dot2tex - a graphviz to latex converter - ftp
TRANSCRIPT
dot2tex - A Graphviz to LaTeX converter
Author: Kjell Magne FauskeVersion: 2.7.0Licence: MIT
Dot2tex is a tool for converting graphs generated by Graphviz to formats suitable for use withLaTeX. Currently dot2tex can generate code for use with PSTricks and PGF/TikZ.
The purpose of dot2tex is to give graphs a more LaTeX look and feel. This is accomplished by:
• Typesetting labels with LaTeX, allowing mathematical notation.
• Using native PSTricks and PGF/TikZ commands for drawing arrows, edges and nodes.
• Using output specific styles to customize the output.
Dependencies
The following software and modules are required to run dot2tex:
• Python 2.4+
• pyparsing. A recent version is required.
• pydot
• Graphviz. A recent version is required.
• preview. A LaTeX package for extracting parts of a document. A free-standing part of thepreview-latex/AUCTeX bundle.
Users have reported problems using dot2tex with old versions of pyparsing and Graphviz.Dot2tex was developed and tested using Python 2.4. However, dot2tex will probably run fine using
Python 2.3.
Installation
From source
Download a zip or a tarball from the download page. It is also available on CTAN. Unpack the file toa directory and run python on the setup.py file:
$ python setup.py install
This will create a dot2tex module in your Python module directory and a wrapper script in yourSCRIPTS directory. Note that a few warnings will be displayed. You can safely ignore them. Thewarnings are shown because there is some extra information in the setup.py file that distutils does notunderstand.
1

Using easy install
The easiest way to install dot2tex is to use easy install:
$ easy_install dot2tex
The command will locate dot2tex and download it automatically. Note that documentation andexamples are not installed by default. Easy install will also create a wrapper script or EXE file for youand install dependencies if necessary.
Binary packages
Binary packages are available for Debian and OpenSUSE.
Development version
The development version of dot2tex is available from a Subversion repository hosted at Google code.To get the code you can use the following command:
svn checkout http://dot2tex.googlecode.com/svn/trunk/ dot2tex
Usage
Syntax:
dot2tex [options] [inputfile]
Input data is read from standard input if no input file is specified. Output is written to standardoutput unless a destination file is set with the -o option.
Dot2tex relies on the xdot format generated by Graphviz. Dot2tex will automatically run dot onthe input data if it is in the plain dot format. If you want to use other layout tools like neato andcirco, use the --prog option.
A few examples on how to invoke dot2tex:Read a file from standard input and write the result to the file test.tex:
$ dot -Txdot test.dot | dot2tex > test.tex$ neato -Txdot -Gstart=rand test.dot | dot2tex > test.tex
Load test.dot, convert it to xdot format and output the resulting graph using the tikz outputformat to testpgf.tex:
$ dot2tex -ftikz test.dot > testtikz.tex
The same as above, but use neato for graph layout:
$ dot2tex --prog=neato -ftikz test.dot > testtikz.tex
Invoking dot2texWindows users you have to type python dot2tex to invoke the program. If you find this annoying,try the ExeMaker tool from effbot.org, or better, use easy install to install dot2tex.
2
Options
The following options are available:
-h, --help Display help message.
-f fmt, --format fmt Set output format. The following values of fmt are supported:
pgf PGF/TikZ. Default.
pstricks or pst Use PSTricks.
tikz TikZ format.
-t mode, --texmode mode Text mode. Specify how text is converted.
verbatim Text is displayed with all special TeX chars escaped (de-fault).
math Output all text in math mode $$.
raw Output text without any processing.
Note that you can locally override the text mode by assigning a spe-cial texlbl attribute to a graph element, or by using the texmodeattribute.
-s, --straightedges Draw edges using straight lines. Graphviz uses bezier curves to drawstraight edges. Use this option to force the use of line to operationsinstead of curves. Does not work in duplicate mode.
-o filename, --output filename Write output to file.
-d, --duplicate Duplicate the xdot output. Uses the drawing information embeddedin the xdot output to draw nodes and edges.
--template filename Use template from file. See the templates section for more details.
-V, --version Print version information and exit.
-w, --switchdraworder Switch drawing order of nodes and edges. By default edges aredrawn before nodes.
-c, --crop Use preview.sty to crop the graph. Currently only implemented forthe pgf and tikz output format.
--figonly Output the graph without a document preamble. Useful if the graphis to be included in a master document.
--codeonly Output only the drawing commands, without wrapping it in a tikzpic-ture or pspicture environment. Useful when used with the dot2texipackage.
--preproc Preprocess the graph through LaTeX using the preview package. Willgenerate a new dot file where the height and widths of nodes and edgelabels are set based on the results from preview.
--autosize Preprocess the graph and run Graphviz on the output. Equivalent to:
$ dot2tex --preproc ex1.dot | dot2tex
--prog program Set graph layout program to use when the input is in plain dot format.Allowed values:
3
• dot (default)
• neato
• circo
• fdp
• twopi
--usepdflatex Use pdflatex instead of latex for preprocessing the graph.
--nominsize Ignore minimum node sizes during preprocessing.
--valignmode mode Vertical alignment of node labels, where mode can have the values:
center Labels are placed in the middle of the node (default).
dot Use the coordinate given by the xdot output from Graphviz.
(pgf and pstricks only)
--alignstr Used to pass a default alignment string to the PSTricks \rput com-mand:
\rput[alignstr] ...
Only works for the PSTricks format. PGF/TikZ users can insteadpass an anchor=... style using the graphstyle option.
--tikzedgelabels Bypass Graphviz’ edge label placement and use PGF/TikZ instead(tikz and pgf formats only).
--styleonly Use TikZ only styles when drawing nodes. No draw or shape optionis added (tikz format only).
--nodeoptions tikzoptions Wrap node code in a scope environment with tikzoptionsas parameter (tikz format only).
--edgeoptions tikzoptions Wrap edge code in a scope environment with tikzoptionsas parameter (tikz format only).
--debug Write detailed debug information to the file dot2tex.log in the currentdirectory.
The following options are used by the output templates.
-e encoding, --encoding encoding Set text encoding. Supported encodings are:
• utf8
• latin1
--docpreamble TeXcode Insert TeX code in the document preamble.
--figpreamble TeXcode Insert TeX code in the figure preamble.
--figpostamble TeXcode Insert TeX code in the figure postamble.
--graphstyle style Sets the <<graphstyle>> tag.
--margin margin Set margin around the graph when using preview.sty. margin mustbe a valid TeX unit. By default margin is set to 0pt.
4
Output formats
The output format is specified with the -f fmt or --format fmt command line option.
PGF
This is the default output format. Generates code for the Portable Graphics Format (PGF) package .Mixes both PGF and TikZ commands.
PSTricks
Generates code for the PSTricks package.
TikZ
The tikz output format also uses the PGF and TikZ package. However, it relies on TikZ node and edgemechanisms to draw nodes and edges, instead of using the drawing information provided by Graphviz.This allows much tighter integration with TikZ and in some cases prettier results.
Advantages of the tikz format:
• The generated code is very compact and clean.
• Easy to modify the output.
• Labels will fit inside nodes without preprocessing.
• Full access to the power of PGF and TikZ.
You can find more details in the section: Use the tikz output format for maximum flexibility.
Note
The tikz output format requires detailed knowledge of the PGF and TikZ package. Some ofGraphviz’ features will not work with this output format.
Labels
The main purpose of dot2tex is to allow text and labels to be typeset by LaTeX. Labels are treateddifferently according to the current TeX mode:
verbatim Text is displayed with all special TeX chars escaped (default).
math Output all text in math mode $$.
raw Output text without any processing.
The TeX mode can be set on the command line using the -t option. It can also be set locally in agraph by using the special texmode attribute.
You can also use the special texlbl attribute on a graph element, which is interpreted as raw TeXstring. If a texlbl attribute is found, it will be used regardless of the current TeX mode. It also hasprecedence over the label attribute.
Note
The \ character needs to be escaped with \\ if used in the label attribute.
Note that only position and alignment information is converted. Any font information is lost. Thismay result in some odd behavior. Some tweaking may be necessary to get it right.
5
Note
If you use texlbl for edges, you have to provide a dummy label attribute. Otherwise Graphvizwill not generate the necessary code for placing edge labels.
Label examples
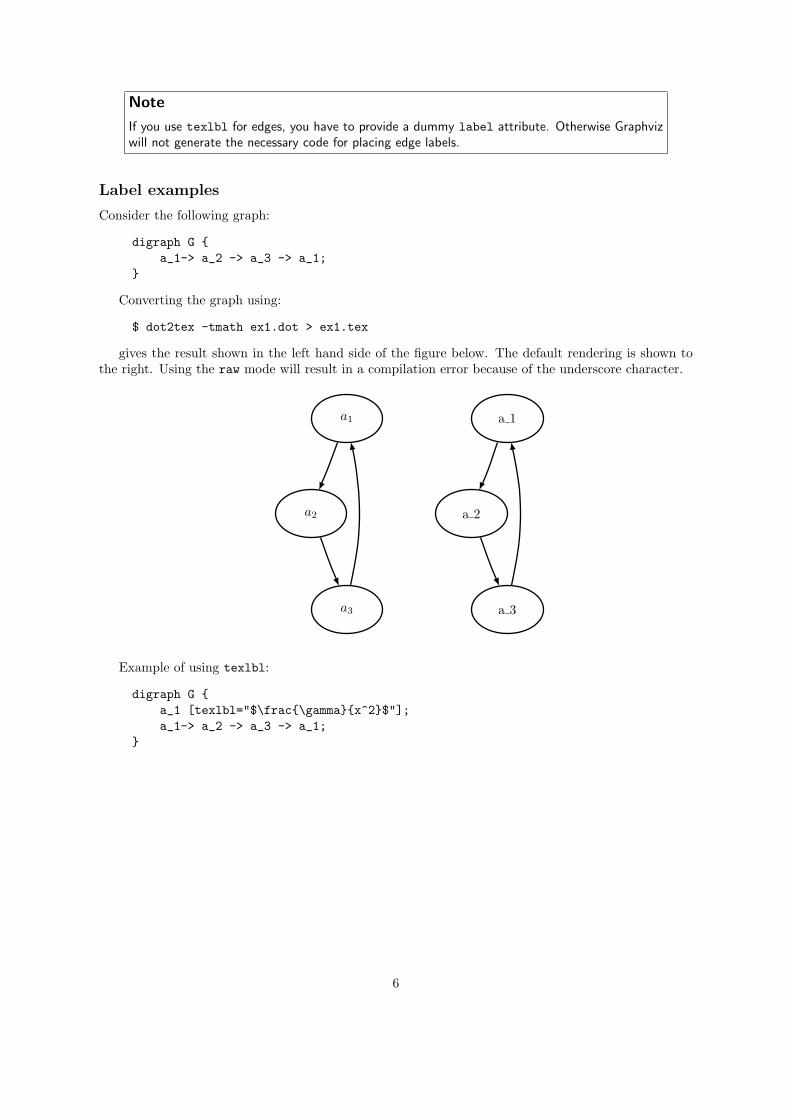
Consider the following graph:
digraph G {a_1-> a_2 -> a_3 -> a_1;
}
Converting the graph using:
$ dot2tex -tmath ex1.dot > ex1.tex
gives the result shown in the left hand side of the figure below. The default rendering is shown tothe right. Using the raw mode will result in a compilation error because of the underscore character.
a1
a2
a3
a 1
a 2
a 3
Example of using texlbl:
digraph G {a_1 [texlbl="$\frac{\gamma}{x^2}$"];a_1-> a_2 -> a_3 -> a_1;
}
6
γx2
a 2
a 3
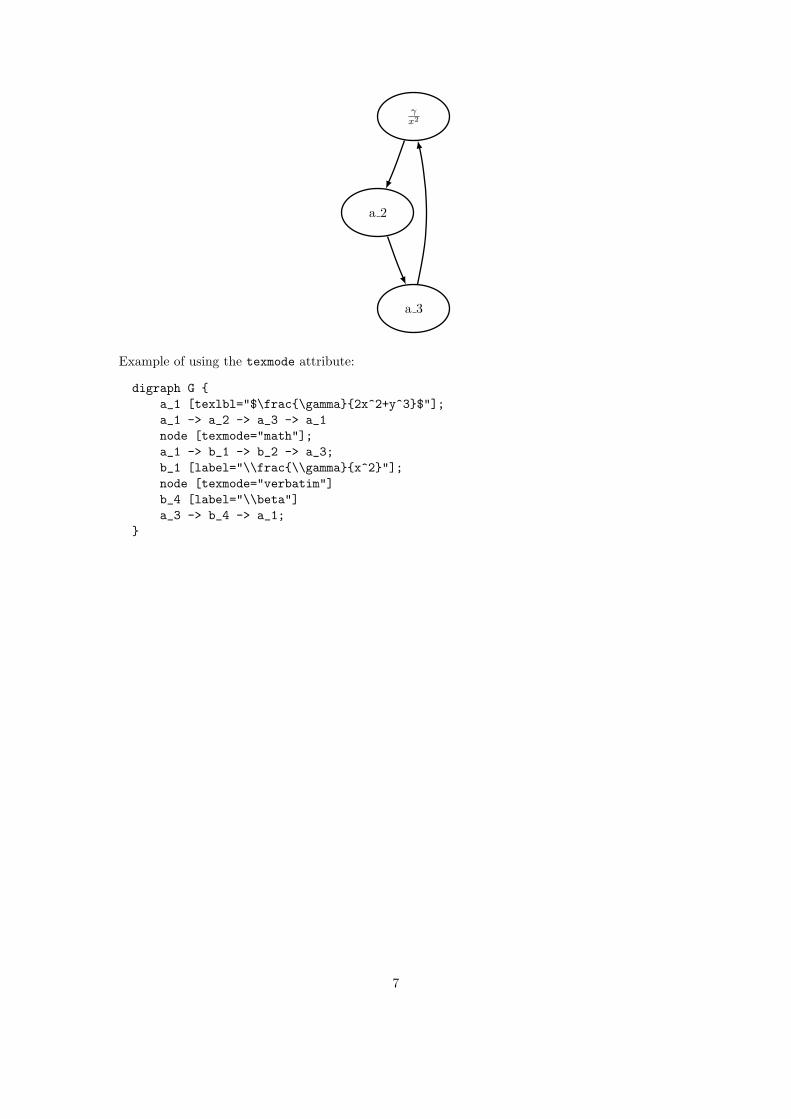
Example of using the texmode attribute:
digraph G {a_1 [texlbl="$\frac{\gamma}{2x^2+y^3}$"];a_1 -> a_2 -> a_3 -> a_1node [texmode="math"];a_1 -> b_1 -> b_2 -> a_3;b_1 [label="\\frac{\\gamma}{x^2}"];node [texmode="verbatim"]b_4 [label="\\beta"]a_3 -> b_4 -> a_1;
}
7
γ2x2+y3
a 2
a 3
γx2
b2
\beta
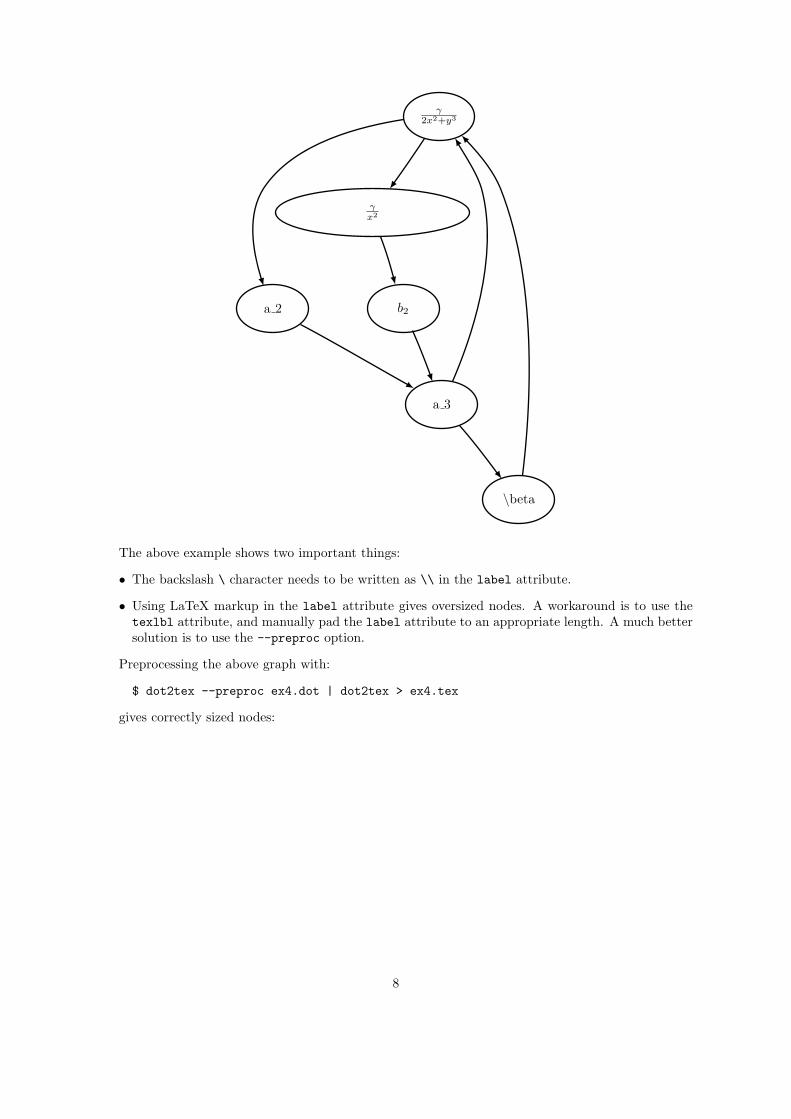
The above example shows two important things:
• The backslash \ character needs to be written as \\ in the label attribute.
• Using LaTeX markup in the label attribute gives oversized nodes. A workaround is to use thetexlbl attribute, and manually pad the label attribute to an appropriate length. A much bettersolution is to use the --preproc option.
Preprocessing the above graph with:
$ dot2tex --preproc ex4.dot | dot2tex > ex4.tex
gives correctly sized nodes:
8

γ2x2+y3
a 2
a 3
γx2
b2
\beta
Read more about preprocessing in the Preprocessing graphs section.
Vertical label alignment
Dot2tex relies on the xdot format for drawing nodes and placing node labels. The fonts that Graphvizand LaTeX use are different, so using the label coordinates from Graphviz does not always give goodresults. Dot2tex’s default behavior is to place node labels in the middle of the node. However, you canchange this behavior by setting the valignmode option to dot. Labels will then be placed using thecoordinates supplied by Graphviz.
Here is an example graph where it is necessary to use the valignmode option:
digraph G {node0 [label="{left|right}", shape=record];node1 [shape=rectangle, label="node 1"];node0 -> node1;rankdir=LR;
}
For record nodes dot2tex has to use Graphviz coordinates. This is shown in the following figurerendered with:
$ dot2tex valign.dot
left right node 1
9

To get the same vertical alignment for both nodes, you can use:
$ dot2tex --valignmode=dot valign.dot
left right node 1
Now the labels are aligned, but the labels are still placed too low. The reason for this is that bothPSTricks and PGF by default centers text vertically on the current coordinate. The alignment pointshould in this case be set to the baseline. For PGF/TikZ you can use the --graphstyle option likethis:
$ dot2tex --valignmode=dot --graphstyle="anchor=base" valign.dot
PSTricks users have to use the --alingstr option:
$ dot2tex --valignmode=dot --alignstr=B valign.dot
left right node 1
The result is better, but to get even better alignment you have to change the node font size. Graphviz’default font size is 14pt, which is larger than the typical 10pt or 11pt used in LaTeX documents. Bychanging the node font size to 10pt we can trick Graphviz to give us a better alignment:
digraph G {node [fontsize=10];node0 [label="{left|right}", shape=record];node1 [shape=rectangle, label="node 1"];node0 -> node1;rankdir=LR;
}
left right node 1
Preprocessing graphs
A problem with using LaTeX for typesetting node and edge labels, is that Graphviz does not know thesizes of the resulting labels. To circumvent this problem, you can use the --preproc or --autosizeoption. The following will then happen:
1. Node and edge labels are extracted and the corresponding LaTeX markup is saved to atemporary file.
2. The file is typeset with LaTeX and information about sizes is extracted using the previewpackage.
10
3. A new dot file is created where node and edge label sizes are set using the dot language’swidth and height attributes.
4. The generated graph can now be processed using Graphviz and dot2tex. Label sizes willnow correspond with the output from LaTeX.
Widths and heights of nodes are handled the in same way as Graphviz does it. The width andheight attributes set the minimum size of the node. If label size + margins is larger that the minimumsize, the node size will grow accordingly. Default values are width=0.75in and height=0.5in.
Node margins are set using the margin attribute. This also works for edge labels. margin==valuesets both the horizontal and vertical margin to value, margin=="hvalue,vvalue" sets the horizontaland vertical margins respectively.
Note
All sizes are given in inches.
If you do not want a minimum node size, you can use the ’--nominsize’ option. Dot2tex will thenuse size of label + margins as node size.
Nodes with fixedsize=True attributes are not processed.Limitations:
• Does not work for HTML-labels
• Does not work for record-based nodes
Examples
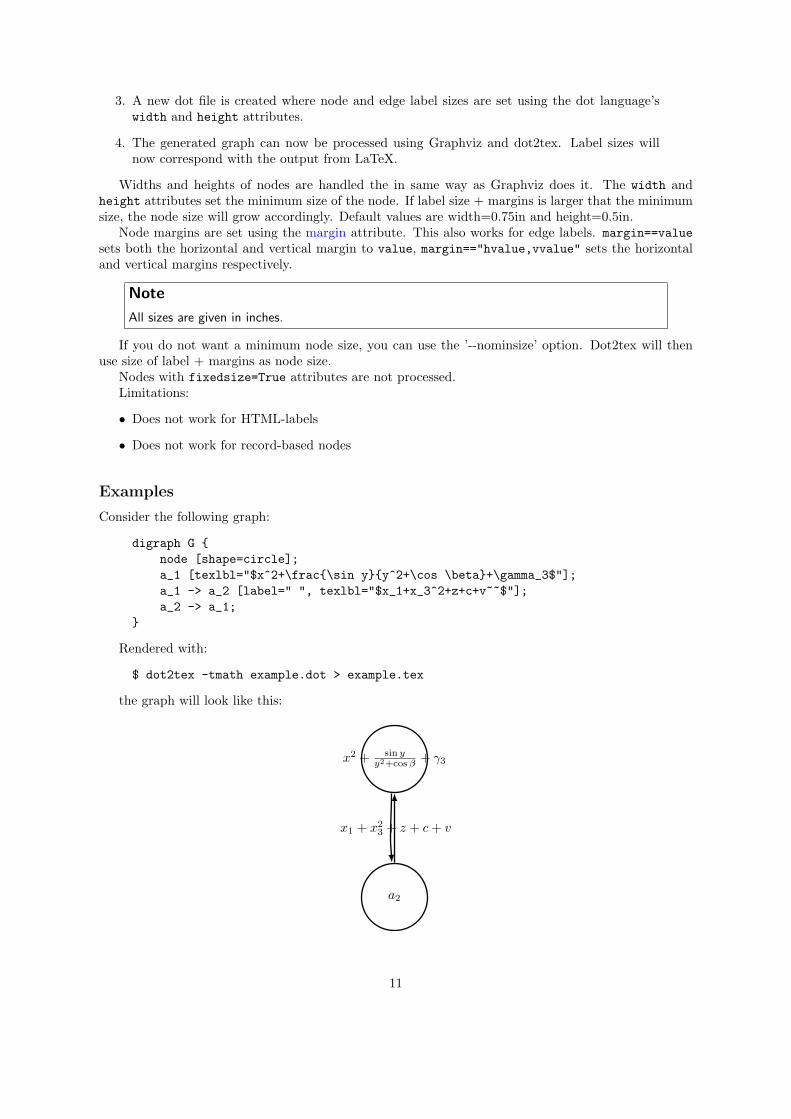
Consider the following graph:
digraph G {node [shape=circle];a_1 [texlbl="$x^2+\frac{\sin y}{y^2+\cos \beta}+\gamma_3$"];a_1 -> a_2 [label=" ", texlbl="$x_1+x_3^2+z+c+v~~$"];a_2 -> a_1;
}
Rendered with:
$ dot2tex -tmath example.dot > example.tex
the graph will look like this:
x1 + x23 + z + c + v
x2 + sin yy2+cos β + γ3
a2
11
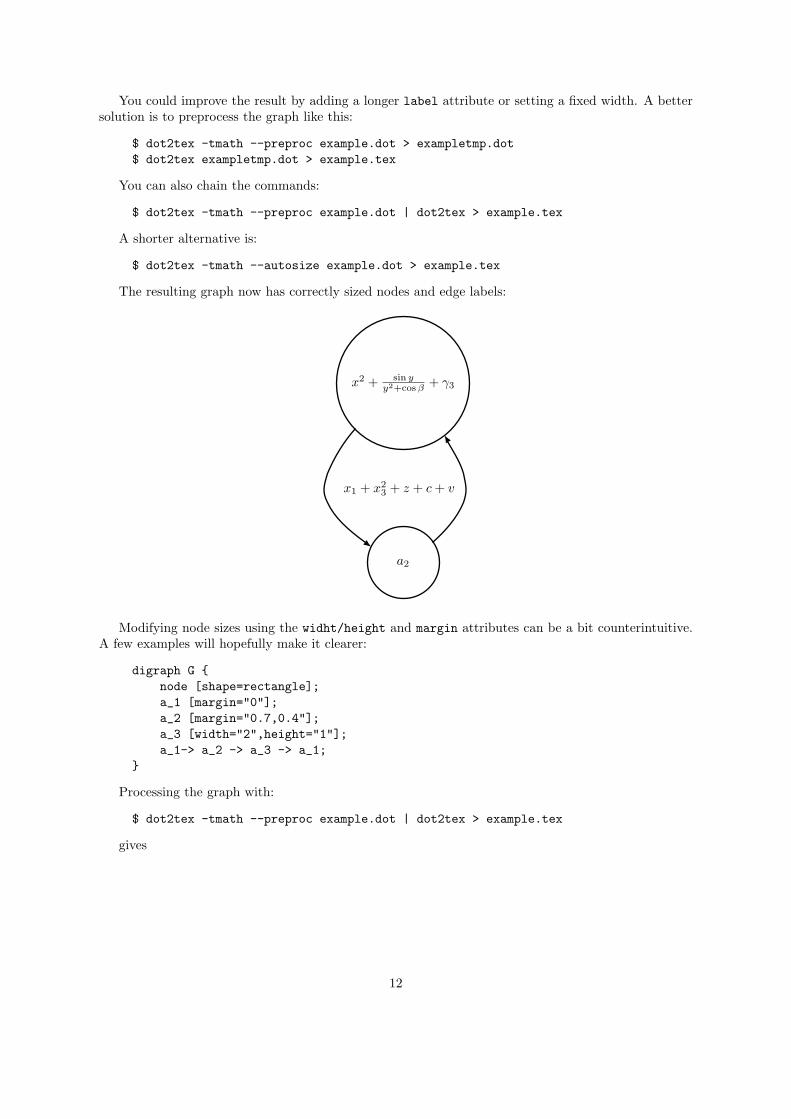
You could improve the result by adding a longer label attribute or setting a fixed width. A bettersolution is to preprocess the graph like this:
$ dot2tex -tmath --preproc example.dot > exampletmp.dot$ dot2tex exampletmp.dot > example.tex
You can also chain the commands:
$ dot2tex -tmath --preproc example.dot | dot2tex > example.tex
A shorter alternative is:
$ dot2tex -tmath --autosize example.dot > example.tex
The resulting graph now has correctly sized nodes and edge labels:
x1 + x23 + z + c + v
x2 + sin yy2+cos β + γ3
a2
Modifying node sizes using the widht/height and margin attributes can be a bit counterintuitive.A few examples will hopefully make it clearer:
digraph G {node [shape=rectangle];a_1 [margin="0"];a_2 [margin="0.7,0.4"];a_3 [width="2",height="1"];a_1-> a_2 -> a_3 -> a_1;
}
Processing the graph with:
$ dot2tex -tmath --preproc example.dot | dot2tex > example.tex
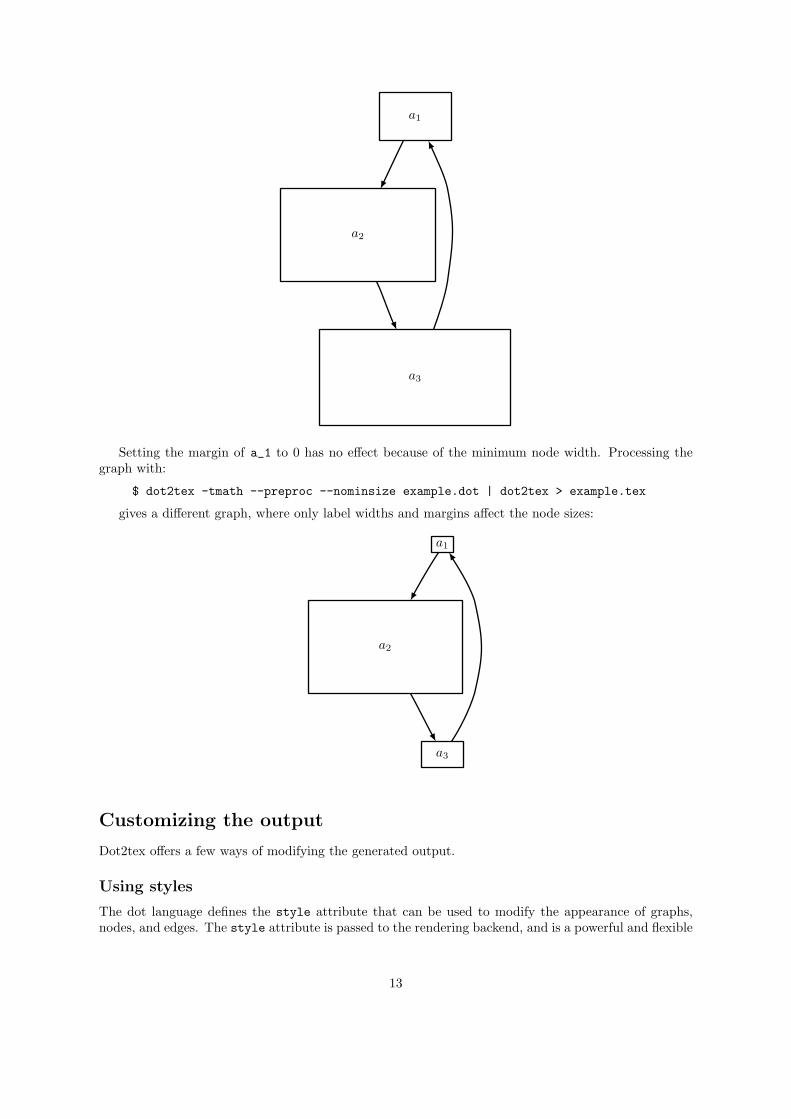
gives
12
a1
a2
a3
Setting the margin of a_1 to 0 has no effect because of the minimum node width. Processing thegraph with:
$ dot2tex -tmath --preproc --nominsize example.dot | dot2tex > example.tex
gives a different graph, where only label widths and margins affect the node sizes:
a1
a2
a3
Customizing the output
Dot2tex offers a few ways of modifying the generated output.
Using styles
The dot language defines the style attribute that can be used to modify the appearance of graphs,nodes, and edges. The style attribute is passed to the rendering backend, and is a powerful and flexible
13
way of customizing the look and feel of your graphs. Using styles requires detailed knowledge of theoutput format.
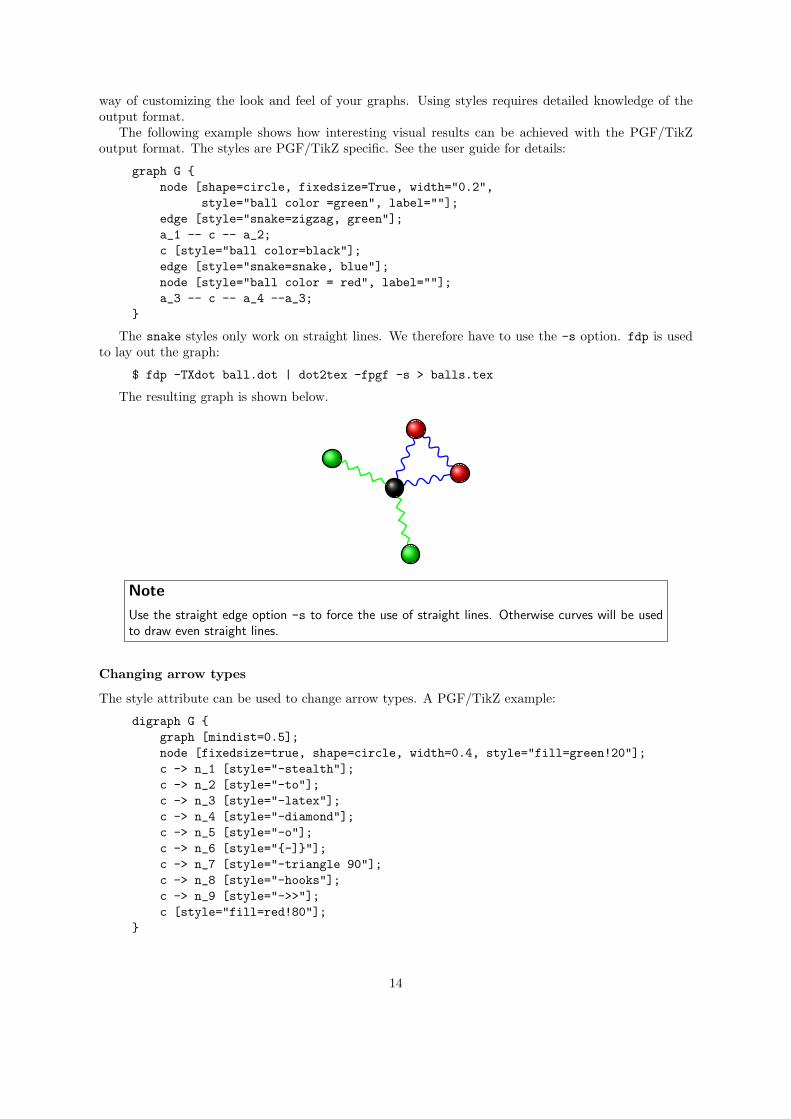
The following example shows how interesting visual results can be achieved with the PGF/TikZoutput format. The styles are PGF/TikZ specific. See the user guide for details:
graph G {node [shape=circle, fixedsize=True, width="0.2",
style="ball color =green", label=""];edge [style="snake=zigzag, green"];a_1 -- c -- a_2;c [style="ball color=black"];edge [style="snake=snake, blue"];node [style="ball color = red", label=""];a_3 -- c -- a_4 --a_3;
}
The snake styles only work on straight lines. We therefore have to use the -s option. fdp is usedto lay out the graph:
$ fdp -TXdot ball.dot | dot2tex -fpgf -s > balls.tex
The resulting graph is shown below.
Note
Use the straight edge option -s to force the use of straight lines. Otherwise curves will be usedto draw even straight lines.
Changing arrow types
The style attribute can be used to change arrow types. A PGF/TikZ example:
digraph G {graph [mindist=0.5];node [fixedsize=true, shape=circle, width=0.4, style="fill=green!20"];c -> n_1 [style="-stealth"];c -> n_2 [style="-to"];c -> n_3 [style="-latex"];c -> n_4 [style="-diamond"];c -> n_5 [style="-o"];c -> n_6 [style="{-]}"];c -> n_7 [style="-triangle 90"];c -> n_8 [style="-hooks"];c -> n_9 [style="->>"];c [style="fill=red!80"];
}
14

Rendered with:
$ circo -Txdot pgfarrows.dot | dot2tex -tmath > pgfarrows.tex
c n1
n2
n3
n4
n5
n6
n7
n8
n9
You can also set the default arrow style by using the --graphstyle option or d2tgraphstyleattribute:
$ dot2tex -tmath --graphstyle=">=diamond" ex1.dot > ex1gstyle.tex
a1
a2
a3
A PSTricks example:
digraph G {d2tdocpreamble="\usepackage{pstricks-add}";graph [mindist=0.5];node [texmode="math", fixedsize=true, shape=circle, width=0.4];c -> n_1 [style="arrows=->"];c -> n_2 [style="arrows=->>"];
15

c -> n_3 [style="arrows=-<"];c -> n_4 [style="arrows=-*"];c -> n_5 [style="arrows=-{]}"];c -> n_6 [style="arrows=-o"];c -> n_7 [style="arrows=-H"];
}
Rendered with:
$ circo -Txdot pstarrows.dot | dot2tex -fpst > pstarrows.tex
c n1
n2
n3
n4
n5
n6
n7
The above example shows how the d2tdocpreamble attribute can be used to load additional LaTeXpackages. You could also use the ‘--docpreamble option:
$ ... | dot2tex -fpst --docpreamble="\usepackage{pstricks-add}" ...
Label styles
Node, edge and graph labels can be styled using the special lblstyle attribute. However, this onlyworks for the pgf and tikz output formats.
Labels are drawn using code like:
\draw (157bp,52bp) node {label};
When you specify a lblstyle attribute, the style will be given as a parameter to the node like this:
\draw (157bp,52bp) node[lblstyle] {label};
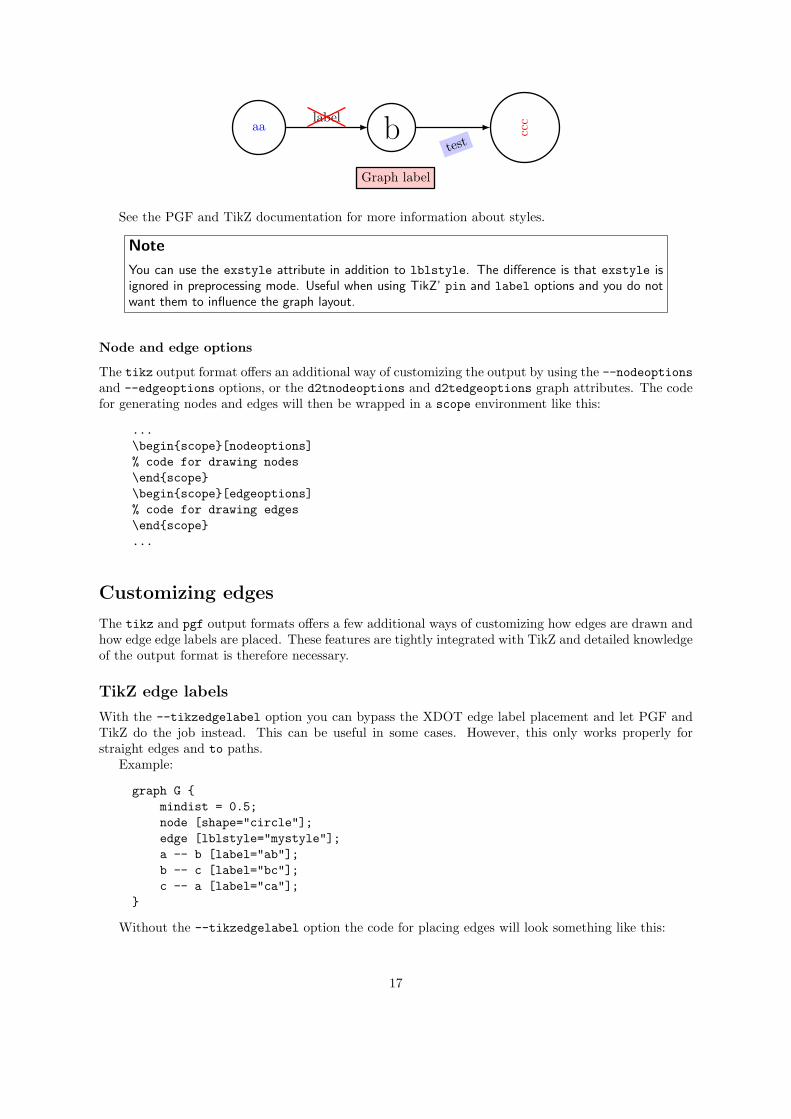
Example:
digraph G {node [shape=circle];a -> b [label="label",lblstyle="draw=red,cross out"];b -> c [label="test",lblstyle="below=0.5cm,rotate=20,fill=blue!20"];a [label="aa",lblstyle="blue"];b [lblstyle="font=\Huge"];c [label="ccc", lblstyle="red,rotate=90"];label="Graph label";lblstyle="draw,fill=red!20";rankdir=LR;
}
16
Graph label
label
testaa b cc
c
See the PGF and TikZ documentation for more information about styles.
Note
You can use the exstyle attribute in addition to lblstyle. The difference is that exstyle isignored in preprocessing mode. Useful when using TikZ’ pin and label options and you do notwant them to influence the graph layout.
Node and edge options
The tikz output format offers an additional way of customizing the output by using the --nodeoptionsand --edgeoptions options, or the d2tnodeoptions and d2tedgeoptions graph attributes. The codefor generating nodes and edges will then be wrapped in a scope environment like this:
...\begin{scope}[nodeoptions]% code for drawing nodes\end{scope}\begin{scope}[edgeoptions]% code for drawing edges\end{scope}...
Customizing edges
The tikz and pgf output formats offers a few additional ways of customizing how edges are drawn andhow edge edge labels are placed. These features are tightly integrated with TikZ and detailed knowledgeof the output format is therefore necessary.
TikZ edge labels
With the --tikzedgelabel option you can bypass the XDOT edge label placement and let PGF andTikZ do the job instead. This can be useful in some cases. However, this only works properly forstraight edges and to paths.
Example:
graph G {mindist = 0.5;node [shape="circle"];edge [lblstyle="mystyle"];a -- b [label="ab"];b -- c [label="bc"];c -- a [label="ca"];
}
Without the --tikzedgelabel option the code for placing edges will look something like this:
17

% Edge: a -- b\draw [] (28bp,55bp) -- (28bp,75bp);\draw (40bp,65bp) node[mystyle] {ab};% Edge: b -- c\draw [] (51bp,88bp) -- (68bp,78bp);\draw (66bp,96bp) node[mystyle] {bc};% Edge: c -- a\draw [] (69bp,51bp) -- (52bp,41bp);\draw (53bp,57bp) node[mystyle] {ca};
With the tikzedgelabels option the output is simply:
\draw [] (a) -- node[mystyle] {ab} (b);\draw [] (b) -- node[mystyle] {bc} (c);\draw [] (c) -- node[mystyle] {ca} (a);
The placement of the edge labels depends on the options passed to the edge label node (in this casemystyle), and the curve used to connect the nodes. Some examples of mystyle values are shown inthe figure below. The leftmost graph is rendered without the tikzedgelabels option.
a
b
cab bcca
a
b
cab
bc
caa
b
cab
bc
caa
b
cab
bc
ca
Graphviz default auto fill=blue!20,sloped
Limitations:
• Works best with straight edges and to paths
• The headlabel and taillabel attributes are currently not affected by the tikzedgelabelsoption.
To paths
The topath edge attribute offers a way to override the edges drawn by Graphviz. When a topathattribute is encountered, dot2tex inserts a so called to path operation to connect the nodes. A numberof predefined to paths are defined by TikZ, and you can create your own.
Example:
digraph G {mindist = 0.5;node [shape="circle"];a -> b [topath="bend right"];c -> b [topath="bend left"];c -> a [topath="out=10,in=-90"];b -> b [topath="loop above"];
}
Generating the graph with:
$ circo -Txdot topaths1.dot | dot2tex -ftikz > topaths1.tex
18
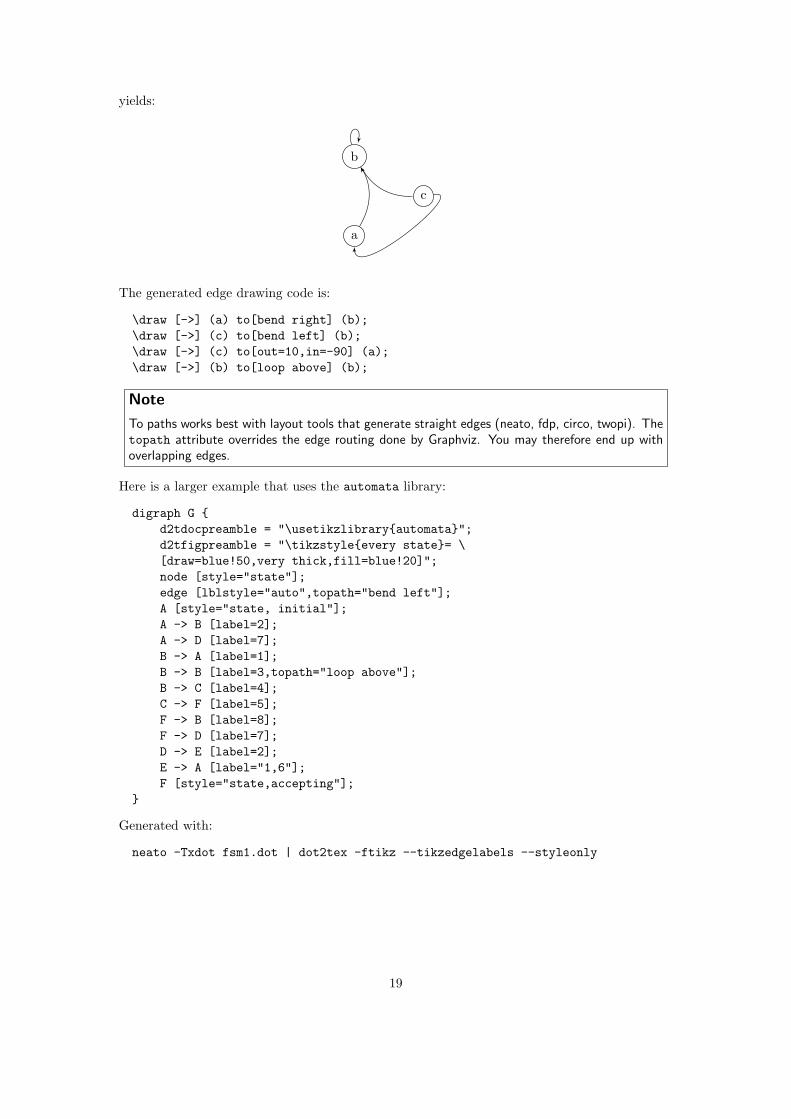
yields:
a
b
c
The generated edge drawing code is:
\draw [->] (a) to[bend right] (b);\draw [->] (c) to[bend left] (b);\draw [->] (c) to[out=10,in=-90] (a);\draw [->] (b) to[loop above] (b);
Note
To paths works best with layout tools that generate straight edges (neato, fdp, circo, twopi). Thetopath attribute overrides the edge routing done by Graphviz. You may therefore end up withoverlapping edges.
Here is a larger example that uses the automata library:
digraph G {d2tdocpreamble = "\usetikzlibrary{automata}";d2tfigpreamble = "\tikzstyle{every state}= \[draw=blue!50,very thick,fill=blue!20]";node [style="state"];edge [lblstyle="auto",topath="bend left"];A [style="state, initial"];A -> B [label=2];A -> D [label=7];B -> A [label=1];B -> B [label=3,topath="loop above"];B -> C [label=4];C -> F [label=5];F -> B [label=8];F -> D [label=7];D -> E [label=2];E -> A [label="1,6"];F [style="state,accepting"];
}
Generated with:
neato -Txdot fsm1.dot | dot2tex -ftikz --tikzedgelabels --styleonly
19

Astart
B
D
C
F
E
2
7
1
34
58
7
2
1,6
Color support
All Graphviz color formats are supported, including the RGBA format. Transparency will however onlywork when using the PGF/TikZ output format.
Named colors are supported, but you have to ensure that the colors are defined in the resultingLaTeX file. The default PSTricks and PGF/TikZ templates load the X11names color scheme definedin the xcolor package. Note that color names in the xcolor package are case sensitive. This is not thecase with Graphviz’s color names. Use CamelCase names in your graphs to ensure compatibility withxcolor.
For convenience, a color definition file gcols.tex is distributed with dot2tex. You can find it in theexamples directory. This file defines most of Graphviz’s named colors as lower case. Include this file inthe preamble if you need it.
Templates
The output from dot2tex is a list of drawing commands. To render the graphics with LaTeX there’s aneed for some boiling plate code. This code can be customized using simple templates. If no templateis specified with the --template option, a default template will be used.
The following template tags are available:
<<drawcommands>> The actual list of drawing commands.
<<figcode>> Drawing commands wrapped in a figure environment. Note that several important styleoptions are set in the figure environment.
<<bbox>> Bounding box. Example: (0bp,0bp)(100bp,100bp) The individual parts of the boundingbox are available with the tags:
• <<bbox.x0>>
• <<bbox.y0>>
• <<bbox.x1>>
• <<bbox.y1>>
Note that the bounding box parts are given without any units.
<<textencoding>> The text encoding used for the output file. Current values are: - utf8 - latin1
20
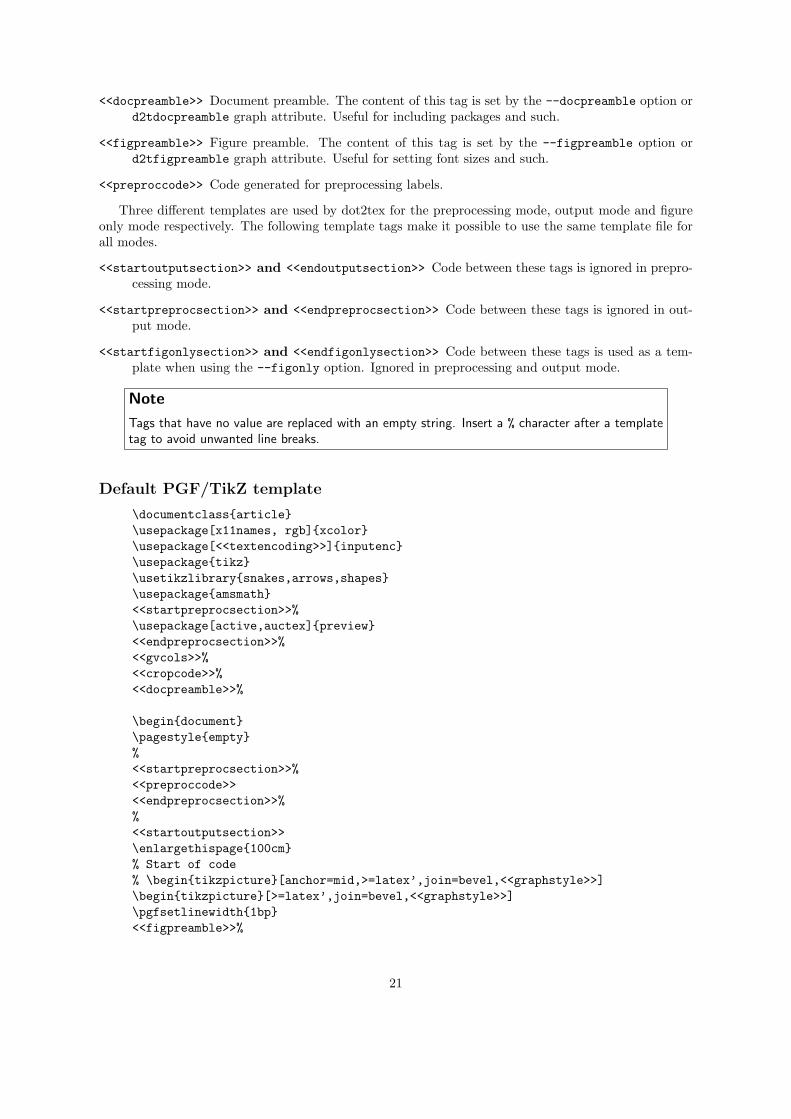
<<docpreamble>> Document preamble. The content of this tag is set by the --docpreamble option ord2tdocpreamble graph attribute. Useful for including packages and such.
<<figpreamble>> Figure preamble. The content of this tag is set by the --figpreamble option ord2tfigpreamble graph attribute. Useful for setting font sizes and such.
<<preproccode>> Code generated for preprocessing labels.
Three different templates are used by dot2tex for the preprocessing mode, output mode and figureonly mode respectively. The following template tags make it possible to use the same template file forall modes.
<<startoutputsection>> and <<endoutputsection>> Code between these tags is ignored in prepro-cessing mode.
<<startpreprocsection>> and <<endpreprocsection>> Code between these tags is ignored in out-put mode.
<<startfigonlysection>> and <<endfigonlysection>> Code between these tags is used as a tem-plate when using the --figonly option. Ignored in preprocessing and output mode.
Note
Tags that have no value are replaced with an empty string. Insert a % character after a templatetag to avoid unwanted line breaks.
Default PGF/TikZ template
\documentclass{article}\usepackage[x11names, rgb]{xcolor}\usepackage[<<textencoding>>]{inputenc}\usepackage{tikz}\usetikzlibrary{snakes,arrows,shapes}\usepackage{amsmath}<<startpreprocsection>>%\usepackage[active,auctex]{preview}<<endpreprocsection>>%<<gvcols>>%<<cropcode>>%<<docpreamble>>%
\begin{document}\pagestyle{empty}%<<startpreprocsection>>%<<preproccode>><<endpreprocsection>>%%<<startoutputsection>>\enlargethispage{100cm}% Start of code% \begin{tikzpicture}[anchor=mid,>=latex’,join=bevel,<<graphstyle>>]\begin{tikzpicture}[>=latex’,join=bevel,<<graphstyle>>]\pgfsetlinewidth{1bp}<<figpreamble>>%
21
<<drawcommands>><<figpostamble>>%\end{tikzpicture}% End of code<<endoutputsection>>%\end{document}%<<startfigonlysection>>\begin{tikzpicture}[>=latex,join=bevel,<<graphstyle>>]\pgfsetlinewidth{1bp}<<figpreamble>>%<<drawcommands>><<figpostamble>>%\end{tikzpicture}<<endfigonlysection>>
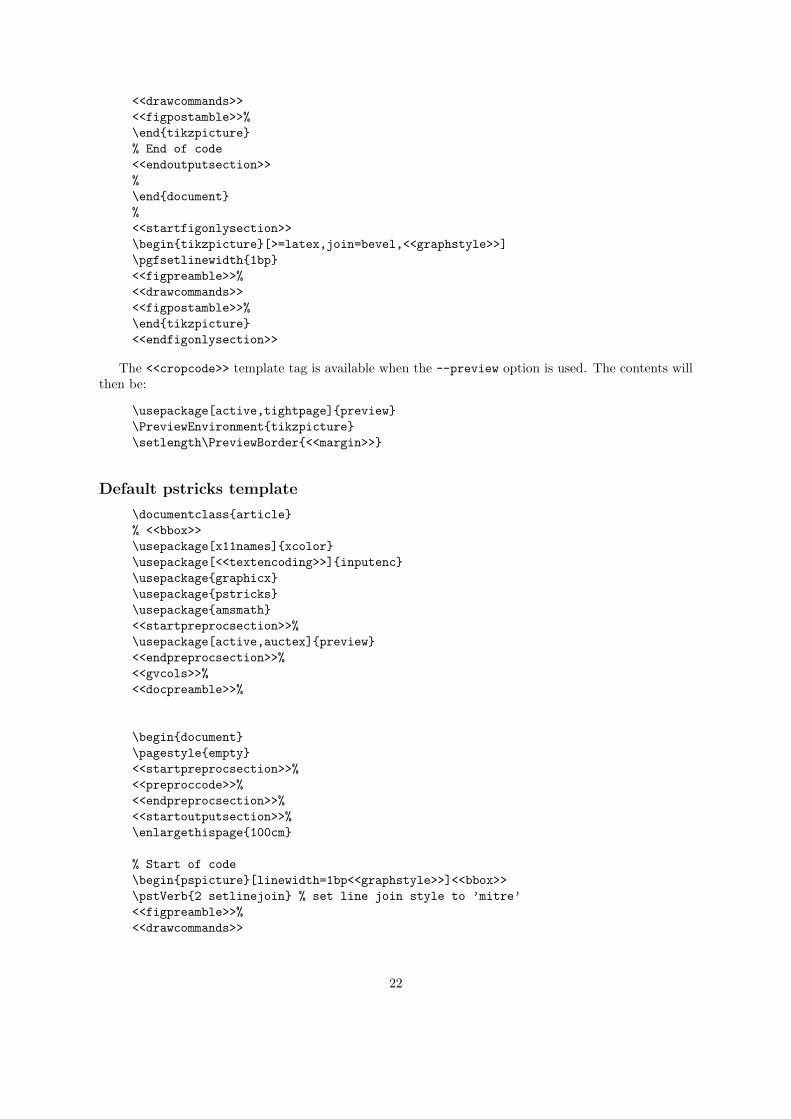
The <<cropcode>> template tag is available when the --preview option is used. The contents willthen be:
\usepackage[active,tightpage]{preview}\PreviewEnvironment{tikzpicture}\setlength\PreviewBorder{<<margin>>}
Default pstricks template
\documentclass{article}% <<bbox>>\usepackage[x11names]{xcolor}\usepackage[<<textencoding>>]{inputenc}\usepackage{graphicx}\usepackage{pstricks}\usepackage{amsmath}<<startpreprocsection>>%\usepackage[active,auctex]{preview}<<endpreprocsection>>%<<gvcols>>%<<docpreamble>>%
\begin{document}\pagestyle{empty}<<startpreprocsection>>%<<preproccode>>%<<endpreprocsection>>%<<startoutputsection>>%\enlargethispage{100cm}
% Start of code\begin{pspicture}[linewidth=1bp<<graphstyle>>]<<bbox>>\pstVerb{2 setlinejoin} % set line join style to ’mitre’<<figpreamble>>%<<drawcommands>>
22

<<figpostamble>>%\end{pspicture}% End of code<<endoutputsection>>%\end{document}%<<startfigonlysection>>\begin{pspicture}[linewidth=1bp<<graphstyle>>]<<bbox>>\pstVerb{2 setlinejoin} % set line join style to ’mitre’<<figpreamble>>%<<drawcommands>><<figpostamble>>%\end{pspicture}<<endfigonlysection>>
Special attributes
Dot2tex defines several special graph, node and edge attributes. Most of them are not part of the DOTlanguage.
texmode Changes locally how labels are interpreted.
texlbl Overrides the current node or edge label.
d2tdocpreamble Sets the <<docpreamble>> tag.
d2tfigpreamble Sets the <<figpreamble>> tag.
d2tfigpostamble Sets the <<figpostable>> tag.
d2tgraphstyle Sets the <<graphstyle>> tag.
d2ttikzedgelabels Sets the --tikzedgelabels option.
d2tnodeoptions Sets the --nodeoptions option.
d2tedgeoptions Sets the --edgeoptions option.
style Used to pass styles to the backend. Styles are output format specific, with the exception of thestyles defined by the DOT language.
lblstyle Used to set styles for drawing graph, node and edge labels. Only works for the pgf and tikzoutput formats.
exstyle The same as lblstyle, except that exstyle is ignored in preprocessing mode.
topath Used to set a to path operation for connecting nodes. Only works for the tikz output format.
d2talignstr Used to pass a default alignment string to the PSTricks \rput command:
\rput[d2talignstr] ...
d2toptions Allows you to pass options to dot2tex in the same format as from the command line. Thed2toptions value is parsed in the same way as ordinary command line options.
23
Issues and limitations
The purpose of dot2tex is to give graphs a more LaTeX friendly look, not to create exact duplicates.However, the program does a descent duplication job when it comes to drawing nodes and edges, butit does not try to duplicate label and annotation formatting.
A list of known limitations:
• Parallel edges are only supported in the duplicate mode.
• Background color of page is currently not set.
• The fontcolor attribute is not supported yet.
• The setlinewidth(.) attribute is not supported yet.
• Pydot/Pyparsing have some problems with the HTML syntax.
• Pydot/Pyparsing sometimes choke on valid dot files. If this happen you could try to feed xdotdata directly to dot2tex like this:
$ dot -Txdot example.dot | dot2tex -o example.tex
Text encoding
Graphviz’s default text encoding is utf8. The latin1 encoding can also be used. Utf8 is an unicodeencoding and can in theory handle any international characters. However, LaTeX’s unicode support issomewhat limited.
Tips and tricks
Fonts
No font information in the DOT file is preserved by dot2tex. However, there are several ways ofmodifying the generated LaTeX code to achieve some control of fonts and font sizes.
• Modifying the templates.
• Using the d2tdocpreamble and d2tfigpreamble attributes or command line options.
• Using the lblstyle attribute.
To increase the font size you can for instance insert a \Huge command in the figure preamble:
$ dot2tex -tmath --figpreamble="\Huge" ex1.dot > ex1huge.tex
24

a1
a2
a3
Debugging
When making your own templates it is easy to make mistakes, and LaTeX markup in graphs may failto compile. To make it easier to find errors, invoke dot2tex with the --debug option:
$ dot2tex --preproc --debug test.dot
A dot2tex.log file will then be generated with detailed information. In the log file you will find thegenerated LaTeX code, as well as well as the compilation log.
Be consistent
Be aware of differences between the template you use for preprocessing and code used to generate finaloutput. This is especially important if you use the --figonly option and include the code in a masterdocument. If a 10pt font is used during preprocessing, the result may not be optimal if a 12pt font isused in the final output.
Example. A graph is generated with:
$ dot2tex --preproc -tmath --nominsize ex1.dot > ex1tmp.dot
Running through dot2tex again with:
$ dot2tex --figpreamble="\Huge" ex1tmp.dot > ex1huge.tex
gives labels that do not fit properly inside the nodes.
a1
a2
a3
a1
a2
a3a b
25
Postprocessing
The output from Graphviz and dot2tex is not perfect. Manual adjustments are sometimes necessary toget the right results for use in a publication. For final and cosmetic adjustments, it is often easier toedit the generated code than to hack the dot source. This is especially true when using the tikz outputformat.
Use the special graph attributes
Dot2tex has many options for customizing the output. Sometimes is is impractical or boring to typethe various options at the command line each time you want to create the graph. To avoid this, youcan use the special graph attributes. The d2toptions attribute is handy because it is interpreted ascommand line options.
So instead of typing:
$ dot2tex -tikz -tmath --tikzedgelabels ex1.dot
each time, use d2toptions like this:
digraph G {d2toptions ="-tikz -tmath --tikzedgelabels";...
}
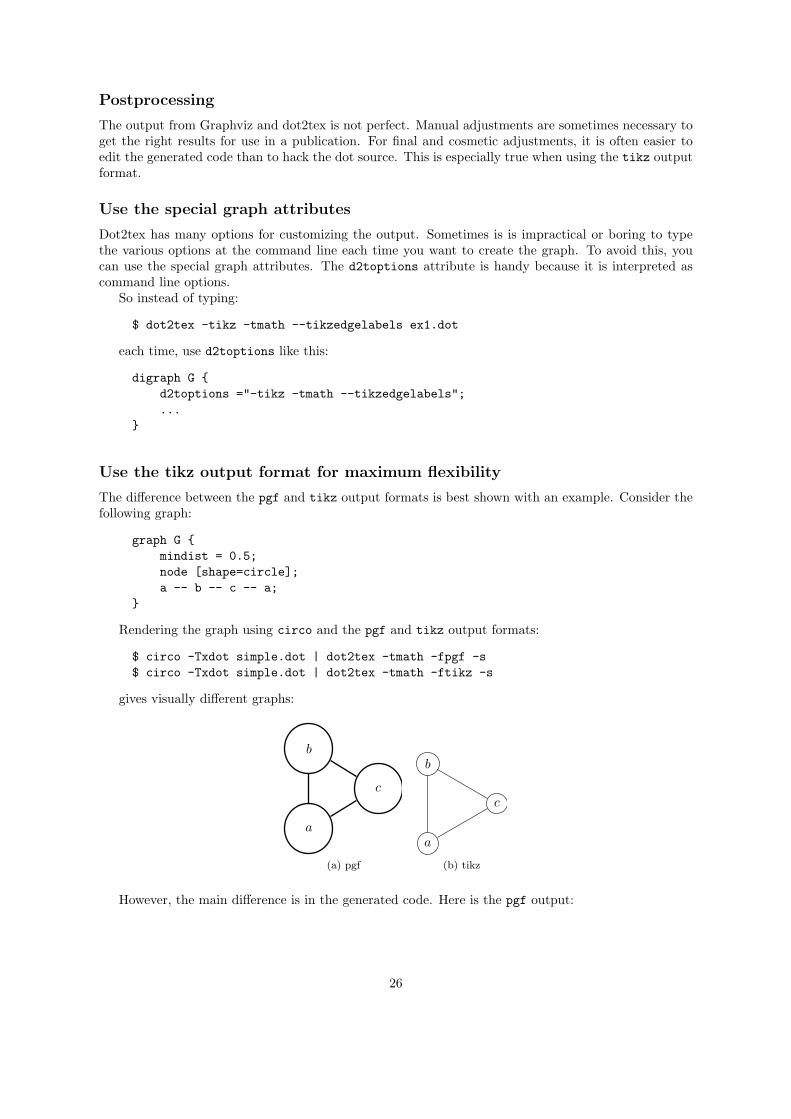
Use the tikz output format for maximum flexibility
The difference between the pgf and tikz output formats is best shown with an example. Consider thefollowing graph:
graph G {mindist = 0.5;node [shape=circle];a -- b -- c -- a;
}
Rendering the graph using circo and the pgf and tikz output formats:
$ circo -Txdot simple.dot | dot2tex -tmath -fpgf -s$ circo -Txdot simple.dot | dot2tex -tmath -ftikz -s
gives visually different graphs:
a
b
c
(a) pgf
a
b
c
(b) tikz
However, the main difference is in the generated code. Here is the pgf output:
26
% Edge: a -- b\draw [] (19bp,38bp) -- (19bp,60bp);% Edge: b -- c\draw [] (35bp,70bp) -- (55bp,58bp);% Edge: c -- a\draw [] (55bp,40bp) -- (35bp,28bp);% Node: a\begin{scope}\pgfsetstrokecolor{black}\draw (19bp,19bp) ellipse (18bp and 19bp);\draw (19bp,19bp) node {$a$};\end{scope}% Node: b\begin{scope}\pgfsetstrokecolor{black}\draw (19bp,79bp) ellipse (18bp and 19bp);\draw (19bp,79bp) node {$b$};\end{scope}% Node: c\begin{scope}\pgfsetstrokecolor{black}\draw (71bp,49bp) ellipse (18bp and 19bp);\draw (71bp,49bp) node {$c$};\end{scope}
Compare the above code with the tikz output:
\node (a) at (19bp,19bp) [draw,circle,] {$a$};\node (b) at (19bp,79bp) [draw,circle,] {$b$};\node (c) at (71bp,49bp) [draw,circle,] {$c$};\draw [] (a) -- (b);\draw [] (b) -- (c);\draw [] (c) -- (a);
The code is much more compact and it is quite easy to modify the graph.
The dot2texi LaTeX package
The dot2texi package allows you to embed DOT graphs directly in you LaTeX document. The packagewill automatically run dot2tex for you and include the generated code. Example:
\documentclass{article}\usepackage{dot2texi}
\usepackage{tikz}\usetikzlibrary{shapes,arrows}
\begin{document}\begin{dot2tex}[neato,options=-tmath]digraph G {
node [shape="circle"];a_1 -> a_2 -> a_3 -> a_4 -> a_1;}
\end{dot2tex}
27
\end{document}
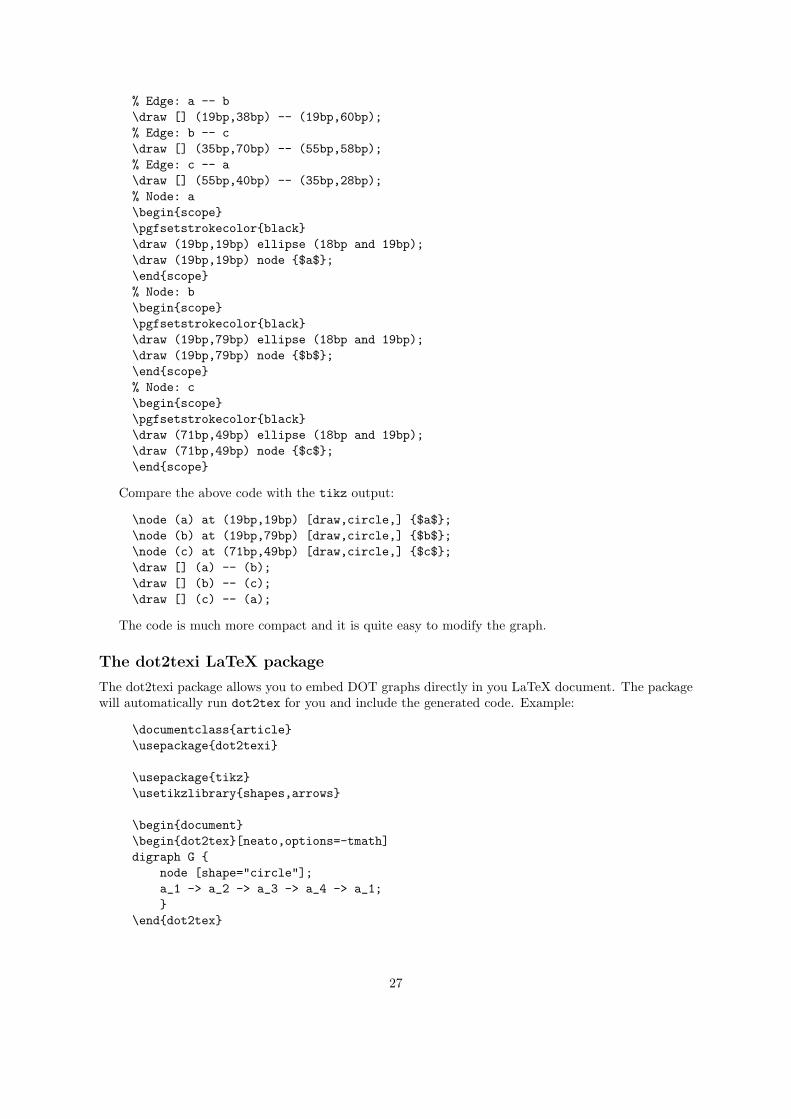
When the above code is run through LaTeX, the following will happen is shell escape is enabled:
• The graph is written to file.
• dot2tex is run on the DOT file.
• The generated code is included in the document.
The whole process is completely automated. The generated graph will look like this:6 Examples
a1
a2
a3
a4
The minimal code required to generate the above graph is:
\documentclass{article}\usepackage{dot2texi}
\usepackage{tikz}\usetikzlibrary{shapes,arrows}
\begin{document}\begin{dot2tex}[neato,options=-tmath]digraph G {node [shape="circle"];a_1 -> a_2 -> a_3 -> a_4 -> a_1;}
\end{dot2tex}
\end{document}
Now an example that uses several TikZ features:
\documentclass{article}\usepackage{dot2texi}
\usepackage{tikz}
4
The codeonly option is useful in conjunction with dot2texi, especially when used with the tikzoutput format. Here is an example that shows how to annotate a graph:
\documentclass{article}\usepackage{tikz}\usetikzlibrary{arrows,shapes}\usepackage{dot2texi}\begin{document}% Define layers\pgfdeclarelayer{background}\pgfdeclarelayer{foreground}\pgfsetlayers{background,main,foreground}
% The scale option is useful for adjusting spacing between nodes.% Note that this works best when straight lines are used to connect% the nodes.\begin{tikzpicture}[>=latex’,scale=0.8]
% set node style\tikzstyle{n} = [draw,shape=circle,minimum size=2em,
inner sep=0pt,fill=red!20]\begin{dot2tex}[dot,tikz,codeonly,styleonly,options=-s -tmath]
digraph G {node [style="n"];A_1 -> B_1; A_1 -> B_2; A_1 -> B_3;B_1 -> C_1; B_1 -> C_2;B_2 -> C_2; B_2 -> C_3;B_3 -> C_3; B_3 -> C_4;
}\end{dot2tex}
28
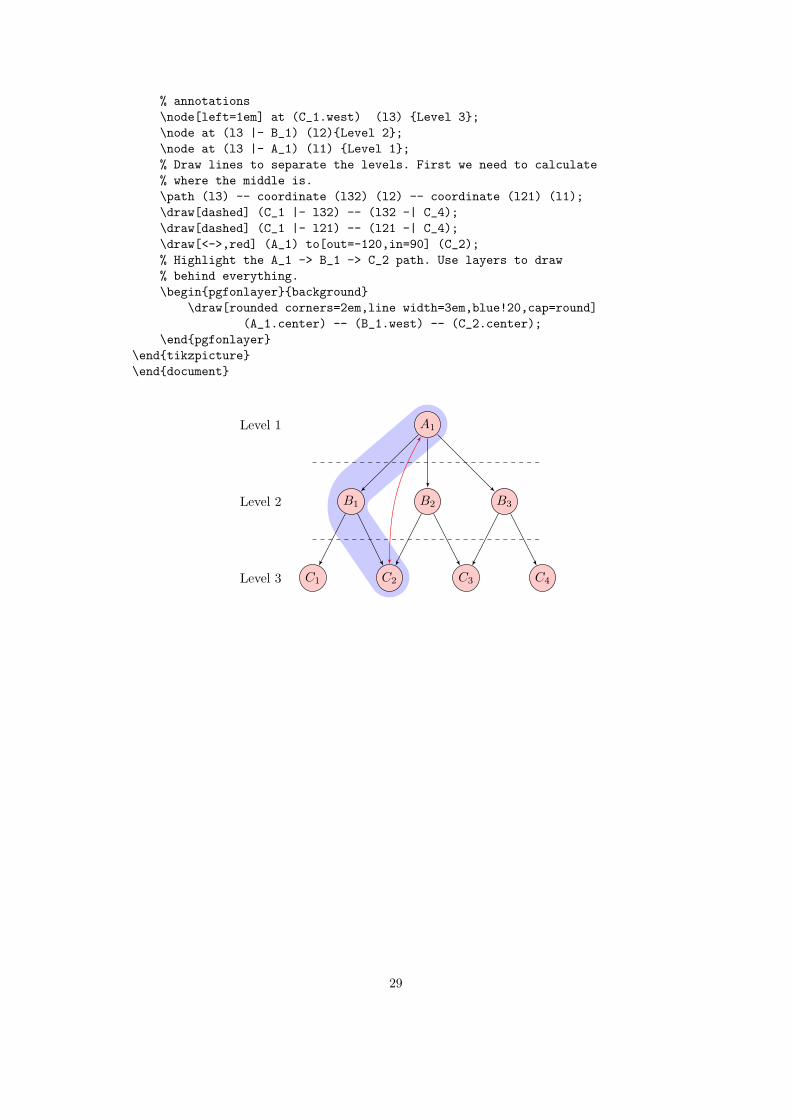
% annotations\node[left=1em] at (C_1.west) (l3) {Level 3};\node at (l3 |- B_1) (l2){Level 2};\node at (l3 |- A_1) (l1) {Level 1};% Draw lines to separate the levels. First we need to calculate% where the middle is.\path (l3) -- coordinate (l32) (l2) -- coordinate (l21) (l1);\draw[dashed] (C_1 |- l32) -- (l32 -| C_4);\draw[dashed] (C_1 |- l21) -- (l21 -| C_4);\draw[<->,red] (A_1) to[out=-120,in=90] (C_2);% Highlight the A_1 -> B_1 -> C_2 path. Use layers to draw% behind everything.\begin{pgfonlayer}{background}
\draw[rounded corners=2em,line width=3em,blue!20,cap=round](A_1.center) -- (B_1.west) -- (C_2.center);
\end{pgfonlayer}\end{tikzpicture}\end{document}
A1
B1 B2 B3
C1 C2 C3 C4Level 3
Level 2
Level 1
29