dot/faa/ar-09/57 calibration of faarfield rigid pavement design procedure · the federal aviation...
TRANSCRIPT

DOT/FAA/AR-09/57 Air Traffic Organization NextGen & Operations Planning Office of Research and Technology Development Washington, DC 20591
Calibration of FAARFIELD Rigid Pavement Design Procedure David R. Brill January 2010 Final Report This document is available to the U.S. public through the National Technical Information Service (NTIS), Springfield, Virginia 22161.
U.S. Department of Transportation Federal Aviation Administration

NOTICE This document is disseminated under the sponsorship of the U.S. Department of Transportation in the interest of information exchange. The United States Government assumes no liability for the contents or use thereof. The United States Government does not endorse products or manufacturers. Trade or manufacturer's names appear herein solely because they are considered essential to the objective of this report. This document does not constitute FAA certification policy. Consult your local FAA airports office as to its use. This report is available at the Federal Aviation Administration William J. Hughes Technical Center’s Full-Text Technical Reports page: actlibrary.tc.faa.gov in Adobe Acrobat portable document format (PDF).

Technical Report Documentation Page
1. Report No.
DOT/FAA/AR-09/57
2. Government Accession No. 3. Recipient's Catalog No.
5. Report Date
January 2010
4. Title and Subtitle
CALIBRATION OF FAARFIELD RIGID PAVEMENT DESIGN PROCEDURE 6. Performing Organization Code
7. Author(s)
David R. Brill
8. Performing Organization Report No.
10, Work Unit No. (TRAIS)
9. Performing Organization Name and Address
U.S. Department of Transportation Federal Aviation Administration William J. Hughes Technical Center Airport and Aircraft Safety Research and Development Division Airport Technology Research and Development Branch Atlantic City International Airport, NJ 08405
11. Contract or Grant No.
13. Type of Report and Period Covered
Final Report
12. Sponsoring Agency Name and Address
U.S. Department of Transportation Federal Aviation Administration Office of Airport Safety & Standards Washington, DC 20591
14. Sponsoring Agency Code
AAS-100
15. Supplementary Notes
16. Abstract
The Federal Aviation Administration (FAA)-developed Rigid and Flexible Iterative Elastic Layer Design (FAARFIELD) is a computer-based thickness design procedure for airport pavements. For rigid pavements and overlays, the procedure combines a three-dimensional finite element analysis of the rigid pavement system with a performance/failure model based on full-scale traffic tests. For flexible pavements, FAARFIELD uses the same structural response and failure models as LEDFAA version 1.3. The updated rigid pavement failure model in FAARFIELD is based on full-scale tests results from the National Airport Pavement Test Facility and a re-analysis of historical full-scale tests conducted by the U.S. Army Corps of Engineers prior to the 1970s. The FAARFIELD design procedure is intended to supersede the pavement thickness design curves in FAA Advisory Circular (AC) 150/5320-6D. The design curves are considered adequate for traffic mixes including aircraft up to dual-tandem aircraft gears, including the Boeing 747, but cannot be used for newer models with more complex gear geometries. Since it is desirable that rigid pavement thickness designs performed using FAARFIELD not deviate too greatly from equivalent designs using the existing design charts when the design aircraft mix is restricted to the older models, a calibration study was performed. Based on this study, a calibration factor equal to 1.12 was applied to FAARFIELD design stresses to ensure that FAARFIELD rigid pavement design thicknesses are compatible with the earlier procedure for aircraft traffic up to and including the B747. An additional analysis was performed comparing the calibrated FAARFIELD designs with designs based on a modification of the AC 150/5320-6D design procedure using the FAA program COMFAA 2.0 to obtain design thicknesses.
17. Key Words
Airport pavement design, Portland concrete cement, Three-dimensional finite element model, Calibration
18. Distribution Statement
This document is available to the U.S. public through the National Technical Information Service (NTIS), Springfield, Virginia 22161.
19. Security Classif. (of this report) Unclassified
20. Security Classif. (of this page) Unclassified
21. No. of Pages 73
22. Price
Form DOT F 1700.7 (8-72) Reproduction of completed page authorized

ACKNOWLEDGEMENTS The contributions of the following individuals are acknowledged: Dr. Gordon F. Hayhoe, Manager of the National Airport Pavement Test Facility, Mr. Charles Teubert, Dr. Edward H. Guo, Dr. Izydor Kawa, Ms. Lia Ricalde, and Dr. Qiang Wang of SRA International, and Mr. Roy D. McQueen of RD McQueen & Associates. Dr. Satish K. Agrawal is the Manager of the FAA Airport Technology R&D Branch. The contents of this report reflect the views of the authors, who are responsible for the facts and accuracy of the data presented within. The contents do not necessarily reflect the official views and policies of the Federal Aviation Administration. This report does not constitute a standard, specification, or regulation.
iii/iv

TABLE OF CONTENTS
Page EXECUTIVE SUMMARY xi 1. INTRODUCTION 1
2. REVISED RIGID PAVEMENT FAILURE MODEL 3
2.1 Structural Condition Index 3 2.2 Mathematical Relation Between SCI and Traffic Coverages 4 2.3 Summary of Full-Scale Test Data 6 2.4 Recalculation of Design Factors 7 2.5 The SCI Versus Coverage Analysis for NAPTF CC2 Test Items 12 2.6 Combined Model Regression 14 2.7 Modification of Failure Model for High-Stiffness Base and Subbase Layers 17
3. CALIBRATION ANALYSIS 20
3.1 Aircraft Traffic Mixes 21 3.2 Comparative Thickness Designs Using FAARFIELD and R805FAA 24
4. THICKNESS DESIGN COMPARISONS FOR NLA MIXES 26
5. OVERLAY DESIGN COMPARISONS FOR NLA MIXES 33
5.1 Hot-Mix Asphalt on Rigid Overlays 35 5.2 Portland Cement Concrete on Rigid Overlays 41
6. CONCLUSIONS 46
7. REFERENCES 47
APPENDICES
A—Comparative Thickness Data for Non-New Large Aircraft Traffic Mixes
B—Comparative Thickness Data for New Large Aircraft Traffic Mixes
C—Comparative Thickness Data for New Large Aircraft Traffic Mixes (New Large Aircraft Removed From Mix)
D—Comparative Thickness Data for Hot-Mix Asphalt on Rigid Overlays
E—Comparative Thickness Data for Portland Cement Concrete on Rigid Overlays
v

LIST OF FIGURES
Figure Page 1 Assumed Relation Between SCI and Log of Coverages 3
2 Concrete Flexural Strength Test Data for NAPTF CC2 Test Item MRC 10
3 Concrete Flexural Strength Test Data for NAPTF CC2 Test Item MRG 11
4 Concrete Flexural Strength Test Data for NAPTF CC2 Test Item MRS 11
5 SCI vs Log of Coverages for NAPTF CC2 Test Items 13
6 DF Versus CO for Full-Scale Tests Including NAPTF CC2 14
7 DF Versus CF for Full-Scale Tests Including NAPTF CC2 15
8 Rigid Failure Model Comparison 17
9 Calculation of Stabilization Factor Fs 19
10 Optimal Value of Calibration Factor Fc 26
11 PCC Thickness Design Comparison for Traffic Mix 1-NLA—All Traffic 28
12 PCC Thickness Design Comparison for Traffic Mix 2-NLA—All Traffic 29
13 PCC Thickness Design Comparison for Traffic Mix 3-NLA—All Traffic 29
14 PCC Thickness Design Comparison for Traffic Mix 1-NLA—NLA Traffic Removed 30
15 PCC Thickness Design Comparison for Traffic Mix 2-NLA—NLA Traffic Removed 30
16 PCC Thickness Design Comparison for Traffic Mix 3-NLA—NLA Traffic Removed 31
17 Effect of Design Aircraft Selection on PCC Thickness Design Comparisons (Traffic Mix 3-NLA) 33
18 HMA on Rigid Overlay Thickness Comparison for Traffic Mix 1-NLA (FAARFIELD 1.2 vs COMFAA Thickness Deficiency Method) 36
19 HMA on Rigid Overlay Thickness Comparison for Traffic Mix 2-NLA (FAARFIELD 1.2 vs COMFAA Thickness Deficiency Method) 37
vi

20 HMA on Rigid Overlay Thickness Comparison for Traffic Mix 3-NLA (FAARFIELD 1.2 vs COMFAA Thickness Deficiency Method) 37
21 HMA on Rigid Overlay Thickness as a Function of Existing PCC Thickness for NLA Mixes 3, 4, and 8 Combined 39
22 HMA on Rigid Overlay Thickness Comparison for Traffic Mix 1-NLA (FAARFIELD 1.2 vs LEDFAA 1.3) 39
23 HMA on Rigid Overlay Thickness Comparison for Traffic Mix 2-NLA (FAARFIELD 1.2 vs LEDFAA 1.3) 40
24 HMA on Rigid Overlay Thickness Comparison for Traffic Mix 3-NLA (FAARFIELD 1.2 vs LEDFAA 1.3) 40
25 PCC on Rigid Overlay Thickness Comparison for Traffic Mix 1-NLA (FAARFIELD 1.2 vs COMFAA Thickness Deficiency Method) 42
26 PCC on Rigid Overlay Thickness Comparison for Traffic Mix 2-NLA (FAARFIELD 1.2 vs COMFAA Thickness Deficiency Method) 42
27 PCC on Rigid Overlay Thickness Comparison for Traffic Mix 3-NLA (FAARFIELD 1.2 vs COMFAA Thickness Deficiency Method) 43
28 Required PCC Thickness as a Function of Subgrade Modulus for COMFAA-Based Thickness Deficiency Method (Traffic Mix 1-NLA) 44
29 Required PCC Thickness as a Function of Subgrade Modulus for FAARFIELD 1.2 Design Method (Traffic Mix 1-NLA) 44
30 PCC on Rigid Overlay Thickness Comparison for Traffic Mix 1-NLA (FAARFIELD 1.2 vs LEDFAA 1.3) 45
31 PCC on Rigid Overlay Thickness Comparison for Traffic Mix 2-NLA (FAARFIELD 1.2 vs LEDFAA 1.3) 45
32 PCC on Rigid Overlay Thickness Comparison for Traffic Mix 3-NLA (FAARFIELD 1.2 vs LEDFAA 1.3) 46
vii

viii
LIST OF TABLES Table Page 1 Rigid Pavement Distress Types Contributing to SCI Deducts 4 2 Full-Scale Test Data Used in Derivation of LEDFAA Rigid Failure Model 7 3 Recalculated Design Factors 8 4 Regression Data for Analysis of SCI vs Coverages 13 5 Air Traffic Mixes for Comparative Thickness Designs 21 6 Determination of Design Aircraft for Mix 1-NLA 32 7 Structures for HMA on Rigid Overlay Design Comparison 35 8 Design Aircraft Data for COMFAA HMA Overlay Designs 36 9 Structures for PCC on Rigid Overlay Design Comparison 41

ACRONYMS 2D Dual tandem gear 3D Three dual gears in tandem 3D-FE Three-dimensional finite element 3D-FEM Three-dimensional finite element model AC Advisory Circular CC2 Construction Cycle 2 CDF Cumulative damage factor D Dual-wheel gear FAA Federal Aviation Administration FAARFIELD FAA Rigid and Flexible Iterative Elastic Layer Design HMA Hot-mix asphalt KLJS Keyed Longitudinal Joint Study LEDFAA Layered Elastic Design Federal Aviation Administration MWHGL Multiple Wheel Heavy Gear Load NAPTF National Airport Pavement Test Facility NLA New large aircraft P/C Pass-to-coverage PCC Portland cement concrete PCI Pavement Condition Index PCN Pavement classification numbers S Single-wheel gear SCI Structural Condition Index SSPS Soil Stabilization Pavement Study WES Waterways Experiment Station
ix/x

EXECUTIVE SUMMARY The Federal Aviation Administration (FAA) has developed a new airport pavement thickness design procedure based on three-dimensional finite element (3D-FE) principles for rigid pavement design and layered elastic analysis for flexible pavements. The integrated design program is called the FAA Rigid and Flexible Iterative Elastic Layer Design (FAARFIELD) and is intended to accompany the revised Advisory Circular (AC) 150/5320-6E, Airport Pavement Design and Evaluation. The rigid design procedure in FAARFIELD departs significantly from the procedure in the previous standard program, Layered Elastic Design Federal Aviation Administration (LEDFAA) 1.3. The main differences between the FAARFIELD rigid pavement design procedure and the procedure as implemented in LEDFAA 1.3 are the use of the 3D-FE model to obtain design stresses, and the revision of the failure model to incorporate new data points from full-scale traffic tests at the FAA National Airport Pavement Test Facility. The new rigid design procedure has been compared to the old FAA design method, as described in AC 150.5320-6D, for different structures under single aircraft load and various traffic mixes. This report focuses on the results of the comparative analyses for both new and overlay pavements. Parameters analyzed in this report include subgrade strength, aircraft type, annual departure levels for single aircraft, narrow- and wide-body aircraft traffic mixes, and thickness and strength of stabilized and aggregate base and subbase layers. For airport pavements accommodating aircraft heavier than 100,000 lb, the FAA design procedure requires the use of a stabilized base and subbase. The influence of a stabilized base/subbase on the pavement life or thickness has also been studied. The comparative analysis results have been used to calibrate the parameters in the new rigid pavement failure criterion. The resulting calibration factor has been implemented for rigid pavement design in the standard version of FAARFIELD.
xi/xii

1. INTRODUCTION.
The Federal Aviation Administration (FAA) Rigid and Flexible Iterative Elastic Layered Design (FAARFIELD) is a software program developed by the FAA to perform airport pavement thickness designs conforming to the requirements of Advisory Circular (AC) 150/5320-6E, Airport Pavement Design and Evaluation. For rigid pavements and overlays, the procedure combines a three-dimensional finite element (3D-FE) analysis of the rigid pavement system with a performance/failure model based on full-scale traffic tests. For flexible pavements, FAARFIELD uses a linear elastic structural response model (LEAF). For both rigid and flexible pavements, the failure models incorporate new test data on 4- and 6-wheel aircraft gears obtained from full-scale tests performed at the National Airport Pavement Test Facility (NAPTF) located at the FAA William J. Hughes Technical Center, Atlantic City International Airport, NJ. FAARFIELD was developed using the existing FAA software program Layered Elastic Design Federal Aviation Administration (LEDFAA) (version 1.3) as a starting point. Except for certain improvements, discussed in reference 1, the program organization, user requirements, etc., are identical to LEDFAA 1.3. Moreover, for flexible pavements and overlays, there are only minor differences between the FAARFIELD procedure and the procedure in LEDFAA 1.3. Most of the differences are in the internal programming and pertain to rigid pavement and rigid overlay design. The most significant changes are as follows: • Stresses in rigid pavements are computed using a three-dimensional finite element model
(3D-FEM) based on the program NIKE3D [2]. This replaces the “equivalent edge stress” calculation that had been implanted in LEDFAA 1.3. The 3D-FEM is capable of directly computing the stress on the edge of a loaded slab, which is typically the critical stress for rigid pavement design.
• The rigid pavement failure models have been completely rewritten, based on a new analysis of full-scale test data, including data points obtained from NAPTF rigid pavement tests conducted in 2004. The 2004 rigid pavement tests and several smaller-scale preparatory tests are collectively referred to as Construction Cycle 2 (CC2). The new failure model is designed to work with the edge stress computed by the FAARFIELD 3D-FEM.
• The algorithms for rigid pavement overlay design were completely rewritten. In the process, a number of errors in the previous procedure were discovered and corrected.
• The entire program was migrated to a new programming environment, Microsoft® Visual Studio.NET™ (2005 version). The conversion from the previous programming environment, Visual Basic® 6.0, was intended to ensure compatibility of the FAARFIELD program with current and future operating systems, as well as future maintainability.
• The computation of pass-to-coverage (P/C) ratio is done using a new algorithm that is applicable to arbitrary wheel configurations.
1

• The aircraft library has been updated and extended to include many aircraft types that were not available in LEDFAA 1.3.
• Previous versions of the FAA layered elastic-based design procedure through LEDFAA 1.2 maintained constant tire pressure while allowing the tire contact area to vary as the gross taxi weight was changed. In FAARFIELD, the procedure has been changed so that the tire contact area is held constant while tire pressure varies linearly with the gross weight. The tire contact area is determined as the tire load for the airplane maximum gross weight divided by the rated tire pressure, as given by the airplane manufacturer. This procedure is more consistent both with actual practice (in which tire inflation pressures are adjusted to maintain the rated tire deflection) and with the older design charts in AC 150/5320-6D, which were derived based on constant tire contact area.
Previous technical reports issued by the FAA covered the development of the FAA finite element design procedure using NIKE3D [3] and compared rigid pavement design thicknesses obtained using the 3D-FEM-based design procedure with the conventional FAA procedure based on design nomographs [4]. The latter report [4] showed that 3D-FEM-based design thicknesses for rigid slabs are reasonably close to design thicknesses following the older FAA standard, but some calibration of the procedure would be necessary to ensure continuity from the previous standard for the pre-existing airplane fleet. In other words, it is desirable to minimize the deviation from the previous design standard, when the aircraft mix contains only the older airplane types covered under the earlier procedure. For this purpose, the “pre-existing fleet” is taken to refer to current single (S), dual-wheel (D), and dual-tandem (2D) aircraft gears, including the B747, for which standard thickness design nomographs are found in AC 150/5320-6D [5]. This report consists of four parts. In section 2, the available full-scale test data are reviewed and the revised rigid pavement failure model derivation is given. Once the rigid pavement failure model in FAARFIELD has been established, including the stabilized base compensation factor, it is then possible to compare FAARFIELD thickness requirements with AC 150/5320-6D design nomographs for a representative range of rigid pavement structures and aircraft traffic mixes. This is done in section 3, and a calibration constant (stress multiplier) is obtained that minimizes the average difference between the procedures over the design matrix for the existing fleet up to and including the B747. In section 4, additional design comparisons are presented for aircraft mixes including new large aircraft (NLA) for which standard design charts are unavailable. NLAs in this analysis include three dual gears in tandem (3D) and complex aircraft types (Boeing B777 and Airbus A380 and A340-500/600). These comparisons make use of the FAA program COMFAA for nonstandard designs. COMFAA computes rigid slab thicknesses following the same basic method originally used to prepare the design charts (based on Westergaard’s edge stress formula), but applies it to any gear configuration, including 3D and user-defined gears. Section 5 presents similar comparisons for rigid overlay designs.
2

2. REVISED RIGID PAVEMENT FAILURE MODEL.
2.1 STRUCTURAL CONDITION INDEX.
Rollings [6] introduced the concept of the Structural Condition Index (SCI) as a measure of the performance of a rigid airport pavement. Rollings defined SCI as a modification of the Pavement Condition Index (PCI) in which only the load-related distresses contribute to the deduct values. Nonload-related distresses (e.g., D-cracking) were ignored. In analyzing full-scale test data for rigid pavements, Rollings observed that the SCI deteriorates as an approximately linear function of the logarithm of coverages1. Figure 1 shows the assumed form of the SCI versus coverages relationship. The CC2 tests at the NAPTF verified this linear relationship and also showed that it is valid for rigid pavements with high-stiffness (stabilized) bases. Figure 1 defines two coverage levels important to the analysis. The number of coverages to the first observed through crack, i.e., at which SCI just begins to diminish from its initial level of 100, is defined as CO. (The SCI level associated with CO is denoted 100-. The number of coverages to complete failure, defined as the loss of all slab integrity or SCI = 0, is CF. As shown in figure 1, the path from CO to CF is an assumed linear function of log (C).
0
100
10 100 1000 10000 100000 1000000Coverages (log scale)
SCI
C O C F
Figure 1. Assumed Relation Between SCI and Log of Coverages Since there are variants of the SCI used in practice [7], it is important to define the specific distresses that are assumed to contribute to the SCI. In analyzing the NAPTF test data, the same general definition of SCI was used as was previously used by the U.S. Army Engineers Waterways Experiment Station (WES) to analyze the series of full-scale tests conducted 1945-1971 [6]. By using a consistent definition of SCI, the older (WES) data could be combined
1 One coverage is defined as the number of passes of an aircraft gear (subject to wander) sufficient to cover every part of a strip of pavement once. It is related to passes by the pass-to-coverage ratio (P/C).
3

with the new NAPTF CC2 data without too much difficulty. The following distresses, shown in table 1, were assumed to contribute to SCI (following Rollings, [6]).
Table 1. Rigid Pavement Distress Types Contributing to SCI Deducts
Number (MicroPAVER)
Distress Name Severity Levels
62 Corner break 1, 2, 3 62 Longitudinal/transverse/diagonal cracking 1, 2, 3 72 Shattered slab 1, 2, 3 73 Shrinkage cracks* 1 74 Joint spalling 1, 2, 3 75 Corner spalling 1, 2, 3
*Used to describe a load-induced crack extending part way across a slab. For the purpose of computing SCI, this distress does not include conventional shrinkage cracks due to curing problems.
2.2 MATHEMATICAL RELATION BETWEEN SCI AND TRAFFIC COVERAGES.
The rigid pavement failure model treats SCI as a parametric function of coverages C, concrete strength R, and analytical stress σ . The general form of the rigid failure model as implemented in LEDFAA 1.3 is
e
CSCIbFd
bFaDFSCI
ss log
100 ⎥⎦
⎤⎢⎣
⎡×⎟⎠⎞
⎜⎝⎛ ×−
+×−−= (1)
where DF = design factor = σR = coverages C = stabilized base compensation factor sF a,b,d,e = parameters The parameters are obtained from regression of the full-scale data. ( ) aCbDF F +×= log (2) ( ) cCdDF O +×= log (3)
( )100
ace −= (4)
( )100
bdg −= (5)
4

For , the original (uncompensated) form of the failure model is recovered. 1=sF
[ ]e
CSCIgbaDFSCI log×+−−= (6)
The number of coverages for SCI = 100- remains constant as the value of varies. For sF 1<sF , the number of coverages to failure increases. Failure can also be accelerated (i.e., for low-quality subbases) by using a value of . Note that equation 1 is mathematically equivalent to the form given in the LEDFAA user manual [8].
1>sF
[ ]
eCSCIgFbFaDF
SCI scs log×+−−= (7)
where
s
ssc Fg
FbdF
××−
= (8)
Equation 1 is not linear in log C. However, it is approximately linear in log C for values of
. Therefore, the FAARFIELD model replaces equation 1 with a new equation that is truly linear in log C.
1≅sF
⎥⎦
⎤⎢⎣
⎡−−
×′−=OF
Os CC
CCFSCI
loglogloglog
1100 (9)
where is a general stabilized base compensation factor, and sF ′
d
cDFCO−
=log (10)
b
aDFCF−
=log (11)
In contrast to the LEDFAA model, the FAARFIELD model remains linear with the log of coverages for all values of . Changing the value of sF ′ sF ′ in equation 9 changes the slope of the falling leg of the SCI-versus-C relationship, but does not affect the number of coverages to initial crack (SCI = 100-). The value of sF ′ can be determined as a function of base modulus and thickness and subgrade modulus, similar to Fs in the LEDFAA procedure. Alternatively, sF ′ can be assigned a value of 1 to recover the basic (uncompensated) model. An illustration of the proposed model, for assumed and0.1=′sF 3.0=′sF , is shown below (using data from test item MRS).
5

Note that assuming SCI = 100 in equation 9 recovers equation 2. If 1=′sF , then assuming SCI = 0 recovers equation 3. Equations 9 through 12 can also be used to derive a unique DF-vs-log C fatigue relationship for any given SCI. The SCI can be expressed as 100×=αSCI (12) where 10 ≤≤α . Then equation 9 yields
( )( )( )( )( )( ) ⎥
⎦
⎤⎢⎣
⎡′+−−′+−−
+×⎥⎦
⎤⎢⎣
⎡′+−−
′=
bFbdbcFbcad
CbFbd
bdFDF
s
s
s
s
αα
α 11
log1
(13)
For the special case of , obtain 1=′sF
( )( )( ) ⎥
⎦
⎤⎢⎣
⎡−+−+
+×⎥⎦
⎤⎢⎣
⎡−+
=dbadbcC
dbbdDF
αααα
αα 11log
1 (14)
By setting 8.0=α in equation 14, obtain the failure relationship for SCI = 80
⎥⎦⎤
⎢⎣⎡
++
+×⎥⎦⎤
⎢⎣⎡
+=
dbadbcC
dbbdDF
2.08.02.08.0log
2.08.0 (15)
2.3 SUMMARY OF FULL-SCALE TEST DATA.
The rigid pavement failure model implemented in LEDFAA 1.3 is based on two regression equations reported in Rollings [6]. ( )OCDF log3920.05234.0 += (16a) ( )FCDF log3881.02967.0 += (16b) The parameters in equations 16a and 16b were determined by an analysis of full-scale test data from the following tests: Lockbourne No. 1, Lockbourne No. 2, Sharonville Heavy Load Tests, Multiple Wheel Heavy Gear Load (MWHGL) Tests, Keyed Longitudinal Joint Study (KLJS), and Soil Stabilization Pavement Study (SSPS). These tests and the accompanying analytical data are described in references 9 through 16. The original analysis by Rollings was based on design factors computed using interior stresses σ from layered elastic analysis. While the general form of equations 16a and 16b continues to be applicable to the finite element-based design procedure, the numerical values of the constants are not consistent with the 3D-FE stress model. Therefore, the constants were revised based on a re-analysis of the design factors, using the same edge stress model incorporated in the 3D-FE-based design procedure.
6

The original data set consisted of 30 data points derived from the six full-scale tests, as listed in table 2.
Table 2. Full-Scale Test Data Used in Derivation of LEDFAA Rigid Failure Model
Test Number of Data Points
Lockbourne No. 1 15
Lockbourne No. 2 (Experimental Mat and Modification)
3
Sharonville 1 MWHGL 4 KLJS 4 SSPS 3 Total 30
Not all data points available from the test documentation were used to determine equations 16a and 16b. Rollings categorized the available data into three categories (Class I, Class II, and Class III) based on the quality of the data spread, presence of a defined failure, unusual failure modes observed, and other factors. Class II data were further subdivided into II(a) and II(b) data, with Class II(a) data defined as the data that would have been considered Class I except for relatively poor data spread. Equation 16a was computed based on Class I and Class II(a) data points (21 data points), while equation 16b included Class II(b) as well. In the re-analysis of the data for the modified rigid failure model, the above data are supplemented by seven new data points from the NAPTF CC2 full-scale tests. These new data points are MRC-North (MRC-N), MRC-South (MRC-S), MRG-North (MRG-N), MRG-South (MRG-S), MRS-North (MRS-N), MRS-South (MRS-S), and the CC2 Test Strip, S Slabs (TS-S). The CC2 data were analyzed using, as closely as possible, the same procedures used for the historical data points. 2.4 RECALCULATION OF DESIGN FACTORS.
Design factors, DF, for all 30 data points in table 2 were recomputed using the 3D-FE stress model, as implemented in FAARFIELD. The new design factor is given by
e
RDFσ×
=75.0
(17)
where eσ is the free edge stress computed by the FAARFIELD model, and the 25% reduction in stress accounts for assumed load transfer between slabs. Wheel loads and configurations for the finite element computation were based on loading information given in the original test reports. Likewise, pavement layer input data were estimated from the information provided in the
7

original test reports and in Parker, et al. [17]. However, in accordance with the philosophy that the design factors should conform to the design procedure used, the material properties are assigned to be consistent with LEDFAA requirements. Thus, the concrete slab is always assigned a nominal E modulus of 4,000,000 psi for the purpose of establishing the design factors, even if test results might justify a higher value. Table 3 lists the recomputed design factors. For comparison, the design factors given by Rollings [6] (layered elastic-based) are also given. Finite element-based design factors for the seven NAPTF data points were also computed and are listed in table 3.
Table 3. Recalculated Design Factors
Test Series Test Item
R (psi)
3D-FEM Design Stress
(psi) Design Factor (Recomputed)
Design Factor [6]
A-1 740 402.3 1.839 1.827 A-2 780 580.5 1.344 1.302 B-1 740 533.6 1.387 1.468 B-2 780 791.7 0.985 1.028 C-1 740 599.1 1.235 1.326
Lockbourne I
C-2 780 904.6 0.862 0.914 D-1 740 611.1 1.211 1.294 D-2 780 926.6 0.842 0.889 E-2 780 805.8 0.968 1.012 N-2 780 605.3 1.289 1.383 N-3 735 794.8 0.925 0.936 O-2 780 484.7 1.609 1.703 O-3 735 647.7 1.135 1.136 Q-3 735 647.5 1.135 1.115
Lockbourne I
U-2 780 468.8 1.664 1.480 E-6 700 397.1 1.763 1.763 M-1 725 658.5 1.101 1.208
Lockbourne II
M-2 725 447.3 1.621 1.626 Sharonville 73 800 466.1 1.716 1.995
1-C5 640 551.5 1.314 1.250 4-C5 720 701.5 1.105 1.054 2-DT 600 573.3 1.221 1.234
MWHGL
3-DT 630 470.5 1.403 1.518
8

Table 3. Recalculated Design Factors (Continued)
Test Series Test Item
R (psi)
3D-FEM Design Stress
(psi) Design Factor (Recomputed)
Design Factor [6]
1-C5 730 629.6 1.437 1.380 2-C5 610 475.9 1.534 1.399 3-C5 598 526.7 1.538 1.397
KLJS
4-DT 790 628.1 1.369 1.338 3-200 850 475.4 1.893 1.944 4-200 900 559.1 1.556 1.879
SSPS
4-240 600 653.4 1.332 1.568 MRC-N 710 585.2 1.213 - MRC-S 710 585.2 1.213 - MRS-N 650 555.3 1.171 - MRS-S 650 561.2 1.158 - MRG-N 690 484.9 1.423 - MRG-S 690 469.4 1.470 -
NAPTF (CC2)
TS-S 1040 758.8 1.371 - Because the design factor, DF, is strongly dependent on the concrete strength, R, the selection of an appropriate value for R is critical. The value of R obtained from tests depends on concrete sampling, curing and testing methods, as well as on the age of the sample tested. In the previous full-scale test analyses, the general philosophy was to base the design factors on the estimated flexural strength of the concrete at the time of testing, rather than on 28-day strength or another arbitrary age [6]. How this was implemented varied from test to test. In the Lockbourne I series of tests, the strength at the time of testing was estimated from a variety of data, including 28-day tests of laboratory-cured cast beams, 300-day tests of field beams, and posttraffic tests of beams sawed from the slabs in the field. In the MWHGL test series, sawed beam strengths were used for analysis, based on the fact that traffic was applied a long time (over 1 year) after concrete placement. The R values given in table 3 are the concrete strengths for analysis taken from the relevant test reports. In the case of the NAPTF test items, the concrete strength at the time of trafficking was estimated based on combining results from the following flexural strength tests: • Field-cured specimens tested at 28, 56, and 90 days after placement.
• Laboratory-cured specimens tested at 28, 56, and 90 days.
• Field-cured specimens reserved and tested at various ages ranging from 123 days (MRC) to 439 days (MRG) after placement.
9

• Beams sawed from the slabs after the completion of trafficking, and tested at various ages ranging from 232 to 453 days after placement.
The above data were combined and used to produce a trend line, from which an average concrete strength at the time of trafficking could be interpolated for each test item (figures 2-4). The trend line excludes “early age” specimens (i.e., beams tested at 2, 5, 7, and 14 days). This procedure is deemed to be consistent with the precedent established for analysis of Lockbourne I and subsequent tests.
1200.0
y = -0.7454x + 802.77 1000.0
Flex
ural
Stre
ngth
, psi
800.0
600.0
400.0 R = 716 psi, 116 days (MRC-South)
200.0 R = 704 psi, 133 days (MRC-North)
0.0 0 50 250 100 150 200 300
Age, days
All Points Field Cured - 1st Pour Laboratory Cured - 1st PourLaboratory Cured - 2nd Pour Sawed - Top Field Cured - 2nd PourSawed - Bottom Field Cured (Reserved) Sawed - MiddleLinear (All Points)
Figure 2. Concrete Flexural Strength Test Data for NAPTF CC2 Test Item MRC
10

1200.0
y = -0.2344x + 743.75 1000.0Fl
exur
al S
treng
th, p
si
800.0
600.0 R = 686 psi, 246 days
400.0
200.0
0.0 0 50 100 400 450 150 200 250 300 350 500
Age, days
All Points Field Cured - 1st Pour Laboratory Cured - 1st PourSawed - Top Laboratory Cured - 2nd Pour Field Cured - 2nd Pour
Figure 3. Concrete Flexural Strength Test Data for NAPTF CC2 Test Item MRG
Figure 4. Concrete Flexural Strength Test Data for NAPTF CC2 Test Item MRS
Sawed - Bottom Sawed - Middle Field Cured (Reserved)Linear (All Points)
1000.0 y = -0.1525x + 679.74
800.0
Flex
ural
Stre
ngth
, psi
600.0
400.0 R = 654 psi, 169 days
R = 648 psi, 208 days 200.0
0.0 0 50 250 100 150 200 300
Age, days
Field Cured - 1st Pour All Laboratory Cured - 1st PourLaboratory Cured - 2nd Pour Field Cured - 2nd Pour Sawed - TopSawed - Bottom Sawed - Middle Field Cured - 1st Pour (Reserved)Field Cured - 2nd Pour (Reserved) Linear (All Points)
11

It is noted that the very high fly ash concrete (50% class C fly ash replacing cement) used for CC2 tests items MRC, MRG, and MRS did not gain strength continuously as would be expected for normal concrete. Rather, the concrete strength reached a plateau at approximately 28 days, and then either remained nearly constant (MRS) or apparently decreased with age (MRC and MRG). The observed strength-gain behavior, which is attributed to the high content of class C fly ash, seems to preclude the use of a single variable, such as 28-day strength, to predict in-service strength at a given time, and is another reason why it was thought desirable to include test data from several different ages to establish the concrete strength more accurately at the time of trafficking. For the test strip (TS-S), posttraffic flexural strength tests were not available. The only available data on strength were from 28-day beams. Therefore, these results were used to establish the design factors. 2.5 THE SCI VERSUS COVERAGE ANALYSIS FOR NAPTF CC2 TEST ITEMS.
Estimated numbers of coverages to first through crack (CO) and to full failure (shattered slab) condition (CF) were computed for the seven NAPTF CC2 data points using Rollings’ procedure [6]. As stated in section 2.1, it is assumed that there is a linear relationship between the pavement condition, expressed by SCI, and the logarithm of the number of coverages. SCI is computed using the procedures outlined in ASTM D 5340-03 [18], but excluding all non-structural-related distresses. For this analysis, the program MicroPAVER was used to perform the SCI computations. The distresses included in the SCI computation were the ones listed in table 1, except that joint spalling and corner spalling were not counted for analysis of NAPTF test items. Although these distresses were observed, it was determined that they were a construction-related defect rather than a true load-induced distress, and that they had no significant effect on the structural capacity of the pavement. Furthermore, it was decided that the sample units on which the SCI numbers are based should include only slabs that received full traffic from both wheels of the load module. In practice, this means that the outside lanes, which exhibited early, top-down cracks but did not receive full traffic, were excluded from the SCI calculation. Figure 5 shows plots of SCI versus log of coverages for all seven CC2 tests. The SCI was computed at intervals based on visual surveys conducted during the course of testing. Again following Rollings’ procedure, a line of best fit was drawn through the observed points for each traffic test. The point at which the best fit line intersects the SCI = 100 horizontal corresponds to CO, while the intersection with the SCI = 0 line corresponds to CF. Besides tying in the NAPTF data with the previous data sets analyzed by Rollings, this method has several advantages: • It allows the CO and CF values to be based on analysis of the entire trend of SCI versus
coverages, rather than on single observations, which are subject to high variability. Thus, the CO and CF are more reliable than they would be if based on single observations.
• It does not require the test to be continued to SCI = 0 (complete loss of structural integrity) as long as a reliable trend is established that can be extrapolated to SCI = 0.
12

0
20
40
60
80
100
100 1000 10000
Coverages
SCI
MRC-North MRC-South MRS-North MRS-South
MRG-North MRG-South CC2 Test Strip
CC2 Test Strip
MRC-South
MRC-North
MRS-North
MRG-North
MRG-South
MRS-South
Figure 5. SCI vs Log of Coverages for NAPTF CC2 Test Items A summary of the performance data for NAPTF CC2 test items, including the calculated values of CO and CF for each test, is given in table 4.
Table 4. Regression Data for Analysis of SCI vs Coverages
Regression Constants*
Test Item A B R2
Coverages to Initial Crack
(CO)
Coverages to Full Failure
(CF) P/C MRC-N -167.43 572.15 0.821 661 2613 3.80 MRC-S -148.36 506.04 0.827 546 2576 4.71 MRG-N -247.03 941.57 0.964 2551 6480 4.71 MRG-S -246.96 935.12 0.965 2408 6117 4.71 MRS-N -101.71 374.94 0.896 505 4855 4.71 MRS-S -231.66 871.57 0.961 2141 5784 4.71 Test Strip -90.33 296.37 0.904 149 1910 4.13
*SCI = A log(C) +B
13

2.6 COMBINED MODEL REGRESSION.
Having established in table 4 the appropriate values of CO and CF for each test, these values were plotted against the calculated DFs. This was done using both the recomputed DFs for the original set of 30 data points, and the DFs for the 7 new NAPTF data points, for a total of 37 data points. The values of CO and CF for the original data points were computed by Rollings and are given in reference 6. Figure 6 presents a plot of DF versus CO. To maintain continuity with the previous analysis, only the 21 data points used by Rollings (Class I and Class II(a)), plus the 7 NAPTF data points are used. A similar plot of DF versus CF is presented in figure 7, based on all 30 Class I and Class II data points from Rollings’ original set, plus the 7 NAPTF points.
0
0.5
1
1.5
2
1 10 100 1000 10000Coverages to Onset of Deterioration, C 0
DF
NAPTF MWHGL KLJSSSPS Lockbourne 1 Lockbourne 2New Regression (All points)
MRC-NMRC-S
TS-S
MRS-N
MRS-SMRG-N
MRG-S
DF = 0.7409 + 0.2464 log (C O )
Figure 6. DF Versus CO for Full-Scale Tests Including NAPTF CC2
14

0
0.5
1
1.5
2
2.5
1 10 100 1000 10000 100000Coverages to Complete Failure, C F
DF
NAPTF MWHGL KLJSSSPS Lockbourne 1 Lockbourne 2Sharonville New Regression (All Points)
MRC-NMRC-S
TS-S
MRS-N
MRS-S MRG-S
MRG-N
DF = 0.5878 + 0.2523 log (C F )
Figure 7. DF Versus CF for Full-Scale Tests Including NAPTF CC2
Based on the data regressions in figures 6 and 7, the following equations are proposed to replace equations 16a and 16b. ( )OCDF log2465.07409.0 += (18a) ( )FCDF log2523.05878.0 += (18b) Equations 18a and 18b can be implemented in the form of a single design equation involving DF, SCI, and C, following the model given in section 2.2.
( )( )( )( )( )( ) ⎥
⎦
⎤⎢⎣
⎡′+−−′+−−
+×⎥⎦
⎤⎢⎣
⎡′+−−
′=
bFbdbcFbcad
CbFbd
bdFDF
s
s
s
s
αα
α 11
log1
(19)
where α = SCI/100, and the parameters are obtained from equations 18a and 18b:
a = 0.5878 b = 0.2523 c = 0.7409 d = 0.2465
The factor is a general compensation factor for stabilized bases whose default value is 1.0. '
sF
15

For new rigid pavements, the design condition is α = 0.8, corresponding to SCI = 80. For this condition and = 1, obtain '
sF
⎥⎦⎤
⎢⎣⎡
++
+×⎥⎦⎤
⎢⎣⎡
+=
dbadbcC
dbbdDF
2.08.02.08.0log
2.08.0 (20)
For the proposed parameters, equation 20 is plotted in figure 8. For comparison, the equivalent failure equation for the rigid pavement design curves in AC 150/5320-6D is superimposed
n
CdDF ⎥⎦
⎤⎢⎣
⎡⎟⎠⎞
⎜⎝⎛×+×=
5000log13.1 (21)
where
(22) 5000 if 07058.05000 if 15603.0
<=≥=
CdCd
and n is an exponent that typically lies between 1.2 and 1.7. In equation 20, DF is defined by equation 17, that is, as the ratio of concrete strength to 0.75 × computed free edge stress eσ . However, in equation 21, eσ is computed using the Westergaard edge stress model rather than the 3D-FEM. It is noted that the DF versus C relationship in figure 8 for the AC 150/5320-6D design charts is not linear in log (C). The Westergaard-based design model establishes a linear relationship between thickness and the log of coverages (the “percent of thickness” concept). According to the classical Westergaard edge stress formula [19], edge stress is a product of two nonlinear functions of the slab thickness t. ( ) ( )tFtFe 21 ×=σ (23) where F1 is inversely proportional to the square of the slab thickness, and F2 is proportional to the logarithm of l, the radius of relative stiffness, which is in turn proportional to the 0.75 power of t. Thus, the Westergaard failure curve in figure 8 is not a simple analytic function of log (C). In figure 8, the two curves for 2.1=n and 7.1=n act as an envelope for the true AC 150/5320-6D rigid failure model. Also superimposed on figure 8 are the seven data points from CC2.
16

2.5 MRG-S
Figure 8. Rigid Failure Model Comparison 2.7 MODIFICATION OF FAILURE MODEL FOR HIGH-STIFFNESS BASE AND SUBBASE LAYERS.
The NAPTF CC2 tests provided data that were used to evaluate the LEDFAA stabilized base compensation model. The model implemented in LEDFAA 1.3 adjusts the rigid pavement failure model using a factor Fs, as shown in equation 8. The factor Fs is computed using the following three-step procedure. • Step 1: Compute an equivalent thickness tEQ based on the properties of all base or
subbase layers. The equivalent thickness is determined from:
(24) ∑=
=n
iiiEQ tft
1
0
0.5
1
1.5
2
1 10 100 1000 10000 100000
Coverages to Design Failure, C (80)
DF
NAPTF Data PointsAC 150/5320-6D Design Procedure (Westergaard-based), n = 1.7 AC 150/5320-6D Design Procedure (Westergaard-based), n = 1.2 FAARFIELD Rigid Failure Model (uncalibrated)
MRC-MRC-TS-S
MRS-
MRS-S MRG-
17

where n is the number of layers between the Portland cement concrete (PCC) and the subgrade, ti is the actual thickness of layer i in inches, and fi is determined from:
( )( ) (
( ) ⎪⎭
⎪⎬
⎫
⎪⎩
⎪⎨
⎧
≥
<<×−
≤
=
5000000.1
500000200000300000
5.0200000
2000005.0
i
ii
i
i
E
EE
E
f ) (25)
where Ei is the elastic modulus of layer i in psi.
• Step 2: Based on the equivalent thickness from step 1, compute the value of the “intermediate factor” Fss, defined as the value at which the (quadratic) plot of Fs versus ESG intersects the ESG = 0 axis
⎟⎟⎠
⎞⎜⎜⎝
⎛<=
⎟⎟⎠
⎞⎜⎜⎝
⎛≥×= ⎥
⎥⎦
⎤
⎢⎢⎣
⎡⎟⎟⎠
⎞⎜⎜⎝
⎛−×
4.0in8
31.1
4.0in8
1025.0 in812.1
EQSS
EQ
t
SS
tF
tF
EQ
(26)
• Step 3: Assume a quadratic plot of Fs as a function of ESG, whose values in the limit are
Fs = Fss at ESG = 0 and Fs = 1 at ESG = 50000 psi. Assume that Fs = 1 for ESG >50000 psi. The value of Fs for any ESG can be determined from this curve, shown in figure 9. The quadratic expression is
2
100025001
1000251
⎟⎠⎞
⎜⎝⎛×⎟
⎠⎞
⎜⎝⎛ −
+⎟⎠⎞
⎜⎝⎛×⎟
⎠⎞
⎜⎝⎛ −
+= SGSSSGSSSSS
EFEFFF (27)
where ESG is in psi.
18

0
0.2
0.4
0.6
0.8
1
1.2
1.4
0 10,000 20,000 30,000 40,000 50,000
Subgrade Modulus, psi
F S
FSS
Range
Figure 9. Calculation of Stabilization Factor Fs Including the CC2 test strip, the full-scale tests in CC2 yielded seven data points, as shown in table 4 and figure 5. In table 4, the second column (regression constant A) represents the slope of the linear SCI-vs-log(C) trend line. As shown in table 4, the type of subbase is a fairly good indicator of the slope of this line, hence the performance following the appearance of the first crack. In general, the stabilized base pavements showed the best performance (shallowest slope), the slab-on-grade pavements the worst, and the conventional base pavements were in the middle. The only exception was MRS-S, which showed performance more consistent with MRG. (It is noted that the test strip was a stabilized base pavement.) If MRS-S is discarded as an outlier, then the average slopes of the falling leg of the SCI-vs-log(C) curves, grouped by stabilized base type, are as follows: • No base (slab on grade): 247 • Conventional base: 158 • Stabilized base: 96 The ratio of stabilized base to conventional base slope is approximately 0.6, suggesting that 0.6 is a reasonable value of (stabilized base compensation factor in FAARFIELD) for the stabilized base design in CC2. Likewise, the ratio of no base to conventional base slope is approximately 1.6.
'sF
Next, consider the stabilized base test item MRS in NAPTF CC2. The section consists of 12-in. PCC (item P-501) over an existing 6-in. layer of econocrete (item P-306), over approximately 8 in. of aggregate subbase (item P-154). The average k value at the top of the medium-strength subgrade is approximately 136, so an estimate of ESG = 15,000 psi is reasonable. Based on the above
tEQ = 1.0 × 6 in. + 0.5 × 8 in. = 10 in.
19

125.01025.0 81012.1
=×=⎥⎦
⎤⎢⎣
⎡⎟⎠⎞
⎜⎝⎛ −×
ssF
571.01000
150002500
1125.01000
1500025
125.01125.02
=⎟⎠⎞
⎜⎝⎛×⎟
⎠⎞
⎜⎝⎛ −
+⎟⎠⎞
⎜⎝⎛×⎟
⎠⎞
⎜⎝⎛ −
+=SF
Since 0.571 is very close to the 0.6 value obtained from the full-scale test, the existing formula yields reasonable results for the stabilized base case. Considering the case of the slab on grade, applying the existing formula yields
tEQ = 0 in.
Fss = 1.31
15.1100015000
2500131.1
100015000
2531.1131.1
2
=⎟⎠⎞
⎜⎝⎛×⎟
⎠⎞
⎜⎝⎛ −
+⎟⎠⎞
⎜⎝⎛×⎟
⎠⎞
⎜⎝⎛ −
+=SF
Since 1.15 <1.6, an increase in the penalty for no base layer or an inadequate base layer may be justified by the test results. This could be implemented by increasing the upper limit value of Fss.
The rigid pavement failure model in FAARFIELD implements equation 19, with the stabilized base compensation factor computed using the above procedure. Although the FAARFIELD stabilized base compensation factor is taken to be numerically equal to the LEDFAA factor
, in FAARFIELD, the factor is simply a slope adjustment factor that does not cause the SCI-versus-log(C) relation to deviate from the linear.
'sF
'sF
sF 'sF
3. CALIBRATION ANALYSIS.
As stated in section 1, the purpose of the calibration analysis is to determine the value of a stress scaling factor that minimizes the average deviation of the design thicknesses produced by FAARFIELD from the equivalent thicknesses produced by the design method of AC 150/5320-6D for traffic mixes including aircraft up to and including the B747. Scaling the stresses computed by the FAARFIELD 3D-FE response model by a constant factor, Fc, is equivalent to modifying equation 19 as follows:
( )( )( )( )( )( ) ⎥
⎦
⎤⎢⎣
⎡′+−−′+−−
+×⎥⎦
⎤⎢⎣
⎡′+−−
′=
bFbdbcFbcad
CbFbd
bdFFDF
s
s
s
s
c αα
α 11
log1
(28)
Since the standard design procedure, as implemented in the AC 150/5320-6D thickness design curves, cannot accommodate more complex aircraft gears (e.g., those of the B777, A380, or A340-500/600), mixes including those gears should be excluded from the calibration. It is important to note that the calibration factor Fc in equation 28 is not a safety factor. That is, the intention of the calibration factor is to minimize overall deviations from the older standard for a
20

particular class of designs (those involving the traditional aircraft fleet), and not to provide an additional margin of conservatism. However, assuming that some conservatism is already built into the older design curves, it will necessarily be reflected in the calibrated design procedure. 3.1 AIRCRAFT TRAFFIC MIXES.
The conventional FAA thickness design procedures (described in Chapters 2 to 4 of AC 150/5320-6D) make use of the “design aircraft” concept, in which all traffic must be converted to equivalent passes of one of the component aircraft in the mix (the design aircraft). Typically, the design aircraft is the aircraft that would, by itself, require the greatest thickness. On the other hand, FAARFIELD is based on the cumulative damage factor (CDF), according to which the partial damage contributed from each aircraft in the traffic mix is summed to obtain total damage. Because of the different traffic models, and other variant assumptions, a direct comparison of slab thickness requirements for single aircraft does not necessarily give a valid comparison for mixtures of aircraft. For this reason, the calibration is based on an analysis of thickness requirements for aircraft traffic mixes. The specific traffic mixes used to perform the study were given in Ricalde, et al. [4] and are reproduced in table 5. In reference 4, eight mixes were given, which are all actual traffic mixes from U.S. airports. Three mixes (designated NLA) include 3D and other complex gears that are outside the scope of the conventional FAA thickness design curves. The remaining five mixes (designated NON) do not include NLA and are suitable for the conventional FAA design procedure. Therefore, the calibration analysis was based only on mixes 1-NON through 5-NON. However, additional comparisons were done using mixes 1-NLA through 3-NLA and are reported in section 4 of this report.
Table 5. Air Traffic Mixes for Comparative Thickness Designs
Aircraft Gross Weight
(lb) Annual Departures Mix 1-NLA
Single Wheel-30 35,000 17,850 Single Wheel-60 55,000 164,599 B727 210,000 7,965 B737-700 160,000 86,053 B737-800 173,000 17,064 B757 250,000 22,021 DC8 355,000 260 B767-200 350,000 10,433 B777-200ER* 634,500 11,102 B777-300* 750,000 996 B747-400 873,000 5,990 DC10-10 460,000 4,135
21
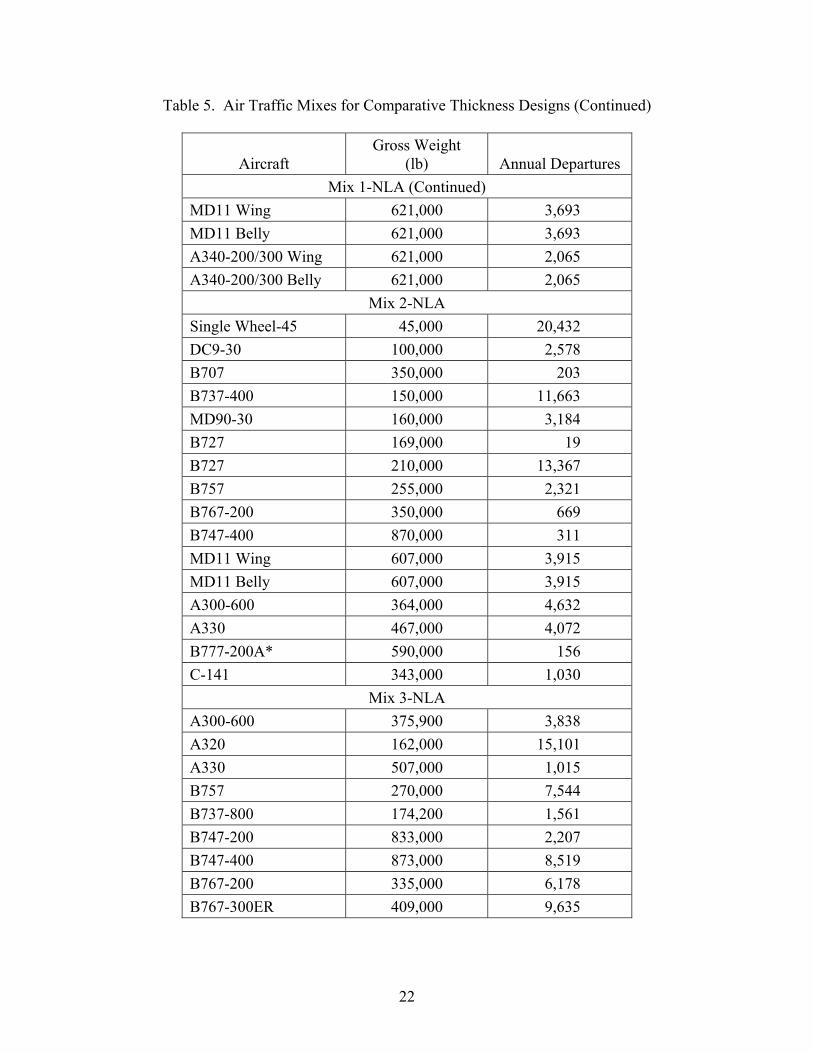
Table 5. Air Traffic Mixes for Comparative Thickness Designs (Continued)
Aircraft Gross Weight
(lb) Annual Departures Mix 1-NLA (Continued)
MD11 Wing 621,000 3,693 MD11 Belly 621,000 3,693 A340-200/300 Wing 621,000 2,065 A340-200/300 Belly 621,000 2,065
Mix 2-NLA Single Wheel-45 45,000 20,432 DC9-30 100,000 2,578 B707 350,000 203 B737-400 150,000 11,663 MD90-30 160,000 3,184 B727 169,000 19 B727 210,000 13,367 B757 255,000 2,321 B767-200 350,000 669 B747-400 870,000 311 MD11 Wing 607,000 3,915 MD11 Belly 607,000 3,915 A300-600 364,000 4,632 A330 467,000 4,072 B777-200A* 590,000 156 C-141 343,000 1,030
Mix 3-NLA A300-600 375,900 3,838 A320 162,000 15,101 A330 507,000 1,015 B757 270,000 7,544 B737-800 174,200 1,561 B747-200 833,000 2,207 B747-400 873,000 8,519 B767-200 335,000 6,178 B767-300ER 409,000 9,635
22

Table 5. Air Traffic Mixes for Comparative Thickness Designs (Continued)
Aircraft Gross Weight
(lb) Annual Departures Mix 3-NLA (Continued)
B777-200 A* 632,500 3,111 Concorde 410,000 406 Fokker F100 100,000 12,117 DC9-30 121,000 569 DC9-50 121,000 488 A340-500/600 Wing* 750,000 2,441 A340-500/600 Belly* 750,000 2,441 A380-800* 1,340,000 5,475 B747-SP 696,000 3 DC8 358,000 504 MD11 Wing 621,000 3,315 MD11 Belly 621,000 3,315
Mix 1-NON DC9-30 90,700 24 B737-200 115,000 979 DC9-50 121,000 282 B737-300 140,000 304 B727 169,000 319 B727 209,000 1,572 B757 255,000 72 DC8 276,000 10 BAe-146 70,000 51
Mix 2-NON B757 255,000 127 B767-200 315,000 237 DC9-50 135,000 855 B727 209,500 2,011 DC10-10 443,000 827 B737-100 110,000 3,726 B747-200 600,000 280 DC8 325,000 852 B707 257,000 1,730
23

Table 5. Air Traffic Mixes for Comparative Thickness Designs (Continued)
Aircraft Gross Weight
(lb) Annual Departures Mix 3-NON
B737-300 150,000 12,775 B737-400 140,000 3,650 B737-700 160,000 183 Fokker F100 100,000 1,095 A320 160,000 2,372
Mix 4-NON DC8 350,000 411 B707 312,000 91 B767-200 300,000 365 B757 220,000 639 MD-82/88 140,000 1,825 B737-200 130,000 12,365 DC9-50 121,000 2,829 B727 209,500 4,958 B737-400 150,000 23,356 B747-200 870,000 832 B757 255,500 3,427 B767-200 350,000 5,061
Mix 5-NON DC10-30 Wing 590,000 2,263 DC10-30 Belly 590,000 2,263 DC8 350,000 1,000 DC9-50 121,000 6,086 MD-82/88 160,000 13,756
*Aircraft not admissible for AC 150/5320-6D design curves
3.2 COMPARATIVE THICKNESS DESIGNS USING FAARFIELD AND R805FAA.
The procedure for calibrating the model was as follows: 1. Divide the eight traffic mixes into two groups:
a. Mixes including newer aircraft with 3D or other complex gear configurations (i.e., B777, A380, A340-500/600).
24

b. Mixes including the conventional fleet only (up to 2D gears including B747).
2. For the conventional fleet, obtain a set of design thicknesses using R805FAA and the FAARFIELD program.
3. Find a calibration factor Fc that, when applied to the FAARFIELD stresses, minimizes an objective function defined as the sum of squares of the differences between the R805FAA and FAARFIELD thicknesses.
As shown in table 5, mixes 1-NLA through 3-NLA contain aircraft types (B777, A380, or A340-500/600) not admissible in the AC 150/5320-6D design curves. Therefore, the calibration analysis was based only on five mixes: mixes 1-NON through 5-NON. The matrix of rigid pavement structures consisted of four subgrade strengths (E = 4,500, 7,500, 15,000, and 25,000 psi) and three concrete flexural strengths (R = 500, 650, and 700 psi). With the five traffic mixes, this resulted in 60 data points for analysis. In all cases, the design assumed an 8-inch crushed aggregate (Item P-209) subbase course directly over the subgrade. The use of the 8-inch-thick granular subbase causes the stabilized base compensation factor (equation 27) to take on the default value of 1.0. A similar matrix of structures was used in reference 4 as the basis of comparisons between the uncalibrated FAARFIELD (identified in that report as FEDFAA Beta) and AC 150/5320-6D thickness requirements for conventional new rigid pavements (i.e., no stabilized base). For each aircraft traffic mix, multiple sets of rigid pavement thickness designs were prepared. The first set used FAA program R805FAA [20] to obtain PCC thicknesses consistent with AC 150/5320-6D, Chapters 2 and 3. R850FAA is a spreadsheet implementation of the rigid pavement thickness design nomographs in AC 150/5320-6D, Chapter 3. Hence, its use is limited to traffic mixes containing aircraft for which design nomographs exist. Subsequent sets of designs used FAARFIELD to obtain the design thickness, but varied the factor Fc within a suitable range (1.0 - 1.2). Setting Fc = 1.0 recovers the uncalibrated failure model, equation 20, and is therefore useful as a tie back to the comparisons reported in reference 4. As shown in figure 10, setting Fc = 1.12 minimizes the sum of the squares of the differences between R805FAA and FAARFIELD for the set of structures considered. Hence, Fc = 1.12 was adopted as a reasonable value for the calibration constant in FAARFIELD. The results of the comparative pavement thickness designs used to develop figure 10 are given in appendix A.
25

y = 5869.9x2 - 13106x + 7373.3R2 = 0.9999
0
20
40
60
80
100
120
140
160
0.95 1 1.05 1.1 1.15 1.2 1.25Calibration Factor F c
Sum
of S
quar
es (O
bjec
tive
Func
tion)
Sum of Squares Poly. (Sum of Squares)
F c = 1.12 minimizes the objective function.
Figure 10. Optimal Value of Calibration Factor Fc
4. THICKNESS DESIGN COMPARISONS FOR NLA MIXES.
In section 3, the calibration factor for the FAARFIELD rigid pavement failure model was developed from thickness design comparisons using a mixture of conventional aircraft gear types, primarily D and 2D gears, but including the B747. Since the FAA rigid pavement design curves have been shown [21] to yield reliable, well-performing designs for this type of traffic, comparisons with R805FAA for the pre-B777 aircraft fleet are a reasonable basis for calibration of the FAARFIELD procedure. However, the calibration analysis in section 3 does not give any information on how FAARFIELD designs for traffic mixtures including NLA types, such as the B777 and A380 (both of which feature 3D gears), would compare with equivalent designs performed using the earlier FAA method. Because there is no standard method in AC 150/5320-6D to account for 3D or other complex gears in the pavement design charts, any such comparison necessarily involves making certain assumptions about how the Westergaard-based procedure should be extended to NLAs. FAA AC 150/5335-5A [22] recommends using the computer program COMFAA to compute Westergaard-based pavement thicknesses as part of the procedure for reporting pavement classification numbers (PCN) for airport pavements. COMFAA’s aircraft library includes all the aircraft types in FAARFIELD and also allows the user to define arbitrary gear configurations. Because of its ability to handle the complex gear configurations, COMFAA was used to develop
26

comparisons with the calibrated FAARFIELD for the traffic mixes in table 5 that include NLA traffic (mixes 1-NLA through 3-NLA). In performing these comparisons, the procedures specified in AC 150/5335-5A were used. These procedures deviate from those embedded in program R805FAA in several significant ways: • In AC 150/5320-6D (and hence, in R805FAA), all S and D aircraft, and most common
2D aircraft, are treated as generic aircraft types. By contrast, the AC 150/5335-5A method allows COMFAA to determine a PCC thickness based on the specific gear geometry. For example, in R805FAA, a B727 aircraft would be classified as a generic dual (D) with assumed wheel spacing and tire contact area, whereas COMFAA uses the specific B727 aircraft data to determine thickness.
• In AC 150/5320-6D, P/C ratios are specified for the aircraft type and are not a function of either gear spacing or tire contact area. In COMFAA, the P/C ratios are computed for each aircraft as a function of both gear geometry and tire contact area. In general, the P/C ratios using COMFAA will differ from those embedded in R805FAA for the same aircraft.
• The AC 150/5320-6D design procedure includes a provision that, for the purpose of determining the equivalent departures of the design aircraft, all “wide-body” aircraft are to be treated as 2D aircraft with a gross weight of 300,000 lb. This provision is not used in AC 150/5335-5A. Instead, the actual configuration and weight is used for all aircraft.
• In AC 150/5335-5A, the conversion factor for expressing departures of a given aircraft in terms of the design aircraft gear type is
( )NM −= 8.0Factor Conversion (29)
where M is the number of wheels on the critical aircraft main gear, and N is the number of wheels on the main gear to be converted. For conversions among S, D, 2D, and 2D/2D2 gears, equation 29 agrees approximately with the conversion factors given in paragraph 305(a) of AC 150/5320-6D. However, the use of equation 29 allows extension of the procedure to 3D and higher gears.
In most cases, the above deviations do not greatly affect the final thickness by the Westergaard-based procedure. However, in certain cases there can be a significant difference, especially where shifting from generic to specific gear characteristics causes a change in the assumed design aircraft. To highlight the effect of the NLA gears, two separate comparisons were performed for each traffic mix. For the first comparison, the full traffic mix, including NLAs, was used, while for the second comparison, the NLAs were removed from the traffic mix. In both comparisons, the design thicknesses computed by FAARFIELD (applying the 1.12 calibration factor to computed stresses) are compared to the equivalent thicknesses obtained using the method of AC 150/5335-5A and COMFAA. In the second comparison only, the FAARFIELD thicknesses are also compared to those obtained using R805FAA. As an additional comparison, the
27

corresponding thicknesses using the LEDFAA 1.3 rigid design procedure were also computed. For R = 500 psi, LEDFAA 1.3 solutions are not shown, since R = 600 psi is the lower allowable limit in LEDFAA 1.3. Figures 11 through 13 show the comparisons among FAARFIELD, LEDFAA 1.3, and the AC 150/5335-5A method using COMFAA for mixes 1-NLA, 2-NLA, and 3-NLA, respectively (full mixes). The comparative thickness data for full mixes are reported in appendix B. Figures 14 through 16 show the comparisons among FAARFIELD, LEDFAA 1.3, COMFAA, and R805FAA for the same mixes with NLA aircraft removed. The NLA aircraft are indicated with an asterisk (*) in table 5. The comparative thickness data for the aircraft mixes with NLAs removed are reported in appendix C.
0
5
10
15
20
25
30
P30
1
P30
4
P30
6
P30
1
P30
4
P30
6
P30
1
P30
4
P30
6
P30
1
P30
4
P30
6
P30
1
P30
4
P30
6
P30
1
P30
4
P30
6
P30
1
P30
4
P30
6
P30
1
P30
4
P30
6
P30
1
P30
4
P30
6
E = 7.5 ksi E = 15 ksi E = 25 ksi E = 7.5 ksi E = 15 ksi E = 25 ksi E = 7.5 ksi E = 15 ksi E = 25 ksi
R = 500 psi R = 650 psi R = 700 psi
PC
C T
hick
ness
, in.
FAARFIELD 1.2 COMFAA LEDFAA 1.3
Figure 11. PCC Thickness Design Comparison for Traffic Mix 1-NLA—All Traffic
28

0
5
10
15
20
25
P30
1
P30
4
P30
6
P30
1
P30
4
P30
6
P30
1
P30
4
P30
6
P30
1
P30
4
P30
6
P30
1
P30
4
P30
6
P30
1
P30
4
P30
6
P30
1
P30
4
P30
6
P30
1
P30
4
P30
6
P30
1
P30
4
P30
6
E = 7.5 ksi E = 15 ksi E = 25 ksi E = 7.5 ksi E = 15 ksi E = 25 ksi E = 7.5 ksi E = 15 ksi E = 25 ksi
R = 500 psi R = 650 psi R = 700 psi
PC
C T
hick
ness
, in.
FAARFIELD 1.2 COMFAA LEDFAA 1.3
Figure 12. PCC Thickness Design Comparison for Traffic Mix 2-NLA—All Traffic
0
5
10
15
20
25
30
P30
1
P30
4
P30
6
P30
1
P30
4
P30
6
P30
1
P30
4
P30
6
P30
1
P30
4
P30
6
P30
1
P30
4
P30
6
P30
1
P30
4
P30
6
P30
1
P30
4
P30
6
P30
1
P30
4
P30
6
P30
1
P30
4
P30
6
E = 7.5 ksi E = 15 ksi E = 25 ksi E = 7.5 ksi E = 15 ksi E = 25 ksi E = 7.5 ksi E = 15 ksi E = 25 ksi
R = 500 psi R = 650 psi R = 700 psi
PC
C T
hick
ness
, in.
FAARFIELD 1.2 COMFAA LEDFAA 1.3
Figure 13. PCC Thickness Design Comparison for Traffic Mix 3-NLA—All Traffic
29

0
5
10
15
20
25
30
P301
P304
P306
P301
P304
P306
P301
P304
P306
P301
P304
P306
P301
P304
P306
P301
P304
P306
P301
P304
P306
P301
P304
P306
P301
P304
P306
E = 7.5 ksi E = 15 ksi E = 25 ksi E = 7.5 ksi E = 15 ksi E = 25 ksi E = 7.5 ksi E = 15 ksi E = 25 ksi
R = 500 psi R = 650 psi R = 700 psi
PC
C T
hick
ness
, in.
FAARFIELD 1.2 R805FAA COMFAA 2.0 LEDFAA 1.3
Figure 14. PCC Thickness Design Comparison for Traffic Mix 1-NLA—NLA Traffic Removed
0
5
10
15
20
25
P301
P304
P306
P301
P304
P306
P301
P304
P306
P301
P304
P306
P301
P304
P306
P301
P304
P306
P301
P304
P306
P301
P304
P306
P301
P304
P306
E = 7.5 ksi E = 15 ksi E = 25 ksi E = 7.5 ksi E = 15 ksi E = 25 ksi E = 7.5 ksi E = 15 ksi E = 25 ksi
R = 500 psi R = 650 psi R = 700 psi
PC
C T
hick
ness
, in.
FAARFIELD 1.2 R805FAA COMFAA LEDFAA 1.3
Figure 15. PCC Thickness Design Comparison for Traffic Mix 2-NLA—NLA Traffic Removed
30

0
5
10
15
20
25
30
P301
P304
P306
P301
P304
P306
P301
P304
P306
P301
P304
P306
P301
P304
P306
P301
P304
P306
P301
P304
P306
P301
P304
P306
P301
P304
P306
E = 7.5 ksi E = 15 ksi E = 25 ksi E = 7.5 ksi E = 15 ksi E = 25 ksi E = 7.5 ksi E = 15 ksi E = 25 ksi
R = 500 psi R = 650 psi R = 700 psi
PC
C T
hick
ness
, in.
FAARFIELD 1.2 R805FAA COMFAA LEDFAA 1.3
Figure 16. PCC Thickness Design Comparison for Traffic Mix 3-NLA—NLA Traffic Removed The matrix of rigid pavement structures used for this portion of the analysis consisted of three subgrade strengths (E = 7,500, 15,000, and 25,000 psi), three concrete flexural strengths (R = 500, 650, and 700 psi), and three different stabilized base layers (6-in. Soil Cement Base, Item P-301; 6-in. Cement Treated Base, Item P-304; and 6-in. Econocrete Base, Item P-306). With the three traffic mixes, this resulted in 81 data points for analysis. Statistical analysis of the data behind figures 11 through 16 yields the following information: • For all 81 designs involving the full traffic mixes (including NLAs), the mean difference
between the COMFAA thickness and the FAARFIELD thickness was -0.08 inch (i.e., FAARFIELD was thicker than COMFAA for these designs by an average of 0.08 inch. Clearly, the average difference was negligible. The standard deviation of this sample was 0.64 inch.
• For all 81 designs involving the reduced aircraft mixes (with NLAs removed), the mean difference between the R805FAA thickness and the FAARFIELD thickness was 0.31 inch, meaning that, in these cases, the thickness required by the FAA design charts was, on the average, 0.31 inch greater than the corresponding FAARFIELD thickness requirement. The standard deviation of this sample was 0.80 inch.
The comparisons in figures 11 through 16 do not fully account for the sensitivity of the COMFAA method to the selection of the design aircraft, which can cause significant jumps in the design thickness as computed by the older method. As an illustration of this phenomenon, consider the traffic mix 1-NLA. Table 6 shows the analysis of mix 1-NLA leading to the selection of the B737-700 aircraft as the design aircraft. In this case, it was assumed that the
31

R-value of the PCC was 650 psi, and that the k-value at the top of the stabilized base was 187. This value corresponds to the design case with E = 7500 psi for the subgrade (ksubgrade = 82.4 pci) and a 6-inch-thick stabilized base, using the k adjustment curves embedded in the R805FAA program.
Table 6. Determination of Design Aircraft for Mix 1-NLA
No. Aircraft
Gross Weight
(lb) Annual
Departures P/C
(COMFAA)
PCC Thickness
(COMFAA) (in.)
1 Single Wheel-30 35,000 17,850 6.25 8.02 2 Single Wheel-60 55,000 164,599 5.24 11.41 3 B727 210,000 7,965 2.92 17.93 4 B737-700* 160,000 86,053 3.75 18.07 5 B737-800 173,000 17,064 3.53 17.21 6 B757 250,000 22,021 3.87 14.05 7 DC-8 355,000 260 3.35 13.90 8 B767-200 350,000 10,433 3.96 15.12 9 B747-400 873,000 5,990 3.46 16.85
10 DC-10-10 460,000 4,135 3.70 15.55 11 MD11 Wing 621,000 3,693 3.67 16.78 12 MD11 Belly 621,000 3,693 3.01 17.46 13 B777-200 ER 634,500 11,102 4.04 15.77 14 B777-300 750,000 996 4.13 15.97 15 A340-200/300 Wing 621,000 2,065 1.89 16.06 16 A340-200/300 Belly 621,000 2,065 3.07 16.86
*Design aircraft
From table 6, it is clear that COMFAA requires the greatest thickness for the B737-700. Therefore, following the procedure of AC 150/5320-6D, the B737 would normally be taken as the design aircraft for this mix. However, it can also be observed from table 6 that the required thickness for the B727 is nearly equal to that for the B737, and only a small change in either gross weight or annual departures would shift the design aircraft to the B727. Figure 17 illustrates the effect on the final thickness design if the required thicknesses for mix 3 are computed for equivalent departures of the B727 instead of the B737. As shown in figure 17, just this one change—reassigning the design aircraft from B737 to B727—adds up to 1.3 inches of additional PCC thickness in the COMFAA-based procedure. It should be noted that a similarly large effect would not be observed using the R805FAA program, since both aircraft (B727 and B737) would be treated as generic dual gears using the design nomographs (with the same P/C ratio based on AC 150/5320-6D).
32

0
5
10
15
20
25
30
P30
1
P30
4
P30
6
P30
1
P30
4
P30
6
P30
1
P30
4
P30
6
P30
1
P30
4
P30
6
P30
1
P30
4
P30
6
P30
1
P30
4
P30
6
P30
1
P30
4
P30
6
P30
1
P30
4
P30
6
P30
1
P30
4
P30
6
E = 7.5 ksi E = 15 ksi E = 25 ksi E = 7.5 ksi E = 15 ksi E = 25 ksi E = 7.5 ksi E = 15 ksi E = 25 ksi
R = 500 psi R = 650 psi R = 700 psi
PC
C T
hick
ness
, in.
COMFAA (B737 as design aircraft) COMFAA (B727 as design aircraft) FAARFIELD
Figure 17. Effect of Design Aircraft Selection on PCC Thickness Design Comparisons
(Traffic Mix 3-NLA) If the mix 3 design comparison is re-analyzed using the B727 as the design aircraft in the COMFAA-based procedure, it is found that, for these 27 designs, the mean value of the difference between COMFAA and FAARFIELD thicknesses is +0.82 inch, compared with -0.24 inch when the B737 is taken as the design aircraft (i.e., the mean of the COMFAA-based designs is 0.82 inches thicker than the mean of the FAARFIELD designs). 5. OVERLAY DESIGN COMPARISONS FOR NLA MIXES.
Chapter 4 of AC 150/5320-6D describes the previous FAA design procedures for designing overlays on existing rigid pavements based on thickness deficiency. In this method, the required thickness of new PCC is first determined using the methods of Chapter 3. For hot-mix asphalt (HMA) overlays, the HMA overlay thickness t is given by the thickness deficiency formula ( )ebd hCFht −= 5.2 (30) where hd is the thickness that would be required for a new PCC slab on the existing foundation, he is the thickness of the existing PCC slab, and Cb is an empirical condition factor for the existing (base) PCC (with values in the range 0.75 to 1.0). The F factor is an empirical factor
33

related to the amount of cracking expected to occur in the base PCC. For unbonded PCC overlays on rigid pavements (the condition where a bond breaking or leveling course is used), the PCC overlay thickness hc is given by the formula 4.1 4.14.1
erdc hChh −= (31) where hd and he are as defined above, and Cr is a different empirical condition factor for the base PCC (with values in the range 0.35 to 1.0). In contrast, the design procedure in FAARFIELD makes use of the SCI concept discussed in section 2.1 and does not entail computation of a fictitious thickness of new PCC. For HMA on rigid overlays, the program assumes that the base PCC has some level of initial damage, and under future traffic, the overlayed PCC will undergo further deterioration. Failure of the overlay structure occurs when the SCI of the base PCC reaches its predefined terminal value (SCI 40 in the case of structures with granular bases; SCI 57 otherwise). In a change from the LEDFAA model, FAARFIELD does not explicitly consider reflection cracks in computing the life of HMA on rigid overlays. For PCC on rigid overlays, both the base PCC and the overlay slab are assumed to deteriorate with traffic, but at different rates. There is no preset terminal SCI for the base PCC; failure occurs when the overlay PCC reaches an SCI value of 80. Both HMA on rigid and PCC on rigid overlays use the failure model in equation 28 to express the three-way relationship among SCI, design factors, and coverages. For both HMA on rigid and PCC on rigid overlay designs, it is necessary to input the SCI value corresponding to the initial condition of the base PCC. Where the rigid pavement being overlayed has no visible structural distress (i.e., the initial SCI is equal to 100), the amount of structural life consumed by previously applied traffic must still be estimated using the “Life” function and the estimated CDF used entered in the “Percent CDF Used” (%CDFU) field. Guidance on assigning the %CDFU value may be found in the FAARFIELD help file. SCI is believed to be a more objective and reproducible index than the previously used condition factors. Since the Cb and Cr factors on one hand, and SCI on the other, are based on different assessment criteria and have different levels of precision, there is no uniform correspondence between them. However, the FAA has adopted the following guidance on the approximate conversion of Cr and Cb numbers to equivalent SCI values (from the FAARFIELD user manual). For HMA overlays on rigid pavements ( )175.025100 ≤≤−= bb CCSCI (32)
34

For PCC overlays on rigid pavements rCSCI ×+= 2.931.7 (33) These approximate formulas are only intended to be used in design practice where PCC condition data are available in the form of a condition factor, but not an SCI value. However, they have been used in this study to obtain reasonably equivalent initial conditions for the overlay design comparisons that follow. 5.1 HOT-MIX ASPHALT ON RIGID OVERLAYS.
A comparison of HMA on rigid overlay designs was performed based on the typical structures given in table 7. Comparisons among FAARFIELD 1.2, LEDFAA 1.3, and the previous FAA method described in Chapter 4 of AC 150/5320-6D were performed for the three NLA mixes in table 5. Equation 32 was used to establish the equivalency between the assumed condition factor and the input SCI for FAARFIELD and LEDFAA.
Table 7. Structures for HMA on Rigid Overlay Design Comparison
Layer FAARFIELD
Material Description E or R Thickness
(in.) HMA overlay P-401/P-403 HMA overlay Fixed E (200,000 psi) (Design layer) Existing PCC PCC Surface R = 700 psi Varies Base course Variable st (rigid) E = 250,000 psi 6 Subbase course P-209 CrAg Internally computed 8 Subgrade Subgrade E varies Infinite
Similar to the new rigid pavement analysis, the four values used for the subgrade modulus were E = 4,500, 7,500, 15,000, and 25,000 psi. Seven values were used for the existing PCC thickness: t = 6, 8, 10, 12, 14, 16, and 18 in. Combined with the three NLA mixes, this resulted in 84 points of comparison. The comparative thickness data are reported in appendix D. For thickness deficiency (previous FAA) designs, the existing PCC was assumed to have a condition factor of Cb = 0.92, corresponding to SCI = 67. The value of F in equation 30 was taken as 1.0. Figures 18 through 20 compare the HMA overlay thickness requirements from FAARFIELD 1.2 with the thickness deficiency requirements based on equation 30. Since the three NLA mixes contain newer aircraft types with gear configurations exceeding 2D, the “new PCC” thickness hd in equation 30 could not be determined using the available design curves in AC 150/5320-6D. Instead, the computer program COMFAA 2.0 was used in pavement design mode to determine the design aircraft and hd following the procedures in AC 150/5335-5A. The required overlay thickness was then determined from equation 30. Table 8 summarizes the COMFAA design aircraft data for the three NLA mixes.
35

Table 8. Design Aircraft Data for COMFAA HMA Overlay Designs
Mix Design Aircraft
Gross Weight (lb) Equivalent Annual Departures
1-NLA B737 160,000 524,425 2-NLA B727 210,000 50,953 3-NLA MD11 Belly 621,000 126,714
0
5
10
15
20
25
30
35
6 8 10 12 14 16 18Existing PCC Thickness, in.
HM
A O
verla
y Th
ickn
ess,
in
FAARFIELD 1.2 (E = 4500 psi) FAARFIELD 1.2 (E = 7500 psi)FAARFIELD 1.2 (E = 15000 psi) FAARFIELD 1.2 (E = 25000 psi)COMFAA (E = 4500 psi) COMFAA (E = 7500 psi)COMFAA (E = 15000 psi) COMFAA (E = 25000 psi)
Figure 18. HMA on Rigid Overlay Thickness Comparison for Traffic Mix 1-NLA (FAARFIELD 1.2 vs COMFAA Thickness Deficiency Method)
36

0
5
10
15
20
25
30
35
6 8 10 12 14 16 18Existing PCC Thickness, in
HM
A O
verla
y Th
ickn
ess,
in
FAARFIELD 1.2 (E = 4500 psi) FAARFIELD 1.2 (E = 7500 psi)FAARFIELD 1.2 (E = 15000 psi) FAARFIELD 1.2 (E = 25000 psi)COMFAA (E = 4500 psi) COMFAA (E = 7500 psi)COMFAA (E = 15000 psi) COMFAA (E = 25000 psi)
Figure 19. HMA on Rigid Overlay Thickness Comparison for Traffic Mix 2-NLA (FAARFIELD 1.2 vs COMFAA Thickness Deficiency Method)
05
10152025303540
6 8 10 12 14 16 18
Existing PCC Thickness, in.
HM
A O
verla
y Th
ickn
ess,
in.
FAARFIELD 1.2 (E = 4500 psi) FAARFIELD 1.2 (E = 7500 psi)FAARFIELD 1.2 (E = 15000 psi) FAARFIELD 1.2 (E = 25000 psi)COMFAA (E = 4500 psi) COMFAA (E = 7500 psi)COMFAA (E = 15000 psi) COMFAA (E = 25000 psi)
Figure 20. HMA on Rigid Overlay Thickness Comparison for Traffic Mix 3-NLA (FAARFIELD 1.2 vs COMFAA Thickness Deficiency Method)
37

The following observations pertain to the comparisons in figures 18 through 20: • Within the range of values considered, there is good overall agreement between
FAARFIELD 1.2 overlay designs and the overlay thickness that would be required by applying the thickness deficiency approach using COMFAA to determine PCC thickness.
• The sensitivity of the two methods to the existing PCC thickness is about the same.
• The FAARFIELD 1.2 method is significantly more sensitive to the subgrade E-value than the COMFAA method.
• Some overlay designs were unable to be completed using FAARFIELD 1.2 due to a lack of convergence. These structures were all characterized by high levels of traffic on a low California Bearing Ratio subgrade combined with a relatively thin existing PCC surface layer. For these conditions, ignoring the PCC slab action and designing the structure as a new flexible pavement on a high-quality base usually will result in a lower HMA thickness, so the failure of the HMA on rigid overlay design procedure to converge in these particular cases is not of great practical concern. However, the program should be modified to improve the handling of these cases.
• For the cases considered, the mean value of the difference between the FAARFIELD 1.2 and COMFAA overlay thickness requirements was -1.03 inches, with a standard deviation of 2.95 inches (i.e., for these designs, FAARFIELD was thinner than the COMFAA procedure by an average of 1.03 in.). For individual designs, FAARFIELD was as much as 8.9 inches thinner, or 3.7 inches thicker, than equivalent thickness deficiency designs using COMFAA.
The greater sensitivity of FAARFIELD to the subgrade modulus is illustrated in figure 21, which plots HMA overlay design thickness against existing PCC thickness for both methods, for all three traffic mixes combined. For each method, the trendline shows the quadratic regression of the data, irrespective of subgrade modulus. Since the variation in the required HMA thickness at each point is due to the effect of the subgrade modulus, the coefficient of variation (R2) value is a measurement of the sensitivity to this variable. As shown in figure 21, the R2 value for FAARFIELD is 0.82, compared to 0.97 for COMFAA, reflecting the greater effect of subgrade E on the FAARFIELD design. Figure 21 also shows that the FAARFIELD design thickness is a less strongly linear function of existing PCC thickness than the COMFAA thickness deficiency method. Figures 22 through 24 compare the FAARFIELD HMA overlay thickness with the corresponding thickness using LEDFAA 1.3. The main point to note in these comparisons is that in LEDFAA, the HMA overlay thickness is limited to 20 inches. This is due to the LEDFAA failure model, which includes in the structural life the time required for a reflection crack to propagate through the thickness of the HMA overlay and assumes that such a crack propagates at a rate of 1 inch per year. For a design life of 20 years, this results in the artificial 20-inch limitation. The reflection crack criterion was removed in FAARFIELD. While this change may produce HMA overlay thicknesses that are greater than corresponding LEDFAA thicknesses in
38
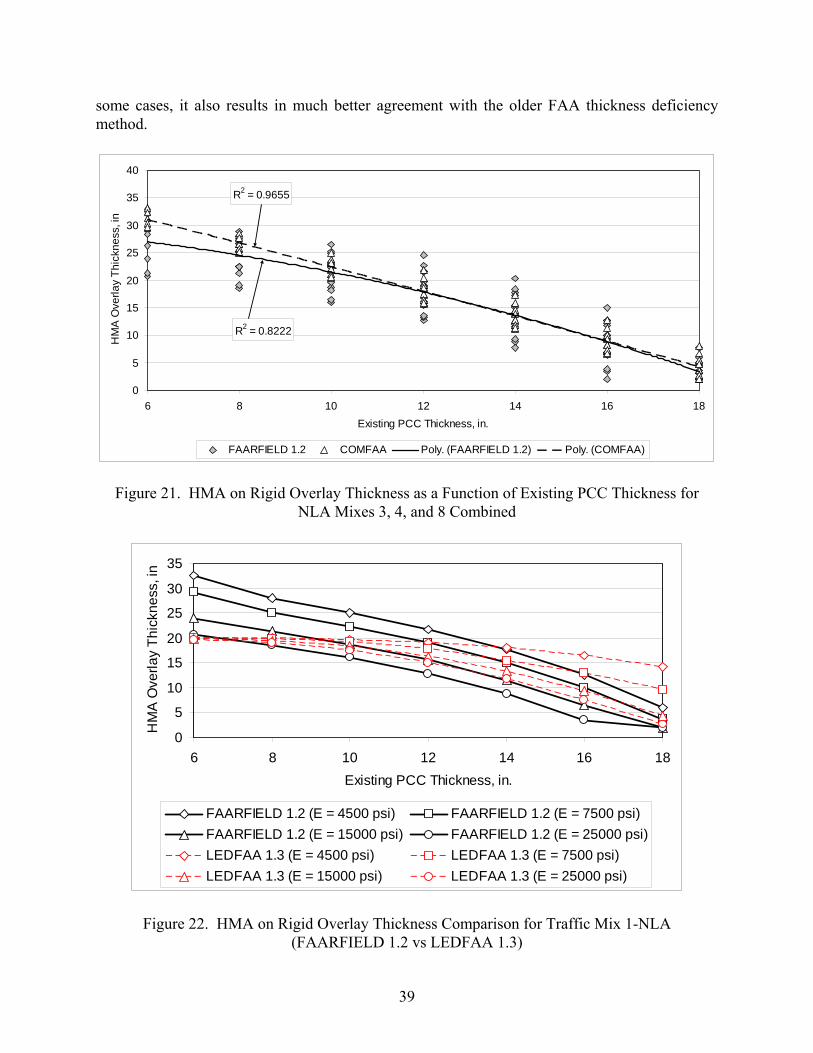
some cases, it also results in much better agreement with the older FAA thickness deficiency method.
R2 = 0.8222
R2 = 0.9655
0
5
10
15
20
25
30
35
40
6 8 10 12 14 16 18Existing PCC Thickness, in.
HM
A O
verla
y Th
ickn
ess,
in
FAARFIELD 1.2 COMFAA Poly. (FAARFIELD 1.2) Poly. (COMFAA)
Figure 21. HMA on Rigid Overlay Thickness as a Function of Existing PCC Thickness for
NLA Mixes 3, 4, and 8 Combined
0
5
10
15
20
25
30
35
6 8 10 12 14 16 18Existing PCC Thickness, in.
HM
A O
verla
y Th
ickn
ess,
in
FAARFIELD 1.2 (E = 4500 psi) FAARFIELD 1.2 (E = 7500 psi)FAARFIELD 1.2 (E = 15000 psi) FAARFIELD 1.2 (E = 25000 psi)LEDFAA 1.3 (E = 4500 psi) LEDFAA 1.3 (E = 7500 psi)LEDFAA 1.3 (E = 15000 psi) LEDFAA 1.3 (E = 25000 psi)
Figure 22. HMA on Rigid Overlay Thickness Comparison for Traffic Mix 1-NLA (FAARFIELD 1.2 vs LEDFAA 1.3)
39

0
5
10
15
20
25
30
35
6 8 10 12 14 16 18Existing PCC Thickness, in.
HM
A O
verla
y Th
ickn
ess,
in
FAARFIELD 1.2 (E = 4500 psi) FAARFIELD 1.2 (E = 7500 psi)FAARFIELD 1.2 (E = 15000 psi) FAARFIELD 1.2 (E = 25000 psi)LEDFAA 1.3 (E = 4500 psi) LEDFAA 1.3 (E = 7500 psi)LEDFAA 1.3 (E = 15000 psi) LEDFAA 1.3 (E = 25000 psi)
Figure 23. HMA on Rigid Overlay Thickness Comparison for Traffic Mix 2-NLA (FAARFIELD 1.2 vs LEDFAA 1.3)
0
5
10
15
20
25
30
35
6 8 10 12 14 16 18Existing PCC Thickness, in.
HM
A O
verla
y Th
ickn
ess,
in
FAARFIELD 1.2 (E = 4500 psi) FAARFIELD 1.2 (E = 7500 psi)FAARFIELD 1.2 (E = 15000 psi) FAARFIELD 1.2 (E = 25000 psi)LEDFAA 1.3 (E = 4500 psi) LEDFAA 1.3 (E = 7500 psi)LEDFAA 1.3 (E = 15000 psi) LEDFAA 1.3 (E = 25000 psi)
Figure 24. HMA on Rigid Overlay Thickness Comparison for Traffic Mix 3-NLA (FAARFIELD 1.2 vs LEDFAA 1.3)
40
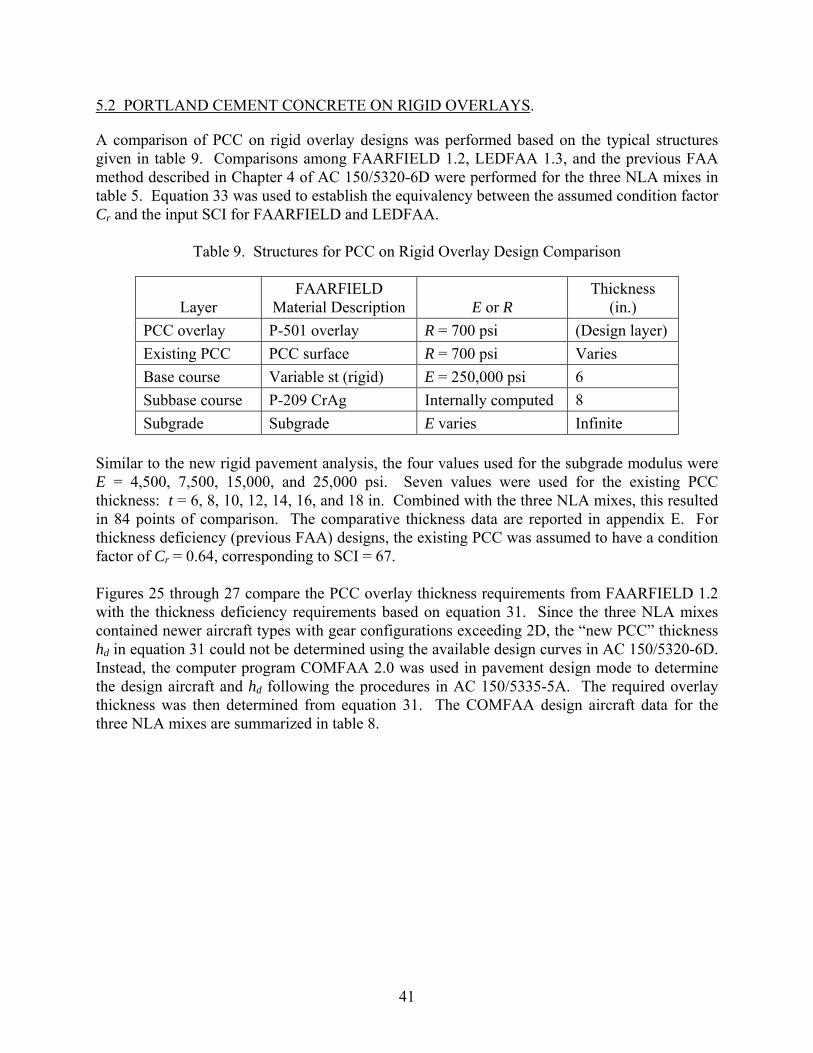
5.2 PORTLAND CEMENT CONCRETE ON RIGID OVERLAYS.
A comparison of PCC on rigid overlay designs was performed based on the typical structures given in table 9. Comparisons among FAARFIELD 1.2, LEDFAA 1.3, and the previous FAA method described in Chapter 4 of AC 150/5320-6D were performed for the three NLA mixes in table 5. Equation 33 was used to establish the equivalency between the assumed condition factor Cr and the input SCI for FAARFIELD and LEDFAA.
Table 9. Structures for PCC on Rigid Overlay Design Comparison
Layer FAARFIELD
Material Description E or R Thickness
(in.) PCC overlay P-501 overlay R = 700 psi (Design layer) Existing PCC PCC surface R = 700 psi Varies Base course Variable st (rigid) E = 250,000 psi 6 Subbase course P-209 CrAg Internally computed 8 Subgrade Subgrade E varies Infinite
Similar to the new rigid pavement analysis, the four values used for the subgrade modulus were E = 4,500, 7,500, 15,000, and 25,000 psi. Seven values were used for the existing PCC thickness: t = 6, 8, 10, 12, 14, 16, and 18 in. Combined with the three NLA mixes, this resulted in 84 points of comparison. The comparative thickness data are reported in appendix E. For thickness deficiency (previous FAA) designs, the existing PCC was assumed to have a condition factor of Cr = 0.64, corresponding to SCI = 67. Figures 25 through 27 compare the PCC overlay thickness requirements from FAARFIELD 1.2 with the thickness deficiency requirements based on equation 31. Since the three NLA mixes contained newer aircraft types with gear configurations exceeding 2D, the “new PCC” thickness hd in equation 31 could not be determined using the available design curves in AC 150/5320-6D. Instead, the computer program COMFAA 2.0 was used in pavement design mode to determine the design aircraft and hd following the procedures in AC 150/5335-5A. The required overlay thickness was then determined from equation 31. The COMFAA design aircraft data for the three NLA mixes are summarized in table 8.
41

0
5
10
15
20
25
6 8 10 12 14 16 18Existing PCC Thickness, in.
PC
C O
verla
y Th
ickn
ess,
in
FAARFIELD 1.2 (E = 4500 psi) FAARFIELD 1.2 (E = 7500 psi)FAARFIELD 1.2 (E = 15000 psi) FAARFIELD 1.2 (E = 25000 psi)COMFAA (E = 4500 psi) COMFAA (E = 7500 psi)COMFAA (E = 15000 psi) COMFAA (E = 25000 psi)
Figure 25. PCC on Rigid Overlay Thickness Comparison for Traffic Mix 1-NLA (FAARFIELD 1.2 vs COMFAA Thickness Deficiency Method)
0
5
10
15
20
25
6 8 10 12 14 16 18
Existing PCC Thickness, in.
PC
C O
verla
y Th
ickn
ess,
in.
FAARFIELD 1.1 (E = 4500 psi) FAARFIELD 1.1 (E = 7500 psi)FAARFIELD 1.1 (E = 15000 psi) FAARFIELD 1.1 (E = 25000 psi)COMFAA (E = 4500 psi) COMFAA (E = 7500 psi)COMFAA (E = 15000 psi) COMFAA (E = 25000 psi)
Figure 26. PCC on Rigid Overlay Thickness Comparison for Traffic Mix 2-NLA (FAARFIELD 1.2 vs COMFAA Thickness Deficiency Method)
42

0
5
10
15
20
25
6 8 10 12 14 16 18
Existing PCC Thickness, in.
PC
C O
verla
y Th
ickn
ess,
in.
FAARFIELD 1.1 (E = 4500 psi) FAARFIELD 1.1 (E = 7500 psi)FAARFIELD 1.1 (E = 15000 psi) FAARFIELD 1.1 (E = 25000 psi)COMFAA (E = 4500 psi) COMFAA (E = 7500 psi)COMFAA (E = 15000 psi) COMFAA (E = 25000 psi)
Figure 27. PCC on Rigid Overlay Thickness Comparison for Traffic Mix 3-NLA (FAARFIELD 1.2 vs COMFAA Thickness Deficiency Method)
The thickness deficiency equation 31 ensures that for the previous FAA method of overlay design, the thickness of a new PCC pavement on the existing foundation (disregarding the existing PCC) is an upper limit on the required PCC overlay thickness. This fact is illustrated in figure 28, which compares the new PCC thickness for mix 1-NLA to the PCC overlay requirement for various thicknesses of existing PCC. For the FAARFIELD design method, which does not explicitly compute a required “new PCC” thickness for the foundation, it is necessary to verify that the new PCC thickness that would be required does in fact exceed the PCC overlay requirement, even for relatively thin existing slabs. This has been done for 1-NLA and the results are shown in figure 29. Figure 29 shows that • the “new PCC” thickness computed using FAARFIELD, assuming that the new PCC slab
is supported directly on the stabilized base layer, is an upper envelope for the computed PCC overlay thickness.
• the FAARFIELD overlay thickness design is markedly more sensitive to the foundation modulus than the older FAA method for both new and overlay designs.
Similar results were obtained for the other two NLA traffic mixes (mixes 2-NLA and 3-NLA).
43
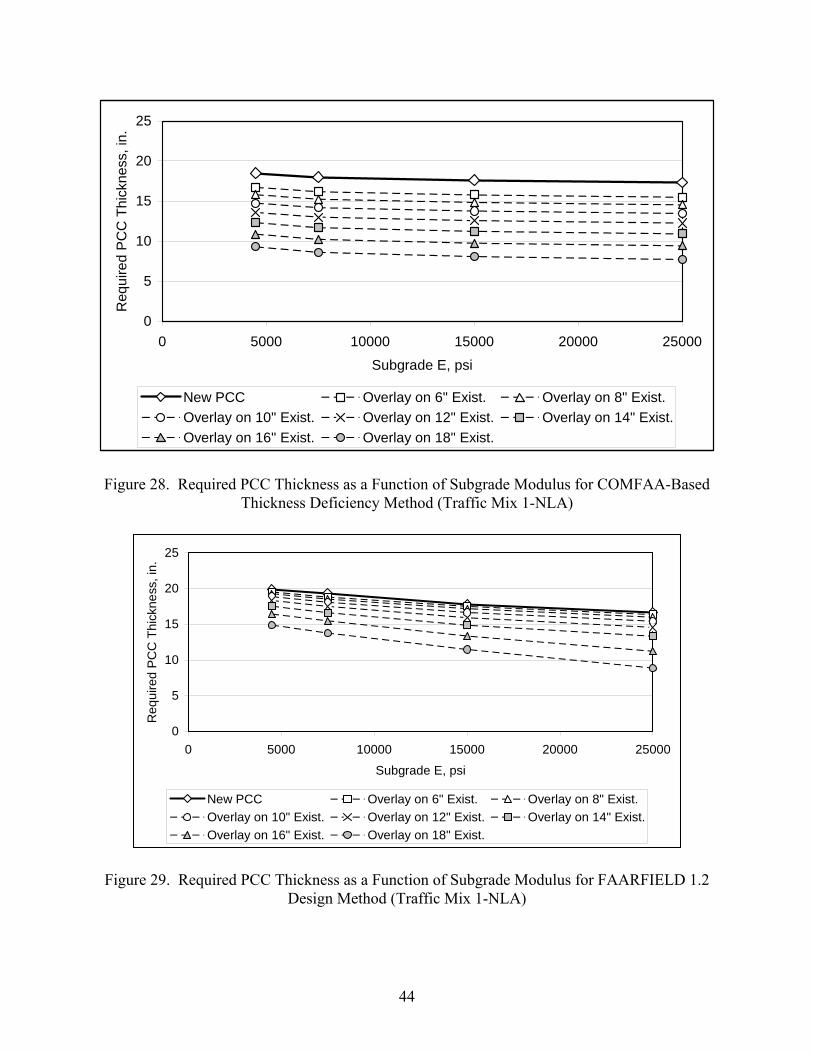
0
5
10
15
20
25
0 5000 10000 15000 20000 25000
Subgrade E, psi
Req
uire
d P
CC
Thi
ckne
ss, i
n.
New PCC Overlay on 6" Exist. Overlay on 8" Exist.Overlay on 10" Exist. Overlay on 12" Exist. Overlay on 14" Exist.Overlay on 16" Exist. Overlay on 18" Exist.
Figure 28. Required PCC Thickness as a Function of Subgrade Modulus for COMFAA-Based Thickness Deficiency Method (Traffic Mix 1-NLA)
0
5
10
15
20
25
0 5000 10000 15000 20000 25000
Subgrade E, psi
Req
uire
d P
CC
Thi
ckne
ss, i
n.
New PCC Overlay on 6" Exist. Overlay on 8" Exist.Overlay on 10" Exist. Overlay on 12" Exist. Overlay on 14" Exist.Overlay on 16" Exist. Overlay on 18" Exist.
Figure 29. Required PCC Thickness as a Function of Subgrade Modulus for FAARFIELD 1.2 Design Method (Traffic Mix 1-NLA)
44

Figures 30 through 32 compare the FAARFIELD PCC overlay thickness with the corresponding thickness using LEDFAA 1.3. These comparisons show good agreement overall between LEDFAA 1.3 and FAARFIELD 1.2 for PCC on rigid overlays.
0
5
10
15
20
25
6 8 10 12 14 16 18
Existing PCC Thickness, in.
PC
C O
verla
y Th
ickn
ess,
in.
LEDFAA 1.3 (E = 4500 psi) LEDFAA 1.3 (E = 7500 psi)LEDFAA 1.3 (E = 25000 psi) LEDFAA 1.3 (E = 15000 psi)FAARFIELD 1.2 (E = 4500 psi) FAARFIELD 1.2 (E = 7500 psi)FAARFIELD 1.2 (E = 15000 psi) FAARFIELD 1.2 (E = 25000 psi)
Figure 30. PCC on Rigid Overlay Thickness Comparison for Traffic Mix 1-NLA (FAARFIELD 1.2 vs LEDFAA 1.3)
0
5
10
15
20
25
6 8 10 12 14 16 18
Existing PCC Thickness, in.
PC
C O
verla
y Th
ickn
ess,
in.
LEDFAA 1.3 (E = 4500 psi) LEDFAA 1.3 (E = 7500 psi)LEDFAA 1.3 (E = 15000 psi) LEDFAA 1.3 (E = 25000 psi)FAARFIELD 1.1 (E = 4500 psi) FAARFIELD 1.1 (E = 7500 psi)FAARFIELD 1.1 (E = 15000 psi) FAARFIELD 1.1 (E = 25000 psi)
Figure 31. PCC on Rigid Overlay Thickness Comparison for Traffic Mix 2-NLA (FAARFIELD 1.2 vs LEDFAA 1.3)
45

0
5
10
15
20
25
6 8 10 12 14 16 18
Existing PCC Thickness, in.
PC
C O
verla
y Th
ickn
ess,
in.
LEDFAA 1.3 (E = 4500 psi) LEDFAA 1.3 (E = 7500 psi)LEDFAA 1.3 (E = 15000 psi) LEDFAA 1.3 (E = 25000 psi)FAARFIELD 1.1 (E = 4500 psi) FAARFIELD 1.1 (E = 7500 psi)FAARFIELD 1.1 (E = 15000 psi) FAARFIELD 1.1 (E = 25000 psi)
Figure 32. PCC on Rigid Overlay Thickness Comparison for Traffic Mix 3-NLA (FAARFIELD 1.2 vs LEDFAA 1.3)
6. CONCLUSIONS.
The Federal Aviation Administration (FAA) airport pavement thickness design program FAA Rigid and Flexible Iterative Elastic Layer Design (FAARFIELD) contains a new rigid pavement design procedure. The FAARFIELD procedure departs from the design procedure in Layered Elastic Design Federal Aviation Administration (LEDFAA) 1.3 in the use of three-dimensional finite element (3D-FE) structural analysis, rather than layered elastic analysis, to develop final design stresses for rigid pavements. In addition, a new rigid failure model has been implemented. The FAARFIELD design procedure has been calibrated to the earlier FAA design procedure represented by the design nomographs in Advisory Circular (AC) 150/5320-6D. Specific conclusions are as follows: • The rigid pavement failure model in FAARFIELD replaces the nonlinear Structural
Condition Index (SCI) deterioration model with a new, linear model. The FAARFIELD model represents SCI as a linear function of the logarithm of coverages in the post-cracking traffic phase.
• Parameters for the new failure model were obtained by mathematically fitting to full-scale test data. The set of test data used included new data points from the National Airport Pavement Test Facility (NAPTF) Construction Cycle 2 (CC2) tests, as well as historical full-scale test data. New design factors for the historical data were computed using FAARFIELD. The procedures for fitting data are described in detail so that as
46

future data points are developed or changes are made to the 3D-FE model, the parameters can be re-evaluated using the same methods.
• A factor, Fs, is introduced that adjusts the slope of the falling leg of the SCI-log(coverages) curve to account for the presence of stabilized bases, but the failure curve remains linear. This agrees with the results of full-scale tests (CC2) at the NAPTF involving both stabilized and nonstabilized bases under similar loading. The implementation of Fs in FAARFIELD follows the same three-step automated procedure used in LEDFAA 1.3. The factor Fs is a function of subbase layer thickness and subgrade modulus. The value of Fs = 1 is recovered for a rigid pavement on an aggregate subbase 8 inches thick.
• FAARFIELD new rigid design thicknesses were compared to the R805FAA design method for five airport traffic mixes. R805FAA is a spreadsheet implementation of the design charts in AC 150/5320-6D. These five mixes excluded any airplanes not covered by the existing design charts. By minimizing the average absolute difference between the two sets of designs, a calibration factor of 1.12 was determined. In general, FAARFIELD new rigid designs are thicker than equivalent LEDFAA 1.3 designs, but comparable with AC 150/5320-6D.
• Comparisons using other airport traffic mixes, including new large aircraft, show reasonable agreement between FAARFIELD and an extension of the old FAA method based on the COMFAA 2.0 program. The mean difference in Portland cement concrete (PCC) thickness over the range of designs considered was less than 0.1 inch, although individual designs varied by considerably larger amounts.
• Comparisons were also done for hot-mix asphalt (HMA)-on-rigid and PCC-on-rigid overlays. In these comparisons, the FAARFIELD overlay thicknesses were compared to equivalent overlay thicknesses using both the COMFAA 2.0-based method (thickness deficiency method) and LEDFAA 1.3. In the case of HMA-on-rigid overlays, the comparisons with LEDFAA 1.3 show the effect of removing the 1-inch-per-year reflective cracking criterion from FAARFIELD.
7. REFERENCES.
1. Kawa, Izydor, Brill, David R., and Hayhoe, Gordon F., “FAARFIELD—New FAA Airport Pavement Thickness Design Software,” in Proceedings of the 2007 FAA Worldwide Airport Technology Transfer Conference, Atlantic City, New Jersey, 2007.
2. Maker, Bradley N., Ferencz, Robert M., and Hallquist, John O., “NIKE3D—A
Nonlinear, Implicit, Three-Dimensional Finite Element Code for Solid and Structural Mechanics User’s Manual,” Lawrence Livermore National Laboratory, Livermore, California, 1995.
3. Guo, Edward, Ricalde, Lia, and Kawa, Izydor, “FAA Finite Element Design Procedure
for Rigid Pavements,” FAA report DOT/FAA/AR-07/33, August 2007.
47

48
4. Ricalde, Lia, Garg, Navneet, and Kawa, Izydor, “Comparative Design Study for Airport Pavement,” FAA report DOT/FAA/AR-06/56, May 2007.
5. Federal Aviation Administration, Office of Airport Safety and Standards, AC 150.5320-
6D, “Airport Pavement Design and Evaluation,” 1995. 6. Rollings, Raymond S., “Design of Overlays for Rigid Airport Pavements,” FAA report
DOT/FAA/PM-87/19, April 1988. 7. U.S. Army Corps of Engineers Construction Engineering Research Center (CERL),
“Micro PAVER 5.2 Users Manual,” M.Y. Shahin, Principal Investigator, U.S. Army Corps of Engineers ERDC-CERL, Champaign, Illinois, 2004.
8. Federal Aviation Administration, Office of Airport Safety and Standards, Program
LEDFAA 1.3, User Manual, 2004. 9. U.S. Army Engineer Ohio River Division, “Lockbourne No. 1 Test Track, Final Report,”
U.S. Army Corps of Engineers, Mariemont, Ohio, 1946. 10. U.S. Army Engineer Ohio River Division, “Lockbourne No. 2—Experimental Mat, Final
Report,” U.S. Army Corps of Engineers, Mariemont, Ohio, 1950. 11. U.S. Army Engineer Ohio River Division, “Final Report Lockbourne No. 2—
Modification Multiple Wheel Study,” U.S. Army Corps of Engineers, Mariemont, Ohio, 1950.
12. U.S. Army Engineer Ohio River Division Laboratories, “Heavy Load Test Tracks Report
of Construction,” TR 4-17, U.S. Army Corps of Engineers, Cincinnati, Ohio, 1961. 13. Ahlvin, R.G., Ulery, H.H., Hutchinson, R.L., and Rice, J.L., “Multiple-Wheel Heavy
Gear Load Pavement Tests, Volume I—Basic Report,” Technical Report S-71-17, U.S. Army Engineer Waterways Experiment Station, Vicksburg, Mississippi, 1971.
14. Burns, C.D., Hutchinson, R.L., Ulery, H.H., Watkins, J.E., and Grau, R.W., “Multiple-
Wheel Heavy Gear Load Pavement Tests, Volume II—Design, Construction, and Behavior Under Traffic,” Technical Report S-71-17, U.S. Army Engineer Waterways Experiment Station, Vicksburg, Mississippi, 1971.
15. Burns, C.D., Rone, C.L., Brabston, W.N., and Ulery, Jr., H.H., “Comparative
Performance of Structural Layers in Pavement Systems, Volume I—Design, Construction and Behavior Under Traffic of Pavement Test Sections,” Technical Report S-74-8, U.S. Army Engineer Waterways Experiment Station, Vicksburg, Mississippi, 1974.

16. Grau, R.W., “Strengthening of Keyed Longitudinal Construction Joints in Rigid Pavements,” FAA report FAA-RD-72-106, Systems Research & Development Service, Washington, DC, 1972.
17. Parker, Frazier Jr., Barker, Walter R., Gunkel, Robert C., and Odom, Eugene C.,
“Development of a Structural Design Procedure for Rigid Airport Pavements,” FAA report FAA-RD-77-81, Systems Research & Development Service, Washington, DC, 1979.
18. ASTM D 5340-98 “Standard Test Method for Airport Pavement Condition Surveys,”
Annual Book of ASTM Standards, Volume 04.03, ASTM International, Pennsylvania. 19. Yoder, E.J. and Witczak, M.W., Principles of Pavement Design, 2nd Ed., New York,
Wiley, 1975. 20. Federal Aviation Administration, Office of Airport Safety and Standards, AC 150.5320-
6D, “Airport Pavement Design and Evaluation,” Change 3, 2005 (Appendix 5). 21. Garg, Navneet, Guo, Edward, and McQueen, Roy D., “Operational Life of Airport
Pavements,” FAA report DOT/FAA/AR-04/46, December 2004. 22. Federal Aviation Administration, Office of Airport Safety and Standards, AC 150/5335-
5A, “Standardized Method of Reporting Pavement Strength - PCN,” 2006.
49/50

APPENDIX A—COMPARATIVE THICKNESS DATA FOR NON-NEW LARGE AIRCRAFT TRAFFIC MIXES
PCC Design Thickness
(in.) FAARFIELD Section
No.
PCC R
(psi) Traffic
Mix Esub (psi) R805FAA Fc = 1.0 Fc = 1.1 Fc = 1.13 Fc = 1.2
C 500 1-NON 4,500 21.8 20.86 21.89 22.20 22.87 22C 500 1-NON 7,500 20.9 20.52 21.55 21.89 22.57 29C 500 1-NON 15,000 20.0 19.60 20.68 21.01 21.80 36C 500 1-NON 25,000 19.4 18.65 19.81 20.15 20.92 C 500 2-NON 4,500 22.8 21.14 22.19 22.50 23.18 22C 500 2-NON 7,500 21.9 20.77 21.86 22.18 22.87 29C 500 2-NON 15,000 21.0 19.85 20.95 21.27 22.07 36C 500 2-NON 25,000 20.4 18.88 20.06 20.40 21.18 C 500 3-NON 4,500 20.5 19.67 20.64 20.94 21.57 22C 500 3-NON 7,500 19.7 19.41 20.37 20.64 21.32 29C 500 3-NON 15,000 18.8 18.55 19.58 19.88 20.54 36C 500 3-NON 25,000 18.2 17.64 18.74 19.06 19.76 C 500 4-NON 4,500 24.0 20.12 21.14 21.45 22.10 22C 500 4-NON 7,500 22.6 19.59 20.65 20.97 21.65 29C 500 4-NON 15,000 21.1 18.34 19.51 19.78 20.58 36C 500 4-NON 25,000 20.1 16.91 18.16 18.48 19.19 C 500 5-NON 4,500 25.0 21.93 23.00 23.32 24.02 22C 500 5-NON 7,500 24.1 21.55 22.66 22.99 23.70 29C 500 5-NON 15,000 23.0 20.67 21.83 22.17 22.86 36C 500 5-NON 25,000 22.3 19.68 20.84 21.18 22.00 A 650 1-NON 4,500 18.4 18.22 19.15 19.43 20.03 22 650 1-NON 7,500 17.6 17.75 18.74 19.02 19.64 29 650 1-NON 15,000 16.8 16.76 17.79 18.09 18.73 36 650 1-NON 25,000 16.3 15.65 16.71 17.03 17.72 A 650 2-NON 4,500 19.3 18.47 19.41 19.66 20.30 22 650 2-NON 7,500 18.5 17.99 18.99 19.28 19.91 29 650 2-NON 15,000 17.6 16.98 18.02 18.33 18.99 36 650 2-NON 25,000 17.1 15.86 16.93 17.24 17.94 A 650 3-NON 4,500 17.3 17.25 18.14 18.40 18.97 22 650 3-NON 7,500 16.6 16.80 17.71 17.98 18.57
A-1

A-2
PCC Design Thickness (in.)
FAARFIELD Section No.
PCC R
(psi) Traffic
Mix Esub (psi) R805FAA Fc = 1.0 Fc = 1.1 Fc = 1.13 Fc = 1.2
29 650 3-NON 15,000 15.7 15.82 16.80 17.06 17.72 36 650 3-NON 25,000 15.2 14.79 15.80 16.10 16.74 A 650 4-NON 4,500 19.9 17.47 18.40 18.64 19.27 22 650 4-NON 7,500 18.6 16.81 17.80 18.09 18.73 29 650 4-NON 15,000 17.2 15.29 16.40 16.69 17.34 36 650 4-NON 25,000 16.3 13.75 14.84 15.17 15.90 A 650 5-NON 4,500 21.1 19.17 20.14 20.42 21.05 22 650 5-NON 7,500 20.3 18.72 19.72 20.02 20.66 29 650 5-NON 15,000 19.3 17.72 18.71 19.01 19.69 36 650 5-NON 25,000 18.7 16.59 17.68 18.00 18.71 B 700 1-NON 4,500 17.5 17.50 18.43 18.67 19.28 22A 700 1-NON 7,500 16.7 17.01 17.97 18.27 18.87 29B 700 1-NON 15,000 16.0 15.97 16.99 17.29 17.94 36B 700 1-NON 25,000 15.5 14.82 15.89 16.18 16.86 B 700 2-NON 4,500 18.4 17.74 18.66 18.93 19.52 22A 700 2-NON 7,500 17.6 17.25 18.23 18.51 19.12 29B 700 2-NON 15,000 16.8 16.18 17.21 17.51 18.17 36B 700 2-NON 25,000 16.2 15.02 16.08 16.39 17.08 B 700 3-NON 4,500 16.5 16.57 17.45 17.68 18.26 22A 700 3-NON 7,500 15.8 16.11 17.00 17.27 17.84 29B 700 3-NON 15,000 15.0 15.09 16.04 16.32 16.92 36B 700 3-NON 25,000 14.4 14.02 15.01 15.30 15.94 B 700 4-NON 4,500 18.9 16.74 17.64 17.92 18.53 22A 700 4-NON 7,500 17.6 16.06 17.04 17.33 17.94 29B 700 4-NON 15,000 16.2 14.45 15.51 15.83 16.52 36B 700 4-NON 25,000 15.3 12.93 13.99 14.30 15.00 B 700 5-NON 4,500 20.1 18.45 19.38 19.64 20.28 22A 700 5-NON 7,500 19.3 17.96 18.95 19.24 19.86 29B 700 5-NON 15,000 18.4 16.91 17.96 18.27 18.85 36B 700 5-NON 25,000 17.8 15.77 16.84 17.16 17.83
Sum of Squares of (FAARFIELD—R805FAA) 146.42 59.96 58.84 94.60 PCC = Portland cement concrete

APPENDIX B—COMPARATIVE THICKNESS DATA FOR NEW LARGE AIRCRAFT TRAFFIC MIXES
PCC Design Thickness
(in.) PCC R
(psi) Traffic
Mix Esub (ksi)
Stabilizer Base
FAARFIELD 1.2 R805FAA
COMFAA 2.0
LEDFAA 1.3
500 1-NLA 7.5 P-301 24.19 * 23.47 ** 500 1-NLA 7.5 P-304 24.04 * 23.47 ** 500 1-NLA 7.5 P-306 23.82 * 23.47 ** 500 1-NLA 15 P-301 23.07 * 22.65 ** 500 1-NLA 15 P-304 22.88 * 22.65 ** 500 1-NLA 15 P-306 22.67 * 22.65 ** 500 1-NLA 25 P-301 22.02 * 22.16 ** 500 1-NLA 25 P-304 21.40 * 22.16 ** 500 1-NLA 25 P-306 21.44 * 22.16 ** 650 1-NLA 7.5 P-301 20.89 * 19.77 22.52 650 1-NLA 7.5 P-304 20.73 * 19.77 21.11 650 1-NLA 7.5 P-306 20.52 * 19.77 20.56 650 1-NLA 15 P-301 19.33 * 18.96 20.24 650 1-NLA 15 P-304 19.31 * 18.96 19.48 650 1-NLA 15 P-306 19.26 * 18.96 19.18 650 1-NLA 25 P-301 18.14 * 18.56 19.58 650 1-NLA 25 P-304 17.96 * 18.56 19.16 650 1-NLA 25 P-306 17.85 * 18.56 19.00 700 1-NLA 7.5 P-301 20.02 * 18.83 21.25 700 1-NLA 7.5 P-304 19.85 * 18.83 19.89 700 1-NLA 7.5 P-306 19.72 * 18.83 19.37 700 1-NLA 15 P-301 18.50 * 18.05 19.28 700 1-NLA 15 P-304 18.40 * 18.05 18.54 700 1-NLA 15 P-306 18.25 * 18.05 18.25 700 1-NLA 25 P-301 17.26 * 17.67 18.62 700 1-NLA 25 P-304 17.04 * 17.67 18.22 700 1-NLA 25 P-306 16.91 * 17.67 18.05 500 2-NLA 7.5 P-301 23.08 * 23.66 ** 500 2-NLA 7.5 P-304 23.03 * 23.66 ** 500 2-NLA 7.5 P-306 22.94 * 23.66 ** 500 2-NLA 15 P-301 22.38 * 22.79 **
B-1

B-2
PCC Design Thickness (in.) PCC
R (psi)
Traffic Mix
Esub (ksi)
Stabilizer Base
FAARFIELD 1.2 R805FAA
COMFAA 2.0
LEDFAA 1.3
500 2-NLA 15 P-304 22.23 * 22.79 ** 500 2-NLA 15 P-306 22.22 * 22.79 ** 500 2-NLA 25 P-301 21.49 * 22.31 ** 500 2-NLA 25 P-304 21.38 * 22.31 ** 500 2-NLA 25 P-306 21.33 * 22.31 ** 650 2-NLA 7.5 P-301 20.14 * 19.91 21.31 650 2-NLA 7.5 P-304 20.02 * 19.91 20.22 650 2-NLA 7.5 P-306 19.89 * 19.91 19.80 650 2-NLA 15 P-301 19.22 * 19.02 20.36 650 2-NLA 15 P-304 19.05 * 19.02 19.60 650 2-NLA 15 P-306 18.98 * 19.02 19.31 650 2-NLA 25 P-301 18.21 * 18.54 19.73 650 2-NLA 25 P-304 18.03 * 18.54 19.31 650 2-NLA 25 P-306 17.89 * 18.54 19.15 700 2-NLA 7.5 P-301 19.39 * 18.96 20.34 700 2-NLA 7.5 P-304 19.21 * 18.96 19.29 700 2-NLA 7.5 P-306 19.07 * 18.96 18.88 700 2-NLA 15 P-301 18.40 * 18.06 19.40 700 2-NLA 15 P-304 18.21 * 18.06 18.67 700 2-NLA 15 P-306 18.11 * 18.06 18.39 700 2-NLA 25 P-301 17.32 * 17.65 18.77 700 2-NLA 25 P-304 17.11 * 17.65 18.37 700 2-NLA 25 P-306 16.97 * 17.65 18.20 500 3-NLA 7.5 P-301 24.33 * 25.06 ** 500 3-NLA 7.5 P-304 24.22 * 25.06 ** 500 3-NLA 7.5 P-306 24.16 * 25.06 ** 500 3-NLA 15 P-301 23.32 * 23.19 ** 500 3-NLA 15 P-304 23.12 * 23.19 ** 500 3-NLA 15 P-306 23.08 * 23.19 ** 500 3-NLA 25 P-301 22.01 * 22.23 ** 500 3-NLA 25 P-304 21.75 * 22.23 ** 500 3-NLA 25 P-306 21.74 * 22.23 **

PCC Design Thickness (in.) PCC
R (psi)
Traffic Mix
Esub (ksi)
Stabilizer Base
FAARFIELD 1.2 R805FAA
COMFAA 2.0
LEDFAA 1.3
650 3-NLA 7.5 P-304 20.91 * 20.13 21.68 650 3-NLA 7.5 P-306 20.79 * 20.13 21.10 650 3-NLA 15 P-301 19.65 * 18.59 20.19 650 3-NLA 15 P-304 19.59 * 18.59 19.27 650 3-NLA 15 P-306 19.51 * 18.59 18.92 650 3-NLA 25 P-301 18.04 * 17.85 19.00 650 3-NLA 25 P-304 17.99 * 17.85 18.49 650 3-NLA 25 P-306 17.87 * 17.85 18.28 700 3-NLA 7.5 P-301 20.22 * 18.94 21.81 700 3-NLA 7.5 P-304 20.02 * 18.94 20.34 700 3-NLA 7.5 P-306 19.89 * 18.94 19.79 700 3-NLA 15 P-301 18.72 * 17.50 19.04 700 3-NLA 15 P-304 18.59 * 17.50 18.16 700 3-NLA 15 P-306 18.53 * 17.50 17.81 700 3-NLA 25 P-301 17.10 * 16.76 17.89 700 3-NLA 25 P-304 16.89 * 16.76 17.49 700 3-NLA 25 P-306 16.75 * 16.76 17.33
*R805FAA does not accommodate NLA. **LEDFAA 1.3 minimum allowable R = 600 psi NLA = New large aircraft PCC = Portland cement concrete
B-3/B-4

APPENDIX C—COMPARATIVE THICKNESS DATA FOR NEW LARGE AIRCRAFT TRAFFIC MIXES (NEW LARGE AIRCRAFT REMOVED FROM MIX)
PCC Design Thickness
(in.) PCC R
(psi) Traffic
Mix Esub (ksi)
Stabilizer Base
FAARFIELD 1.2 R805FAA
COMFAA 2.0
LEDFAA 1.3
500 1-NLA* 7.5 P-301 23.50 24.51 23.02 ** 500 1-NLA* 7.5 P-304 23.27 24.51 23.02 ** 500 1-NLA* 7.5 P-306 23.22 24.51 23.02 ** 500 1-NLA* 15 P-301 22.42 23.60 22.21 ** 500 1-NLA* 15 P-304 22.33 23.60 22.21 ** 500 1-NLA* 15 P-306 22.28 23.60 22.21 ** 500 1-NLA* 25 P-301 21.48 23.08 21.72 ** 500 1-NLA* 25 P-304 21.36 23.08 21.72 ** 500 1-NLA* 25 P-306 21.31 20.59 19.38 21.27 650 1-NLA* 7.5 P-301 20.35 20.59 19.38 20.15 650 1-NLA* 7.5 P-304 20.14 20.59 19.38 19.72 650 1-NLA* 7.5 P-306 20.01 19.77 18.59 20.23 650 1-NLA* 15 P-301 19.20 19.77 18.59 19.47 650 1-NLA* 15 P-304 19.09 19.77 18.59 19.18 650 1-NLA* 15 P-306 18.97 19.30 18.20 19.58 650 1-NLA* 25 P-301 18.14 19.30 18.20 19.16 650 1-NLA* 25 P-304 17.96 19.30 18.20 18.99 650 1-NLA* 25 P-306 17.84 20.59 19.38 21.27 700 1-NLA* 7.5 P-301 19.49 19.59 18.46 20.27 700 1-NLA* 7.5 P-304 19.30 19.59 18.46 19.20 700 1-NLA* 7.5 P-306 19.17 19.59 18.46 18.79 700 1-NLA* 15 P-301 18.36 18.79 17.70 19.27 700 1-NLA* 15 P-304 18.19 18.79 17.70 18.53 700 1-NLA* 15 P-306 18.09 18.79 17.70 18.24 700 1-NLA* 25 P-301 17.25 18.34 17.32 18.62 700 1-NLA* 25 P-304 17.03 18.34 17.32 18.21 700 1-NLA* 25 P-306 16.91 18.34 17.32 18.05 500 2-NLA* 7.5 P-301 23.08 23.73 23.65 ** 500 2-NLA* 7.5 P-304 23.03 23.73 23.65 ** 500 2-NLA* 7.5 P-306 22.94 23.73 23.65 ** 500 2-NLA* 15 P-301 22.38 22.85 22.79 **
C-1

C-2
PCC Design Thickness (in.) PCC
R (psi)
Traffic Mix
Esub (ksi)
Stabilizer Base
FAARFIELD 1.2 R805FAA
COMFAA 2.0
LEDFAA 1.3
500 2-NLA* 15 P-304 22.23 22.85 22.79 ** 500 2-NLA* 15 P-306 22.22 22.85 22.79 ** 500 2-NLA* 25 P-301 21.49 22.34 22.30 ** 500 2-NLA* 25 P-304 21.38 22.34 22.30 ** 500 2-NLA* 25 P-306 21.33 22.34 22.30 ** 650 2-NLA* 7.5 P-301 20.14 19.94 19.91 21.31 650 2-NLA* 7.5 P-304 20.02 19.94 19.91 20.22 650 2-NLA* 7.5 P-306 19.89 19.94 19.91 19.80 650 2-NLA* 15 P-301 19.22 19.14 19.02 20.36 650 2-NLA* 15 P-304 19.05 19.14 19.02 19.61 650 2-NLA* 15 P-306 18.98 19.14 19.02 19.31 650 2-NLA* 25 P-301 18.21 18.69 18.53 19.73 650 2-NLA* 25 P-304 18.03 18.69 18.53 19.31 650 2-NLA* 25 P-306 17.89 18.69 18.53 19.15 700 2-NLA* 7.5 P-301 19.39 18.97 18.96 20.34 700 2-NLA* 7.5 P-304 19.21 18.97 18.96 19.29 700 2-NLA* 7.5 P-306 19.07 18.97 18.96 18.88 700 2-NLA* 15 P-301 18.40 18.20 18.05 19.40 700 2-NLA* 15 P-304 18.21 18.20 18.05 18.67 700 2-NLA* 15 P-306 18.11 18.20 18.05 18.39 700 2-NLA* 25 P-301 17.32 17.76 17.65 18.77 700 2-NLA* 25 P-304 17.11 17.76 17.65 18.37 700 2-NLA* 25 P-306 16.97 17.76 17.65 18.20 500 3-NLA* 7.5 P-301 23.91 24.19 23.28 ** 500 3-NLA* 7.5 P-304 23.66 24.19 23.28 ** 500 3-NLA* 7.5 P-306 23.63 24.19 23.28 ** 500 3-NLA* 15 P-301 22.80 22.29 21.55 ** 500 3-NLA* 15 P-304 22.68 22.29 21.55 ** 500 3-NLA* 15 P-306 22.61 22.29 21.55 ** 500 3-NLA* 25 P-301 21.54 21.35 20.55 ** 500 3-NLA* 25 P-304 21.35 21.35 20.55 ** 500 3-NLA* 25 P-306 21.38 21.35 20.55 **

PCC Design Thickness (in.) PCC
R (psi)
Traffic Mix
Esub (ksi)
Stabilizer Base
FAARFIELD 1.2 R805FAA
COMFAA 2.0
LEDFAA 1.3
650 3-NLA* 7.5 P-301 20.67 19.36 20.34 21.31 650 3-NLA* 7.5 P-304 20.49 19.36 20.34 20.05 650 3-NLA* 7.5 P-306 20.37 19.36 20.34 19.56 650 3-NLA* 15 P-301 19.28 18.23 19.41 19.63 650 3-NLA* 15 P-304 19.19 18.23 19.41 18.78 650 3-NLA* 15 P-306 19.11 18.23 19.41 18.50 650 3-NLA* 25 P-301 17.62 17.78 18.97 18.82 650 3-NLA* 25 P-304 17.50 17.78 18.97 18.41 650 3-NLA* 25 P-306 17.41 17.78 18.97 18.25 700 3-NLA* 7.5 P-301 19.82 18.20 19.31 20.19 700 3-NLA* 7.5 P-304 19.58 18.20 19.31 18.97 700 3-NLA* 7.5 P-306 19.48 18.20 19.31 18.50 700 3-NLA* 15 P-301 18.37 17.32 18.48 18.57 700 3-NLA* 15 P-304 18.26 17.32 18.48 17.86 700 3-NLA* 15 P-306 18.14 17.32 18.48 17.58 700 3-NLA* 25 P-301 16.72 16.88 18.00 17.88 700 3-NLA* 25 P-304 16.50 16.88 18.00 17.48 700 3-NLA* 25 P-306 16.33 16.88 18.00 17.32
*NLAs have been removed from the traffic mix (B777, A340, A380). **LEDFAA 1.3 minimum allowable R = 600 psi NLA = New large aircraft PCC = Portland cement concrete
C-3/C-4
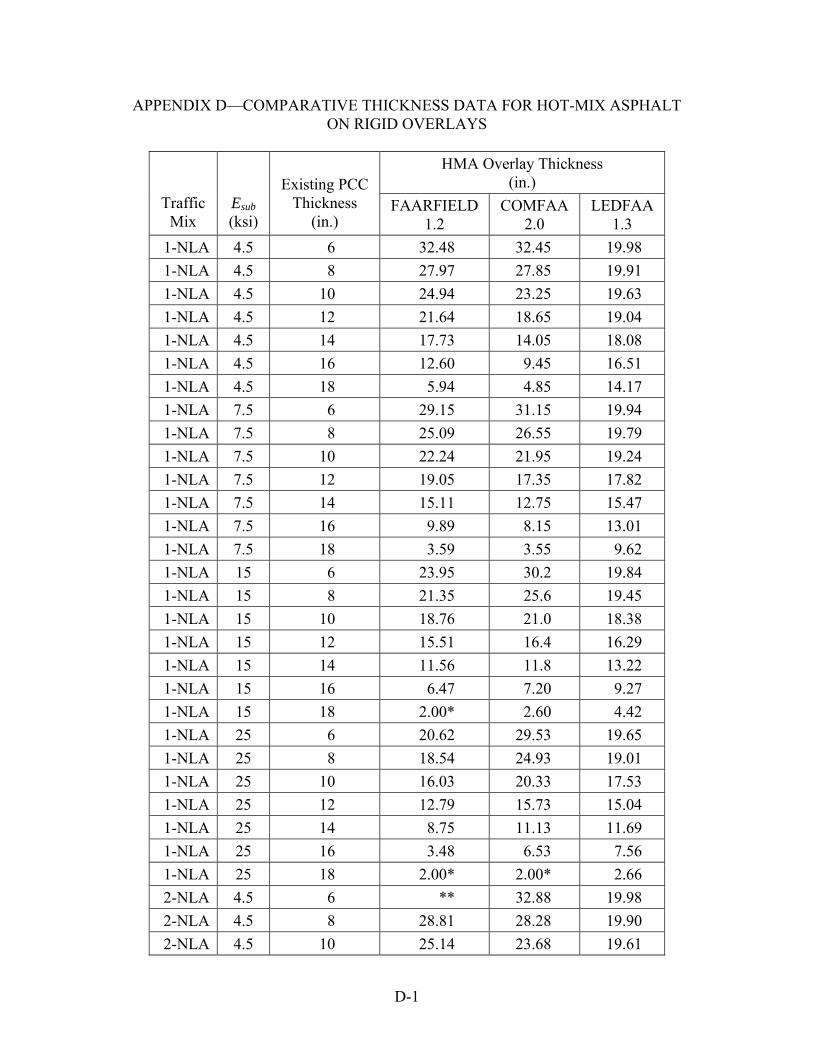
APPENDIX D—COMPARATIVE THICKNESS DATA FOR HOT-MIX ASPHALT ON RIGID OVERLAYS
HMA Overlay Thickness
(in.) Traffic
Mix Esub (ksi)
Existing PCC Thickness
(in.) FAARFIELD
1.2 COMFAA
2.0 LEDFAA
1.3 1-NLA 4.5 6 32.48 32.45 19.98 1-NLA 4.5 8 27.97 27.85 19.91 1-NLA 4.5 10 24.94 23.25 19.63 1-NLA 4.5 12 21.64 18.65 19.04 1-NLA 4.5 14 17.73 14.05 18.08 1-NLA 4.5 16 12.60 9.45 16.51 1-NLA 4.5 18 5.94 4.85 14.17 1-NLA 7.5 6 29.15 31.15 19.94 1-NLA 7.5 8 25.09 26.55 19.79 1-NLA 7.5 10 22.24 21.95 19.24 1-NLA 7.5 12 19.05 17.35 17.82 1-NLA 7.5 14 15.11 12.75 15.47 1-NLA 7.5 16 9.89 8.15 13.01 1-NLA 7.5 18 3.59 3.55 9.62 1-NLA 15 6 23.95 30.2 19.84 1-NLA 15 8 21.35 25.6 19.45 1-NLA 15 10 18.76 21.0 18.38 1-NLA 15 12 15.51 16.4 16.29 1-NLA 15 14 11.56 11.8 13.22 1-NLA 15 16 6.47 7.20 9.27 1-NLA 15 18 2.00* 2.60 4.42 1-NLA 25 6 20.62 29.53 19.65 1-NLA 25 8 18.54 24.93 19.01 1-NLA 25 10 16.03 20.33 17.53 1-NLA 25 12 12.79 15.73 15.04 1-NLA 25 14 8.75 11.13 11.69 1-NLA 25 16 3.48 6.53 7.56 1-NLA 25 18 2.00* 2.00* 2.66 2-NLA 4.5 6 ** 32.88 19.98 2-NLA 4.5 8 28.81 28.28 19.90 2-NLA 4.5 10 25.14 23.68 19.61
D-1

D-2
HMA Overlay Thickness (in.)
Traffic Mix
Esub (ksi)
Existing PCC Thickness
(in.) FAARFIELD
1.2 COMFAA
2.0 LEDFAA
1.3 2-NLA 4.5 12 21.51 19.08 18.72 2-NLA 4.5 14 17.24 14.48 16.73 2-NLA 4.5 16 11.73 9.88 13.76 2-NLA 4.5 18 4.43 5.28 9.60 2-NLA 7.5 6 32.01 31.20 19.93 2-NLA 7.5 8 26.63 26.60 19.79 2-NLA 7.5 10 23.22 22.00 19.27 2-NLA 7.5 12 19.67 17.40 17.91 2-NLA 7.5 14 15.38 12.80 15.47 2-NLA 7.5 16 9.98 8.20 11.98 2-NLA 7.5 18 3.05 3.60 7.43 2-NLA 15 6 26.23 30.30 19.81 2-NLA 15 8 22.43 25.70 19.48 2-NLA 15 10 19.55 21.10 18.48 2-NLA 15 12 16.16 16.50 16.50 2-NLA 15 14 12.03 11.90 13.49 2-NLA 15 16 6.84 7.30 9.56 2-NLA 15 18 2.00* 2.70 4.70 2-NLA 25 6 21.25 29.70 19.65 2-NLA 25 8 19.05 25.10 19.07 2-NLA 25 10 16.51 20.50 17.69 2-NLA 25 12 13.24 15.90 15.30 2-NLA 25 14 9.23 11.30 11.98 2-NLA 25 16 3.84 6.70 7.90 2-NLA 25 18 2.00* 2.10 2.96 3-NLA 4.5 6 ** 35.70 19.93 3-NLA 4.5 8 ** 31.10 19.83 3-NLA 4.5 10 ** 26.50 19.59 3-NLA 4.5 12 24.55 21.90 19.16 3-NLA 4.5 14 20.34 17.30 18.35 3-NLA 4.5 16 15.00 12.70 17.04 3-NLA 4.5 18 7.67 8.10 15.03

HMA Overlay Thickness (in.)
Traffic Mix
Esub (ksi)
Existing PCC Thickness
(in.) FAARFIELD
1.2 COMFAA
2.0 LEDFAA
1.3 3-NLA 7.5 6 ** 34.28 19.75 3-NLA 7.5 8 ** 29.68 19.39 3-NLA 7.5 10 26.48 25.08 18.48 3-NLA 7.5 12 22.71 20.48 17.42 3-NLA 7.5 14 18.38 15.88 15.75 3-NLA 7.5 16 12.69 11.28 13.47 3-NLA 7.5 18 5.01 6.68 10.38 3-NLA 15 6 32.91 33.03 19.44 3-NLA 15 8 26.80 28.43 18.68 3-NLA 15 10 22.75 23.83 17.18 3-NLA 15 12 18.79 19.23 14.83 3-NLA 15 14 13.78 14.63 11.63 3-NLA 15 16 6.84 10.03 8.09 3-NLA 15 18 2.00* 5.43 3.63 3-NLA 25 6 28.41 32.33 19.07 3-NLA 25 8 22.37 27.73 17.96 3-NLA 25 10 18.18 23.13 16.09 3-NLA 25 12 13.47 18.53 13.40 3-NLA 25 14 7.72 13.93 9.99 3-NLA 25 16 2.04 9.33 5.78 3-NLA 25 18 2.00* 4.72 2.00*
*FAARFIELD did not converge. **Minimum overlay thickness reached. HMA = Hot-mix asphalt NLA = New large aircraft PCC = Portland cement concrete
D-3/D-4

APPENDIX E—COMPARATIVE THICKNESS DATA FOR PORTLAND CEMENT CONCRETE ON RIGID OVERLAYS
PCC Overlay Thickness
(in.) Traffic Esub
(ksi)
Existing PCC Thickness
(in.) FAARFIELD
1.2 COMFAA
2.0 LEDFAA
1.3 Mix 1-NLA 4.5 6 19.49 16.71 21.05 1-NLA 4.5 8 19.23 15.79 20.76 1-NLA 4.5 10 18.81 14.75 20.31 1-NLA 4.5 12 18.26 13.59 19.64 1-NLA 4.5 14 17.46 12.30 18.67 1-NLA 4.5 16 16.37 10.87 17.52 1-NLA 4.5 18 14.81 9.29 15.00 1-NLA 7.5 6 18.77 16.17 19.13 1-NLA 7.5 8 18.50 15.24 18.77 1-NLA 7.5 10 18.06 14.18 18.21 1-NLA 7.5 12 17.47 13.00 17.36 1-NLA 7.5 14 16.57 11.69 16.07 1-NLA 7.5 16 15.42 10.23 14.20 1-NLA 7.5 18 13.73 8.60 11.37 1-NLA 15 6 17.40 15.77 17.95 1-NLA 15 8 17.06 14.83 17.58 1-NLA 15 10 16.54 13.76 17.00 1-NLA 15 12 15.79 12.56 16.14 1-NLA 15 14 14.71 11.23 14.87 1-NLA 15 16 13.30 9.75 13.23 1-NLA 15 18 11.44 8.08 9.78 1-NLA 25 6 16.24 15.49 17.72 1-NLA 25 8 15.87 14.54 17.33 1-NLA 25 10 15.30 13.46 16.74 1-NLA 25 12 14.44 12.26 15.86 1-NLA 25 14 13.14 10.91 14.58 1-NLA 25 16 10.98 9.41 12.58 1-NLA 25 18 8.95 7.71 9.34 2-NLA 4.5 6 19.02 16.89 19.23 2-NLA 4.5 8 18.73 15.97 18.92 2-NLA 4.5 10 18.32 14.94 18.42
E-1

E-2
PCC Overlay Thickness (in.)
Traffic Mix
Esub (ksi)
Existing PCC Thickness
(in.) FAARFIELD
1.2 COMFAA
2.0 LEDFAA
1.3 2-NLA 4.5 12 17.69 13.78 17.68 2-NLA 4.5 14 16.79 12.50 16.59 2-NLA 4.5 16 15.50 11.08 15.35 2-NLA 4.5 18 13.37 9.51 12.68 2-NLA 7.5 6 18.50 16.19 18.66 2-NLA 7.5 8 18.17 15.26 18.32 2-NLA 7.5 10 17.74 14.20 17.78 2-NLA 7.5 12 17.08 13.02 16.99 2-NLA 7.5 14 16.11 11.71 15.81 2-NLA 7.5 16 14.67 10.25 14.14 2-NLA 7.5 18 12.11 8.62 11.43 2-NLA 15 6 17.44 15.81 18.10 2-NLA 15 8 17.11 14.87 17.73 2-NLA 15 10 16.58 13.81 17.16 2-NLA 15 12 15.82 12.61 16.31 2-NLA 15 14 14.69 11.28 15.04 2-NLA 15 16 12.86 9.80 13.45 2-NLA 15 18 5.00 8.14 9.78 2-NLA 25 6 16.31 15.56 17.88 2-NLA 25 8 15.93 14.62 17.50 2-NLA 25 10 15.35 13.54 16.91 2-NLA 25 12 14.45 12.34 16.04 2-NLA 25 14 13.04 10.99 14.75 2-NLA 25 16 9.95 9.49 12.84 2-NLA 25 18 5.00 7.81 8.63 3-NLA 4.5 6 19.71 18.06 21.91 3-NLA 4.5 8 19.47 17.17 21.65 3-NLA 4.5 10 19.07 16.17 21.22 3-NLA 4.5 12 18.5 15.05 20.58 3-NLA 4.5 14 17.71 13.82 19.63 3-NLA 4.5 16 16.61 12.46 18.30 3-NLA 4.5 18 15.11 10.97 15.92

PCC Overlay Thickness (in.)
Traffic Mix
Esub (ksi)
Existing PCC Thickness
(in.) FAARFIELD
1.2 COMFAA
2.0 LEDFAA
1.3 3-NLA 7.5 6 18.98 17.47 19.55 3-NLA 7.5 8 18.69 16.57 19.19 3-NLA 7.5 10 18.28 15.55 18.63 3-NLA 7.5 12 17.66 14.41 17.78 3-NLA 7.5 14 16.82 13.15 16.48 3-NLA 7.5 16 15.63 11.77 14.31 3-NLA 7.5 18 13.99 10.24 12.44 3-NLA 15 6 17.48 16.95 17.45 3-NLA 15 8 17.14 16.04 17.02 3-NLA 15 10 16.62 15.00 16.34 3-NLA 15 12 15.93 13.85 15.32 3-NLA 15 14 14.94 12.57 13.79 3-NLA 15 16 13.58 11.16 11.32 3-NLA 15 18 11.73 9.59 7.39 3-NLA 25 6 15.71 16.66 16.97 3-NLA 25 8 15.3 15.74 16.55 3-NLA 25 10 14.75 14.70 15.89 3-NLA 25 12 13.94 13.53 14.90 3-NLA 25 14 12.83 12.24 13.36 3-NLA 25 16 11.24 10.81 11.08 3-NLA 25 18 9.09 9.22 3.00
HMA = Hot-mix asphalt NLA = New large aircraft PCC = Portland cement concrete
E-3/E-4