dots expansion - stop tb · pdf file6.2 dots expansion activities in 2006–2015 ... (year...
TRANSCRIPT
DOTS ExpansionWorking GroupSt rateg ic P lan2 0 0 6 – 2 0 1 5

��
�
DOTS ExpansionWorking GroupSt rateg ic P lan2 0 0 6 – 2 0 1 5
WHO/HTM/TB/2006.370
��
DOTS Expansion Working Group S t ra teg ic P lan 2 0 0 6 – 2 0 1 5
�ii
DOTS Expansion Working Group S t ra teg ic P lan 2 0 0 6 – 2 0 1 5
© World Health Organization 2006
All rights reserved.
The designations employed and the presentation of the material in this publication do not imply the expression of any opinion whatsoever on the part of the World Health Organization concerning the legal status of any country, territory, city or area or of its authorities, or concerning the delimitation of its frontiers or boundaries. Dotted lines on maps represent approximate border lines for which there may not yet be full agreement.
The mention of specific companies or of certain manufacturers’ products does not imply that they are endorsed or recommended by the World Health Organization in preference to others of a similar nature that are not mentioned. Errors and omissions excepted, the names of proprietary products are distinguished by initial capital letters.
All reasonable precautions have been taken by the World Health Organization to verify the information contained in this publication. However, the published material is being distributed without warranty of any kind, either express or implied. The responsibility for the interpretation and use of the material lies with the reader. In no event shall the World Health Organization be liable for damages arising from its use.
The Stop TB Partnership is housed by the World Health Organization.
��
DOTS Expansion Working Group S t ra teg ic P lan 2 0 0 6 – 2 0 1 5
�ii
DOTS Expansion Working Group S t ra teg ic P lan 2 0 0 6 – 2 0 1 5
CONTENTS
Acknowledgements __________________________________________________________________________________iv
Abbreviations _______________________________________________________________________________________ v
1. INTRODUCTION ________________________________________________________________________________ 1
2. PROGRESS SINCE THE LAUNCH OF THE FIRST GLOBAL PLAN _______________________________________ 2
3. MAIN STRATEGIC DIRECTIONS FOR 2006–2015 ____________________________________________________ 4 3.1 The challenges ahead ________________________________________________________________________ 4 3.2 Strategic directions for global TB control and DOTS expansion ______________________________________ 5 3.3 Broadening the scope of DOTS expansion _______________________________________________________ 5 3.4 Objectives for DOTS expansion in 2006–2015 ___________________________________________________ 6 3.5 Measuring achievements _____________________________________________________________________ 7
4. MAIN ACTIVITY AREAS FOR DOTS EXPANSION ___________________________________________________ 9 4.1 Completing DOTS coverage___________________________________________________________________ 9 4.2 Improving DOTS quality ______________________________________________________________________ 9 4.3 Instituting and scaling up PPM DOTS __________________________________________________________10 4.4 Scaling up community DOTS _________________________________________________________________11 4.5 Introducing and scaling up PAL _______________________________________________________________11 4.6 Developing capacity for culture services, DST and new diagnostics _________________________________12 4.7 Prioritizing the needs of poor and vulnerable populations _________________________________________12
5. RISK, THREATS AND OPPPORTUNITIES __________________________________________________________13 5.1 Deteriorating health systems _________________________________________________________________13 5.2 Devolving responsibilities for TB control from the public sector ____________________________________15 5.3 Diluting the focus of TB control ______________________________________________________________15 5.4 Losing broad support from the public health community _________________________________________15
6. SUMMARY OF REGIONAL DOTS EXPANSION SCENARIOS _________________________________________16 6.1 Methodology ______________________________________________________________________________16 6.2 DOTS expansion activities in 2006–2015 _______________________________________________________17 6.3 Summary of expected TB control outcomes and impact __________________________________________21 6.4 Financial needs for country implementation ____________________________________________________25
7. DEWG SUPPORT TO COUNTRY IMPLEMENTATION ________________________________________________27 7.1 Responsibilities ____________________________________________________________________________28 7.2 Priority countries ___________________________________________________________________________28 7.3 Structure for delivering support ______________________________________________________________28 7.4 Subgroup activities _________________________________________________________________________30 7.5 Financial resource requirements for country support _____________________________________________32
8. REFERENCES __________________________________________________________________________________35
ANNEX: _________________________________________________________________________________________37 Regional scenarios for TB control in 2006–2015 _____________________________________________________37 Introduction ___________________________________________________________________________________38 African Region _________________________________________________________________________________39 The Americas Region (excluding established market economies) ________________________________________50 Eastern Mediterranean Region ____________________________________________________________________57 Eastern European Region ________________________________________________________________________63 South-East Asia Region __________________________________________________________________________69 Western Pacific Region __________________________________________________________________________75
iii
�v
DOTS Expansion Working Group S t ra teg ic P lan 2 0 0 6 – 2 0 1 5
v
DOTS Expansion Working Group S t ra teg ic P lan 2 0 0 6 – 2 0 1 5
ACKNOWLEDGEMENTS
The Chair and Secretary of the DOTS Expansion Working Group (DEWG), Syed Karam Shah and Léopold Blanc, led the development of the DEWG strategic plan together with the DEWG core team: Francis Adatu-Engwau, Susan Bacheller, Carmelia Basri, Nils Billo, Lakhbir Singh Chauhan, Mao Tan Eang, Fraser Fowler, Robert Gie, Peter Gondrie, Phil Hopewell, Françoise Portaels, Bertie Squire and Masashi Suchi.
Knut Lönnroth coordinated the development of the plan, wrote the first draft and ensured its finalization. The strategic plan and the regional scenarios were developed jointly by the DEWG secretariat (Malgosia Grzemska and Amy Piatek), WHO regional TB advisers (Dong Il Ahn, Mirtha del Granado, Nani Nair, Wilfred Nkhoma, Akihiro Seita and Richard Zaleskis), Stop TB Department (STB) regional TB focal points (José Figueroa-Munoz, Giuliano Gargioni, Malgosia Grzemska, Jun-Wook Kwon, Pierre-Yves Norval and Salah-Eddine Ottmani) and experts representing specific technical areas (Mohamed Aziz, Karin Bergström, Dermot Maher, Krystyna Ryszewska, Bertie Squire and Mukund Uplekar). The regional scenarios, which integrate scenarios for DOTS expansion with those for collaborative TB/HIV activities and DOTS-Plus for MDR-TB, were developed jointly with the DOTS-Plus for MDR-TB Working Group Secretariat (Eva Nathanson) and the TB/HIV Working Group Secretariat (Alasdair Reid). The STB Monitoring and Evaluation unit (Chris Dye, Katherine Floyd, Andrea Pantoja and Bernadette Bourdin Trunz) assisted with epidemiological and costing predictions.
The strategic plan was developed as one of the building blocks for the Global Plan to Stop TB 2006–2015. Overall guidance in its contribution to the Global Plan (along with the strategic plans of the other six working groups) was provided by the Global Plan Writing Committee and Steering Committee.
The pre-final draft of the DEWG Strategic Plan 2006–2015 was reviewed and endorsed at the annual DEWG meeting in Versailles, France, in October 2005.
�v
DOTS Expansion Working Group S t ra teg ic P lan 2 0 0 6 – 2 0 1 5
v
DOTS Expansion Working Group S t ra teg ic P lan 2 0 0 6 – 2 0 1 5
ABBREVIATIONS
AFR high African countries with high HIV prevalence (TB epidemiological region)
AFR low African countries with low HIV prevalence (TB epidemiological region)
AIDS acquired immunodeficiency syndrome
AMR WHO Region of the Americas
ART antiretroviral therapy
DEWG DOTS Expansion Working Group
DST drug susceptibility testing
EMR WHO Eastern Mediterranean Region
EEUR Eastern European Region (TB epidemiological region)
GDEP Global DOTS Expansion Plan (2001–2005)
GDF Global Drug Facility
GFATM Global Fund to Fight AIDS, Tuberculosis and Malaria
HBC high (TB) burden country
HIV human immunodeficiency virus
ICC interagency coordination committee
KNCV Koninklijke Nederlandse Centrale Vereniging ter Bestrijding van Tuberculose [Royal Netherlands Tuberculosis Foundation]
MDG Millennium Development Goal
MDR-TB multidrug-resistant TB
NGO nongovernmental organization
NRL national reference laboratory
NTP national TB control programme
PAL Practical Approach to Lung Health
PPM DOTS public-private mix for DOTS
SEAR WHO South-East Asia Region
TB tuberculosis
Union International Union Against Tuberculosis and Lung Disease
WHO World Health Organization
WPR WHO Western Pacific Region

v�
DOTS Expansion Working Group S t ra teg ic P lan 2 0 0 6 – 2 0 1 5
�
DOTS Expansion Working Group S t ra teg ic P lan 2 0 0 6 – 2 0 1 5
v�
DOTS Expansion Working Group S t ra teg ic P lan 2 0 0 6 – 2 0 1 5
�
DOTS Expansion Working Group S t ra teg ic P lan 2 0 0 6 – 2 0 1 5
The DOTS Expansion Working Group (DEWG) Strategic Plan 2006–2015 (the Strategic Plan) has evolved as part of the process of developing the Global Plan to Stop TB 2006–2015 (the Global Plan) (1). The Global Plan outlines the strategies of the Stop TB Partnership’s seven working groups, including DEWG.
The DEWG Strategic Plan is the main pillar of the Global Plan. DEWG aims to assist countries in improving access to high-quality DOTS, which will serve as a foundation for implementation of the activities of the working groups on TB/HIV and MDR-TB. Successful implementation of the Strategic Plan will also pave the way for effective implementation of the new tools that are expected to become available through the efforts of the working groups on new diagnostics, new drugs and new vaccines. Moreover, the planned activities of the working group on advocacy, communication and social mobilization to help strengthen strategic communication for improved tuberculosis (TB) con-trol in countries need to build on the plan for DOTS expansion.
This Strategic Plan outlines how expansion and enhancement of DOTS will contribute towards the 2015 global targets for TB control. These targets, linked to the United Nations TB-related Millennium Development Goals (MDGs) and endorsed by the Stop TB Partnership are: (i) to detect at least 70% of infectious TB cases and to treat successfully at least 85% of these cases; (ii) to have halted and begun to reverse incidence of TB by 2015; and (iii) to have halved TB prevalence and death rates 2015 compared with 1990 levels. It also outlines how DOTS expansion will contribute towards achieving MDG 1: to eradicate extreme poverty and hunger. TB control and MDG 1 are closely related: effective TB control reduces poverty and poverty reduction helps control TB. The Strategic Plan acknowledges
the profound importance of poverty alleviation and socioeconomic development for the long-term control of the TB epidemic, while focusing on mechanisms to effectively implement high-quality TB diagnosis and treatment for all, particularly poor and vulnerable populations, in line with the Stop TB Strategy.
First, the Strategic Plan reviews the progress made in TB control since the launch of the first Global Plan in 2001 (2). It then analyses current challenges and outlines the strategic vision of DEWG for the period 2006–2015. The DEWG secretariat has developed a broad plan of activities to be imple-mented in the regions through a process of con-sultations with DEWG partners and WHO regional offices. This broad plan identifies core objectives for DOTS expansion and outlines the activities required to reach these objectives. The plan also includes 10-year scenarios for country implementation (summarized at regional level), including assumed pace of scale-up and estimated coverage of differ-ent activities related to DOTS expansion. As part of the scenario, estimates have been made of the impact on the trend of TB case detection and treat-ment outcomes over the next 10 years, as well as the impact on TB prevalence, incidence and death rates in relation to the MDG targets. Furthermore, the scenarios include the estimated cost of country implementation plus the cost of required external technical support.
1. INTRODUCTION
�
DOTS Expansion Working Group S t ra teg ic P lan 2 0 0 6 – 2 0 1 5
�
DOTS Expansion Working Group S t ra teg ic P lan 2 0 0 6 – 2 0 1 5
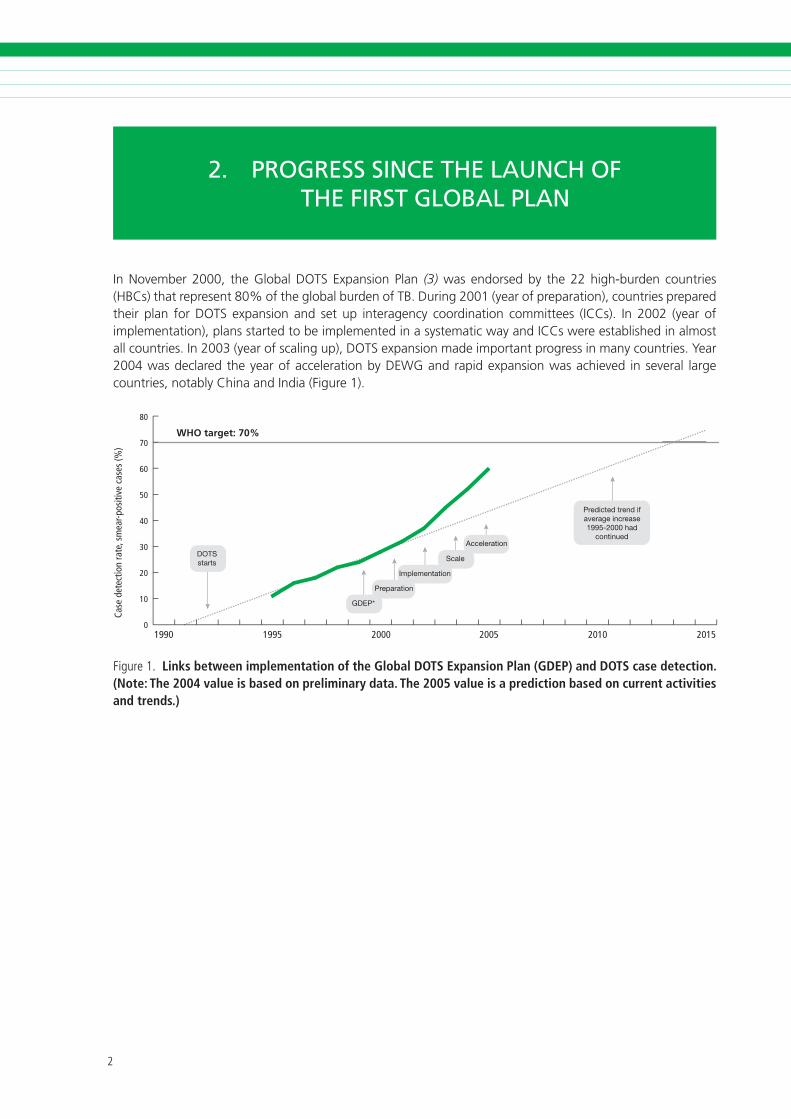
In November 2000, the Global DOTS Expansion Plan (3) was endorsed by the 22 high-burden countries (HBCs) that represent 80% of the global burden of TB. During 2001 (year of preparation), countries prepared their plan for DOTS expansion and set up interagency coordination committees (ICCs). In 2002 (year of implementation), plans started to be implemented in a systematic way and ICCs were established in almost all countries. In 2003 (year of scaling up), DOTS expansion made important progress in many countries. Year 2004 was declared the year of acceleration by DEWG and rapid expansion was achieved in several large countries, notably China and India (Figure 1).
1990 1995 2000 2005 2010 2015
Case
det
ectio
n ra
te, s
mea
r-pos
itive
cas
es (%
)
80
70
60
50
40
30
20
10
0
WHO target: 70%
F�gure�. Links between implementation of the Global DOTS Expansion Plan (GDEP) and DOTS case detection. (Note: The 2004 value is based on preliminary data. The 2005 value is a prediction based on current activities and trends.)
2. PROGRESS SINCE THE LAUNCH OF THE FIRST GLOBAL PLAN
�
DOTS Expansion Working Group S t ra teg ic P lan 2 0 0 6 – 2 0 1 5
�
DOTS Expansion Working Group S t ra teg ic P lan 2 0 0 6 – 2 0 1 5
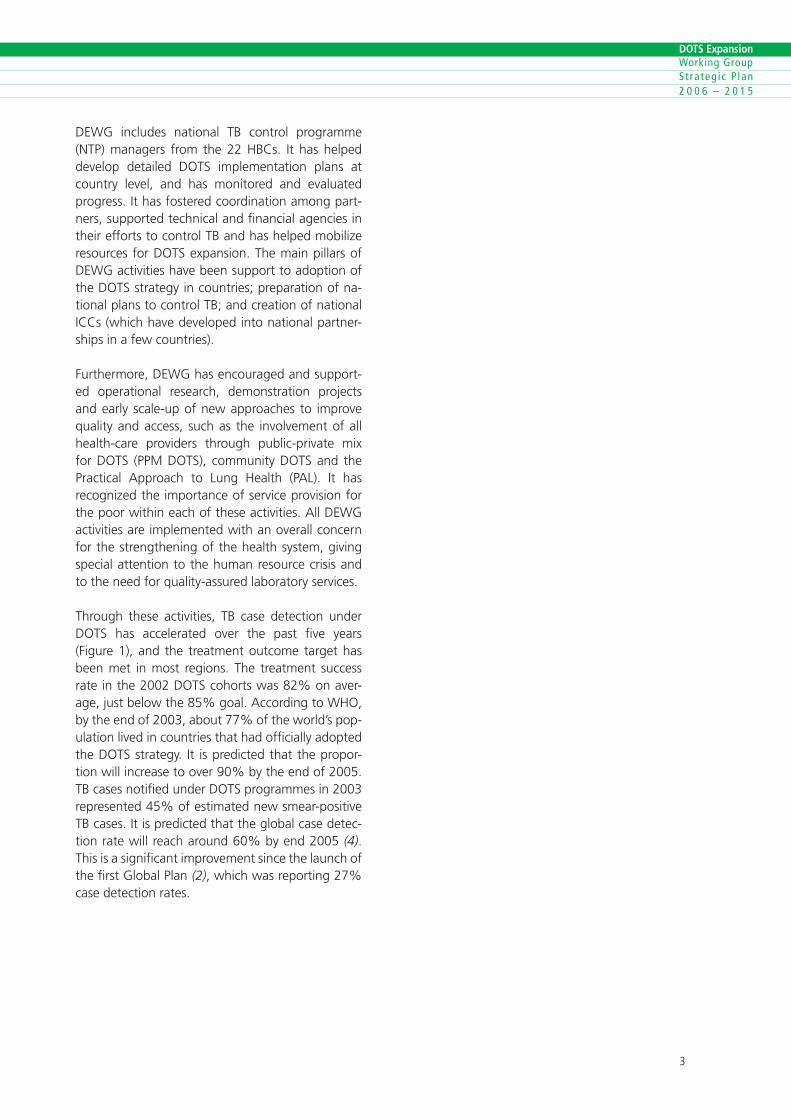
DEWG includes national TB control programme (NTP) managers from the 22 HBCs. It has helped develop detailed DOTS implementation plans at country level, and has monitored and evaluated progress. It has fostered coordination among part-ners, supported technical and financial agencies in their efforts to control TB and has helped mobilize resources for DOTS expansion. The main pillars of DEWG activities have been support to adoption of the DOTS strategy in countries; preparation of na-tional plans to control TB; and creation of national ICCs (which have developed into national partner-ships in a few countries).
Furthermore, DEWG has encouraged and support-ed operational research, demonstration projects and early scale-up of new approaches to improve quality and access, such as the involvement of all health-care providers through public-private mix for DOTS (PPM DOTS), community DOTS and the Practical Approach to Lung Health (PAL). It has recognized the importance of service provision for the poor within each of these activities. All DEWG activities are implemented with an overall concern for the strengthening of the health system, giving special attention to the human resource crisis and to the need for quality-assured laboratory services.
Through these activities, TB case detection under DOTS has accelerated over the past five years (Figure 1), and the treatment outcome target has been met in most regions. The treatment success rate in the 2002 DOTS cohorts was 82% on aver-age, just below the 85% goal. According to WHO, by the end of 2003, about 77% of the world’s pop-ulation lived in countries that had officially adopted the DOTS strategy. It is predicted that the propor-tion will increase to over 90% by the end of 2005. TB cases notified under DOTS programmes in 2003 represented 45% of estimated new smear-positive TB cases. It is predicted that the global case detec-tion rate will reach around 60% by end 2005 (4). This is a significant improvement since the launch of the first Global Plan (2), which was reporting 27% case detection rates.
�
DOTS Expansion Working Group S t ra teg ic P lan 2 0 0 6 – 2 0 1 5
�
DOTS Expansion Working Group S t ra teg ic P lan 2 0 0 6 – 2 0 1 5
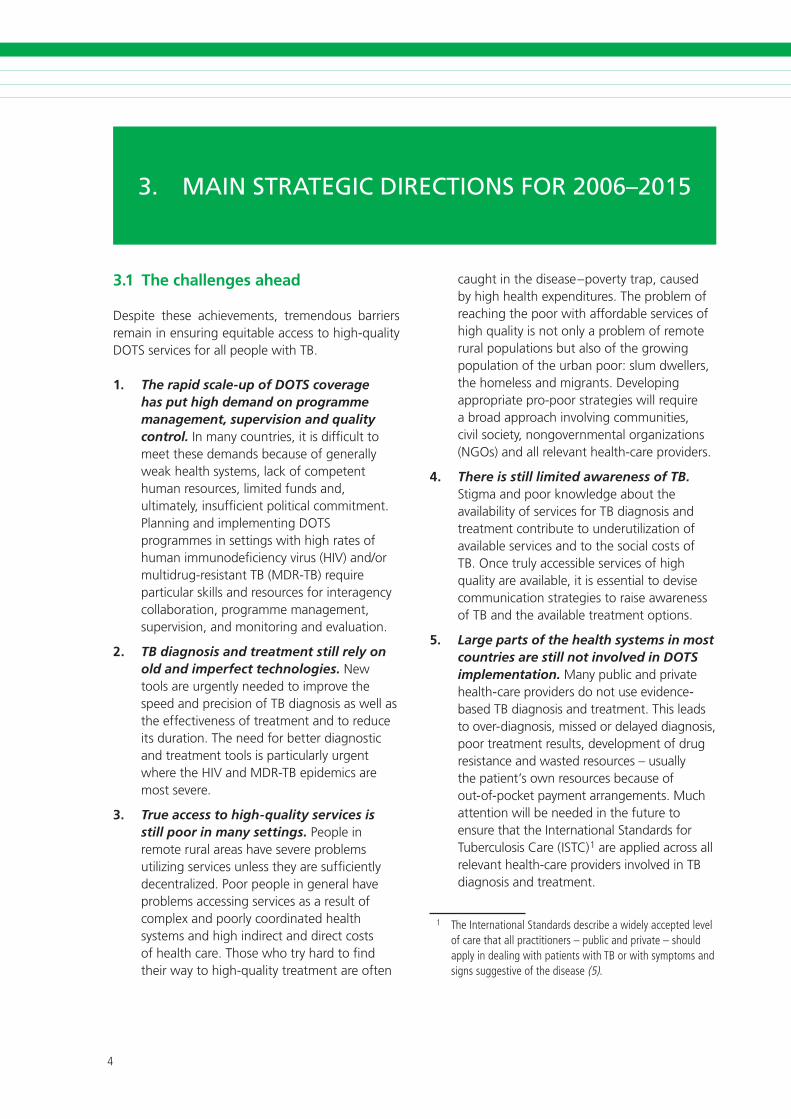
3.1 The challenges ahead
Despite these achievements, tremendous barriers remain in ensuring equitable access to high-quality DOTS services for all people with TB.
1. The rapid scale-up of DOTS coverage has put high demand on programme management, supervision and quality control. In many countries, it is difficult to meet these demands because of generally weak health systems, lack of competent human resources, limited funds and, ultimately, insufficient political commitment. Planning and implementing DOTS programmes in settings with high rates of human immunodeficiency virus (HIV) and/or multidrug-resistant TB (MDR-TB) require particular skills and resources for interagency collaboration, programme management, supervision, and monitoring and evaluation.
2. TB diagnosis and treatment still rely on old and imperfect technologies. New tools are urgently needed to improve the speed and precision of TB diagnosis as well as the effectiveness of treatment and to reduce its duration. The need for better diagnostic and treatment tools is particularly urgent where the HIV and MDR-TB epidemics are most severe.
3. True access to high-quality services is still poor in many settings. People in remote rural areas have severe problems utilizing services unless they are sufficiently decentralized. Poor people in general have problems accessing services as a result of complex and poorly coordinated health systems and high indirect and direct costs of health care. Those who try hard to find their way to high-quality treatment are often
3. MAIN STRATEGIC DIRECTIONS FOR 2006–2015
caught in the disease–poverty trap, caused by high health expenditures. The problem of reaching the poor with affordable services of high quality is not only a problem of remote rural populations but also of the growing population of the urban poor: slum dwellers, the homeless and migrants. Developing appropriate pro-poor strategies will require a broad approach involving communities, civil society, nongovernmental organizations (NGOs) and all relevant health-care providers.
4. There is still limited awareness of TB. Stigma and poor knowledge about the availability of services for TB diagnosis and treatment contribute to underutilization of available services and to the social costs of TB. Once truly accessible services of high quality are available, it is essential to devise communication strategies to raise awareness of TB and the available treatment options.
5. Large parts of the health systems in most countries are still not involved in DOTS implementation. Many public and private health-care providers do not use evidence-based TB diagnosis and treatment. This leads to over-diagnosis, missed or delayed diagnosis, poor treatment results, development of drug resistance and wasted resources – usually the patient’s own resources because of out-of-pocket payment arrangements. Much attention will be needed in the future to ensure that the International Standards for Tuberculosis Care (ISTC)1 are applied across all relevant health-care providers involved in TB diagnosis and treatment.
1� Theinternat�onalStandardsdescr�beaw�delyacceptedlevelofcarethatallpract�t�oners–publ�candpr�vate–shouldapply�ndeal�ngw�thpat�entsw�thTBorw�thsymptomsands�gnssuggest�veofthed�sease(�).
�
DOTS Expansion Working Group S t ra teg ic P lan 2 0 0 6 – 2 0 1 5
�
DOTS Expansion Working Group S t ra teg ic P lan 2 0 0 6 – 2 0 1 5
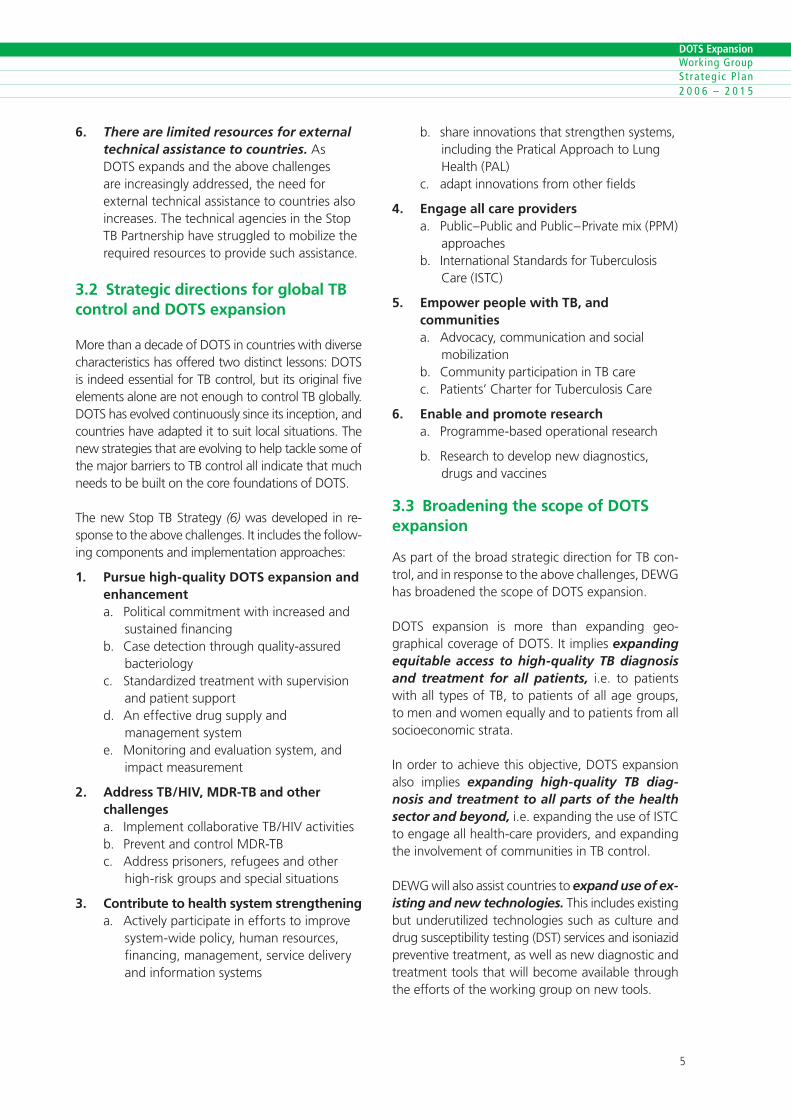
6. There are limited resources for external technical assistance to countries. As DOTS expands and the above challenges are increasingly addressed, the need for external technical assistance to countries also increases. The technical agencies in the Stop TB Partnership have struggled to mobilize the required resources to provide such assistance.
3.2 Strategic directions for global TB control and DOTS expansion
More than a decade of DOTS in countries with diverse characteristics has offered two distinct lessons: DOTS is indeed essential for TB control, but its original five elements alone are not enough to control TB globally. DOTS has evolved continuously since its inception, and countries have adapted it to suit local situations. The new strategies that are evolving to help tackle some of the major barriers to TB control all indicate that much needs to be built on the core foundations of DOTS.
The new Stop TB Strategy (6) was developed in re-sponse to the above challenges. It includes the follow-ing components and implementation approaches:
1. Pursue high-quality DOTS expansion and enhancementa. Political commitment with increased and
sustained financingb. Case detection through quality-assured
bacteriologyc. Standardized treatment with supervision
and patient supportd. An effective drug supply and
management systeme. Monitoring and evaluation system, and
impact measurement
2. Address TB/HIV, MDR-TB and other challengesa. Implement collaborative TB/HIV activitiesb. Prevent and control MDR-TBc. Address prisoners, refugees and other
high-risk groups and special situations
3. Contribute to health system strengtheninga. Actively participate in efforts to improve
system-wide policy, human resources, financing, management, service delivery and information systems
b. share innovations that strengthen systems, including the Pratical Approach to Lung Health (PAL)
c. adapt innovations from other fields
4. Engage all care providersa. Public–Public and Public–Private mix (PPM)
approachesb. International Standards for Tuberculosis
Care (ISTC)
5. Empower people with TB, and communitiesa. Advocacy, communication and social
mobilizationb. Community participation in TB carec. Patients’ Charter for Tuberculosis Care
6. Enable and promote researcha. Programme-based operational research
b. Research to develop new diagnostics, drugs and vaccines
3.3 Broadening the scope of DOTS expansion
As part of the broad strategic direction for TB con-trol, and in response to the above challenges, DEWG has broadened the scope of DOTS expansion.
DOTS expansion is more than expanding geo-graphical coverage of DOTS. It implies expanding equitable access to high-quality TB diagnosis and treatment for all patients, i.e. to patients with all types of TB, to patients of all age groups, to men and women equally and to patients from all socioeconomic strata.
In order to achieve this objective, DOTS expansion also implies expanding high-quality TB diag-nosis and treatment to all parts of the health sector and beyond, i.e. expanding the use of ISTC to engage all health-care providers, and expanding the involvement of communities in TB control.
DEWG will also assist countries to expand use of ex-isting and new technologies. This includes existing but underutilized technologies such as culture and drug susceptibility testing (DST) services and isoniazid preventive treatment, as well as new diagnostic and treatment tools that will become available through the efforts of the working group on new tools.
�
DOTS Expansion Working Group S t ra teg ic P lan 2 0 0 6 – 2 0 1 5
�
DOTS Expansion Working Group S t ra teg ic P lan 2 0 0 6 – 2 0 1 5
3.4 Objectives for DOTS expansion in 2006–2015
In line with the general strategic directions for TB control outlined above and the overall aim of reach-ing the MDG targets, DEWG and its partners will continue to assist countries in working towards two main outcome objectives:
1. To achieve, sustain and exceed the targets of 70% case detection rate and 85% treatment success rate.
2. To ensure universal access to high-quality TB care for all people with TB, especially the poor and marginalized.
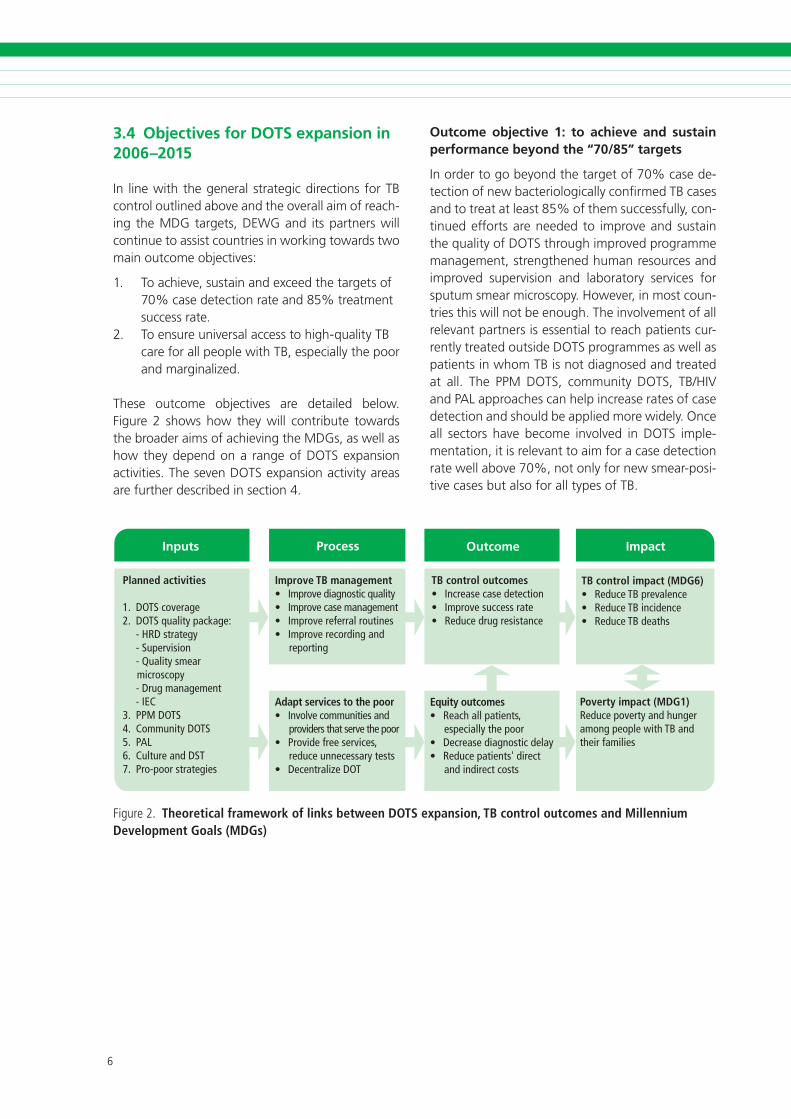
These outcome objectives are detailed below. Figure 2 shows how they will contribute towards the broader aims of achieving the MDGs, as well as how they depend on a range of DOTS expansion activities. The seven DOTS expansion activity areas are further described in section 4.
Inputs
Improve TB management• Improve diagnostic quality• Improve case management • Improve referral routines• Improve recording and
reporting
Adapt services to the poor• Involve communities and
providers that serve the poor• Provide free services,
reduce unnecessary tests• Decentralize DOT
TB control outcomes• Increase case detection• Improve success rate • Reduce drug resistance
Equity outcomes• Reach all patients,
especially the poor• Decrease diagnostic delay• Reduce patients' direct
and indirect costs
TB control impact (MDG6)• Reduce TB prevalence • Reduce TB incidence • Reduce TB deaths
Poverty impact (MDG1)Reduce poverty and hunger among people with TB and their families
Process Outcome Impact
Planned activities
1. DOTS coverage2. DOTS quality package: - HRD strategy - Supervision - Quality smear
microscopy - Drug management - IEC3. PPM DOTS4. Community DOTS5. PAL6. Culture and DST7. Pro-poor strategies
F�gure�. Theoretical framework of links between DOTS expansion, TB control outcomes and Millennium Development Goals (MDGs)
Outcome objective 1: to achieve and sustain performance beyond the “70/85” targets
In order to go beyond the target of 70% case de-tection of new bacteriologically confirmed TB cases and to treat at least 85% of them successfully, con-tinued efforts are needed to improve and sustain the quality of DOTS through improved programme management, strengthened human resources and improved supervision and laboratory services for sputum smear microscopy. However, in most coun-tries this will not be enough. The involvement of all relevant partners is essential to reach patients cur-rently treated outside DOTS programmes as well as patients in whom TB is not diagnosed and treated at all. The PPM DOTS, community DOTS, TB/HIV and PAL approaches can help increase rates of case detection and should be applied more widely. Once all sectors have become involved in DOTS imple-mentation, it is relevant to aim for a case detection rate well above 70%, not only for new smear-posi-tive cases but also for all types of TB.

�
DOTS Expansion Working Group S t ra teg ic P lan 2 0 0 6 – 2 0 1 5
�
DOTS Expansion Working Group S t ra teg ic P lan 2 0 0 6 – 2 0 1 5
Outcome objective 2: to ensure universal ac-cess to high-quality TB care for all people with TB, especially the poor and marginalized
The completion of DOTS expansion starts with achieving the 70/85 targets and ends with all people with TB having true access to high-quality TB services. Neither type of TB nor financial capacity or social status should determine access to high-quality TB services. “All people with TB” includes people of all ages and all people with extrapulmonary disease or pulmonary sputum smear-negative disease. It also includes people with TB/HIV coinfection and people with MDR-TB.
Given the poor socioeconomic status of most people with TB, a pro-poor and equity-based approach requires that health services pay special attention to the needs of the most disadvantaged groups. This means identifying barriers and implementing measures that will ensure early diagnosis and effec-tive treatment, and thereby reduce the social and financial burden of the disease for patients. People in remote rural areas often lack geographical access to even basic health services. The urban poor have geographical access to health services but often lack the financial means to access them. People with poor understanding of TB, and of the health-care system, have difficulties identifying relevant provid-ers and utilizing them in an effective way. Migrants, “floating populations” and the homeless are diffi-cult to provide with seamless care.
Community involvement – in health care in general and in DOTS expansion in particular – is an effective strategy to improve access for the rural poor and help channel health information to communities. In order to reach the poor and disadvantaged, health-care providers that are used by this segment of the population need to be involved in DOTS.
A wide range of public and private health-care pro-viders needs to be targeted, including the informal private sector which is often utilized by the poor and marginalized. Slum dwellers, other urban poor and migrant populations deserve special attention. Special strategies for urban TB control are needed. Furthermore, referral and information systems need to be improved in order to secure efficient transfer of patients and information between different geo-graphical areas and different types of providers.
These approaches need to go hand in hand with improved advocacy and communication strategies, in order to ensure rational use of available services. For this, the involvement of communication experts as well as linkages with NGOs and civil society through social mobilization initiatives are needed.
Improving access to high-quality services also means reducing the harmful effects of poor medi-cal practice. Inappropriate medical practices for TB diagnosis, treatment and case management contribute to unnecessary suffering for patients, diagnostic delays, continuous spread of TB, high health-care costs for patients and society, and de-velopment of MDR-TB. Appropriate technologies, such as sputum smear microscopy, evidence-based treatment regimens and standardized patient moni-toring mechanisms are under-used. At the same time, there is tremendous over-use of a range of non-standardized and non-evidence-based medical technologies in most health systems. High costs of unnecessary health-care interventions make poor TB patients poorer and place additional burdens on the overall health system finances. The key strategy to reducing these harmful effects is to ensure that all health-care providers adopt the International Standards and to educate patients to utilize avail-able services in a rational way.
3.5 Measuring achievements
TB control and equity outcomes
The core indicators for measuring achievements in relation to outcome objective 1 are the well-estab-lished indicators of case detection rate and treatment success rate. A combination of improvements to the existing recording and recording system, mecha-nisms to improve notification systems as well as better approaches to estimate underlying incidence would improve the quality of these indicators.
In order to assess achievements in relation to out-come objective 2, the case detection and treatment success indicators could be measured separately for different subgroups according to age, sex, socioeco-nomic class, etc. For example, the target could be that at least 70% people from the poorest segment of society who suffer from TB should be detected under DOTS, of whom at least 85% are success-fully treated. To measure this, information about
�
DOTS Expansion Working Group S t ra teg ic P lan 2 0 0 6 – 2 0 1 5
�
DOTS Expansion Working Group S t ra teg ic P lan 2 0 0 6 – 2 0 1 5
sociodemographic profile needs to be collected as part of prevalence surveys as well as through sample surveys of patients registered in DOTS programmes. Alternatively, case detection and treatment success rate could be disaggregated by poor vs non-poor geographical areas.
Process of implementing DOTS expansion activities
Process indicators to measure progress towards high-quality TB management already exist. Additional indicators to measure the process of implementing PPM DOTS, community DOTS, PAL, culture and DST services and pro-poor strategies (see below) will have to be further developed.
Contribution towards MDG targets
In order to measure progress towards the MDG targets, baseline and follow-up prevalence surveys and/or other studies that can provide reliable es-timates on incidence, prevalence and death rates need to be undertaken. Through collecting data on socioeconomic variables in prevalence surveys, TB epidemiology could be described and MDG targets monitored for different socioeconomic groups, i.e. each MDG indicator could be disaggregated by socioeconomic group. It should be noted that DOTS expansion is one of many factors that will de-termine future changes in TB incidence, prevalence and death rates. Therefore, measuring changes in these parameters is not the ideal approach for as-sessing successes attributable to DOTS expansion, but rather for assessing the combined impact of the full package of interventions outlined in the Global Plan as well as the “up-stream” determinants of the TB epidemic, such as poverty alleviation and general social and economic development.
�
DOTS Expansion Working Group S t ra teg ic P lan 2 0 0 6 – 2 0 1 5
�
DOTS Expansion Working Group S t ra teg ic P lan 2 0 0 6 – 2 0 1 5
In order to achieve the outcome objectives stated above, DEWG partners will assist countries to imple-ment the following interlinked activities:
1. Completing coverage of basic DOTS services.
2. Improving the quality of DOTS through strengthening the competence and improving the availability of human resources, and strengthening capacity for quality-assured sputum smear microscopy, drug management, supervision, and recording and reporting practices.
3. Instituting and scaling up PPM DOTS to promote international standards for TB care among all relevant health-care providers.
4. Scaling up community DOTS initiatives.
5. Introducing and scaling up PAL.
6. Developing capacity for culture services, DST and emerging new diagnostic tools.
7. Prioritizing the needs of poor and vulnerable populations throughout the process of implementing activities 1–6.
The combination and mode of implementation of these activities will be tailored to address specific local challenges. This strategic plan outlines broad activity areas. The scenario described in section 5 describes possible scale up of activities in the regions. However, detailed country planning, lo-cal targets and implementation will require local situational analysis to determine local challenges, barriers and opportunities. Suitable priorities and mix of activities will have to be defined accordingly. Furthermore, implementation of the activities will have to be combined with operational research and careful monitoring in order to fine-tune approaches before scaling up.
4. MAIN ACTIVITY AREAS FOR DOTS EXPANSION
4.1 Completing DOTS coverage
Global target: all public health basic management units provide TB care according to the DOTS strat-egy in all countries by 2010.
Basic coverage of DOTS within public health struc-tures will soon be completed in the 22 HBCs. Main challenges include achieving 100% coverage in all HBCs and other priority countries. Some countries do not yet provide treatment free of charge under DOTS to sputum smear-negative pulmonary TB patients and extrapulmonary TB patients. These countries should ensure that the above patient groups are covered by DOTS. This applies also to all children with TB. In addition, all countries should work towards free provision of sputum smear microscopy and other TB diagnostic tests. Finally, isoniazid preventive treatment for children needs to be implemented in countries that have not yet done so.
4.2 Improving DOTS quality
Global target: all countries provide high-quality diagnosis and treatment and achieve ≥85% treat-ment success rate by 2015.
Substantial investments in quality improvements of DOTS programmes have been made in many countries over the past couple of years. A major challenge for the future is to sustain the current level of financial and technical support for DOTS. However, most countries are in need of further quality improvement.
The core element of improved quality is improved human resource capacity for undertaking required DOTS tasks: sputum smear microscopy, drug management, supervision, recording and report-ing practices, etc. For some countries, this can be
�0
DOTS Expansion Working Group S t ra teg ic P lan 2 0 0 6 – 2 0 1 5
��
DOTS Expansion Working Group S t ra teg ic P lan 2 0 0 6 – 2 0 1 5
achieved through more efficient use of available resources. For other countries, additional financial resources are needed. Yet other countries face a human resource crisis that will not be resolved with additional financial resources. DOTS quality improvement needs to be planned in parallel with plans for general improvement in human resource capacity. The general strategy for human resource development as part of improved TB control, which is equally essential for all working groups, is dis-cussed further in Part I of the Global Plan.
Decentralization of health service planning and fi-nancing and diminishing public financing for health can pose a threat to the sustainability of TB control. Plans to improve DOTS quality should be developed while considering general health system challenges and competing needs within the health services. Increased political commitment and increased DOTS financing are essential in most countries. Resources, including investments of governments in TB control, should be monitored continuously. It is also essential to strengthen programme man-agement in many countries, particularly at the sub-national level. Furthermore, there is a need to build local-level ownership and support for DOTS, while creating more accountability for performance at the sub-national level.
4.3 Instituting and scaling up PPM DOTS
Global target: all countries have developed guidelines, by 2010, for the involvement of relevant public and private health-care providers in DOTS, and have implemented them by 2015.
The term “PPM DOTS” has evolved to represent a comprehensive approach to involve all relevant health-care providers in DOTS and ensure that they apply international standards for TB care, while taking on DOTS tasks according to their capacity. PPM DOTS targets a wide range of public as well as private health-care providers not yet sufficiently linked to NTPs. Depending on setting, these may include medical colleges, general hospitals, health services under specific insurance schemes, prison health systems, army health services, NGO health facilities, corporate health facilities, private special-ists and general practitioners, private pharmacies
and the informal private health-care sector. While there is a potential role for all providers in deliv-ering DOTS services, the NTP will need to retain and strengthen its stewardship functions, including regulation, financing, monitoring, evaluation and surveillance.
Guidance for PPM DOTS implementation in coun-tries has been developed (7). Evidence shows that PPM DOTS is a feasible and cost-effective strategy to increase case detection and cure rates, to reach the poor and to reduce the financial burden on pa-tients. With the assistance of DEWG and the PPM-DOTS subgroup, several countries have piloted PPM-DOTS initiatives, some have started to scale up, and a few countries have incorporated PPM DOTS fully into national TB control plans. However, PPM DOTS needs to be implemented on a larger scale in many more countries in order to have a real impact on TB control at regional and global levels. Much effort is needed to strengthen the technical capacity and coordination of PPM DOTS at country, regional and global levels.
The PPM-DOTS approach is particularly relevant in settings with large numbers of public and private health-care providers not yet involved in DOTS. The South-East Asia Region, the Western Pacific Region and parts of the Eastern Mediterranean Region have huge private sectors as well as numer-ous public health-care services not yet sufficiently linked to NTPs. Many countries in the Eastern European Region have not yet fully involved public lung clinics, general hospitals, health centres and prison health services in DOTS. In the Region of the Americas, large parts of the health systems are under social insurance schemes, which have not yet been sufficiently linked with DOTS programmes. In the African Region, health-care providers are scarce compared with other regions, particularly in rural areas. Nevertheless, there are large urban areas with a strong presence of private and public providers that need to be tapped. Furthermore, the NGO sector as well as the informal private sec-tor play an important role in rural areas in Africa. Thus, with varied levels of priority, PPM DOTS is a relevant strategy for all regions. In all regions, it will be important to link PPM DOTS to specific urban TB control strategies.

�0
DOTS Expansion Working Group S t ra teg ic P lan 2 0 0 6 – 2 0 1 5
��
DOTS Expansion Working Group S t ra teg ic P lan 2 0 0 6 – 2 0 1 5
4.4 Scaling up community DOTS
Global target: all countries in Africa have scaled up community DOTS initiatives by 2010.
Management of TB patients in many countries where the majority of the population resides in rural areas with poor geographical access to health facilities has often included mandatory hospital admission during the initial intensive phase of treatment, as one way to ensure direct observation of drug taking until the patient is considered non infectious. This practice is expensive and cumbersome both for the health system and for patients. It presents a severe access barrier, especially for the urban poor, and often leads to interruption of treatment due to financial constraints. Ambulatory treatment at basic primary health-care facilities is also difficult and expensive for patients when there are long distances from villages to health centres. Therefore, there is an acute need to further decentralize the provision of TB services beyond health facilities to increase geographical ac-cess and to foster participation in patient support, in order to improve access and increase the likelihood of successful treatment.
A study of community DOTS initiatives in six African countries from 1997–2000 showed that the approach is feasible, effective and cost-effective (8). Based on these experiences, WHO has so far supported 20 countries in various ways to develop plans and to implement the initiative within their NTPs. Experiences to date show that, where implemented, community DOTS has resulted in improved treatment success rates through decreased default and transfer out rates. A subsequent impact on case detection rates, related to both improved popular awareness and better access to care, has also been reported. The implementation of community TB care is relevant not only for its demonstrated impact on TB control, but also for the creation of more equitable ways to access high-quality health care.
4.5 Introducing and scaling up PAL
Global target: PAL is introduced in 20% of devel-oping countries by 2010 and in 50% by 2015.
Respiratory conditions are very common in primary health-care settings. Symptoms presented by pul-
monary TB cases are, in general, similar to those dis-played by non-tuberculous respiratory patients. PAL is a comprehensive and symptom-based approach to manage patients (aged above 5 years) with re-spiratory symptoms within the primary health-care system in order to improve the diagnosis of TB while taking into account the differential diagnoses of other respiratory conditions (9). To this end, this strategy aims to improve: (i) the quality of care for every respiratory patient and (ii) the efficiency of pri-mary health-care services for respiratory conditions, with focus on TB, acute respiratory infections and chronic respiratory diseases.
PAL includes two major components: (i) the stan-dardization of clinical care procedures through the development and implementation of clinical prac-tice guidelines and (ii) the coordination between health care levels within the district health system as well as among various players of the health system, such as health resource development, NTP, HIV/AIDS programme, primary health-care services, essential drugs programme, health management information system and others.
There are currently 16 countries throughout the world where there is some form of formal PAL activity. These countries include populations with various demographic, epidemiological and economic profiles as well as different TB and HIV burden levels. Experience in some countries suggests that PAL can significantly increase TB case detection among respiratory patients as well as improve the bacterio-logical confirmation of pulmonary TB. Furthermore, experiences from various countries show that PAL consistently and significantly reduces irrational drug prescription, particularly the prescription of antibi-otics and adjuvant drugs on vague indications.
The PAL strategy should be considered in high-HIV burden countries in order to improve the quality of the diagnosis of TB, particularly that of smear-negative TB. This will contribute to identifying HIV-positive respiratory patients and implementing antiretroviral therapy. PAL should also be consid-ered in country settings with satisfactory DOTS implementation in order to improve TB case detec-tion, the quality of TB diagnosis and the integration of TB control activities within primary health-care services. In countries with intermediate or low TB
��
DOTS Expansion Working Group S t ra teg ic P lan 2 0 0 6 – 2 0 1 5
��
DOTS Expansion Working Group S t ra teg ic P lan 2 0 0 6 – 2 0 1 5
prevalence, or where TB is not considered a health priority in comparison with chronic respiratory dis-eases, PAL is highly indicated to raise the profile of TB as a priority disease of the strategy.
4.6 Developing capacity for culture services, DST and new diagnostics
Global target 1: all countries have developed full capacity by 2015 to perform culture and DST ac-cording to national policies.
Global target 2: from 2010, new diagnostic tools will be implemented gradually and expected to cover at least 50% of the eligible population by 2015. Although high-quality sputum smear microscopy is the cornerstone of DOTS and remains the high-est priority for case detection and TB control, the strengthening of culturing of Mycobacterium tu-berculosis and DST services is necessary to improve diagnostic sensitivity and specificity, especially in settings with high HIV and MDR-TB prevalence.
However, such improvements require the develop-ment of standardized operational procedures for cul-ture and relevant training material to strengthen the technical capacity and performance of laboratories. In addition, proper monitoring and evaluation tools need to be developed. Strengthening of laboratory capacity to perform culture will require a substantial increase in human and financial resources and the development of closer, more effective collaboration between national programmes and partner institu-tions. Recognizing the need for expansion activities, NTPs, national reference laboratories (NRLs) and key international organizations will continue to re-view the national or regional epidemiological data, organization, structure and the role of the labora-tory networks in order to determine the resources needed for laboratory strengthening.
At the same time, it is necessary to develop country or regional policy to strengthen or build capacity to perform culture to enhance case-finding, especially (but not exclusively) in areas experiencing a high burden of AFB smear-negative TB associated with HIV infection. It is also necessary to expand DST services in support of DOTS-Plus projects. These ef-
forts should lead to implementation or scale up of culture and DST in settings where their use would enhance TB control and patient management.
The Working Group on New TB Diagnostics predicts that a new diagnostic test will be available by 2008 that will have the potential to replace sputum smear microscopy. Furthermore, a rapid culture and DST test is expected to be available for use under field conditions by 2010. The main target group for the DST test will be re-treatment cases, patients with sus-pected drug-resistant TB and HIV-positive sputum-negative cases. A rapid culture test will also be an important tool to improve sensitivity and specificity of the diagnosis of sputum smear-negative cases in general. After appropriate demonstration tests un-der field conditions by the new diagnostics working group, DEWG will assist countries with implementa-tion of these tests into NTP routine operations. This will require registration of new products in countries, developing new policies, purchasing required equip-ment, training of staff, supervision and costs for doing the tests. The new tools will be introduced in a step-wise manner starting in 2010 and gradually replace sputum smear microscopy and conventional culture and DST respectively.
4.7 Prioritizing the needs of poor and vulnerable populations
Global target 1: all countries have developed capacity by 2010 to monitor the extent to which DOTS reaches and serves poor and vulnerable populations.
Global target 2: by 2010 all countries have devel-oped key strategies for improving access to DOTS for poor and vulnerable populations.
The DEWG TB and Poverty Subgroup has developed a normative document outlining options for NTP managers to choose in addressing poverty in DOTS implementation (10). This guide will be used to prioritize the needs of poor and vulnerable popula-tions in implementing all the activities of the Global Plan. As experience and evidence accumulates, these options will be revised and reformulated into formal guidelines for use at national and interna-tional levels.

��
DOTS Expansion Working Group S t ra teg ic P lan 2 0 0 6 – 2 0 1 5
��
DOTS Expansion Working Group S t ra teg ic P lan 2 0 0 6 – 2 0 1 5
5.1 Deteriorating health systems
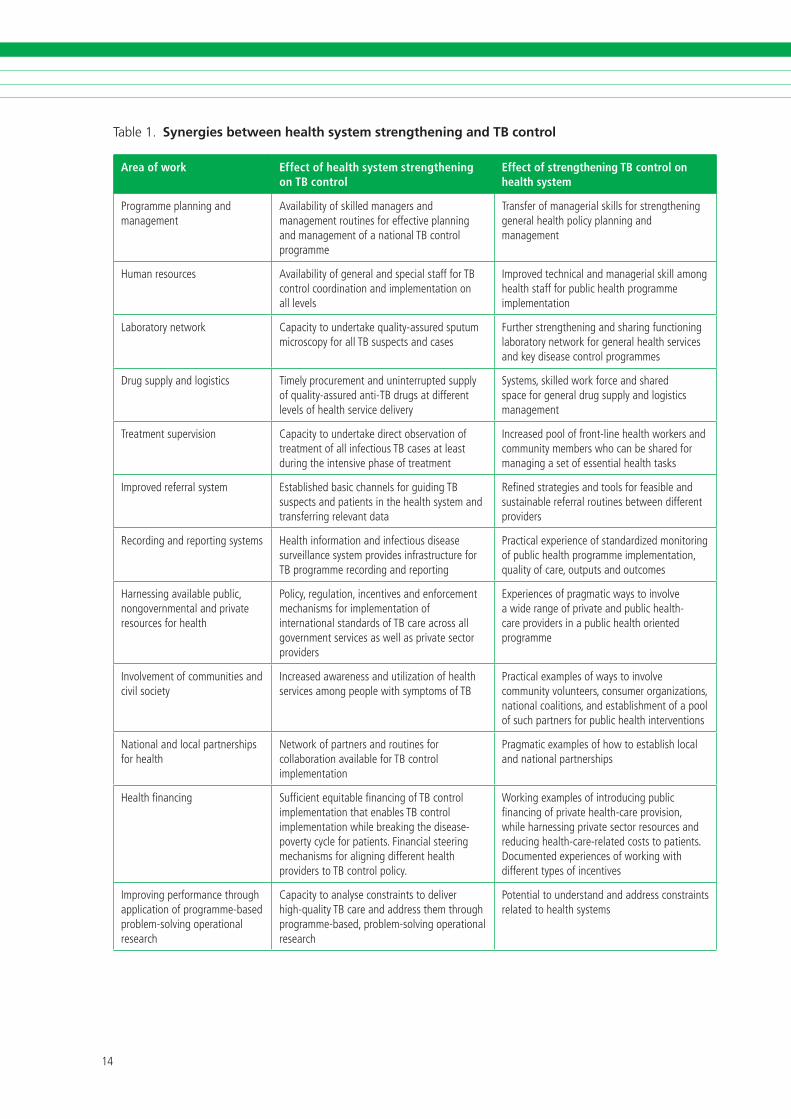
Successful TB control strategies rely on functioning general health systems. Many NTPs today struggle to implement high-quality services in the context of health workforce crises, continuous low levels of public funding for health care, weak government stewardship functions and disintegrated health service networks. DOTS expansion itself is one facet of health systems development. To invest in DOTS means investing in improved health systems. However, DOTS expansion without strengthening of general health services is not sustainable. DEWG therefore needs to join forces with other stakehold-ers involved in health systems development to find ways to strengthen human resources for health, increase equitable health financing and improve general health systems management.
DEWG has identified a range of mechanisms through which DOTS expansion strengthens health systems as well as how health system development creates better conditions for TB control (Table 1). For example, successful implementation of DOTS results in strengthened managerial capacity in the health system, enhanced technical skills among front-line health workers, and improved referral, recording and reporting systems. New initiatives under DEWG, such as PPM DOTS, community DOTS, and PAL are pathfinders for general health systems develop-ment. They demonstrate how all available resources in society can be harnessed to enhance health systems performance. They stimulate development of government stewardship functions. They also show how some adverse effects of malfunctioning health systems, such as irrational use of drugs and catastrophic health expenditures for patients, can be partly overcome. In this context, DEWG will con-tinue to help mobilize resources for TB control that will benefit the whole health sector.
5. RISK, THREATS AND OPPPORTUNITIES
Similarly, DEWG will continue to identify and ad-dress general health systems related barriers for successful TB control. For example, it will advocate, to countries as well as to international stakeholders, the need to strengthen human resources for health, increase equitable health financing and strengthen general health systems management, including coordination between different authorities and providers. To this end, DEWG will take part and share experiences in global fora for health systems strengthening, such as initiatives for health systems strategy development and technical working groups on various issues related to health information sys-tems, human resources for health, health financing and working with private sector providers.
��
DOTS Expansion Working Group S t ra teg ic P lan 2 0 0 6 – 2 0 1 5
��
DOTS Expansion Working Group S t ra teg ic P lan 2 0 0 6 – 2 0 1 5
Area of work Effect of health system strengthening on TB control
Effect of strengthening TB control on health system
Programmeplann�ngandmanagement
Ava�lab�l�tyofsk�lledmanagersandmanagementrout�nesforeffect�veplann�ngandmanagementofanat�onalTBcontrolprogramme
Transferofmanager�alsk�llsforstrengthen�nggeneralhealthpol�cyplann�ngandmanagement
Humanresources Ava�lab�l�tyofgeneralandspec�alstaffforTBcontrolcoord�nat�onand�mplementat�ononalllevels
improvedtechn�calandmanager�alsk�llamonghealthstaffforpubl�chealthprogramme�mplementat�on
Laboratorynetwork Capac�tytoundertakequal�ty-assuredsputumm�croscopyforallTBsuspectsandcases
Furtherstrengthen�ngandshar�ngfunct�on�nglaboratorynetworkforgeneralhealthserv�cesandkeyd�seasecontrolprogrammes
Drugsupplyandlog�st�cs T�melyprocurementandun�nterruptedsupplyofqual�ty-assuredant�-TBdrugsatd�fferentlevelsofhealthserv�cedel�very
Systems,sk�lledworkforceandsharedspaceforgeneraldrugsupplyandlog�st�csmanagement
Treatmentsuperv�s�on
Capac�tytoundertaked�rectobservat�onoftreatmentofall�nfect�ousTBcasesatleastdur�ngthe�ntens�vephaseoftreatment
increasedpooloffront-l�nehealthworkersandcommun�tymemberswhocanbesharedformanag�ngasetofessent�alhealthtasks
improvedreferralsystem Establ�shedbas�cchannelsforgu�d�ngTBsuspectsandpat�ents�nthehealthsystemandtransferr�ngrelevantdata
Refinedstrateg�esandtoolsforfeas�bleandsusta�nablereferralrout�nesbetweend�fferentprov�ders
Record�ngandreport�ngsystems Health�nformat�onand�nfect�ousd�seasesurve�llancesystemprov�des�nfrastructureforTBprogrammerecord�ngandreport�ng
Pract�calexper�enceofstandard�zedmon�tor�ngofpubl�chealthprogramme�mplementat�on,qual�tyofcare,outputsandoutcomes
Harness�ngava�lablepubl�c,nongovernmentalandpr�vateresourcesforhealth
Pol�cy,regulat�on,�ncent�vesandenforcementmechan�smsfor�mplementat�onof�nternat�onalstandardsofTBcareacrossallgovernmentserv�cesaswellaspr�vatesectorprov�ders
Exper�encesofpragmat�cwaysto�nvolveaw�derangeofpr�vateandpubl�chealth-careprov�ders�napubl�chealthor�entedprogramme
involvementofcommun�t�esandc�v�lsoc�ety
increasedawarenessandut�l�zat�onofhealthserv�cesamongpeoplew�thsymptomsofTB
Pract�calexamplesofwaysto�nvolvecommun�tyvolunteers,consumerorgan�zat�ons,nat�onalcoal�t�ons,andestabl�shmentofapoolofsuchpartnersforpubl�chealth�ntervent�ons
Nat�onalandlocalpartnersh�psforhealth
Networkofpartnersandrout�nesforcollaborat�onava�lableforTBcontrol�mplementat�on
Pragmat�cexamplesofhowtoestabl�shlocalandnat�onalpartnersh�ps
Healthfinanc�ng Suffic�entequ�tablefinanc�ngofTBcontrol�mplementat�onthatenablesTBcontrol�mplementat�onwh�lebreak�ngthed�sease-povertycycleforpat�ents.F�nanc�alsteer�ngmechan�smsforal�gn�ngd�fferenthealthprov�derstoTBcontrolpol�cy.
Work�ngexamplesof�ntroduc�ngpubl�cfinanc�ngofpr�vatehealth-careprov�s�on,wh�leharness�ngpr�vatesectorresourcesandreduc�nghealth-care-relatedcoststopat�ents.Documentedexper�encesofwork�ngw�thd�fferenttypesof�ncent�ves
improv�ngperformancethroughappl�cat�onofprogramme-basedproblem-solv�ngoperat�onalresearch
Capac�tytoanalyseconstra�ntstodel�verh�gh-qual�tyTBcareandaddressthemthroughprogramme-based,problem-solv�ngoperat�onalresearch
Potent�altounderstandandaddressconstra�ntsrelatedtohealthsystems
Table 1. Synergies between health system strengthening and TB control

��
DOTS Expansion Working Group S t ra teg ic P lan 2 0 0 6 – 2 0 1 5
��
DOTS Expansion Working Group S t ra teg ic P lan 2 0 0 6 – 2 0 1 5
5.2 Devolving TB control responsibili-ties from the public sector
Where public health functions have been weakened by health sector reforms aimed at reducing the size and responsibilities of the public sector, TB control has suffered. In such situations, new approaches such as PPM DOTS and community DOTS are use-ful in harnessing available resources for improved TB control. These approaches should be seen as responses to misguided health sector reforms, not as part of the reforms. That is, they should not contribute to privatization and devolution of government responsibilities. Rather, they should go hand-in-hand with revitalizing certain functions of the public sector.
In order for governments and NTPs to reach out, attract the collaboration of and coordinate the inputs by different health-care providers and civil society partners, additional investments are needed in the public health care sector. Capacity needs to be strengthened in order to fulfill important stew-ardship functions, including supervision, quality control, programme management, contracting and enforcement of regulation. The risk that the role of the government sector is played down as a result of a new focus on the involvement of private sec-tor and civil society should be seriously addressed. DEWG and the Stop TB Partnership need to strongly advocate for increased resources to strengthen the public sector as a core condition for successfully involving other sectors.
5.3 Diluting the focus of TB control
DOTS is evolving and the scope of DOTS expan-sion is widening. This is necessary in order to adapt to old and new challenges such as health sector reform, the health workforce crises, the growth of the private health-care sector, the increasing MDR-TB prevalence and the HIV epi-demic. However, to increase the scope risks losing the focus on the essential components of DOTS. Unless sufficient resources are made available and technical assistance is increased, NTPs may divert money and manpower away from core elements required to ensure quality of DOTS in the basic public health infrastructure. On the other hand,
postponing efforts to deal with health sector reform, irrational use of anti-TB drugs, MDR-TB development and TB/HIV coinfection, will make matters worse in the long run. NTPs need to strike a balance between investing in increasing the quality of “basic” DOTS and investments in new approaches. The key to success is to continue to stress the need to secure high-quality basic DOTS functions as well as to raise additional resources needed to implement new approaches.
5.4 Losing broad support from the public health community
The facts underpinning DOTS as an effective strategy to control TB are there. Prevention starts with cure and the urgent priority for TB control is to ensure access to quality-assured diagnosis and treatment for all people with TB. However, given the history of TB incidence decline in high-income countries over the past century, it is clear that economic and social development are also key to TB control. Playing down the essential role of social and economic development for TB control, because it is beyond the purview of NTPs or because it is too much a long-term and upstream determinant, may defeat its purpose of advocating for resource allocation to where it is most cost-effective.
DEWG and the Stop TB Partnership risk losing cred-ibility among public health experts, governments, development agencies, donors and the Millennium Development Movement if the TB control commu-nity pays relatively little attention to the impact of poverty and socioeconomic development on the TB epidemic. The link between MDG 6 and MDG 1 needs to be clearly articulated. There is a need for a strong message that long-term TB control depends on economic development, and that DOTS expan-sion contributes to breaking the disease–poverty cycle, both directly by reducing health-care costs to patients, and indirectly by improving productivity through death and disability reduction.

��
DOTS Expansion Working Group S t ra teg ic P lan 2 0 0 6 – 2 0 1 5
��
DOTS Expansion Working Group S t ra teg ic P lan 2 0 0 6 – 2 0 1 5
Regional scenarios and activity profiles are summa-rized in the Annex (and in Part II of the Global Plan). The following section outlines the methodology for the scenario-building, summarizes planned DOTS expansion activities across all regions, presents the estimated impact of planned activities on TB control outcomes, and summarizes the estimated cost of country implementation of DOTS expansion activities.
The regional scenarios are indicative and should serve as examples of what could be achieved under “optimistic, yet realistic” assumptions: that is, they try to predict what could happen if DOTS expansion goes well, while accounting for general barriers that are difficult to overcome during the 10-year time-span and that lie outside the domain of DOTS expansion, such as severe health system constraints. The regional scenarios are not implementation plans. Detailed regional and country implementa-tion plans for DOTS expansion are being developed based on the DEWG Strategic Plan.
6.1 Methodology
The DEWG secretariat, in collaboration with partners and WHO regional offices, has developed scenarios for implementation of DOTS expansion activities in seven TB epidemiological regions: (i) Africa, high HIV prevalence (AFR high); (ii) Africa, low HIV prevalence (AFR low); (iii) Americas Region (AMR, Latin America only); (iv) Eastern Mediterranean Region (EMR); (v) Eastern European Region (EEUR); (vi) South-East Asia Region (SEAR); (vii) Western Pacific Region (WPR). In brief, the methodology for the scenario building was:
Step 1. Defining and costing intervention packages
a. The following DEWG activities (complete DOTS coverage, improve quality of DOTS,
6. SUMMARY OF REGIONAL DOTS EXPANSION SCENARIOS
PPM DOTS, community DOTS, PAL, culture services, DST and new diagnostics) were defined as an intervention package including start-up and running activities such as new buildings, equipment, policy and guidelines development, sensitization meetings, training, supervision, and monitoring and evaluation. Intervention packages were adapted to regional and country conditions and needs. Pro-poor strategies were incorporated in all intervention packages.
b. Unit costs specific to each region were developed, which expressed cost per population to be covered by respective activity. To this end, start-up and running costs of each intervention package were estimated using regional data on staff salary scales, cost of equipment, per diem, travel costs, etc. Costs of the intervention packages reflected additional structural and managerial activities required and did not include costs for diagnosis and treatment of patients under the different activities (see below).
Step 2. Estimating the magnitude and pace of scaling up of activities
a. The status of DOTS expansion in countries in 2005 was used as a baseline for this analysis. Required additional activities were identified in relation to the 2005 DOTS expansion status, the achievements in relation to targets in 2005 and the existing barriers for DOTS expansion in 2005.
b. Estimation was made of the magnitude and pace of scale up of activities that could reasonably be expected during 2006–2015, provided sufficient financial resources become available. This analysis aimed to build an “optimistic, yet realistic” scenario for each country, as defined above.
��
DOTS Expansion Working Group S t ra teg ic P lan 2 0 0 6 – 2 0 1 5
��
DOTS Expansion Working Group S t ra teg ic P lan 2 0 0 6 – 2 0 1 5
c. The scale up was expressed in terms of addi-tional population to be covered by respective activity, in relation to the situation in 2005.
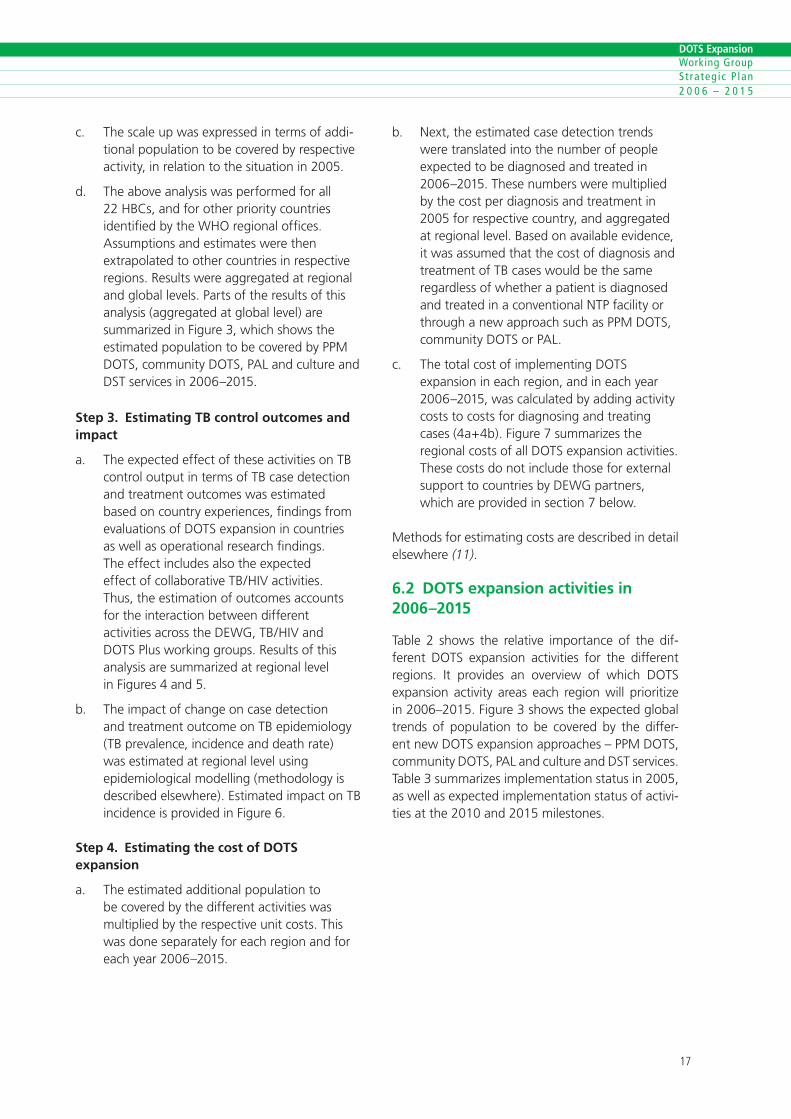
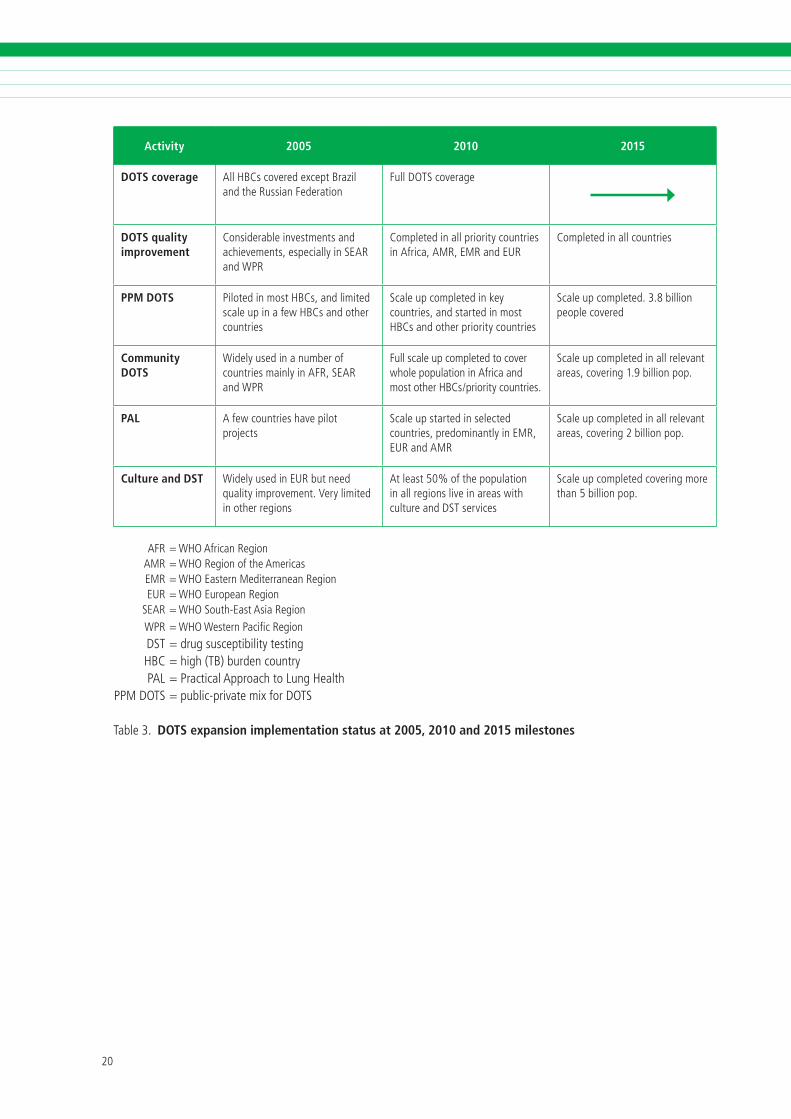
d. The above analysis was performed for all 22 HBCs, and for other priority countries identified by the WHO regional offices. Assumptions and estimates were then extrapolated to other countries in respective regions. Results were aggregated at regional and global levels. Parts of the results of this analysis (aggregated at global level) are summarized in Figure 3, which shows the estimated population to be covered by PPM DOTS, community DOTS, PAL and culture and DST services in 2006–2015.
Step 3. Estimating TB control outcomes and impact
a. The expected effect of these activities on TB control output in terms of TB case detection and treatment outcomes was estimated based on country experiences, findings from evaluations of DOTS expansion in countries as well as operational research findings. The effect includes also the expected effect of collaborative TB/HIV activities. Thus, the estimation of outcomes accounts for the interaction between different activities across the DEWG, TB/HIV and DOTS Plus working groups. Results of this analysis are summarized at regional level in Figures 4 and 5.
b. The impact of change on case detection and treatment outcome on TB epidemiology (TB prevalence, incidence and death rate) was estimated at regional level using epidemiological modelling (methodology is described elsewhere). Estimated impact on TB incidence is provided in Figure 6.
Step 4. Estimating the cost of DOTS expansion
a. The estimated additional population to be covered by the different activities was multiplied by the respective unit costs. This was done separately for each region and for each year 2006–2015.
b. Next, the estimated case detection trends were translated into the number of people expected to be diagnosed and treated in 2006–2015. These numbers were multiplied by the cost per diagnosis and treatment in 2005 for respective country, and aggregated at regional level. Based on available evidence, it was assumed that the cost of diagnosis and treatment of TB cases would be the same regardless of whether a patient is diagnosed and treated in a conventional NTP facility or through a new approach such as PPM DOTS, community DOTS or PAL.
c. The total cost of implementing DOTS expansion in each region, and in each year 2006–2015, was calculated by adding activity costs to costs for diagnosing and treating cases (4a+4b). Figure 7 summarizes the regional costs of all DOTS expansion activities. These costs do not include those for external support to countries by DEWG partners, which are provided in section 7 below.
Methods for estimating costs are described in detail elsewhere (11).
6.2 DOTS expansion activities in 2006–2015
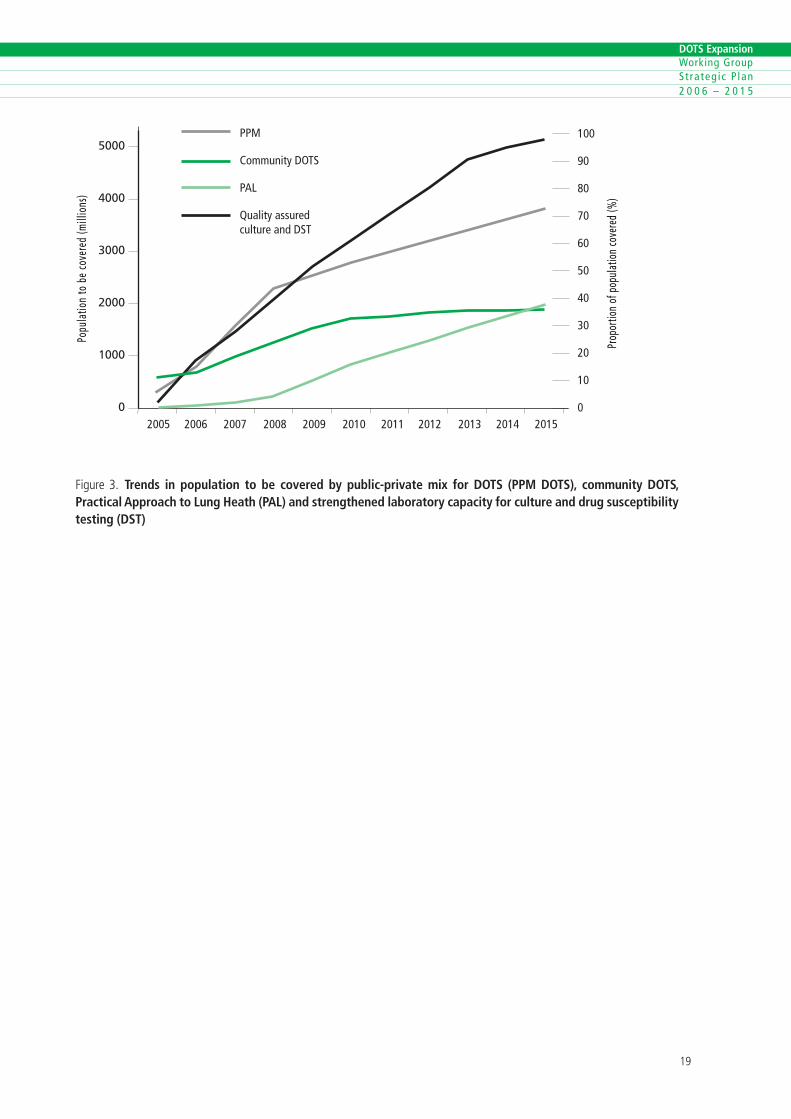
Table 2 shows the relative importance of the dif-ferent DOTS expansion activities for the different regions. It provides an overview of which DOTS expansion activity areas each region will prioritize in 2006–2015. Figure 3 shows the expected global trends of population to be covered by the differ-ent new DOTS expansion approaches – PPM DOTS, community DOTS, PAL and culture and DST services. Table 3 summarizes implementation status in 2005, as well as expected implementation status of activi-ties at the 2010 and 2015 milestones.

��
DOTS Expansion Working Group S t ra teg ic P lan 2 0 0 6 – 2 0 1 5
��
DOTS Expansion Working Group S t ra teg ic P lan 2 0 0 6 – 2 0 1 5
Activity AFR AMR EMR EUR SEAR WPR
Additional DOTS coverage
– + + ++ – –
Additional DOTS quality +++ ++ ++ ++ ++ ++
PPM DOTS + + ++ ++ +++ +++
PAL + ++ ++ ++ ++ +
Community DOTS +++ + + – ++ +
Culture and DST services ++ +++ +++ +++ +++ +++
AFR=WHOAfr�canReg�on AMR=WHOReg�onoftheAmer�cas EMR=WHOEasternMed�terraneanReg�on EUR=WHOEuropeanReg�on SEAR=WHOSouth-EastAs�aReg�on WPR=WHOWesternPac�ficReg�on
Table�. Overview of relevance of the different types of activities related to the DOTS Expansion Working Group, by WHO region
��
DOTS Expansion Working Group S t ra teg ic P lan 2 0 0 6 – 2 0 1 5
��
DOTS Expansion Working Group S t ra teg ic P lan 2 0 0 6 – 2 0 1 5
5000
4000
3000
2000
1000
0 2005 2006 2007 2008 2009 2010 2011 2012 2013 2014 2015
100
90
80
70
60
50
40
30
20
10
0
Prop
ortio
n of
pop
ulat
ion
cove
red
(%)
Popu
latio
n to
be
cove
red
(mill
ions
)
PPM
Community DOTS
PAL
Quality assured culture and DST
F�gure �. Trends in population to be covered by public-private mix for DOTS (PPM DOTS), community DOTS, Practical Approach to Lung Heath (PAL) and strengthened laboratory capacity for culture and drug susceptibility testing (DST)
�0
DOTS Expansion Working Group S t ra teg ic P lan 2 0 0 6 – 2 0 1 5
��
DOTS Expansion Working Group S t ra teg ic P lan 2 0 0 6 – 2 0 1 5
Activity 2005 2010 2015
DOTS coverage AllHBCscoveredexceptBraz�landtheRuss�anFederat�on
FullDOTScoverage
DOTS quality improvement
Cons�derable�nvestmentsandach�evements,espec�ally�nSEARandWPR
Completed�nallpr�or�tycountr�es�nAfr�ca,AMR,EMRandEUR
Completed�nallcountr�es
PPM DOTS P�loted�nmostHBCs,andl�m�tedscaleup�nafewHBCsandothercountr�es
Scaleupcompleted�nkeycountr�es,andstarted�nmostHBCsandotherpr�or�tycountr�es
Scaleupcompleted.�.�b�ll�onpeoplecovered
Community DOTS
W�delyused�nanumberofcountr�esma�nly�nAFR,SEARandWPR
Fullscaleupcompletedtocoverwholepopulat�on�nAfr�caandmostotherHBCs/pr�or�tycountr�es.
Scaleupcompleted�nallrelevantareas,cover�ng�.�b�ll�onpop.
PAL Afewcountr�eshavep�lotprojects
Scaleupstarted�nselectedcountr�es,predom�nantly�nEMR,EURandAMR
Scaleupcompleted�nallrelevantareas,cover�ng�b�ll�onpop.
Culture and DST W�delyused�nEURbutneedqual�ty�mprovement.Veryl�m�ted�notherreg�ons
Atleast�0%ofthepopulat�on�nallreg�onsl�ve�nareasw�thcultureandDSTserv�ces
Scaleupcompletedcover�ngmorethan�b�ll�onpop.
AFR=WHOAfr�canReg�on AMR=WHOReg�onoftheAmer�cas EMR=WHOEasternMed�terraneanReg�on EUR=WHOEuropeanReg�on SEAR=WHOSouth-EastAs�aReg�on WPR=WHOWesternPac�ficReg�on DST=drugsuscept�b�l�tytest�ng HBC=h�gh(TB)burdencountry PAL=Pract�calApproachtoLungHealthPPMDOTS=publ�c-pr�vatem�xforDOTS
Table�. DOTS expansion implementation status at 2005, 2010 and 2015 milestones

�0
DOTS Expansion Working Group S t ra teg ic P lan 2 0 0 6 – 2 0 1 5
��
DOTS Expansion Working Group S t ra teg ic P lan 2 0 0 6 – 2 0 1 5
6.3 Summary of expected TB control outcomes and impact
Case detection and treatment outcomes
If all the proposed activities are implemented ac-cording to the scenario, it is expected that the case detection target will be reached in all regions by 2010, and that case detection will be 80% or above in all regions by 2015 (Figure 4). Case detec-tion is estimated to be the same for sputum smear-negative TB cases and extrapulmonary TB cases, as for new bacteriologically-confirmed cases. The treatment success rate is expected to reach and be sustained at 85% latest from 2010 onwards in all regions (Figure 5).
100
90
80
70
60
50
40
30
20
10
0
%
2003 2005 2010 2015
AFRhigh
AFRlow
AMR
EMR
EUR
SEAR
WPR
F�gure�. Estimated regional case detection trends, new bacteriologically confirmed cases
��
DOTS Expansion Working Group S t ra teg ic P lan 2 0 0 6 – 2 0 1 5
��
DOTS Expansion Working Group S t ra teg ic P lan 2 0 0 6 – 2 0 1 5
100
90
80
70
60
50
40
30
20
10
0
%
AFRhigh AFRlow AMR EMR EUR SEAR WPR
2002
2005
2010
2015
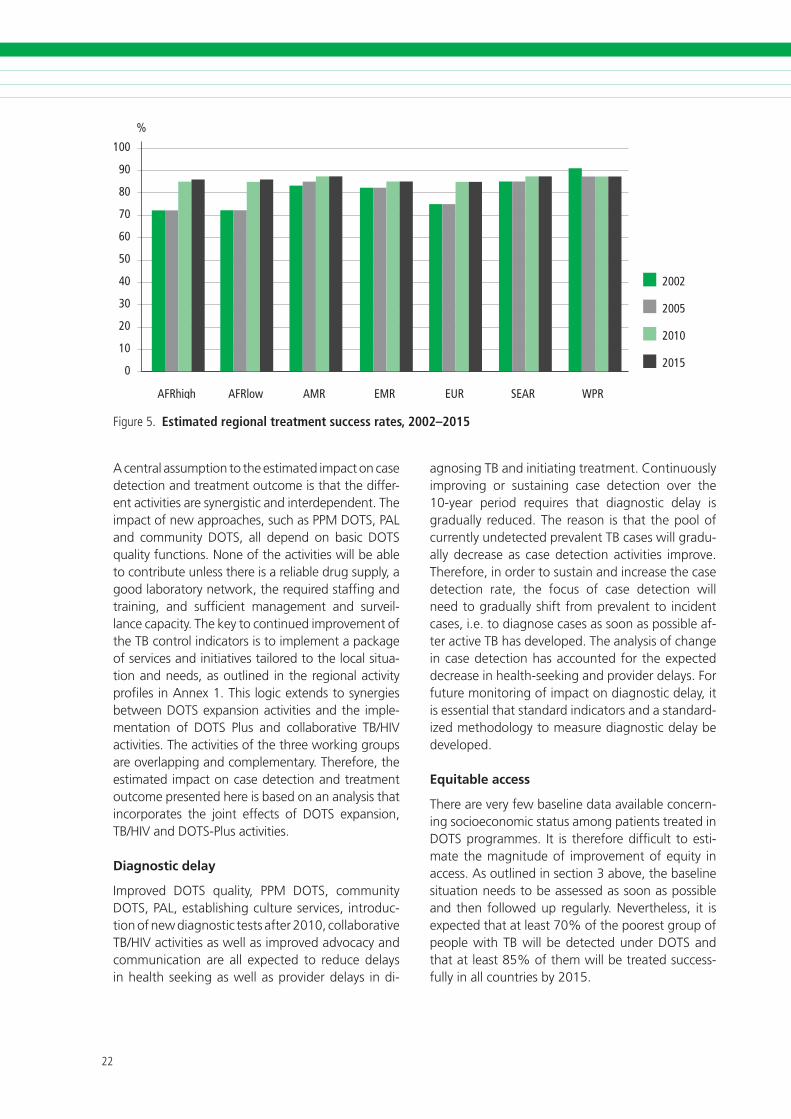
F�gure�. Estimated regional treatment success rates, 2002–2015
A central assumption to the estimated impact on case detection and treatment outcome is that the differ-ent activities are synergistic and interdependent. The impact of new approaches, such as PPM DOTS, PAL and community DOTS, all depend on basic DOTS quality functions. None of the activities will be able to contribute unless there is a reliable drug supply, a good laboratory network, the required staffing and training, and sufficient management and surveil-lance capacity. The key to continued improvement of the TB control indicators is to implement a package of services and initiatives tailored to the local situa-tion and needs, as outlined in the regional activity profiles in Annex 1. This logic extends to synergies between DOTS expansion activities and the imple-mentation of DOTS Plus and collaborative TB/HIV activities. The activities of the three working groups are overlapping and complementary. Therefore, the estimated impact on case detection and treatment outcome presented here is based on an analysis that incorporates the joint effects of DOTS expansion, TB/HIV and DOTS-Plus activities.
Diagnostic delay
Improved DOTS quality, PPM DOTS, community DOTS, PAL, establishing culture services, introduc-tion of new diagnostic tests after 2010, collaborative TB/HIV activities as well as improved advocacy and communication are all expected to reduce delays in health seeking as well as provider delays in di-
agnosing TB and initiating treatment. Continuously improving or sustaining case detection over the 10-year period requires that diagnostic delay is gradually reduced. The reason is that the pool of currently undetected prevalent TB cases will gradu-ally decrease as case detection activities improve. Therefore, in order to sustain and increase the case detection rate, the focus of case detection will need to gradually shift from prevalent to incident cases, i.e. to diagnose cases as soon as possible af-ter active TB has developed. The analysis of change in case detection has accounted for the expected decrease in health-seeking and provider delays. For future monitoring of impact on diagnostic delay, it is essential that standard indicators and a standard-ized methodology to measure diagnostic delay be developed.
Equitable access
There are very few baseline data available concern-ing socioeconomic status among patients treated in DOTS programmes. It is therefore difficult to esti-mate the magnitude of improvement of equity in access. As outlined in section 3 above, the baseline situation needs to be assessed as soon as possible and then followed up regularly. Nevertheless, it is expected that at least 70% of the poorest group of people with TB will be detected under DOTS and that at least 85% of them will be treated success-fully in all countries by 2015.

��
DOTS Expansion Working Group S t ra teg ic P lan 2 0 0 6 – 2 0 1 5
��
DOTS Expansion Working Group S t ra teg ic P lan 2 0 0 6 – 2 0 1 5
Reduction in financial burden for patients
Available data from South-East Asia suggest that shifting TB patients from out-of pocket financed non-DOTS to DOTS treatment reduces indirect and direct costs of care to patients by US$ 50–100 dur-ing the course of treatment. This is more than the annual income of many TB patients. It is estimated that about 17 million people with TB will be put on treatment under DOTS in South-East Asia dur-ing 2006–2015. Assuming that about half of them would have to pay out-of-pocket for non-DOTS treatment had they not been treated under DOTS, the total reduction in financial burden for patients through subsidized treatment under DOTS would be about US$ 850 million in SEAR. This direct financial alleviation for mostly poor patients is equivalent to 16% of the total cost for DOTS expansion in SEAR. This does not include the financial benefits for patients and society at large related to the improved productivity resulting from curing TB.
Epidemiological impact
The estimated trends of TB incidence rates for the different regions are shown in Figure 6, which pres-ents predicted trends for three different scenarios: (i) no DOTS; (ii) sustained DOTS implementation at the 2005 level (no new activities or investments); and (iii) implementation of activities according to the Global Plan 2006–2015, including DOTS expan-sion, as well as collaborative TB/HIV and DOTS-Plus activities. Trends for prevalence and death rate for each region are shown in Annex 1.
Under the present scenario, all regions are expected to see trends in incidence, prevalence and death rate reduced rapidly over the next 10 years as a result of the various TB control activities. The MDG target to “have halted by 2015 and begun to reverse the incidence” of TB will be met in all regions.
According to these estimates, the targets to halve prevalence and deaths will be achieved in Latin American, Eastern Mediterranean, South-East Asia and Western Pacific regions and for all regions com-bined (Figure 7). However, these targets will not be achieved in the African and Eastern European re-gions despite declines in incidence, prevalence and deaths. An important reason is that these targets are measured with 1990 as a baseline, and these re-
gions had an increasing trend in the 1990s that will not be fully compensated for during 2006–2015.
It should be noted that these are the results of epidemiological modelling, which does not include any assumptions about trend changes in poverty re-duction and the related impact on the TB epidemic. Therefore, the current scenarios are neutral to any impact of general development strategies to reach other MDGs, in particular MDG1. Prospects of reaching the TB-related MDG targets in Africa and Eastern Europe early are much better if there are considerable socioeconomic improvements. As a consequence, the need for socioeconomic develop-ment should be advocated as a crucial component of long-term and sustainable TB control. Similarly, if new preventive, diagnostic and/or treatment tools become available, this may have dramatic effects on the TB epidemic.
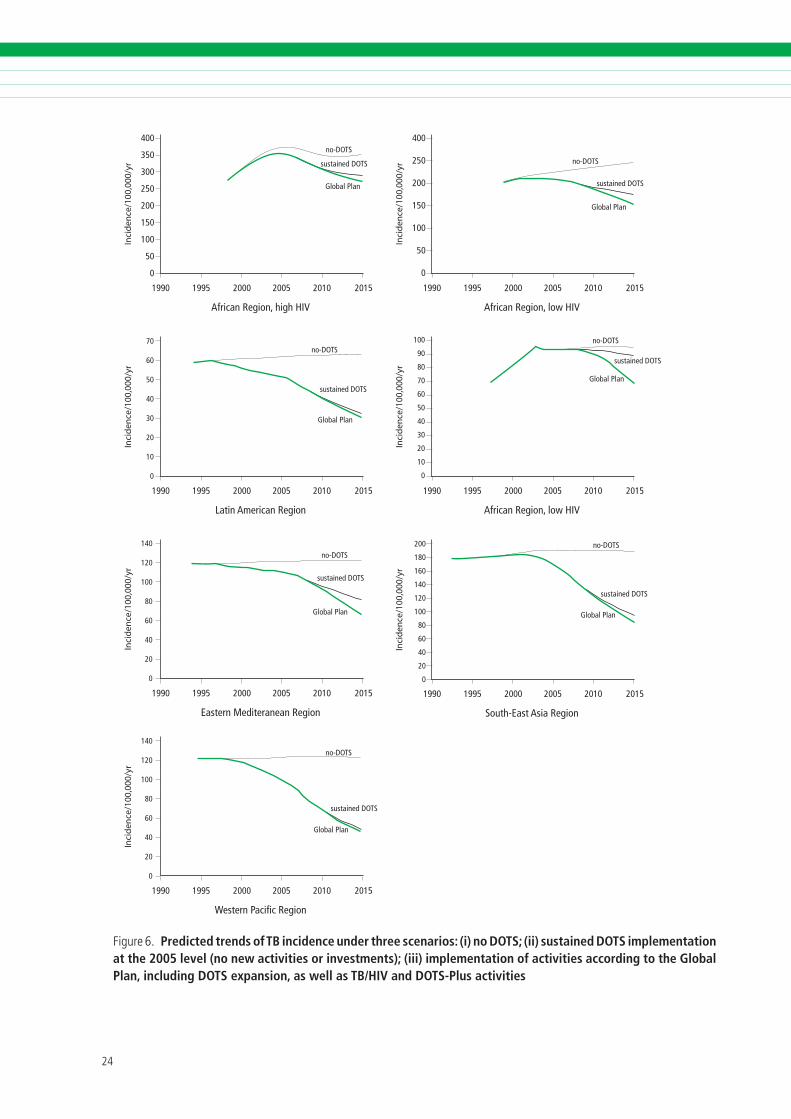
��
DOTS Expansion Working Group S t ra teg ic P lan 2 0 0 6 – 2 0 1 5
��
DOTS Expansion Working Group S t ra teg ic P lan 2 0 0 6 – 2 0 1 5
Inci
den
ce/1
00,0
00/y
r400
350
300
250
200
150
100
50
0
1990 1995 2000 2005 2010 2015
no-DOTS
sustained DOTS
Global Plan
African Region, high HIV
Inci
den
ce/1
00,0
00/y
r
1990 1995 2000 2005 2010 2015
no-DOTS
sustained DOTS
Global Plan
Latin American Region
Inci
den
ce/1
00,0
00/y
r
400
250
200
150
100
50
0
1990 1995 2000 2005 2010 2015
no-DOTS
sustained DOTS
Global Plan
African Region, low HIV
Inci
den
ce/1
00,0
00/y
r
1990 1995 2000 2005 2010 2015
no-DOTS
sustained DOTS
Global Plan
African Region, low HIV
70
60
50
40
30
20
10
0
Inci
den
ce/1
00,0
00/y
r
1990 1995 2000 2005 2010 2015
no-DOTS
sustained DOTS
Global Plan
Eastern Mediteranean Region
140
120
100
80
60
40
20
0
100
90
80
70
60
50
40
30
20
10
0
Inci
den
ce/1
00,0
00/y
r
1990 1995 2000 2005 2010 2015
no-DOTS
sustained DOTS
Global Plan
South-East Asia Region
Inci
den
ce/1
00,0
00/y
r
1990 1995 2000 2005 2010 2015
no-DOTS
sustained DOTS
Global Plan
Western Pacific Region
140
120
100
80
60
40
20
0
200
180
160
140
120
100
80
60
40
20
0
F�gure�. Predicted trends of TB incidence under three scenarios: (i) no DOTS; (ii) sustained DOTS implementation at the 2005 level (no new activities or investments); (iii) implementation of activities according to the Global Plan, including DOTS expansion, as well as TB/HIV and DOTS-Plus activities
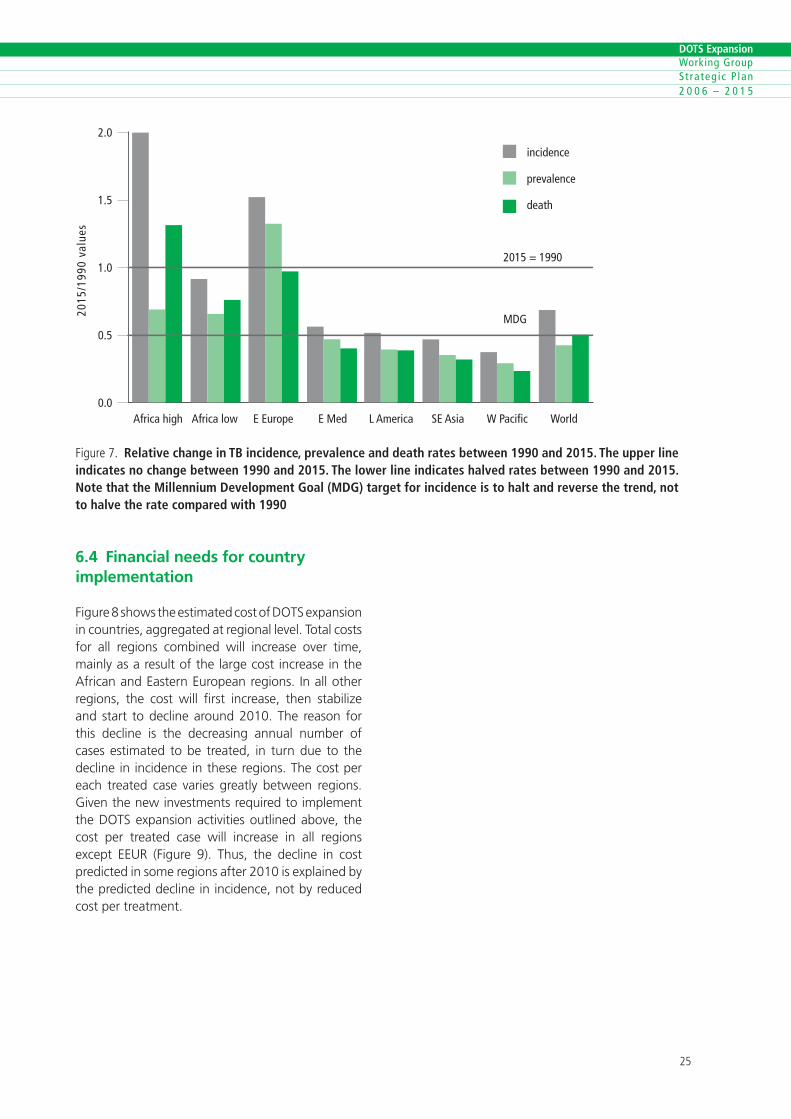
��
DOTS Expansion Working Group S t ra teg ic P lan 2 0 0 6 – 2 0 1 5
��
DOTS Expansion Working Group S t ra teg ic P lan 2 0 0 6 – 2 0 1 5
2.0
1.5
1.0
0.5
0.0
2015
/199
0 va
lues
incidence
prevalence
death
Africa high Africa low E Europe E Med L America SE Asia W Pacific World
2015 = 1990
MDG
F�gure�. Relative change in TB incidence, prevalence and death rates between 1990 and 2015. The upper line indicates no change between 1990 and 2015. The lower line indicates halved rates between 1990 and 2015. Note that the Millennium Development Goal (MDG) target for incidence is to halt and reverse the trend, not to halve the rate compared with 1990
6.4 Financial needs for country implementation
Figure 8 shows the estimated cost of DOTS expansion in countries, aggregated at regional level. Total costs for all regions combined will increase over time, mainly as a result of the large cost increase in the African and Eastern European regions. In all other regions, the cost will first increase, then stabilize and start to decline around 2010. The reason for this decline is the decreasing annual number of cases estimated to be treated, in turn due to the decline in incidence in these regions. The cost per each treated case varies greatly between regions. Given the new investments required to implement the DOTS expansion activities outlined above, the cost per treated case will increase in all regions except EEUR (Figure 9). Thus, the decline in cost predicted in some regions after 2010 is explained by the predicted decline in incidence, not by reduced cost per treatment.
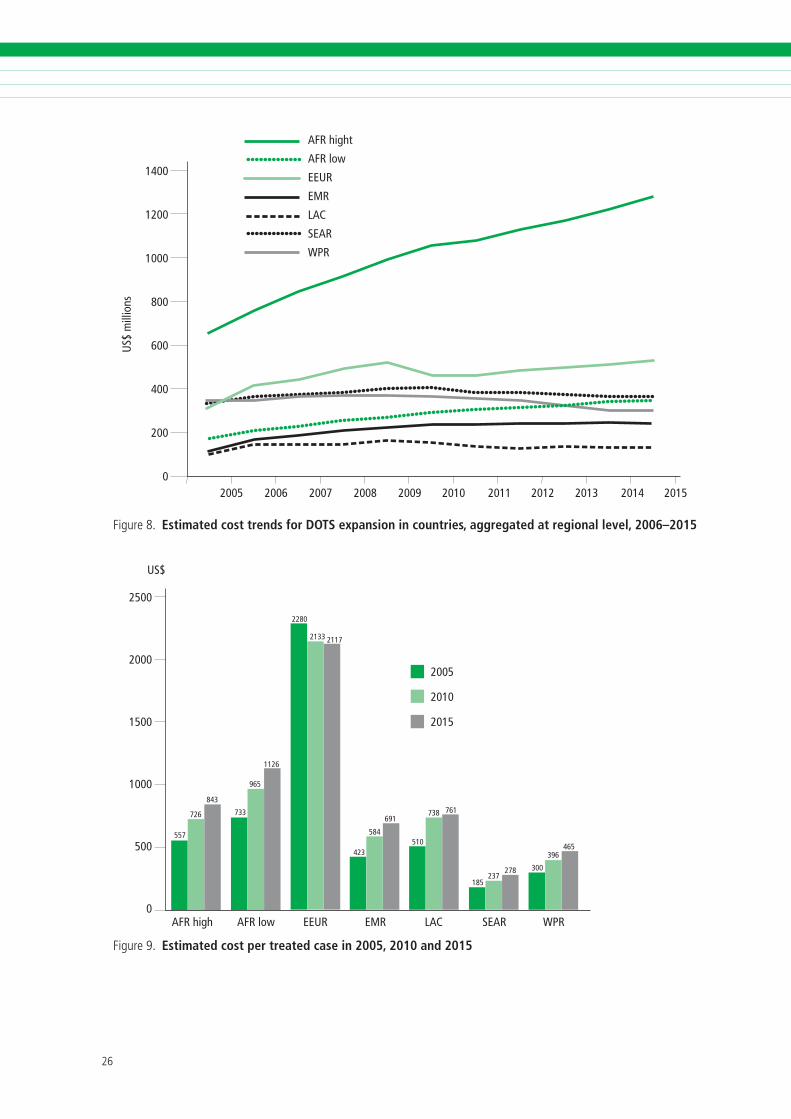
��
DOTS Expansion Working Group S t ra teg ic P lan 2 0 0 6 – 2 0 1 5
��
DOTS Expansion Working Group S t ra teg ic P lan 2 0 0 6 – 2 0 1 5
1400
1200
1000
800
600
400
200
0
US$
mill
ions
2005 2006 2007 2008 2009 2010 2011 2012 2013 2014 2015
AFR hight
AFR low
EEUR
EMR
LAC
SEAR
WPR
F�gure�. Estimated cost trends for DOTS expansion in countries, aggregated at regional level, 2006–2015
2500
2000
1500
1000
500
0
US$
AFR high AFR low EEUR EMR LAC SEAR WPR
465396
300278237
185
510
738 761691
584
423
21172133
2280
1126
965
733
843
726
557
2005
2010
2015
F�gure�. Estimated cost per treated case in 2005, 2010 and 2015
��
DOTS Expansion Working Group S t ra teg ic P lan 2 0 0 6 – 2 0 1 5
��
DOTS Expansion Working Group S t ra teg ic P lan 2 0 0 6 – 2 0 1 5
7.1 Responsibilities
In order to assist countries in implementing the ac-tivities outlined above, DEWG and its partners will focus on the following three main areas of activity.
Country support
a. Strategic and technical support to countries. Strengthening DOTS and scaling up new approaches will need intensified technical support to countries. This includes additional help in preparing country and regional plans to reach the MDGs, preparation of proposals for funding TB control and continuous technical assistance for programme implementation. Current achievements to expand DOTS coverage have required considerable technical and financial support from a wide range of partners within DEWG. This support needs to be sustained and further strengthened. The unprecedented amount of resources made available by bilateral and multilateral agencies, in particular the Global Fund to Fight AIDS, Tuberculosis and Malaria (GFATM), has made the recent rapid expansion possible. However, it has also amplified the request for technical support for planning, implementation, monitoring and evaluation of interventions. Strategic support will be linked to efforts to help boost political commitment in countries, among donors and within international agencies in order to increase resources for TB control.
b. Capacity building at global and regional levels. Building capacity at global and regional levels includes human resource development plans, training material, and training of trainers and of consultants through regional and global training courses. In order to utilize existing surveillance data more efficiently, efforts will be made to increase analytical capacity at regional, country and local levels.
Monitoring DOTS expansion and MDG indicators
a. Monitoring progress towards targets. Monitoring and evaluation include implementation of the standard recording and reporting system and analysis of the data that it generates. Special efforts and new indicators and tools will be needed to monitor and evaluate the implementation of new approaches as well as progress towards achieving the MDGs. To this end, countries will be assisted in implementing TB prevalence surveys or equivalent studies. Furthermore, as discussed in section 3, new indicators and methods need to be developed in order to specifically measure the impact of DEWG activities on equity in access, diagnostic delay and financial protection for the poor.
b. Monitoring plan implementation involves monitoring of the extent to which countries implement TB control plans developed in line with the Global Plan.
c. Financial monitoring including tracking financial flows and estimating sources and expenditure areas within NTP budgets.
Operational research and policy development
Operational research and policy development in-clude continued testing of innovative approaches, facilitating assessment of new tools and analysis of barriers and enablers for scaling up initiatives. Such evaluations and research will inform the develop-ment of global strategy documents and guidelines. Approaches to improving access to high-quality TB care, including PPM DOTS, community DOTS and PAL, are still at an early stage of scale up in most countries. Continued documentation and evaluation of barriers and enablers for scaling up these initia-tives are required. More in-depth analyses of hard-to-reach segments of the population and barriers
7. DEWG SUPPORT TO COUNTRY IMPLEMENTATION
��
DOTS Expansion Working Group S t ra teg ic P lan 2 0 0 6 – 2 0 1 5
��
DOTS Expansion Working Group S t ra teg ic P lan 2 0 0 6 – 2 0 1 5
to access health services are needed. DEWG will play an important role in setting the agenda and supporting operational research in this field.
DOTS programmes will have to adapt to accommo-date the expansion of collaborative TB/HIV activities and treatment of MDR-TB. Furthermore, during the coming 10 years, it is expected that new tools to prevent, diagnose and treat TB will become avail-able. DOTS programmes will be the main vehicle for introduction of these new tools. Effective strategies for the adaptation of DOTS to new approaches and innovations need to be developed based on careful documentation and evaluation of new initiatives and pilot projects.
7.2 Priority countries
DEWG will continue to prioritize those countries that constitute the bulk of the global TB burden – the HBCs. Currently, DEWG is targeting 22 HBCs that together make up 80% of the global burden. In the next 10 years, the classification of HBCs may change according to changing TB epidemiology as well as changing needs for technical support.
Furthermore, each of the WHO regional offices has identified priority countries, which include the HBCs, as well as other countries with high TB incidence or special needs for support, e.g. high HIV prevalence, high MDR-TB prevalence or special health system challenges. These classifications may also change over time.
It is clear that the African and Eastern European regions will require special attention during 2006–2015, not only from DEWG but also from all other Stop TB Partnership working groups. This is particularly true for Africa. Among the current 22 HBCs, 9 (41%) are in Africa. It is possible that this proportion will increase in the future. As is evident from the scenario described above, the cost of implementing DOTS in Africa and Eastern Europe will be much higher than in other regions, and will increase, while several other regions will see a fall in cost after around 2010. This is a strong argument for increasing investment in technical assistance to African countries to ensure that new investments are used optimally.
However, an intensified effort to provide support to Africa and Eastern Europe should not divert atten-tion away from other regions. Hard-won successes in large HBCs such as China and India need to be sustained. Moreover, support to all HBCs should be increased to maintain the positive momentum and efforts intensified to improve access and qual-ity. The challenges are great in these countries to ensure that high-quality DOTS reaches remote and disadvantaged areas as well as special problem areas such as the growing urban slums.
7.3 Structure for delivering support
Modes of delivery
The mechanisms of delivering DEWG activities include:
• In-country support through long-term national and international TB experts supported directly by DEWG partners
• Regional and country TB advisers in regional/country offices of WHO and partners based in regions and countries
• Country programme review and monitoring missions
• Ad hoc missions for technical assistance in specific activity areas
• Meetings of NTP managers
• Meetings of regional TB advisers
• Dissemination of tools, guidelines and generic training materials
• Regional and global training workshops
• Global consultations on specific technical issues
• In-house and commissioned operational research
• Research seminars, workshops and conferences
• Annual meetings of DEWG and its subgroups and regular meetings of their core teams.

��
DOTS Expansion Working Group S t ra teg ic P lan 2 0 0 6 – 2 0 1 5
��
DOTS Expansion Working Group S t ra teg ic P lan 2 0 0 6 – 2 0 1 5
DEWG structure
The working group is composed of a core team and four subgroups (Figure 10). Members have the following terms of reference:
• Ensure that countries, starting with HBCs, develop, implement and sustain comprehensive TB control using the DOTS strategy to achieve the global targets and MDGs with the collaboration of partners.
• Review the status and measure progress in countries, share experiences between countries and stimulate action when necessary.
• Promote the documentation and dissemination of best practices and lessons learnt.
• Ensure the involvement of the private medical sector, the community and other sectors in TB control.
• Liaise with and support the work of the DEWG subgroups.
• Ensure that TB control efforts are included in, and contribute to, broader health sector and poverty reduction strategies.
• Liaise with the other Stop TB working groups.
Members. Working group members are HBC representatives and partner institutions, including financial and technical agencies. Institutions and their representatives as well as invited experts will provide DEWG with technical advice and input on DOTS expansion. Membership is open to any institution or agency that supports the goals of the working group. Additional members may be invited based on their willingness to collaborate and their potential of contribution to the initiative.
Chair. The chair serves for a renewable period of two years. A nominating committee is set up prior to the election. Its aim is to re-examine the selection criteria and review the nominations for the chair in order to shortlist the candidates. DEWG members will elect the chair. The terms of reference of the Chair are:
• To define, with the DEWG core team and the secretariat, the key areas of work and the direction of the DEWG.
• To coordinate the activities with the chairs of the DEWG subgroups.
• To convene the DEWG on an annual basis and chair the meeting.
• To convene and chair the teleconferences and meetings of the DEWG core team.
Secretariat. The secretariat, which is answerable to the DEWG, is hosted by WHO and operates under the WHO system within the Strategy and Operations unit of the Stop TB Department. Its responsibilities include: organizing DEWG and core group meet-ings, preparing agendas and relevant documents in consultation with the Chair and members of the core group, preparing and distributing the reports of the meetings; monitoring the implementation of the recommendations, and managing resources provided for the functioning of the group.
Financing. Financing of the Working Group secre-tariat functions at WHO will be the responsibility of WHO, which will seek assistance, where appropri-ate, from partner institutions. Travel expenses for participation in meetings of the DEWG will be shared between WHO and partner institutions, depending on the availability of funds. Expansion of DOTS will be the responsibility of countries, with support provided by the implementing institutions/agencies and may be assisted and facilitated by WHO.
Meetings. DEWG meetings will be held at least once a year and will be convened by the chair and facilitated by WHO. Decisions will be taken, as far as possible, by consensus; otherwise by majority vote. However, scientific questions will not be decided upon by vote. If members cannot agree, the report of the meeting will reflect the diversity of views on the scientific question concerned.
Core team. The core team was established at the request of the secretariat with the aim of facilitat-ing and accelerating decision-making and setting the strategic directions of DEWG. The core team is composed of three permanent technical members (Union, KNCV Tuberculosis Foundation and WHO) and non-permanent members serving for two years. It includes country representatives and major agen-cies working in TB control. The core group will hold
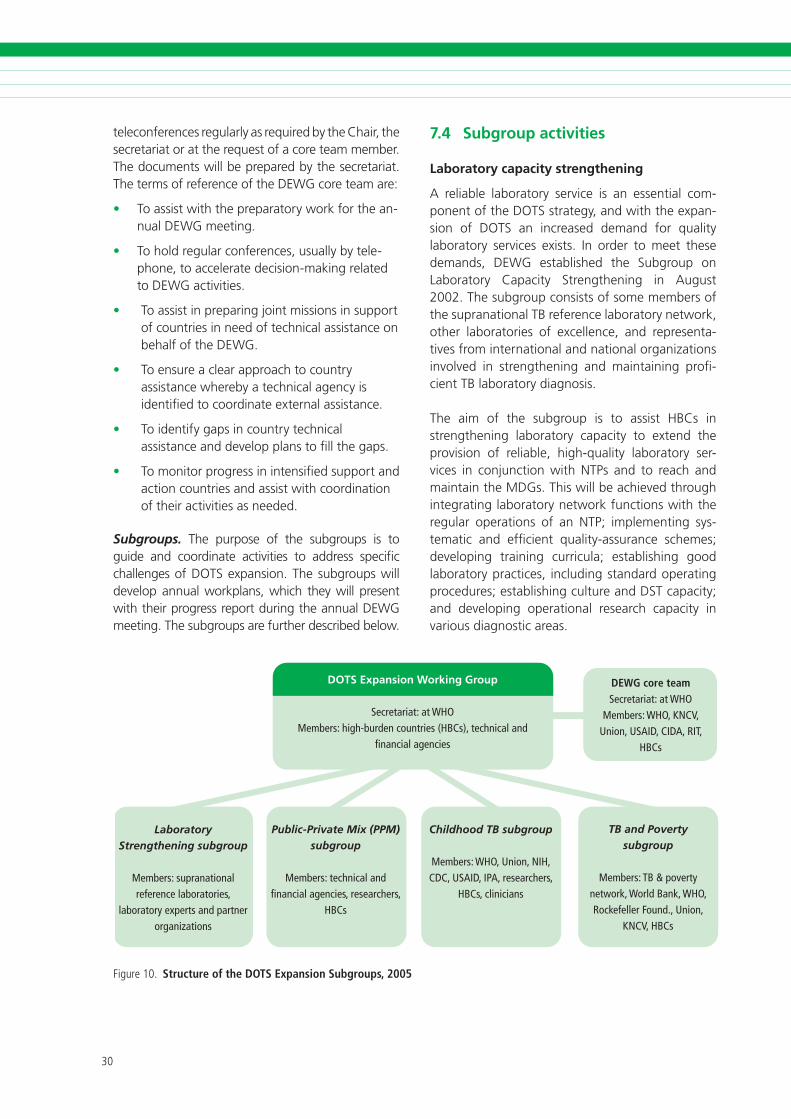
�0
DOTS Expansion Working Group S t ra teg ic P lan 2 0 0 6 – 2 0 1 5
��
DOTS Expansion Working Group S t ra teg ic P lan 2 0 0 6 – 2 0 1 5
teleconferences regularly as required by the Chair, the secretariat or at the request of a core team member. The documents will be prepared by the secretariat. The terms of reference of the DEWG core team are:
• To assist with the preparatory work for the an-nual DEWG meeting.
• To hold regular conferences, usually by tele-phone, to accelerate decision-making related to DEWG activities.
• To assist in preparing joint missions in support of countries in need of technical assistance on behalf of the DEWG.
• To ensure a clear approach to country assistance whereby a technical agency is identified to coordinate external assistance.
• To identify gaps in country technical assistance and develop plans to fill the gaps.
• To monitor progress in intensified support and action countries and assist with coordination of their activities as needed.
Subgroups. The purpose of the subgroups is to guide and coordinate activities to address specific challenges of DOTS expansion. The subgroups will develop annual workplans, which they will present with their progress report during the annual DEWG meeting. The subgroups are further described below.
DOTS Expansion Working Group
Secretariat: at WHOMembers: high-burden countries (HBCs), technical and
financial agencies
Laboratory Strengthening subgroup
Members: supranational reference laboratories,
laboratory experts and partner organizations
Public-Private Mix (PPM) subgroup
Members: technical and financial agencies, researchers,
HBCs
Childhood TB subgroup
Members: WHO, Union, NIH, CDC, USAID, IPA, researchers,
HBCs, clinicians
TB and Poverty subgroup
Members: TB & poverty network, World Bank, WHO, Rockefeller Found., Union,
KNCV, HBCs
DEWG core teamSecretariat: at WHO
Members: WHO, KNCV, Union, USAID, CIDA, RIT,
HBCs
F�gure�0. Structure of the DOTS Expansion Subgroups, 2005
7.4 Subgroup activities
Laboratory capacity strengthening
A reliable laboratory service is an essential com-ponent of the DOTS strategy, and with the expan-sion of DOTS an increased demand for quality laboratory services exists. In order to meet these demands, DEWG established the Subgroup on Laboratory Capacity Strengthening in August 2002. The subgroup consists of some members of the supranational TB reference laboratory network, other laboratories of excellence, and representa-tives from international and national organizations involved in strengthening and maintaining profi-cient TB laboratory diagnosis.
The aim of the subgroup is to assist HBCs in strengthening laboratory capacity to extend the provision of reliable, high-quality laboratory ser-vices in conjunction with NTPs and to reach and maintain the MDGs. This will be achieved through integrating laboratory network functions with the regular operations of an NTP; implementing sys-tematic and efficient quality-assurance schemes; developing training curricula; establishing good laboratory practices, including standard operating procedures; establishing culture and DST capacity; and developing operational research capacity in various diagnostic areas.
�0
DOTS Expansion Working Group S t ra teg ic P lan 2 0 0 6 – 2 0 1 5
��
DOTS Expansion Working Group S t ra teg ic P lan 2 0 0 6 – 2 0 1 5
Activities
• Assessment of the laboratory network and evaluation and formulation of recommendations for improvement
• Monitoring the outcome of the assessment missions and the achievement of the NTP/national reference laboratory
• Technical assistance for developing and implementation of country workplans to improve capacity and performance of TB diagnostic services including culture and DST
• Coordinate operational research to introduce/scale up transfer of innovative techniques and improve performance of currently used technologies in collaboration with partners in the Working Group on New TB Diagnostics
• Assistance in designing a country-specific external quality assurance programme
• Standardization, development and revision of documents, training materials and guidelines (for sputum smear microscopy, culture and DST)
• Advocacy for improving collaboration between the NTP and the NRL in planning, budgeting and implementing activities
• Conduct annually two TB laboratory manage-ment training sessions for heads of the NRL
• Ensure that the necessary funds for improving the laboratory network performance are included in grant proposals
• Organize the annual meeting of the subgroup to formulate the workplan for the upcoming year, outlining specific activities and technical assistance measures undertaken to strengthen the capacity of the TB laboratory network.
PPM DOTS
The PPM DOTS subgroup consists of NTP represen-tatives, private sector providers, technical agencies, donors, academicians, and WHO country and regional PPM DOTS focal points. Since its creation in 2002, the subgroup has coordinated operational research and developed PPM DOTS policies and tools based on evaluated country initiatives. It has
helped countries to develop national policies and operational guidelines and has provided technical assistance for the implementation, scale up and evaluation of PPM DOTS.
Over the coming years, the subgroup will continue to coordinate operational research and help evaluate ongoing initiatives in order to refine PPM DOTS poli-cies and tools. It will work towards full integration of PPM DOTS into regional and country TB control strategies, included national human resource plans. As PPM DOTS is scaled up, much more technical support to countries will be needed. The subgroup will therefore work to increase the capacity to provide technical assistance at global, regional and country levels. It will intensify efforts to implement PPM DOTS with an equity focus, by targeting public and private providers that are utilized by the poor and continuing to assess the impact of PPM DOTS on equity in access and financial protection for the poor.
Main activities
• Support countries to incorporate PPM DOTS in national TB control plans to achieve MDGs
• Technical assistance for developing, implementing and scaling up PPM DOTS
• Monitoring and evaluating approaches to PPM DOTS scale up in countries
• Facilitate and conduct operational research on selected issues
• Sharing of processes and outcomes of scaling up PPM DOTS in diverse country settings
• Assistance to develop training strategies for PPM DOTS
• Advocacy for PPM DOTS through participation in relevant national, regional and global meetings
• Organization of the annual global meetings of the PPM DOTS Subgroup
• Organizing of biannual regional PPM DOTS meetings
• Assistance in developing grant proposals for scaling up PPM DOTS.

��
DOTS Expansion Working Group S t ra teg ic P lan 2 0 0 6 – 2 0 1 5
��
DOTS Expansion Working Group S t ra teg ic P lan 2 0 0 6 – 2 0 1 5
TB and Poverty
Since 2004, the subgroup has served as the plat-form for innovative implementation and sharing of experiences on TB and poverty. It aims to accelerate the expansion of best practice to better meet the needs of the poor and to help achieve, sustain and exceed the global target of 70% TB case detection. The Network for Action on TB and Poverty is the executive arm of the subgroup, with its secretariat based in Lilongwe (Malawi). Initially, the network has a regional focus on Africa, which will expand based on the lessons learnt during the first phase.
The subgroup and the network have the following objectives:
• To improve access of the poorest and marginalized populations to high-quality TB care and control, resulting in higher case detection and cure rates.
• To assist with mainstreaming pro-poor approaches in TB control.
• To foster research to inform operations and policy on TB and poverty.
• To advocate for pro-poor approaches in TB control through innovative dissemination.
• To initiate and maintain effective linkages with other pro-poor approaches and funding in the wider arena of the health sector as a whole.
Functions and activities
• To appraise and approve, on the basis of actual available funding or firm pledges, the annual workplans and budgets for subgroup/network activities as submitted by the Secretariat.
• To appraise and endorse proposals from implementing stakeholders in countries for innovative activities that aim to improve access by the poor to TB care and control that have been submitted to the Secretariat for support.
• To periodically appraise the progress of the subgroup/network.
• To liaise with donor agencies and other financial stakeholders regarding resource mobilization and reporting.
• To arrange for the external evaluation of the performance of the subgroup/network and the Secretariat two years after its official launch.
Childhood TB
The subgroup works to decrease the global burden of mortality and morbidity caused by TB in children through ensuring that the care of children with TB is mainstreamed entirely within the routine activi-ties of NTPs. This is done through assisting NTPs, technical partners and the Stop TB working groups to explicitly address in their plans issues concern-ing diagnosis, treatment and drug formulations for childhood TB.
Activities
• Develop, and promote the implementation of guidelines for NTPs on promoting the incorporation of childhood TB coverage as part of routine NTP activities.
• Promote the mobilization of human resources for the implementation of the above guidelines as part of routine NTP operations.
• Advise on policy development regarding case-finding and treatment of children with TB, contact tracing of children at high risk of TB for preventive TB treatment, and including all childhood TB cases in routine NTP recording and reporting activities.
• Promote research in the fields of epidemiology, health policy, systems and services and of development of new tools (diagnostics, drugs and vaccines).
• Promote the mainstreaming of childhood TB throughout the activities of the Stop TB Partnership, including activities concerning HIV-related TB, drug-resistant TB, laboratory diagnosis and anti-TB drug formulation and packaging.
��
DOTS Expansion Working Group S t ra teg ic P lan 2 0 0 6 – 2 0 1 5
��
DOTS Expansion Working Group S t ra teg ic P lan 2 0 0 6 – 2 0 1 5
7.5 Financial resource requirements for country support
Table 4 outlines the estimated budget needs for country support by partners in 2006–2015 under the heading “External agency needs”. These needs include running costs of DEWG and its subgroups, as well as costs of operations and staff of DEWG partners, including staff costs of partners in regions and countries. The budget estimates for “technical assistance” include costs for technical assistance for collaborative TB/HIV activities as well as DOTS-Plus for MDR-TB. The reason is that technical staff, especially in regions and countries, will share their time for various activities under the different work-ing groups. Furthermore, cross-cutting technical assistance for activities under the different working groups will be coordinated within and between partner organizations in order to improve efficiency and avoid duplication of work.
The table also provides the financial needs of all countries in the seven regions for DOTS expansion (aggregated at regional level), which are presented under “Country needs”. These include the costs of activities outlined above in Chapter 6.
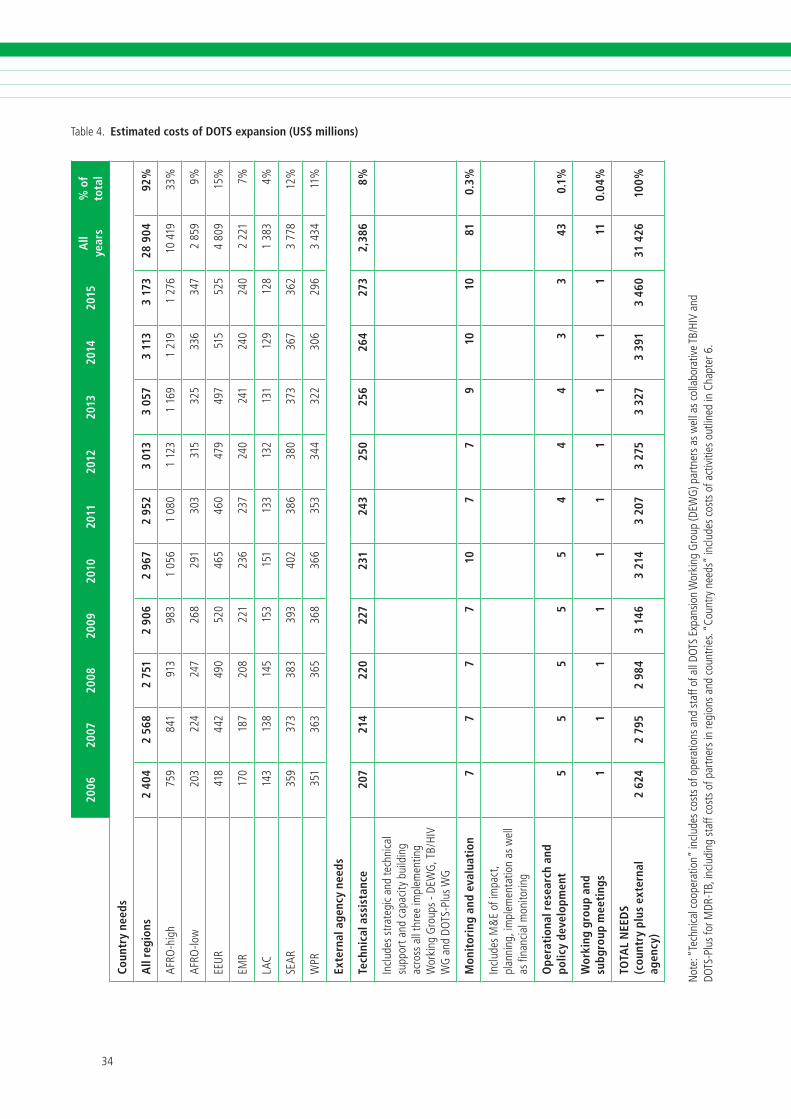
��
DOTS Expansion Working Group S t ra teg ic P lan 2 0 0 6 – 2 0 1 5
��
DOTS Expansion Working Group S t ra teg ic P lan 2 0 0 6 – 2 0 1 5
2006
2007
2008
2009
2010
2011
2012
2013
2014
2015
All
year
s%
of
tota
l
Coun
try
need
s
All
regi
ons
2 40
42
568
2 75
12
906
2 96
72
952
3 01
33
057
3 11
33
173
28 9
0492
%
AFRO
-h�g
h��
���
���
���
��
0��
�0�
0�
���
���
��
���
���
��0
���
��%
AFRO
-low
�0�
���
���
���
���
�0�
���
���
���
���
���
��%
EEU
R��
���
���
0��
0��
���
0��
���
���
���
��
�0�
��%
EMR
��0
���
�0�
���
���
���
��0
���
��0
��0
���
��%
LAC
���
���
���
���
���
���
���
���
���
���
���
��%
SEAR
���
���
���
���
�0�
���
��0
���
���
���
���
���
%
WPR
���
���
���
���
���
���
���
���
�0�
���
���
���
%
Exte
rnal
age
ncy
need
s
Tech
nica
l ass
ista
nce
207
214
220
227
231
243
250
256
264
273
2,38
68%
incl
udes
stra
teg�
can
dte
chn�
cal
supp
orta
ndc
apac
�tyb
u�ld
�ng
acro
ssa
llth
ree
�mpl
emen
t�ng
Wor
k�ng
Gro
ups
-DEW
G,T
B/Hi
VW
Ga
ndD
OTS
-Plu
sW
G
Mon
itor
ing
and
eval
uati
on7
77
710
77
910
1081
0.3%
incl
udes
M&
Eof
�mpa
ct,
plan
n�ng
,�m
plem
enta
t�on
asw
ell
asfi
nanc
�alm
on�to
r�ng
Ope
rati
onal
res
earc
h an
d po
licy
deve
lopm
ent
55
55
54
44
33
430.
1%
Wor
king
gro
up a
nd
subg
roup
mee
ting
s1
11
11
11
11
111
0.04
%
TOTA
L N
EED
S
(cou
ntry
plu
s ex
tern
al
agen
cy)
2 62
42
795
2 98
43
146
3 21
43
207
3 27
53
327
3 39
13
460
31 4
2610
0%
Not
e:“
Tech
n�ca
lcoo
pera
t�on”
�nclu
desc
osts
ofo
pera
t�ons
and
staf
fofa
llDO
TSE
xpan
s�on
Wor
k�ng
Gro
up(D
EWG
)par
tner
sasw
ella
scol
labo
rat�v
eTB
/HiV
and
DO
TS-P
lus
forM
DR-T
B,�n
clud�
ngs
taff
cost
sof
par
tner
s�n
reg�
ons
and
coun
tr�es
.“Co
untry
nee
ds”
�nclu
des
cost
sof
act
�v�t�
eso
utl�n
ed�n
Cha
pter
�.
Table�. Estimated costs of DOTS expansion (US$ millions)
��
DOTS Expansion Working Group S t ra teg ic P lan 2 0 0 6 – 2 0 1 5
��
DOTS Expansion Working Group S t ra teg ic P lan 2 0 0 6 – 2 0 1 5
1. Stop TB Partnership. The Global Plan to Stop TB, 2006–2015. Geneva, World Health Organization, 2006 (WHO/HTM/STB/2006.35).
2. Stop TB Partnership. Global Plan to Stop TB. Geneva, World Health Organization, 2001 (WHO/CDS/STB/2001.16).
3. Global DOTS Expansion Plan: progress in TB control in high-burden countries 2001 – one year after the Amsterdam ministerial conference. Geneva, World Health Organization, 2001 (WHO/CDS/STB/2001.11).
4. Global tuberculosis control: surveillance, planning, financing. WHO report 2006. Geneva, World Health Organization, 2006 (WHO/HTM/TB/2006.362).
5. Tuberculosis Coalition for Technical Assistance. International standards for tuberculosis care (ISTC). The Hague, Tuberculosis Coalition for Technical Assistance, 2006.
6. The Stop TB Strategy: building on and enhancing DOTS to meet the TB-related Millennium Development Goals. Geneva, World Health Organization, 2006 (WHO/HTM/STB/2006.37).
7. Engaging all health care providers in TB control — guidance on implementing public-private mix approaches. Geneva, World Health Organization, 2006 (WHO/HTM/TB/2006.360).
8. Community contribution to TB care: practice and policy. Geneva: World Health Organization, 2003 (WHO/CDS/TB/2003.312).
9. Practical approach to lung health (PAL): a primary health-care strategy for the integrated management of respiratory conditions in people five years of age or over. Geneva, World Health Organization, 2005 (WHO/HTM/TB/2005.351).
10. Addressing poverty in TB control : options for national TB control programmes. Geneva, World Health Organization, 2005 (WHO/HTM/TB/2005.352).
11. The Global Plan to Stop TB, 2006–2015: methods used to estimate costs, funding and funding gaps. Geneva, World Health Organization, 2006 (WHO/HTM/STB/2006.39).
8. REFERENCES

�� ��

�� ��
ANNEX
REGIONAL SCENARIOS FOR TB CONTROL IN 2006–2015
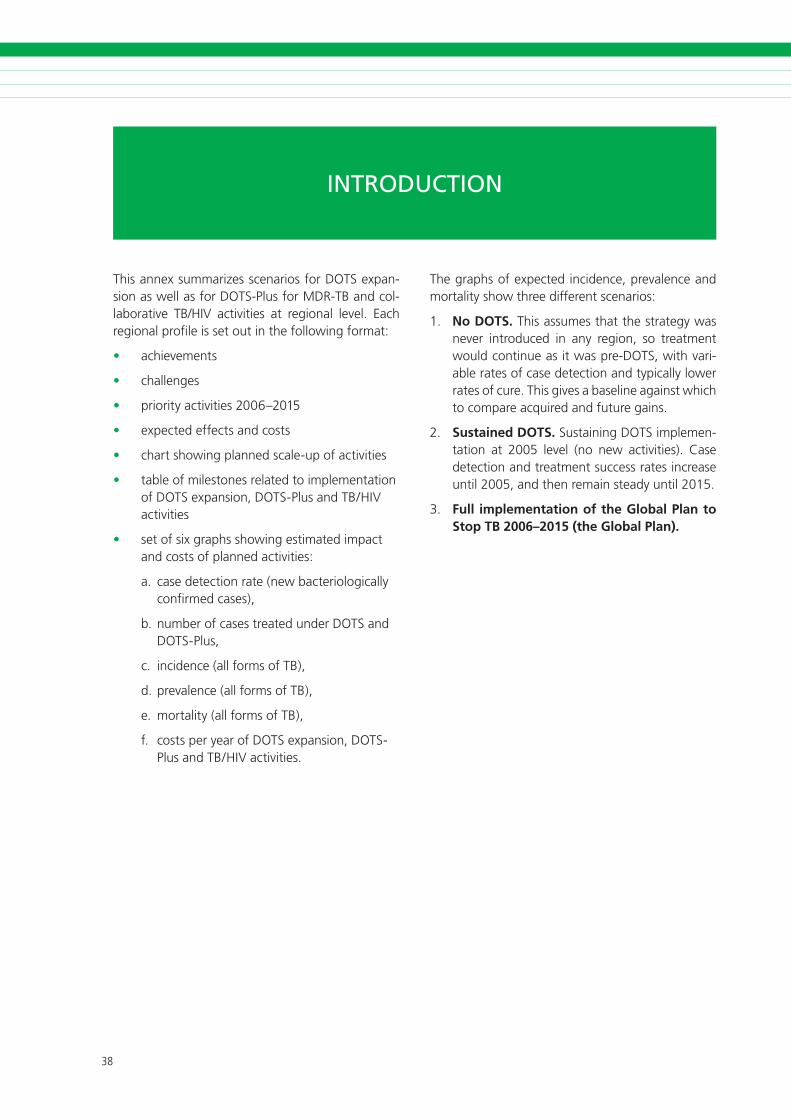
��
DOTS Expansion Working Group S t ra teg ic P lan 2 0 0 6 – 2 0 1 5
��
DOTS Expansion Working Group S t ra teg ic P lan 2 0 0 6 – 2 0 1 5
This annex summarizes scenarios for DOTS expan-sion as well as for DOTS-Plus for MDR-TB and col-laborative TB/HIV activities at regional level. Each regional profile is set out in the following format:
• achievements
• challenges
• priority activities 2006–2015
• expected effects and costs
• chart showing planned scale-up of activities
• table of milestones related to implementation of DOTS expansion, DOTS-Plus and TB/HIV activities
• set of six graphs showing estimated impact and costs of planned activities:
a. case detection rate (new bacteriologically confirmed cases),
b. number of cases treated under DOTS and DOTS-Plus,
c. incidence (all forms of TB),
d. prevalence (all forms of TB),
e. mortality (all forms of TB),
f. costs per year of DOTS expansion, DOTS-Plus and TB/HIV activities.
The graphs of expected incidence, prevalence and mortality show three different scenarios:
1. No DOTS. This assumes that the strategy was never introduced in any region, so treatment would continue as it was pre-DOTS, with vari-able rates of case detection and typically lower rates of cure. This gives a baseline against which to compare acquired and future gains.
2. Sustained DOTS. Sustaining DOTS implemen-tation at 2005 level (no new activities). Case detection and treatment success rates increase until 2005, and then remain steady until 2015.
3. Full implementation of the Global Plan to Stop TB 2006–2015 (the Global Plan).
INTRODUCTION
��
DOTS Expansion Working Group S t ra teg ic P lan 2 0 0 6 – 2 0 1 5
��
DOTS Expansion Working Group S t ra teg ic P lan 2 0 0 6 – 2 0 1 5
Summary of planned activities, impact and costs
The African Region (AFR) contains two distinct epidemiological subregions in terms of TB and HIV burden: the high HIV prevalence subregion (AFR high1) includes countries with an estimated adult HIV prevalence rate equal to or greater than 4%; the re-maining countries constitute the low HIV prevalence subregion (AFR low2). The following section summa-rizes achievements to date, challenges, priority activi-ties, and expected effects and costs for the African region, and highlights key differences between AFR high and AFR low. Summary tables and figures are presented separately for the two subregions.
Achievements
The region has made good progress in DOTS ex-pansion in recent years. Of the world’s 22 high-bur-den countries (HBCs), 9 are in Africa (Democratic Republic of Congo, Ethiopia, Kenya, Mozambique, Nigeria, South Africa, Uganda, United Republic of Tanzania and Zimbabwe), and all have a DOTS pro-gramme. Only 5 of the 46 countries in the region have not adopted DOTS as the national strategy for TB control, though a few countries have not ad-equately implemented some of its core elements. Case detection increased steadily from 23% to 48% between 1995 and 2003, and is expected to reach 55% in 2005. Though short of the 70% target, this is a significant achievement given the severe health system constraints in the region.
� AFR high HIV prevalence countries:Botswana,Burund�,Cameroon, Central Afr�can Republ�c, Congo, Côte d’ivo�re,Democrat�c Republ�c of the Congo, Eth�op�a, Gabon, Kenya,Lesotho, Malaw�, Mozamb�que, Nam�b�a, N�ger�a, Rwanda,SouthAfr�ca,Swaz�land,Uganda,Un�tedRepubl�cofTanzan�a,Zamb�a,Z�mbabwe.
� AFR low HIV prevalence countries:Alger�a,Angola,Ben�n,Burk�naFaso,CapeVerde,Chad,Comoros,Dj�bout�,Equator�alGu�nea, Er�trea, Gamb�a, Ghana, Gu�nea, Gu�nea-B�ssau,L�ber�a, Madagascar, Mal�, Maur�tan�a, Maur�t�us, N�ger, SaoTomeandPr�nc�pe,Senegal,Seychelles,S�erraLeone,Togo.
All nine HBCs in the region fall in the AFR high sub-region, and face particular challenges related to the HIV epidemic. Many countries with high HIV preva-lence have established pilot projects for collabora-tive TB/HIV activities (e.g. Democratic Republic of the Congo, Ethiopia, Rwanda, United Republic of Tanzania) or are already scaling up TB/HIV activities nationally (e.g. Kenya, Malawi and South Africa).
Several countries have taken up community DOTS, and are now at various stages of programme imple-mentation. Coverage of drug resistance surveillance is increasing. Kenya has a DOTS-Plus pilot project approved by the Green Light Committee. South Africa is one of the few HBCs in which the national TB control programme (NTP) provides treatment for cases of multidrug-resistant TB (MDR-TB). The pro-gramme, however, has not been endorsed by the Green Light Committee.
Challenges
Despite these achievements, TB control in the re-gion faces severe challenges, of which the great-est is perhaps the impact of HIV on increasing TB incidence. However, a range of additional factors contributes to the uncontrolled epidemic, including widespread poverty and very weak health systems. Major constraints to the delivery of high-quality care include: inadequate infrastructure, poor access to health facilities, insufficient staffing and human resource development, insufficient and substandard laboratory services, and limited links between NTP and HIV/AIDS programmes, as well as with other public and private health-care providers.
The treatment success rate has remained more or less unchanged since 1998 at just above 70%, consider-ably short of the 85% target. This low rate is due not only to the high rates of death among people living with HIV/AIDS but also to high rates of treatment interruption and transfer. Efforts are needed specifi-cally to improve treatment and care for HIV-positive
1. AFRICAN REGION
�0
DOTS Expansion Working Group S t ra teg ic P lan 2 0 0 6 – 2 0 1 5
��
DOTS Expansion Working Group S t ra teg ic P lan 2 0 0 6 – 2 0 1 5
TB patients, generally to improve case management, referral and transfer mechanisms, and defaulter tracing and to improve TB diagnosis (that will also help improve the case detection rate).
Drug resistance surveillance data are limited and few trends are available from the African Region. This is of particular concern given that little information is avail-able about MDR-TB in high HIV-prevalence settings.
Priority activities 2006–2015
Ministers of Health from 46 Member States of the Africa Region unanimously declared TB an emer-gency in the region in August 2005. The declara-tion urged countries to develop and implement, with immediate effect, emergency strategies and plans to control the worsening of the epidemic. This declaration of emergency will be crucial in acceler-ating the implementation of priority activities and in garnering the necessary commitments from all stakeholders, both nationally and internationally.
The first priority is to move from basic geographical coverage of DOTS, to improved quality and access. Quality improvements require intensified efforts to strengthen laboratory services, treatment manage-ment and supervision. This, in turn, requires that the root problems of the human resource crisis and weak health systems are addressed. Advocacy for higher and sustained political commitment at na-tional and international levels will be key. Tackling the human resource crisis goes far beyond TB control alone, and will require the implementation of human resource development strategies in the public health sector, e.g. more attractive career and salary structures, and improved training, as well as the establishment of partnerships with communi-ties and all health-care providers, in order to tap all available human resources.
Implementation of collaborative TB/HIV activities is another priority in the region, in particular in the high HIV prevalence countries. Such activities will have begun in all high HIV prevalence countries by 2007, with full coverage by 2015.
Access will be improved by further decentralizing services. For the majority of the population living in rural areas, establishing and scaling up com-
munity DOTS will improve access to high-quality care, particularly for the most disadvantaged, and will also address some gender-related barriers to access. Through social mobilization, communities participate in treatment support and contribute to identifying TB suspects and referring them for diag-nosis. The public-private mix for DOTS (PPM DOTS) approach will be relevant mainly in urban settings, where it will contribute to making DOTS services available to vulnerable urban populations, such as slum dwellers and migrants. It will also facilitate links between large central hospitals and public health facilities in the cities. The Practical Approach to Lung Health (PAL) will be introduced gradually in settings with sound DOTS programmes in place.
Rapid introduction and scale up of culture services, especially new rapid culture methods, are particularly important to improve diagnosis of sputum smear-negative and extrapulmonary TB among people liv-ing with HIV/AIDS. Drug resistance surveillance will be expanded and the relationship between HIV and MDR-TB will be monitored. Diagnosis and treatment of MDR-TB will be pilot tested and scaled up, and will focus on previously treated patients.
Better coordination between NTPs, anti-poverty ini-tiatives and health system strengthening is needed to ensure that TB treatment is accessible to all so-cioeconomic groups (but most importantly to the poor), and to women and men equally. Debt relief for highly indebted poor countries could contribute to ensuring universal access to high-quality TB care by freeing up domestic resources. However, the poverty reduction strategy papers, medium-term expenditure frameworks, poverty reduction sup-port credits and other broad planning mechanisms, such as sector-wide approaches, hold the potential for addressing constraints and placing financing for TB control in a sustainable and flexible long-term strategic plan, with multisectoral involvement. The establishment of national Stop TB partnerships will be encouraged to forge multisectoral involvement and coordination.
Expected effects and costs
Successful implementation of the activities described above is expected to increase case detection to over 70% by 2010 and over 80% by 2015. The treat-
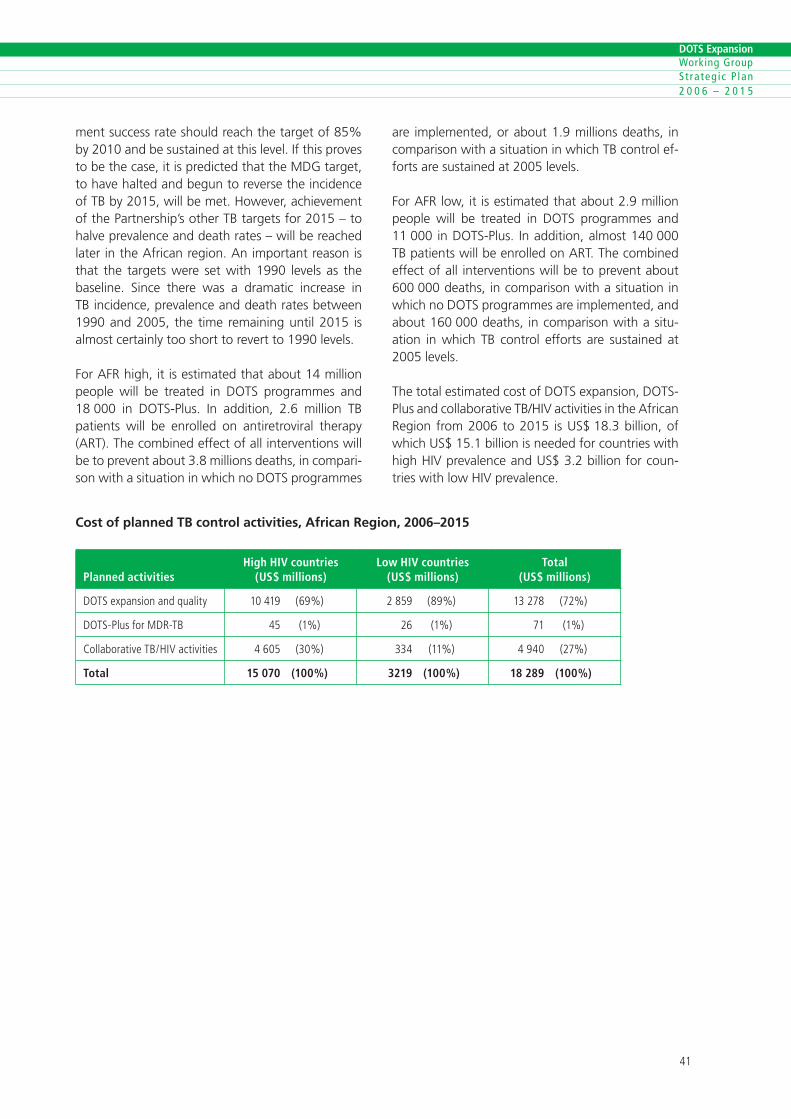
�0
DOTS Expansion Working Group S t ra teg ic P lan 2 0 0 6 – 2 0 1 5
��
DOTS Expansion Working Group S t ra teg ic P lan 2 0 0 6 – 2 0 1 5
ment success rate should reach the target of 85% by 2010 and be sustained at this level. If this proves to be the case, it is predicted that the MDG target, to have halted and begun to reverse the incidence of TB by 2015, will be met. However, achievement of the Partnership’s other TB targets for 2015 – to halve prevalence and death rates – will be reached later in the African region. An important reason is that the targets were set with 1990 levels as the baseline. Since there was a dramatic increase in TB incidence, prevalence and death rates between 1990 and 2005, the time remaining until 2015 is almost certainly too short to revert to 1990 levels.
For AFR high, it is estimated that about 14 million people will be treated in DOTS programmes and 18 000 in DOTS-Plus. In addition, 2.6 million TB patients will be enrolled on antiretroviral therapy (ART). The combined effect of all interventions will be to prevent about 3.8 millions deaths, in compari-son with a situation in which no DOTS programmes
Cost of planned TB control activities, African Region, 2006–2015
Planned activities
High HIV countries(US$ millions)
Low HIV countries(US$ millions)
Total (US$ millions)
DOTSexpans�onandqual�ty �0��� (��%) ���� (��%) ����� (��%)
DOTS-PlusforMDR-TB �� (�%) �� (�%) �� (�%)
Collaborat�veTB/HiVact�v�t�es ��0� (�0%) ��� (��%) ���0 (��%)
Total 15 070 (100%) 3219 (100%) 18 289 (100%)
are implemented, or about 1.9 millions deaths, in comparison with a situation in which TB control ef-forts are sustained at 2005 levels.
For AFR low, it is estimated that about 2.9 million people will be treated in DOTS programmes and 11 000 in DOTS-Plus. In addition, almost 140 000 TB patients will be enrolled on ART. The combined effect of all interventions will be to prevent about 600 000 deaths, in comparison with a situation in which no DOTS programmes are implemented, and about 160 000 deaths, in comparison with a situ-ation in which TB control efforts are sustained at 2005 levels.
The total estimated cost of DOTS expansion, DOTS-Plus and collaborative TB/HIV activities in the African Region from 2006 to 2015 is US$ 18.3 billion, of which US$ 15.1 billion is needed for countries with high HIV prevalence and US$ 3.2 billion for coun-tries with low HIV prevalence.

��
DOTS Expansion Working Group S t ra teg ic P lan 2 0 0 6 – 2 0 1 5
��
DOTS Expansion Working Group S t ra teg ic P lan 2 0 0 6 – 2 0 1 5
Summary charts for African countries with high HIV prevalence
Planned scale-up of activities, 2006–2015
0
20
40
60
80
100DOTS-Plus
TB/HIV
Lab capacity for culture and DST
PAL
Community DOTS
PPM
2015201420132012201120102009200820072006
African countries with high HIV prevalence
Pop
ulat
ion
cove
red
(%)
N.B.Populat�oncoverage�sthepercentageofthepopulat�onthatl�ves�nanareawheretheact�v�ty�s�mplemented.Forcollaborat�veTB/HiVact�v�t�es,thepercentagereferstotheproport�onoftheel�g�blepopulat�on,�.e.thepopulat�onl�v�ng�nareasw�thanHiVprevalenceabove�%.ForDOTS-Plus,�t�sthepercentageofdetectedMDR-TBcasesthatareenrolled�nDOTS-Plusprogrammes.
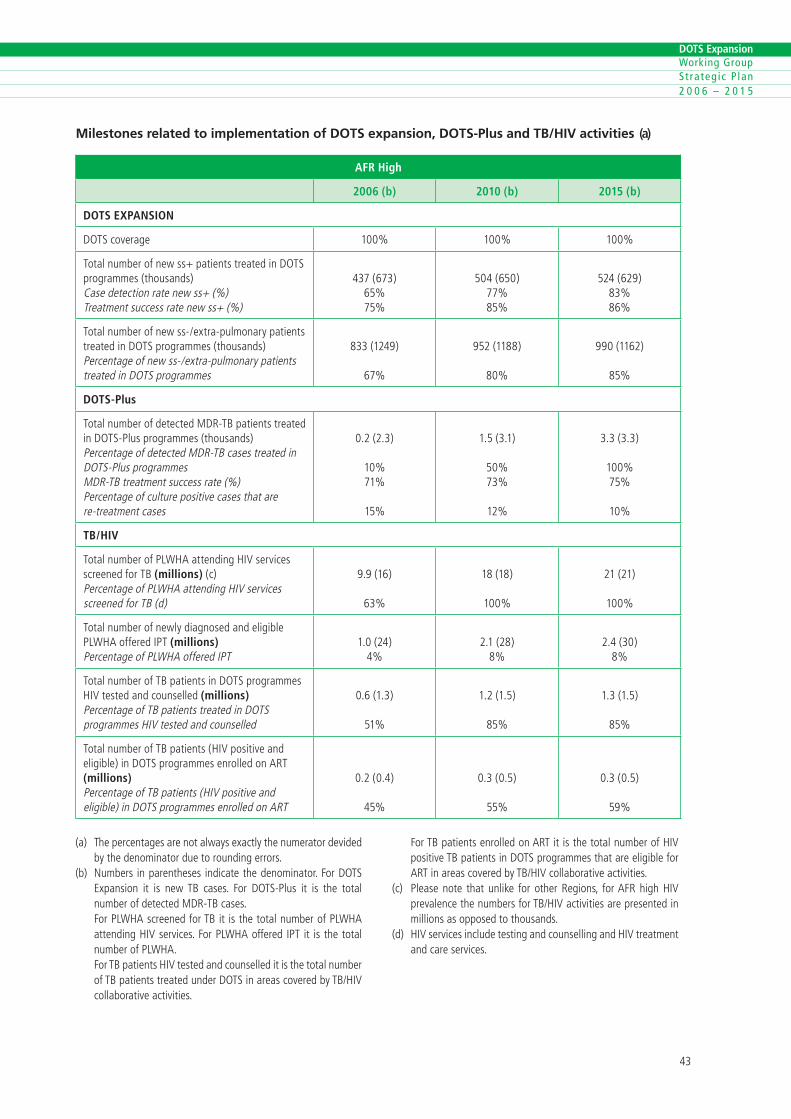
��
DOTS Expansion Working Group S t ra teg ic P lan 2 0 0 6 – 2 0 1 5
��
DOTS Expansion Working Group S t ra teg ic P lan 2 0 0 6 – 2 0 1 5
Milestones related to implementation of DOTS expansion, DOTS-Plus and TB/HIV activities (a)
AFR High
2006 (b) 2010 (b) 2015 (b)
DOTS EXPANSION
DOTScoverage �00% �00% �00%
Totalnumberofnewss+pat�entstreated�nDOTSprogrammes(thousands)Casedetect�onratenewss+(%)Treatmentsuccessratenewss+(%)
���(���)��%��%
�0�(��0)��%��%
���(���)��%��%
Totalnumberofnewss-/extra-pulmonarypat�entstreated�nDOTSprogrammes(thousands)Percentageofnewss-/extra-pulmonarypat�entstreated�nDOTSprogrammes
���(����)
��%
���(����)
�0%
��0(����)
��%
DOTS-Plus
TotalnumberofdetectedMDR-TBpat�entstreated�nDOTS-Plusprogrammes(thousands)PercentageofdetectedMDR-TBcasestreated�nDOTS-PlusprogrammesMDR-TBtreatmentsuccessrate(%)Percentageofculturepos�t�vecasesthatarere-treatmentcases
0.�(�.�)
�0%��%
��%
�.�(�.�)
�0%��%
��%
�.�(�.�)
�00%��%
�0%
TB/HIV
TotalnumberofPLWHAattend�ngHiVserv�cesscreenedforTB(millions)(c)PercentageofPLWHAattend�ngHiVserv�cesscreenedforTB(d)
�.�(��)
��%
��(��)
�00%
��(��)
�00%
Totalnumberofnewlyd�agnosedandel�g�blePLWHAofferediPT(millions)PercentageofPLWHAofferediPT
�.0(��)�%
�.�(��)�%
�.�(�0)�%
TotalnumberofTBpat�ents�nDOTSprogrammesHiVtestedandcounselled(millions)PercentageofTBpat�entstreated�nDOTSprogrammesHiVtestedandcounselled
0.�(�.�)
��%
�.�(�.�)
��%
�.�(�.�)
��%
TotalnumberofTBpat�ents(HiVpos�t�veandel�g�ble)�nDOTSprogrammesenrolledonART(millions)PercentageofTBpat�ents(HiVpos�t�veandel�g�ble)�nDOTSprogrammesenrolledonART
0.�(0.�)
��%
0.�(0.�)
��%
0.�(0.�)
��%
(a) Thepercentagesarenotalwaysexactlythenumeratordev�dedbythedenom�natorduetoround�ngerrors.
(b) Numbers �nparentheses �nd�catethedenom�nator.ForDOTSExpans�on �t �s newTB cases. For DOTS-Plus �t �s the totalnumberofdetectedMDR-TBcases.
ForPLWHAscreenedforTB�t �sthetotalnumberofPLWHAattend�ngHiVserv�ces.ForPLWHAoffered iPT �t �s thetotalnumberofPLWHA.
ForTBpat�entsHiVtestedandcounselled�t�sthetotalnumberofTBpat�entstreatedunderDOTS�nareascoveredbyTB/HiVcollaborat�veact�v�t�es.
ForTBpat�entsenrolledonART�t�sthetotalnumberofHiVpos�t�veTBpat�ents�nDOTSprogrammesthatareel�g�bleforART�nareascoveredbyTB/HiVcollaborat�veact�v�t�es.
(c) Pleasenote that unl�ke for otherReg�ons, forAFRh�ghHiVprevalencethenumbersforTB/HiVact�v�t�esarepresented�nm�ll�onsasopposedtothousands.
(d) HiVserv�ces�ncludetest�ngandcounsell�ngandHiVtreatmentandcareserv�ces.
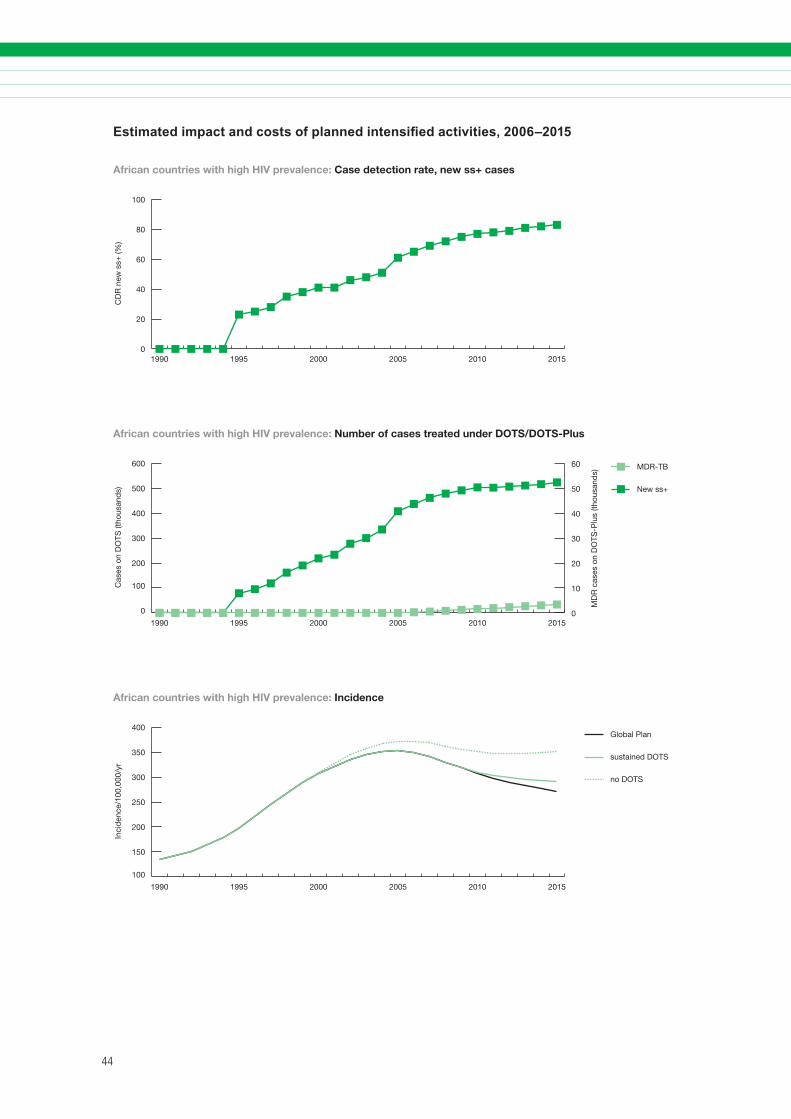
��
DOTS Expansion Working Group S t ra teg ic P lan 2 0 0 6 – 2 0 1 5
��
DOTS Expansion Working Group S t ra teg ic P lan 2 0 0 6 – 2 0 1 5
Estimated impact and costs of planned intensified activities, 2006–2015
0
20
40
60
80
100
201520102005200019951990
African countries with high HIV prevalence: Case detection rate, new ss+ cases
CD
R n
ew s
s+ (%
)
0
100
200
300
400
500
600 MDR-TB
New ss+
201520102005200019951990
Cas
es o
n D
OTS
(tho
usan
ds)
MD
R c
ases
on
DO
TS-P
lus
(thou
sand
s)
African countries with high HIV prevalence: Number of cases treated under DOTS/DOTS-Plus
0
10
20
30
40
50
60
100
150
200
250
300
350
400Global Plan
sustained DOTS
no DOTS
201520102005200019951990
African countries with high HIV prevalence: Incidence
Inci
den
ce/1
00,0
00/y
r
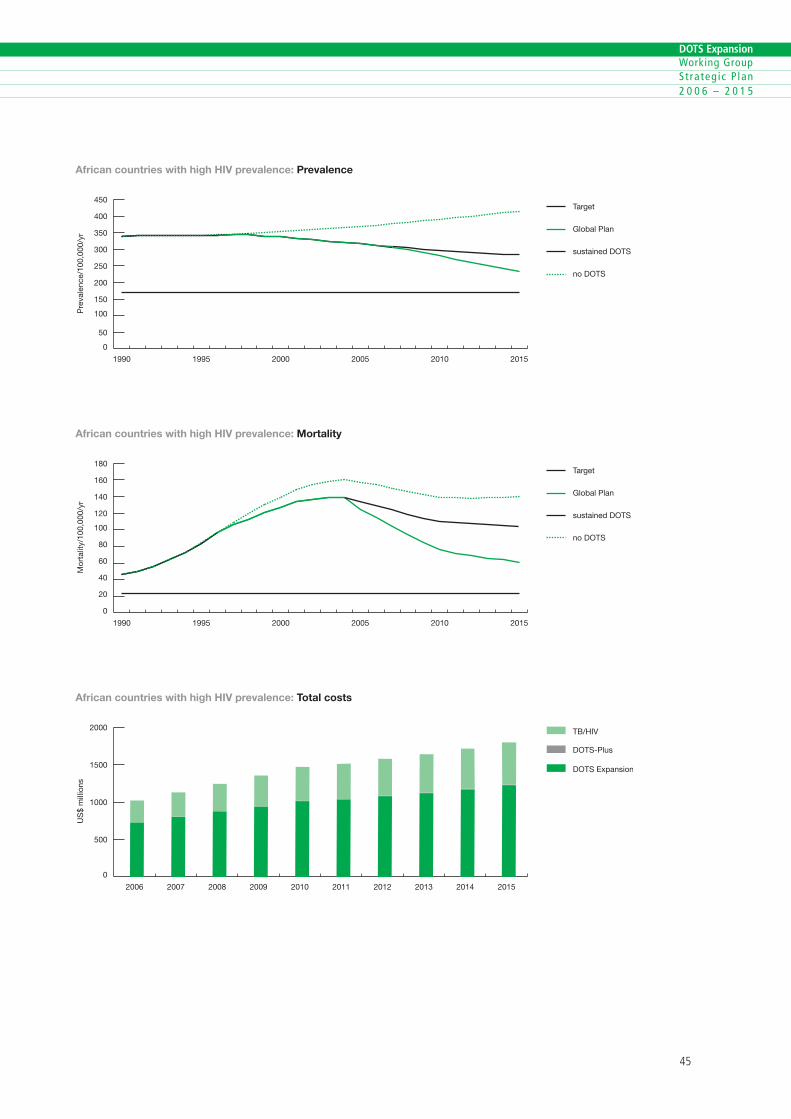
��
DOTS Expansion Working Group S t ra teg ic P lan 2 0 0 6 – 2 0 1 5
��
DOTS Expansion Working Group S t ra teg ic P lan 2 0 0 6 – 2 0 1 5
0
50
100
150
200
250
300
350
400
450Target
Global Plan
sustained DOTS
no DOTS
201520102005200019951990
Pre
vale
nce/
100,
000/
yr
African countries with high HIV prevalence: Prevalence
0
20
40
60
80
100
120
140
160
180Target
Global Plan
sustained DOTS
no DOTS
201520102005200019951990
African countries with high HIV prevalence: Mortality
Mor
talit
y/10
0,00
0/yr
0
500
1000
1500
2000 TB/HIV
DOTS-Plus
DOTS Expansion
2015201420132012201120102009200820072006
African countries with high HIV prevalence: Total costs
US
$ m
illio
ns
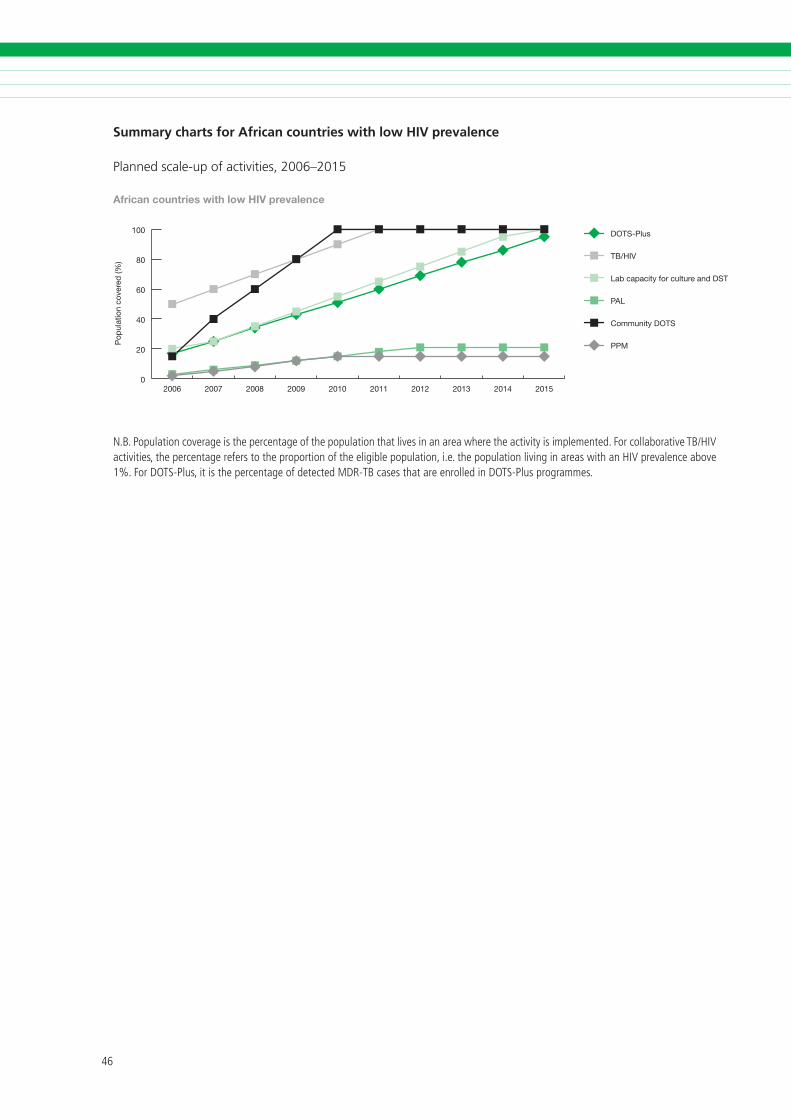
��
DOTS Expansion Working Group S t ra teg ic P lan 2 0 0 6 – 2 0 1 5
��
DOTS Expansion Working Group S t ra teg ic P lan 2 0 0 6 – 2 0 1 5
Summary charts for African countries with low HIV prevalence
Planned scale-up of activities, 2006–2015
0
20
40
60
80
100 DOTS-Plus
TB/HIV
Lab capacity for culture and DST
PAL
Community DOTS
PPM
2015201420132012201120102009200820072006
African countries with low HIV prevalence
Pop
ulat
ion
cove
red
(%)
N.B.Populat�oncoverage�sthepercentageofthepopulat�onthatl�ves�nanareawheretheact�v�ty�s�mplemented.Forcollaborat�veTB/HiVact�v�t�es,thepercentagereferstotheproport�onoftheel�g�blepopulat�on,�.e.thepopulat�onl�v�ng�nareasw�thanHiVprevalenceabove�%.ForDOTS-Plus,�t�sthepercentageofdetectedMDR-TBcasesthatareenrolled�nDOTS-Plusprogrammes.
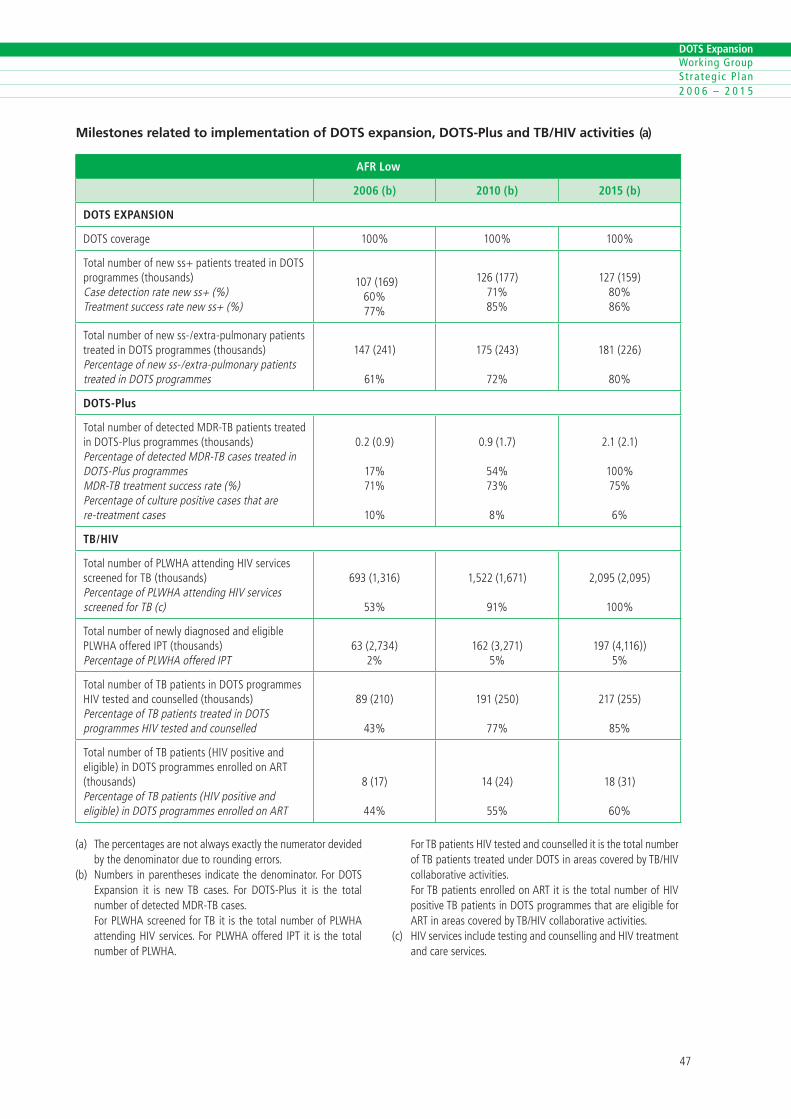
��
DOTS Expansion Working Group S t ra teg ic P lan 2 0 0 6 – 2 0 1 5
��
DOTS Expansion Working Group S t ra teg ic P lan 2 0 0 6 – 2 0 1 5
Milestones related to implementation of DOTS expansion, DOTS-Plus and TB/HIV activities (a)
AFR Low
2006 (b) 2010 (b) 2015 (b)
DOTS EXPANSION
DOTScoverage �00% �00% �00%
Totalnumberofnewss+pat�entstreated�nDOTSprogrammes(thousands)Casedetect�onratenewss+(%)Treatmentsuccessratenewss+(%)
�0�(���)�0%��%
���(���)��%��%
���(���)�0%��%
Totalnumberofnewss-/extra-pulmonarypat�entstreated�nDOTSprogrammes(thousands)Percentageofnewss-/extra-pulmonarypat�entstreated�nDOTSprogrammes
���(���)
��%
���(���)
��%
���(���)
�0%
DOTS-Plus
TotalnumberofdetectedMDR-TBpat�entstreated�nDOTS-Plusprogrammes(thousands)PercentageofdetectedMDR-TBcasestreated�nDOTS-PlusprogrammesMDR-TBtreatmentsuccessrate(%)Percentageofculturepos�t�vecasesthatarere-treatmentcases
0.�(0.�)
��%��%
�0%
0.�(�.�)
��%��%
�%
�.�(�.�)
�00%��%
�%
TB/HIV
TotalnumberofPLWHAattend�ngHiVserv�cesscreenedforTB (thousands)PercentageofPLWHAattend�ngHiVserv�cesscreenedforTB(c)
���(�,���)
��%
�,���(�,���)
��%
�,0��(�,0��)
�00%
Totalnumberofnewlyd�agnosedandel�g�blePLWHAofferediPT(thousands)PercentageofPLWHAofferediPT
��(�,���)�%
���(�,���)�%
���(�,���))�%
TotalnumberofTBpat�ents�nDOTSprogrammesHiVtestedandcounselled(thousands)PercentageofTBpat�entstreated�nDOTSprogrammesHiVtestedandcounselled
��(��0)
��%
���(��0)
��%
���(���)
��%
TotalnumberofTBpat�ents(HiVpos�t�veandel�g�ble)�nDOTSprogrammesenrolledonART(thousands)PercentageofTBpat�ents(HiVpos�t�veandel�g�ble)�nDOTSprogrammesenrolledonART
�(��)
��%
��(��)
��%
��(��)
�0%
(a) Thepercentagesarenotalwaysexactlythenumeratordev�dedbythedenom�natorduetoround�ngerrors.
(b) Numbers �nparentheses �nd�catethedenom�nator.ForDOTSExpans�on �t �s newTB cases. For DOTS-Plus �t �s the totalnumberofdetectedMDR-TBcases.
ForPLWHAscreenedforTB�t �sthetotalnumberofPLWHAattend�ngHiVserv�ces.ForPLWHAoffered iPT �t �s thetotalnumberofPLWHA.
ForTBpat�entsHiVtestedandcounselled�t�sthetotalnumberofTBpat�entstreatedunderDOTS�nareascoveredbyTB/HiVcollaborat�veact�v�t�es.
ForTBpat�entsenrolledonART�t�sthetotalnumberofHiVpos�t�veTBpat�ents�nDOTSprogrammesthatareel�g�bleforART�nareascoveredbyTB/HiVcollaborat�veact�v�t�es.
(c) HiVserv�ces�ncludetest�ngandcounsell�ngandHiVtreatmentandcareserv�ces.

��
DOTS Expansion Working Group S t ra teg ic P lan 2 0 0 6 – 2 0 1 5
��
DOTS Expansion Working Group S t ra teg ic P lan 2 0 0 6 – 2 0 1 5
Estimated impact and costs of planned intensified activities, 2006–2015
0
20
40
60
80
100
201520102005200019951990
African countries with low HIV prevalence: Case detection rate, new ss+ cases
CD
R n
ew s
s+ (%
)
0
20
40
60
80
100
120
140 MDR-TB
New ss+
201520102005200019951990
African countries with low HIV prevalence: Number of cases treated under DOTS/DOTS-Plus
Cas
es o
n D
OTS
(tho
usan
ds)
MD
R c
ases
on
DO
TS-P
lus
(thou
sand
s)
0
10
20
30
40
50
60
0
50
100
150
200
250Global Plan
sustained DOTS
no DOTS
201520102005200019951990
Inci
den
ce/1
00,0
00/y
r
African countries with low HIV prevalence: Incidence

��
DOTS Expansion Working Group S t ra teg ic P lan 2 0 0 6 – 2 0 1 5
��
DOTS Expansion Working Group S t ra teg ic P lan 2 0 0 6 – 2 0 1 5
0
100
200
300
400
500
600
700Target
Global Plan
sustained DOTS
no DOTS
201520102005200019951990
Pre
vale
nce/
100,
000/
yr
African countries with low HIV prevalence: Prevalence
0
20
40
60
80Target
Global Plan
sustained DOTS
no DOTS
201520102005200019951990
African countries with low HIV prevalence: Mortality
Mor
talit
y/10
0,00
0/yr
0
50
100
150
200
250
300
350
400 TB/HIV
DOTS-Plus
DOTS Expansion
2015201420132012201120102009200820072006
African countries with low HIV prevalence: Total costs
US
$ m
illio
ns
�0
DOTS Expansion Working Group S t ra teg ic P lan 2 0 0 6 – 2 0 1 5
��
DOTS Expansion Working Group S t ra teg ic P lan 2 0 0 6 – 2 0 1 5
Summary of planned activities, impact and costs
Achievements
The Americas Region has made major progress in TB control. A number of countries have had excellent TB control programmes following DOTS principles for some time (such as Chile, Cuba and Uruguay). Since 2003, the DOTS strategy has been implemented in 33 countries, giving an estimated regional DOTS coverage of 78%. The case detec-tion rate under DOTS reached 50% in 2003 and is predicted to increase to 67% in 2005. The treat-ment success rate for new smear-positive cases in DOTS areas has increased from 77% (1994 cohort) to 81% (2002 cohort) and is expected to reach the 2005 target of 85% in the 2005 cohort.
TB prevalence and incidence are already decreas-ing. From 1994 to 2003, the incidence of TB in the region showed a downward trend of 1.6% per year for all forms, and 2.6% per year for smear-positive cases. This downward trend is essentially attributed to fewer cases in Brazil, Chile, Costa Rica, Cuba and Peru. Data from drug resistance surveys are available for most countries in the region, as a result of exist-ing laboratory networks and the commitment of NTPs to monitor the emergence of drug resistance. Nine countries have already implemented DOTS-Plus pilot projects and several others are planning to introduce sound MDR-TB management schemes.
Challenges
Although the region is on track to reach the Partnership’s 2015 targets linked to the MDGs, it should be emphasized that current achievements essentially reflect results in countries with successful long-standing NTPs (such as Brazil, Chile, Costa Rica, El Salvador and Peru), which have shown sustained improvement against their indicators. Reaching the MDG target will depend mainly on progress over
2. THE AMERICAS REGION (EXCLUDING ESTABLISHED MARKET ECONOMIES)
the next 10 years in low- and middle-income coun-tries with a high TB burden,3 and on ensuring that services for TB diagnosis and treatment reach the poorest and marginalized groups of society in all countries in the region.
Furthermore, some countries where DOTS needs to be strengthened have recently implemented health sector reforms, or are subject to political or social instability, impoverishment, or rapid spread of HIV/AIDS. All these pose challenges, and technical assis-tance will need to be tailored to the epidemiologi-cal, social, operational and developmental situation of the health system and the NTP in each country.
Priority activities 2006–2015
Regional efforts will focus on countries with weak health systems, a high degree of poverty, a high TB burden, high MDR-TB or high HIV/AIDS prevalence. A regional TB control plan for 2006–2015 has been developed with the involvement of a range of partners and regional experts. It aims to strengthen DOTS implementation and to improve the quality of TB care by following the Stop TB Strategy. This in-cludes fostering TB/HIV and MDR-TB management at primary care level and promoting community participation, particularly in those countries and for those minority groups where poor access to health care remains a significant barrier to adequate implementation of DOTS. The plan includes: fur-ther improvements in the quality of diagnostic and treatment services; implementing PAL in countries with a low TB burden (Chile, Costa Rica, El Salvador, Uruguay and Venezuela), as well as in countries re-quiring intensified case-finding (Bolivia and Peru); and expansion of PPM DOTS initiatives, with a focus on urban areas.
� WHO class�fies countr�es �n the reg�on as hav�ng a h�ghTBburdenwhen the est�matedTB �nc�dence �s greater than�0per�00000populat�on.Braz�l andPeru together not�fy ap-prox�mately�0%ofcases�nthereg�on.
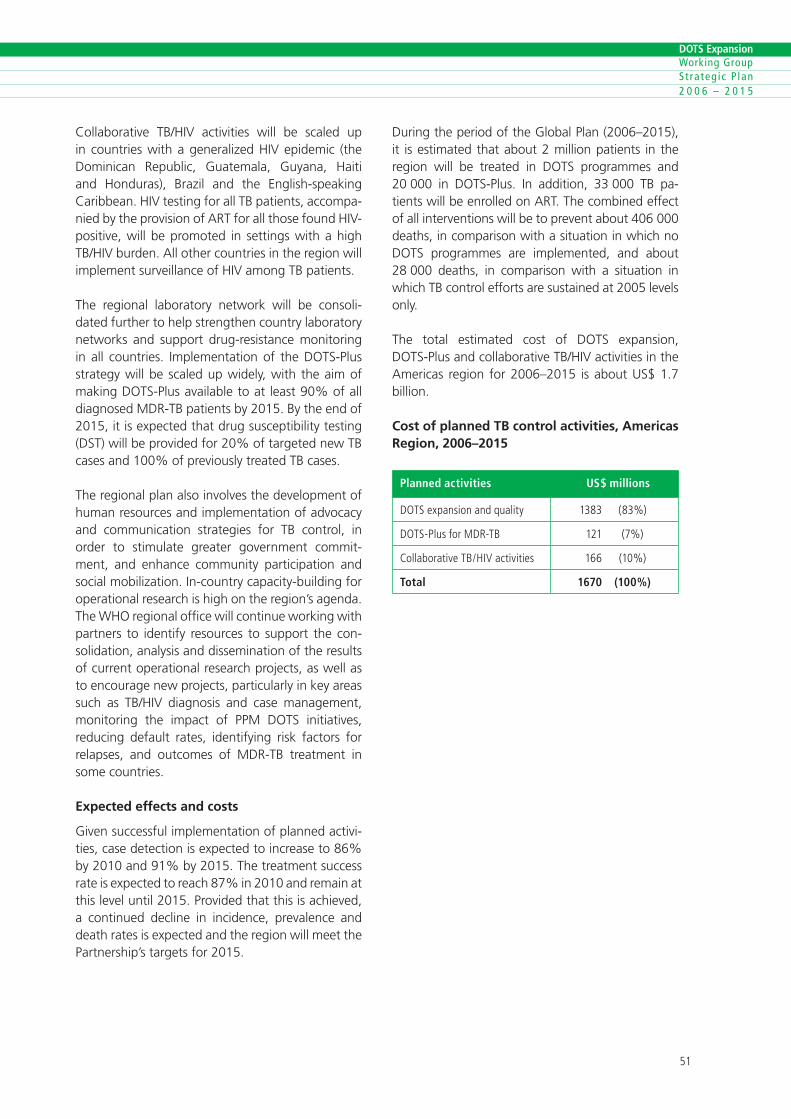
�0
DOTS Expansion Working Group S t ra teg ic P lan 2 0 0 6 – 2 0 1 5
��
DOTS Expansion Working Group S t ra teg ic P lan 2 0 0 6 – 2 0 1 5
Collaborative TB/HIV activities will be scaled up in countries with a generalized HIV epidemic (the Dominican Republic, Guatemala, Guyana, Haiti and Honduras), Brazil and the English-speaking Caribbean. HIV testing for all TB patients, accompa-nied by the provision of ART for all those found HIV-positive, will be promoted in settings with a high TB/HIV burden. All other countries in the region will implement surveillance of HIV among TB patients.
The regional laboratory network will be consoli-dated further to help strengthen country laboratory networks and support drug-resistance monitoring in all countries. Implementation of the DOTS-Plus strategy will be scaled up widely, with the aim of making DOTS-Plus available to at least 90% of all diagnosed MDR-TB patients by 2015. By the end of 2015, it is expected that drug susceptibility testing (DST) will be provided for 20% of targeted new TB cases and 100% of previously treated TB cases.
The regional plan also involves the development of human resources and implementation of advocacy and communication strategies for TB control, in order to stimulate greater government commit-ment, and enhance community participation and social mobilization. In-country capacity-building for operational research is high on the region’s agenda. The WHO regional office will continue working with partners to identify resources to support the con-solidation, analysis and dissemination of the results of current operational research projects, as well as to encourage new projects, particularly in key areas such as TB/HIV diagnosis and case management, monitoring the impact of PPM DOTS initiatives, reducing default rates, identifying risk factors for relapses, and outcomes of MDR-TB treatment in some countries.
Expected effects and costs
Given successful implementation of planned activi-ties, case detection is expected to increase to 86% by 2010 and 91% by 2015. The treatment success rate is expected to reach 87% in 2010 and remain at this level until 2015. Provided that this is achieved, a continued decline in incidence, prevalence and death rates is expected and the region will meet the Partnership’s targets for 2015.
During the period of the Global Plan (2006–2015), it is estimated that about 2 million patients in the region will be treated in DOTS programmes and 20 000 in DOTS-Plus. In addition, 33 000 TB pa-tients will be enrolled on ART. The combined effect of all interventions will be to prevent about 406 000 deaths, in comparison with a situation in which no DOTS programmes are implemented, and about 28 000 deaths, in comparison with a situation in which TB control efforts are sustained at 2005 levels only.
The total estimated cost of DOTS expansion, DOTS-Plus and collaborative TB/HIV activities in the Americas region for 2006–2015 is about US$ 1.7 billion.
Cost of planned TB control activities, Americas Region, 2006–2015
Planned activities US$ millions
DOTSexpans�onandqual�ty ���� (��%)
DOTS-PlusforMDR-TB ��� (�%)
Collaborat�veTB/HiVact�v�t�es ��� (�0%)
Total 1670 (100%)
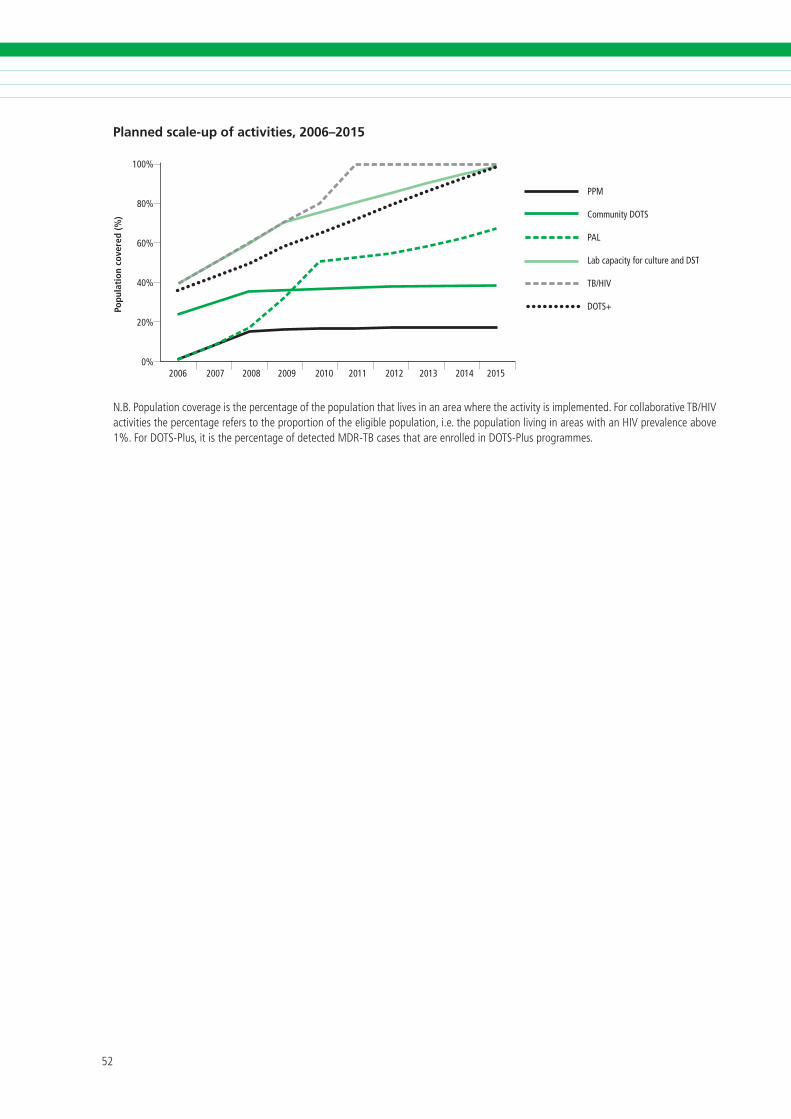
��
DOTS Expansion Working Group S t ra teg ic P lan 2 0 0 6 – 2 0 1 5
��
DOTS Expansion Working Group S t ra teg ic P lan 2 0 0 6 – 2 0 1 5
Planned scale-up of activities, 2006–2015
100%
80%
60%
40%
20%
0%
Popu
lati
on c
over
ed (%
)
2006 2007 2008 2009 2010 2011 2012 2013 2014 2015
PPM
Community DOTS
PAL
Lab capacity for culture and DST
TB/HIV
DOTS+
N.B.Populat�oncoverage�sthepercentageofthepopulat�onthatl�ves�nanareawheretheact�v�ty�s�mplemented.Forcollaborat�veTB/HiVact�v�t�esthepercentagereferstotheproport�onoftheel�g�blepopulat�on,�.e.thepopulat�onl�v�ng�nareasw�thanHiVprevalenceabove�%.ForDOTS-Plus,�t�sthepercentageofdetectedMDR-TBcasesthatareenrolled�nDOTS-Plusprogrammes.
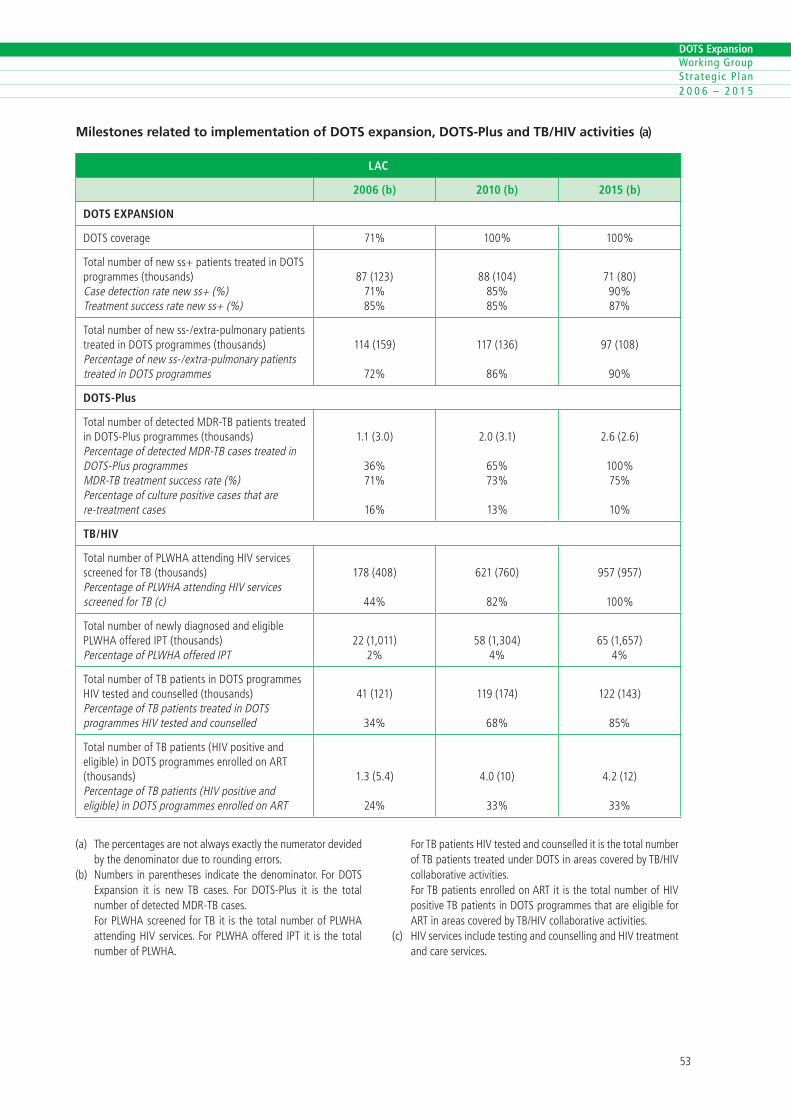
��
DOTS Expansion Working Group S t ra teg ic P lan 2 0 0 6 – 2 0 1 5
��
DOTS Expansion Working Group S t ra teg ic P lan 2 0 0 6 – 2 0 1 5
Milestones related to implementation of DOTS expansion, DOTS-Plus and TB/HIV activities (a)
LAC
2006 (b) 2010 (b) 2015 (b)
DOTS EXPANSION
DOTScoverage ��% �00% �00%
Totalnumberofnewss+pat�entstreated�nDOTSprogrammes(thousands)Casedetect�onratenewss+(%)Treatmentsuccessratenewss+(%)
��(���)��%��%
��(�0�)��%��%
��(�0)�0%��%
Totalnumberofnewss-/extra-pulmonarypat�entstreated�nDOTSprogrammes(thousands)Percentageofnewss-/extra-pulmonarypat�entstreated�nDOTSprogrammes
���(���)
��%
���(���)
��%
��(�0�)
�0%
DOTS-Plus
TotalnumberofdetectedMDR-TBpat�entstreated�nDOTS-Plusprogrammes(thousands)PercentageofdetectedMDR-TBcasestreated�nDOTS-PlusprogrammesMDR-TBtreatmentsuccessrate(%)Percentageofculturepos�t�vecasesthatarere-treatmentcases
�.�(�.0)
��%��%
��%
�.0(�.�)
��%��%
��%
�.�(�.�)
�00%��%
�0%
TB/HIV
TotalnumberofPLWHAattend�ngHiVserv�cesscreenedforTB (thousands)PercentageofPLWHAattend�ngHiVserv�cesscreenedforTB(c)
���(�0�)
��%
���(��0)
��%
���(���)
�00%
Totalnumberofnewlyd�agnosedandel�g�blePLWHAofferediPT(thousands)PercentageofPLWHAofferediPT
��(�,0��)�%
��(�,�0�)�%
��(�,���)�%
TotalnumberofTBpat�ents�nDOTSprogrammesHiVtestedandcounselled(thousands)PercentageofTBpat�entstreated�nDOTSprogrammesHiVtestedandcounselled
��(���)
��%
���(���)
��%
���(���)
��%
TotalnumberofTBpat�ents(HiVpos�t�veandel�g�ble)�nDOTSprogrammesenrolledonART(thousands)PercentageofTBpat�ents(HiVpos�t�veandel�g�ble)�nDOTSprogrammesenrolledonART
�.�(�.�)
��%
�.0(�0)
��%
�.�(��)
��%
(a) Thepercentagesarenotalwaysexactlythenumeratordev�dedbythedenom�natorduetoround�ngerrors.
(b) Numbers �nparentheses �nd�catethedenom�nator.ForDOTSExpans�on �t �s newTB cases. For DOTS-Plus �t �s the totalnumberofdetectedMDR-TBcases.
ForPLWHAscreenedforTB�t �sthetotalnumberofPLWHAattend�ngHiVserv�ces.ForPLWHAoffered iPT �t �s thetotalnumberofPLWHA.
ForTBpat�entsHiVtestedandcounselled�t�sthetotalnumberofTBpat�entstreatedunderDOTS�nareascoveredbyTB/HiVcollaborat�veact�v�t�es.
ForTBpat�entsenrolledonART�t�sthetotalnumberofHiVpos�t�veTBpat�ents�nDOTSprogrammesthatareel�g�bleforART�nareascoveredbyTB/HiVcollaborat�veact�v�t�es.
(c) HiVserv�ces�ncludetest�ngandcounsell�ngandHiVtreatmentandcareserv�ces.
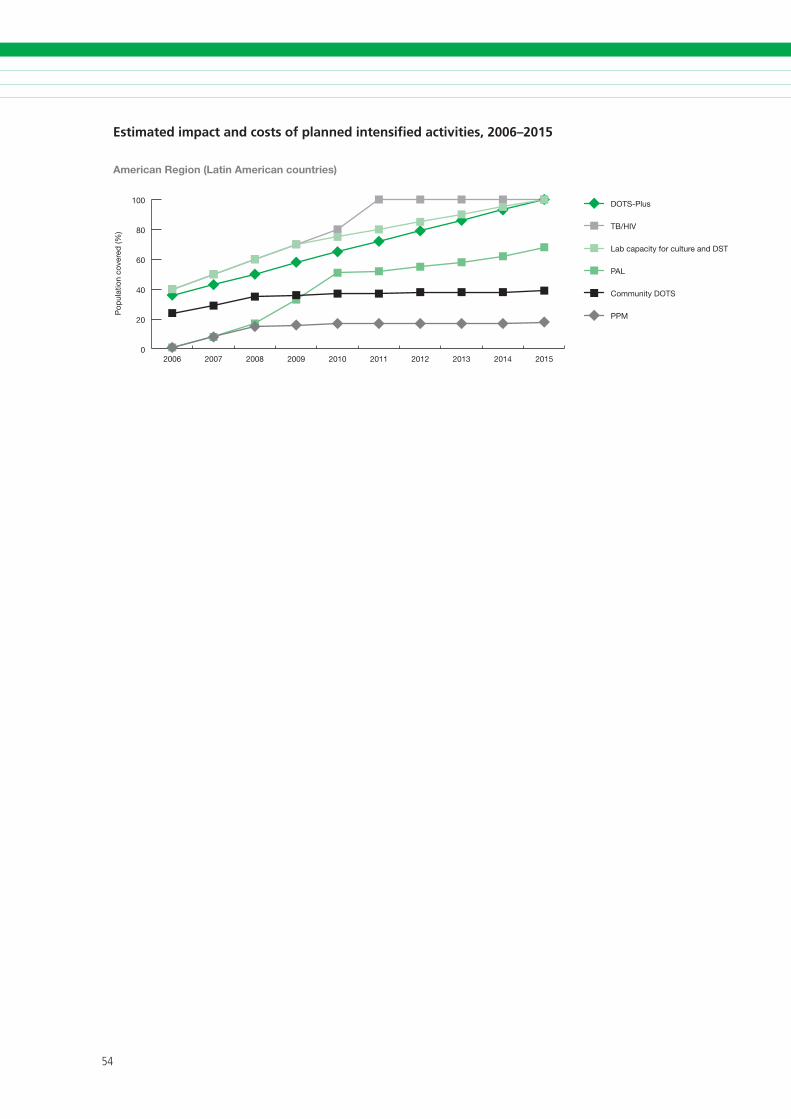
��
DOTS Expansion Working Group S t ra teg ic P lan 2 0 0 6 – 2 0 1 5
��
DOTS Expansion Working Group S t ra teg ic P lan 2 0 0 6 – 2 0 1 5
Estimated impact and costs of planned intensified activities, 2006–2015
0
20
40
60
80
100 DOTS-Plus
TB/HIV
Lab capacity for culture and DST
PAL
Community DOTS
PPM
2015201420132012201120102009200820072006
Pop
ulat
ion
cove
red
(%)
American Region (Latin American countries)

��
DOTS Expansion Working Group S t ra teg ic P lan 2 0 0 6 – 2 0 1 5
��
DOTS Expansion Working Group S t ra teg ic P lan 2 0 0 6 – 2 0 1 5
0
20
40
60
80
100
201520102005200019951990
CD
R n
ew s
s+ (%
)
American Region (Latin American countries): Case detection rate, new ss+ cases
0
20
40
60
80
100 MDR-TB
New ss+
201520102005200019951990
Cas
es o
n D
OTS
(tho
usan
ds)
American Region (Latin American countries): Number of cases treated under DOTS/DOTS-Plus
MD
R c
ases
on
DO
TS-P
lus
(thou
sand
s)
0
10
20
30
40
50
60
0
10
20
30
40
50
60
70Global Plan
sustained DOTS
no DOTS
201520102005200019951990
American Region (Latin American countries): Incidence
Inci
den
ce/1
00,0
00/y
r
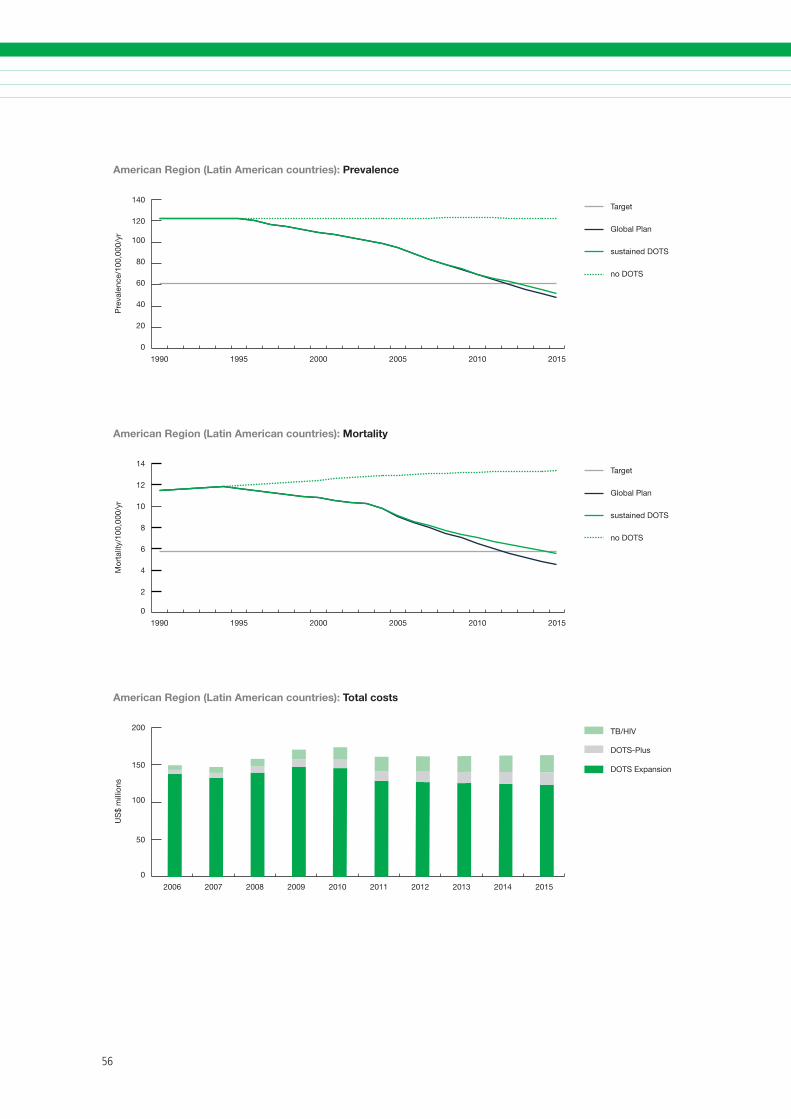
��
DOTS Expansion Working Group S t ra teg ic P lan 2 0 0 6 – 2 0 1 5
��
DOTS Expansion Working Group S t ra teg ic P lan 2 0 0 6 – 2 0 1 5
0
20
40
60
80
100
120
140Target
Global Plan
sustained DOTS
no DOTS
201520102005200019951990
American Region (Latin American countries): Prevalence
Pre
vale
nce/
100,
000/
yr
0
2
4
6
8
10
12
14Target
Global Plan
sustained DOTS
no DOTS
201520102005200019951990
Mor
talit
y/10
0,00
0/yr
American Region (Latin American countries): Mortality
0
50
100
150
200 TB/HIV
DOTS-Plus
DOTS Expansion
2015201420132012201120102009200820072006
US
$ m
illio
ns
American Region (Latin American countries): Total costs
��
DOTS Expansion Working Group S t ra teg ic P lan 2 0 0 6 – 2 0 1 5
��
DOTS Expansion Working Group S t ra teg ic P lan 2 0 0 6 – 2 0 1 5
Summary of planned activities, impact and costs
Achievements
The DOTS strategy was introduced in the Eastern Mediterranean Region in the mid-1990s. Almost all countries in the region have since expanded DOTS services throughout the network of health facilities of Ministries of Health, achieving 100% population coverage as well as high treatment success rates. In 2005, the regional DOTS coverage was close to 90% and the regional average treatment success rate 84%. There are many middle-income coun-tries in the region with a well developed public health care infrastructure. Political commitment to TB control is generally good. Most countries have thus laid the foundation for effective TB control. In other words, they have completed the first stage in the development of TB control, which is to achieve basic DOTS coverage and good treatment outcome within the existing programmes.
Encouragingly, a few countries, such as Morocco and Tunisia, have already achieved the 2005 global targets of detecting at least 70% of new smear-positive cases and treating successfully at least 85% of these cases. TB incidence has started to decline in these countries.
There is increasing awareness in the region of the impact of HIV on TB. Initial steps have been taken to establish HIV surveillance among TB patients and to implement collaborative TB/HIV activities where appropriate. DOTS-Plus pilot projects have been implemented in Egypt, Jordan, Lebanon, Syrian Arab Republic and Tunisia, and PAL has been initi-ated in Jordan, Morocco, Syrian Arab Republic and Tunisia.
Challenges
Geographical expansion of DOTS is incomplete in countries with complex emergencies because of poor health infrastructure or an unsafe environ-ment, namely Afghanistan, Iraq, Somalia and Sudan (South and Darfur). The other countries in the region are now in the second stage in the development of TB control – the stage of further improving quality and access. They are struggling with low case detection: the regional case detec-tion rate is expected to be only 45% by the end of 2005. Case detection in the region’s two high-burden countries – Pakistan and Afghanistan – is still very low at 17% and 18%, respectively. This low case detection is due to many factors. Key components of DOTS, particularly case-finding and surveillance, are not always of high quality. In many countries of the region, the private health care sec-tor is booming but is not yet involved in DOTS. In addition, important segments of the public health care sector, such as social security health services or army health services, are not yet involved.
Coverage of drug resistance surveillance is low but is being expanded. The impact of HIV on TB is becoming increasingly important in countries with a generalized HIV epidemic (e.g. Djibouti, Somalia, Sudan) and in those where injecting drug use is an important cause of HIV infection (e.g. the Islamic Republic of Iran). The challenge will be to implement collaborative TB/HIV activities to address HIV-related TB in settings where health systems are weak and health service delivery is complicated by civil conflict.
Priority activities 2006–2015
The first priority is to improve further the quality of key basic components of DOTS, such as laboratory diagnosis, surveillance and drug management, and to develop and sustain adequate human resources
3. EASTERN MEDITERRANEAN REGION

��
DOTS Expansion Working Group S t ra teg ic P lan 2 0 0 6 – 2 0 1 5
��
DOTS Expansion Working Group S t ra teg ic P lan 2 0 0 6 – 2 0 1 5
to deliver high-quality DOTS. Public-private mix for DOTS will be scaled up widely. The involvement of the nongovernmental sector will continue to be es-sential in areas with complex emergencies.
In order to facilitate implementation of DOTS-Plus, culture and DST services will be scaled up. It is ex-pected that by 2015 DST will be provided for 100% of previously treated TB patients. DOTS-Plus will be expanded in a stepwise approach to reach 100% coverage by 2015. Scaling up culture services will also improve the diagnosis of smear-negative TB cases, which is particularly important for areas with high HIV prevalence.
To further improve quality across different health sectors, and help boost case detection, PAL will be implemented widely in the region. Community DOTS will be scaled up in selected rural areas. Surveillance is important to assess and monitor the burden of HIV infection in TB patients. Collaborative TB/HIV activities need to be implemented and strengthened in settings with a high HIV burden.
Operational research activities will continue to be promoted in order to solve problems identified through the TB surveillance and TB control informa-tion system. Countries in the Eastern Mediterranean Region will be supported in adapting, developing and implementing special strategies to control TB, especially in poor settings and in big cities. In order to realize sustainable political, technical and financial support to TB control, Stop TB Partnerships will be developed at regional and national levels, and strategic approaches for communication, ad-vocacy and social mobilization will be adapted and implemented. Expected effects and costs
Successful implementation of the activities described above is expected to increase case detection rapidly to 73% by 2010 and 80% by 2015. The treatment success rate will increase from 84% to 87% in 2010 and be sustained at this level. TB incidence, prevalence and death rates are already falling in the region. Planned activities are predicted to boost the decline further and the 2015 Partnership targets, linked to the MDG target, will be met in the Eastern Mediterranean Region.
During the period of the Global Plan (2006–2015), it is estimated that 3.6 million people will be treated in DOTS programmes and 48 000 in DOTS-Plus. In addition, 36 000 TB patients will be enrolled on ART. The combined effect of all interventions will be to prevent about 798 000 deaths, in comparison with a situation in which no DOTS programmes are implemented, or about 196 000 deaths in compari-son with a situation in which TB control efforts are sustained at 2005 levels.
The total estimated cost of DOTS expansion, DOTS-Plus and collaborative TB/HIV control activities in the Eastern Mediterranean Region from 2006 to 2015 is US$ 2.6 billion.
Cost of planned TB control activities, Eastern Mediterranean Region, 2006–2015
Planned activities US$ millions
DOTSexpans�onandqual�ty ���� (��%)
DOTS-Plus ��� (�%)
Collaborat�veTB/HiVact�v�t�es ��� (�%)
Total 2622 (100%)
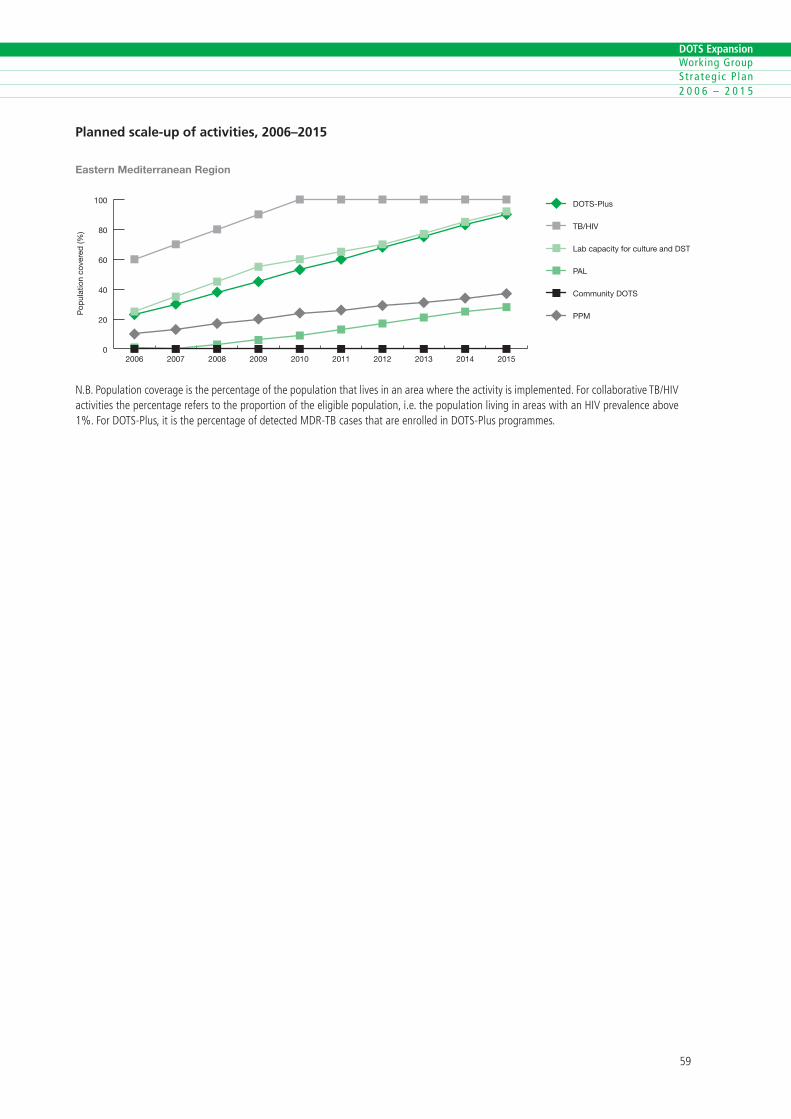
��
DOTS Expansion Working Group S t ra teg ic P lan 2 0 0 6 – 2 0 1 5
��
DOTS Expansion Working Group S t ra teg ic P lan 2 0 0 6 – 2 0 1 5
Planned scale-up of activities, 2006–2015
0
20
40
60
80
100 DOTS-Plus
TB/HIV
Lab capacity for culture and DST
PAL
Community DOTS
PPM
2015201420132012201120102009200820072006
Eastern Mediterranean Region
Pop
ulat
ion
cove
red
(%)
N.B.Populat�oncoverage�sthepercentageofthepopulat�onthatl�ves�nanareawheretheact�v�ty�s�mplemented.Forcollaborat�veTB/HiVact�v�t�esthepercentagereferstotheproport�onoftheel�g�blepopulat�on,�.e.thepopulat�onl�v�ng�nareasw�thanHiVprevalenceabove�%.ForDOTS-Plus,�t�sthepercentageofdetectedMDR-TBcasesthatareenrolled�nDOTS-Plusprogrammes.
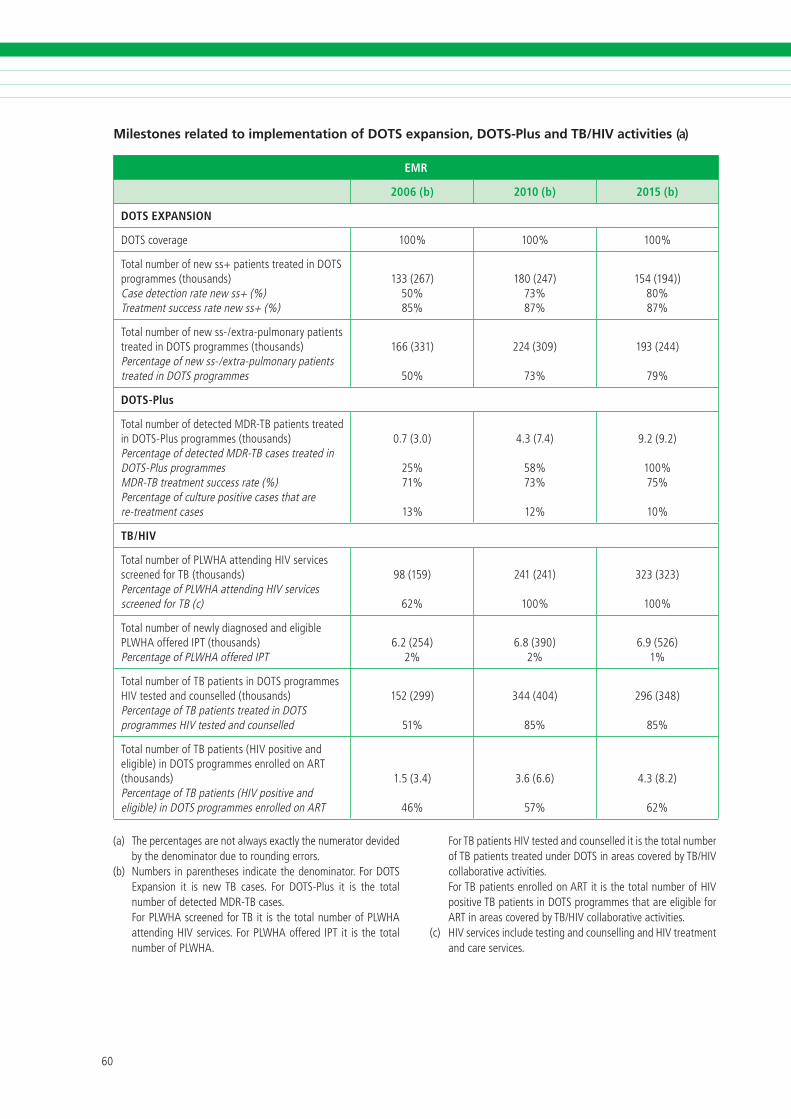
�0
DOTS Expansion Working Group S t ra teg ic P lan 2 0 0 6 – 2 0 1 5
��
DOTS Expansion Working Group S t ra teg ic P lan 2 0 0 6 – 2 0 1 5
Milestones related to implementation of DOTS expansion, DOTS-Plus and TB/HIV activities (a)
EMR
2006 (b) 2010 (b) 2015 (b)
DOTS EXPANSION
DOTScoverage �00% �00% �00%
Totalnumberofnewss+pat�entstreated�nDOTSprogrammes(thousands)Casedetect�onratenewss+(%)Treatmentsuccessratenewss+(%)
���(���)�0%��%
��0(���)��%��%
���(���))�0%��%
Totalnumberofnewss-/extra-pulmonarypat�entstreated�nDOTSprogrammes(thousands)Percentageofnewss-/extra-pulmonarypat�entstreated�nDOTSprogrammes
���(���)
�0%
���(�0�)
��%
���(���)
��%
DOTS-Plus
TotalnumberofdetectedMDR-TBpat�entstreated�nDOTS-Plusprogrammes(thousands)PercentageofdetectedMDR-TBcasestreated�nDOTS-PlusprogrammesMDR-TBtreatmentsuccessrate(%)Percentageofculturepos�t�vecasesthatarere-treatmentcases
0.�(�.0)
��%��%
��%
�.�(�.�)
��%��%
��%
�.�(�.�)
�00%��%
�0%
TB/HIV
TotalnumberofPLWHAattend�ngHiVserv�cesscreenedforTB (thousands)PercentageofPLWHAattend�ngHiVserv�cesscreenedforTB(c)
��(���)
��%
���(���)
�00%
���(���)
�00%
Totalnumberofnewlyd�agnosedandel�g�blePLWHAofferediPT(thousands)PercentageofPLWHAofferediPT
�.�(���)�%
�.�(��0)�%
�.�(���)�%
TotalnumberofTBpat�ents�nDOTSprogrammesHiVtestedandcounselled(thousands)PercentageofTBpat�entstreated�nDOTSprogrammesHiVtestedandcounselled
���(���)
��%
���(�0�)
��%
���(���)
��%
TotalnumberofTBpat�ents(HiVpos�t�veandel�g�ble)�nDOTSprogrammesenrolledonART(thousands)PercentageofTBpat�ents(HiVpos�t�veandel�g�ble)�nDOTSprogrammesenrolledonART
�.�(�.�)
��%
�.�(�.�)
��%
�.�(�.�)
��%
(a) Thepercentagesarenotalwaysexactlythenumeratordev�dedbythedenom�natorduetoround�ngerrors.
(b) Numbers �nparentheses �nd�catethedenom�nator.ForDOTSExpans�on �t �s newTB cases. For DOTS-Plus �t �s the totalnumberofdetectedMDR-TBcases.
ForPLWHAscreenedforTB�t �sthetotalnumberofPLWHAattend�ngHiVserv�ces.ForPLWHAoffered iPT �t �s thetotalnumberofPLWHA.
ForTBpat�entsHiVtestedandcounselled�t�sthetotalnumberofTBpat�entstreatedunderDOTS�nareascoveredbyTB/HiVcollaborat�veact�v�t�es.
ForTBpat�entsenrolledonART�t�sthetotalnumberofHiVpos�t�veTBpat�ents�nDOTSprogrammesthatareel�g�bleforART�nareascoveredbyTB/HiVcollaborat�veact�v�t�es.
(c) HiVserv�ces�ncludetest�ngandcounsell�ngandHiVtreatmentandcareserv�ces.
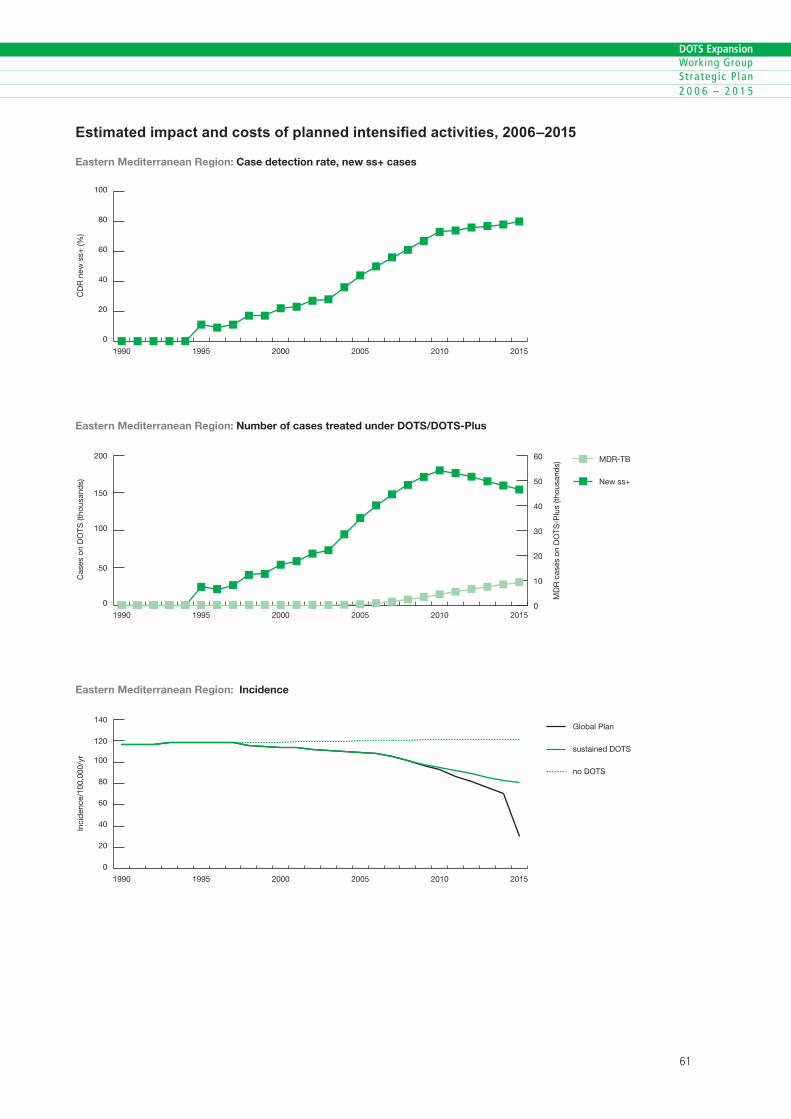
�0
DOTS Expansion Working Group S t ra teg ic P lan 2 0 0 6 – 2 0 1 5
��
DOTS Expansion Working Group S t ra teg ic P lan 2 0 0 6 – 2 0 1 5
Estimated impact and costs of planned intensified activities, 2006–2015
0
20
40
60
80
100
201520102005200019951990
Eastern Mediterranean Region: Case detection rate, new ss+ cases
CD
R n
ew s
s+ (%
)
0
50
100
150
200 MDR-TB
New ss+
201520102005200019951990
Eastern Mediterranean Region: Number of cases treated under DOTS/DOTS-Plus
Cas
es o
n D
OTS
(tho
usan
ds)
MD
R c
ases
on
DO
TS-P
lus
(thou
sand
s)
0
10
20
30
40
50
60
0
20
40
60
80
100
120
140Global Plan
sustained DOTS
no DOTS
201520102005200019951990
Inci
den
ce/1
00,0
00/y
r
Eastern Mediterranean Region: Incidence
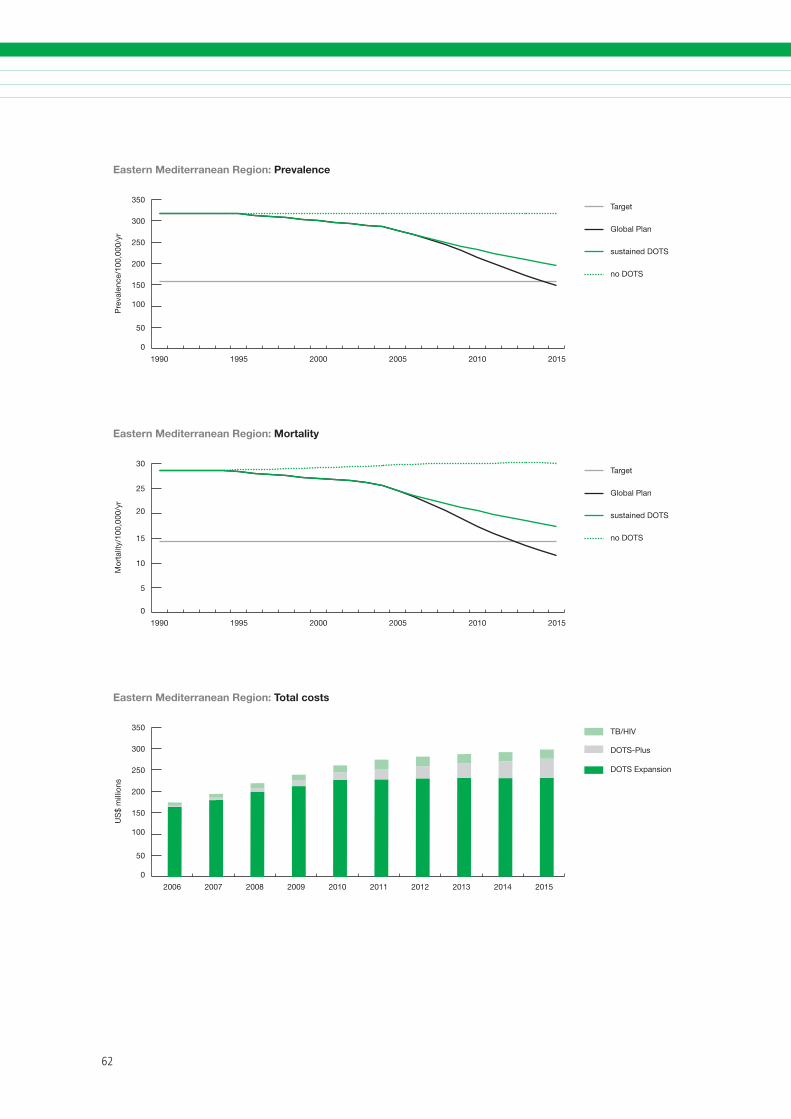
��
DOTS Expansion Working Group S t ra teg ic P lan 2 0 0 6 – 2 0 1 5
��
DOTS Expansion Working Group S t ra teg ic P lan 2 0 0 6 – 2 0 1 5
0
50
100
150
200
250
300
350Target
Global Plan
sustained DOTS
no DOTS
201520102005200019951990
Pre
vale
nce/
100,
000/
yr
Eastern Mediterranean Region: Prevalence
0
5
10
15
20
25
30Target
Global Plan
sustained DOTS
no DOTS
201520102005200019951990
Eastern Mediterranean Region: Mortality
Mor
talit
y/10
0,00
0/yr
0
50
100
150
200
250
300
350 TB/HIV
DOTS-Plus
DOTS Expansion
2015201420132012201120102009200820072006
Eastern Mediterranean Region: Total costs
US
$ m
illio
ns
��
DOTS Expansion Working Group S t ra teg ic P lan 2 0 0 6 – 2 0 1 5
��
DOTS Expansion Working Group S t ra teg ic P lan 2 0 0 6 – 2 0 1 5
Summary of planned activities, impact and costs
Achievements
The rapid increase in case notification rates in the Eastern European Region after the collapse of the Soviet Union – reaching nearly 15% per year – ap-pears to have been halted. Case notification rates peaked in 2001, since when they have started slowly to decline. DOTS coverage increased from 30% in 2000 to 39% in 2003 and is expected to reach 46% in 2005. The case detection rate was only 22% in 2003 but is expected to reach 40% in 2005. However, this progress has to be seen against a 2005 global target of 70%. The treatment success rate in DOTS pro-grammes reached 76% in the 2002 cohort, with a target of 85% for 2005. Improved treatment success rates can be attributed to improved implementation of DOTS, sometimes as a result of the introduction of incentives and enablers targeting socially vulnerable TB patients and health workers involved in TB con-trol. Special risk groups – minorities, refugees and asylum seekers – have been targeted in some places, but the interventions are limited to the project areas, in spite of the good results achieved.
With assistance from the Green Light Committee and several partners, sound MDR-TB control based on WHO recommendations has been implemented countrywide in Estonia and Latvia, and pilot-testing has started in Azerbaijan and Georgia (in prison projects), Kyrgyzstan, the Republic of Moldova, Romania, the Russian Federation and Uzbekistan. A number of countries are planning to set up pi-lot projects and scale up DOTS-Plus, with funding mainly from the GFATM.
Pilot projects of collaborative TB/HIV activities to address HIV-related TB have commenced or are planned in most of the countries with a high bur-den of TB/HIV coinfection.
4. EASTERN EUROPEAN REGION
Challenges
The Eastern European Region has the lowest level of DOTS coverage and DOTS case detection of all regions. The regional treatment success rate is second-lowest, only slightly higher than that in the high HIV preva-lence African Region. The expansion of high-quality TB diagnostic and treatment services in the Eastern European Region is severely limited by lack of politi-cal will, weak public health infrastructure (particularly a lack of laboratory capacity to perform high-quality bacteriological investigations), the vertical organiza-tion of TB control programmes, limited involvement of important health care providers, and, perhaps most importantly, inadequately trained human resources.
The majority of TB patients in the region belong to socially vulnerable groups, such as the homeless, the unemployed, migrants, alcohol-dependent people and ex-prisoners. Without measures to alleviate poverty and improve living standards in these coun-tries, other public health efforts to control TB will have only limited impact.
The wide extent of drug resistance (including MDR-TB) in Eastern Europe represents a critical challenge to TB control, as reflected in low treatment success rates. MDR-TB patients managed outside DOTS-Plus projects are treated according to the availability of drugs and the ability of patients to purchase drugs, with a high risk of inadequate treatment and con-tinuing amplification of drug resistance. Three re-ports on global anti-TB drug resistance surveillance have confirmed the serious scale and spread of drug resistance in Eastern Europe, especially in the former Soviet Union countries. In addition, drug resistance patterns are more severe than in other regions, with TB strains often resistant to all first-line drugs and also to some second-line drugs.
Prisons in the former Soviet Union have been high-lighted as a breeding ground for TB, and especially
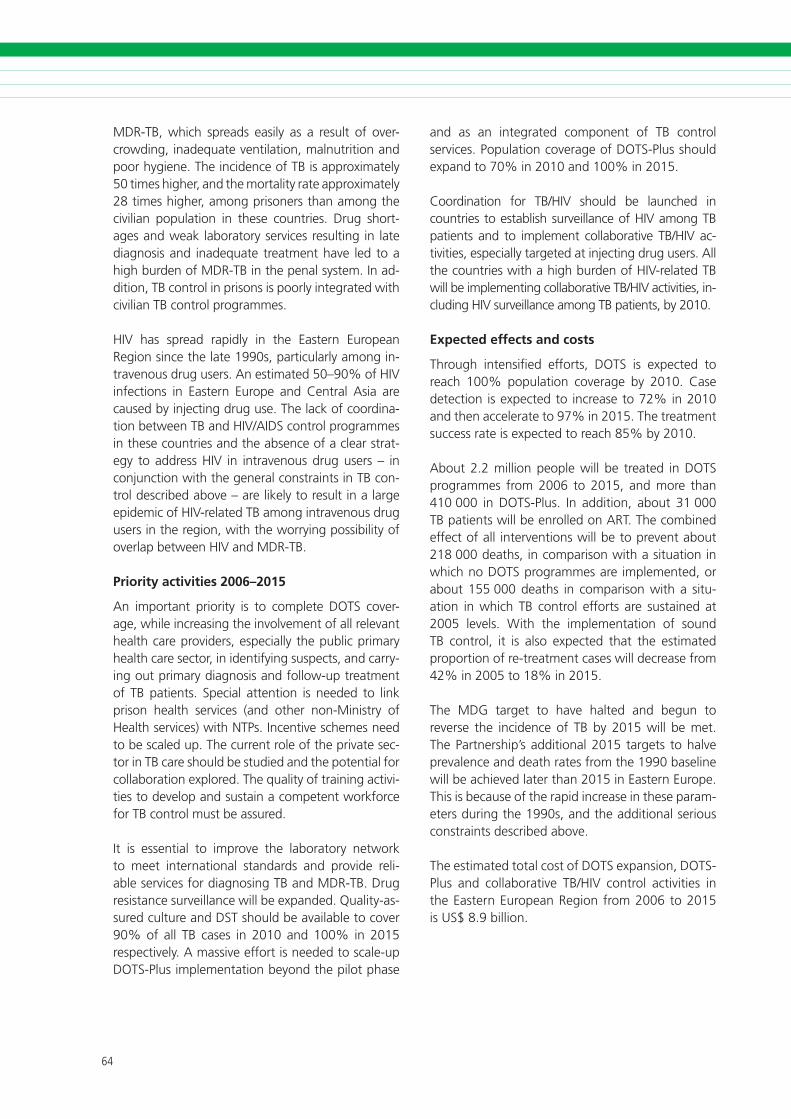
��
DOTS Expansion Working Group S t ra teg ic P lan 2 0 0 6 – 2 0 1 5
��
DOTS Expansion Working Group S t ra teg ic P lan 2 0 0 6 – 2 0 1 5
MDR-TB, which spreads easily as a result of over-crowding, inadequate ventilation, malnutrition and poor hygiene. The incidence of TB is approximately 50 times higher, and the mortality rate approximately 28 times higher, among prisoners than among the civilian population in these countries. Drug short-ages and weak laboratory services resulting in late diagnosis and inadequate treatment have led to a high burden of MDR-TB in the penal system. In ad-dition, TB control in prisons is poorly integrated with civilian TB control programmes.
HIV has spread rapidly in the Eastern European Region since the late 1990s, particularly among in-travenous drug users. An estimated 50–90% of HIV infections in Eastern Europe and Central Asia are caused by injecting drug use. The lack of coordina-tion between TB and HIV/AIDS control programmes in these countries and the absence of a clear strat-egy to address HIV in intravenous drug users – in conjunction with the general constraints in TB con-trol described above – are likely to result in a large epidemic of HIV-related TB among intravenous drug users in the region, with the worrying possibility of overlap between HIV and MDR-TB.
Priority activities 2006–2015
An important priority is to complete DOTS cover-age, while increasing the involvement of all relevant health care providers, especially the public primary health care sector, in identifying suspects, and carry-ing out primary diagnosis and follow-up treatment of TB patients. Special attention is needed to link prison health services (and other non-Ministry of Health services) with NTPs. Incentive schemes need to be scaled up. The current role of the private sec-tor in TB care should be studied and the potential for collaboration explored. The quality of training activi-ties to develop and sustain a competent workforce for TB control must be assured.
It is essential to improve the laboratory network to meet international standards and provide reli-able services for diagnosing TB and MDR-TB. Drug resistance surveillance will be expanded. Quality-as-sured culture and DST should be available to cover 90% of all TB cases in 2010 and 100% in 2015 respectively. A massive effort is needed to scale-up DOTS-Plus implementation beyond the pilot phase
and as an integrated component of TB control services. Population coverage of DOTS-Plus should expand to 70% in 2010 and 100% in 2015.
Coordination for TB/HIV should be launched in countries to establish surveillance of HIV among TB patients and to implement collaborative TB/HIV ac-tivities, especially targeted at injecting drug users. All the countries with a high burden of HIV-related TB will be implementing collaborative TB/HIV activities, in-cluding HIV surveillance among TB patients, by 2010.
Expected effects and costs
Through intensified efforts, DOTS is expected to reach 100% population coverage by 2010. Case detection is expected to increase to 72% in 2010 and then accelerate to 97% in 2015. The treatment success rate is expected to reach 85% by 2010.
About 2.2 million people will be treated in DOTS programmes from 2006 to 2015, and more than 410 000 in DOTS-Plus. In addition, about 31 000 TB patients will be enrolled on ART. The combined effect of all interventions will be to prevent about 218 000 deaths, in comparison with a situation in which no DOTS programmes are implemented, or about 155 000 deaths in comparison with a situ-ation in which TB control efforts are sustained at 2005 levels. With the implementation of sound TB control, it is also expected that the estimated proportion of re-treatment cases will decrease from 42% in 2005 to 18% in 2015.
The MDG target to have halted and begun to reverse the incidence of TB by 2015 will be met. The Partnership’s additional 2015 targets to halve prevalence and death rates from the 1990 baseline will be achieved later than 2015 in Eastern Europe. This is because of the rapid increase in these param-eters during the 1990s, and the additional serious constraints described above.
The estimated total cost of DOTS expansion, DOTS-Plus and collaborative TB/HIV control activities in the Eastern European Region from 2006 to 2015 is US$ 8.9 billion.
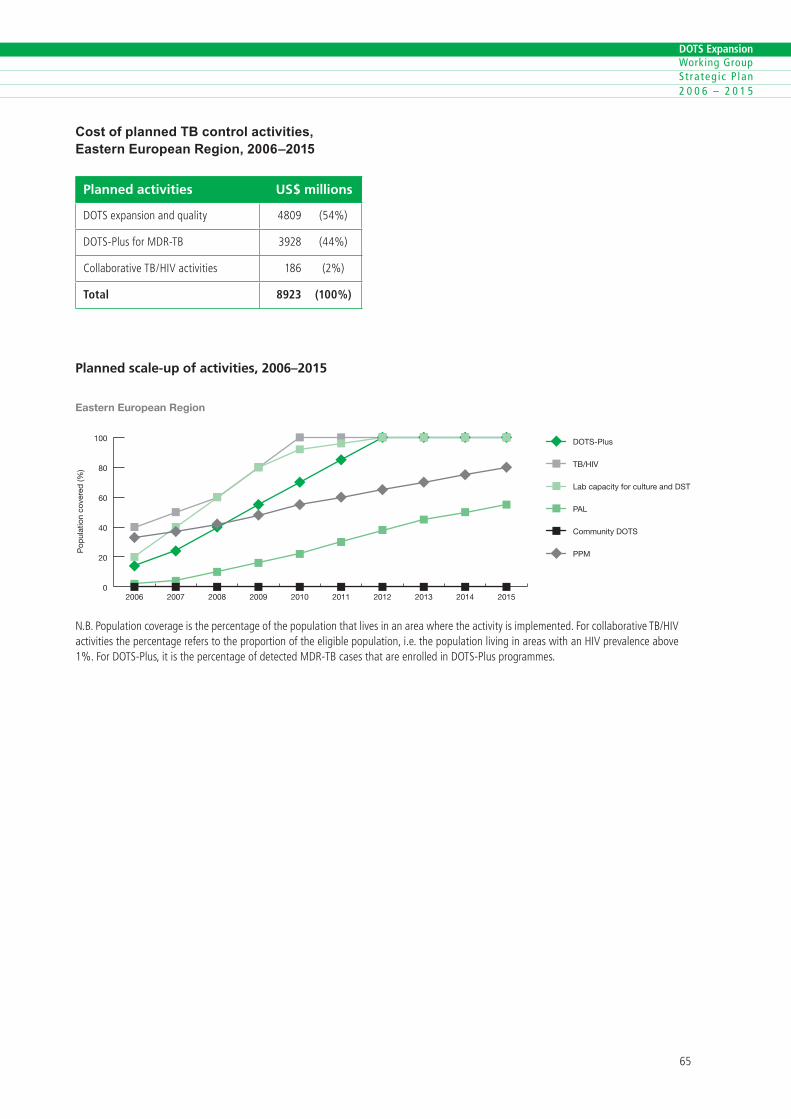
��
DOTS Expansion Working Group S t ra teg ic P lan 2 0 0 6 – 2 0 1 5
��
DOTS Expansion Working Group S t ra teg ic P lan 2 0 0 6 – 2 0 1 5
Cost of planned TB control activities, Eastern European Region, 2006–2015
Planned activities US$ millions
DOTSexpans�onandqual�ty ��0� (��%)
DOTS-PlusforMDR-TB ���� (��%)
Collaborat�veTB/HiVact�v�t�es ��� (�%)
Total 8923 (100%)
Planned scale-up of activities, 2006–2015
0
20
40
60
80
100 DOTS-Plus
TB/HIV
Lab capacity for culture and DST
PAL
Community DOTS
PPM
2015201420132012201120102009200820072006
Pop
ulat
ion
cove
red
(%)
Eastern European Region
N.B.Populat�oncoverage�sthepercentageofthepopulat�onthatl�ves�nanareawheretheact�v�ty�s�mplemented.Forcollaborat�veTB/HiVact�v�t�esthepercentagereferstotheproport�onoftheel�g�blepopulat�on,�.e.thepopulat�onl�v�ng�nareasw�thanHiVprevalenceabove�%.ForDOTS-Plus,�t�sthepercentageofdetectedMDR-TBcasesthatareenrolled�nDOTS-Plusprogrammes.
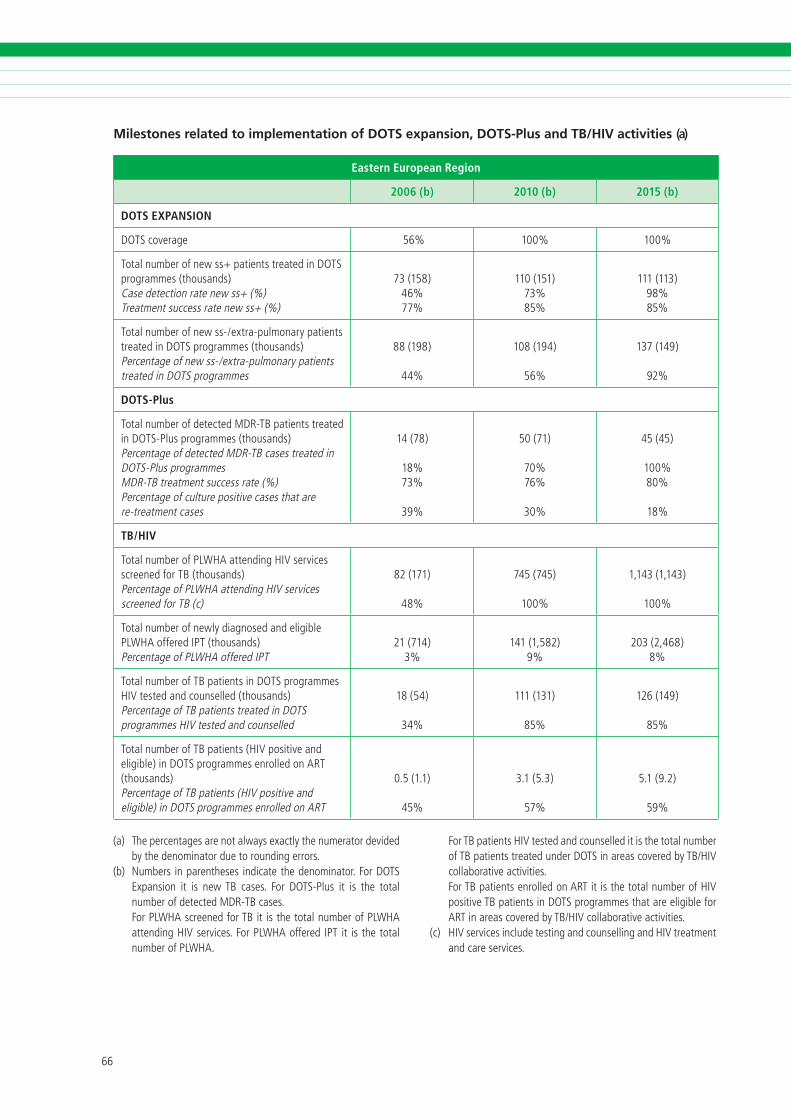
��
DOTS Expansion Working Group S t ra teg ic P lan 2 0 0 6 – 2 0 1 5
��
DOTS Expansion Working Group S t ra teg ic P lan 2 0 0 6 – 2 0 1 5
Milestones related to implementation of DOTS expansion, DOTS-Plus and TB/HIV activities (a)
Eastern European Region
2006 (b) 2010 (b) 2015 (b)
DOTS EXPANSION
DOTScoverage ��% �00% �00%
Totalnumberofnewss+pat�entstreated�nDOTSprogrammes(thousands)Casedetect�onratenewss+(%)Treatmentsuccessratenewss+(%)
��(���)��%��%
��0(���)��%��%
���(���)��%��%
Totalnumberofnewss-/extra-pulmonarypat�entstreated�nDOTSprogrammes(thousands)Percentageofnewss-/extra-pulmonarypat�entstreated�nDOTSprogrammes
��(���)
��%
�0�(���)
��%
���(���)
��%
DOTS-Plus
TotalnumberofdetectedMDR-TBpat�entstreated�nDOTS-Plusprogrammes(thousands)PercentageofdetectedMDR-TBcasestreated�nDOTS-PlusprogrammesMDR-TBtreatmentsuccessrate(%)Percentageofculturepos�t�vecasesthatarere-treatmentcases
��(��)
��%��%
��%
�0(��)
�0%��%
�0%
��(��)
�00%�0%
��%
TB/HIV
TotalnumberofPLWHAattend�ngHiVserv�cesscreenedforTB (thousands)PercentageofPLWHAattend�ngHiVserv�cesscreenedforTB(c)
��(���)
��%
���(���)
�00%
�,���(�,���)
�00%
Totalnumberofnewlyd�agnosedandel�g�blePLWHAofferediPT(thousands)PercentageofPLWHAofferediPT
��(���)�%
���(�,���)�%
�0�(�,���)�%
TotalnumberofTBpat�ents�nDOTSprogrammesHiVtestedandcounselled(thousands)PercentageofTBpat�entstreated�nDOTSprogrammesHiVtestedandcounselled
��(��)
��%
���(���)
��%
���(���)
��%
TotalnumberofTBpat�ents(HiVpos�t�veandel�g�ble)�nDOTSprogrammesenrolledonART(thousands)PercentageofTBpat�ents(HiVpos�t�veandel�g�ble)�nDOTSprogrammesenrolledonART
0.�(�.�)
��%
�.�(�.�)
��%
�.�(�.�)
��%
(a) Thepercentagesarenotalwaysexactlythenumeratordev�dedbythedenom�natorduetoround�ngerrors.
(b) Numbers �nparentheses �nd�catethedenom�nator.ForDOTSExpans�on �t �s newTB cases. For DOTS-Plus �t �s the totalnumberofdetectedMDR-TBcases.
ForPLWHAscreenedforTB�t �sthetotalnumberofPLWHAattend�ngHiVserv�ces.ForPLWHAoffered iPT �t �s thetotalnumberofPLWHA.
ForTBpat�entsHiVtestedandcounselled�t�sthetotalnumberofTBpat�entstreatedunderDOTS�nareascoveredbyTB/HiVcollaborat�veact�v�t�es.
ForTBpat�entsenrolledonART�t�sthetotalnumberofHiVpos�t�veTBpat�ents�nDOTSprogrammesthatareel�g�bleforART�nareascoveredbyTB/HiVcollaborat�veact�v�t�es.
(c) HiVserv�ces�ncludetest�ngandcounsell�ngandHiVtreatmentandcareserv�ces.
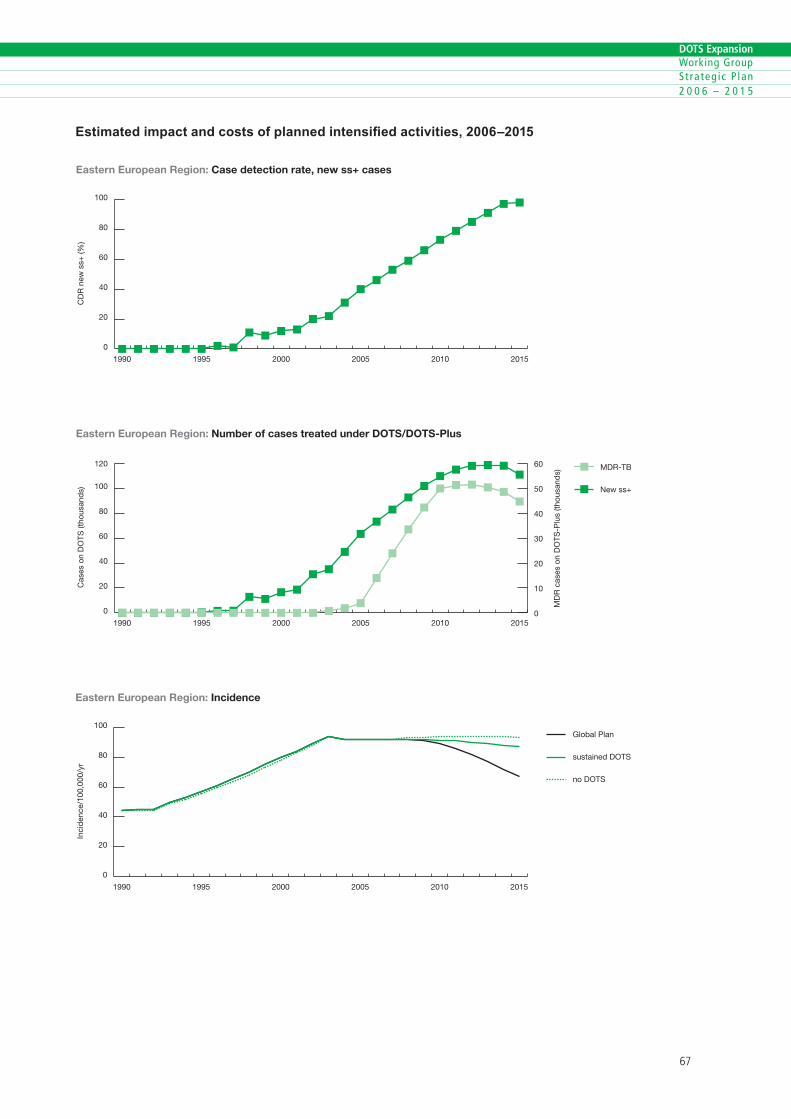
��
DOTS Expansion Working Group S t ra teg ic P lan 2 0 0 6 – 2 0 1 5
��
DOTS Expansion Working Group S t ra teg ic P lan 2 0 0 6 – 2 0 1 5
Estimated impact and costs of planned intensified activities, 2006–2015
0
20
40
60
80
100
201520102005200019951990
CD
R n
ew s
s+ (%
)
Eastern European Region: Case detection rate, new ss+ cases
0
20
40
60
80
100
120 MDR-TB
New ss+
201520102005200019951990
Cas
es o
n D
OTS
(tho
usan
ds)
Eastern European Region: Number of cases treated under DOTS/DOTS-Plus
MD
R c
ases
on
DO
TS-P
lus
(thou
sand
s)
0
10
20
30
40
50
60
0
20
40
60
80
100Global Plan
sustained DOTS
no DOTS
201520102005200019951990
Eastern European Region: Incidence
Inci
den
ce/1
00,0
00/y
r
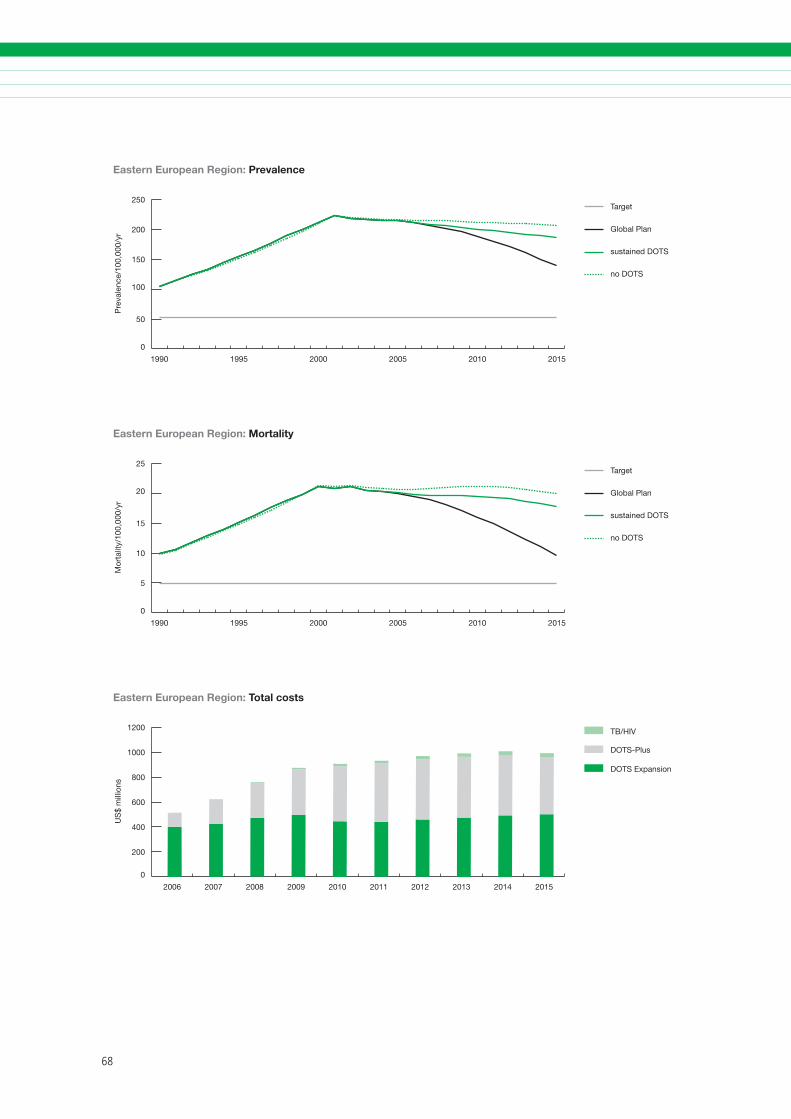
��
DOTS Expansion Working Group S t ra teg ic P lan 2 0 0 6 – 2 0 1 5
��
DOTS Expansion Working Group S t ra teg ic P lan 2 0 0 6 – 2 0 1 5
0
50
100
150
200
250Target
Global Plan
sustained DOTS
no DOTS
201520102005200019951990
Eastern European Region: Prevalence
Pre
vale
nce/
100,
000/
yr
0
5
10
15
20
25Target
Global Plan
sustained DOTS
no DOTS
201520102005200019951990
Mor
talit
y/10
0,00
0/yr
Eastern European Region: Mortality
0
200
400
600
800
1000
1200 TB/HIV
DOTS-Plus
DOTS Expansion
2015201420132012201120102009200820072006
US
$ m
illio
ns
Eastern European Region: Total costs
��
DOTS Expansion Working Group S t ra teg ic P lan 2 0 0 6 – 2 0 1 5
��
DOTS Expansion Working Group S t ra teg ic P lan 2 0 0 6 – 2 0 1 5
Summary of planned activities, impact and costs
Achievements
DOTS expanded rapidly in the South-East Asia Region over the period of the Partnership’s first Global Plan (2001–2005), and 100% geographical coverage was achieved in 2005. All the region’s HBCs (Bangladesh, India, Indonesia, Myanmar and Thailand) have made impressive progress in improv-ing coverage and quality. Case detection increased from a mere 18% in 2000 to 45% in 2003 and is expected to reach about 65% by the end of 2005, against the World Health Assembly and Stop TB Partnership’s 2005 target of 70%. The treatment success rate in the region is already 85.3%, meet-ing the 2005 target of 85%. This progress has been made possible through strong political commitment and large investments in improved infrastructure, reliable drug supply, increased staffing, improved laboratory services, and intensified training and supervision.
Increasingly, TB programmes in the region have reached out to a wide range of public and private health care providers in order to increase access to high-quality services. Community involvement is already a prominent feature in several TB pro-grammes in the region. NGOs with roots in the local community are playing leading roles in several places. Community volunteers are widely used to supervise treatment.
The WHO Regional Strategic Plan on HIV/TB rec-ommends key strategies and interventions for re-ducing HIV/TB-associated morbidity and mortality through enhanced collaboration between national TB and AIDS programmes. Thailand has established comprehensive joint TB/HIV services throughout the country. India, Indonesia, and Myanmar have established formal collaboration between their
5. SOUTH-EAST ASIA REGION
national TB programmes and national AIDS pro-grammes and have identified collaborative TB/HIV interventions and activities, while three countries (India, Myanmar and Thailand) are planning to carry out HIV surveillance among TB patients.
DOTS-Plus pilot projects are being implemented in India and Nepal. India has a national plan for drug re-sistance surveillance as well as a plan for pilot-testing and implementing DOTS-Plus. Currently, the capac-ity for culture and DST is very limited in the region, though Bangladesh, Indonesia and Myanmar are also planning to scale up quality-assured culture, DST and DOTS-Plus with resources from the GFATM.
Challenges
Over the Global Plan period of 2006–2015, strong political commitment needs to be maintained and the current level of funding increased in order to continue to improve access to high quality TB ser-vices. With an estimated 35% of cases still not being reached through existing DOTS services, significant and sustained efforts will be needed to continue the current positive trends. Most countries in the region have a very diversified health care system, with a number of public and private health-care providers still not linked to the DOTS programmes. A major challenge for the future is to involve a critical mass of these providers in extending quality-assured DOTS services in both urban and rural areas.
The South-East Asia Region is the region second-hardest hit by the HIV-epidemic, after sub-Saharan Africa. More than 6 million people were estimated to be living with HIV in December 2004. The extent of the epidemic of TB/HIV coinfection in the region will depend on the future course of the HIV epi-demic, as well as on efforts to control TB. Estimated HIV prevalence among TB patients ranges from 0.1% in Bangladesh, through 4.6% in India, to 8.7% in Thailand. Data from a region of Thailand
�0
DOTS Expansion Working Group S t ra teg ic P lan 2 0 0 6 – 2 0 1 5
��
DOTS Expansion Working Group S t ra teg ic P lan 2 0 0 6 – 2 0 1 5
with low HIV prevalence illustrate that the uptake of HIV counselling and testing is low among TB pa-tients, a challenge that will need to be addressed as HIV counselling and testing facilities become more readily accessible.
Coverage of drug resistance surveillance is low in the region, mainly because of limited data from Bangladesh, India and Indonesia, making it difficult to assess the regional MDR-TB situation. Available data show that, while the levels of MDR-TB among previously untreated cases may be below 3%, the large numbers of TB cases translate into a significant burden of MDR-TB in South-East Asia. It is estimated that 25% of all MDR-TB cases worldwide are in India alone. Most NTPs in the region do not at present diagnose and treat MDR-TB patients, though many other public and private providers do, using widely available second-line drugs without following inter-national standards.
Priority activities 2006–2015
First and foremost, attention will need to be fo-cused on sustaining commitment and resources for TB control, particularly sustaining adequate human resource capabilities to deliver high-quality DOTS services. Second, to increase the reach of DOTS, scaling up the participation of other sectors – par-ticularly the large and vibrant private sector in the region – will be critical. Expanding PPM DOTS will be especially important in the rapidly growing ur-ban areas, where TB control struggles to cope with a complex range of health providers as well as a diverse mix of TB patients, including slum-dwellers and migrants.
Community outreach activities, as well as educa-tion, information and communication campaigns empowering communities to develop their own strategies, will be important if high-quality services are to be provided for the poor and the marginalized in remote rural and cross-border areas, and among displaced communities. Decentralizing services and involving all health and social workers at the grass-roots level should help reduce barriers to access for women and children.
The region also needs to focus on the growing problem of drug resistance. Improving the quality of
DOTS services made available by all health-care pro-viders will halt and reverse the development of drug resistance. DST should be scaled up to cover 20% of new TB patients and 100% of previously treated TB patients in 2015. DOTS-Plus population coverage should expand to 50% by 2010 and 100% by 2015.
Surveillance of HIV among TB patients needs to be established in countries with a high burden of HIV-related TB. Collaborative TB/HIV activities will be expanded to all populations with a high burden of HIV-related TB by the end of 2009. PAL initiatives will be scaled up, with a main focus on urban areas.
Expected effects and costs
Through the intensified efforts outlined above, case detection is expected to increase to 79% by 2010 and 84% by 2015. The treatment success rate is already at the 2005 target level of 85% and is expected to increase to between 85–90% by 2010 and then remain at this level (noting that 87% is used as the treatment success rate in the scenario calculations). As a consequence, the expected de-cline in incidence, prevalence and death rates would mean that the Partnership’s targets would be met ahead of the target date of 2015 in the South-East Asia Region.
The projected rapid decline in incidence and new cases under the scenario shown in the figures is based on the assumption that all countries and par-ticularly the five high-burden countries in the region will continue to maintain or surpass the 70% case detection and 85% treatment success rates. These rates of decline will also depend on how effectively initiatives such as DOTS-Plus, PPM DOTS and inter-ventions for TB/HIV among others, are implemented to counterbalance the effect of HIV and the emer-gence of MDR-TB in countries in the region.
During the period of the Global Plan (2006–2015), it is estimated that at least 16 million people will be treated in DOTS programmes and more than 145 000 in DOTS-Plus. In addition, 306 000 TB pa-tients will be enrolled on ART. The combined effect of all interventions will be to prevent about 5 mil-lion deaths, in comparison with a situation in which no DOTS programmes are implemented, or about 460 000 deaths in comparison with a situation in
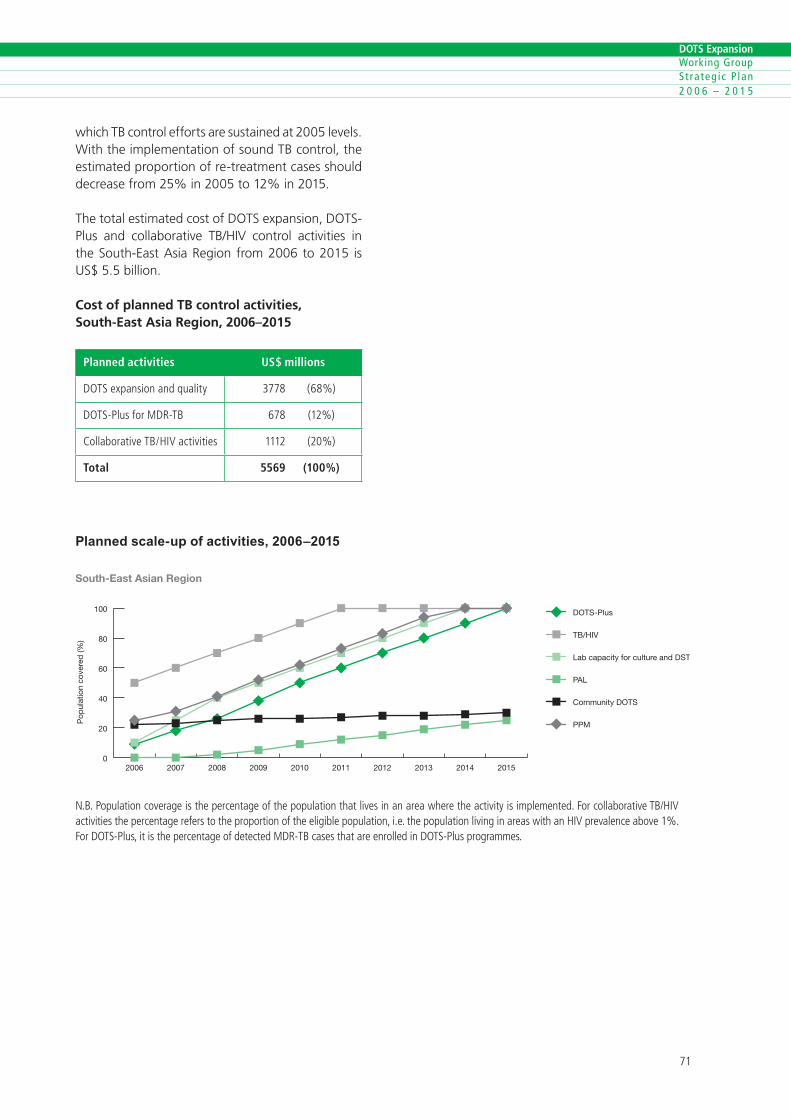
�0
DOTS Expansion Working Group S t ra teg ic P lan 2 0 0 6 – 2 0 1 5
��
DOTS Expansion Working Group S t ra teg ic P lan 2 0 0 6 – 2 0 1 5
which TB control efforts are sustained at 2005 levels. With the implementation of sound TB control, the estimated proportion of re-treatment cases should decrease from 25% in 2005 to 12% in 2015.
The total estimated cost of DOTS expansion, DOTS-Plus and collaborative TB/HIV control activities in the South-East Asia Region from 2006 to 2015 is US$ 5.5 billion.
Cost of planned TB control activities, South-East Asia Region, 2006–2015
Planned activities US$ millions
DOTSexpans�onandqual�ty ���� (��%)
DOTS-PlusforMDR-TB ��� (��%)
Collaborat�veTB/HiVact�v�t�es ���� (�0%)
Total 5569 (100%)
Planned scale-up of activities, 2006–2015
0
20
40
60
80
100 DOTS-Plus
TB/HIV
Lab capacity for culture and DST
PAL
Community DOTS
PPM
2015201420132012201120102009200820072006
South-East Asian Region
Pop
ulat
ion
cove
red
(%)
N.B.Populat�oncoverage�sthepercentageofthepopulat�onthatl�ves�nanareawheretheact�v�ty�s�mplemented.Forcollaborat�veTB/HiVact�v�t�esthepercentagereferstotheproport�onoftheel�g�blepopulat�on,�.e.thepopulat�onl�v�ng�nareasw�thanHiVprevalenceabove�%.ForDOTS-Plus,�t�sthepercentageofdetectedMDR-TBcasesthatareenrolled�nDOTS-Plusprogrammes.
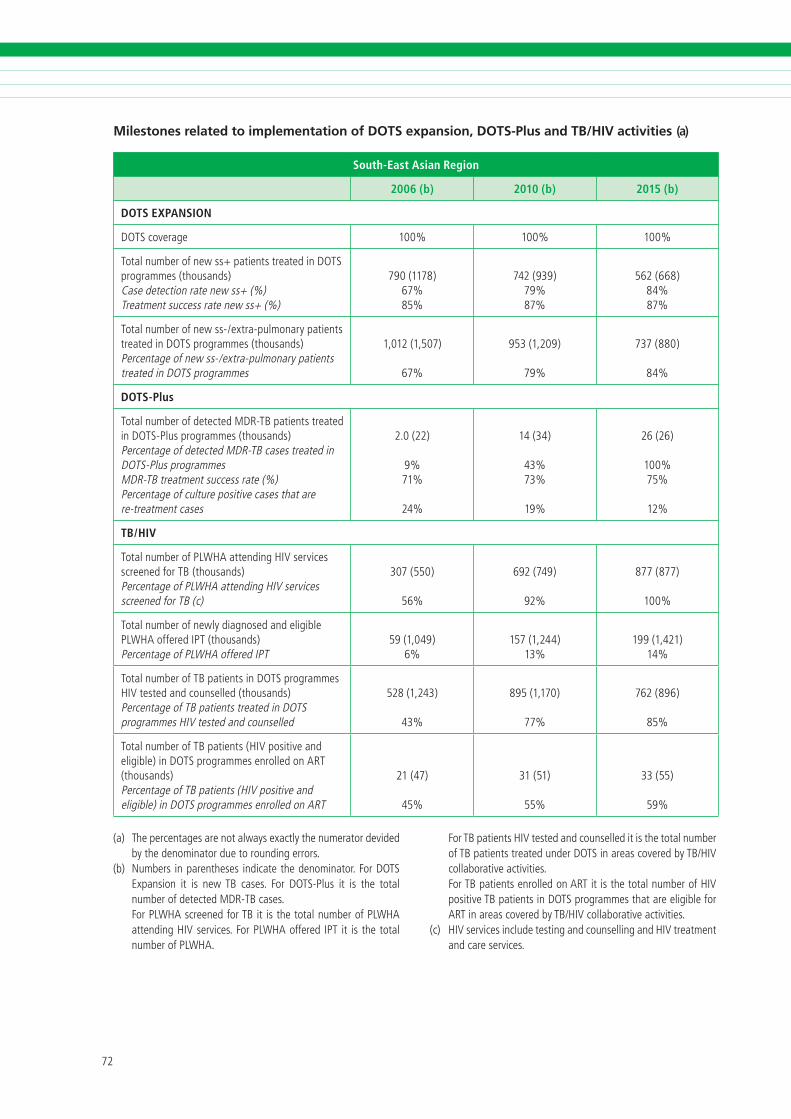
��
DOTS Expansion Working Group S t ra teg ic P lan 2 0 0 6 – 2 0 1 5
��
DOTS Expansion Working Group S t ra teg ic P lan 2 0 0 6 – 2 0 1 5
Milestones related to implementation of DOTS expansion, DOTS-Plus and TB/HIV activities (a)
South-East Asian Region
2006 (b) 2010 (b) 2015 (b)
DOTS EXPANSION
DOTScoverage �00% �00% �00%
Totalnumberofnewss+pat�entstreated�nDOTSprogrammes(thousands)Casedetect�onratenewss+(%)Treatmentsuccessratenewss+(%)
��0(����)��%��%
���(���)��%��%
���(���)��%��%
Totalnumberofnewss-/extra-pulmonarypat�entstreated�nDOTSprogrammes(thousands)Percentageofnewss-/extra-pulmonarypat�entstreated�nDOTSprogrammes
�,0��(�,�0�)
��%
���(�,�0�)
��%
���(��0)
��%
DOTS-Plus
TotalnumberofdetectedMDR-TBpat�entstreated�nDOTS-Plusprogrammes(thousands)PercentageofdetectedMDR-TBcasestreated�nDOTS-PlusprogrammesMDR-TBtreatmentsuccessrate(%)Percentageofculturepos�t�vecasesthatarere-treatmentcases
�.0(��)
�%��%
��%
��(��)
��%��%
��%
��(��)
�00%��%
��%
TB/HIV
TotalnumberofPLWHAattend�ngHiVserv�cesscreenedforTB (thousands)PercentageofPLWHAattend�ngHiVserv�cesscreenedforTB(c)
�0�(��0)
��%
���(���)
��%
���(���)
�00%
Totalnumberofnewlyd�agnosedandel�g�blePLWHAofferediPT(thousands)PercentageofPLWHAofferediPT
��(�,0��)�%
���(�,���)��%
���(�,���)��%
TotalnumberofTBpat�ents�nDOTSprogrammesHiVtestedandcounselled(thousands)PercentageofTBpat�entstreated�nDOTSprogrammesHiVtestedandcounselled
���(�,���)
��%
���(�,��0)
��%
���(���)
��%
TotalnumberofTBpat�ents(HiVpos�t�veandel�g�ble)�nDOTSprogrammesenrolledonART(thousands)PercentageofTBpat�ents(HiVpos�t�veandel�g�ble)�nDOTSprogrammesenrolledonART
��(��)
��%
��(��)
��%
��(��)
��%
(a) Thepercentagesarenotalwaysexactlythenumeratordev�dedbythedenom�natorduetoround�ngerrors.
(b) Numbers �nparentheses �nd�catethedenom�nator.ForDOTSExpans�on �t �s newTB cases. For DOTS-Plus �t �s the totalnumberofdetectedMDR-TBcases.
ForPLWHAscreenedforTB�t �sthetotalnumberofPLWHAattend�ngHiVserv�ces.ForPLWHAoffered iPT �t �s thetotalnumberofPLWHA.
ForTBpat�entsHiVtestedandcounselled�t�sthetotalnumberofTBpat�entstreatedunderDOTS�nareascoveredbyTB/HiVcollaborat�veact�v�t�es.
ForTBpat�entsenrolledonART�t�sthetotalnumberofHiVpos�t�veTBpat�ents�nDOTSprogrammesthatareel�g�bleforART�nareascoveredbyTB/HiVcollaborat�veact�v�t�es.
(c) HiVserv�ces�ncludetest�ngandcounsell�ngandHiVtreatmentandcareserv�ces.
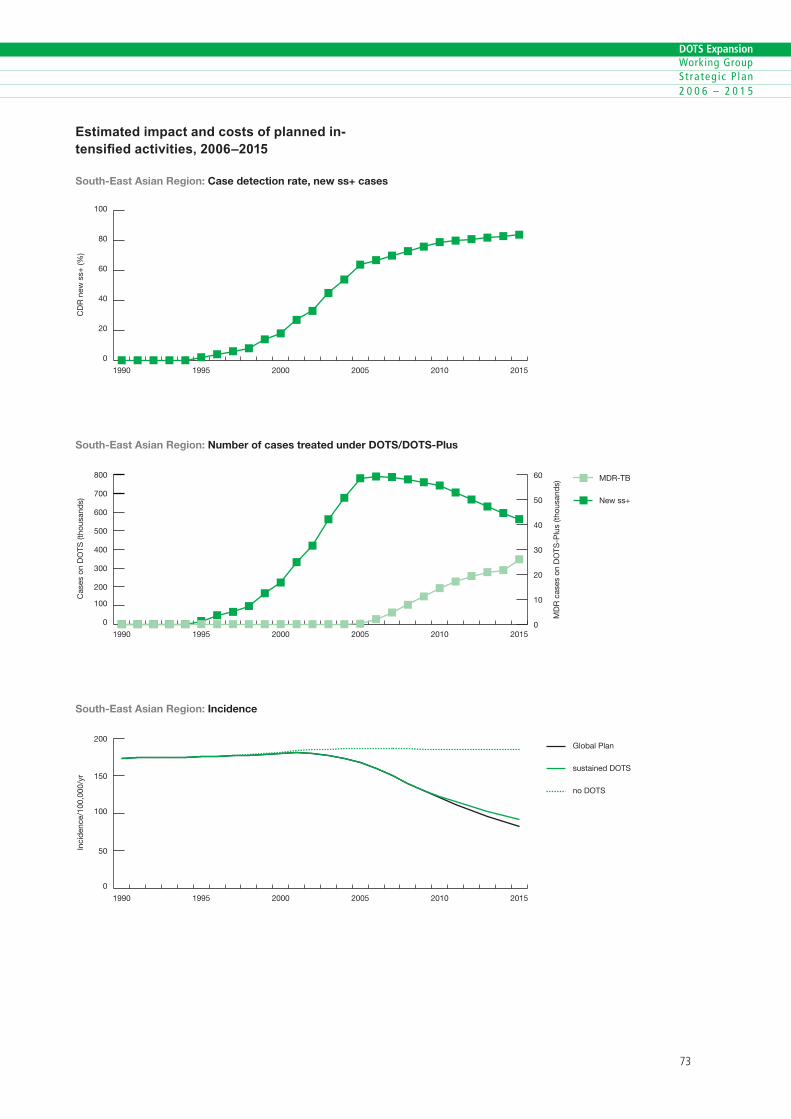
��
DOTS Expansion Working Group S t ra teg ic P lan 2 0 0 6 – 2 0 1 5
��
DOTS Expansion Working Group S t ra teg ic P lan 2 0 0 6 – 2 0 1 5
Estimated impact and costs of planned in-tensified activities, 2006–2015
0
20
40
60
80
100
201520102005200019951990
CD
R n
ew s
s+ (%
)
South-East Asian Region: Case detection rate, new ss+ cases
0
100
200
300
400
500
600
700
800 MDR-TB
New ss+
201520102005200019951990
South-East Asian Region: Number of cases treated under DOTS/DOTS-Plus
Cas
es o
n D
OTS
(tho
usan
ds)
MD
R c
ases
on
DO
TS-P
lus
(thou
sand
s)
0
10
20
30
40
50
60
0
50
100
150
200Global Plan
sustained DOTS
no DOTS
201520102005200019951990
Inci
den
ce/1
00,0
00/y
r
South-East Asian Region: Incidence
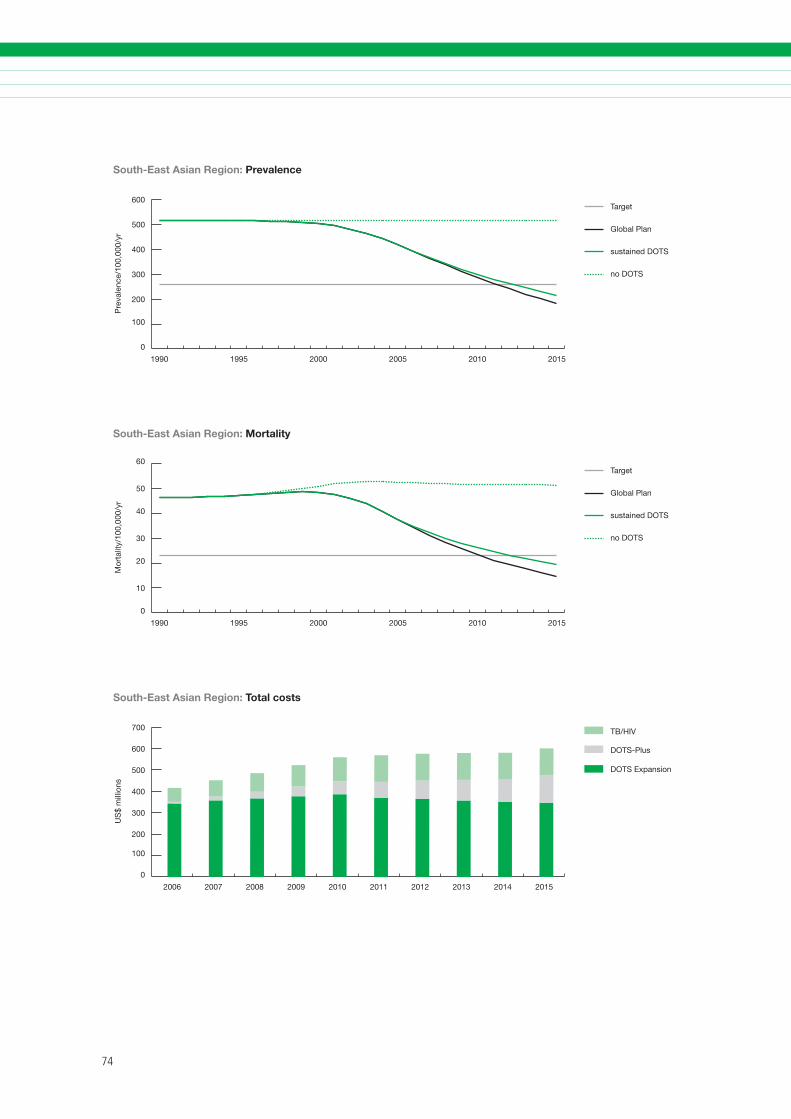
��
DOTS Expansion Working Group S t ra teg ic P lan 2 0 0 6 – 2 0 1 5
��
DOTS Expansion Working Group S t ra teg ic P lan 2 0 0 6 – 2 0 1 5
0
100
200
300
400
500
600Target
Global Plan
sustained DOTS
no DOTS
201520102005200019951990
Pre
vale
nce/
100,
000/
yr
South-East Asian Region: Prevalence
0
10
20
30
40
50
60Target
Global Plan
sustained DOTS
no DOTS
201520102005200019951990
South-East Asian Region: Mortality
Mor
talit
y/10
0,00
0/yr
0
100
200
300
400
500
600
700 TB/HIV
DOTS-Plus
DOTS Expansion
2015201420132012201120102009200820072006
South-East Asian Region: Total costs
US
$ m
illio
ns
��
DOTS Expansion Working Group S t ra teg ic P lan 2 0 0 6 – 2 0 1 5
��
DOTS Expansion Working Group S t ra teg ic P lan 2 0 0 6 – 2 0 1 5
Summary of planned activities, impact and costs
Achievements
In the Western Pacific Region, DOTS coverage and case detection have increased steadily from 58% and 44%, respectively, in 1998 to 90% and 52% in 2003. Preliminary data show continued progress in 2004 and early 2005, which makes it likely that the region will reach the 2005 targets for DOTS cover-age and case detection (70%). The treatment suc-cess rate has exceeded the 2005 target of 85% for several years. The implementation of the regional strategy to Stop TB in the Western Pacific has been critical to achieving this progress. Large investments have been made to ensure focused technical sup-port, capacity strengthening, effective coordina-tion, information exchange, advocacy, monitoring and supervision, strengthened partnerships and mobilization of resources for TB control.
Four HBCs – Cambodia, China, the Philippines and Viet Nam – together account for 95% of the esti-mated TB cases in the region. Viet Nam has a high-performing programme that has reached the 2005 TB targets for several years, although this success has not yet resulted in a decline in TB incidence. China has made huge progress in recent years because of strong political commitment and increased local and external funding. As a result, DOTS coverage has rapidly increased and the quality of DOTS improved. Recently a large-scale initiative has been launched to involve China’s huge hospital sector in DOTS implementation and to improve disease notification. This initiative has led to a rapid increase in case de-tection. The Philippines has continuously improved programme performance since 2001 and is scaling up PPM DOTS to further boost case detection and improve TB case management in the private sector. DOTS-Plus is being expanded in the country with support from the GFATM. Cambodia has improved
6. WESTERN PACIFIC REGION
DOTS quality and access in parallel with strengthen-ing general primary health care services.
Collaboration between HIV and TB control pro-grammes has been established in Cambodia, and pilot projects have been set up in Viet Nam. In China, a national framework to address TB/HIV has been outlined. In addition to the existing DOTS-Plus project in the Philippines, national plans for pilot-testing and scaling up DOTS-Plus have been developed in China, Mongolia and Viet Nam.
The region has invested in the development of a strong laboratory network. With support from supranational reference laboratories in Australia, Hong Kong SAR, Japan and the Republic of Korea, an extensive programme of quality assurance of laboratory services and drug resistance surveillance has been established throughout the region.
Challenges
Recent successes need to be maintained through sustained levels of political commitment and funding. The rapid expansion of services has put pressure on programme management and quality control. Full attention is needed to secure and sus-tain high-quality DOTS services. The large number and diversity of health-care providers in the region that are not yet involved in DOTS present a major challenge.
The impact of the HIV epidemic on TB control in parts of the region and among certain populations (such as injecting drug users) will need to be closely monitored and addressed. China is reporting high MDR-TB prevalence, and it is estimated that more than 30% of the global MDR-TB cases are in China. MDR-TB patients are currently treated outside the NTP on an individual basis and have to pay for ser-vices. Second-line drugs are produced in the country and are widely available.
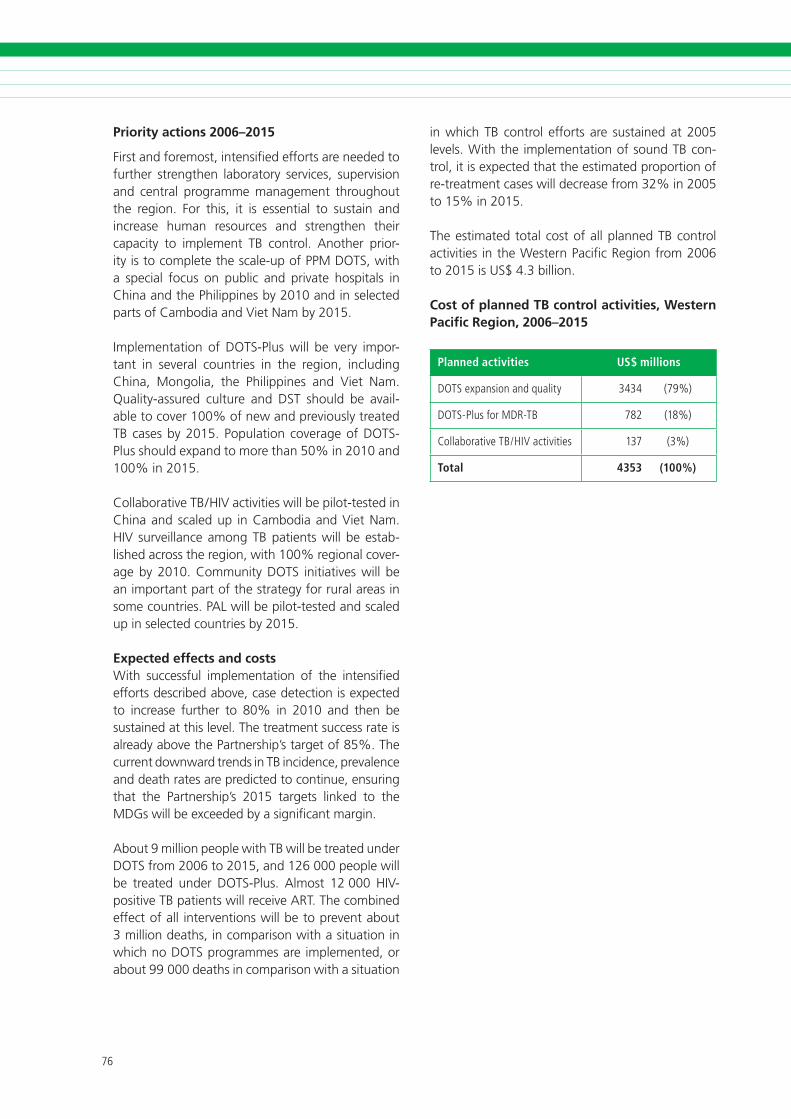
��
DOTS Expansion Working Group S t ra teg ic P lan 2 0 0 6 – 2 0 1 5
��
DOTS Expansion Working Group S t ra teg ic P lan 2 0 0 6 – 2 0 1 5
Priority actions 2006–2015
First and foremost, intensified efforts are needed to further strengthen laboratory services, supervision and central programme management throughout the region. For this, it is essential to sustain and increase human resources and strengthen their capacity to implement TB control. Another prior-ity is to complete the scale-up of PPM DOTS, with a special focus on public and private hospitals in China and the Philippines by 2010 and in selected parts of Cambodia and Viet Nam by 2015.
Implementation of DOTS-Plus will be very impor-tant in several countries in the region, including China, Mongolia, the Philippines and Viet Nam. Quality-assured culture and DST should be avail-able to cover 100% of new and previously treated TB cases by 2015. Population coverage of DOTS-Plus should expand to more than 50% in 2010 and 100% in 2015.
Collaborative TB/HIV activities will be pilot-tested in China and scaled up in Cambodia and Viet Nam. HIV surveillance among TB patients will be estab-lished across the region, with 100% regional cover-age by 2010. Community DOTS initiatives will be an important part of the strategy for rural areas in some countries. PAL will be pilot-tested and scaled up in selected countries by 2015.
Expected effects and costs With successful implementation of the intensified efforts described above, case detection is expected to increase further to 80% in 2010 and then be sustained at this level. The treatment success rate is already above the Partnership’s target of 85%. The current downward trends in TB incidence, prevalence and death rates are predicted to continue, ensuring that the Partnership’s 2015 targets linked to the MDGs will be exceeded by a significant margin.
About 9 million people with TB will be treated under DOTS from 2006 to 2015, and 126 000 people will be treated under DOTS-Plus. Almost 12 000 HIV-positive TB patients will receive ART. The combined effect of all interventions will be to prevent about 3 million deaths, in comparison with a situation in which no DOTS programmes are implemented, or about 99 000 deaths in comparison with a situation
in which TB control efforts are sustained at 2005 levels. With the implementation of sound TB con-trol, it is expected that the estimated proportion of re-treatment cases will decrease from 32% in 2005 to 15% in 2015.
The estimated total cost of all planned TB control activities in the Western Pacific Region from 2006 to 2015 is US$ 4.3 billion.
Cost of planned TB control activities, Western Pacific Region, 2006–2015
Planned activities US$ millions
DOTSexpans�onandqual�ty ���� (��%)
DOTS-PlusforMDR-TB ��� (��%)
Collaborat�veTB/HiVact�v�t�es ��� (�%)
Total 4353 (100%)
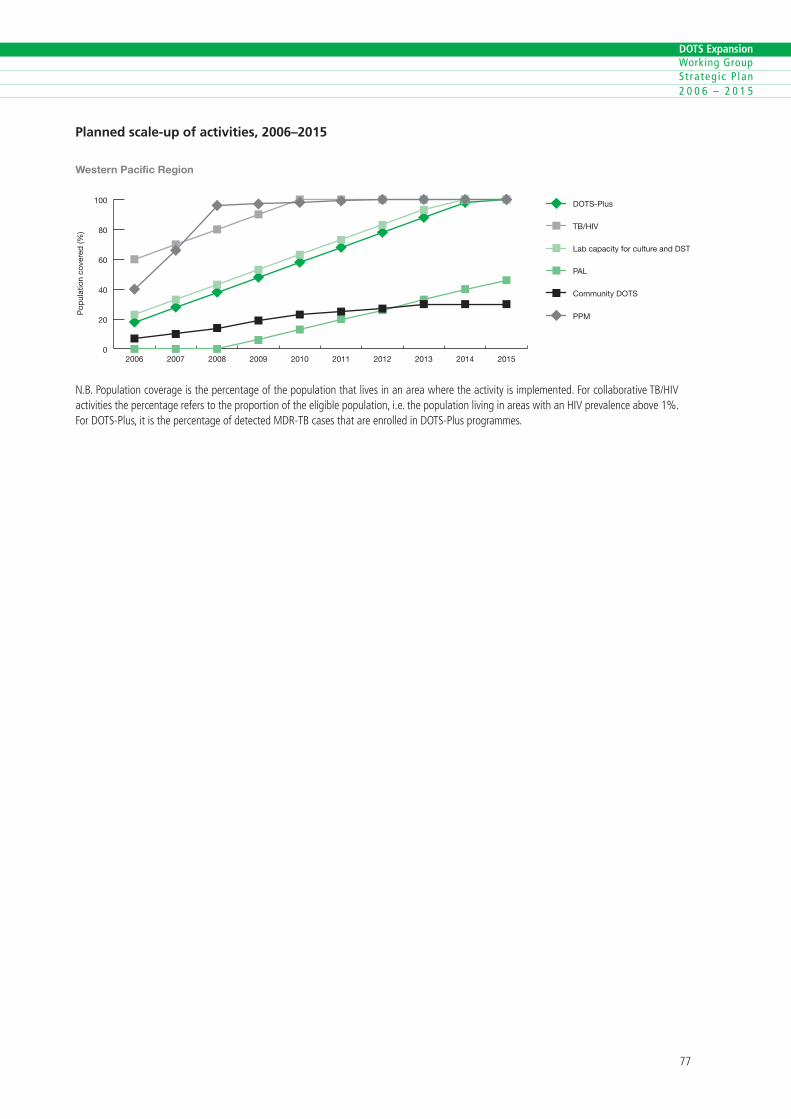
��
DOTS Expansion Working Group S t ra teg ic P lan 2 0 0 6 – 2 0 1 5
��
DOTS Expansion Working Group S t ra teg ic P lan 2 0 0 6 – 2 0 1 5
Planned scale-up of activities, 2006–2015
0
20
40
60
80
100 DOTS-Plus
TB/HIV
Lab capacity for culture and DST
PAL
Community DOTS
PPM
2015201420132012201120102009200820072006
Pop
ulat
ion
cove
red
(%)
Western Pacific Region
N.B.Populat�oncoverage�sthepercentageofthepopulat�onthatl�ves�nanareawheretheact�v�ty�s�mplemented.Forcollaborat�veTB/HiVact�v�t�esthepercentagereferstotheproport�onoftheel�g�blepopulat�on,�.e.thepopulat�onl�v�ng�nareasw�thanHiVprevalenceabove�%.ForDOTS-Plus,�t�sthepercentageofdetectedMDR-TBcasesthatareenrolled�nDOTS-Plusprogrammes.
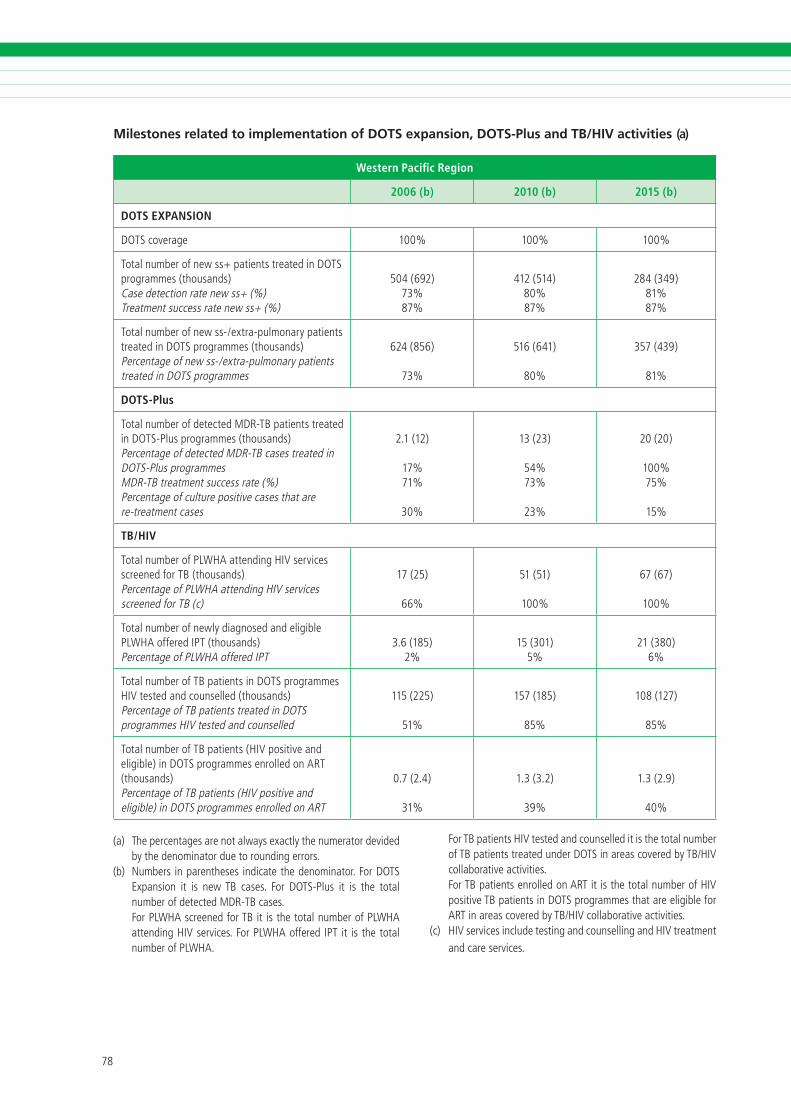
��
DOTS Expansion Working Group S t ra teg ic P lan 2 0 0 6 – 2 0 1 5
��
DOTS Expansion Working Group S t ra teg ic P lan 2 0 0 6 – 2 0 1 5
Milestones related to implementation of DOTS expansion, DOTS-Plus and TB/HIV activities (a)
Western Pacific Region
2006 (b) 2010 (b) 2015 (b)
DOTS EXPANSION
DOTScoverage �00% �00% �00%
Totalnumberofnewss+pat�entstreated�nDOTSprogrammes(thousands)Casedetect�onratenewss+(%)Treatmentsuccessratenewss+(%)
�0�(���)��%��%
���(���)�0%��%
���(���)��%��%
Totalnumberofnewss-/extra-pulmonarypat�entstreated�nDOTSprogrammes(thousands)Percentageofnewss-/extra-pulmonarypat�entstreated�nDOTSprogrammes
���(���)
��%
���(���)
�0%
���(���)
��%
DOTS-Plus
TotalnumberofdetectedMDR-TBpat�entstreated�nDOTS-Plusprogrammes(thousands)PercentageofdetectedMDR-TBcasestreated�nDOTS-PlusprogrammesMDR-TBtreatmentsuccessrate(%)Percentageofculturepos�t�vecasesthatarere-treatmentcases
�.�(��)
��%��%
�0%
��(��)
��%��%
��%
�0(�0)
�00%��%
��%
TB/HIV
TotalnumberofPLWHAattend�ngHiVserv�cesscreenedforTB (thousands)PercentageofPLWHAattend�ngHiVserv�cesscreenedforTB(c)
��(��)
��%
��(��)
�00%
��(��)
�00%
Totalnumberofnewlyd�agnosedandel�g�blePLWHAofferediPT(thousands)PercentageofPLWHAofferediPT
�.�(���)�%
��(�0�)�%
��(��0)�%
TotalnumberofTBpat�ents�nDOTSprogrammesHiVtestedandcounselled(thousands)PercentageofTBpat�entstreated�nDOTSprogrammesHiVtestedandcounselled
���(���)
��%
���(���)
��%
�0�(���)
��%
TotalnumberofTBpat�ents(HiVpos�t�veandel�g�ble)�nDOTSprogrammesenrolledonART(thousands)PercentageofTBpat�ents(HiVpos�t�veandel�g�ble)�nDOTSprogrammesenrolledonART
0.�(�.�)
��%
�.�(�.�)
��%
�.�(�.�)
�0%
(a) Thepercentagesarenotalwaysexactlythenumeratordev�dedbythedenom�natorduetoround�ngerrors.
(b) Numbers �nparentheses �nd�catethedenom�nator.ForDOTSExpans�on �t �s newTB cases. For DOTS-Plus �t �s the totalnumberofdetectedMDR-TBcases.
ForPLWHAscreenedforTB�t �sthetotalnumberofPLWHAattend�ngHiVserv�ces.ForPLWHAoffered iPT �t �s thetotalnumberofPLWHA.
ForTBpat�entsHiVtestedandcounselled�t�sthetotalnumberofTBpat�entstreatedunderDOTS�nareascoveredbyTB/HiVcollaborat�veact�v�t�es.
ForTBpat�entsenrolledonART�t�sthetotalnumberofHiVpos�t�veTBpat�ents�nDOTSprogrammesthatareel�g�bleforART�nareascoveredbyTB/HiVcollaborat�veact�v�t�es.
(c) HiVserv�ces�ncludetest�ngandcounsell�ngandHiVtreatmentandcareserv�ces.
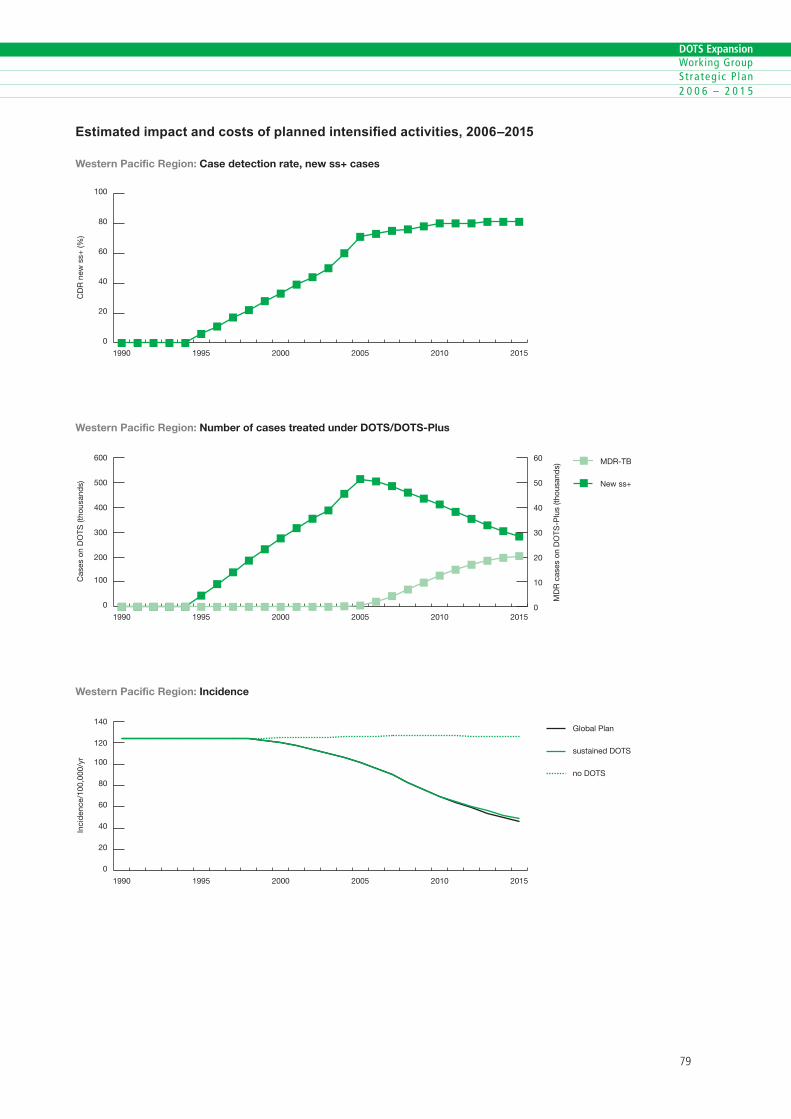
��
DOTS Expansion Working Group S t ra teg ic P lan 2 0 0 6 – 2 0 1 5
��
DOTS Expansion Working Group S t ra teg ic P lan 2 0 0 6 – 2 0 1 5
Estimated impact and costs of planned intensified activities, 2006–2015
0
20
40
60
80
100
201520102005200019951990
Western Pacific Region: Case detection rate, new ss+ cases
CD
R n
ew s
s+ (%
)
0
100
200
300
400
500
600 MDR-TB
New ss+
201520102005200019951990
Cas
es o
n D
OTS
(tho
usan
ds)
Western Pacific Region: Number of cases treated under DOTS/DOTS-Plus
MD
R c
ases
on
DO
TS-P
lus
(thou
sand
s)
0
10
20
30
40
50
60
0
20
40
60
80
100
120
140Global Plan
sustained DOTS
no DOTS
201520102005200019951990
Western Pacific Region: Incidence
Inci
den
ce/1
00,0
00/y
r
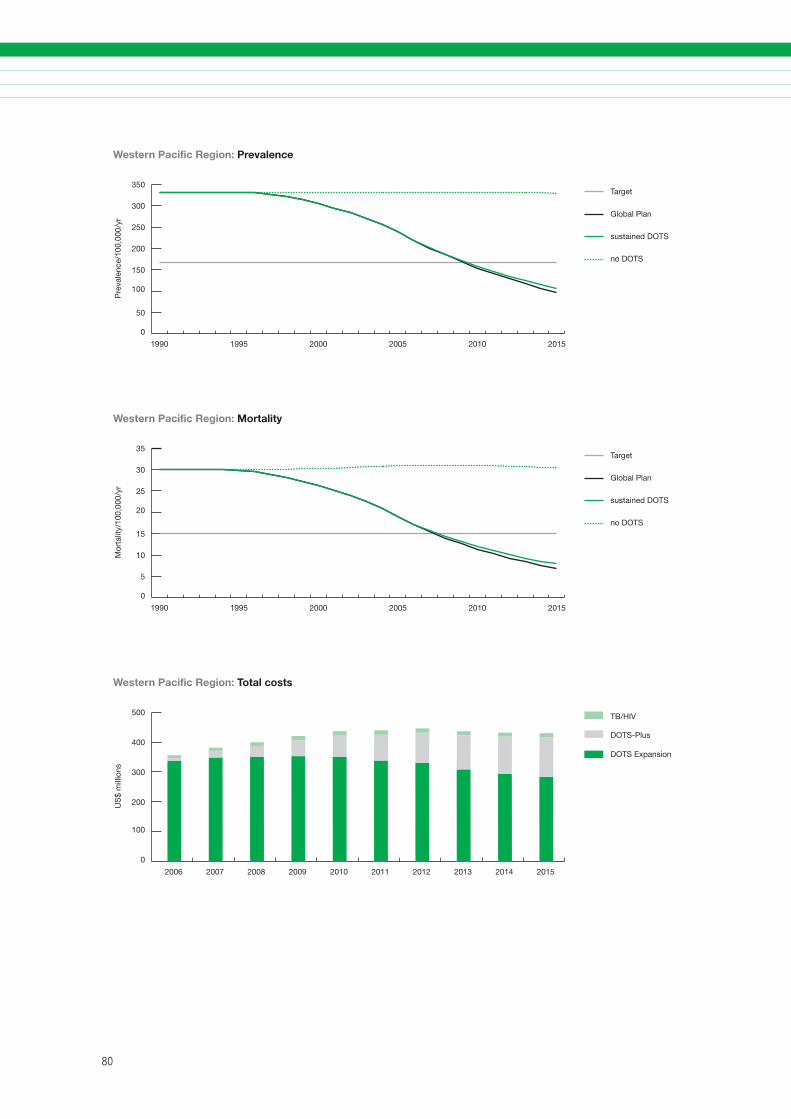
�0
DOTS Expansion Working Group S t ra teg ic P lan 2 0 0 6 – 2 0 1 5
��
DOTS Expansion Working Group S t ra teg ic P lan 2 0 0 6 – 2 0 1 5
0
50
100
150
200
250
300
350Target
Global Plan
sustained DOTS
no DOTS
201520102005200019951990
Western Pacific Region: Prevalence
Pre
vale
nce/
100,
000/
yr
0
5
10
15
20
25
30
35Target
Global Plan
sustained DOTS
no DOTS
201520102005200019951990
Mor
talit
y/10
0,00
0/yr
Western Pacific Region: Mortality
0
100
200
300
400
500 TB/HIV
DOTS-Plus
DOTS Expansion
2015201420132012201120102009200820072006
US
$ m
illio
ns
Western Pacific Region: Total costs

�0
DOTS Expansion Working Group S t ra teg ic P lan 2 0 0 6 – 2 0 1 5
��
DOTS Expansion Working Group S t ra teg ic P lan 2 0 0 6 – 2 0 1 5

��