double-blind study on effects of glucosyl ceramide in …11)129-142.pdf · double-blind study on...
TRANSCRIPT

Prof. Yoshikazu Yonei, M.D., Ph.D.Anti-Aging Medical Research Center, Graduate School of Life and Medical Sciences, Doshisha University
1-3, Tatara Miyakodani, Kyotanabe city, Kyoto 610-0321 JapanTel: +81-(0)774-65-6382 / Fax: +81-(0)774-65-6394 / E-mali: [email protected]
Anti-Aging Medicine 7 (11) : 129-142, 2010(c) Japanese Society of Anti-Aging Medicine
Original ArticleDouble-Blind Study on Effects of Glucosyl Ceramide in Beet Extract on Skin Elasticity and Fibronectin Production in Human Dermal Fibroblasts
129
Objective: To determine the effect of beet extract on skin elasticity in female volunteers with dry skin and in human dermal fibroblasts.Method: To assess the effects of oral administration of glucosyl ceramide contained in beet extract (beet ceramide), we conducted an 8-week double-blind comparison study with 35 females (mean age: 40.9±4.2 years) with mild subjective symptoms of dry skin and declining keratin moisture levels. The compound was administered as glucosyl ceramide at 0, 0.6, or 1.8 mg/day to 3 groups (n=11, 12, 12, respectively).Results: Scores improved significantly for the following subjective skin symptoms: “concerned about dull skin,” “concerned about spots or freckles,” “sticky, oily skin,” “coarse and desiccated skin,” “not elastic, not glossy,” “concerned about rough skin,” “bags under eyes.” In addition, perspiration levels improved. The skin elasticity test (Cutometer) indicated that the elasticity index (R2 and R7) improved in a dose-dependent manner. However, we were unable to confirm the effects of ceramide on increasing skin moisture as reported in previous studies. In experiments involving human dermal fibroblasts, addition of beet ceramide promoted fibronectin synthesis and mRNA expression but had no effect on fibroblast proliferation or collagen synthesis. Conclusion: Results from clinical trials and experiments suggested that oral ingestion of beet ceramide may stimulate intracellular signals and exert favorable effects on the extracellular matrix, including the induction of fibronectin synthesis. In addition, we confirmed the safety of administering beet ceramide to humans.
Abstract
Mio Hori 1), Seishi Kishimoto 2), Yu Tezuka 3), Hideo Nishigori 3), Keitaro Nomoto 1), Umenoi Hamada 1), Yoshikazu Yonei 1)
1) Anti-Aging Medical Research Center, Graduate School of Life and Medical Sciences, Doshisha University
2) Center for Pharmaceutical Research and Education, Faculty of Pharmaceutical Sciences, Teikyo University
3) Department of Pharmaceutical Therapeutics, School of Pharmacy, Iwate Medical University
KEY WORDS: ceramide, skin elasticity, skin moisture, fibronectin, beet
Received: Jul. 13, 2010Accepted: Sep. 21, 2010Published online: Oct 7, 2010
Introduction Lamellae, which form between cells in the outermost layer of skin, play an important role as a perspiration barrier in humans 1). In the human stratum corneum, 50% of the lipid lamella is composed of ceramide (N-acylsphingosine), one of the sphingolipids that make up the skin, and ceramide content decreases gradually with aging. As such, ceramide is considered to be a potentially important factor in maintaining young-looking, healthy skin. We previously examined the effects of cosmetics 2), supplements 3), and health foods 4) on skin in the field of Anti-Aging Medicine by utilizing common, objective parameters such as skin image analysis devices. According to the Incorporated Administrative Agency at the National Institute of Health and Nutrition, “Ceramide is said to have a ‘moisturizing effect’ as well as a ‘smoothing effect,’ but no reliable data regarding the effectiveness and safety of oral ingestion of ceramide can be found 5).” However, the mechanism by which extrinsic ceramide is absorbed and
transported to the skin and ceramide’s essential role in physiology and effect on cell signals is still unclear. Beets, from which sugar can be made, contain fibers which have relatively high amounts of glucosyl ceramide. Glucosyl ceramide extract from beets (beet ceramide) can be obtained through ethanol extraction. To examine the effects of beet ceramide on skin and quality of life, we conducted randomized controlled tests on the effect of oral administration of beet ceramide. In addition, since extracellular matrix proteins and natural moisturizing factors, both of which influence skin elasticity, are synthesized in dermal fibroblast cells, we examined the effect of beet ceramide on human fibroblast proliferation and synthesis of extracellular matrix proteins, such as collagen and fibronectin. Here, we report new information acquired through clinical and fundamental research.

Methods
Subjects A total of 50 Japanese female volunteers (aged 35 to 50 years) reporting dry skin were screened based on level of skin moisture of the medial surface of their arms as measured by Corneometer (CM825; Courage + Khazaka Electronic, GmbH, Kern, Germany). Of these 50 initial volunteers, 35 with relatively low levels of skin moisture were selected to participate in the present study (mean age: 40.9±4.2 years, body mass index [BMI]: 21.1±3.4 kg/m2). Participants were randomly divided into three groups: control (n=11), low-dose test group (LD group; n=12), and high-dose test group (HD group; n=12). One volunteer in the control group dropped out (drop out rate: 2.8% [1/36]) after suspecting pregnancy. In the LD group, one person made a mistake in answering the questionnaire, and her data for the evaluation of subjective symptoms was removed.
Test Product The test product, beet ceramide, was provided by Nippon Beet Sugar Manufacturing Co. Ltd. (Minato-ku, Tokyo) in 200-mg capsules including gelatin, glycerin, and caramel color (Table 1). Beet ceramide is a botanical lipid contained in the beetroot domestically grown in Hokkaido as a raw material of sugar. Both the test product and placebo were odorless, tasteless, brown 11mm soft capsules. There were no differences in appearance or smell between the test product and placebo. Water-soluble materials such as sugar are chiefly extracted from the beetroot using warm water. The cell walls of the residues (beet fibers) contain approximately 2% as lipids. In the present
study, this lipid was extracted and condensed using ethanol and then was filtrated using charcoal or diatomaceous earth to give the lipid segment. To this segment, cyclodextrin was added at a ratio of approximately 1:1, ultimately producing lipid powder known as “beet ceramide.” This powder contains 3.0%-3.5% glucosyl ceramide, which mainly consists of a sphingoid base with dihydroxy unsaturated bonds trans-located at the fourth and eighth positions (d18:2 4t,8t) and a 2-hydroxy fatty acid with 16 carbon atoms (16h:0) (Fig. 1) 6). In Japan, beet fiber has been sold for 15 years or more as a food material, functioning as a source of dietary fiber, and neither serious adverse events nor side effects have yet been reported. Further, the Food and Drug Administration (FDA) in the United States is currently reviewing the application for beet fiber as a Generally Recognized As Safe (GRAS) material. At the Japan Health Food & Nutrition Association, a technical committee concerning specially designated health foods evaluated beet fibers and determined that a minimum of 5 g of beet fiber is needed to be ingested daily to achieve intestinal effect; the maximum amount determined not to induce a laxative effect was 20 g/day. Twenty to sixty milligrams of beet ceramide correspond to approximately 2-6 g as raw beet fiber. No issue has been raised with regard to its safety as a food item. Safety of beet ceramide has been confirmed by third party specialized agencies (New Drug Development Research Center Inc., Hokkaido, Japan) via a reverse mutation test, single dose toxicity test, and repeated dose toxicity test over 28 days.
Study Design The present study was a double-blinded, dose-comparison study consisting of three groups: control group (11 cases), LD group (12 cases), and HD group (12 cases). Subjects in the control, LD, and HD groups were orally administered a capsule of placebo, low-dose test material, or high-dose test material, respectively, twice daily for eight weeks. Intake in the control, LD, and HD groups was 0, 20, or 60 mg/day as beet ceramide, and 0.0, 0.6, or 1.8 mg/day as glucosyl ceramide, respectively. Body and skin were examined three times during the observation period. Participants ingested two soft capsules a day for eight weeks (one each after breakfast and dinner). Subjects were instructed to take only the test product, described below, if breakfast or dinner was skipped. Percentage intake was 98.6% in the control group, 98.7% in the LD group, and 98.0% in the HD group (average ingestion rate: 98.4%).
130
Effect of Beet-Derived Glucosyl Ceramide on Skin and Human Dermal Fibroblasts
0301414142200
10201414142200
Table 1 Contents of test products in soft capsules
High dose test groupControlGroup(LD group) (HD group)test productamount(mg/capsule) placebo test product
Low dose test group
30
0
14
14
142
200
Beet ceramide
Cornstarch
Yellow beeswax
Fatty acid esters of glycerin
Safflower oil
Total
Fig. 1. Main structure of beet-derived glucosyl ceramide (6).

During the study, participants were instructed to maintain their normal lifestyles, including alcohol intake, and in particular to avoid excessive food intake, excessive exercise, and lack of sleep. Participants recorded the presence (and severity) or absence of adverse events, intake of the test product, lifestyle habits, and dietary/exercise habits in a diary. The study was conducted from January 15 to March 13, 2010. Written consent was obtained from each participant after full explanation of the purpose and methods of the study, participants’ rights, and that no penalty was associated with dropout.
Evaluation Methods For the evaluation of subjective symptoms, items were divided into two categories: “physical symptoms” and “mental symptoms.” The Anti-Aging Quality of Life (AAQol) Common Questionnaire was used to rate individual symptoms on a five-point scale ranging from 1 to 5 points, as described previously 7). Facial skin was evaluated on the right cheek with regard to moisture level, melanin levels, and presence of erythema, as in previous reports 8). Level of skin moisture was measured using a Corneometer (CM825; Courage + Khazaka Electronic, GmbH) 9,10), which functions on the principle that electric capacitance changes according to the skin’s moisture level. Transepidermal water loss (TEWL) was measured using a Tewameter (TM300; Courage + Khazaka Electronic, GmbH) 11), which measures water vapor pressure at two points 1-2 mm from the skin surface. The volume of water transpiring from the epidermis was then calculated and expressed as volume of water (g/h·m2) lost per hour per square meter of skin. Measurements were taken 20 minutes after face-washing and becoming accustomed to the indoor environment. The temperatures and humidity levels during the measurements are shown in Table 2. The level of melanin in the skin and degree of erythema were measured using a Mexameter (MX18; Courage + Khazaka Electronic, GmbH), which irradiates the skin with specific wavelength light and measures the reflected light using a diode to calculate the melanin and erythema indices 12,13).
Skin elasticity was evaluated using a Cutometer (MPA580; Courage + Khazaka Electronic, GmbH) 14-16). Briefly, a probe was placed on the skin surface, and an area of skin was drawn up into the probe using negative pressure; the length of skin drawn into the probe was then measured using a glass prism. The physical principles underlying the results obtained from the Cutometer are shown in Fig. 2, and Table 3 shows the various indices that can be derived and their interpretations. The R2 index is the ratio of skin
131
4.2°C
2.9°C
13.2°C
34.0%68.0%47.5%
24.5°C
24.0°C
24.5°C
Table 2 Temperatures and humidity levels
Average room temperature/humidity
WeatherDate Average outdoor temperature/humidity
43.0%
49.5%
47.5%
Week 0
Week 4
Week 8
1/15
2/12
3/12
Sunny
Rain
Sunny
Table 3 Definitions of skin elasticity indices by Cutometer
ExpressionIndex Point of measurement
R0
R1
R2
R3
R4
R5
R6
R7
R8
R9
F0
F1
Uf1
Uf1-Ua1
Ua1/Uf1
Uf2
Uf2-Ua2
Ur1/Ue1
Uv1/Ue1
Ur1/Uf1
Ua1
Uf2-Uf1
Area A
Area B
Length of the skin when elongated
Length of the skin after elongation and constriction
Recocery ratio of the skin length
Length of the skin when elongated at second time
Length of the skin after elongation and constriction at second time
Ratio of elasticity part when elongated and during constriction
Ratio of viscosity and elasticity part when elongated
Ratio of elasticity part during constriction
Length of skin constriction afrer first elongation
Difference of skin length between first and second elongation
Skin distortion during elongation
Skin distortion during constriction
Fig. 2. Principles underlying the measurement of skin elasticity by Cutometer.

length recovery after elongation and constriction (Ua1/Uf1), indicating improvement in elasticity as the ratio approaches 1.00; an ideal elastic material has an R2 value of 1.00, and normal skin has values in the range of 0.3-0.5. The R7 index is a ratio of skin elasticity during constriction (Ur1/Uf1); the most elastic skin has an R7 value close to 1.00. The R2 and R7 indices are the most reliable ones derived from a Cutometer, and a previous study found that these indices decrease with aging, with the curve shifted down and forward in patients with diabetes mellitus 17). Skin elasticity was measured four times to reduce error, with the highest and lowest values removed before averaging calculations. We evaluated accumulated amounts of advanced glycation endproducts (AGEs) in the skin as an index of glycation using an AGE Reader™ (DiagnOptics, Groningen, Netherlands). This measurement is a non-invasive evaluation method that excites AGEs accumulated in the skin tissue by exposure to ultraviolet radiation, using the observed characteristics to generate specific fluorescence (auto-fluorescence; AF) 18,19). Examination of skin biopsies from diabetic and dialysis patients has confirmed that skin AF is correlated with accumulation of typical AGEs in the skin, such as pentosidine and Nε-(carboxymethyl)lysine (CML). In addition, AF is high in type 2 diabetes patients and increases in healthy persons with age 20). While AF measurements are generally taken at the forearm and upper arm, skin AF was impossible to measure at the forearms of a substantial number of subjects in our previous studies due to the presence of sun tan (data not shown). In this study, subjects were asked to rest their elbow on the AGE Reader™. Measurements were taken at the outer upper right arm, 10 cm away from the edge of the elbow. After wiping the measuring area using a cotton swab and alcohol, AF intensity was measured three times at the same point, and the results were expressed as the mean of three values. Reflectance, which affects measured values of skin auto-fluorescence, was determined here, using spectra obtained from skin measurement, as subtraction between white standard skin and dark skin. An external reflection standard was measured using each apparatus above to determine correction factors for each wavelength. Reliability of measurement results is low when the reflectance value is low.
Experimental MethodCulture of Human Dermal Fibroblasts Normal human dermal fibroblasts were obtained from AGC Techno Glass (Funabashi-city, Chiba). Cells were cultured and maintained in fibroblast basal medium (AGC Techno Glass) containing 10% fetal bovine serum and antibiotics at 37 °C in a humified atmosphere of 95% air and 5% CO2.
Measurement of Proliferation Rate of Human Dermal Fibroblasts Appropriate concentrations of beet ceramide (adjusted to a final concentration of 0.1% with dimethyl sulfoxide [DMSO]) were added to the fibroblast basal medium in which human dermal fibroblasts were suspended. To observe the vehicle effect, 0.1% of DMSO was added to 0μg/mL of beet ceramide. Suspended cells were plated onto 96-well tissue culture plates at 1 × 10³ cells per well and incubated for 72 hours in a CO2 incubator. After incubation, cell number in each well was estimated via colorimetric method using a Cell Counting Kit (Dojindo Laboratories, Kamimashiki-gun, Kumamoto).
Observation of Fibronectin and Type I Collagen Expression Via Fluorescent Immunostaining Human dermal fibroblast cells were spread onto a 3.5-cm flat glass-bottom dish, and incubated for 24 hours in a CO2 incubator with beet ceramide added to the medium at various concentrations. The cells can be stained directly with fluorescent antibodies with the glass-bottom dish used in this experiment. The cells were then fixed using 4% formaldehyde followed by treatment with 0.2% Triton X-100/PBS (-). After blocking in 10% goat serum, the specimens were treated with either mouse anti-human fibronectin monoclonal antibody (Santa Cruz Biotechnology, Santa Cruz, CA, USA) or mouse anti-human type I collagen monoclonal antibody (Chemicon International, Billerica, MA, USA) as primary antibodies, followed by FITC-labeled goat anti-mouse IgG antibody (Santa Cruz Biotechnology) as a secondary antibody. After washing, fluorescence was observed using an inverted fluorescence microscope. Because anti-collagen type I antibodies can detect collagen type I in the cytosol 21), they were used for the relative comparison of collagen type I production.
Measurement of Fibronectin mRNA Gene Expression Using Real-Time Polymerase Chain Reaction (PCR) Human dermal fibroblast cells were spread onto a 6-cm tissue culture dish and incubated for 24 hours in a CO2 incubator with beet ceramide added to the medium at various concentrations. After collecting cells, total RNA was extracted and purified using Isogen (Nippon Gene, Chiyoda-ku, Tokyo), and cDNA was then adjusted using a high capacity cDNA reverse transcription kit (Applied Biosystems, Carlsbad, CA, USA). The adjusted cDNA was used as a substrate and treated with human fibronectin gene (TaqMan Gene Expression Assay; Applied Biosystems). Fibronectin mRNA was assayed semi-quantitatively using real-time PCR. Glyceraldehyde-3-phosphate dehydrogenase was used as a reference gene.
Ethical Considerations and Declaration of No Commercial Relationship The study was performed at a third party institution in compliance with the ethical principles of the Declaration of Helsinki and the Personal Information Protection Law, and with reference to the “Ordinance regarding the Good Clinical Practice (GCP)” (MHW Ordinance No. 28, dated March 27, 1997). At the medical institution where the study was performed, an ethical committee for clinical studies held meetings to review the ethical justification and validity of the study. This study was approved by the committee and conducted according to the approved protocol. The activities of the laboratory are annually declared to “the Committee of Conflicts of Interests” of Doshisha University. The authors have no commercial relationship with companies related to the field of the study.
Statistical Analysis Results are expressed as average ± standard deviation (SD) in the clinical study (Table 4-8) or as average ± standard error of the mean (SEM) in the experimental study (Fig. 3 and 6. Statistical analyses were performed using the statistical analysis application Dr. SPSSII (SPSS Japan Inc., Shibuya-ku, Tokyo). Either a paired t-test or Dunnet’s test was used to compare measurements from Week 0 and data after treatment. For inter-group analysis, between-group differences before and after the study were compared using the Mann-Whitney U test. Correlation analysis was assessed using Spearman’s method, and significance was set at p<0.05.
132
Effect of Beet-Derived Glucosyl Ceramide on Skin and Human Dermal Fibroblasts

133
Table 4 Physical and mental symptoms, lifestyle-related behaviors
Physical symptoms Tired eyes Blurry eyes Eye pain Stiff shoulders Muscular pain/stiffness Palpitations Shortness of breath Tendency to gain weight Weight loss; thin Lethargy Lack of sense of wellness Thirst Skin problems Anorexia Early satiety Epigastralgia Liable to catch colds Coughing and sputum Diarrhea Constipation Hair loss Gray hair Headache Dizziness Tinnitus Lumbago Arthralgia Edematous Easily breaking into a sweatFrequent urination Hot flashes Cold skin
Mental symptomsIrritability Easily angered Loss of motivation No feeling of happiness Nothing to look forward to in lifeDaily life is not enjoyableLose confidence Reluctance to talk with othersDepressed Feeling of uselessness Shallow sleep Difficulty in falling asleepPessimism Lapse of memory Inability to concentrate Inability to solve problemsInability to make judgments readilyInability to sleep because of worriesA sense of tension Feeling of anxiety for no special reasonVague feeling of fear
Lifestyle-related behaviorsSmokingAlcohol consumptionFrequency of alcohol drinkingConverted into ethanolExerciseSleeping hoursWater consumptionVDT working hours
Cigarettes/ day mL/daytimes/weekmL/daydays/weekhours/dayL/dayours/day
Week 4mean meanSD
2.5 2.0 1.7 3.5 2.6 1.5 1.5 2.9 1.4 2.3 2.4 2.4 2.5 1.5 2.1 2.1 2.2 2.0 1.8 2.7 2.8 3.2 1.7 1.7 1.7 2.7 1.6 2.8 2.5 2.1 2.0 3.4
2.2 2.1 2.1 1.8 1.8 1.8 2.0 1.7 1.8 1.8 2.2 1.7 2.5 2.5 2.3 2.2 2.0 1.8 2.5 2.0 1.7
5.5 429.5
2.4 9.4 1.5 6.9 1.0 6.0
0.7 0.6 0.6 1.0 0.5 0.5 0.5 1.1 0.5 0.5 0.8 0.7 0.8 0.5 0.5 0.7 0.6 0.8 0.8 0.9 0.9 0.9 0.8 0.6 0.9 0.8 0.7 0.6 0.9 0.8 1.2 1.1
0.4 0.5 0.5 0.6 0.6 0.6 0.6 0.5 0.8 0.6 0.6 0.6 0.5 0.7 0.6 0.6 0.6 0.8 0.8 0.4 0.5
6.5 324.2 2.1 10.9 1.6 1.0 0.3 2.8
±±±±±±±±±±±±±±±±±±±±±±±±±±±±±±±±
±±±±±±±±±±±±±±±±±±±±±
±±±±±±±±
2.5 2.2 1.8 3.5 2.5 1.5 1.4 2.6 1.5 2.4 2.1 2.2 2.1 1.9 1.6 1.9 2.3 1.9 1.9 2.5 2.4 3.0 1.7 1.8 1.6 2.2 1.7 2.6 2.3 2.4 1.8 3.3
2.4 2.2 2.2 2.0 2.0 2.1 2.2 1.8 2.0 2.0 2.2 1.6 2.1 2.3 2.3 2.2 2.0 2.1 2.4 2.1 1.8
4.8 361.4
2.5 8.7 2.3 6.9 1.3 6.5
0.9 0.9 0.8 0.9 0.8 0.8 0.5 1.2 0.5 0.8 0.5 0.9 0.3 1.1 0.5 0.8 0.6 0.7 0.8 0.8 0.7 0.6 0.8 1.0 0.8 0.9* 0.6 0.9 0.9 0.9 0.8 1.1
0.7 0.4 0.4 0.4 0.4 0.5 0.6 0.4 0.6 0.6 0.6 0.7 0.5* 0.6 0.6 0.6 0.6 0.5 0.7 0.5 0.6
6.4 210.2 1.9 7.4 2.0 1.2 0.5* 2.7
±±±±±±±±±±±±±±±±±±±±±±±±±±±±±±±±
±±±±±±±±±±±±±±±±±±±±±
±±±±±±±±
2.5 1.8 1.7 3.5 2.5 1.4 1.4 2.5 1.4 2.5 1.8 2.1 2.2 1.4 1.7 2.0 2.1 2.0 2.0 2.5 2.1 2.9 1.9 1.8 1.6 2.3 1.8 2.6 2.2 2.4 1.8 3.1
2.1 1.9 2.0 1.9 2.0 1.9 2.0 1.9 1.7 1.8 1.8 1.8 1.9 2.5 2.2 1.9 1.9 1.6 2.2 1.9 1.6
5.5 329.5
2.0 6.4 2.0 6.9 1.1 6.6
0.8 1.1 0.6 1.0 1.0 0.7 0.5 1.1 0.5 0.7 0.6* 0.8 0.6*0.5 0.6 0.8 0.5 0.8 0.8 0.8 0.9* 1.2 0.7 0.6 0.7 1.0 0.6 1.0 1.1 1.0 0.8 1.3
0.5 0.3 0.4 0.3 0.4 0.3 0.4 0.5 0.6 0.4 0.8 0.8 0.8** 0.5 0.6 0.5 0.5 0.8 0.6 0.7 0.5
6.5 177.8 1.7 6.7 1.9 1.3 0.5 3.5
±±±±±±±±±±±±±±±±±±±±±±±±±±±±±±±±
±±±±±±±±±±±±±±±±±±±±±
±±±±±±±±
Week 0
Control (n=11) LD group (n=12)
mean SD SDWeeks 8 Week 4
mean meanSD
3.2 2.4 1.6 3.5 2.6 1.7 1.8 3.0 1.8 2.3 1.8 2.1 2.5 1.5 1.7 1.8 1.8 1.7 1.8 2.6 1.8 2.8 1.8 1.7 1.4 2.5 1.8 2.3 2.8 2.3 1.9 3.3
2.0 1.9 1.8 1.8 1.8 1.8 2.1 1.7 1.8 1.7 2.3 2.4 1.8 2.9 2.1 1.8 2.1 1.9 2.1 1.7 1.3
0.0 175 0.9 3.1 1.1 6.6 1.3 5.2
1.0 1.2 0.8 1.2 1.2 0.5 0.6 1.1 0.8 0.9 0.7 1.1 0.5 0.5 0.8 1.0 0.8 0.7 0.8 1.4 0.9 1.1 0.9 0.7 0.5 1.4 1.2 0.8 1.3 1.4 1.1 1.1
1.2 1.2 0.9 0.9 0.9 0.9 0.8 0.8 1.0 0.9 1.3 1.4 0.9 0.9 0.7 0.7 0.8 1.0 0.9 0.7 0.5
0.0 205 1.2 4.0 1.8 0.9 0.6 3.4
±±±±±±±±±±±±±±±±±±±±±±±±±±±±±±±±
±±±±±±±±±±±±±±±±±±±±±
±±±±±±±±
2.8 2.1 1.9 3.5 2.4 1.7 1.6 3.0 1.8 2.3 1.7 2.1 2.5 1.7 1.8 1.8 2.1 1.9 1.7 2.5 2.0 2.8 2.0 1.7 1.5 2.4 2.1 2.3 2.6 2.5 1.8 2.8
2.3 2.3 1.8 1.8 1.8 1.8 1.8 1.9 1.7 1.9 2.5 2.2 1.9 2.8 2.2 1.6 1.9 1.7 1.9 1.7 1.4
0.0 154 0.8 2.8 1.8 6.7 1.3 4.6
1.0 1.0 1.0 1.2 1.1 0.5 0.7 1.0 0.9 1.1 0.9 1.2 1.0 0.8 1.1 1.0 1.0* 1.2 0.7 1.2 0.9 1.1 1.0 0.8 0.7 1.3 1.2 1.1 1.3 1.3 0.8 1.5
1.0 1.2* 0.8 0.8 0.8 0.8 0.8 0.8 0.7 0.8 1.1 1.2 0.9 0.7 0.7 0.7 0.8 0.8 0.7 0.7 0.5
0.0 209 1.2 4.0 1.9 0.8 0.6 3.4
±±±±±±±±±±±±±±±±±±±±±±±±±±±±±±±±
±±±±±±±±±±±±±±±±±±±±±
±±±±±±±±
2.8 2.4 1.8 3.2 2.8 1.8 1.8 2.9 2.0 2.4 1.9 2.2 2.4 1.8 1.4 1.6 1.8 1.8 1.8 2.5 1.9 2.8 1.6 1.7 1.7 2.6 1.9 2.0 2.3 2.3 1.9 2.9
2.2 2.1 1.8 1.6 1.8 1.7 1.9 1.8 1.7 1.4 1.8 1.9 1.9 2.9 1.9 1.8 2.1 1.8 2.0 1.6 1.4
0.0 113 0.8 2.9 2.0 6.6 1.2 4.8
0.057 0.888 0.665 0.629 0.391 0.525 0.805 0.443 0.562 0.727 0.343 0.433 0.354 0.726 0.195 0.677 0.293 0.191 0.768 0.649 0.010 0.433 0.423 0.609 0.226 0.174 0.850 0.752 0.561 0.788 0.678 0.490
0.582 0.301 0.833 0.403 0.575 0.447 0.251 0.681 0.433 0.789 0.547 0.108 0.013 0.896 1.000 0.948 0.806 0.437 0.676 0.533 0.377
1.000 0.552 0.595 0.585 0.384 0.876 0.332 0.455
1.1 1.0 1.0 1.3 1.3 0.8 0.8 1.2 1.0 0.9 1.0 1.4 1.0 1.0 0.5 0.9 0.9 1.0 0.8 1.2 0.9 1.2 0.8 0.8 0.9 1.3 1.0 0.9 1.2* 1.3 0.9 1.4
1.0 0.9 1.0 0.7 0.6 0.8 0.8 0.8 0.8 0.5 0.9 1.1* 0.8 0.9 0.7 0.8 0.8 0.8 0.7 0.7 0.5
0.0 184 1.4 4.8 2.0* 0.8 0.6 4.1
±±±±±±±±±±±±±±±±±±±±±±±±±±±±±±±±
±±±±±±±±±±±±±±±±±±±±±
±±±±±±±±
Week 0mean SD SD
Weeks 8p value
Inter-group analysis(vs. Control)
HD group (n=12)
Week 4mean meanSD
2.8 2.5 1.8 3.3 2.8 1.8 1.6 2.8 1.4 2.3 2.3 1.8 2.9 1.4 2.1 1.9 2.1 1.9 1.8 2.7 2.6 2.4 2.1 1.8 1.8 2.8 1.8 2.4 1.8 2.3 1.8 3.1
2.6 2.3 2.2 2.1 1.8 1.6 1.9 1.7 1.6 1.9 1.8 1.7 2.0 2.6 2.6 2.1 2.0 1.9 2.6 1.9 1.8
0.8 244 2.0 5.9 0.6 7.0 0.9 4.8
1.2 1.2 1.1 0.9 1.2 1.0 0.7 1.1 1.2 0.8 0.6 0.9 0.9 0.5 1.0 0.9 0.8 1.2 0.8 0.8 1.2 1.1 0.9 0.9 0.8 1.2 0.6 0.8 0.8 1.2 0.9 1.3
0.7 0.7 0.8 0.5 0.8 0.5 0.5 0.5 0.5 0.7 0.8 1.0 0.7 1.0 0.9 0.7 0.7 0.7 1.0 0.5 0.6
2.9 208 2.1 8.0 1.0 0.7 0.5 2.4
±±±±±±±±±±±±±±±±±±±±±±±±±±±±±±±±
±±±±±±±±±±±±±±±±±±±±±
±±±±±±±±
2.8 2.5 1.7 3.3 3.0 2.1 1.7 2.8 1.9 2.8 2.3 2.0 2.4 1.7 2.1 2.1 2.1 2.2 1.8 2.8 2.5 2.4 1.8 1.8 1.8 2.9 1.7 2.0 2.0 2.4 1.8 3.1
2.7 2.3 2.3 1.9 1.8 1.8 1.8 1.8 1.8 1.9 1.9 1.7 1.9 2.6 2.4 2.1 2.1 1.7 2.4 1.9 1.7
0.8 309 1.6 5.8 1.2 7.0 1.2 4.9
1.0 1.0 0.9 1.1 1.3 1.0 0.8 0.9 1.2 0.8* 0.9 1.0 0.5 0.7 1.0 0.9 1.1 1.0 0.8 1.1 1.0 1.2 0.7 0.7 0.9 1.3 0.8 0.6 0.9 1.2 0.7 1.5
1.0 0.9 0.9 0.5 0.6 0.5 0.6 0.6 0.6 0.7 0.7 0.7 0.7 0.9 0.9 0.7 0.7 0.5 1.0 0.8 0.7
2.9 208 1.6 7.3 1.2 0.9 0.4* 3.9
±±±±±±±±±±±±±±±±±±±±±±±±±±±±±±±±
±±±±±±±±±±±±±±±±±±±±±
±±±±±±±±
2.7 2.3 1.7 3.1 2.9 1.9 2.1 3.0 1.7 2.3 2.1 2.3 2.8 1.6 1.9 2.1 2.0 2.3 1.9 2.7 2.5 2.6 2.1 2.0 2.2 2.3 2.0 2.5 2.2 2.5 1.9 3.0
2.4 2.1 2.0 1.8 1.8 1.6 1.7 1.8 1.7 1.8 1.7 1.6 1.7 2.3 2.1 1.7 1.8 1.5 2.2 1.7 1.6
0.8 288 1.8 5.9 1.7 7.2 1.1 4.8
0.936 0.593 0.748 0.898 0.449 0.511 0.131 0.092 0.201 0.677 0.343 0.053 0.630 0.363 0.444 0.238 0.974 0.110 0.919 0.549 0.057 0.184 0.899 0.875 0.224 0.191 0.752 0.922 0.045 0.713 0.404 0.557
0.653 0.739 0.888 0.155 0.491 0.623 0.233 0.860 0.916 0.452 0.505 1.000 0.204 0.949 0.300 0.918 0.733 0.101 0.896 0.838 0.623
1.000 0.078 0.822 0.420 0.173 0.876 0.656 0.804
1.2 1.1 0.8 1.0 1.2 0.8 0.8**0.7 0.8 0.8 0.8 1.0* 0.6 0.7 0.7 1.1 0.7 0.9 0.8 1.1 1.2 0.9 0.8 0.7* 0.9 1.2 0.9 0.8 0.7 1.1 0.8 1.4
0.8 0.7 0.7 0.5 0.6 0.5 0.7 0.7 0.7 0.8 0.7 0.7 0.7* 1.1 1.0 0.7 0.6 0.5* 0.9 0.7 0.7
2.9 193 1.7 6.9 1.5** 0.9 0.5 2.9
±±±±±±±±±±±±±±±±±±±±±±±±±±±±±±±±
±±±±±±±±±±±±±±±±±±±±±
±±±±±±±±
Week 0mean SD SD
Weeks 8p value
Inter-group analysis(vs. Control)
VDT; visual display terminal; SD, standard deviation
Average±SD, *p<0.05, **p<0.01 vs. Week 0 by Wilcoxon signed rank test. Inter-group analysis by Mann-Whitney U test.

Effect of Beet-Derived Glucosyl Ceramide on Skin and Human Dermal Fibroblasts
134
Average±SD, *p<0.05, **p<0.01 vs. Week 0 by paired-t test. Inter-group analysis by Mann-Whitney U test.
Table 5 Anthropometry
Height
Weight
Percentage body fat
Amount of fat
Lean body mass
Water content
Basal metabolic rate
BMI
Systolic blood pressure
Diastolic blood pressure
Heart Rate
cm
kg
%
kg
kg
kg
kcal
mmHg
mmHg
bpm
Week 4mean meanSD
158.2
51.2
28.4
14.7
36.5
26.7
1029.6
20.5
119.5
72.0
74.6
6.6
6.0
4.6
3.5
3.6
2.6
93.7
2.7
18.2
12.9
11.6
±±±±±±±±±±±
51.2
28.4
14.7
36.5
26.7
1029.5
20.5
115.9
72.4
71.4
5.8
4.1
3.4
3.3
2.4
87.4
2.7
16.2
12.9
9.5
±±±±±±±±±±
50.9
27.7
14.2
36.6
26.8
1031.7
20.4
108.2
68.3
73.1
5.8
4.3*
3.3 **
3.5
2.6
90.9
2.6
13.7**
12.8
7.2
±±±±±±±±±±
Week 0
Control (n=11) LD group (n=12)
mean SD SDWeeks 8 Week 4
mean meanSD
152.5
50.6
29.7
15.7
34.9
25.6
992
21.7
119.8
72.0
72.0
8.2
12.4
7.2
8.3
5.4
3.9
149
4.5
19.5
13.4
7.9
±±±±±±±±±±±
50.5
29.6
15.5
35.0
25.6
992
21.6
115.8
72.1
72.9
12.1
6.8
7.9
5.5
4.1
151
4.4
14.6
13.4
8.0
±±±±±±±±±±
50.4
29.0
15.2
35.2
25.8
997
21.6
114.2
70.0
71.9
0.666
0.853
0.689
1.000
0.902
0.951
0.514
0.218
0.902
0.268
12.2
7.1
8.0
5.6
4.1
155
4.4
14.4
10.4
9.8
±±±±±±±±±±
Week 0mean SD SD
Weeks 8p value
Inter-group analysis(vs. Control)
HD group (n=12)
Week 4mean meanSD
158.2
52.5
30.3
16.1
36.4
26.6
1029
21.0
118.0
73.9
77.9
7.7
6.8
5.3
4.3
3.8
2.8
103
2.8
12.0
7.8
6.8
±±±±±±±±±±±
52.0
30.3
16.0
36.0
26.4
1019
20.8
113.9
73.2
82.8
7.0
5.2
4.3
3.9
2.8
106
2.8
16.8
12.1
16.9
±±±±±±±±±±
52.4
29.6
15.7
36.7
26.9
1036
21.0
110.5
70.2
75.4
0.926
0.975
1.000
0.926
0.951
0.926
0.926
0.712
0.735
0.268
7.0
5.3
4.2
3.8
2.8
105
2.6
10.4*
9.7
10.9
±±±±±±±±±±
Week 0mean SD SD
Weeks 8p value
Inter-group analysis(vs. Control)
SD, standard deviationAverage±SD, *p<0.05, **p<0.01 vs. Week 0 by paired-t test. Inter-group analysis by Mann-Whitney U test.
Table 6 Blood biochemistry
Leukocyte count
Erythrocyte count
Hemoglobin
Hematocrit
Platelet count
MCV
MCH
MCHC
Neutrophils
Lymphocytes
Monocytes
Eosinophils
Basophils
Total protein
Albumin
A/G ratio
AST
ALT
LDH
Total bilirubin
ALP
γ‐GTP
CPK
Urea nitrogen
Creatinine
Uric acid
Sodium
Chlorine
Potassium
Calcium
Serum iron
Total cholesterol
LDL cholesterol
HDL cholesterol
Triglyceride
Glucose
HbA1c
Arterial sclerosis index
Insulin
/µl
×104/µl
g/dl
%
×104/µl
fl
pg
%
%
%
%
%
%
g/dl
g/dl
-
IU/l
IU/l
IU/l
mg/dl
IU/l
IU/l
IU/l
mg/dl
mg/dl
mg/dl
mEq/l
mEq/l
mEq/l
mg/dl
µg/dl
mg/dl
mg/dl
mg/dl
mg/dl
mg/dl
%
-
µU/ml
Week 4mean meanSD
5691
430.1
13.0
40.8
27.8
94.9
30.3
31.9
56.7
34.8
5.2
2.7
0.7
7.5
4.6
1.6
16.1
12.3
156.3
0.8
189.0
18.5
62.4
11.2
0.6
3.9
140.5
102.8
4.0
9.8
110.0
206.1
112.3
73.1
73.0
86.2
4.8
1.9
4.4
1297
29.3
0.6
1.9
7.2
3.7
1.1
0.6
9.3
9.3
0.9
1.6
0.4
0.5
0.2
0.1
1.9
2.9
20.8
0.3
63.7
9.4
16.8
2.8
0.1
1.2
1.4
1.9
0.2
0.3
26.4
29.7
25.1
12.8
21.9
5.9
0.2
0.5
1.7
±±±±±±±±±±±±±±±±±±±±±±±±±±±±±±±±±±±±±±±
5909
437.0
13.1
41.7
28.7
95.5
30.1
31.5
61.0
30.6
4.9
2.9
0.6
7.5
4.6
1.6
15.9
12.3
154.7
0.8
184.0
19.4
62.5
10.1
0.6
3.8
139.8
102.3
4.1
9.7
92.7
208.5
111.2
76.4
78.9
86.2
4.7
1.8
4.6
1532
30.1
0.8
2.4
7.4
3.2
1.1
0.6
8.6
8.2
1.1
2.1
0.4
0.4
0.3
0.2
1.9
3.1
11.6
0.2
58.0
9.4
15.6
3.0
0.1
1.0
1.6
2.0
0.3
0.6
31.6
31.2
27.4
12.4
31.8
5.8
0.2**
0.6
1.5
±±±±±±±±±±±±±±±±±±±±±±±±±±±±±±±±±±±±±±±
5900
429.0
12.9
40.3
27.5
94.1
30.0
31.9
62.3
29.1
5.1
2.8
0.7
7.4
4.5
1.6
15.4
11.1
147.5
0.7
186.4
18.9
62.3
11.4
0.6
4.0
139.3
103.7
4.1
9.7
88.2
200.2
108.2
76.8
63.6
86.3
4.8
1.6
5.3
1448
22.2
0.6
1.7
6.3
2.8
1.0
0.9
6.8
6.1
1.5
1.9
0.3
0.4
0.2*
0.2
1.6
3.0*
14.8*
0.3
54.2
7.9
14.5
4.0
0.1
0.9
2.2*
1.5
0.2
0.3
28.5*
28.7
24.2
12.0
20.4
7.6
0.2
0.5**
2.0
±±±±±±±±±±±±±±±±±±±±±±±±±±±±±±±±±±±±±±±
Week 0
Control (n=11) LD group (n=12)
mean SD SDWeeks 8 Week 4
mean meanSD
5509
439.4
13.0
40.9
27.6
93.5
29.7
31.8
57.5
33.8
5.7
2.4
0.7
7.6
4.6
1.6
17.9
13.7
175.6
0.7
159.5
13.5
73.1
11.5
0.5
3.5
140.5
102.1
4.0
9.7
79.7
206.9
117.4
72.5
66.5
83.2
4.8
1.9
5.4
1472
28.2
0.8
2.4
7.6
6.5
2.2
0.9
9.6
8.4
1.4
1.7
0.4
0.5
0.2
0.2
3.1
3.8
17.2
0.2
41.1
2.8
17.3
3.0
0.1
1.1
1.8
1.7
0.3
0.2
29.9
33.1
35.9
10.5
26.7
8.8
0.2
0.6
4.2
±±±±±±±±±±±±±±±±±±±±±±±±±±±±±±±±±±±±±±±
5536
436.4
12.9
40.5
27.1
93.0
29.6
31.7
59.9
31.6
5.9
1.9
0.6
7.5
4.5
1.5
17.4
13.4
163.5
0.7
146.5
14.3
79.9
11.8
0.6
3.4
139.6
102.2
4.0
9.6
85.5
202.4
109.7
73.5
65.4
83.2
4.7
1.8
5.0
908
25.7
0.7
1.4
6.2
6.6
2.2
0.8
7.8
6.8
1.1
1.2
0.4
0.5
0.1
0.2
2.9
3.7
27.5
0.2
34.7*
2.9
24.0
3.7
0.1
1.3
2.2*
2.1
0.3
0.2
32.8
28.7
30.1*
11.7
34.5
5.5
0.2*
0.6
2.0
±±±±±±±±±±±±±±±±±±±±±±±±±±±±±±±±±±±±±±±
5236
431.8
12.8
39.4
25.6
91.5
29.7
32.4
60.3
31.1
4.9
3.0
0.7
7.4
4.5
1.6
16.8
13.1
153.3
0.7
147.0
14.0
73.3
11.9
0.6
3.6
140.2
104.5
3.9
9.7
87.9
203.7
113.4
74.3
73.5
82.8
4.8
1.8
6.9
0.538
0.340
0.441
0.140
0.176
0.277
0.205
0.064
0.424
0.356
0.878
0.805
0.926
0.163
0.805
0.457
0.597
0.926
0.176
0.619
0.460
0.902
0.666
0.735
0.735
0.666
0.401
0.172
0.322
0.355
0.242
1.000
0.805
0.324
0.854
0.644
0.826
0.106
1.000
1267
25.1
0.8
2.2*
5.1
6.3
2.1
0.8*
5.8
5.6
1.0*
1.9
0.4
0.3*
0.2
0.2
3.1
3.6
23.0**
0.2
32.4
3.2
21.1
3.6
0.1
1.4
1.9
1.8**
0.2
0.3
46.1
25.8
28.1
12.3
42.8
6.6
0.2 0.6
4.3
±±±±±±±±±±±±±±±±±±±±±±±±±±±±±±±±±±±±±±±
Week 0mean SD SD
Weeks 8p value
Inter-group analysis(vs. Control)
HD group (n=12)
Week 4mean meanSD
5083
440.3
12.8
40.7
27.5
92.8
29.2
31.4
56.9
33.6
5.4
3.5
0.6
7.7
4.6
1.5
22.3
17.6
182.5
0.8
190.5
22.6
82.9
11.1
0.6
4.0
140.8
102.3
4.0
9.7
102.6
203.8
115.2
64.2
108.9
90.8
4.9
2.4
6.7
1357
27.7
1.5
3.5
7.0
10.2
3.9
1.5
7.4
4.7
1.2
3.2
0.4
0.3
0.2
0.2
5.9
6.0
31.5
0.2
59.9
14.7
21.7
2.4
0.1
0.8
1.9
1.8
0.2
0.2
32.9
38.0
36.2
17.9
137.3
15.6
0.4
1.2
4.1
±±±±±±±±±±±±±±±±±±±±±±±±±±±±±±±±±±±±±±±
5550
451.6
13.0
41.6
26.6
92.7
29.0
31.3
59.8
31.3
5.2
3.3
0.6
7.7
4.6
1.5
20.6
16.6
177.3
0.7
189.2
22.5
80.5
11.0
0.6
3.8
139.3
101.9
4.2
9.8
97.4
199.6
117.2
62.4
81.1
93.8
4.9
2.4
8.3
1643
36.5*
1.5
3.2
7.1
9.6
3.8
1.5
12.5
10.6
1.3
2.8
0.4
0.6
0.2
0.3
5.3
4.8
20.4
0.2
54.1
12.7
28.6
1.8
0.1
0.8
1.4**
2.1
0.3
0.3
53.9
31.8
38.6
16.2
35.8
11.8
0.4
1.1
6.3
±±±±±±±±±±±±±±±±±±±±±±±±±±±±±±±±±±±±±±±
5242
443.2
12.8
40.2
26.5
91.3
29.2
31.9
59.2
30.6
5.0
4.5
0.6
7.6
4.6
1.6
20.8
17.3
177.8
0.7
200.8
21.9
101.1
10.8
0.6
4.0
140.2
103.3
4.0
9.7
99.7
198.6
114.3
64.8
89.3
87.6
5.0
2.3
6.0
0.805
0.498
0.388
0.805
0.242
0.203
0.388
0.242
0.667
0.538
1.000
0.387
0.925
0.643
0.353
0.142
0.302
0.643
0.666
0.493
0.268
0.975
0.951
0.689
0.517
0.405
0.975
0.975
0.852
0.497
0.424
0.829
0.538
0.079
0.829
0.644
0.103
0.156
0.878
1277
35.7
1.2
2.8
5.9
9.6*
3.6
1.1
8.1
6.2
1.0
3.7
0.3
0.3
0.2
0.3
5.1
7.4
29.8
0.2*
63.4
13.2
64.6
2.9
0.1
1.0
1.5
2.1
0.2
0.2
51.4 32.9
36.9
15.8
74.5
8.6
0.4
1.1
2.6
±±±±±±±±±±±±±±±±±±±±±±±±±±±±±±±±±±±±±±±
Week 0mean SD SD
Weeks 8p value
Inter-group analysis(vs. Control)

135
TEWL, transepidermal water loss; AGEs: advanced glycation end-products; SD, standard deviationAverage±SD, *p<0.05, **p<0.01 vs. Week 0 by paired-t test. Inter-group analysis by Mann-Whitney U test.
Table 8 Skin analysis
Moisture level pH TEWL
Skin image analysis Melanin
Erythema
Skin Elasticity R0
R1
R2
R3
R4
R5
R6
R7
R8
R9
F0
F1
AGEs measurement Auto fluorescence
Reflectance value
Cheak
Arm
Cheak
Arm
Week 4mean meanSD
47.1
30.3
6.4
20.2
8.1
125.4
354.2
0.33
0.16
0.51
0.35
0.18
0.33
0.41
0.23
0.17
0.02
0.06
0.05
2.13
0.14
9.6
6.0
0.2
4.8
2.0
36.0
56.7
0.03
0.03
0.07
0.03
0.03
0.08
0.06
0.05
0.03
0.00
0.01
0.01
0.41
0.03
±±±±±
±±
±±±±±±±±±±±±
±±
52.9
33.1
6.5
17.7
6.8
117.8
342.8
0.33
0.15
0.54
0.35
0.17
0.33
0.41
0.24
0.17
0.02
0.06
0.04
2.08
0.15
6.5
5.5
0.1*
3.2
1.7**
37.0
52.8
0.06
0.04
0.07
0.06
0.04
0.05
0.09
0.04
0.04
0.00
0.00
0.01
0.41
0.03
±±±±±
±±
±±±±±±±±±±±±
±±
53.1
34.9
6.5
19.7
7.9
109.2
345.4
0.31
0.14
0.54
0.33
0.16
0.33
0.43
0.23
0.17
0.02
0.05
0.04
2.04
0.16
5.9
6.2**
0.2
3.4
2.3
38.7**
58.0
0.04
0.03*
0.07*
0.05
0.03*
0.05
0.09
0.05
0.04
0.00
0.00
0.01
0.40
0.02*
±±±±±
±±
±±±±±±±±±±±±
±±
Week 0
Control (n=11) LD group (n=12)
mean SD SDWeeks 8 Week 4
mean meanSD
47.4
32.5
6.53
22.6
8.9
129.3
325.8
0.35
0.16
0.55
0.37
0.18
0.34
0.38
0.24
0.19
0.02
0.06
0.04
2.16
0.15
5.9
5.5
0.14
5.2
3.1
23.9
64.1
0.05
0.03
0.07
0.05
0.03
0.05
0.05
0.04
0.04
0.00
0.01
0.01
0.35
0.04
±±±±±
±±
±±±±±±±±±±±±
±±
49.2
32.2
6.46
21.3
8.4
126.4
306.3
0.34
0.16
0.54
0.36
0.17
0.33
0.43
0.23
0.18
0.02
0.06
0.05
1.93
0.17
9.1
5.3
0.32
5.7
2.5
29.9
71.5
0.07
0.03
0.05
0.07
0.03
0.03
0.11
0.03
0.04*
0.00
0.01
0.01
0.36*
0.04**
±±±±±
±±
±±±±±±±±±±±±
±±
49.7
34.4
6.51
20.2
9.5
118.6
319.2
0.31
0.13
0.58
0.33
0.15
0.35
0.42
0.25
0.18
0.02
0.06
0.05
2.11
0.16
0.295
0.196
0.056
0.538
0.580
0.388
0.902
0.255
0.712
0.085
0.268
0.878
0.758
0.176
0.242
0.176
0.829
0.806
0.268
0.460
0.622
7.3
9.8
0.28
5.3
3.4
23.9**
45.6
0.05**
0.03*
0.07
0.05**
0.03*
0.05
0.09
0.03
0.04
0.00
0.01
0.01
0.24
0.04
±±±±±
±±
±±±±±±±±±±±±
±±
Week 0mean SD SD
Weeks 8p value
Inter-group analysis(vs. Control) Week 4
mean meanSD
43.2
31.9
6.41
22.2
7.2
109.8
351.6
0.34
0.16
0.51
0.35
0.18
0.30
0.42
0.21
0.17
0.02
0.06
0.04
1.98
0.16
8.5
5.0
0.29
7.2
1.9
24.5
50.5
0.06
0.02
0.05
0.06
0.02
0.05
0.08
0.03
0.04
0.00
0.01
0.01
0.35
0.04
±±±±±
±±
±±±±±±±±±±±±
±±
43.6
32.8
6.50
18.7
6.6
108.2
328.9
0.32
0.14
0.56
0.34
0.16
0.34
0.41
0.24
0.18
0.02
0.05
0.04
1.88
0.15
9.9
6.8
0.15
4.7
2.1
25.9
41.5
0.06
0.03*
0.06*
0.06
0.03*
0.04*
0.10
0.02**
0.04
0.00
0.01
0.01
0.36
0.04
±±±±±
±±
±±±±±±±±±±±±
±±
42.7
34.2
6.45
19.5
8.3
110.3
330.1
0.31
0.13
0.58
0.33
0.15
0.34
0.40
0.24
0.18
0.02
0.05
0.05
1.92
0.17
0.110
0.218
0.622
0.340
0.242
0.052
0.131
0.601
0.166
0.023 0.667
0.056
0.074
0.667
0.012 0.460
0.497
0.951
0.538
0.806
0.758
8.7
4.9
0.27
3.8
2.7
23.5
34.1
0.06**
0.03**
0.05**
0.06**
0.03**
0.07
0.11
0.03*
0.03
0.00
0.01
0.01
0.27
0.04
±±±±±
±±
±±±±±±±±±±±±
±±
Week 0mean SD SD
Weeks 8p value
Inter-group analysis(vs. Control)
HD group (n=12)
SD, standard deviationAverage±SD, *p<0.05, **p<0.01 vs. Week 0 by Wilcoxon signed rank test. Inter-group analysis by Mann-Whitney U test.
Table 7 Skin symptoms
Concerned about pores
Dry skin
Concerned about dull skin
Frequent pimples
Itchy skin
Concerned about spots or freckles
Make-up runs easily
Poor complexion
Sticky oily skin
Coarse and desiccated skin
Slackened skin
Not elastic, not glossy
Concerned about crows feet
Concerned about rough skin
Bags under eyes
Thinning eyebrows
Concerned about slackened skin and chin
Thinning hair
Slow growing nails
Dull, fragile nails
Week 4+8
mean SD
2.8
3.9
3.1
2.4
2.7
3.0
2.8
2.7
2.0
2.6
3.3
2.9
2.6
2.8
2.4
1.7
2.7
2.5
1.7
2.6
0.8
0.8
0.7
0.8
0.5
0.6
0.4
0.6
0.7
0.7
0.6
0.5
0.9
0.6
0.8
0.5
0.5
0.5
0.5
1.1
±±±±±±±±±±±±±±±±±±±±
2.5
3.4
2.9
2.1
2.3
2.8
2.5
2.4
2.0
2.2
2.7
2.7
2.8
2.2
2.4
1.9
2.6
2.4
1.9
2.5
0.7*
0.8**
0.6
0.6
0.5*
0.6
0.5*
0.5
0.6
0.4
0.8**
0.6
0.8
0.5**
1.0
0.5
0.6
0.6
0.3
1.2
±±±±±±±±±±±±±±±±±±±±
Week 0
Control (n=11) LD group (n=11)
mean SD
Week 4+8
mean SD
3.2
3.9
3.1
2.2
3.0
3.1
3.0
2.7
2.4
3.0
3.1
3.3
3.5
3.1
2.1
1.9
2.8
2.7
2.1
2.4
0.8
1.0
0.8
1.2
0.6
1.0
0.6
0.9
1.0
0.7
0.9
0.5
1.1
1.0
0.7
0.8
0.7
1.2
0.5
0.9
±±±±±±±±±±±±±±±±±±±±
2.8
3.3
3.0
2.2
2.2
3.2
2.7
2.5
2.1
2.4
3.0
3.0
3.1
2.7
2.2
2.0
2.6
2.6
2.4
2.6
0.8**
0.9*
1.1
1.1
0.7*
0.6
0.6
0.8
0.6
0.5**
0.9
0.7
1.1*
0.9
0.8
0.8
1.0
1.2
0.8
1.0
±±±±±±±±±±±±±±±±±±±±
Week 0
mean SD
0.642
0.837
0.784
0.263
0.480
0.632
0.756
0.697
0.189
0.508
0.038 0.973
0.012 0.687
0.939
0.639
1.000
0.914
0.605
0.342
p value
Inter-group analysis(vs. Control)
HD group (n=12)
Week 4+8
mean SD
3.2
3.8
3.5
2.9
2.9
3.8
3.1
2.8
2.4
3.3
3.3
3.4
3.5
3.2
2.6
2.1
2.8
3.0
1.9
3.3
0.9
1.0
1.2
1.2
1.4
0.8
0.8
1.0
0.7
1.0
1.3
1.1
1.0
0.9
1.0
0.7
0.9
1.5
0.8
1.3
±±±±±±±±±±±±±±±±±±±±
2.8
3.4
3.0
2.8
2.5
3.3
2.8
2.7
2.0
2.6
3.0
3.0
3.3
2.7
2.3
2.0
2.5
2.6
1.9
3.0
0.8
0.8
1.1*
1.1
0.9
1.0*
0.7
1.1
0.7*
0.8**
0.8
0.9*
0.8
1.0**
0.8* 0.7
0.7
1.2*
0.6
1.1*
±±±±±±±±±±±±±±±±±±±±
Week 0
mean SD
0.803
0.295
0.292
0.536
0.900
0.287
0.706
0.330
0.072
0.239
0.488
0.428
0.141
0.407
0.085
0.114
0.779
0.246
0.795
0.423
p value
Inter-group analysis(vs. Control)
Effect of Beet-Derived Glucosyl Ceramide on Skin and Human Dermal Fibroblasts
136
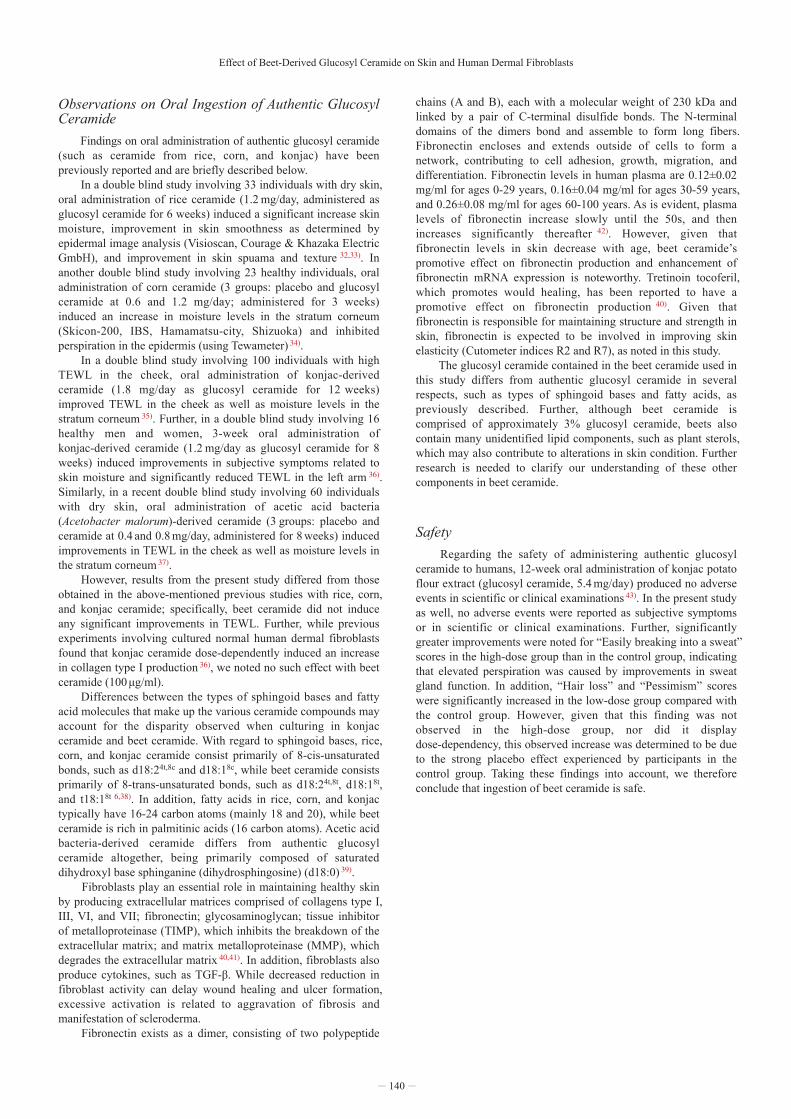
Fig. 4. Fibronectin production in human dermal fibroblasts
Immunoflourescent staining was performed with anti-fibronectin antibodies 24 h after cultivation of human dermal fibroblasts in various concentrations of beet ceramide. Left column: phase-contrast microscopy image. Right column: fluorescence microscope image.
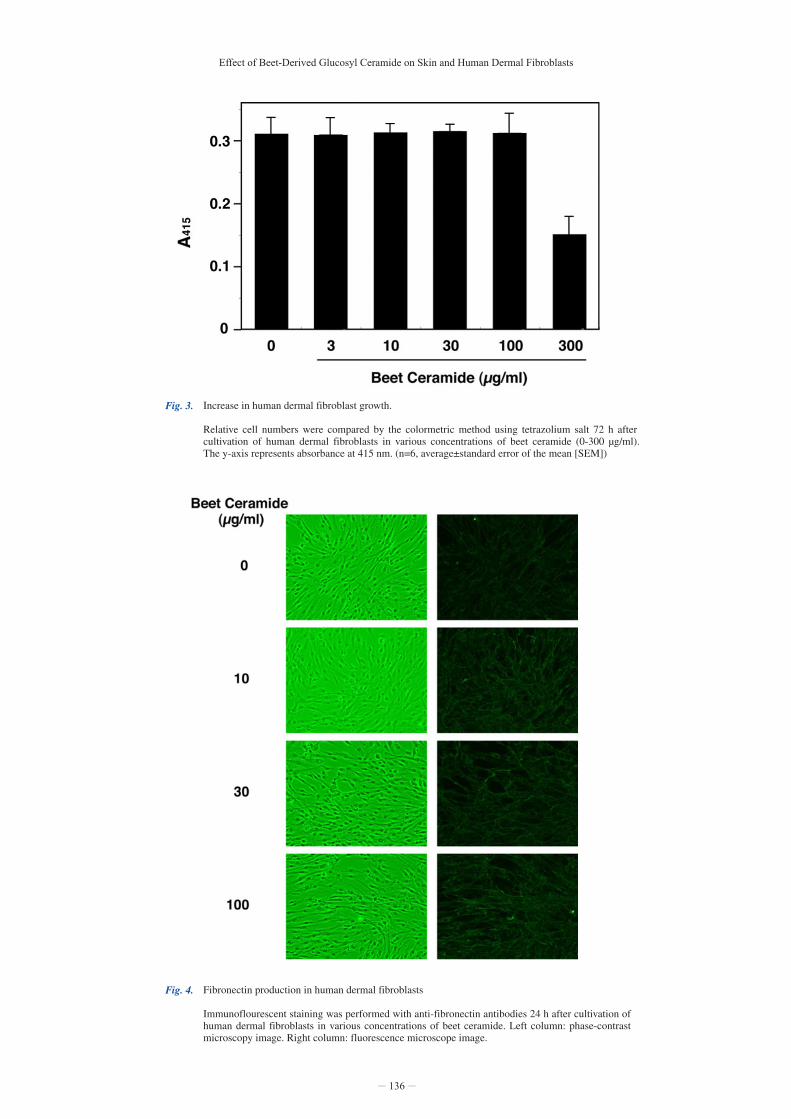
Fig. 3. Increase in human dermal fibroblast growth.
Relative cell numbers were compared by the colormetric method using tetrazolium salt 72 h after cultivation of human dermal fibroblasts in various concentrations of beet ceramide (0-300 µg/ml). The y-axis represents absorbance at 415 nm. (n=6, average±standard error of the mean [SEM])

Fig. 5. Collagen type I production in human dermal fibroblasts.
24 hours after the cultivation of human dermal fibroblasts with (100µg/ml) and without the addition of beet ceramide, immonoflourescent staining was performed with anti-collagen type I antibodies. Left column: phase-contrast microscopy image. Right column: fluorescence microscopy image.
Fig. 6. Fibronectin mRNA expression in human dermal fibroblast.
Fibronectin mRNA expression was semi-quantitatively measured using real time PCR 24 h after cultivation of human dermal fibroblasts in beet ceramide (0-100 µg/ml). The y-axis represents relative amount of fibronectin mRNA adjusted with g1yceraldehyde-3-phosphate dehydrogenase (GAPDH) mRNA expression, a standard for mRNA gene expression. (n=3, average±standard error of the mean [SEM])
137

Effect of Beet-Derived Glucosyl Ceramide on Skin and Human Dermal Fibroblasts
Results
Evaluation of Subjective Symptoms Subjective symptom scores assessed using the AAQol questionnaire are shown in Table 4. Scores for the three groups (control, LD [glucosyl ceramide at 0.6 mg/day], HD [glucosyl ceramide at 1.8 mg/day]) after the intake of beet ceramide (averages after 4 and 8 weeks) were compared using a Mann-Whitney U test. Of the 32 physical symptom items, only “easily break into sweat” differed statistically significantly compared to the control (p=0.045); the score decreased from the relatively high pre-value (2.8±1.3) in the LD group and increased from the relatively low pre-value (1.8±0.8) in the HD group, suggesting that inter-group differences are due to background difference between the LD and HD groups. Of the 21 emotional symptom items, none differed significantly from the control values. Although the LD group showed significant differences from the control with regard to “hair loss” (p=0.010) and “pessimism” (p=0.013), we deemed this result to be due to the large improvement observed in the control group.
Physical Examination The results of the participants’ physical examination are presented in Table 5. No significant differences in body composition, blood pressure, or pulse were noted between the control and experimental groups.
Biochemical Blood Testing Results of biochemical blood tests are presented in Table 6. No significant differences in results for tested items were noted between the control and experimental groups.
Skin Analysis Results for skin symptom analysis are presented in Table 7. With regard to skin symptoms for which significant improvement was reported after the experiment, improvement was noted for six symptoms in both the control and LD group and nine in the HD group. The most overall improvement in skin was reported among members of the HD group. Items for which improvement was reported in the HD group were, “Concerned about dull skin,” “Concerned about spots or freckles,” “Sticky oily skin,” “Coarse and desiccated skin,” “Not elastic, not glossy,” “Bags under eyes,” “Thinning hair,” and “Dull, fragile nails.” No skin symptom items showed a significant difference in score change between HD group and Control. In the LD group, a significant difference in score change (vs. Control) was seen for “Slackened skin” (p=0.038) and “Concerned about crow’s feet” (p=0.012), but the change in “Slackened skin” was attributed to the high level of improvement seen in the control group. Results of skin analysis are presented in Table 8. No significant differences in skin moisture or transepidermal water loss (TEWL) in the cheek or arm were observed between the control and experimental groups. Although we analyzed a number of subclasses in our assessment of moisture and TEWL before oral intake, we noted no significant observations. Results of correlation analysis between moisture level and TEWL prior to beet ceramide intake were r=– 0.072 and p=0.680 in the cheek and r=0.223 and p=0.197 in the arm. Results for correlation analysis of changes in moisture levels and TEWL were r=– 0.017 and p=0.921 in the cheek and r=0.309 and p=0.071 in the arm. No significant correlation was observed.
No significant difference was noted in the level of melanin or severity of erythema in the center of the right cheek between the control and experimental groups. Results of the skin elasticity test (measured at the center of the right cheek) showed a significant difference in elasticity indices R2 (p=0.023) and R7 (p=0.012) between the control and LD groups. Given their dose-dependent nature, these changes were associated with ceramide intake. A significant correlation was confirmed between improvement in elasticity index R2 and score improvement for “Thinning eyebrows” (r=– 0.361, p=0.036). In addition, a significant correlation was also observed between improvement in elasticity index R7 and score improvement for, “Concerned about dull skin” (r=– 0.469, p=0.005), “Concerned about spots of freckles” (r=– 0.343, p=0.047), and “Thinning eyebrows” (r=– 0.360, p=0.036). No significant differences were noted in the advanced glycation end-product fluorescence AF values (measured on the skin of the outer side of the upper arm) between the control and experimental groups.
Test Product Safety No adverse events due to intake of the test product were reported during or after the examination period, suggesting the safety of the test product.
Results from Experiments with Human Dermal Fibroblasts Results from experiments investigating the influence of beet ceramide on human fibroblast proliferation are presented in Fig. 3. No influence on cell proliferation was observed at beet ceramide concentrations at or below 100 µg/ml, with inhibition only evident from 300 µg/ml. With regard to apoptosis, no cell apoptosis was noted at beet ceramide concentrations with 100 µg/ml (data not shown). The influence of beet ceramide on fibronectin production in human fibroblasts was examined using fluorescent immunostaining (Fig. 4). Results showed that fibronectin production increased after culturing cells for 24 h in beet ceramide. Further, the level of increase was found to be dependent on the concentration of beet ceramide used for culturing. Analysis results regarding the influence of beet ceramide on production of human fibroblast collagen type I are presented in Fig. 5. Unlike fibronectin production, collagen type I production levels did not change significantly with the addition of beet ceramide. The influence of the beet ceramide on fibronectin mRNA expression in human fibroblast was also examined (Fig. 6). Results showed that expression increased in a dose-dependent manner after culturing fibroblasts for 24 h with beet ceramide in the medium.
138

139
Discussion
We conducted a double-blind comparison study to assess the effects of eight-week oral administration of glucosyl ceramide contained in beet extract (beet ceramide) on skin condition. Results showed that oral ingestion of beet ceramide did indeed improve subjective symptoms, and a skin elasticity test showed that the elasticity index improved in a dose-dependent manner. In experiments involving human dermal fibroblast cells, beet ceramide promoted fibronectin synthesis as well as fibronectin mRNA expression. Given these results, we postulate that orally ingested beet ceramide stimulates cell signals, thereby inducing favorable effects on the extracellular matrix. However, further studies are needed to determine the digestion and absorption dynamics of beet ceramide, as well as its transference to and effects on human skin.
Changes in the Skin Due to Aging and Ceramide Various structural changes occur in the skin due to aging 22). In the epidermis, for example, such changes include decline in ability to carry out cell division in keratinocytes, decrease in the number of spinous cells, and decrease in lipid levels between keratinocytes (primarily ceramide). Prominent changes in the dermis include decrease in collagen fibers and thinning of fiber bundles; in addition, numbers of elastic fibers decrease, and normal elasticity is lost. As general consequences of aging, the extracellular matrix (mainly hyaluronic acid) diminishes, skin moisture decreases, and reductions are noted in perspiration levels, sebum secretion, and number of hair follicles, along with thinning and whitening of hair. Dry skin is often seen among the elderly, with the degree of dryness increasing with age 23). Subjective symptoms such as itchiness, burning sensations, tingling pains, and stiffness are also occasionally experienced. Morphologically, the dermis and subcutaneous tissue become atrophic and thin in aged skin. Physiologically, sebum secretion and sweat gland function decrease, while TEWL increases 24). Biochemically, ceramide and amino acid levels decrease 25). With regard to ceramide fractions, the ratio of ceramide 1 decreases while that of ceramides 4 and 5 increases in the elderly compared to the younger population. Levels of sphingomyelinase and prosposin, important components in the ceramide synthesis pathway, also decrease with age 23).
Data Analysis In the present study, we noted improvements in skin symptoms and skin elasticity on oral administration of beet ceramide. The fact that the number of improved skin symptom items increased significantly in a dose-dependent manner and that many improvements were observed among members of the high-dose group suggests the efficacy of the product evaluated here. Improved items included “Coarse and desiccated skin” and “Skin not elastic or glossy.” We were unable to explain the reason for the improvement in “Corase and desiccated skin,” for improvements in skin moisture were not confirmed. Functions of skin appendages (sweat glands, sebaceous glands, etc.) and sweat secretion decline with aging 24), and it is possible that sweat gland function improved during the study. Further studies are required in this area. Improvements in “Skin not elastic or glossy” scores can be shown using a skin elasticity test. Strong correlation between the degree of improvement in elasticity indices R2/R7 and the degree of improvement in skin symptoms support the possibility that improvements in skin symptoms are directly related to improvements in skin elasticity.
Skin elasticity is affected by a number of factors, such as the extracellular matrix and collagen fibers, and is lost with age 23,24). Given that the amount of ceramide contained in the test product is less than both the daily intake of ceramide and the total amount in the body, administation of exogenous ceramide is unlikely to affect ceramide content in the skin. Therefore, ceramide is extremely likely to instead affect intracellular signaling. Results from experiments with human skin fibroblasts showed that addition of beet ceramide to the culture medium induced an increase in fibronectin production and mRNA levels. However, given that no increase in levels of collagen I production was observed, the effect of beet ceramide is believed to be selective. These results indicate that beet ceramide does indeed exert favorable effects on the skin’s extracellular matrix, sebum line, and elasticity. Fibronectin, an extracellular matrix protein produced by fibroblasts and resides in the matrix between collagen fibers and elastic fibers in the dermis, can bind to collagen, heparin, and other cells, and plays a critical role in elasticity, morphology, and wound healing in the dermis. Because beet ceramide promotes fibronectin production in fibroblasts, it is thought to aid in maintaining proper dermal structure, thereby maintaining skin elasticity.
Pharmacokinetics of Orally Ingested Ceramide in the Body Results from previous studies revealed that a specific type of ceramide is transported to the skin, liver, and brain after oral ingestion, where it is then metabolically converted and distributed throughout the body, migrating from the dermis to the epidermis in mice 26) and rats 27). Approximately 5% of dosed ceramide is excreted in urine, and approximately 90% in feces 27). Respective ratios of orally ingested ceramide transported to the skin in mice and rats are 4.5% (continuous administration for 12 days) 26) and 1.67% (96 h after a single administration) 27). Typical daily ceramide intake from food in humans is approximately 50-290 mg 28). With plant-derived orally ingested glucosyl ceramide, glucoside bonds break off and become ceramide, which is then broken down into sphingoid bases and fatty acids. Sphingoid bases are absorbed by the epithelial cells of the small intestine via selective absorption involving p-sugar protein, a drug excretion transporter 29). However, while plant-derived sphingoid bases such as sphingadienine (d18:24t,8t, d18:24t,8c, etc.) are absorbed by epithelial cells, they are absorbed and excreted into the intestines by p-glycoproteins. As such, absorption of plant-derived sphingoid bases has been reported to be lower than that of animal-derived ones such as sphingosine 30). In the present study, only 1.8 mg of glucosyl ceramide was administered to the high-dose group, an amount which accounts for approximately 4% of daily intake. Only a small portion of ingested ceramide is actually absorbed by the body, and even if 5% of the total amount absorbed were transported to the skin, that amount is expected to be less than 1 μg. Further, the skin of an adult human weighs 3-4 kg 31), and 2 mg of ceramide is less than 0.0001% of this weight. As such, it is therefore unrealistic to hypothesize that, “2 mg of authentic glucosyl ceramide orally ingested is absorbed by the intestinal tract and thereby increases the level of ceramide in the epidermis.” We alternatively hypothesize that glucoside bases which appear during metabolism acts as second messengers in the cell and control intracellular signals, thereby leading to physiological changes.
Effect of Beet-Derived Glucosyl Ceramide on Skin and Human Dermal Fibroblasts
Observations on Oral Ingestion of Authentic Glucosyl Ceramide Findings on oral administration of authentic glucosyl ceramide (such as ceramide from rice, corn, and konjac) have been previously reported and are briefly described below. In a double blind study involving 33 individuals with dry skin, oral administration of rice ceramide (1.2 mg/day, administered as glucosyl ceramide for 6 weeks) induced a significant increase skin moisture, improvement in skin smoothness as determined by epidermal image analysis (Visioscan, Courage & Khazaka Electric GmbH), and improvement in skin spuama and texture 32,33). In another double blind study involving 23 healthy individuals, oral administration of corn ceramide (3 groups: placebo and glucosyl ceramide at 0.6 and 1.2 mg/day; administered for 3 weeks) induced an increase in moisture levels in the stratum corneum (Skicon-200, IBS, Hamamatsu-city, Shizuoka) and inhibited perspiration in the epidermis (using Tewameter) 34). In a double blind study involving 100 individuals with high TEWL in the cheek, oral administration of konjac-derived ceramide (1.8 mg/day as glucosyl ceramide for 12 weeks) improved TEWL in the cheek as well as moisture levels in the stratum corneum 35). Further, in a double blind study involving 16 healthy men and women, 3-week oral administration of konjac-derived ceramide (1.2 mg/day as glucosyl ceramide for 8 weeks) induced improvements in subjective symptoms related to skin moisture and significantly reduced TEWL in the left arm 36). Similarly, in a recent double blind study involving 60 individuals with dry skin, oral administration of acetic acid bacteria (Acetobacter malorum)-derived ceramide (3 groups: placebo and ceramide at 0.4 and 0.8 mg/day, administered for 8 weeks) induced improvements in TEWL in the cheek as well as moisture levels in the stratum corneum 37). However, results from the present study differed from those obtained in the above-mentioned previous studies with rice, corn, and konjac ceramide; specifically, beet ceramide did not induce any significant improvements in TEWL. Further, while previous experiments involving cultured normal human dermal fibroblasts found that konjac ceramide dose-dependently induced an increase in collagen type I production 36), we noted no such effect with beet ceramide (100 μg/ml). Differences between the types of sphingoid bases and fatty acid molecules that make up the various ceramide compounds may account for the disparity observed when culturing in konjac ceramide and beet ceramide. With regard to sphingoid bases, rice, corn, and konjac ceramide consist primarily of 8-cis-unsaturated bonds, such as d18:24t,8c and d18:18c, while beet ceramide consists primarily of 8-trans-unsaturated bonds, such as d18:24t,8t, d18:18t, and t18:18t 6,38). In addition, fatty acids in rice, corn, and konjac typically have 16-24 carbon atoms (mainly 18 and 20), while beet ceramide is rich in palmitinic acids (16 carbon atoms). Acetic acid bacteria-derived ceramide differs from authentic glucosyl ceramide altogether, being primarily composed of saturated dihydroxyl base sphinganine (dihydrosphingosine) (d18:0) 39). Fibroblasts play an essential role in maintaining healthy skin by producing extracellular matrices comprised of collagens type I, III, VI, and VII; fibronectin; glycosaminoglycan; tissue inhibitor of metalloproteinase (TIMP), which inhibits the breakdown of the extracellular matrix; and matrix metalloproteinase (MMP), which degrades the extracellular matrix 40,41). In addition, fibroblasts also produce cytokines, such as TGF-β. While decreased reduction in fibroblast activity can delay wound healing and ulcer formation, excessive activation is related to aggravation of fibrosis and manifestation of scleroderma. Fibronectin exists as a dimer, consisting of two polypeptide
chains (A and B), each with a molecular weight of 230 kDa and linked by a pair of C-terminal disulfide bonds. The N-terminal domains of the dimers bond and assemble to form long fibers. Fibronectin encloses and extends outside of cells to form a network, contributing to cell adhesion, growth, migration, and differentiation. Fibronectin levels in human plasma are 0.12±0.02 mg/ml for ages 0-29 years, 0.16±0.04 mg/ml for ages 30-59 years, and 0.26±0.08 mg/ml for ages 60-100 years. As is evident, plasma levels of fibronectin increase slowly until the 50s, and then increases significantly thereafter 42). However, given that fibronectin levels in skin decrease with age, beet ceramide’s promotive effect on fibronectin production and enhancement of fibronectin mRNA expression is noteworthy. Tretinoin tocoferil, which promotes would healing, has been reported to have a promotive effect on fibronectin production 40). Given that fibronectin is responsible for maintaining structure and strength in skin, fibronectin is expected to be involved in improving skin elasticity (Cutometer indices R2 and R7), as noted in this study. The glucosyl ceramide contained in the beet ceramide used in this study differs from authentic glucosyl ceramide in several respects, such as types of sphingoid bases and fatty acids, as previously described. Further, although beet ceramide is comprised of approximately 3% glucosyl ceramide, beets also contain many unidentified lipid components, such as plant sterols, which may also contribute to alterations in skin condition. Further research is needed to clarify our understanding of these other components in beet ceramide.
Safety Regarding the safety of administering authentic glucosyl ceramide to humans, 12-week oral administration of konjac potato flour extract (glucosyl ceramide, 5.4 mg/day) produced no adverse events in scientific or clinical examinations 43). In the present study as well, no adverse events were reported as subjective symptoms or in scientific or clinical examinations. Further, significantly greater improvements were noted for “Easily breaking into a sweat” scores in the high-dose group than in the control group, indicating that elevated perspiration was caused by improvements in sweat gland function. In addition, “Hair loss” and “Pessimism” scores were significantly increased in the low-dose group compared with the control group. However, given that this finding was not observed in the high-dose group, nor did it display dose-dependency, this observed increase was determined to be due to the strong placebo effect experienced by participants in the control group. Taking these findings into account, we therefore conclude that ingestion of beet ceramide is safe.
140

1)
2)
3)
4)
5)
6)
7)
8)
9)
10)
11)
12)
Uchida Y, Holleran WM: Omega-O-acylceramide, a lipid essential for mammalian survival. J Dermatol Sci 51;77-87: 2008Yonei Y, Mizuno Y, Katagiri E: Effects of cosmetics therapy using isoflavone and pine bark extract on the skin and QOL: A double-blind placebo-controlled trial. Anti-Aging Medical Research 1; 48-58: 2004Yonei Y, Takahashi Y, Takahashi H, et al: A double-blind clinical study of Rokkaku Reishi essence in women. Anti-Aging Medicine 4; 28-37: 2007Yonei Y, Iwabayashi M, Fujioka N, et al: Evaluation of effects of cassis (Ribes nigrum L.) juice on human vascular function and gene expression using a microrray system. Anti-Aging Medicine 6; 22-31: 2009National Institute of Health and Nutrition. Information system for safety and effectiveness for health foods. Ceramide (N-acylsphingosine). http://hfnet.nih.go.jp/contents/detail570.html (accessed April 2010) (in Japanese)Matsumoto E, Nakatsuka S: Development of authentic glucosyl ceramides from rice, maize etc. The Cell 41; 215-217: 2009 (in Japanese) Yonei Y, Takahashi Y, Hibino S, et al: Effects on the human body of a dietary supplement containing L-carnitine and Garcinia cambogia extract: a study using double-blind tests. J Clin Biochem Nutr 42; 89-103: 2008Fujioka N, Hibino S, Wakahara A, et al: Effects of various soap elements on skin. Anti-Aging Medicine 6; 109-118: 2009Fluhr JW, Kuss O, Diepgen T, et al: Testing for irritation with a multifactorial approach: comparison of eight non-invasive measuring techniques on five different irritation types. Br J Dermatol 145; 696-703: 2001Annen M, Yamamoto K: Clinical case reports of bioceramides LS lotion: efficacy in pediatric patients with atopic dermatitis. Journal of Pediatric Dermatology 17; 45-50: 1998 (in Japanese)Pinnagoda J, Tupker RA, Agner T, et al: Guidelines for transepidermal water loss (TEWL) measurement. Contact Dermatitis 22; 164-178: 1990Clarys P, Alewaeters K, Lambrecht R, et al: Skin color measurements: comparison between three instruments: the Chromameter (R), the DermaSpectrometer (R) and the Mexameter (R). Skin Res Technol 6; 230-238: 2000
13)
14)
15)
16)
17)
18)
19)
20)
21)
22)
23)
24)
25)
Manuskiatti W, Sivayathorn A, Leelaudomlipi P, et al: Treatment of acquired bilateral nevus of Ota-like macules (Hori's nevus) using a combination of scanned carbon dioxide laser followed by Q-switched ruby laser. J Am Acad Dermatol 48; 584-591: 2003Enomoto DN, Mekkes JR, Bossuyt PM, et al: Quantification of cutaneous sclerosis with a skin elasticity meter in patients with generalized scleroderma. J Am Acad Dermatol 35; 381-387: 1996Rennekampff HO, Rabbels J, Pfau M, et al: Evaluating scar development with objective computer-assisted viscoelastic measurement. Kongressbd Dtsch Ges Chir Kongr 119; 749-755: 2002 (in German)Dobrev H: Application of Cutometer area parameters for the study of human skin fatigue. Skin Res Technol 11; 120-122: 2005Kubo M. Yagi M. Kawai H. et al: Anti-glycation effects of mixed-herb-extracts in diabetes and pre-diabetes. J Clin Biochem Nutr 43(Suppl 1); 66-69: 2008Meerwaldt R, Graaff R, Oomen PH, et al: Simple non-invasive assessment of advanced glycation endproduct accumulation. Diabetologia 47; 1324-1330: 2004Meerwaldt R, Hartog JW, Graaff R, et al: Skin autofluorescence, a measure of cumulative metabolic stress and advanced glycation end products, predicts mortality in hemodialysis patients. J Am Soc Nephrol 16; 3687-3693: 2005 Lutgers HL, Graaff R, Links TP, et al: Skin autofluorescence as a noninvasive marker of vascular damage in patients with type 2 diabetes. Diabetes Care 29; 2654-2659: 2006Bi LX, Wiren KM, Zhang XW, et al: The effect of oxandrolone treatment on human osteoblastic cells. J Burns Wounds 6; 53-64: 2007Ojimi H, Kosaka M, Eto A, et al: Causes, prophylaxis, and treatment of the aging face. The Journal of Fukuoka Dental College 34; 87-92: 2008 (in Japanese) Tezuka T: Senile changes of the epidermis. Nagoya Medical Journal 43; 121-127: 2000Kobayashi Y, Sultana R: Skin aging. Biomedical Gerontology 32; 15-19: 2008 (in Japanese)Togashi K: Aging of skin moisturizing function and lipid in epidermis and stratum corneum. Japanese Journal of Dermatology 103; 1165-1170: 1993 (in Japanese)
References
141
Conclusion
To assess the effects of 8-week oral administration of glucosyl ceramide contained in beet extract (beet ceramide; administered as glucosyl ceramide to 3 groups at 0, 0.6, and 1.8 mg/day), we conducted a double-blind comparison study involving 35 females (mean age: 40.9±4.2 years). Results showed that oral ingestion of beet ceramide improved subjective skin symptoms, and skin elasticity tests showed that elasticity index improved in a dose-dependent manner. In addition, beet ceramide promoted fibronectin synthesis and mRNA expression in experiments involving human dermal fibroblast cells. Given these results, we postulate that orally ingested beet ceramide stimulates cell signals, thereby exerting favorable effects on the extracellular matrix. We have confirmed the safety of beet ceramide in humans. However, further studies are needed to determine the digestion and absorption dynamics of beet ceramide, as well as its transferability to and effects on human skin.

Effect of Beet-Derived Glucosyl Ceramide on Skin and Human Dermal Fibroblasts
26)
27)
28)
29)
30)
31)
32)
33)
34)
Ueda O, Hasegawa M, Kitamura S: Distribution in skin of ceramide after oral administration to rats. Drug Metab Pharmacokinet 24; 180-184: 2009Fukami H, Tachimoto H, Kishi M, et al: Pharmacokinetics of oral intake of ceramide-containing acetic acid bacteria. Proceedings of the Japanese Conference on the Biochemistry of Lipids 51; 107-110: 2009 (in Japanese)Miyashita R, Yunoki K, Ogawa T, et al: Intake of sphingolipid in Japanese and effect of authentic cerebrosides on skin. Proceedings of the Japanese Conference on the Biochemistry of Lipids 49; 161-164: 2007 (in Japanese)Sugawara T, Kinoshita M, Ohnishi M, et al: Efflux of sphingoid bases by P-glycoprotein in human intestinal Caco-2 cells. Biosci Biotechnol Biochem 68; 2541-2546: 2004Sugawara T, Kinoshita M, Ohnishi M, et al: Digestion of maize sphingolipids in rats and uptake of sphingadienine by Caco-2 cells. J Nutr 133; 2777-2782: 2003Komiya S, Muraoka Y, Zhang F-S: Age related changes in body fat distribution in middle-aged and eldery Japanese. The Journal of Anthropological Society of Nippon 100; 161-169: 1992Zhang HL: Clinical study in effect of rice-derived glucosyl ceramide (sphingoglycolipid) containing food on skin: Objective evaluation by three-dimensional image analysis. Journal of New Remedies & Clinics 51; 890-900: 2002 (in Japanese) Shimoda H: Effect of glucosyl sphingolipids derived from rice on human skin condition. The Cell 41; 203-205: 2009 (in Japanese)Asai S, Miyachi H: Effect and evaluation of epidermal and oral administration of authentic glucosyl ceramides on skin moisturizing. Rinsho Byori 55; 209-215: 2007 (in Japanese)
35)
36)
37)
38)
39)
40)
41)
42)
43)
Uchiyama T, Nakano Y, Ueda O, et al: Oral intake of glucosyl ceramide improves relatively higher level of transepidermal water loss in mice and healthy human subjects. Journal of Health Science 54; 559-566: 2008Mukai K: The possibility of glucosyl ceramide derived from konjac-tuber as the beauty materials. The Cell 41; 206-208: 2009 (in Japanese)Oda T, Tachimoto H, Kishi M, et al: Effect of oral intake of ceramide-containing acetic acid bacteria on skin barrier function. Anti-Aging Medicine 7; 50-54: 2010Tahara Y, Nakagawa A, Yamada Y: Occurrence of free ceramide in Acetobacter xylinum. Agric Biol Chem 50; 2949-2950: 1986Takakuwa N, Saito K, Oda Y: Content of functional lipid ceramide in crop tissues and by-products from their processing. In Atarashii Kenkyu Seika. Hokkaido Chiiki, pp173-177, National Agricultural Research Center for Hokkaido Region: 2005Mori Y, Hatamochi A, Takeda K, et al: Effects of tretinoin tocoferil on gene expression of the extracellular matrix components in human dermal fibroblasts in vitro. J Dermatol Sci 8; 233-238: 1994Inh H: Recent Progress in autoimmune: TGF-beta signaling and systemic sclerosis. Japanese Journal of Dermatology 117; 2088-2090: 2007 (in Japanese)Oka H, Sato K, Moriguchi T, et al: The quantitative changes of the plasma fibronectin (FN) with aging. Kawasaki Medical Journal 11; 101-108: 1985Uchiyama T, Nakano Y, Nakashima M, et al: Safety in long term or excess intake of a drink containing glucosyl ceramide derived from Amorphophallus Konjac in healthy volunteers. Yakuri To Chiryo 36; 303-314: 2008 (in Japanese)
142