doutoramento em bioquímica -...
TRANSCRIPT

2018
UNIVERSIDADE DE LISBOA
FACULDADE DE CIÊNCIAS
Impact of the feeding cycle upon the neuronal membrane properties of rat
hippocampal neurones: the involvement of voltage-gated sodium and calcium
currents and the maintenance of plasma membrane organization.
“Documento Definitivo”
Doutoramento em Bioquímica
Especialidade de Biofísica Molecular
André Emanuel Pinheiro Bastos
Tese orientada por:
Doutor Pedro Afonso Lima
Doutor Rodrigo F.M. de Almeida
Doutora Ana Maria Sebastião
Documento especialmente elaborado para a obtenção do grau de doutor

2018
UNIVERSIDADE DE LISBOA
FACULDADE DE CIÊNCIAS
Impact of the feeding cycle upon the neuronal membrane properties of rat
hippocampal neurones: the involvement of voltage-gated sodium and calcium
currents and the maintenance of plasma membrane organization.
Doutoramento em Bioquímica
Especialidade de Biofísica Molecular
André Emanuel Pinheiro Bastos
Tese orientada por:
Doutor Pedro Afonso Lima
Doutor Rodrigo F.M. de Almeida
Doutora Ana Maria Sebastião
Júri:
Presidente:
Doutora Amélia Pilar Grases dos Santos Silva Rauter, Professora Catedrática e Presidente do Departamento
de Química e Bioquímica da Faculdade de Ciências da Universidade de Lisboa
Vogais:
Doutor Euan Robert Brown, Senior Lecture
School of Engineering and Physical Sciences da Heriot Watt University (Reino Unido);
Doutor Albino Jorge Oliveira Maia, Professor Auxiliar Convidado
Nova Medical School da Universidade Nova de Lisboa;
Doutor Pedro Afonso dos Santos Baltazar de Lima
Professor Auxiliar Convidado da Nova Medical School da Universidade Nova de Lisboa (Orientador);
Doutora Ana Isabel Abrantes Coutinho, Professora Auxiliar
Faculdade de Ciências da Universidade de Lisboa.
Documento especialmente elaborado para a obtenção do grau de doutor
Bolsa de doutoramento financiado pela Fundação para a Ciência e Tecnologia (FCT) com a referência
SFRH/BD/881

“If you’re going to live life, you’ve got to be all in”
Professor Marian Diamond
“As long as our brain is a mystery, the universe, the reflection of the structure of the
brain, will also be a mystery.”
Santiago Ramón y Cajal

CONTENTS
ACKNOWLEDGMENTS ............................................................................................................................. I
LIST OF ABBREVIATIONS AND SYMBOLS ............................................................................................... III
ABSTRACT .......................................................................................................................................... VIII
RESUMO ...............................................................................................................................................XI
1 GENERAL INTRODUCTION ............................................................................................................. 1
1.1 BRAIN AND ENERGY HOMEOSTASIS: CROSSTALK BRAIN VS. PERIPHERAL ORGANS (BRAIN-GUT AXIS) ...................... 1
1.2 HIPPOCAMPUS AND ENERGY BALANCE ..................................................................................................... 3
1.3 EFFECT OF NUTRITION ON COGNITION ..................................................................................................... 6
1.4 FEEDING CYCLE ON HIPPOCAMPAL NEURONES - EXCITABILITY AND PLASMA MEMBRANE LIPID COMPOSITION AND
ORGANIZATION ............................................................................................................................................. 8
1.5 REFERENCES ..................................................................................................................................... 12
2 OBJECTIVES ................................................................................................................................. 20
2.1 OUTLINE OF THE THESIS ...................................................................................................................... 21
3 FEEDING CYCLE ON ION CHANNELS ............................................................................................. 23
3.1 MATERIAL AND METHODS .................................................................................................................. 23
3.1.1 Animal monitorization ........................................................................................................ 23
3.1.2 Dissection of hippocampus and preparation of CA1 hippocampal sub-slices ..................... 23
3.1.3 Enzymatic and mechanical dissociation of CA1 neurones .................................................. 25
3.1.4 Selection of neurones/criteria of exclusion ......................................................................... 27
3.1.5 Whole-cell recordings ......................................................................................................... 28
3.1.6 Inside-out excised patch clamp recordings ......................................................................... 30
3.1.7 Plasma membrane-enriched fractions preparation ............................................................ 33
3.1.8 Western blotting ................................................................................................................. 33
3.1.9 Statistical analysis .............................................................................................................. 34
3.2 VOLTAGE-GATED NA+ CHANNELS .......................................................................................................... 35
3.2.1 Brief introduction on behaviour and functioning ................................................................ 35
3.2.2 VGSCs subunits in mammalian brain - structure and background biophysics .................... 36
3.2.3 VGSCs distribution in rat hippocampal CA1 neurones ........................................................ 39
3.2.4 Influence of Feeding cycle on neuronal Na+ currents .......................................................... 41
3.2.4.1 Whole-cell voltage clamp recordings ...................................................................................... 41
3.2.4.2 Single-channel analysis – inside-out excised patch configuration ........................................... 49
3.2.4.3 Na+ channel expression analysis – western blotting ............................................................... 58
3.2.4.4 Discussion ................................................................................................................................ 59
3.3 VOLTAGE-GATED CA2+ CHANNELS ......................................................................................................... 65

3.3.1 Calcium signaling in the brain............................................................................................. 65
3.3.2 Voltage-gated Ca2+ channel - Diversity and classification schemes .................................... 67
3.3.3 Subunits of VGCCs - Structure ............................................................................................. 70
3.3.4 VGCC distribution in rat hippocampal CA1 neurones ......................................................... 71
3.3.5 Influence of feeding cycle on neuronal Ca2+ currents ......................................................... 74
3.3.5.1 Whole-cell voltage clamp recordings ...................................................................................... 74
3.3.5.2 Discussion ................................................................................................................................ 84
3.4 REFERENCES ..................................................................................................................................... 87
4 FEEDING CYCLE ON NEURONAL PLASMA MEMBRANE ................................................................ 98
4.1 PLASMA MEMBRANE DOMAINS – LIPID COMPOSITION AND DISTINCT PHASES ................................................ 98
4.2 MEMBRANE PROBES SENSITIVE TO DIFFERENT LIPID DOMAINS .................................................................. 102
4.3 FLUORESCENCE SPECTROSCOPY – PRINCIPLES AND TYPES OF MEASUREMENTS .............................................. 104
4.3.1 Steady-state fluorescence anisotropy. Into the rigidity of biological membranes derived
from rotational dynamics of excited molecular probes .................................................................. 106
4.3.1.1 Technical instrumentation used in steady-state fluorescence anisotropy ............................ 107
4.3.2 Time-resolved fluorescence intensity decays. Into the organization of biological
membranes ..................................................................................................................................... 108
4.3.2.1 Technical instrumentation used in time-resolved fluorescence intensity decays ................. 110
4.4 MATERIALS AND METHODS ............................................................................................................... 111
4.4.1 Chemicals .......................................................................................................................... 111
4.4.2 Plasma membrane-enriched fraction isolation ................................................................. 111
4.4.3 Total lipids extraction ....................................................................................................... 111
4.4.4 Phospholipid and cholesterol quantification .................................................................... 112
4.4.5 Membrane preparation for fluorescence spectroscopy measurements ........................... 112
4.4.6 Fluorescence spectroscopy measurements ....................................................................... 113
4.4.7 Thin Layer Chromatography ............................................................................................. 114
4.5 INFLUENCE OF FEEDING CYCLE ON LIPID ORGANIZATION AND COMPOSITION OF NEURONAL PLASMA MEMBRANE . 115
4.5.1 Fluorescence spectroscopy ............................................................................................... 115
4.5.1.1 Anisotropy measurements .................................................................................................... 115
4.5.1.2 Fluorescence lifetime measurements ................................................................................... 117
4.5.2 Biochemical characterization of the plasma membrane of rat hippocampus .................. 120
4.5.2.1 Lipid content ......................................................................................................................... 120
4.5.2.2 Phospholipid composition of the PM of rat hippocampus .................................................... 121
4.5.3 Conclusions on the influence of feeding cycle on the plasma membrane of rat
hippocampus ................................................................................................................................... 123
4.6 REFERENCES ................................................................................................................................... 125
5 FINAL CONSIDERATIONS ........................................................................................................... 131
5.1 GENERAL DISCUSSION ...................................................................................................................... 131

5.2 FUTURE PERSPECTIVES ...................................................................................................................... 135
5.3 REFERENCES ................................................................................................................................... 137
6 ANNEX I .................................................................................................................................... 140
6.1 HIPPOCAMPUS – HISTORICAL PERSPECTIVE OF ANATOMY AND CIRCUITRY .................................................... 140
6.1.1 Intrinsic hippocampal circuit ............................................................................................. 141
6.2 RAT HIPPOCAMPAL CA1 NEURONES .................................................................................................... 143
6.3 REFERENCES ................................................................................................................................... 146
7 ANNEX II ................................................................................................................................... 147
7.1 VOLTAGE CLAMP TECHNIQUES ........................................................................................................... 147
7.1.1 Patch clamp configurations .............................................................................................. 148
7.1.1.1 Whole-cell and inside-out patch clamp recordings – technical singularities and procedure 149
7.1.2 Principles of patch-clamp recording – technical instrumentation .................................... 151
7.2 REFERENCES ................................................................................................................................... 154

I
Acknowledgments
Termina assim uma caminhada longa!... que começou a ser trilhada há quase 10 anos
pelos protagonistas, Pedro e André. Decorria uma tarde do mês de Junho de 2008, terceiro
semestre do 1º ano de mestrado em Bioquímica Médica, quando André recebeu um email
de Pedro a confirmar a visita ao gabinete deste, a propósito de uma entrevista de estágio
de mestrado. O tema do estágio era muito interessante, completamente fora dos conteúdos
programáticos da FCUL naquela altura. Chegado ao gabinete de Pedro, André desde cedo
percebeu que a dinâmica daquele professor era… diferente. O rumo formal que, pensara
André, aquela entrevista tomaria, não passou de um momento ligeiro, de descontração,
sem preconceitos, nem pretensiosismos. Com o tempo, André apercebeu-se que esta era
uma capacidade inata de Pedro.
E foi assim que tudo começou!
Durante este longo trajecto de 10 anos conheci várias pessoas que me marcaram e me
ajudaram muito para que hoje consiga estar a escrever a secção dos “agradecimentos” da
minha tese de doutoramento. Chegou a hora de prestar louvores a quem os merece! A
primeira palavra de gratidão é endereçada ao Pedro Lima. O respeito mútuo e a
cumplicidade que se criou entre nós extravasa qualquer barreira profissional. Hoje sei que
tenho um amigo no qual me posso apoiar e confiar. Pedro, obrigado por este caminho.
Cresci muito durante este tempo. Tenho a plena noção que tu tiveste uma grande
responsabilidade nisso. Obrigado!
A minha gratidão e reconhecimento estendem-se igualmente ao Rodrigo! Tenho bem
presente a importância do teu papel na fase inicial da minha ainda curta carreira de
investigador. Bem sei o que aquelas duas bolsas de investigação representaram no meu
trajecto científico. Desde logo, foram preponderantes para ter conseguido uma bolsa de
Doutoramento. Tenho plena consciência que tu foste essencial nessa fase pré-
doutoramento. O teu contributo merece toda a minha consideração. Estas palavras são
testemunhas disso mesmo!
Pedro e Rodrigo, evoluí muito convosco a nível técnico. Cada um de vocês, dentro das
respectivas área de especialidade, soube passar-me conhecimentos que hoje ponho em

II
práctica no quotidiano da vida laboratorial. Se há dias em que trato a bancada do
laboratório por ‘tu’, devo-os a vocês.
Seguidamente, o rol infindável de amigos e colegas de laboratório com os quais tive o
prazer de aprender, ensinar e crescer. Joaquim Marquês!!!!! Este é para a vida! Já não
escapa! Tem uma capacidade incrível; no laboratório consegue ser desconcertante e
manter um elevado nível elevado de raciocínio, ao mesmo tempo. Fora do laboratório,
continua a ser desconcertante… é um amigo, daqueles para a vida! IFI, caro Joaquim!
IFI!
Inês Almeida, Ana, Andreia Giro, Filipa Santos, Catarina Antunes (!), Chico, Cordel,
Telma, Eva, Ana Carreira, Telmo. A todos vocês um muito obrigado por, aqui e ali, me
terem acompanhado neste projecto de doutoramento.
Ao pessoal da Sea4Us, a melhor empresa de biotecnologia do mundo e arredores! Tem
sido fantástico acompanhar de perto o crescimento da empresa! O que suporta todo esse
crescimento é a colaboração de cada uma das pessoas, que se identificam com a causa.
Importa relevar a importância dos colegas com quem partilho ideias, experiências,
gargalhadas, cafés, bebidas, jantares, conversas… é um prazer enorme ser testemunha do
crescimento da Beatriz e da Rosa, por exemplo. Joaninha, Clarinha, Miguel, Gilberto,
Sílvia, Marisa, Filipe, Nuno e, claro está, Pedro! A minha gratidão para com a Sea4Us
também não será esquecida!
À minha noiva, minha companheira e confidente, Soraya! Esta grande realização pessoal
ganha uma dimensão tendo-te por perto. Na verdade, se o caminho do meu projecto de
doutoramento começou há 10 anos, o caminho do nosso projecto de vida começou há 14
anos! O Lourenço é a prova da vivacidade do nosso Amor. Tu tens sido uma companheira
incrível, um apoio imprescindível! Tu, melhor que ninguém, sabes que o percurso até
aqui foi duro, mas altamente recompensador. Só tu sabes todas as agruras por que passei,
todos os percalços e desgaste de um percurso exigente e, muitas vezes, solitário. Estavas
sempre lá para mais um beijo, para mais uma palavra de conforto e encorajamento. Pelo
teu papel no meu doutoramento, e na minha vida em geral, muito obrigado!

III
List of abbreviations and symbols
𝑎𝑓 – amplitude coefficient of the fast component of inactivation
𝑎𝑠 amplitude coefficient of the slow component of inactivation
𝑓𝑐 – cut-off frequency
⟨𝑟⟩ -Fluorescence anisotropy
⟨𝜏⟩ -Fluorescence lifetime
[Ca2+i] - intracellular calcium concentration
4-AP - 4-Aminopyridine
ACSF - chilled artificial cerebrospinal fluid
AGRP – Agouti-related protein
AIS – Initial Segmnt of Axons
AP – Action Potential
BCA - Bicinchoninic Acid
BDNF – Brain-Derived Neurotrophic Factor
𝐶 – current amplitude of the sustained component
CA - cornu ammonis
Ca2+ - Calcium
CaCl2 – Calcium Chloride
Cav or VGCC- Voltage-Gated Calcium Channel
CCK – Cholecystokinin
CHCl3 - chloroform
Cm - whole-cell capacitance (Faraday, F)
CNS – Central Nervous System

IV
CO2 – Carbone Dioxide
CsCl – Cesium Chloride
CsF – Cesium Fluoride
D.O.C – sodium deoxycholate
DHP - 1,4-dihydropyridine
DPH - 1,6-diphenyl-1,3,5-hexatriene
DPPE - 1,2-Dipalmitoyl-sn-glycero-3-phosphoethanolamine
DTT – dithiothreitol
ENa+ - Reversal potential of Na+ ions (mV)
𝐸𝐶𝑎2+ - Reversal potential of Ca2+ ions (mV)
FA – Fatty acid
G – Conductance (Siemens, S))
G/Gmax - Conductance normalized to maximum conductance values
GI – Gastrointestinal
GLP-1 – Glucagon-like Peptide-1
GSL – glycosphingolipid
H.M. – patient Henry Molaison
h∞ - steady-state of inactivation curves
HCl – chloride acid
H-H – Hodgkin and Huxley
HVA – High-threshold Voltage Activated
Hz – Heartz (frequency)
I/Imax – Current normalized to maximum value
ICa – Voltage-gated Ca2+ currents (Ampere, A)

V
IFM – Isoleucine; Phenylalanine; Methionine
INa – Voltage-gated Na+ currents (Ampere, A)
Ip – Current flowing through the pipette
Ipeak – Current amplitude taken at the peak of the current taces
Isustained - Current amplitude taken at the end of the voltage command pulse
I-V – Current to voltage relationship
K+ - Potassium
KCl – Potassium chloride
KH2PO4 – Potassium Hydrogen Phosphate
ld – liquid disordered phase
lo – liquid ordered phase
LTD- Long-Term Depression
LTP – Long-Term Potentiation
LVA – Low-threshold Voltage Activated
MeOH - methanol
MgCl2 – Magnesium Chloride
Na+ - Sodium
NaCl – Sodium Chloride
NaHCO3 – Sodium Hydrogen Carbonate
NaOH – Sodium Hydroxide
NP-40 - nonidet P
NPY – Neuropeptide Y
O2 – Oxygen
PA - phosphatidic acid

VI
pA/pF – Current amplitude normalized to cell capacitance
PC – Phosphatidylcholine
PE – Phosphatidylethanolamine
PI – Phosphatidylinositol
PIP – Phosphatidyl Inositol Phosphate
PIPES – 1,4-Piperazinediethanesulfonic acid
PL - Phospholipid
PM – Plasma Membrane
POMC – Pro-Opiomelanocortin
POPC - 1-Palmitoyl-2-oleoyl-sn-glycero-3-phosphocholine
ppIMI – postprandial intermeal interval
PS – Phosphatidylserine
PSM - N-palmitoyl-sphingomyelin
PVDF – Polyvinylidene difluoride (western blotting membrane)
PYY – Peptide YY (gut hormone)
Rf – Feedback resistor (Ohm, Ω)
Rs - Series resistance (Ohm, Ω)
SDS – Sodium Sodecyl Sulphate
SL – Sphingolipid
SM – Sphingomyelin
so – solid ordered
STX – Saxitoxin
TBS – Tris-buffered saline
TEA-Cl - Tetraethylammonium chloride

VII
TLC – Thin-Layer Chromatography
Tm- Phase transition temperature
t-PnA - Trans-parinaric acid
tr – Rise time
TTX – Tetrodotoxin
VC – voltage clamp
Vcommand or Vref – Voltage command
VGSC or Nav – Voltage-Gated Sodium Channel
Vh – Half-maximal activation (or inactivation) potential (mV)
vHPC – Ventral hippocampus
Vm – Step command potential (mV).
Vout – Output voltage
Vp – Pipette voltage
Vs – Slope factor (mV/e-fold)
WC – Whole-cell
WD – Western diets
τh - Time-constant of inactivation (ms)
τhfast - Time-constant of the fast component of inactivation
τhslow – time-constant of the slow component of inactivation

VIII
Abstract
Feeding behaviour and energy balance is regulated by the central nervous system, through
a concerted endeavour of different brain areas. The hippocampus, historically regarded
as a substrate for learning and memory processes, has also been implicated in such energy
regulation. In recent years, researchers have established that hippocampal neurones form
a memory of a meal and act to delay meal initiation during the postprandial period.
However, more experiments are needed to identify the processes involved in such control.
The present thesis starts to fill this gap, by identifying possible neuronal mechanisms by
which the hippocampus processes satiety and meal termination. By assessing the
functioning of ion currents/channels and the lipid composition and organization of the
plasma membrane throughout the feeding cycle, this study furnishes a global perspective
of the effect of post-prandial and fasting conditions upon intrinsic neuronal plasma
membrane (PM) properties.
The involvement of ion channels of rat hippocampal CA1 neurones in a feeding cycle
context has already been studied. Indeed, the feeding cycle was found to impact the
excitability of these neurones by modulating the activity of voltage-gated potassium
currents. This finding has urged further investigation to evaluate the broadness of the
effect of feeding cycle on the activity of other ion channels. Hence, it was critical to
address the involvement of a) voltage-gated sodium (Na+) currents/channels, given their
importance in the initiation and propagation of action potentials, and b) voltage-gated
calcium (Ca2+) currents/channels, as they mediate the influx of this ubiquitous second
messenger, with wide-ranging physiological roles, into the interior of the neurones.
The influence of feeding cycle on the biophysics of Na+ and Ca2+ channels was
undertaken in neurones acutely isolated from the CA1 subfield of the rat hippocampus.
Two classes of neurones were used: those obtained from animals that fasted overnight
(‘fasted neurones’) and those from animals that, after such period, were fed (‘fed
neurones’).
Voltage-gated Na+ currents were recorded by applying electrophysiological voltage
clamp techniques - namely whole-cell (WC) and excised inside-out patches. Fed
neurones, in comparison to fasted neurones, showed increased mean maximum
macroscopic Na+ current density (1.5 ± 0.12mA.cm-2 vs. 1±0.10mA.cm-2) and a greater

IX
single-channel conductance (16.7 ± 0.76pS vs. 12.6 ± 1.30pS). Furthermore, the larger
amplitude of the ‘window current’ obtained in fed neurones, derived from hyperpolarized
activation curves and depolarized steady-state of inactivation curves (h∞), indicates a
greater Na+ channel availability to respond to activation. Such variation is supported by
a higher concentration of Nav1.2 isoform at the plasma membrane-enriched fractions of
hippocampus of fed animals. Overall, the results indicate a variation in the biophysics and
expression of voltage gated Na+ channels of rat hippocampal CA1 neurones, pointing out
that feeding cycle changes the neuronal excitability.
Voltage-gated Ca2+ currents were analysed with whole-cell recordings. It was observed
heterogeneity in whole-cell Ca2+ currents, here sorted into three categories – ‘A’, ‘B’, and
‘C’ currents. The differential distribution of these currents between fed and fasted
neurones determined significant alterations on the inactivation properties of Ca2+
currents. The increased values of the time-constant of inactivation - τh -, observed upon
feeding, can be ascribed to a conspicuous slowly-inactivating current mainly assigned to
fed neurones (current ‘A’), as oppose to the fastest kinetics of inactivation, solely seen in
fasted neurones (current ‘C’). Furthermore, in fed neurones, a depolarizing shift of the
most depolarized component (Vh2) of the voltage-dependence of h∞ was observed, which
indicates that fasted neurones inactivate at more negative membrane potentials.
Altogether, these observations point to a facilitated entry of Ca2+ into the soma of fed
neurones, which, ultimately, potentiates the Ca2+-dependent intracellular events.
The observed influence of feeding cycle on the biophysical and molecular expression of
voltage-gated Na+ and Ca2+ channels did not have repercussions on the lipid environment
of the PM. The plasma membrane-enriched fractions of rat hippocampus were labeled
with molecular probes: 1,6-diphenyl-1,3,5-hexatriene (DPH) and trans-parinaric acid (t-
PnA). By assessing the fluorescence properties of these probes, it was possible to study
the molecular organization and lateral heterogeneity (in the membrane plane) of the lipid
domains. Specifically, two types of fluorescence spectroscopy measurements were used,
either in steady-state (anisotropy measurements) and time-resolved domains
(fluorescence intensity decay). The molecular biophysics analysis indicated that the order
and rigidity of the acyl chains of the phospholipids constituents of the PM is not altered
during the feeding cycle. Furthermore, the proportion of the different lipid domains at the
surface of the neuronal PM is identical between conditions, which clearly indicates that
the lateral heterogeneity of such domains is similar throughout the feeding cycle. This

X
observation must be interpreted at a hydrophobic core level, where the t-Pna and DPH
preferentially locate within the PM.
The lipid content of the plasma membrane of rat hippocampus also did not endure any
variation during the feeding cycle. The ratios calculated for the total lipid, phospholipid
and cholesterol content were identical between the membranes of fed and fasted animals.
The results concerning the molecular biophysics and biochemical characterization of the
lipids imbedded in the neuronal plasma membrane indicate that neurones must have a
shield mechanism to preserve their functional viability, regardless of the peripheral
metabolic state.
In summary, the greater levels of neuronal excitability and the promotion of Ca2+ entry
into the neurones upon feeding may imply a subsequent increase on neuronal synaptic
performance. A positive relationship between feeding and higher levels of synaptic
plasticity-related phenomena (formation and consolidation of memories) is suggested,
which could help to explain the role of hippocampus on the regulation of energy intake,
mainly due to its role on meal-related episodic memories. This work gives new insights
into the function of hippocampus on energy homeostasis, by adding new elements to the
equation, namely, voltage-gated Na+ and Ca2+ channels.
Keywords:
Feeding cycle; CA1 neurones; hippocampus; voltage-gated ion channels; Plasma
membrane

XI
Resumo
A regulação do comportamento alimentar e do balanço energético, isto é, a relação entre
a energia consumida e despendida, por parte do sistema nervoso central tem por base uma
acção concertada de diferentes áreas do cérebro. O hipocampo, classicamente
considerado um substrato para os processos de aprendizagem e memória, tem vindo a ser
implicado em fenómenos de homeostasia energética. O crescente interesse da
comunidade científica em aprofundar o conhecimento acerca dos processos celulares
subjacentes a esta nova função do hipocampo reflecte a importância do tema. Nos últimos
anos, vários investigadores têm estudado a influência dos neurónios do hipocampo na
formação de memórias relacionadas com a ingestão de alimentos. Os resultados apontam
para uma relação directa entre a consciencialização da ingestão de alimentos durante uma
refeição e o prolongamento do subsequente período pós-prandial, retardando o início da
refeição seguinte. No entanto, mais investigação é necessária para identificar os processos
envolvidos neste mecanismo. A presente tese contribui no sentido de começar a preencher
esta lacuna, identificando possíveis mecanismos pelos quais os neurónios do hipocampo
processam a saciedade após uma refeição. Os estudos do funcionamento dos canais
iónicos dependentes da voltagem, e da composição e organização lipídica da membrana
plasmática, fornecem uma perspectiva global do efeito do ciclo alimentar (períodos pós-
prandal/jejum) nas propriedades biofísicas da membrana plasmática dos neurónios.
O envolvimento de canais iónicos num contexto de ciclo alimentar foi previamente
estudado na região CA1 dos neurónios do hipocampo de rato. Na sequência deste estudo,
descobriu-se que o ciclo alimentar tem impacto na excitabilidade dos neurónios, através
da modulação da actividade das correntes de potássio dependentes da voltagem. Surgiu
então a necessidade de avaliar a amplitude do efeito do ciclo alimentar sobre o
funcionamento de outros canais iónicos, nomeadamente canais/correntes de sódio (Na+)
dependentes da voltagem e canais/correntes de cálcio (Ca2+) dependentes da voltagem.
Os primeiros, dada a sua importância no início e propagação dos potenciais de ação, e os
segundos, uma vez que medeiam o fluxo do mensageiro intracelular, Ca2+, com amplas
funções fisiológicas, para o interior dos neurónios.
A influência do ciclo alimentar nas propriedades biofísicas das correntes de Na+ e Ca2+
foi abordada em neurónios isolados da região CA1 do hipocampo de ratos. Duas classes

XII
de neurónios foram utilizadas: os obtidos a partir de animais que jejuaram durante a noite
(‘neurónios em jejum’) e os provenientes de animais que, após esse período, foram
alimentados ('neurónios alimentados").
As correntes de sódio dependentes da voltagem foram medidas com recurso a técnicas de
electrofisiologia de voltagem controlada. Duas configurações foram utilizadas: whole-
cell voltage clamp e inside-out patch. Os neurónios alimentados mostraram,
relativamente aos neurónios em jejum, um aumento na densidade de corrente máxima
(1.5 ± 0.12mA.cm-2 versus 1±0.10 mA.cm-2) e uma maior condutância de cada canal
iónico single channel (16.7 ± 0.76pS vs 12.6 ± 1.30pS). Além disso, a maior amplitude
da window current dos neurónios alimentados, resultante de uma hiperpolarização das
curvas de activação e de uma despolarização das curvas de inactivação em estado
estacionário (h∞), indica uma maior disponibilidade de canais para responder ao processo
de activação. Essa variação é corroborada por uma maior concentração da isoforma
Nav1.2 ao nível da membrana plasmática de hipocampo de animais alimentados.
Genericamente, os resultados indicam uma variação nas propriedades biofísicas e na
expressão molecular das correntes/canais de Na+ da região CA1 dos neurónios do
hipocampo de rato, apontando para a existência de consequências do ciclo alimentar ao
nível da excitabilidade neuronal.
As correntes de Ca2+ dependentes da voltagem foram analisadas através da técnica whole-
cell voltage clamp. Observou-se heterogeneidade ao nível das correntes, aqui
classificadas em três categorias - 'A', 'B' e 'C. A distribuição diferencial destas correntes
entre os neurónios alimentados e em jejum determinou alterações significativas sobre as
respectivas propriedades de inactivação. Os valores mais elevados da constante de tempo
de inativação - τh -, observada em neurónios alimentados, podem ser fundamentalmente
atribuídos à expressão de uma componente de inactivação lenta, principalmente detectada
nos neurónios alimentados (corrente "A"). Por oposição, a ocorrência de uma componente
com uma cinética de inactivação rápida cingiu-se a observações em neurónios em jejum
(corrente 'C'), contribuindo largamente para valores de constante de tempo de inactivação
mais reduzidos. Além disso, as curvas de inactivação em estado estacionário dos
neurónios alimentados apresentam um desvio despolarizante da segunda componente
(Vh2), o que indica que os neurónios em jejum inactivam a potenciais de membrana mais
negativos. Em conjunto, estas observações apontam para uma promoção da entrada de

XIII
Ca2+ no corpo celular dos neurónios alimentados, o que, inevitavelmente, potencia os
eventos bioquímicos intracelulares dependentes de Ca2+.
A influência do ciclo alimentar sobre a expressão molecular e biofísica dos canais de Na+
e Ca2+ não mostraram ter repercussões sobre o ambiente lipídico da membrana
plasmática. As fracções de hipocampo de rato enriquecidas com membrana plasmática
foram marcadas com sondas moleculares: 1,6-difenil-hexatriene-1,3,5 (DPH) e ácido
trans-parinárico (t-Pna). Através da análise das propriedades de fluorescência destas
sondas, foi possível estudar a organização molecular e heterogeneidade lateral (no plano
da membrana) dos domínios lipídicos da membrana plasmática. Especificamente, dois
tipos de medidas de espectroscopia de fluorescência foram utilizados, quer em estado
estacionário (medições de anisotropia), quer resolvidas no tempo (medições de
decaimento de intensidade de fluorescência). A análise da biofísica molecular indicou
que a ordem e a rigidez das cadeias acilo dos fosfolípidos componentes da membrana
plasmática não são alteradas durante o ciclo alimentar. Além disso, a proporção dos
diferentes domínios lipídicos na superfície da membrana plasmática dos neurónios é
idêntica entre as condições pós-prandial e jejum, o que indica claramente que a
heterogeneidade lateral de tais domínios é semelhante durante todo o ciclo alimentar. Esta
observação deve ter em conta a localização das sondas utilizadas no interior das
membranas, isto é, na região hidrofóbica da bicamada lipídica. Portanto, os resultados
aqui apresentados não permitem qualquer tipo de considerações acerca da influência do
ciclo alimentar a um nível mais superficial da membrana.
O teor de lípidos da membrana plasmática do hipocampo de rato também não sofreu
qualquer variação durante o ciclo alimentar. Os índices calculados para os lipídios totais,
teor de colesterol e fosfolípidos foram idênticos entre as membranas de animais
alimentados e animais em jejum.
Os resultados referentes à caracterização bioquímica e biofísica molecular dos lípidos
constituintes da membrana plasmática indicam que os neurónios do hipocampo devem
possuir um mecanismo de protecção para preservarem a sua viabilidade funcional,
independentemente do estado metabólico periférico.
Em conclusão, os maiores níveis de excitabilidade neuronal e a promoção da entrada de
Ca2+ nos neurónios após a ingestão de alimentos pode implicar um melhor desempenho
das sinapses neuronais. É, portanto, sugerida uma relação positiva entre a alimentação e

XIV
níveis mais elevados de plasticidade sináptica (fenómenos relacionados a formação e
consolidação de memórias), o que poderia ajudar a explicar o papel do hipocampo na
regulação do comportamento alimentar, principalmente devido ao seu papel no processo
de formação de memórias das refeições ingeridas. Este trabalho fornece novos dados
acerca sobre a função do hipocampo na homeostase energética, adicionando novos
elementos à equação, no caso, canais de Na+ e Ca2+ dependentes da voltagem.
Os resultados ilustrados nesta tese ganham uma relevância translacional quando inseridos
num contexto de doenças epidémicas relacionadas com distúrbios alimentares, tais como
obesidade e diabetes. Estas condições patológicas são fruto de hábitos alimentares pouco
saudáveis, associados a um estilo de vida sedentário. Numa sociedade altamente
susceptível a desenvolver este tipo de doenças impõe-se o a identificação e estudo de
determinantes moleculares que possam ajudar a inverter esta tendência.
Palavras-chave:
Comportamento alimentar; neurónios da região CA1; hipocampo; canais iónicos
dependentes da voltagem; membrana plasmática

General Introduction
1 PhD thesis - Bastos, AEP (2018)
1 General Introduction
1.1 Brain and energy homeostasis: crosstalk brain vs. peripheral organs (brain-gut axis)
The act of eating is an everyday part of the human experience and represents an obvious
component of energy homeostasis, whose modulation and balance are ensured by energy
intake and energy expenditure. The tight regulation of these processes is of the utmost
importance given that it enables us to keep body weight stable over the adult life,
preventing diseases like obesity and diabetes that are becoming epidemic with
contemporary life habits.
The brain acts as the main orchestrator of this homeostatic process, as the constant
bidirectional communication between the brain and peripheral organs, such as the
gastrointestinal (GI) tract and other relevant tissues (i.e., adipose tissue, pancreas, and
liver), ensures that the brain constantly perceives and responds accordingly to the energy
status/needs of the body (Faulconbridge & Hayes, 2011; Rui, 2013).
The involvement of the brain as key player in the homeostatic regulation of feeding
behavior was initially established by a series of degeneration studies performed in
different regions of the hypothalamus. The destruction of the ventromedial hypothalamic
nuclei (known as ‘satiety’ centres) induces hyperphagia, resulting in obesity, decreased
activity, and neuroendocrine abnormalities (Hetherington & Ranson, 1940, 1942;
Brobeck, 1946; Anand & Brobeck, 1951), whereas lesions in the lateral hypothalamus
(known as ‘feeding’ centres) reduce food intake and eventually lead to starvation and
death (Anand & Brobeck, 1951).
These studies established the anatomical basis for modern research of energy regulation
and set the start of an era in which the hypothalamus has been regarded as the headquarters
of the central nervous system homeostatic mechanism of feeding behaviour. Indeed, the
discovery of a complex intrahypothalamic neuronal network and the interplay with
peripheral organs endows the hypothalamus the energy balance regulation (Williams et
al., 2000; Leibowitz & Wortley, 2004; Stanley et al., 2005; Morton et al., 2006; Lutter &
Nestler, 2009; Pang & Han, 2012; Coll & Yeo, 2013; Dietrich & Horvath, 2013).
The action of neuropeptides together with circulating hormones and nutrients upon
different subsets of hypothalamic neurones contributes to the process of energy

General Introduction
2 PhD thesis - Bastos, AEP (2018)
homeostasis (see Figure 1.1). Briefly, the entry of nutrients in the small intestine
stimulates the release of peptides (e.g., cholecystokinin (CCK)) which act as negative
feedback signals (“satiety” signals) to reduce meal size and terminate feeding. The
effectiveness of these signals is thought to be modulated by circulating adiposity
hormones (e.g., leptin and insulin), which relay information about long-term peripheral
energy levels to the brain. Thus, in a post-prandial/absorptive state, leptin suppresses food
intake and stimulates metabolic processes to dissipate excessive energy stores (Williams
et al., 2000, 2001, 2004; Leibowitz & Wortley, 2004; Stanley et al., 2005). In addition,
ghrelin has been identified as a gastric peptide that functions as a physiological meal
initiation or “hunger” cue. Hence, during fasting, in response to negative energy balance,
ghrelin stimulates food intake and, subsequently, promotes energy storage (Berthoud,
2002; Stanley et al., 2005; Lutter & Nestler, 2009).
Figure 1.1- Hypothalamic control of food intake. The role of hormones and neuropeptides during
feeding and fasting periods. During and after regular feeding, there is a reduction in the production
of ghrelin by the stomach. In contrast, production of Peptide YY (PYY), Glucagon Like Peptide-
1(GLP-1) and CCK from the gut is increased, and serum leptin levels also rise. These changes are
detected by the hypothalamus, resulting in modulation of gene expression of orexigenic (Agouti-
related protein (AGRP) and neuropeptide Y (NPY)) and anorexigenic (pro-opiomelanocortin
(POMC)) proteins, which result in decreased appetite and a feeling of satiety such that caloric intake
is stopped. During fasting, decreased food intake suppresses the release of PYY, GLP-1 and CCK
from the gut while stimulating the secretion of ghrelin by the stomach. Fasting also decreases serum
leptin levels. These changes are detected by the hypothalamus, resulting in upregulation of orexigenic
and downregulation of anorexigenic gene expression within the hypothalamus, leading to hunger.
Taken from (Larder & O’Rahilly, 2012).

General Introduction
3 PhD thesis - Bastos, AEP (2018)
Currently, it is established that extrahypothalamic central nervous system structures may
play a previously unappreciated role in the control of ingestive behaviour, highlighting
the broad reach of the hypothalamus in regulating energy balance. The hypothalamic
‘center’ hypothesis has dominated research on food intake during much of the last half
century. However, with the advent of neuronal tracing, it became clear that the
hypothalamus is well connected to most other areas of the brain and does not work in
isolation (Berthoud, 2003). In addition, increasing evidence has shown that mammalian
organisms rely on a much broader diversity and distribution of neuronal network, to
regulate both energy intake and expenditure (Shin et al., 2009; Grill & Hayes, 2012;
Waterson & Horvath, 2015). Hence, it has become clear that the responsibility for
controlling energy homeostasis is shared between several brain regions, spanning the
range of ‘higher’ and ‘lower’ centres (from cortex to brainstem). Among them, the
hippocampus, a forebrain structure historically conceived as an important substrate for
memory storage and retrieval, has gained relevance as a hub of energy balance. A search
in the literature reveals that hippocampus is neuroanatomically linked to hypothalamic
nuclei and other brain circuits thought to underlie energy regulation (Atasoy et al., 2012;
Kanoski, 2012; Zeltser et al., 2012; Davidson et al., 2013; Sweeney & Yang, 2015, 2017;
Berthoud et al., 2017; Kanoski & Grill, 2017). Furthermore, hippocampal neurones
integrate previous learned experience (episodic memories) with the external sensory
context (visuospatial, olfactory, gustatory cues) and the internal context (interoceptive
energy status cues – hunger, satiety, thirst) to influence decisions about when, where,
what, and how much to eat (Davidson & Jarrard, 1993; Tracy et al., 2001; Higgs, 2008;
Davidson et al., 2013; Parent et al., 2014; Higgs, 2015).
1.2 Hippocampus and energy balance
The first glimpse of hippocampus as a possible regulator of food intake occurred in the
early 1950s when neurosurgeons removed the hippocampus and other parts of the medial
temporal region on both sides of the brain of an epileptic patient, known as H.M. (Henry
Molaison) (Scoville & Milner, 1957). This experimental operation constitutes one of the
most extensively studied human cases of the effects of hippocampal lesions. Accordingly,
although the procedure brought H.M.’s seizures under control, it also produced a near
complete loss of his ability to form new memories (Scoville & Milner, 1957). This was a
major breakthrough in neuroscience as it helped to acknowledge the importance of the

General Introduction
4 PhD thesis - Bastos, AEP (2018)
hippocampus in brain activity, namely its role in memory and learning processes.
Surprisingly, in addition to this memory impairment, it was noted by researchers (Hebben
et al., 1985) that H.M. rarely made any references to interoceptive states, such as hunger
and thirst. This was the first time that hippocampus was thought to be interrelated with
appetite. Since then, several reports were undertaken in patients with clinical cases
disclosing hippocampal-dependent episodic memory deficits, like those of patient H.M.
Likewise, they had difficulties determining whether they were sated, did not remember
eating, and ate an additional meal when presented with food, even if they have just eaten
to satiety (Hebben et al., 1985; Higgs et al., 2008; Francis & Stevenson, 2011; Parent et
al., 2014).
The cognitive regulation of food intake has gained momentum with the patient H.M.
During the past 25 years, the scientific community has deepened the knowledge of the
involvement of hippocampus in energy balance. In this context, one has to consider a
number of evidence pinpointing the hippocampus as a structure responsible for energy
regulation: a) throughout the hippocampus there is a multitude of receptors for
preprandial and postprandial signals, such as leptin, insulin, ghrelin, glucose,
cholecystokinin and feeding neuropeptides (Lathe, 2001; Beck & Pourié, 2013; Hsu et
al., 2015; Kanoski & Grill, 2017); b) It is known that hippocampal leptin negatively
regulates feeding behaviour, ghrelin increases appetite (Volkow et al., 2011; Beck &
Pourié, 2013; Higgs, 2015; Kanoski & Grill, 2017), and both exert a direct action on
hippocampal plasticity, contributing to learning and memory consolidation (Diano et al.,
2006; Beck & Pourié, 2013; Parent et al., 2014); c) Accordingly, rats with selective
lesions of the hippocampus exhibit reduced ability to use energy state cues (stomach
distention, changes in circulating nutrient and hormone concentrations, etc.) as inhibitory
signals (Davidson & Jarrard, 1993; Davidson et al., 2005), resulting in increased
appetitive response for food and weight gain (Davidson & Jarrard, 1993; Schmelzeis &
Mittleman, 1996; Clifton et al., 1998); d) hippocampal neurones are anatomically poised
to monitor energy status and influence energy intake, as hippocampus integrates a
neuronal circuitry that involves several regions of the brain (e.g., hypothalamus)
responsible for ingestive and appetitive behaviours. For example, the ventral
hippocampus (vHPC), a medial temporal lobe structure with a prominent role in cognitive
and emotional behaviours (Moser & Moser, 1998; Fanselow & Dong, 2010), is directly
linked to hypothalamus (Cenquizca & Swanson, 2006); e) Human and rodent imaging
studies show that the hippocampus is activated following food consumption (DelParigi et

General Introduction
5 PhD thesis - Bastos, AEP (2018)
al., 2004, 2005) and by experimental manipulations that mimic aspects of nutrient intake,
including gastric distention and gastric electrical stimulation of the vagus nerve, the
primary sensory channel of information communicated from the gastrointestinal tract to
the brain (Wang et al., 2006; Min et al., 2011; Kanoski, 2012); f) hippocampal neurones
may inhibit meal onset by extending the postprandial intermeal interval (ppIMI)
(Henderson et al., 2013; Parent et al., 2014; Parent, 2016a; Hannapel et al., 2017). This
hypothesis is supported by the finding that increasing memory encoding during eating
(brought by attention and awareness on eating) has a bigger effect on intake at the next
eating episode than on current food intake (Higgs, 2002, 2008, 2015), and by the finding
that episodic memory of the size of a previous meal, rather than the actual amount
ingested, predicts hunger hours after the end of a meal (Parent, 2016b).
As a whole, these observations account for an influence of hippocampus in the adaptation
of feeding behaviour to external (food-related stimuli) and internal (interoceptive signals)
cues. Hence, in addition to its role in learning and memory, the hippocampus also
performs multiple functions involved with the regulatory control of food intake. In this
context, memory serves as a powerful mechanism for influencing eating behavior. In
support of this idea, there is evidence that overweight and obesity are associated with
learning and memory problems (Kanoski, 2012; Coppin et al., 2014; Higgs, 2015;
Prickett et al., 2015). Concomitantly, understanding how cognitive processes, such as
memory, control intake is vital important in nowadays society because it will provide a
more complete explanation of how the brain controls eating and will likely provide
insights regarding the brain mechanisms that contribute to eating disorders and diet-
induced obesity.
In summary, the act of eating is directly influenced by the brain. The hippocampus is now
viewed as a major player in this context. The opposite, i.e., the influence of feeding on
hippocampal activity is equally important, as it is known that the hippocampal-dependent
modulatory control of feeding behavior is compromised by consumption of foods
common to ‘Western diets’ (WD), including saturated fats and simple carbohydrates.
Accordingly, the effects of nutrition upon hippocampal function is an emerging research
area in the field of food-related diseases that affect several million people around the
world (World Health Organization, 2018). Malfunctioning of hippocampus is linked to
devastating consequences in energy intake, which, ultimately, contributes to
complications in body weight regulation (Kanoski et al., 2010; Kanoski & Davidson,
2011; Jacka et al., 2015).

General Introduction
6 PhD thesis - Bastos, AEP (2018)
Hence, due to its fundamental importance, a historical perspective of the hippocampus,
along with a description of the hippocampal circuitry and a characterization of the
pyramidal neurones, can be found at the end of this thesis (Annex I).
1.3 Effect of nutrition on cognition
Diet, exercise and other aspects of our daily interaction with the environment have the
potential to alter our brain health and mental function. Brain networks that are associated
with the control of feeding are intimately associated with those that are involved in
processing emotions, reward and cognition. In this respect, given its exquisite plasticity
in response to multiple lifestyle factors or events, the hippocampus is a pivotal target to
show effects of nutritional intervention (Monti et al., 2014).
Several dietary components have been identified as having effects on cognitive abilities.
Dietary factors can affect multiple brain processes by regulating neurotransmitter
pathways, synaptic transmission, membrane fluidity and signal-transduction pathways
(Gómez-pinilla, 2008). For example, Omega‑3 polyunsaturated fatty acids, seminal
constituents of cell membranes and essential for normal brain function, are involved in
improvement and maintenance of mental health. A deficiency of omega‑3 fatty acids
results in impaired learning and memory (Gómez-pinilla, 2008; Stangl & Thuret, 2009;
Francis & Stevenson, 2011; Kanoski & Davidson, 2011; Martin & Davidson, 2014; Monti
et al., 2014), and in humans has been associated with increased risk of several mental
disorders, including attention-deficit disorder, dyslexia, dementia, depression, bipolar
disorder and schizophrenia (Freeman et al., 2006; Gómez-pinilla, 2008; Matsuoka et al.,
2017). On the other hand, dietary supplementation of omega-3 fatty acids has been found
to elevate levels of hippocampal brain-derived neurotrophic factor (BDNF) (Wu et al.,
2004; Stangl & Thuret, 2009; Peters, 2011; Yeomans, 2017), a protein that serves to
promote neurogenesis, synaptic transmission and memory performance.
In contrast to the health-promoting effects of diets rich in omega‑3 fatty acids,
epidemiological studies indicate that diets with high contents of saturated fats – ‘western
diet’ (WD) - adversely affect cognition. This type of diet, common in societies with high
obesity rates, is associated with the so-called “junk food” and its consumption can induce
cognitive deficits and perturb hippocampal function (Kanoski et al., 2010). The extended
maintenance on a WD leads to neuroinflammation (Kanoski & Davidson, 2011; Hargrave

General Introduction
7 PhD thesis - Bastos, AEP (2018)
et al., 2016), reduced hippocampal and hypothalamic levels of BDNF, and smaller
hippocampal volume (Jacka et al., 2015). Overall, the pernicious effects of WD upon
brain lead, directly or indirectly, to a hippocampal malfunction, which contributes to the
commence or development of a vicious circle of hippocampal dysfunction and impaired
inhibitory cognitive control of responding to environmental food cues, resulting in excess
intake, obesity, and further hippocampal dysfunction (Figure 1.2) (Hargrave et al., 2016;
Berthoud et al., 2017).
The caloric intake, per se, also exerts a vital influence on cognition. Excess calories can
increase the vulnerability of cells to damage (Mattson, 2005a) by causing free-radical
formation, that decreases BDNF-mediated synaptic plasticity and cognitive function (Wu
et al., 2004). Moderate caloric restriction could thus protect the brain by reducing
oxidative damage to cellular proteins, lipids and nucleic acids (Mattson, 2008). The
number of calories seems to be a crucial factor for the physiological effects on human
mental health, such that there are several nutritional studies that point a variety of low-
calorie diets (e.g., fasting diets) as therapeutic applications to treat several neurological
disorders, like Alzheimer´s disease and epilepsy (Mattson, 2005a; Bough & Rho, 2007;
McNally & Hartman, 2012; Fond et al., 2013; Longo & Mattson, 2014). Consequently,
Figure 1.2- Vicious circle of overeating and hippocampal-based memory declined, induced by
WD. Taken from (Hargrave et al., 2016)

General Introduction
8 PhD thesis - Bastos, AEP (2018)
the excessive food intake in wealthy nations seems to be almost as harmful as the lack of
it in poor countries. It is intriguing that several countries with limited resources, such as
India, have a reduced prevalence of neurological disorders that have been associated with
diet, such as Alzheimer’s disease (Gómez-pinilla, 2008).
The challenge now is to ameliorate our knowledge of the molecular mechanisms by which
peripheral signals can modulate mental processes. Specifically, understanding the
molecular basis of the effects of feeding on hippocampal neurones will help us to
determine its consequence on cognition and subsequently on appetite.
1.4 Feeding cycle on hippocampal neurones - excitability and plasma membrane lipid composition and organization
Changes in metabolism – variations in glycogen content, as well as in levels of glycerol,
free fatty acids and acetoacetate - will affect internal cellular biochemistry and one should
therefore expect differences in the effects of preparations on isolated cells, tissues or
organs removed from animals that have, or have not, been fasted (Smith, 2009). By all
accounts, feeding cycle – postprandial and fasting periods - is characterized by tidal
variations of biochemical processes, either in peripheral organs and in the brain, mainly
due to glucose repletion or scarcity. For instance, the effect of fasting on brain metabolism
and function is well described, namely its role in treating and preventing disease: the
increased levels of glycerol and free fatty acids account for improvements in mood and
cognition (Cunnane et al., 2002; Fond et al., 2013; Bazinet & Layé, 2014) and higher
concentration of ketone bodies are thought to be involved in neuroprotection, as in
mitigating the frequency of epilepsy seizures (Likhodii et al., 2003; Bough & Rho, 2007;
McNally & Hartman, 2012; Rho, 2017). In the hippocampus, fasting positively affects
the production of BDNF, which itself promotes neurogenesis and consolidation of
memory (Longo & Mattson, 2014).
To date, the extent of the effect of feeding cycle at a neuronal level is barely understood,
especially in the hippocampus. A thorough literature search within this scope led to a
study undertaken in rat dorsal hippocampal CA1 neurones, indicating that Arc expression,
a marker of synaptic plasticity necessary for memory consolidation, was significantly
higher in animals that consumed sucrose, than in control rats that had been given

General Introduction
9 PhD thesis - Bastos, AEP (2018)
comparable handling and transportation (Henderson et al., 2016). This result suggests that
consuming a meal should change the induction of synaptic plasticity in the dorsal
hippocampal neurones responsible for the memory formation of a meal.
Synaptic plasticity is linked to intrinsic neuronal excitability, whose regulation is
mediated by molecules present at the plasma membrane of neurones – the voltage-gated
ion channels. For example, certain potassium (K+) channels can change the induction
thresholds and maintenance of Long-Term Potentiation (LTP) phenomena (Narasimhan,
2005; Kim & Hoffman, 2008). Thus, it is reasonable to expect that feeding may influence
the behavior of the ion channels present at the surface of hippocampal CA1 neurones.
Accordingly, there is a study showing that feeding cycle influences excitability in rat
hippocampal CA1 neurones, by an indirect modulation of K+ currents (Lima et al., 2008).
The effect of insulin on these ion channels is only detectable in fed animals, contrasting
with the lack of response in fasted ones (Lima et al., 2012). This clearly suggests a marked
impact of feeding cycle periods over the activity of central nervous system neurones,
particularly in protein ion channels involved in excitability (Figure 1.3).
The excitability of the neurones also relies on the composition and organization of the
lipid domains present in the plasma membrane. The ion channels, embedded in the
phospholipid bilayer (Figure 1.4A), are mainly located in lipid microdomains known as
‘lipid rafts’, essentially constituted by cholesterol and sphingolipids. These lipid species
Figure 1.3 - Influence of feeding upon excitability of rat hippocampal CA1 neurones by mediating
the effect of insulin over K+ currents. Adapted from (Lima et al., 2012).

General Introduction
10 PhD thesis - Bastos, AEP (2018)
exert effects on channel activity either through direct protein–lipid interactions or by
influencing the physical properties of the bilayer (Dart, 2010; Levitan et al., 2010).
Indeed, the regulation of the ion channels by the host bilayer lipid composition has been
a subject of intense research. Currently, it is widely accepted that the ion channel function
is most likely regulated by the bilayer elasticity, since the transition between the closed
and the open states of an ion channel are accompanied by a deformation of the lipid
bilayer in the vicinity of the membrane (Figure 1.4B) (Lundbæk et al., 1996, 2004;
Andersen & Koeppe, 2007; Lundbaek et al., 2010).
The effects of peripheral metabolism and physiological feeding cycles upon the
membrane-lipid dynamics are poorly understood, though. There is evidence that point to
an influence of diet on the rigidity and organization of cellular membranes: dietary lipids,
as cholesterol and Ω-3 polyunsaturated fatty acids, mediate variations on membrane
fluidity, mainly by their effects over the lipid rafts (Mattson, 2005; Gómez-pinilla, 2008;
Yaqoob, 2009).
Understanding the involvement of ion channels and membrane lipids composition and
organization within the impact of feeding over the neuronal plasma membrane of
hippocampus will 1) disclose new molecular clues into the involvement of hippocampus
in the regulation of food intake and 2) leverage the state-of-the-art currently available
A B
Figure 1.4- Interactions between ion channels and lipid composition of the plasma membrane. A)
Functioning of a voltage-gated potassium channel within the lipid bilayer, showing the transition
between open and closed states. Taken from (Lee, 2006). B) The hydrophobic coupling between an ion
channel and the surrounding bilayer means that a protein conformational change will be associated
with a deformation of the surrounding bilayer. Adapted from (Lundbæk et al., 2004).
General Introduction
11 PhD thesis - Bastos, AEP (2018)
regarding the treatment and prevention of the food-related neurological diseases with
marked impact on cognition. The present dissertation aims to contribute to this matter.

General Introduction
12 PhD thesis - Bastos, AEP (2018)
1.5 References
Anand BK & Brobeck JR (1951). Localization of a “Feeding Center” in the
Hypothalamus of the Rat. Proc Soc Exp Biol Med 77, 323–324.
Andersen OS & Koeppe RE (2007). Bilayer Thickness and Membrane Protein Function:
An Energetic Perspective. Annu Rev Biophys Biomol Struct 36, 107–130.
Bazinet RP & Layé S (2014). Polyunsaturated fatty acids and their metabolites in brain
function and disease. Nat Rev Neurosci 15, 771–785.
Beck B & Pourié G (2013). Ghrelin, neuropeptide Y, and other feeding-regulatory
peptides active in the Hippocampus: Role in learning and memory. Nutr Rev 71,
541–561.
Berthoud H-R (2002). Multiple neural systems controlling food intake and body weight.
Neurosci Biobehav Rev 26, 393–428.
Berthoud HR (2003). Neural systems controlling food intake and energy balance in the
modern world. Curr Opin Clin Nutr Metab Care 6, 615–620.
Berthoud HR, Münzberg H & Morrison CD (2017). Blaming the Brain for Obesity:
Integration of Hedonic and Homeostatic Mechanisms. Gastroenterology 152, 1728–
1738.
Bough KJ & Rho JM (2007). Anticonvulsant mechanisms of the ketogenic diet. Epilepsia
48, 43–58.
Brobeck JR (1946). Mechanism of the development of obesity in animals with
hypothalamic lesions. Physiol Rev 26, 541–559.
Cenquizca LA & Swanson LW (2006). Analysis of Direct Hippocampal Cortical Field
CA1 Axonal Projections to Diencephalon in the Rat. J Comp Neurol 497, 101–114.
Clifton PG, Vickers SP & Somerville EM (1998). Little and often: Ingestive behavior
patterns following hippocampal lesions in rats. Behav Neurosci 112, 502–511.
Coll AP & Yeo GSH (2013). The hypothalamus and metabolism: Integrating signals to
control energy and glucose homeostasis. Curr Opin Pharmacol 13, 970–976.
Coppin G, Nolan-Poupart S, Jones-Gotman M & Small DM (2014). Working memory

General Introduction
13 PhD thesis - Bastos, AEP (2018)
and reward association learning impairments in obesity. Neuropsychologia 65, 146–
155.
Cunnane SC, Musa K, Ryan M a, Whiting S & Fraser DD (2002). Potential role of
polyunsaturates in seizure protection achieved with the ketogenic diet.
Prostaglandins Leukot Essent Fatty Acids 67, 131–135.
Dart C (2010). Lipid microdomains and the regulation of ion channel function. J Physiol
588, 3169–3178.
Davidson T, Kanoski S, Walls E & Jarrard L (2005). Memory inhibition and energy
regulation. Physiol Behav 86, 731–746.
Davidson TL & Jarrard LE (1993). A role for hippocampus in the utilization of hunger
signals. Behav Neural Biol 59, 167–171.
Davidson TL, Kanoski SE, Schier LA, Clegg DJ & Benoit SC (2007). A Potential Role
for the Hippocampus in Energy Intake and Body Weight Regulation. Curr Opin
Pharmacol 7, 613–616.
DelParigi A, Chen K, Salbe AD, Hill JO, Wing RR, Reiman EM & Tataranni PA (2004).
Persistence of abnormal neural responses to a meal in postobese individuals. Int J
Obes 28, 370–377.
DelParigi A, Chen K, Salbe AD, Reiman EM & Tataranni PA (2005). Sensory experience
of food and obesity: A positron emission tomography study of the brain regions
affected by tasting a liquid meal after a prolonged fast. Neuroimage 24, 436–443.
Fanselow M & Dong H-W (2010). Are the Dorsal and Ventral Hippocampus functionally
distinct structures. Neuron 65, 1–25.
Faulconbridge LF & Hayes MR (2011). Regulation of energy balance and body weight
by the brain: A distributed system prone to disruption. Psychiatr Clin North Am 34,
733–745.
Fond G, Macgregor A, Leboyer M & Michalsen A (2013). Fasting in mood disorders:
Neurobiology and effectiveness. A review of the literature. Psychiatry Res 209, 253–
258.
Francis HM & Stevenson RJ (2011). Higher reported saturated fat and refined sugar

General Introduction
14 PhD thesis - Bastos, AEP (2018)
intake is associated with reduced hippocampal-dependent memory and sensitivity to
interoceptive signals. Behav Neurosci 125, 943–955.
Freeman MP, Davis JM, Keck PE, Mischoulon D, Hibbeln JR, Wisner KL, Richardson
AJ, Peet M & Marangell LB (2006). Omega-3 fatty acids: evidence basis for
treatment and future research in psychiatry. J Clin Psychiatry 67, 1954–1967.
Gómez-pinilla F (2008). Brain foods: the effects of nutrients on brain function. Nat Rev
Neurosci.
Grill HJ & Hayes MR (2012). Hindbrain neurones as an essential hub in the
neuroanatomically distributed control of energy balance. Cell Metab 16, 296–309.
Hannapel RC, Henderson YH, Nalloor R, Vazdarjanova A & Parent MB (2017). Ventral
hippocampal neurones inhibit postprandial energy intake. Hippocampus 27, 274–
284.
Hargrave SL, Jones S & Davidson TL (2016). The Outward Spiral: A vicious cycle model
of obesity and cognitive dysfunction. Curr Opin Behav Sci 9, 40–46.
Hebben N, Corkin S, Eichenbaum H & Shedlack K (1985). Diminished ability to interpret
and report internal states after bilateral medial temporal resection: case H.M. Behav
Neurosci 99, 1031–1039.
Henderson YO, Nalloor R, Vazdarjanova A & Parent MB (2016). Sweet orosensation
induces Arc expression in dorsal hippocampal CA1 neurones in an Experience-
dependent manner. Hippocampus 26, 405–413.
Henderson YO, Smith GP & Parent MB (2013). Hippocampal neurones inhibit meal
onset. Hippocampus 23, 100–107.
Hetherington AW & Ranson SW (1940). Hypothalamic lesions and adiposity in the rat.
Anat Rec 78, 149–172.
Hetherington AW & Ranson SW (1942). The relation of various hypothalamic lesions to
adiposity in the rat. J Comp Neurol 76, 475–499.
Higgs S (2002). Memory for recent eating and its influence on subsequent food intake.
Appetite 39, 159–166.
Higgs S (2008). Cognitive influences on food intake: The effects of manipulating memory

General Introduction
15 PhD thesis - Bastos, AEP (2018)
for recent eating. Physiol Behav 94, 734–739.
Higgs S (2015). Cognitive processing of food rewards. Appetite 104, 10–17.
Higgs S, Williamson AC, Rotshtein P & Humphreys GW (2008). Sensory-Specific
Satiety Is Intact in Amnesics Who Eat Multiple Meals. Psychol Sci 19, 623–628.
Hsu TM, Hahn JD, Konanur VR, Noble EE, Suarez AN, Thai J, Nakamoto EM & Kanoski
SE (2015). Hippocampus ghrelin signaling mediates appetite through lateral
hypothalamic orexin pathways. Elife 4, 1–20.
Jacka FN, Cherbuin N, Anstey KJ, Sachdev P & Butterworth P (2015). Western diet is
associated with a smaller hippocampus: a longitudinal investigation. BMC Med 13,
215.
Kanoski SE (2012). Cognitive and neuronal systems underlying obesity. Physiol Behav
106, 337–344.
Kanoski SE & Davidson TL (2011). Western Diet Consumption and Cognitive
Impairment: Links to Hippocampal Dysfunction and Obesity. Physiol Behav 103,
59–68.
Kanoski SE & Grill HJ (2017). Hippocampus Contributions to Food Intake Control:
Mnemonic, Neuroanatomical, and Endocrine Mechanisms. Biol Psychiatry 81, 748–
756.
Kanoski SE, Zhang Y, Zheng W & Davidson TL (2010). The Effects of a High-Energy
Diet on Hippocampal Function and Blood-Brain Barrier Integrity in the Rat. J
Alzheimer´s Dis 21, 207–219.
Kim J & Hoffman DA (2008). Potassium Channels: Newly Found Players in Synaptic
Plasticity. Neuroscientist 14, 276–286.
Larder R & O’Rahilly S (2012). Shedding pounds after going under the knife: Guts over
glory—why diets fail. Nat Med 18, 666–667.
Lathe R (2001). Hormones and the hippocampus. J Endocrinol 169, 205–231.
Lee AG (2006). Ion channels: A paddle in oil. Nature 444, 697.
Leibowitz SF & Wortley KE (2004). Hypothalamic control of energy balance: Different
peptides, different functions.

General Introduction
16 PhD thesis - Bastos, AEP (2018)
Levitan I, Fang Y, Rosenhouse-Dantsker A & Romanenko V (2010). Cholesterol and Ion
Channels. Subcell Biochem 51, 509–549.
Likhodii SS, Serbanescu I, Cortez MA, Murphy P, Snead OC & Burnham WM (2003).
Anticonvulsant properties of acetone, a brain ketone elevated by the ketogenic diet.
Ann Neurol 54, 219–226.
Lima PA, Costa PC, Mondragão M, Alves FM, Costa G, Hardy D, Jalil A, Ogden D &
Auger. C (2012). Metabolic states induced by feeding/fasting influence insulin-
induced excitability and levels of insulin receptor in hippocampal but not cerebellar
neurones. In 8 th FENS Forum of Neuroscience.
Lima PA, Vicente MI, Alves FM, Dionísio JC & Costa PF (2008). Insulin increases
excitability via a dose-dependent dual inhibition of voltage-activated K+ currents in
differentiated N1E-115 neuroblastoma cells. Eur J Neurosci 27, 2019–2032.
Longo VD & Mattson MP (2014). Fasting: Molecular Mechanisms and Clinical
Applications. Cell Metab 19, 181–192.
Lundbæk JA, Birn P, Girshman J, Hansen AJ & Andersen OS (1996). Membrane stiffness
and channel function. Biochemistry 35, 3825–3830.
Lundbæk JA, Birn P, Hansen AJ, Søgaard R, Nielsen C, Girshman J, Bruno MJ, Tape
SE, Egebjerg J, Greathouse D V., Mattice GL, Koeppe RE & Andersen OS (2004).
Regulation of Sodium Channel Function by Bilayer Elasticity. J Gen Physiol 123,
599–621.
Lundbaek JA, Collingwood SA, Ingolfsson HI, Kapoor R & Andersen OS (2010). Lipid
bilayer regulation of membrane protein function: gramicidin channels as molecular
force probes. J R Soc Interface 7, 373–395.
Lutter M & Nestler EJ (2009). Homeostatic and Hedonic Signals Interact in the
Regulation of Food Intake. J Nutr 139, 629–632.
Martin AA & Davidson TL (2014). Human cognitive function and the obesogenic
environment. Physiol Behav 136, 185–193.
Matsuoka YJ, Sawada N, Mimura M, Shikimoto R, Nozaki S, Hamazaki K, Uchitomi Y
& Tsugane S (2017). Dietary fish, n-3 polyunsaturated fatty acid consumption, and
depression risk in Japan: a population-based prospective cohort study. Transl

General Introduction
17 PhD thesis - Bastos, AEP (2018)
Psychiatry 7, e1242.
Mattson MP (2005a). ENERGY INTAKE, MEAL FREQUENCY, AND HEALTH: A
Neurobiological Perspective. Annu Rev Nutr 25, 237–260.
Mattson MP (2005b). Dietary Modulation of Lipid Rafts. Implications for Disease
Prevention and Treatment. In Membrane Microdomain Signaling. Lipid Rafts in
Biology and Medicine, ed. Mattson MP, pp. 191–201. Humana Press.
Mattson MP (2008). Dietary factors, hormesis and health. Ageing Res Rev 7, 43–48.
McNally MA & Hartman AL (2012). Ketone Bodies in Epilepsy. J Neurochem 121, 28–
35.
Min DK, Tuor UI & Chelikani PK (2011). Gastric distention induced functional magnetic
resonance signal changes in the rodent brain. Neuroscience 179, 151–158.
Monti JM, Baym CL & Cohen NJ (2014). Identifying and characterizing the effects of
nutrition on hippocampal memory. Adv Nutr 5, 337S–43S.
Moser MB & Moser EI (1998). Functional differentiation in the hippocampus.
Hippocampus 8, 608–619.
Narasimhan K (2005). SK channels: a new twist to synaptic plasticity. Nat Neurosci 8,
550–550.
Parent MB (2016a). Dorsal Hippocampal–Dependent Episodic Memory Inhibits Eating.
Curr Dir Psychol Sci 25, 461–466.
Parent MB (2016b). Cognitive control of meal onset and meal size: Role of dorsal
hippocampal-dependent episodic memory. Physiol Behav 162, 112–119.
Parent MB, Darling JN & Henderson YO (2014). Remembering to eat: hippocampal
regulation of meal onset. Am J Physiol Regul Integr Comp Physiol 306, R701–R713.
Prickett C, Brennan L & Stolwyk R (2015). Examining the relationship between obesity
and cognitive function: A systematic literature review. Obes Res Clin Pract 9, 93–
113.
Rho JM (2017). How does the ketogenic diet induce anti-seizure effects? Neurosci Lett
637, 4–10.

General Introduction
18 PhD thesis - Bastos, AEP (2018)
Rui L (2013). Brain regulation of energy balance and body weight. Rev Endocr Metab
Disord 14, 387–407
Schmelzeis MC & Mittleman G (1996). The hippocampus and reward: effects of
hippocampal lesions on progressive-ratio responding. Behav Neurosci 110, 1049–
1066.
Scoville WB & Milner B (1957). Loss of Recent Memory After Bilateral Hippocampal
Lesions. J Neurol Neurosurg Psychiatry 20, 11–21.
Shin AC, Zheng H & Berthoud H-R (2009). An expanded view of energy homeostasis:
Neural integration of metabolic, cognitive, and emotional drives to eat. Physiol
Behav 97, 572–580.
Smith A (2009). Fasting in rodents.
Stangl D & Thuret S (2009). Impact of diet on adult hippocampal neurogenesis. Genes
Nutr 4, 271–282.
Stanley S, Wynne K, McGowan B & Bloom S (2005). Hormonal Regulation of Food
Intake. Physiol Rev 85, 1131–1158.
Sweeney P & Yang Y (2015). An excitatory ventral hippocampus to lateral septum circuit
that suppresses feeding. Nat Commun 6, 10188.
Sweeney P & Yang Y (2017). Neural Circuit Mechanisms Underlying Emotional
Regulation of Homeostatic Feeding. Trends Endocrinol Metab 28, 437–448.
Tracy AL, Jarrard LE & Davidson TL (2001). The hippocampus and motivation revisited:
Appetite and activity. Behav Brain Res 127, 13–23.
Volkow ND, Wang GJ & Baler RD (2011). Reward, dopamine and the control of food
intake: implications for Obesity. Trends Cogn Sci 15, 37–46.
Wang G-J, Yang J, Volkow ND, Telang F, Ma Y, Zhu W, Wong CT, Tomasi D, Thanos
PK & Fowler JS (2006). Gastric stimulation in obese subjects activates the
hippocampus and other regions involved in brain reward circuitry. Proc Natl Acad
Sci 103, 15641–15645.
Waterson MJ & Horvath TL (2015). Neuronal Regulation of Energy Homeostasis:
Beyond the Hypothalamus and Feeding. Cell Metab 22, 962–970.

General Introduction
19 PhD thesis - Bastos, AEP (2018)
Williams G, Bing C, Cai XJ, Harrold J a, King PJ & Liu XH (2001). The hypothalamus
and the control of energy homeostasis. Physiol Behav 74, 683–701.
Williams G, Cai XJ, Elliott JC & Harrold JA (2004). Anabolic neuropeptides. Physiol
Behav 81, 211–222.
Williams G, Harrold JA & Cutler DJ (2000). The hypothalamus and the regulation of
energy homeostasis: lifting the lid on a black box. Proc Nutr Soc 59, 385–396.
World Health Organization (2018). Obesity and overweight. World Heal Organ.
Wu A, Ying Z & Gomez-Pinilla F (2004). The interplay between oxidative stress and
brain-derived neurotrophic factor modulates the outcome of a saturated fat diet on
synaptic plasticity and cognition. Eur J Neurosci 19, 1699–1707.
Yeomans MR (2017). Adverse effects of consuming high fat–sugar diets on cognition:
implications for understanding obesity. Proc Nutr Soc1–11.
Objectives
20 PhD thesis - Bastos, AEP (2018)
2 Objectives
The involvement of hippocampal neurones on the regulation of food intake has received
close attention as evidence has been emerging for a key role of the hippocampus apart
from the traditional function of supporting memory and learning processes. However, the
molecular mechanisms by which hippocampal neurones play this new role is unclear.
This thesis aimed at providing evidence on this regard, by studying the influence of
feeding cycle over the neuronal activity. The lipid and protein alterations were established
as benchmarks for the influence of peripheral metabolism in the hippocampal neurones.
For such, rat hippocampal CA1 neurones and plasma membrane-enriched fractions of rat
hippocampus were obtained from animals during fasting or during the post-prandial
period.
Specifically, it was intended to:
1. Address the impact of feeding cycle on neuronal excitability, by recording the
sodium (Na+) and calcium (Ca2+) currents mediated by voltage-gated Na+ and
Ca2+ channels at the plasma membrane of rat hippocampal CA1 neurones. Whole-
cell voltage clamp and inside-out excised patch-clamp were used to study the
behaviour of the ion channels. By investigating important biophysical properties,
such as voltage-dependence of activation and inactivation, time-constant of
inactivation and single-channel conductance, it was possible to report the
influence of feeding cycle upon the activity of pyramidal CA1 neurones.
2. Identify whether feeding cycle influences the ion channel expression levels (Na+
and/or Ca2+ channels) at the neuronal plasma membrane through western blotting
experiments. The molecular expression of currents with significantly different
whole-cell current density between fed and fasted neurones prioritized the choice
of channel isoform studied in this task.
3. Establish differences in lipid composition of brain neuronal-membranes in the
different conditioned rats (lipidomic studies). This allowed determining lipid level
modifications in fed and fasting conditions.
4. Evaluate the implications of lipid alterations on the biophysical properties of the
neuronal membrane, particularly in the amount and organization of lipid rafts.

Objectives
21 PhD thesis - Bastos, AEP (2018)
2.1 Outline of the thesis
The following flowchart aims at guiding the readers throughout the thesis to facilitate the
comprehension of the objectives outlined above. One can find a visual resume of the
experimental design used as well as the organization of the results within the structure of
the thesis.

Objectives
22 PhD thesis - Bastos, AEP (2018)
Wister Rats(P21-P29; )
OVERNIGHT FASTING1h Feeding
Sacrifice
FED animals
Sacrifice
FASTED animals
H I
P P
O C
A M
P U
S
D I
S S
E C
T I
O N
Electrophysiology approach
Ca2+ Currents
Whole-cell (section 3.2.4.1 )
Single channel (inside-out configuration) (section 3.2.4.2)
Whole-cell (section 3.3.5.1)
Western blotting
Nav 1.2 expression
Lipid composition and
organization
Fluorescence
Spectroscopy
Biochemical
Characterization
Thin-layer
chromatography (TLC)
Na+ Currents
PLASMA MEMBRANE – ENRICHED FRACTIONS
Time-resolved
Steady-state
INFLUENCE OF FEEDING CYCLE ON RAT HIPPOCAMPAL NEURONES
ISOLATION OF CA1 NEURONES

Influence of feeding cycle on ion channels/currents
23 PhD thesis - Bastos, AEP (2018)
3 Feeding cycle on Ion channels
Feeding cycle was found to modulate the functioning of protein ion channels present at
the surface of rat hippocampal CA1 neurones. This chapter discloses a thorough
biophysical analysis of voltage-gated sodium (Na+) and calcium (Ca2+) currents. For a
fully comprehension of the results depicted here, one may find, at the end of this thesis,
an annex with the fundamentals of the electrophysiology techniques used (Annex II). The
general methods applied to study the Na+ and Ca2+ currents are firstly presented.
3.1 Material and Methods
3.1.1 Animal monitorization
Twenty-one- to twenty-nine-day old female Wistar rats (P21-29), purchased from Charles
River Laboratories, were used according to Afonso and co-workers (Afonso et al., 2012).
Briefly, animals were maintained under a 12:12 h light ⁄dark cycle with free access to
food and water. On the day before the experiment, animals were subjected to an overnight
fasting period, period in which the effect of food deprivation is greatest (Palou et al.,
1981), with the free access to water maintained. At the day of the experiment, animals
were either fed during a period of 1 hour to ensure that they had eaten by the time the
experiment started (here termed fed animals or ‘fed neurones’) or not fed (here termed
fasted animals or ‘fasted neurones’).
The establishment of different metabolic conditions were ensured upon the measurement
of glycaemia levels (mg/dL) using a glucose meter (Freestyle Lite, Blood Glucose Test,
Abbot®), as follows: 121.17 ± 5.73 and 44.091 ± 2.46, for fed and fasted animals,
respectively.
3.1.2 Dissection of hippocampus and preparation of CA1 hippocampal sub-slices
The animals were sacrificed by cervical dislocation. The brain was rapidly removed as
follows: the dorsal skin of the head was cut and pulled back to expose the skull surface.

Influence of feeding cycle on ion channels/currents
24 PhD thesis - Bastos, AEP (2018)
The skull overlying the brain was removed by cutting longitudinally along the sutures
from the occipital bone until above the olfactory lobes and cutting transversely at the
frontal suture. Care was taken to cut the dura mater. The exposed brain was lifted from
the skull after sectioning out the olfactory bulb and the underlying cranial nerves and
placed in chilled artificial cerebrospinal fluid (ACSF) containing (in mM): 125 NaCl, 25
NaHCO3, 1.25 KCl, 1.25 KH2PO4, 1 CaCl2, 1.5 MgCl2 and 16 D-glucose, saturated with
95% O2 and 5% CO2 (pH 7.4). Throughout the dissection, the brain tissue was maintained
wet in the cold bicarbonate solution to minimise the damage from anoxia and improve
the texture of the tissue for slicing (Schwartzkroin, 1981; Sakmann & Stuart, 1995).
Subsequently, the brain was placed over a cold damp surface and bisected along the
longitudinal fissure to separate the hemispheres (Figure 3.1A). Each hemisphere was held
down on its lateral convex side, and the thalamus and surrounding tissue overlying the
hippocampus dissected aside (Figure 3.1B and 3.1C). The hippocampus was exposed and
isolated (Figure 3.1D). From this point forward, two procedures were applied:
dissociation of CA1 neurones (section 3.1.3) or fractionation of hippocampus tissue to
obtain plasma membrane-enriched fractions (section 3.1.7).

Influence of feeding cycle on ion channels/currents
25 PhD thesis - Bastos, AEP (2018)
3.1.3 Enzymatic and mechanical dissociation of CA1 neurones
The dissected hippocampi were placed on a soft rubber, on a drop of cold ACSF with the
lateral face comprising the CA1 area upwards. The hippocampi were cut perpendicular to
their longitudinal axis in the middle third region to obtain transverse slices, 300µM thick
(Figure 3.2A). The slices were transferred with a brush to a petri dish with cold
oxygenated ACSF. Sub-slices from the CA1 area were obtained by carefully making 3
incisions around the CA1 subfield. The cutting lines are indicated by dashes in Figure
Figure 3.1- Dissection of the hippocampus. (A) The cerebellum/brain stem is cut off and discarded.
The cerebrum is bisected along the midline, separating the two hemispheres. (B) The left hemisphere is
illustrated with the medial surface facing up. The neocortex is peeled off toward the caudal surface, and
the midbrain is pulled ventrally by pulling in opposite directions at the location marked by the arrows
using small Teflon-coated weighing spatulas. (C) The dentate surface of the hippocampus is revealed.
Care should be taken not to touch the hippocampus with the spatulas. The fornix is cut by pushing the
point of the spatula into the brain at the point indicated by the dotted line. Next, one spatula is inserted
gently under the fimbria and further under the hippocampus (area of insertion indicated by the large
arrows). This works best if the spatula is inserted starting at the caudal (temporal) end of the
hippocampus and worked toward the septal end. (D) The hippocampus is flipped out of the brain by
lifting and pushing on the spatula, and then rotating the spatula tip around the long axis of the
hippocampus. Once the hippocampus is flipped out, it is trimmed at the line indicated by the two arrows,
and the rest of the brain is pulled away from the isolated hippocampus. Taken from (Madison & Edson,
2001)

Influence of feeding cycle on ion channels/currents
26 PhD thesis - Bastos, AEP (2018)
3.2B. The viability of cells is highly dependent on the rapidity and accuracy of the
dissection procedure.
Sub-slices of the CA1 region were incubated at 32 °C in an oxygen saturated solution
under moderate stirring; the composition of the incubating solution was as follows (in
mM): NaCl 120, KCl 5, CaCl2 1, MgCl2 1, 1,4-Piperazinediethanesulfonic acid (PIPES)
20, D-Glucose 25, adjusted to pH 7 with 1 mM NaOH. Trypsin (Sigma Type XI, 0.9
mg/ml) was added to this solution shortly after the preparation of the sub-slices;
incubation period was 30–50 min, depending on rat's age. Figure 3.3 shows a schematic
diagram of the enzyme incubation system used.
Figure 3.3- Schematic diagram of the
enzyme incubation system. The
incubation beaker (1) contains the
hippocampal tissue in a trypsin-
dissociation solution. A circulating hot
water heat-exchanger (2) keeps the
temperature at 32ºC. The tissue is
constantly agitated using a magnetic
stirrer (3) and oxygenated through a
tube blowing air to the surface of the
solution. Taken from (Fernandes,
2002).
Figure 3.2- Preparation of rat hippocampal CA1 neurones. A) The hippocampus lying with the CA1 area
upwards is cut perpendicular to its long axis to yield transverse slices. Taken from (Chad et al., 1991). B)
Transversal axis of the rat hippocampus exposing the somata and proximal processes of the major cell
body layers. The cutting lines performed around the CA1 subfield are highlighted. Taken from(Fisher et
al., 1990).
A B

Influence of feeding cycle on ion channels/currents
27 PhD thesis - Bastos, AEP (2018)
The sub-slices were placed in an incubation beaker containing the dissociation solution
and trypsin. They were agitated with a magnetic stirrer and oxygenated by blowing O2
(medicinal grade) through a fine catheter tubing, adjusted above the liquid surface to
avoid air bubbles. Temperature was maintained at 32ºC by a circulating hot water bath,
heat-exchanging system. After digestion, sub-slices were transferred to an oxygen
saturated enzyme-free solution after a brief wash with this solution and kept at room
temperature at moderate stirring. The preparation remained viable for about 5–6 h.
Enzyme activity was particularly critical for patch activity: too little enzyme activity often
lead to the production of very few isolated neurones (clumping), whilst too many tended
to produce many rounded, damaged neurones.
The mechanical dissociation involved gentle trituration of the enzyme-treated sub-slices
using 4 flame-polished Pasteur pipettes, with gradual narrower tips (i.e., tissue repeatedly
washed back and forth through the pipette tip). The first trituration with a wider tip pipette
achieved splitting of the tissue into two. Further trituration with narrower tips produced
dispersion of individual neurones. The technique of mechanical dissociation involved
some skill; too vigorous trituration often resulted in very few intact neurones or neurones
with short dendrites. Freshly dissociated neurones were experimentally viable for up to
two hours in the recording chamber at room temperature. In subsequent experiments
further away from the digestion, the dissociated neurones were viable for a shorter time.
The 35mm plastic Petri dishes were used as recording chambers for acutely isolated
neurones. The recording chamber was placed on a metal platform set on the stage of an
inverted microscope. The microscope was standing on an anti-vibration table and
enclosed by a Faraday cage.
3.1.4 Selection of neurones/criteria of exclusion
Patch pipettes were positioned over the soma of cells, whose selection was based on their
shape and appearance: pyramidal or fusiform cell shapes (cell body length about 20-
40microns) attached to the floor of the petri dish with shinny smooth surfaces and no
visible nucleus under ordinary inverted microscope optics (Olympus CK2 microscope)
were preferred, the latter conditions being an indication of viability (Kay & Wong, 1986).
Criteria to accept a well voltage-clamped cell were based on the pattern of current arousal
(Sah et al., 1988; Costa et al., 1994): on applying depolarizing series of command pulses

Influence of feeding cycle on ion channels/currents
28 PhD thesis - Bastos, AEP (2018)
to the membrane, currents were evoked progressively; current records showed no delay
in respect to the beginning of the command pulse and rose smoothly; current breakthrough
or discontinuities were not apparent in the current to voltage (I-V) curves. Cells that did
not comply with the above criteria were discarded.
3.1.5 Whole-cell recordings
Cells were superfused (2-3 mL/min) with an extracellular solution adequate for the
recording of whole-cell inward currents. The composition of external and internal
solutions used to record sodium and calcium currents are disclosed in Table 3.1, along
with notes explaining the rationale behind the use of some constituents.

Influence of feeding cycle on ion channels/currents
29 PhD thesis - Bastos, AEP (2018)
Com
posit
ion of
solu
tions u
sed i
n W
hole
-cell v
olt
age c
lam
p re
cord
ings
I Na
I Ca
Ext
erna
l (b
ath
solu
tion)
mM
Inte
rnal
(f
illin
g so
lutio
n)m
ME
xter
nal
(bat
h so
lutio
n)m
MIn
tern
al (f
illin
g so
lutio
n)m
M
NaC
l100
NaC
l10
CaC
l 25
CaC
l 20,5
KC
l5
CsF
d140
CsC
l5
CsF
d100
HE
PE
S
10
HE
PE
S10
HE
PE
S10
HE
PE
S10
CaC
l 21,8
EG
TA
5T
EA
-Cla
135
TE
A-C
la20
MgC
l 21
MgC
l 21
MgC
l 22
Tet
raet
hyla
mm
oniu
m
chlo
ride
(TE
A-C
l)a
30
Glu
cose
25
EG
TA
10
4-a
min
o-p
yrid
ine
(4-A
P)b
34-A
Pa
5M
gAT
Pf
2
Co
Cl 2
c2
Tet
rodoto
xin
(TT
X)e
0.3
μM
NaG
TP
g0,1
Glu
cose
25
Pho
spho
crea
tine
(PC
)h20
Pho
spho
crea
tine
kin
ase
(PC
K)i
50U
nits
/mL
Leu
pep
tinj
0,1
pH
7.4
(N
aOH
)7.2
(C
sOH
)7.4
(C
sOH
)7.1
(C
sOH
)
mO
sm/K
g300-3
10
285-2
95
29
0-3
00
270
-280
Junc
tion
pote
ntia
l
(mV
)k
9.5
11.6
No
tes
Co
mp
osit
ion
of
I Na
so
luti
on
s a
cco
rdin
g to
Co
sta
, P
. F
. (1
995)
Co
mp
osit
ion
of
I Ca
so
luti
on
s a
cco
rdin
g t
o R
ibeir
o,
M.
A. an
d C
osta
, P
. F
. (2
000)
a,b
Blo
cks K
+cu
rren
ts
c B
locks C
a2
+ c
urr
en
ts
dC
s+
as a
su
bsti
tute
of K
+io
ns a
nd
F-as t
he c
ou
nte
r an
ion
kn
ow
n t
o e
sta
biliz
e t
he p
atc
h
eB
locks N
a+
cu
rren
ts
f, g
, h
, i,
jU
sed
to
reta
rd c
urr
en
t ru
n-d
ow
n
kL
iqu
id j
un
cti
on
po
ten
tial b
etw
een
bath
an
d fillin
g so
luti
on
s, c
alc
ula
ted
wit
h J
PC
alc
(B
arr
y,
1994).
Ta
ble
3.1
- C
om
po
siti
on
of
solu
tio
ns
use
d f
or
reco
rdin
g w
hole
-cel
l so
diu
m a
nd c
alc
ium
curr
ents
of
rat
hip
po
cam
pa
l C
A1
neu
ron
es

Influence of feeding cycle on ion channels/currents
30 PhD thesis - Bastos, AEP (2018)
Currents were recorded with an Axopatch1D electrometer (Axon Instruments) and a
pCLAMP 6.0 software (Axon Instruments). Signal was digitized using a DigiData 1200
interface and a 20 µs sampling interval. The holding potential was -70mV. Series
resistance (Rs) was compensated to about 80%-90%. Rs values bellow 1MΩ enabled me
to reduce the errors associated with the voltage drop introduced by series resistance. The
currents were sampled with a low-pass 4-pole Bessel filter at a frequency of 5 kHz.
Electrode and cell membrane capacitances were compensated, and membrane surface
area was estimated from the reading of the cell capacitance compensation dial, assuming
a specific membrane capacitance of 1 µF.cm-2. Leak subtraction was digitally applied to
raw data using a P/4 protocol (Bezanilla & Armstrong, 1977). Holding current (Ip) was
used as an indirect measure of leakage current. Patches with Ip values more negative than
-60pA were not considered for analysis.
Recordings were allowed to stabilize for 5 min before current recording started, remaining
stable for at least 30min. After attaining whole cell configuration, cells were lifted from
the bottom of the chamber, brought near the surface and remained under continuous bath
perfusion. Experiments were carried out at room temperature (about 20 °C). Data in the
present report were not corrected for the junction potential.
3.1.6 Inside-out excised patch clamp recordings
Unitary Na+ channel current traces were recorded using an inside-out excised patch
configuration (Hamill et al., 1981). Composition of filling and bath solutions is showed
in table 3.2.

Influence of feeding cycle on ion channels/currents
31 PhD thesis - Bastos, AEP (2018)
The signal-to-noise output was a major concern, for the currents were recorded in the pA
range. Thus, in order to null the stray currents (capacitive currents, leak currents), several
technical requisites were considered: 1) the usage of small patch pipettes (~3cm length),
designed for low-noise single channel recordings, with an outside/inside diameter of
1.5mm/0.86mm and coated with a hydrophobic agent in the shank (ex: sylgard) to reduce
pipette capacitance and background noise; 2) routine cleaning of the pipette holder (also
of small dimensions), electrode wires and pipette itself (the glass of the pipette was
cleaned by boiling in diluted HCl acid for 5min, washed and oven-dried); 3) the tip of the
pipette had reduced dimensions and was fire-polished to further reduce the tip diameter
to a final resistance of 15 to 25 MΩ. All the background procedure aimed at reaching an
adequate seal in a tiny area of the membrane (‘patch’). In the present study, seals
resistance ranged from 20 to 100 GΩ, being often greater than 50 GΩ. The electronics
was also adequate for the exigency of this technique. The amplifier used in the
experiments provided a 4) high input resistance to permit recordings of subpicoampere
input currents (for further details, see annex II, Figure 7.2). Additionally, prior to a patch
recording, 5) a pipette was filled with pipette solution up to the shank, and back-filled
with liquid paraffin. During the recordings, 6) the location of the pipette (tip near the
surface of the bath) was also found critical for relatively low noise (Fernandes et al.,
Composition of solutions used in inside-out patch clamp recordings
INa
External (filling
solution)mM
Internal (bath
solution)mM
NaCl 150 NaCl 1
KCl 5 CsF 145
HEPES 10 HEPES 10
CaCl2 1,8 EGTA 5
MgCl2 0,9 CsCl 20
pH 7.4 (CsOH) 7.2 (CsOH)
mOsm/Kg 305 320
Junction
potential (mV)k 8.7
Notes Composition of solutions according to Fernandes, J. et al. (2001)
Table 3.2- Composition of bath and filling solutions used to record single-Na+ channel currents

Influence of feeding cycle on ion channels/currents
32 PhD thesis - Bastos, AEP (2018)
2001). These requisites, enabled to reach noise levels as low as 0.15 pA r.m.s. Unstable
and noisy (>0.40pA) patches were discarded.
Single-channel currents were recorded at 20ºC with an Axopatch-200B electrometer and
pClamp 6.0 software (Axon Instruments). The acquisition was made through an interface
TL-1 DMA (Axon Instruments) with a sampling interval of 25 µs and analog filtering of
filter fa= 5 kHz (-3 dB, 4 pole Bessel). Holding potential was -70mV. Currents were
evoked with 40ms depolarizing command pulses ranging from -60 to +20 mV (in 10 mV
steps), preceded by pre-pulses to-110mV. Typically, patches were stable for about 30
min, occasionally for 1 h. Capacitance transients were averaged from blank traces and
subtracted to sweeps with channel openings.
The signal processing was carried out under the operator´s constant surveillance, to
reduce the introduction of artifacts and to allow for event detection interpretation. Unitary
Na+ current amplitude measurements were performed using the 50% crossing method
(Ogden, 1994). The rise time (tr) is described as the time taken for the signal to rise from
10% to 90% of its final amplitude:
𝑡𝑟 = 0.3321
𝑓𝑐 (Equation 3.1),
Where 𝑓𝑐 is the cut-off frequency (Hz), here only characterized by the analog filter of the
recording system, 5 kHz, as no digital filtering has been used. To assure the detection of
fully resolved openings, an open time resolution, which is thought as the shortest time
interval that can be measured, was imposed prior to histogram binning. To obtain reliable
amplitude measurements, the imposed time resolution was 2 tr. Thus, the maximum time
resolution used in the present study was 132.8µs.
All-point amplitude histograms were constructed. The peak current of the openings was
determined from Gaussian fits to the distributions (Sakmann & Neher, 1995). Channel
conductance was estimated by averaging the slope of the regression line of the current to
voltage (I-V) plots obtained for each patch, either in fed and fasted animals.

Influence of feeding cycle on ion channels/currents
33 PhD thesis - Bastos, AEP (2018)
3.1.7 Plasma membrane-enriched fractions preparation
Hippocampal plasma membrane fractions were prepared as described previously (Sun et
al., 1988) with some modifications. Hippocampi from fed and fasted rats were
homogenized in ice-cold homogenization buffer - 0.32M sucrose, 50mM Tris HCl
(pH7.4), 1mM EDTA, 2mM EGTA, 1x protease inhibitor cocktail from Roche®
Diagnostics -, using a glass tissue homogenizer pestle, and centrifuged for 10min at 500g
to sediment nucleus and cell debris. The supernatant was centrifuged at 18800g, for
20min, to obtain a crude mitochondrial pellet. The post-mitochondrial supernatant was
centrifuged at 43500g for 30min, which resulted in the sedimentation of a white-colored
pellet. This pellet, constituted by the crude plasma membranes, was resuspended in lysis
buffer – 150mM NaCl, 1mM EGTA, 50mM Tris HCl (pH7.4), 1% (w/v) sodium
deoxycholate (D.O.C), 1% (w/v) nonidet P (NP-40), 0.1% (w/v) sodium dodecyl sulphate
(SDS), 1x protease inhibitor cocktail– and placed on ice for 30min. The protein
concentration was determined by the bicinchoninic acid (BCA) protein assay kit (Micro
BCA Pierce Thermo®) using BSA as a standard. Plasma membrane-enriched fractions
were then used immediately or stored at -80ºC until use. All steps were performed on ice
and centrifugations at 4ºC.
3.1.8 Western blotting
20 µg proteins were denaturated in Laemmli sample buffer containing (in %w/v):
dithiothreitol (DTT) 0.77, bromophenol blue 0.01, glycerol 5, SDS 1.5 and Tris-HCl
0.5M (pH6.8); applied in a 7% SDS-Polyacrylamide gel electrophoresis and wet
transferred to a Polyvinylidene difluoride (PVDF) membrane. Blots were blocked for 2
hours at room temperature in 5% skimmed milk in Tris-buffered saline (TBS) with 0.1%
of Tween 20 detergent (TBS-T 0.1%) prior to the incubation with primary antibody
overnight at 4ºC. The antibodies used were polyclonal anti-Nav1.2 (1:1000, Alomone labs
®, ASC-002) and as a loading control, the polyclonal anti N-cadherin (1:1000, Alomone
labs ®, ANR-082). Blots were washed several times in TBS-T 0.1% and incubated with
the secondary antibody polyclonal goat anti-rabbit IgG (H&L) peroxidase conjugated
(1:3000, Rockland®, 611-1302) for 120min at room temperature. Membranes were
washed in TBS-T 0.1% and incubated with enhanced luminol chemiluminescence

Influence of feeding cycle on ion channels/currents
34 PhD thesis - Bastos, AEP (2018)
reagents (Clarity ECL Bio-rad®) according to the manufacturer instructions. The density
of the signals was detected in a Chemidoc Molecular Imager (Chemidoc, Biorad®) and
densitometry was performed using the ImageLab software (Biorad®).
3.1.9 Statistical analysis
Statistical analyses were performed using SigmaStat 4.0 (Systat Software, Inc., San Jose,
CA, USA). The significance of the differences between the data of the two groups studied
– fed and fasted animals – was calculated as follows: Samples size n≥10 were subjected
to a two-tailed unpaired t-student test; samples in which n<10 or that failed normality test,
the non-parametric Mann-Whitney U-test was used for statistical procedures. Values
given in the text are means ± S.E.M, unless otherwise stated. Differences for experimental
data were considered statistically significant for P < 0.05. Exact P-values are presented
in the tables along the thesis.
Off-line analysis of electrophysiological data was carried out using Clampfit 10
(Molecular Devices, USA), Origin 8.0 (Originlab, USA) and Microsoft Excel®
(Microsoft, USA).

Influence of feeding cycle on ion channels/currents
35 PhD thesis - Bastos, AEP (2018)
3.2 Voltage-gated Na+ channels
Physiologists have many reasons to admire the Na+ channel (Marban et al., 1998).
3.2.1 Brief introduction on behaviour and functioning
Voltage-gated sodium (Na+) channels (hereafter termed VGSCs or Nav) are major key
players in initiation and propagation of action potentials in excitable cells. They were
firstly introduced to the scientific community by Hodgkin and Huxley in the 50´s of last
century with their voltage clamp experiments in the giant squid axon (Hodgkin & Huxley,
1952a). They have noticed that when the membrane potential is suddenly reduced
(depolarization), the initial pulse of current through the capacity of the membrane is
followed by large currents carried by ions (chiefly sodium and potassium), moving down
their own electrochemical gradients. The current carried by sodium ions rises rapidly to
a peak and then decays to a low value.
In a series of five papers (Hodgkin & Huxley, 1952a, 1952b, 1952c; Hodgkin & Huxley
A.F., 1952; Hodgkin et al., 1952), they have developed a thorough biophysical and
mathematical description of Na+ currents, with two distinct and independent processes; a
first, rising phase, which they called activation, and a second, decaying phase, developed
with an exponential time course – inactivation. Furthermore, they show that activation is
related to the existence of 3 charge particles present in the structure of the channel – m
particles – and that inactivation results from the movement of another particle – h particle.
The product of these particles (m3h) illustrated the better description of the Na+
conductance through VGSCs. The Hodgkin and Huxley (H-H) model, in which they have
assumed a diphasic model with a first order reaction (two states in equilibrium, open and
closed), enabled them to derive the mathematical equations and functions (rate constants,
time constants) that furnished a reliable description of the VGSCs functioning.
Later work, revealed that H-H model is no longer the most adequate to describe the
behaviour of such channels (Bezanilla, 1977; Horn & Vandenberg, 1984; Aldrich &
Stevens, 1987; Patlak, 1991; Vandenberg & Bezanilla, 1991). These authors
demonstrated inactivation as coupled to activation (the coupling model), for the
inactivation to occur it is necessary that the mechanism of activation must have happened
at least at some extent (Bezanilla & Armstrong, 1977; Goldman, 1995; Armstrong, 2006).
Currently, it is known that inactivation can occur from open and closed states (Figure

Influence of feeding cycle on ion channels/currents
36 PhD thesis - Bastos, AEP (2018)
3.4), as long as the latter contains some degree of activation (gating mechanisms related
to voltage sensor).
3.2.2 VGSCs subunits in mammalian brain - structure and background biophysics
The discovery of the channel protein structure (Catterall et al., 1979; Hartshorne &
Catterall, 1984; Noda et al., 1984, 1986) was a breakthrough towards the comprehension
of functioning of these channels. The sodium channel α-subunit is 260kDa and consists
of four domains, each with six membrane-spanning regions (S1-S6) which give fully
functional expression (Figure 3.5). Nine genes encode VGSC α subunits in mammals
(NaV1.1 toNaV1.9), and four are expressed primarily in the Central Nervous System
(CNS) (NaV1.1, NaV1.2, NaV1.3, and NaV1.6). Other structures, β-subunits (β1-β4, 33–
36 kDa), provide support to the α-subunit of channels, being required for the normal
kinetics and voltage dependence of channel gating (Isom, 2001). For instance, β1 and β2
subunits potentiate the fast kinetics properties of Nav1.2 (Nguyen & Goldin, 2010), the
major α-subunit in brain (Gordon et al., 1987; Westenbroek et al., 1989). Furthermore,
Figure 3.4- Scheme of three potential states of voltage gated ion channels such as those for sodium ions.
The resting closed channel state (upper left panel) is activated by membrane depolarisation which causes a
fast transition to the open state (upper right). Owing to an intrinsic inactivation, the channel closes (lower
panel) and reopens very rarely. Repolarisation of the membrane leads to recovery from the inactivated
(refractory) state back to the resting state (upper left) from which activation is again possible. There are
probably more than one open and at least two inactivated (fast and slow) states (not shown). Note that
transition from the resting to the inactivated state is also possible without channel opening, particularly
during slow depolarisation (so called accommodation). Note also that the amphipathic voltage sensor helices
(here depicted with positive charges) move within the lipid bilayer when the membrane polarity changes.
Taken from (Lehmann-Horn & Jurkat-Rott, 2003).

Influence of feeding cycle on ion channels/currents
37 PhD thesis - Bastos, AEP (2018)
they are also involved in channel localization and interaction with cell adhesion
molecules, extracellular matrix, and intracellular cytoskeleton (Isom, 2001).
The unveiling of the primary structure preceded a wide range of site-directed mutagenesis
experiments (Stühmer et al., 1989; O’Leary et al., 1995; Hirschberg et al., 1995; Kontis
& Goldin, 1997; Vedantham & Cannon, 1998; Kühn & Greeff, 1999; Goldin, 2003a;
Ulbricht, 2005). The introduction of mutations into mammalian Na+ channels and analysis
of their functional effects by electrophysiological recordings have yielded a remarkably
detailed view of the components of the Na+ channel that are required for its physiological
activity. The era of structure-function analysis has begun. It brought important insights
into the understanding of the molecular determinants of Na+ channels, with special
attention given to the α-pore forming subunit (Figure 3.6).
Figure 3.5- Subunit composition and subcellular localization of Nav channel principal and auxiliary
subunits in mammalian central neurones. Schematic representation of a single Navα subunit that forms
macromolecular complexes with auxiliary Nav β subunits. Bottom left box: classification, genetic
nomenclature, and subcellular localization of mammalian brain Nav channel principal α subunits. Bottom
right box: classification of Nav β auxiliary subunits expressed in mammalian central neurones and their
functional effects on coexpressed Nav α subunits. Taken from (Vacher et al., 2008)
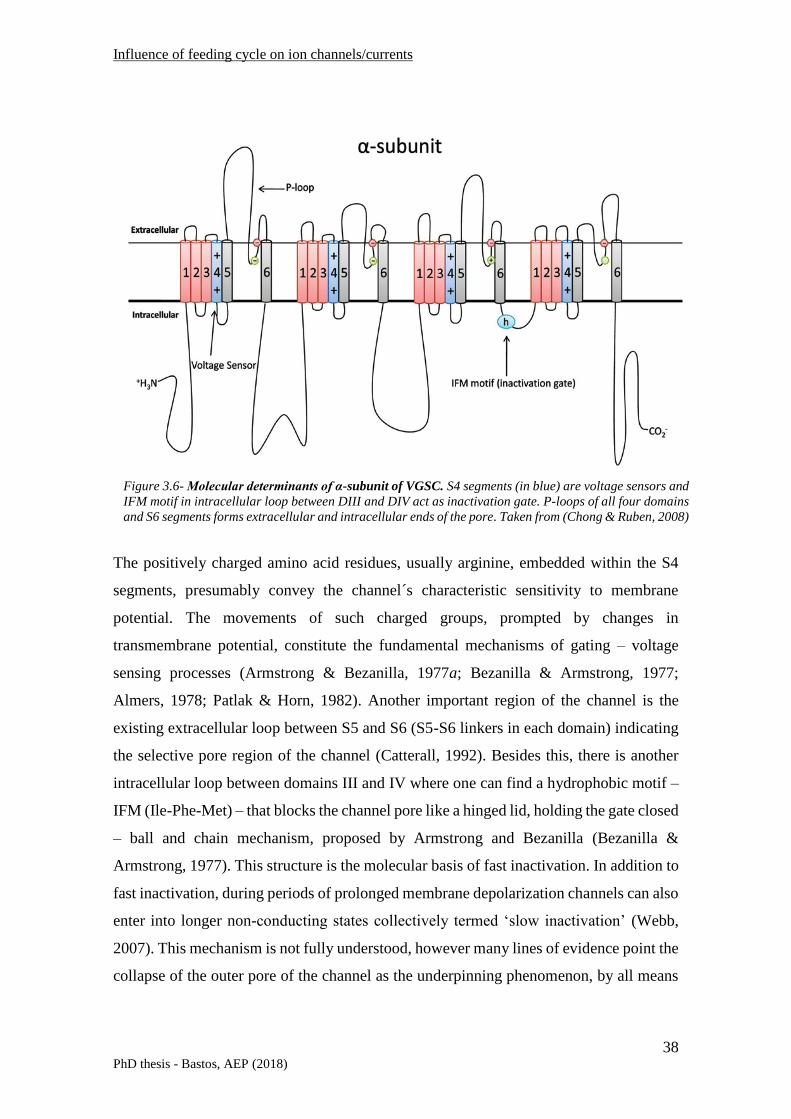
Influence of feeding cycle on ion channels/currents
38 PhD thesis - Bastos, AEP (2018)
The positively charged amino acid residues, usually arginine, embedded within the S4
segments, presumably convey the channel´s characteristic sensitivity to membrane
potential. The movements of such charged groups, prompted by changes in
transmembrane potential, constitute the fundamental mechanisms of gating – voltage
sensing processes (Armstrong & Bezanilla, 1977a; Bezanilla & Armstrong, 1977;
Almers, 1978; Patlak & Horn, 1982). Another important region of the channel is the
existing extracellular loop between S5 and S6 (S5-S6 linkers in each domain) indicating
the selective pore region of the channel (Catterall, 1992). Besides this, there is another
intracellular loop between domains III and IV where one can find a hydrophobic motif –
IFM (Ile-Phe-Met) – that blocks the channel pore like a hinged lid, holding the gate closed
– ball and chain mechanism, proposed by Armstrong and Bezanilla (Bezanilla &
Armstrong, 1977). This structure is the molecular basis of fast inactivation. In addition to
fast inactivation, during periods of prolonged membrane depolarization channels can also
enter into longer non-conducting states collectively termed ‘slow inactivation’ (Webb,
2007). This mechanism is not fully understood, however many lines of evidence point the
collapse of the outer pore of the channel as the underpinning phenomenon, by all means
Figure 3.6- Molecular determinants of α-subunit of VGSC. S4 segments (in blue) are voltage sensors and
IFM motif in intracellular loop between DIII and DIV act as inactivation gate. P-loops of all four domains
and S6 segments forms extracellular and intracellular ends of the pore. Taken from (Chong & Ruben, 2008)

Influence of feeding cycle on ion channels/currents
39 PhD thesis - Bastos, AEP (2018)
similar to the ‘C-type’ inactivation of K+ channels (Vedantham & Cannon, 1998; Vilin &
Ruben, 2001; Goldin, 2003a; Ulbricht, 2005; Webb, 2007).
3.2.3 VGSCs distribution in rat hippocampal CA1 neurones
Biochemical and immunocytochemical studies indicate that Nav1.2 is the predominant
Na+ channel subtype in most regions of the rat brain including the forebrain, midbrain,
dentate, cerebellum, and hippocampus (Gordon et al., 1987; Westenbroek et al., 1989).
Specifically, Gordon and co-workers showed that the predominance of Nav1.2 subtype
goes as follows: whole brain (81%), cerebral cortex (79%), cerebellum (84%), midbrain
(56%) and hippocampus (97%).
In rat hippocampal CA1 neurones, the subcellular distributions of all neuronal subtypes
of voltage-gated Na+ channels (Nav1.1, 1.2, 1.3 and 1.6) have been investigated by using
physiological approaches, as well as antibody binding, in some cases combined with
electron microscopy. Physiological studies fall into two categories: direct measurement
of ion channel function using cell-attached or cell-excised patches from the soma, axon,
and dendrites and indirect assessment of ion channel distribution using whole-cell
recording in combination with ion-channel pharmacology (Andersen et al., 2007).
Direct recordings of Na+ channel activity in patches up to about 300 µm from the soma
on the primary apical dendrite in CA1 neurones (see Annex I for a visual comprehension
of this region) have revealed that Na+ channels are distributed at an approximately
constant density along this region of the dendrite (Magee & Johnston, 1995a). The
presence of these channels confers very active properties to the dendrites, by allowing for
the propagation of Na+-dependent action potentials into the dendrites from their initiation
site in the axon, a mechanism known as ‘back-propagation’ (Figure 3.7). This activation
mechanism also limits the attenuation of the action potential as it propagates distally
(Spruston, 2008).
Despite the relatively uniform channel density, the properties of the channels change with
distance from the soma. For example, patches obtained at increasing distances from the
soma exhibited more prolonged inactivation (Mickus et al., 1999a). Such variation in the
biophysical output found along the length of the neurones may rely either on a modal
gating of a specific channel subtype (Alzheimer et al., 1993; Taylor, 1993; Fernandes et

Influence of feeding cycle on ion channels/currents
40 PhD thesis - Bastos, AEP (2018)
al., 2001) (the same channel reveals different degrees of inactivation, ranging from a short
single opening to periods of long-lasting openings and re-openings), and/or on a distinct
distribution of channel subtypes. Regarding the second consideration, it has been
established that Nav1.1 and Nav1.2 have a complementary distribution in rat CA1
pyramidal cells: Nav1.1 (and Nav1.3, in immature neurones) are preferentially localized
in the cell bodies and proximal dendrites, where they control neuronal excitability through
integration of synaptic impulses (Gordon et al., 1987; Westenbroek et al., 1989; Gong et
al., 1999). In contrast, Nav1.2 is predominantly expressed in unmyelinated fibers in the
mossy fiber pathway and in the other fiber layers of the hippocampus with a high density
of axons (Gordon et al., 1987; Gong et al., 1999). In the CA1 neurones, Nav1.2 can be
encountered in the proximal part of the initial segment of axons (AIS) (Vacher et al.,
2008; Hu et al., 2009; Qiao et al., 2013; Wang et al., 2017), whereas the distal AIS is
mostly populated by Nav1.6 channels (Hu et al., 2009; Grubb et al., 2011; Qiao et al.,
2013) (Figure 3.7).
This segregation of Na+ channel subtypes at the AIS sets a biophysical model, in which
the low-threshold Nav1.6 channels are responsible for the initiation and propagation of
action potentials along axon and the high-threshold Nav1.2 channels support action
potential backpropagation to the soma and dendrites (Hu et al., 2009; Grubb et al., 2011).
Figure 3.7- Function and modulation of AIS ion
channels. A, Schematic detailing roles of Na+
channel subtypes in AP initiation and
backpropagation in pyramidal neurones.
Accumulation of the low-threshold Nav1.6
channels at the distal AIS determines the lowest
threshold for AP initiation, whereas
accumulation of the high-threshold Nav1.2
channels at the proximal AIS promotes AP
backpropagation to the soma and dendrites. The
neuronal location of Nav1.1 is also illustrated.
Adapted from (Grubb et al., 2011)
Nav1.1

Influence of feeding cycle on ion channels/currents
41 PhD thesis - Bastos, AEP (2018)
3.2.4 Influence of Feeding cycle on neuronal Na+ currents
The influence of feeding cycle upon the biophysics and expression of voltage gated Na+
currents (INa) is addressed in this section. The results here illustrated provide information
regarding the effects of feeding cycle on the excitability of rat hippocampal CA1
neurones.
3.2.4.1 Whole-cell voltage clamp recordings
Voltage dependence of activation
Recordings from CA1 hippocampal neurones showed the common behaviour of Na+
currents (Figure 3.8), with a fast activation and a spontaneously rapid decay (Sah et al.,
1988; Costa, 1996; Vreugdenhil et al., 1998; Ketelaars et al., 2001b; Bruehl & Witte,
2003), reaching a peak within 0.6ms at -10mV. Na+ currents were evoked with a step of
depolarized voltages from -60mV up to +30mV, following a conditioning pulse of -
110mV, with a duration of 25ms, to remove inactivation. Holding potential was set at -
70mV.
The effect of feeding on sodium currents is depicted in Figure 3.8. Upon feeding, the
amplitude of Na+ current increased: mean peak current amplitude was -14.2 ± 0.76 nA
(n=18), as opposed to - 8.7 ± 0.74nA (n=28) in neurones from fasted animals. The nature
of the currents was confirmed by the blockade of the macroscopic currents upon the
application of 1 µM TTX (see inset in figure 3.8). The blocking of TTX was not complete,
which indicates the presence of TTX-resistant voltage gated Na+ channels.

Influence of feeding cycle on ion channels/currents
42 PhD thesis - Bastos, AEP (2018)
The conspicuous difference in the amplitude is also depicted in the current to voltage (I-
V) relationship, whose data comprises the mean peak Na current values obtained in the
voltage range studied (-60mV to +30mV) (Figure 3.9). Peak current values, I (pA), were
normalized to cell capacitance (pA/pF) (Figure 3.9A).
Figure 3.8- Effect of feeding cycle over the Na+ currents of acutely isolated rat CA1 hippocampal
neurones. Whole-cell voltage clamp Na+ currents, recorded in neurones from fed (A) and fasted (B)
animals, were evoked in series of depolarization command pulses (25ms in duration), in steps of 10mV,
from -60mV to +30mV, following a hyperpolarizing conditioning pulse at -110mV (25ms in duration).
Holding potential was set at -70mV. Traces depict increased Na+ current amplitudes in fed animals. The
inset confirms the nature of the currents, as trace 1 (control current) was blocked by 1µM TTX application
(trace 2); currents evoked with a command potential to 0mV from a -110mV prepulse, with a holding
potential of -70mV.
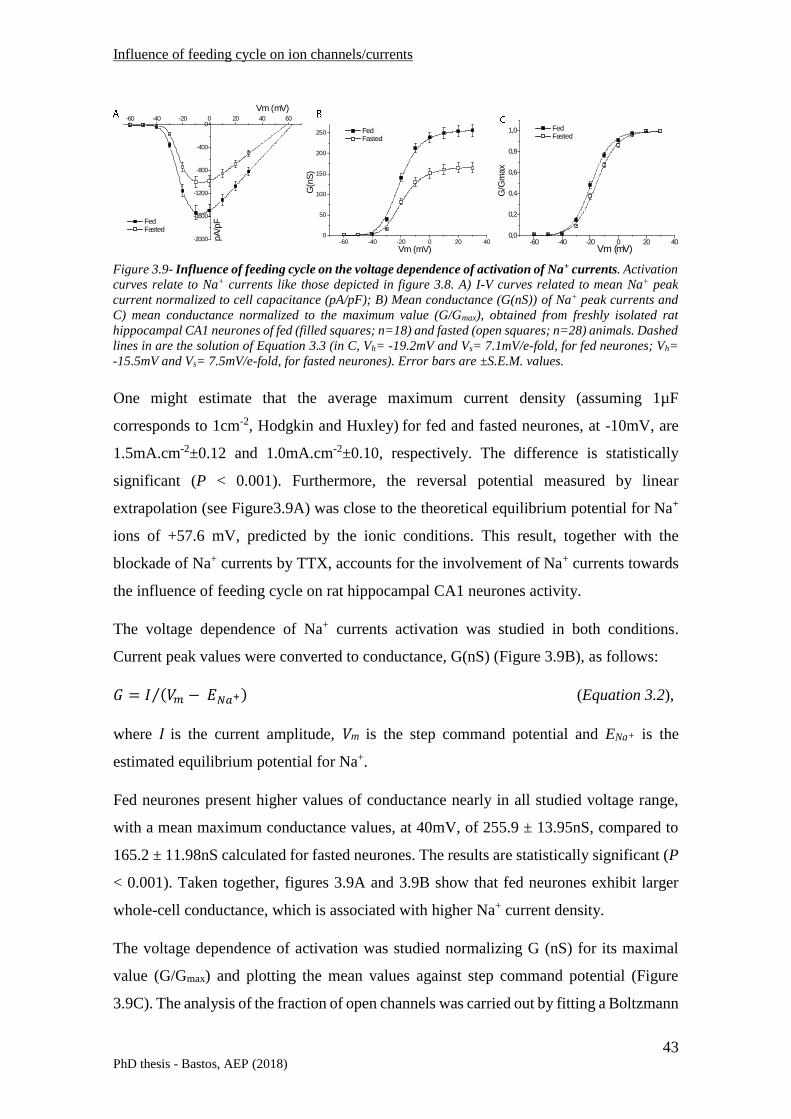
Influence of feeding cycle on ion channels/currents
43 PhD thesis - Bastos, AEP (2018)
One might estimate that the average maximum current density (assuming 1µF
corresponds to 1cm-2, Hodgkin and Huxley) for fed and fasted neurones, at -10mV, are
1.5mA.cm-2±0.12 and 1.0mA.cm-2±0.10, respectively. The difference is statistically
significant (P < 0.001). Furthermore, the reversal potential measured by linear
extrapolation (see Figure3.9A) was close to the theoretical equilibrium potential for Na+
ions of +57.6 mV, predicted by the ionic conditions. This result, together with the
blockade of Na+ currents by TTX, accounts for the involvement of Na+ currents towards
the influence of feeding cycle on rat hippocampal CA1 neurones activity.
The voltage dependence of Na+ currents activation was studied in both conditions.
Current peak values were converted to conductance, G(nS) (Figure 3.9B), as follows:
𝐺 = 𝐼 (𝑉𝑚 − 𝐸𝑁𝑎+)⁄ (Equation 3.2),
where I is the current amplitude, Vm is the step command potential and ENa+ is the
estimated equilibrium potential for Na+.
Fed neurones present higher values of conductance nearly in all studied voltage range,
with a mean maximum conductance values, at 40mV, of 255.9 ± 13.95nS, compared to
165.2 ± 11.98nS calculated for fasted neurones. The results are statistically significant (P
< 0.001). Taken together, figures 3.9A and 3.9B show that fed neurones exhibit larger
whole-cell conductance, which is associated with higher Na+ current density.
The voltage dependence of activation was studied normalizing G (nS) for its maximal
value (G/Gmax) and plotting the mean values against step command potential (Figure
3.9C). The analysis of the fraction of open channels was carried out by fitting a Boltzmann
-60
-2000
-1600
-1200
-800
-400
0-40 -20 0 20 40 60
Vm (mV)
pA
/pF
-60 -40 -20 0 20 400,0
0,2
0,4
0,6
0,8
1,0
G/G
max
Vm (mV)-60 -40 -20 0 20 40
0
50
100
150
200
250
G(n
S)
Vm (mV)
FedFasted
FedFasted
FedFasted
Figure 3.9- Influence of feeding cycle on the voltage dependence of activation of Na+ currents. Activation
curves relate to Na+ currents like those depicted in figure 3.8. A) I-V curves related to mean Na+ peak
current normalized to cell capacitance (pA/pF); B) Mean conductance (G(nS)) of Na+ peak currents and
C) mean conductance normalized to the maximum value (G/Gmax), obtained from freshly isolated rat
hippocampal CA1 neurones of fed (filled squares; n=18) and fasted (open squares; n=28) animals. Dashed
lines in are the solution of Equation 3.3 (in C, Vh= -19.2mV and Vs= 7.1mV/e-fold, for fed neurones; Vh=
-15.5mV and Vs= 7.5mV/e-fold, for fasted neurones). Error bars are ±S.E.M. values.

Influence of feeding cycle on ion channels/currents
44 PhD thesis - Bastos, AEP (2018)
distribution to the resulting data, whose parameters quantify the influence of feeding cycle
in the activation of Na+ channels:
𝐺 𝐺𝑚𝑎𝑥 = 1 1 + 𝑒𝑥𝑝[(𝑉ℎ − 𝑉𝑚)/𝑉𝑠]⁄⁄ (Equation 3.3),
Where Vh is the half-activation potential (mV), Vs is a slope factor (mV/e-fold) and Vm is
the step command potential (mV).
The average fitting parameters values of activation curves – Vh and Vs - are presented in
table1. Vh values were as follows: -15.2 ± 0.89mV and -19.1 ± 0.87mV, for fed and fasted
neurones, respectively. This result is statistically significant (0.001 < P < 0.01),
supporting the shift towards hyperpolarizing potentials (roughly 4mV) of the activation
of Na+ currents, observed in fed neurones (Figure 3.9C). Vs values were similar in both
conditions: 6.7 ± 0.35 mV/e-fold and 6.8 ± 0.25 mV/e-fold, for fed and fasted neurones,
respectively.
Steady-state inactivation (h∞)
The steady state of inactivation was studied with a conditioning double-pulse protocol
(Hodgkin & Huxley, 1952b), by which Na+ currents were evoked with pre-pulses ranging
from - 120 mV to 0 mV, 40ms in duration, from a holding potential of -70mV, in
conjunction with a depolarizing command step to a fixed voltage (0mV, 30ms). Currents
evoked with such voltage-clamp protocol are depicted in Figures 3.10A and 3.10B.

Influence of feeding cycle on ion channels/currents
45 PhD thesis - Bastos, AEP (2018)
Peak current values were normalized to the maximal response (I/Imax) and plotted against
pre-pulse potential to obtain steady-state inactivation curves (Figure 3.10C). Data points
were fitted with a Boltzmann distribution (equation 3.3) and the results can be directly
compared with the h∞ curve obtained by Hodgkin and Huxley (Hodgkin & Huxley,
1952b), giving us information about the steady state availability of sodium channels to
respond to activation.
Here, we can also quantify the effect of feeding cycle over the steady state properties of
inactivation (see Table 3.3). The average fitting parameters were as follows: Vh = -51.2
± 1.50mV, Vs = -9.8 ± 0.45 mV/e-fold in fed neurones (n=24) and Vh = -58.4 ± 1.81 mV,
Vs = -10.9 ± 0.35 mV/e-fold in fasted neurones (n=27). The results demonstrate that Na+
currents in CA1 neurones showed a significant voltage shift during the feeding cycle
(0.001 < P < 0.01). As presented in Figure 3C, from -90mV to -40mV, the Na+ currents
of fed animals display comparatively higher I/Imax values due to a shift towards
depolarized potentials by 7mV. Thus, the voltage profile observed in inactivation curves
of fed neurones showed a significant depolarization in comparison with that obtained in
fasted neurones. This demonstrates that Na+ currents in fasted neurones begin to
inactivate at more negative potentials. Once again, the voltage dependence, given by the
steepness of the h∞ curves, was similar in both feeding conditions.
Figure 3.10- Influence of feeding cycle on steady-state inactivation (h∞) of Na+ currents. Whole-cell
voltage clamp Na+ currents were evoked by a command step to 0 mV (30ms) following a set of pre-pulses
(40ms) ranging from −120 mV to 0 mV in steps of 10 mV; holding potential of −70 mV (inset). Records
were obtained from a neuron of a fed (A) and (B) fasted animal. C) Mean peak Na+ current obtained in the
test pulse normalized to the maximum value (I/Imax) as a function of pre-pulse potentials, from neurones of
fed (filled squares; n=24) and fasted (open squares; n=27) animals. The steady-state inactivation curves
(h∞) were fitted with equation 3.3 (Vh= -50.7mV and Vs= 10.7mV/e-fold, for fed neurones; Vh= -57.8mV
and Vs= 12.4mV/e-fold, for fasted neurones). Error bars are ±S.E.M. values.

Influence of feeding cycle on ion channels/currents
46 PhD thesis - Bastos, AEP (2018)
Na+ channel availability
To a better visualization of the effect of feeding cycle on the steady state properties of
activation and inactivation, we have addressed the fraction of permanently activated
channels. Overlapping the activation and inactivation of Na+ channels, it is possible to
define a range of voltages (i.e., ‘window’) where the channels are partially activated but
not fully inactivated (Figure 3.11).
The probability of being within this ‘window’, highlighted in Figure 3.11A as a grey area,
was calculated from the product of the activation and steady-state inactivation curves
(Huang et al., 2011). The feeding enlarged the window, shifted the peak toward negative
potentials and produced a twofold increase in amplitude (3%, Figure 3.11B). The
sustained ‘window’ current presented here is, thus, the result of an increase in the
Voltage dependence of activation (mV)
Voltage dependence of inactivation (mV)
Vh Vs n Vh Vs n
Fed -19.1 ± 0.87 6.7 ± 0.35 18 -51.2 ± 1.50 9.8 ± 0.45 24
Fasted -15.2 ± 0.89 6.8 ± 0.25 28 -58.4 ± 1.81 10.9 ± 0.35 27
P-value 0.005 n.s. - 0.004 n.s. -
Table 3.3- Activation and steady-state inactivation (h∞) fitting parameters Vh (mV) and Vs (mV/e-fold) (Eq.
3.3) for neurones of fed and fasted animals. Statistical analysis performed with a t-test; 0.001<P-
value<0.01
Figure 3.11- Window current of voltage gated Na+ currents obtained from neurones of fed and fasted
animals. A) Voltage dependence of activation and steady-state inactivation curves as depicted in Figures
3.9C and 3.10C. The area highlighted by a grey area relates to a voltage range (´window´) in which Na+
currents are partially activated although not fully inactivated. B) The product of the activation and h∞
curves give the probability of channels being present in this region (Huang et al., 2011). Na+ channels in
fed animals (black area) depict a larger availability when compared to the Na+ channels in fasted animals
(grey area).

Influence of feeding cycle on ion channels/currents
47 PhD thesis - Bastos, AEP (2018)
“window current” of fed neurones caused by a positive shift of the steady-state
inactivation and a negative shift of the activation curve (Figure 3.11A).
Time-constant of inactivation (τh)
The decay phase of the Na+ currents, obtained with activation protocols (Figure 3.8), was
described with an exponential time course, using an equation of the form
𝐼 = 𝑎𝑓𝑒−𝑡 𝜏ℎ𝑓⁄ + 𝑎𝑠𝑒−𝑡 𝜏ℎ𝑠⁄ + 𝐶 (Equation 3.4),
where 𝜏ℎ𝑓 and 𝜏ℎ𝑠 are the time-constants of the fast and slow inactivating components,
respectively; 𝑎𝑓 and 𝑎𝑠 are the amplitude coefficients and 𝐶 is a constant.
Figure 3.12A illustrates exponential fits to the decay phase of currents evoked in
command steps to -30, -25 and -20 mV from -70 mV holding potential. At -30 mV, the
current decayed monoexponentially with a time constant of 8.1 ms; at -25 and -20 mV,
Figure 3.12- Effect of feeding cycle on the kinetics of inactivation of Na+ channels. A) Fitting of the decay
phase of Na+ currents evoked by an activation protocol. The inactivation could be described by a single (-
30mV command pulse) or a by double exponential (-25mV and -20mV command pulses), equation 3.4. B)
Voltage-dependence of the time-constant of inactivation (τh(ms)) measured in activation protocols, in which
Na+ currents were evoked in series of depolarization command pulses, in steps of 5mV, from -45mV to
+30mV; slow (squares) and fast (triangles) inactivation components in neurones of fed (filled symbols;
n=18) and fasted (open symbols; n=28) animals. C) Voltage-dependence of the fast/slow ratio of the two
exponential components of inactivation in fed (filled squares, n= 18) and fasted (open squares, n= 28)
neurones. Error bars are ±S.E.M.

Influence of feeding cycle on ion channels/currents
48 PhD thesis - Bastos, AEP (2018)
the inactivating phase was best described by two exponentials, with time constants of 7.6;
3.8 ms and 6.8; 2.5 ms, respectively. Figure 3.12B shows the mean inactivation time
constants values measured in activation protocols. At a hyperpolarized Vm range (from -
45mV to -30mV), we could only determine a single exponential with slow kinetics
(τhslow); at -40mV, we have obtained τhslow 18.6 ± 2.81ms and τhslow 11.7 ± 0.83ms for fed
and fasted neurones, respectively. Results are statistically significant (0.001 < P < 0.01).
For voltage command steps more depolarized than -25mV, two exponentials were
ascribed to the time course of inactivation, revealing the existence of two inactivating
components, with slow (τhslow) and fast kinetics (τhfast). In command steps to -20mV, the
mean inactivation time constants measured in fed neurones were as follows: τhslow 8.5 ±
0.95ms and τhfast 2.2 ± 0.24ms. In fasted neurones, the mean inactivation time constants
were: τhslow 6.6 ± 0.52ms and τhfast 2.4 ± 0.39ms. Overall, the effect of feeding cycle over
the voltage dependence of the time-constant of inactivation is evident at more
hyperpolarized potentials, between -45mV and -20mV.
Furthermore, as previously observed by P. F. Costa (Costa, 1996), the proportion of fast
and slow inactivating components - afast and aslow - changed with depolarization. The
faster inactivating component dominated at values less negative than -20mV, attaining
∼92% of total current amplitude at large depolarizations up to +30 mV, in fed neurones.
Figure 3.12C depicts the voltage-dependence of the ratios calculated from the coefficients
in Equation 3.4 (𝑎𝑓/𝑎𝑠). At 30mV, the mean ratio values were: 10.3 ± 2.26 and 8.7 ± 3.25
for fed (n=18) and fasted (n=28) neurones, respectively. Ratio values obtained from fed
and fasted neurones, in the voltage range between 10mV and 30mV, were statistically
significant (0.01 < P < 0.05). The higher contribution of fast components in fed neurones
suggests a difference in protein expression levels at the surface of neuronal plasma
membrane between animals subjected to fed and fasting conditions.

Influence of feeding cycle on ion channels/currents
49 PhD thesis - Bastos, AEP (2018)
3.2.4.2 Single-channel analysis – inside-out excised patch configuration
The macroscopic Na+ currents showed distinct characteristics whether the animals were
fed or kept in fasting conditions. To further understand the underlying mechanisms of
such outcome, it was critical to address the effect of feeding cycle on the Na+ channel
functioning at a microscopic level.
The information obtained with single-channel experiments is mostly valuable. Here, the
equilibrium considerations, exclusive of macroscopic currents obtained in WC
experiments, give place to microscopic transitions between states/conformations of the
Na+ channels. The scope of my PhD urged me to study the amplitude of the currents to
establish a current-to-voltage (I-V) relationship, and thus, obtain the unitary conductance
of single- Na+ channels.
Unitary Na+ channel currents
Figure 3.13 illustrates single Na+ channel records in several patches of fed and fasted
neurones, using an excised inside-out patch configuration.

Influence of feeding cycle on ion channels/currents
50 PhD thesis - Bastos, AEP (2018)
Fed neurones comprised patches with higher current amplitudes. In the patches illustrated
in Figure 3.13 it is shown that the observed delta in current amplitude between feeding
conditions was obvious at hyperpolarized Vm values, becoming negligible as the
command potential steps are depolarized; at -60mV, we could observe a clear difference
in current amplitude, which was not observed at -10mV.
Amplitude measurements
The analysis of the single channel records followed the 50% threshold method (Sakmann
& Neher, 1995). All point histograms were constructed from the detected events. Figure
3.14 depicts all-point amplitude histograms obtained in patches from fed and fasted
neurones, at a pulse command step of -60mV.
Figure 3.13- Influence of the feeding cycle on single Na+ channel currents of acutely isolated rat
hippocampal CA1 neurones. Single-channel current traces, obtained in inside-out excised configuration,
in different patches from neurones of fed and fasted animals, at voltage command steps shown on the left
of each record and from a holding potential of -110mV. Arrows (↓) indicate the onset and the end of the
voltage command pulses. The horizontal dashed lines represent the closed (C) and open (O) states of
channels in preparations from either fasted or fed rats.
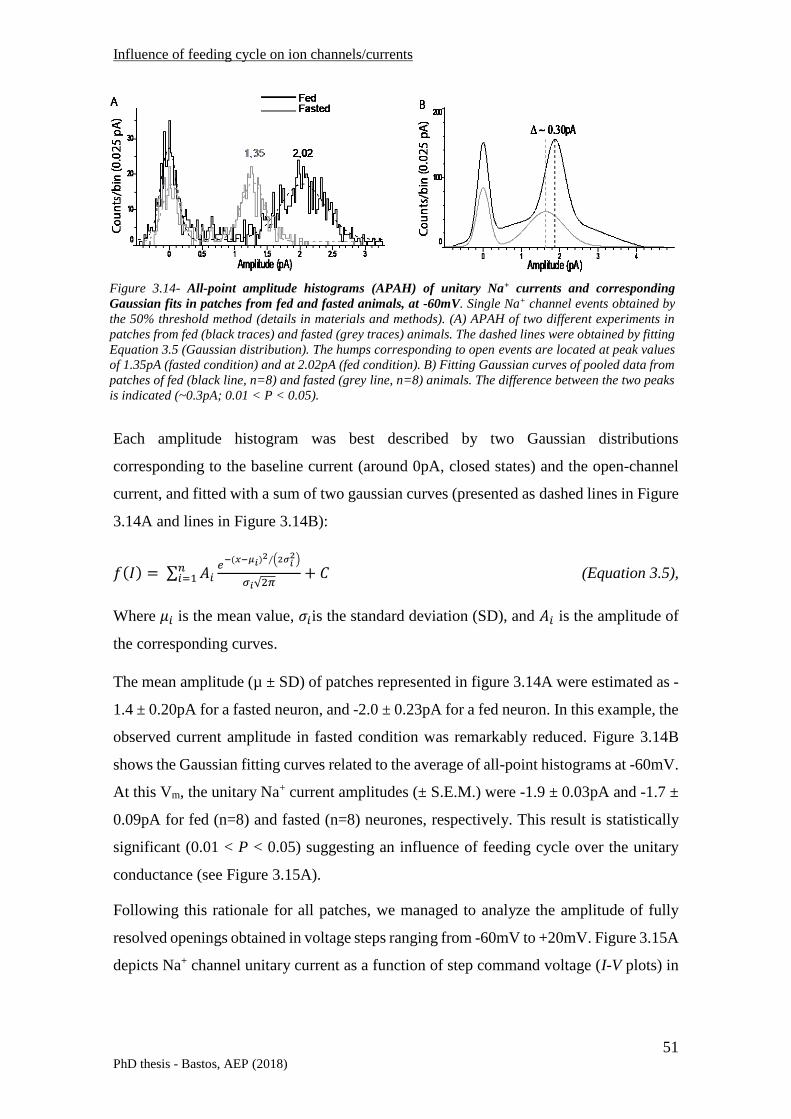
Influence of feeding cycle on ion channels/currents
51 PhD thesis - Bastos, AEP (2018)
Each amplitude histogram was best described by two Gaussian distributions
corresponding to the baseline current (around 0pA, closed states) and the open-channel
current, and fitted with a sum of two gaussian curves (presented as dashed lines in Figure
3.14A and lines in Figure 3.14B):
𝑓(𝐼) = ∑ 𝐴𝑖𝑒
−(𝑥−𝜇𝑖)2∕(2𝜎𝑖2)
𝜎𝑖√2𝜋
𝑛𝑖=1 + 𝐶 (Equation 3.5),
Where 𝜇𝑖 is the mean value, 𝜎𝑖is the standard deviation (SD), and 𝐴𝑖 is the amplitude of
the corresponding curves.
The mean amplitude (µ ± SD) of patches represented in figure 3.14A were estimated as -
1.4 ± 0.20pA for a fasted neuron, and -2.0 ± 0.23pA for a fed neuron. In this example, the
observed current amplitude in fasted condition was remarkably reduced. Figure 3.14B
shows the Gaussian fitting curves related to the average of all-point histograms at -60mV.
At this Vm, the unitary Na+ current amplitudes (± S.E.M.) were -1.9 ± 0.03pA and -1.7 ±
0.09pA for fed (n=8) and fasted (n=8) neurones, respectively. This result is statistically
significant (0.01 < P < 0.05) suggesting an influence of feeding cycle over the unitary
conductance (see Figure 3.15A).
Following this rationale for all patches, we managed to analyze the amplitude of fully
resolved openings obtained in voltage steps ranging from -60mV to +20mV. Figure 3.15A
depicts Na+ channel unitary current as a function of step command voltage (I-V plots) in
Figure 3.14- All-point amplitude histograms (APAH) of unitary Na+ currents and corresponding
Gaussian fits in patches from fed and fasted animals, at -60mV. Single Na+ channel events obtained by
the 50% threshold method (details in materials and methods). (A) APAH of two different experiments in
patches from fed (black traces) and fasted (grey traces) animals. The dashed lines were obtained by fitting
Equation 3.5 (Gaussian distribution). The humps corresponding to open events are located at peak values
of 1.35pA (fasted condition) and at 2.02pA (fed condition). B) Fitting Gaussian curves of pooled data from
patches of fed (black line, n=8) and fasted (grey line, n=8) animals. The difference between the two peaks
is indicated (~0.3pA; 0.01 < P < 0.05).

Influence of feeding cycle on ion channels/currents
52 PhD thesis - Bastos, AEP (2018)
patches from fed and fasted neurones. Points in the plots are mean values and concern
measurements obtained in a total of 18 patches, 9 in fed and 9 in fasted conditions.
The unitary Na+ channel conductance was estimated from the slope of the regression lines
calculated in all patches studied. To obtain reliable slope results, we only used patches
where at least 4 voltage commands were applied. The bars represented in Figure 3.15B
are mean values. The calculated slope conductance for fed neurones determined between
−60mV and +20 mV was 16.1 ± 0.76pS (n=8). Fasted neurones disclosed a smaller mean
slope conductance of 12.6 ± 1.30pS (n=8). These conductance results are statistically
significant (0.01 < P < 0.05), confirming that each Na+ channel present in the surface of
CA1 neurones of fed animals conduct more Na+ ions, than every single Na+ channel
located in neurones of fasted animals.
0
5
10
15
20
25
Fed Fasted
γ(p
S)
-2,0
-1,5
-1,0
-0,5
0,0-60 -40 -20 0 20 40
FedFasted
Vm (mV)
I(pA
)
Figure 3.15- Single Na+ channel current as a function of voltage command step (I–V plots). A) Mean
single channel current amplitude was accessed in fully resolved openings and determined by fitting all-
points histograms (see figure 3.14) in patches from fed (n=9 patches) and fasted (n=9 patches) neurones,
in voltage command steps from -60 to +20 mV. Dashed lines are linear regression of the average data. B)
The mean single-channel conductance, γ(pS), was determined by means of the average of the slope
conductance calculated for each I-V plot of patches from fed (∼16.7 ±0.76pS, n=8) and fasted (~12.6
±1.30pS, n=8) conditions. Error bars are ±S.E.M (t-student analysis *0.01<P<0.05).

Influence of feeding cycle on ion channels/currents
53 PhD thesis - Bastos, AEP (2018)
Ensemble averages
In order to establish a comparison between the single channel and whole-cell recordings,
ensemble averages were obtained by averaging all the current traces with channel
openings, produced at a single voltage step, at each time point. The time constant of
inactivation for the mean currents was determined by fitting one or two exponentials
(Equation 3.4; whole-cell currents section) to the decaying phase of the ensemble signal
(Figure 3.16).
The activity pattern of the sweeps observed in Figure 3.16A is representative of the
current traces observed at each membrane potential indicated. At -10mV, brief openings
(‘non-burst’ activity) were mainly obtained, where fast inactivation is prominent (see
ensemble averages, Figure 3.16B), and, thus, the possibility of obtaining long lasting or
late openings and reopenings is diminished. Such ‘burst’ activity was rather found at -
40mV, where the fast inactivation is less predominant, which increases the likelihood of
channel to transit between open and closed states before completion of inactivation. At -
50mV, voltage at which the open probability of the sodium channels is generally reduced,
non-burst activity was also observed.
Figure 3.16B depicts illustrative ensemble averages obtained from sweeps of different
patches in command steps to -50mV, -40mV and -10mV. The decaying phase of the more
Figure 3.16- Illustrative examples of ensemble averages. A) Representative sweeps of Na+ channel
activity recorded at -50 mV, -40mV and -10 mV from inside-out patches excised from different neurones,
both with one apparently active channel. Arrows indicate the onset and end of patch depolarization from
-110 mV to the indicated voltage. B) Ensemble averages obtained from each patch depicted in A), from a
total of 151 sweeps (-50 mV), 234 sweeps (-40 mV) and 152 sweeps (-10 mV). In -10mV, exponential fits
to the decaying phase of the signal were best described by two exponentials (τhf and τhs).

Influence of feeding cycle on ion channels/currents
54 PhD thesis - Bastos, AEP (2018)
hyperpolarized patches (-50mV and -40mV) was better described by a single exponential
fit (τhsingle = 5.63ms, at -50mV and 4.88ms, at -40mV). At -10mV, the decay phase of the
ensemble traces was best described by two exponentials, with hfast = 1.36ms and hslow =
3.77ms. Such current decays resemble those obtained with the whole-cell approach.
There was variability on the fits applied to all the patches and a tendency emerged when
comparing the recordings from fasted neurones to those recorded from fed neurones. In
fasted neurones, the fraction of patches in which one single exponential was required in
ensemble averages was as follows: 5/5 (-60mV), 4/4 (-50mV), 8/8 (-40mV), 4/4 (-30mV),
3/8 (-20mV), 5/9 (-10mV), 5/7 (0mV), 4/5 (10mV), 3/4 (20mV). On the other hand, in
fed neurones, the relative number of patches best fit with just one exponential was
reduced: 7/11 (-60mV), 5/8 (-50mV), 4/8 (-40mV), 3/5 (-30mV), 4/6 (-20mV), 5/5 (-
10mV), 3/8 (0mV), 7/7 (10mV), 5/6 (20mV). For a better comprehension of these ratios,
Figure 3.17 presents the relative contribution of single (τhsingle) and double exponential
(τhfast and τhslow) fits in the patches, at each voltage membrane studied, for fed and fasted
neurones.
The stack bars on Figure 3.17 show that in fed neurones two components of inactivation
were practically found in all voltage range studied, except for -10mV and 10mV. At
potential values between -60 and -30 mV, in fed neurones, there were considerable
percentage of patches requiring two exponentials, a tendency that contrast with what was
observed in fasted neurones: at the same hyperpolarized potentials (between -60mV and
-30mV), all the ensemble averages require only one exponential. Indeed, in fasted
neurones, a second component was only seen at potentials more positive than -20mV
(including). Overall, these results indicate that the feeding cycle influenced the fraction
Figure 3.17- Fraction of patches (%) with the decay phase of ensemble traces best described by a single
(grey bars) or double (green bars) exponential fits, in fed and fasted neurones.

Influence of feeding cycle on ion channels/currents
55 PhD thesis - Bastos, AEP (2018)
of patches with two distinguishable components – τhfast and τhslow, an effect more
pronounced at more hyperpolarized voltage range (-60mV to -30mV) In other words, a
single component is more often found in fasted neurones.
The voltage dependence of the time constant of inactivation, as estimated from ensemble
averages, is summarized in Figure 3.18. This analysis allowed to assess the contribution
of each component of inactivation in both neurones.
The values depicted in Figure 3.18A, corresponding to the ensembles that required the fit
of a single exponential, resemble the ones verified in the curves of the time-constant of
inactivation of whole-cell Na+ currents. Similar voltage dependence was found which
further indicates that the single-channel recordings refer to Na+ channel openings.
Furthermore, despite some apparent discrepancies in some voltages (e.g. -50 mV), the
Figure 3.18- Effect of the feeding cycle on the voltage dependence of the time constant of inactivation as
measured in ensemble averages such as those in Figure 3.16. A) Mean values of the single exponential
(τhsingle) calculated for ensemble average traces best described by one exponential (see Equation 3.4). B)
Mean values of fast (τhfast) and C) slow (τhslow) components of the decay phase of the signals best fit with two
exponentials, as given by Equation 3.4, from fed (filled squares) and fasted (open squares) neurones. Error
bars are ±S.E.M. and where no error bars are shown, sample was less than three. The grey box in B) draws
attention for the range of voltage steps at which only fed neurones presented data points correspondent to
the faster component of inactivation, τhfast. Indeed, one should note that, at the voltage range between -
60mV and -30mV, the mean values of τhsingle in fasted neurones is practically superimposed with the mean
values of τhslow of fed neurones, pointing for the exclusiveness of τhfast in fed neurones at that voltage range.
This is consistent with higher channel density in fed neurones, most likely due to the presence of additional
channel isoforms with rather fast kinetics of inactivation.

Influence of feeding cycle on ion channels/currents
56 PhD thesis - Bastos, AEP (2018)
data from fed and fasted neurones presents no significant differences in the voltage range
studied (P > 0.05).
For the patches that showed two components in the time course of the current decay, the
voltage dependence of the τhfast and τhslow is presented in figures 3.18B and 3.18C,
respectively. As previously observed on whole-cell currents (figure 3.12), τhslow depicts a
greater voltage dependence, in relation to τhfast. Both graphs show a steady decrease of
mean values along the voltage range studied, even considering the observed ‘hump’ at
0mV. Overall, the graphs in Figure 3.18 point to a lack of influence of the feeding cycle
on the kinetics of inactivation of the ensemble currents obtained from patches of fed and
fasted neurones. However, at hyperpolarized potentials (between -60mV and -30mV),
two observations must be highlighted: a) the curves of τhsingle vs. voltage in the fasted
neurones and τhslow vs. voltage in the fed neurones are superimposed and b) the presence
of τhfast is exclusive in fed neurones (Figure3.18B). Altogether, these observations
indicate a variation in the channel density throughout the feeding cycle, suggesting that
fed neurones have more functional channels when compared to fasted neurones, as
indicated by the results obtained from the whole-cell currents.
Qualitatively, the major differences in the decaying phase of the ensemble traces between
fed and fasted neurones are presented in the Figure 3.19. The mean pooled response from
the same raw data of figure 3.18 was normalized to peak current value, for each of the
membrane potentials indicated.

Influence of feeding cycle on ion channels/currents
57 PhD thesis - Bastos, AEP (2018)
In the range from -60mV to -30mV, there was a dominant faster component in fed
neurones (more prominent between -40mV and -30mV), which accounts for the sharper
drop in the decaying phase observed in the fed neurones. At potentials more depolarized
than -20mV the decaying phase of both neurones is essentially overlapped. This result
demonstrates that the fast decay observed in fed neurones is dominant over the fast decay
of fasted neurones, precisely in the voltage range at which fasted neurones disclose a
single exponential. Once again, the exclusive presence of τhf at hyperpolarized potentials
in fed neurones may be accountable for the differences illustrated in Figure 3.19. This is
consistent with a greater density of Na+ channel isoforms with faster kinetics of
inactivation in CA1 neurones of fed animals.
Figure 3.19- Pooled ensemble averages (mean values) normalized to peak current values in patches
from fasted (thinner grey trace) and fed (thicker black trace) neurones, obtained in command steps
from -60 to 10 mV. For each voltage, the results for fed and fasted neurones were superimposed for
comparison.

Influence of feeding cycle on ion channels/currents
58 PhD thesis - Bastos, AEP (2018)
3.2.4.3 Na+ channel expression analysis – western blotting
The likely differential expression of Na+ channel isoforms in the surface of rat
hippocampal neurones was addressed, as a further explanation to the different
electrophysiological properties of Na+ channels.
Plasma membrane-enriched fractions were isolated from hippocampal neurones dissected
from fed and fasted animals (see material and methods) and used in western blotting
experiments. These samples contained all the neuronal membrane structures, including
the plasma membrane where the voltage gated Na+ channels are functionally located. To
detect the presence of Nav1.2, the most common sodium channel isoforms in rat brain
(Gordon et al., 1987), PVDF membranes were marked with an antibody raised against the
α-subunit (1:2000 dilution) and as a loading control we have used an antibody that
recognizes a plasma membrane marker, N-cadherin (1:1000 dilution).
Figure 3.20A illustrates the effect of feeding cycle on the protein population of rat
hippocampal neuronal membranes. The bands located near the 250KDa molecular weight
relate to the expression levels of Nav1.2. The first three lanes, on the left, contain the
protein extracts of fed rats, suggesting an increased concentration of this isoform in the
surface of rat hippocampal plasma membrane when the animals were fed. The
quantification of protein expression is shown in Figure 3.20B, confirming the higher
levels of Nav1.2 in fed rats. Results are statistically significant (0.01 < P < 0.05, n=3).
MW (KDa)
150 -
250 -
FASTEDFED
0
0,2
0,4
0,6
0,8
1
FED FASTED
DN
av1
.2/D
N-c
ad
he
rin
*
v1.2
Figure 3.20- Expression of rat brain Na+ channel subtype Nav1.2 in plasma membrane-enriched
fractions of hippocampal neurones, from fed and fasted rats. A) Western blotting PVDF membrane
marked with antibody raised against Nav1.2 (1:2000) and N-cadherin (1:1000), as a loading control.
The first three lanes, on the left, correspond to fed samples and the last three, on the right, to fasted
samples. B) Densitometry results obtained by dividing the blot areas measured in ImageLab software
(Biorad®). The results are statistically significant (t-student test *0.05<P<0.01, n=3). Error bars are
±S.E.M.

Influence of feeding cycle on ion channels/currents
59 PhD thesis - Bastos, AEP (2018)
3.2.4.4 Discussion
The present study aimed at providing data concerning the effect of feeding cycle on
sodium (Na+) currents (INa) in acutely isolated rat hippocampal CA1 neurones. For such,
we developed an integrated analysis of the biophysical and biochemical properties of INa
in neurones of fed and fasted animals.
The significant differences between fed and fasted neurones can be summarized as
follows: in fed neurones, the whole-cell currents showed 1) a 1.5-fold increase in average
maximum current density values; 2) a hyperpolarizing shift in the voltage dependence of
activation curves and a depolarizing shift in the voltage dependence of both 3) steady-
state inactivation (h∞) curve and 4) time-constant of the slow inactivating component
(τhslow). Also, in fed neurones, the single-channel current records displayed 5) higher Na+
channel unitary current amplitudes and larger conductance mediated through single
channels. Finally, western blotting results disclosed 6) an increase in the concentration of
a specific Na+ channel α-subunit, Nav1.2, in plasma membrane-enriched fractions of
hippocampus from fed animals.
Considering the voltage dependence of activation curves of Na+ currents obtained from
both conditioned neurones, mean Vh values were significantly different, with fed
neurones depicting a hyperpolarizing shift (about 4mV) in comparison to fasted neurones
(see Table 3.1). This result indicates an influence of feeding cycle on the conductance of
the Na+ channel population of rat hippocampal CA1 neurones, suggesting a facilitation
of the activation process in fed neurones. More specifically, upon feeding, there must be
more Na+ channels opened at more negative membrane voltages, at which the driving
force is greater, thus contributing to the higher current density observed in fed neurones.
In addition, a more hyperpolarized activation curve lowers the spike voltage threshold,
increasing the excitability in hippocampal CA1 neurones of fed animals.
The feeding cycle also influenced the voltage dependence of inactivation of INa. The Vh
parameter of h∞ in fed neurones showed a significant depolarizing shift by 7mV, in
comparison to fasted neurones (see Table 3.1), reflecting an increase of the fraction of
activatable channels. Such variation in the voltage dependence of h∞ is accompanied by
a depolarizing shift in the voltage dependence of τhslow in fed neurones, with slower values
obtained at a hyperpolarized voltage range between -45mV and -20mV (see figure

Influence of feeding cycle on ion channels/currents
60 PhD thesis - Bastos, AEP (2018)
3.12B). In other words, INa displayed relatively less and slower inactivation in fed
neurones in a wide range of potentials, which indicates a greater neuronal excitability
after feeding.
By overlapping the activation and inactivation curves, we obtained a voltage range at
which the activation occurs when the current is not completely inactivated – ‘window
current’ (French et al., 1990; Ketelaars et al., 2001a; Huang et al., 2011). From this
analysis, one can estimate that, upon feeding, there are more Na+ channels available for
activation. Again, the larger window current amplitude plus the negative shift observed
in its voltage dependence emphasise the thesis of higher state of excitability in fed
neurones.
Despite the already mentioned biophysical modifications observed in whole-cell currents,
we suggest that the feeding cycle does not play any role over the structure of the voltage-
gated Na+ channels. Such reasoning arises from the analysis of Vs parameter of activation
curves, whose output is sensitive to variations in the structure responsible for the gating
of the channels - the voltage sensor (Stühmer et al., 1989; Chen et al., 1996). This
structure is mainly confined to the positive charged amino acids – arginine residues -
embedded in the S4 segments of the channels (Robert Guy & Conti, 1990; Patlak, 1991;
Catterall et al., 2005; Bezanilla, 2005). Here, the similarity observed in Vs values between
conditions (6.7 ± 0.35 mV/e-fold and 6.8 ± 0.25 mV/e-fold, for fed and fasted neurones,
respectively) is an indirect indication that the voltage sensor of the channels might not
endure any alteration during the physiological feeding cycle. Accordingly, the number of
charges required for the outward movement of the voltage sensor (Armstrong &
Bezanilla, 1973; Armstrong & Bezanilla, 1977; Almers, 1978; Yang et al., 1996;
Bezanilla, 2000) is expected to be the same in both conditions.
Additional evidence that further suggests the lack of influence of feeding cycle on Na+
channel structure is brought by the analysis of the voltage dependence of time constant
of the fast inactivating component (τhfast). Fast inactivation is linked to a hinged-lid
structure (IFM motif) tethered in the cytoplasmic part of the channel - “ball and chain”
model (Bezanilla & Armstrong, 1977; Armstrong, 1981). Here, we clearly showed that
τhfast values of fed and fasted neurones are essentially overlapped (see figure 3.12B),
suggesting that the tethered cytoplasmic structures of the Na+ channels take essentially

Influence of feeding cycle on ion channels/currents
61 PhD thesis - Bastos, AEP (2018)
the same time to block the pore and completing the fast inactivating mechanism, either in
fed and fasted animals.
On the other hand, the already mentioned variations obtained from τhslow point out to a
possible conformational rearrangement of Na+ channels throughout feeding cycle.
Although the slow inactivation is not a fully understood mechanism (Vilin & Ruben,
2001b; Goldin, 2003b), it is thought to be correlated with conformational alterations at
the extracellular pore of the channel (O’Leary et al., 1995; Mickus et al., 1999; Goldin,
2003b; Ulbricht, 2005; Silva, 2014). Despite the biophysical interpretation of this
outcome is not clear, one may consider alterations in the interaction lipid-protein between
the neuronal plasma membrane and the extracellular pore of the channels. Indeed,
modifications in the organization and lipid composition of the plasma membrane result
in alterations of the fluidity properties of neuronal plasma membrane, which, ultimately
might regulate channel functioning (Lee, 2006; Schmidt et al., 2006; Schmidt &
MacKinnon, 2008; Dart, 2010; Jiang & Gonen, 2012; Kasimova et al., 2014; Poveda et
al., 2014, 2017).
We have sought for possible underlying mechanisms that could account for the
biophysical differences described here for the whole-cell currents of fed and fasted
neurones. In this regard, we have exploited two possibilities: alterations on Na+ single-
channel activity and in channel density throughout the feeding cycle. These two
approaches would be most valuable to provide further mechanistic insights on how
feeding led to changes observed in whole-cell currents.
Accordingly, single-channel recordings were performed using the excised inside-out
patch configuration. Unitary current amplitudes were measured by fitting all-points
amplitude histograms with Gaussian curves. Fed neurones contained patches with higher
current amplitude, suggesting an influence of feeding cycle over the unitary conductance.
The calculated slope conductance for fed neurones was 16.7 pS, being consistent with the
16.6 pS value obtained in a previous study in rat hippocampal CA1 cells (Fernandes et
al., 2001). The lower average single-channel conductance obtained for fasted neurones
(12.6 pS) indicates an impact of feeding on the single-channel conductance: each Na+
channel present at the surface of rat hippocampal CA1 neurones conducts more Na+ ions
through its pore during the post-prandial period, corroborating the results observed in the
activation curves of whole-cell currents. There was indeed positive correlation between

Influence of feeding cycle on ion channels/currents
62 PhD thesis - Bastos, AEP (2018)
the ensemble traces obtained from sweeps with single-channel openings and the whole-
cell currents, confirming the nature of such openings as being Na+ channel events.
Furthermore, the observed distinct behaviour of macroscopic currents may also be
explained by variation in the number of functional Na+ channel isoforms at the plasma
throughout the feeding cycle. In the light of this argument, the analyses regarding the
whole-cell current density and window current can be interpreted as a result of augmented
expression levels of Na+ channels in fed neurones. Moreover, the ratio of the components
of time constant of inactivation (𝑎𝑓 𝑎𝑠⁄ ) reflects a dominance of fast component
proportion in both conditions, which, ultimately, highlights the presence of channels with
rather faster kinetics, typically found in brain cells (Westenbroek et al., 1989; Vacher et
al., 2008; Leterrier et al., 2010). In this regard, Nav1.2, a fast inactivating channel, seemed
like a reliable candidate to address this question, as it comprises approximately 70% of
the total rat brain Nav α-subunit pool (Gordon et al., 1987). Thus, any alteration in the
surface expression of Na+ channel populations determined by the feeding cycle, would
most likely involve the Nav1.2 isoform.
Indeed, the western blotting experiments, run in plasma membrane-enriched fractions of
rat hippocampus, validated this hypothesis, pointing to a higher concentration of Nav1.2
at the surface of hippocampal neurones of fed animals. Hence, the Nav1.2 isoform
underwent a differential surface expression whether animals have eaten or not. Although
the survey of Nav1.2 isoform has been conducted on the entire tissue of rat hippocampus,
one may assume that these results are representative of what happens in the neurones of
CA1 subfield, where the electrophysiological experiments were carried out.
The backdrop outlined here of increased neuronal excitability upon feeding is reinforced
with higher Nav1.2 density at the plasma membrane. The cellular localization of Nav1.2
channels in the central nervous system neurones – proximal Axon Initial Segment (AIS)
–, as well as their physiological function at ensuring action potential backpropagation,
make them major players in the modulation of the threshold for the generation of
somatodendritic potentials (Westenbroek et al., 1989; Ahn et al., 2007; Hu et al., 2009).
Hence, it is plausible to consider that a greater channel density may result in a reduction
of action potential threshold in fed neurones, which, per se, promotes hyperexcitability.
The possibility of other channel isoforms being overexpressed after feeding should be
also considered. For example, the Nav1.1 isoform might be involved in this tidal

Influence of feeding cycle on ion channels/currents
63 PhD thesis - Bastos, AEP (2018)
regulation of channel expression, as the single-channel conductance value of fed neurones
resembles the one obtained for SCN1A expressed in HEK-293 cells (17pS; Vanoye et al.,
2006). Hence, one can predict a larger number of Nav1.1 channels at the surface of the
soma of hippocampal neurones from fed animals. Indeed, considering the mean pooled
ensemble-average currents obtained in the voltage range from -60mV to -30mV (figure
3.19), major differences were found in the decaying phase of the signal in fasted and fed
neurones. The higher proportion of τhfast in fed neurones (sharper drop in the decaying
phase) can be attributed to the major contribution of Nav1.1 isoform, which is known for
its fast-kinetic properties (Goldin, 1999; Catterall et al., 2005a; Eijkelkamp et al., 2012).
In summary, the present study provides evidence for the impact of the feeding cycle on
the functioning of Na+ currents/channels of central pyramidal neurones, mainly confined
to the CA1 region of rat hippocampus. By correlating information obtained from
electrophysiology with those obtained with molecular biology methods, we conclude that
there is a rapid and reversible adjustment of the biophysical and molecular characteristics
of INa to variations of metabolism brought up by the feeding cycle. The differentiated
response under fed vs. fasted conditions suggest an increase in intrinsic neuronal
excitability upon feeding. Such increase of excitability is likely to involve a consequent
enhancement of calcium dynamics in CA1 neurones upon feeding. Our results are
consistent with changes in the Na+ channel density of rat hippocampal neurones, which,
at some extent, can explain the voltage shifts observed in activation and inactivation
curves (both, h∞ and τhslow) in fed neurones. Furthermore, the greater current density
observed in fed neurones can be justified by the combination of a greater channel density
with a higher single-Na+ channel conductance, leading to a signal amplification of the
whole-cell current output. Additionally, the results concerning the Vs parameter and τhfast
suggest that feeding cycle does not determine any structural effect upon the regions
responsible for the voltage sensor and fast inactivation of the channels, respectively,
whereas changes in τhslow may indicate conformational alterations in the outer pore of the
Na+ channels.
The results disclosed a new perspective of the interplay between feeding and the
hippocampus. The biophysical and biochemical modifications brought by the feeding
cycle may elect voltage-gated Na+ channels as molecular references in the role of
hippocampus as a processor of satiety information (Hebben et al., 1985; Higgs, 2002;
Davidson et al., 2005, 2009, Henderson et al., 2013, 2016; Parent et al., 2014; Hsu et al.,

Influence of feeding cycle on ion channels/currents
64 PhD thesis - Bastos, AEP (2018)
2015; Jacka et al., 2015; Parent, 2016b; Hannapel et al., 2017; Kanoski & Grill, 2017).
Thus, when to eat, or how much to eat in any one meal are decisions that may rely on the
functioning of Na+ channels present at the surface of the hippocampus. Speculating, one
might regard Na+ channels as new players in the context of food ingestion-related
conditions - overweight and obesity – and metabolic disorder, such as diabetes.

Influence of feeding cycle on ion channels/currents
65 PhD thesis - Bastos, AEP (2018)
3.3 Voltage-gated Ca2+ channels
3.3.1 Calcium signaling in the brain
Calcium (Ca2+) is the widely known universal second messenger that regulates the most
important activities of all eukaryotic cells. Ca2+ ions are key players in enabling excitable
cells to translate their electric excitation into other forms of physiological activity. In
neurones, by influencing membrane depolarization (thereby activating other voltage-
gated ion channels), regulating gene expression and controlling the release of
neurotransmitters from the presynaptic terminals, Ca2+ has been shown to influence both
long-term potentiation (LTP) and long-term depression (LTD) (Eccles, 1983; Voronin,
1983; Grover & Teyler, 1990; Bliss & Collingridge, 1993; Stanton, 1996; Kawamoto et
al., 2012; Brini et al., 2014; Simms & Zamponi, 2014; Zamponi, 2015). Neurones have
thus developed extensive and intricate Ca2+ signaling pathways to couple the Ca2+ signal
to their biochemical machinery (Figure 3.21). Given the evidence, Ca2+ plays pivotal roles
in controlling neuronal excitability, not only within individual neurones, but also among
large populations of neurones that comprise neuronal networks (Gleichmann & Mattson,
2011).

Influence of feeding cycle on ion channels/currents
66 PhD thesis - Bastos, AEP (2018)
While Ca2+ regulation is essential to any cell, it is obvious that in neuronal cells the
connection between electrochemical ion gradients and biochemical regulatory pathways
is of special importance. For such, there must be a tight regulation of intracellular Ca2+
concentration ([Ca2+]i), which is accomplished, among other homeostatic mechanisms,
by ion channels and ATP-dependent exchangers and pumps (Figure 3.21). Indeed, it has
been suggested that once cells opted to use high-energy phosphate compounds as
metabolic currency, they faced great evolutionary pressure to maintain an unusually low
[Ca2+]i (< 100 nM) (Tsien & Barret, 2013). Otherwise, salts of calcium and phosphate
would precipitate, turning the cytosol into a bone-like solid (Williams, 1970). The 10,000-
fold concentration gradient (extracellular [Ca2+] ~1.2mM) makes Ca2+ special when
compared with the more abundant cations Na+ and K+, as it leads to a significant locally
increase in [Ca2+]i with only a small Ca2+ flux across the cell membrane (Clapham, 2007),
whereas influx of Na+ and efflux of K+ significantly affect the membrane potential, but
cause only relatively minor changes in cytosolic ion concentration (Brini et al., 2014).
The [Ca2+]i increase is the call to action. A good rule of thumb is that Ca2+ acts locally, in
the vicinity of the channels that delivery it (Hille, 2001).
As a broad generalization, excitable cells translate their electricity into action by Ca2+
fluxes modulated by voltage-sensitive, Ca2+-permeable channels. Combining the ideas of
Ca2+ as a chemical messenger and change in membrane as an initiator of Ca2+ influx
brings us to the essence of the advantages offered by voltage-gated Ca2+ channels (Tsien
& Barret, 2013). Ca2+ channels in the plasma membrane have an added advantage relative
to channels in intracellular membranes, in that they have access to the plasma membrane's
voltage potential, a global indicator of cellular activity. A rapid, voltage-dependent
Figure 3.21- Neuronal calcium (Ca2+) signaling toolkit. The Ca2+ transport proteins, the receptors of the
plasma membrane (PM), and the intracellular organelles, including mitochondria, endoplasmic reticulum
(ER), Golgi apparatus, and acidic organelles, are indicated. The mitochondrial Ca2+ handling systems
(proteins) are shown in greater detail in the bottom right inset. The top right inset shows a schematic view
of the pre-synaptic bouton and the post-synaptic termination. The legend on the bottom left indicates the
Ca2+ transporter proteins. VOC Voltage-gated Ca2+ channel, ROC receptor-operated Ca2+ channel, ORAI
the pore-forming subunit of store-operated Ca2+ entry channel (SOC), STIM the Ca2+ sensor, TPC two-pore
channel, ARC arachidonic acid-regulated Ca2+ channel, TRP transient receptor potential channel, PMCA
plasma membrane Ca2+ ATPase, V-ATPase vacuolar H+ ATPase, InsP3R inositol 1,4,5 tris–phosphate
receptors, RyR ryanodine receptor, NCX plasma membrane Na+/Ca2+ exchanger, SERCA sarco-
/endoplasmic reticulum Ca2+ ATPase, MCU mitochondrial Ca2+ uniporter, MICU mitochondrial Ca2+ uniporter regulator, NCLX mitochondrial Na+/Ca2+ exchanger, VDAC voltage-dependent anion channels,
MPTP mitochondrial permeability transition pore, AMPAR 2-amino-3-hydroxy-5-methyl-4-
isoxazolepropionic acid receptor, NMDAR N-methyl-d-aspartate receptor (Brini et al., 2014)

Influence of feeding cycle on ion channels/currents
67 PhD thesis - Bastos, AEP (2018)
closing of the channel allows for dissipation of the message by diffusion and strong, rapid
local buffering, thereby achieving spatio-temporally precise signaling (Tsien & Barret,
2013). Furthermore, signal transduction in different cell types involves different
molecular subtypes of voltage-gated Ca2+ channels (VGCC), which mediate voltage-
gated Ca2+ currents with different physiological, pharmacological, and regulatory
properties.
3.3.2 Voltage-gated Ca2+ channel - Diversity and classification schemes
Without Ca channels our nervous system would have no outputs (Hille, 2001).
VGCCs were first identified in the 1950s (Fatt & Katz, 1953). Since then, multiple types
of VGCCs have been measured directly in a variety of cell types from vertebrate and
invertebrate organisms. Their classification and nomenclature has been made according
to various schemes, based on electrophysiological, pharmacological and
biochemical/molecular observations.
Firstly, they were distinguished by their potential of activation, which enabled VGCC in
falling into two major categories: high voltage-activated (HVA) channels that open in
response to large membrane depolarizations (with a threshold positive to approximately
−30mV) and low voltage-activated (LVA) channels that only need a small depolarization
to be activated (threshold activation at a membrane voltage positive to −70 mV)
(Hagiwara et al., 1975; Llinas & Yarom, 1981; Carbone & Lux, 1984; Armstrong &
Matteson, 1985; Yaari et al., 1987).
Following the establishment of advanced technology, such as patch-clamp techniques,
the next stage of the classification resulted from the combination of phenomenological
parameters including biophysical and pharmacological properties. In what concerns the
investigation upon vertebrate neurones, the LVA channels were further classified as T
channels and the HVA channels were subdivided into two classes – L and N channels.
This common classification of neuronal Ca2+ channels was named by Tsien and
colleagues (Tsien et al., 1988), following their study on DRG neurones (see table 3.4).

Influence of feeding cycle on ion channels/currents
68 PhD thesis - Bastos, AEP (2018)
T channels are described as having fast current decays, with a small amplitude of single
channel conductance during a sustained depolarization (‘T’ stands for tiny conductance
and transient current). Due to their low threshold of activation, they are not seen when a
cell is maintained at depolarized holding potentials. L channels, the first HVA subtype
being biochemically purified and cloned (Curtis & Catterall, 1984), show large-single
channel conductance amplitude and slow kinetics of current decay during a sustained
depolarization (‘L’ stands for large and long-lasting). They can be recorded in isolation
from T-type currents by starting from depolarized holding potentials (Hille, 2001).
Pharmacologically, L-type channels are defined by their sensitivity to 1,4-
dihydropyridine (DHP) drugs, a wide class of drugs with either inhibitor (nifedipine,
nisoldipine, isradipine) or activator (Bay K 8644) action on the channel (Lipscombe,
2002; Helton, 2005). Novel calcium channels, insensitive to DHPs and with single-
channel conductance between those of T-type and L-type channels, were revealed in
experiments with neuronal cells (Nowycky et al., 1985; Carbone & Lux, 1987; Fox et al.,
1987a, 1987b). These channels were named N-type Ca2+ channels (N for neuronal). The
availability of blocking agents that target L- and N-type channels revealed other HVA
Table 3.4- types of voltage-gated Ca2+ channels in vertebrates. Electrophysiological and
pharmacological characteristics. Taken from (Hille, 2001)
Influence of feeding cycle on ion channels/currents
69 PhD thesis - Bastos, AEP (2018)
currents. It was shown that neuronal non-L-type channels could be further classified into
subtypes according to their sensitivity to peptide toxins isolated from cone snails and
spiders. The channel sensitive to ω-conotoxin GVIA, kept the name N-type channel,
whereas the channel sensitive to ω-Aga IVA toxin was named P/Q-type calcium channel
(P for Purkinje cells, where this channel was characterized (Llinas et al., 1989)). The
channels resistant to these toxins were named R-type calcium channel (R for resistant)
(Lacinová, n.d.). Except for their pharmacology, N-, P/Q-, and R-types of Ca2+ channels
seem functionally similar, disclosing variable degrees of inactivation (Fox et al., 1987a,
1987b) and modulation by G-protein-coupled receptors (Hille, 2001).
The original classification system of Ca2+ channels, which was expanded from the simple
LVA/ HVA dichotomy to encompass T-, L-, N-, P-/Q-, R-channels, was subsequently
found to be too restrictive to adequately describe all types of Ca2+ channels. The
nomenclature currently used for calcium channels terminology was proposed based on
molecular biological approaches, and specifically, on the amino acid and gene sequence
of the pore-forming α1 subunit (Cavα1) (Ertel et al., 2000) (Figure 3.22).
The pharmacological and electrophysiological diversity of calcium channels arises
primarily from the existence of multiple α1 subunits (Hofmann et al., 1994), encoded by
at least 10 distinct genes (Table 3.4 and Figure 3.22B), organized into three distinct
subtypes of VGCCs in animals- Cav1, Cav2, and Cav3 (Catterall et al., 2005b).
The Cav1 channel family encodes three different neuronal L-type channels (termed
Cav1.2, Cav1.3, and Cav1.4) plus a skeletal muscle-specific isoform, Cav1.1 (Simms &
Zamponi, 2014). In the mammalian brain, Cav1.2 and Cav1.3 are the predominant forms
of L-type Ca2+ channels. They are localized in the cell bodies and proximal dendrites,
both at presynaptic as well as postsynaptic locations (Lipscombe & Andrade, 2015).
Hippocampal function appears to depend more on Cav1.2, which, by promoting large
influx of Ca2+, initiates downstream protein kinase pathways that promote gene
transcription required for long-term synaptic plasticity (long-term potentiation)
(Westenbroek et al., 1990; Thibault & Landfield, 1996; Bowden et al., 2001; Striessnig
et al., 2015; Zamponi et al., 2015).
The Cav2 channel family includes three members (Cav2.1, Cav2.2, and Cav2.3) localized
at presynaptic terminals, dendrites and cell bodies (Westenbroek et al., 1992), mainly
responsible for the release of neurotransmitters, like glutamate, γ- aminobutyric acid

Influence of feeding cycle on ion channels/currents
70 PhD thesis - Bastos, AEP (2018)
(GABA), and acetylcholine. Through alternative splicing and assembly with specific
ancillary subunits, Cav2.1 gives rise to P- and Q-type channels. Cav2.2 encodes N-type
channels and Cav2.3 corresponds to R-type channels (Simms & Zamponi, 2014).
The Cav3 channels are represented by three subtypes (Cav3.1, Cav3.2, and Cav3.3), all T-
type calcium channels (Perez-reyes, 2003). They have been detected both on and near the
soma and at more distal dendritic sites of neurones throughout all brain regions, including
hippocampus. Cav3 families are mainly involved in triggering low-threshold spikes,
which in turn generates a burst of repetitive firing of action potentials mediated by Na+
channels (Perez-reyes, 2003).
3.3.3 Subunits of VGCCs - Structure
Studies based on biochemical and molecular analyses (Curtis & Catterall, 1984) provide
structural differences between HVA and LVA channels (Figure 3.22A). HVA channels
are hetero-multimeric protein complexes that are formed through the co-assembly of a
functional pore-forming Cavα1 subunit, plus ancillary Cavβ, Cavα2δ and Cavγ subunits,
whereas LVA channels appear to lack these ancillary subunits (Catterall, 2011). The
associated α2, β, γ, δ subunits have auxiliary functions, including the control of channel
expression and the modulation of current kinetics. The β subunits greatly enhance cell-
surface expression of the α1 subunits and shift their kinetics and voltage dependence
(Catterall, 2000b; Brini et al., 2014).
A B

Influence of feeding cycle on ion channels/currents
71 PhD thesis - Bastos, AEP (2018)
Figure 3.22- A) Subunit Composition and Transmembrane Topology of Voltage-Gated Calcium Channel
Subunits. HVA channels are heteromultimers comprised of a pore-forming Cavα1 subunit that co-
assembles with ancillary Cavβ, Cavα2δ, and possibly Cavγ subunits, plus calmodulin (CaM); LVA channels
on the other hand function as Cavα1 subunit monomers. The Cavα1 subunit is comprised of four major
transmembrane domains (I–IV) that are connected by cytoplasmic linkers. Each of these domains contains
six membrane-spanning helices, plus a re-entrant pore loop (shown in green). The fourth transmembrane
segment in each domain contains positively charged amino acids in every third position and forms the
voltage sensor. Key protein interaction sites with the Cavα1 subunits are indicated by numbers. Adapted
from (Simms & Zamponi, 2014). B) Evolutionary tree of all known VGCCs, considering just the amino acid
sequences of α1 subunits. An early evolutionary event separated the α1 subunits into LVA and HVA
channels, with less than 30% of sequence homology. A later evolutionary event divided HVA channels into
two subfamilies: L-type and neuronal types, with about 50% sequence homology. Individual members of
both subfamilies share more than 80% of sequence homology. Adapted from (Lacinová, n.d.).
The α1 subunit is a 190- to 250-kDa transmembrane protein composed by four repeat
domains (I–IV), each containing six transmembrane α helices (S1–S6), homologous to
those found in voltage-gated Na+ channels (Catterall, 2000a). The S4 segments of each
domain comprise some positively charged residues, serving as the voltage sensors for
activation, moving outward and rotating under the influence of the electric field and
initiating a conformational change that opens the pore. A re-entrant P loop motif between
S5 and S6 forms the pore lining of the VGCCs. Each of the P loop regions contains highly
conserved negatively charged amino acid residues (in the case of HVA channels, glutamic
acids) that cooperate to form a pore that is highly selective for permeant cations such as
calcium, barium, and strontium (Simms & Zamponi, 2014). The cytoplasmic linker
regions of the α1subunit contain sites that are substrates for phosphorylation and
interaction with regulatory proteins, and the intracellular carboxyl (C)-terminal region
contains a binding site for calmodulin (CaM), which mediates Ca2+-triggered inactivation
of the channel upon prolonged membrane depolarization (Hering et al., 2005; Dolphin,
2009; Catterall, 2011). All Ca2+ channels share these general structural features.
3.3.4 VGCC distribution in rat hippocampal CA1 neurones
Many of the properties of the Ca2+ channels recorded from hippocampal CA1 neurones –
single-channel conductance and pharmacological response - are reminiscent of those
reported for the multiple types of channels described first in peripheral neurones (Kay &
Wong, 1987; Ozawa et al., 1989; Takahashi et al., 1989; Fisher et al., 1990; Toselli &

Influence of feeding cycle on ion channels/currents
72 PhD thesis - Bastos, AEP (2018)
Taglietti, 1990; Kay, 1991; O´Dell & Alger, 1991; Thompson & Wong, 1991; Wong &
Stewart, 1992).
To date, at least 5 types of Ca2+ channels have been described in rat hippocampal CA1
neurones – T-, L-, N-, P-/Q- and R- channels (Takahashi et al., 1989; Toselli & Taglietti,
1990; Magee & Johnston, 1995a; Igelmund et al., 1996; Porter et al., 1997). The
subcellular distribution of these channels is one of the main factors that determines their
effectiveness in supporting different neuronal functions. The extensive dendritic
arborizations of CA1 pyramidal neurones results in tens of thousands of widely
distributed synaptic inputs, most of which are both physically and electrotonically distant
from the soma (Andersen et al., 2007). The integration of these synaptic inputs depends
to a considerable extent on the expression of voltage‐gated channels in different regions
of the neuronal membrane.
In rat hippocampal CA1 pyramidal neurones, the density of both low- and high-threshold
Ca2+ channels throughout the extent of longitudinal somatodendritic axis may be constant
(Magee & Johnston, 1995a, 1995b). However, substantial differences in the type of
channels can be found within the somatic and dendritic regions of these neurones, with a
trend for more HVA channels to be encountered in the soma and proximal dendrites and
more LVA channels to be detected in more distal dendrites (Figure 3.23).
L- and N-type channels are mainly found in the soma of CA1 neurones, which is
consistent with somatic patch-clamp recordings taken from CA1 neurones (Ozawa et al.,
1989; Takahashi et al., 1989; Fisher et al., 1990; Thompson & Wong, 1991) and with
antibody-binding imaging studies for L- and N-type Ca2+ channels, which indicated the
highest density of these channels in the somatodendritic compartment (Westenbroek et
al., 1990; Pravettoni et al., 2000; Bowden et al., 2001; Leitch et al., 2009). Nevertheless,
a lower expression level of L- and N- type channels is likely to be found at the distal
Figure 3.23- Schematic representation of the Ca2+ channel distribution in the soma and apical dendrites
of hippocampal CA1 neurones. Relative densities of different channel types are represented by font size.
Taken from Magee & Johnston (1995).

Influence of feeding cycle on ion channels/currents
73 PhD thesis - Bastos, AEP (2018)
regions of the apical dendrites. Although no data are available regarding the subtypes of
Ca2+ channels in CA1 axons, pharmacological studies of synaptic transmission and
presynaptic Ca2+ entry indicate that N-, P-, Q-, and R-type Ca2+ channels are most
abundant in other axon terminals of the hippocampus (Andersen et al., 2007).
On the other hand, T-type channels are primarily localized in the apical dendrites. At this
point, it is relevant to highlight that the expression of T-type channels in rat hippocampal
CA1 neurones undergoes changes during the developmental stages of the animals. In fact,
it has been established that T-type channels are mostly found on neurones isolated from
neonatal animals (O´Dell & Alger, 1991; Thompson & Wong, 1991; Campbell et al.,
1996; Kortekaas & Wadman, 1997; Porter et al., 1997; Ribeiro & Costa, 2000). One
possible explanation might be enclosed in a displacement of the expression of T-type
channels within the neuron, in the course of maturation. In CA1 pyramidal neurones of
very young animals, T-type channels might be distributed throughout the neuron and, as
the animal matures, these channels may become primarily localized to the dendritic
arborizations (Magee & Johnston, 1995a)

Influence of feeding cycle on ion channels/currents
74 PhD thesis - Bastos, AEP (2018)
3.3.5 Influence of feeding cycle on neuronal Ca2+ currents
Given the pivotal importance of voltage-gated Ca2+ channels outlined in the introductory
sections, the present section gains relevance as it focuses on the oscillations of the activity
of such channels throughout the feeding cycle.
3.3.5.1 Whole-cell voltage clamp recordings
Features of the currents
The present section comprises data concerning the influence of feeding cycle in the
characteristics of whole-cell voltage clamp Ca2+ currents of rat hippocampal CA1
neurones. Ca2+ currents were evoked with a step of depolarized voltages from -60mV up
to +30mV (increments of 10mV), following a conditioning pulse of -120mV to remove
inactivation. Holding potential was set at -70mV (Figure 3.24). With these protocol, both
high-voltage activated (HVA) and low-voltage activated (LVA) currents could be
recorded (Vreugdenhil & Wadman, 1992; Kortekaas & Wadman, 1997; Ribeiro & Costa,
2000).

Influence of feeding cycle on ion channels/currents
75 PhD thesis - Bastos, AEP (2018)
The records depicted in Figure 3.24 illustrate 3 types of currents, here termed currents
‘A’, ‘B’ and ‘C’ (or, alternatively, ‘A-, B-, C-type currents’) with distinct properties in
terms of kinetics of inactivation and a differential distribution between fed and fasted
neurones. Current ‘A’ was characterized by its slow kinetics, with a minimal contribution
of the transient component, and with a prominent slow-inactivating component (here
termed ‘sustained current’) at the end of the 600ms command pulse. Current ‘B’ had faster
kinetics, with the current decay better described by two components – fast and slow – and
a sustained current with smaller amplitude. Current ‘C’ had the fastest kinetics, with a
sharper decay of inactivation and a sustained current barely detected, envisaging a greater
proportion of the fast component in relation to the slow component. The sorting of these
currents was a result of visual examination, based on the characteristics described above.
In order to avoid biased results, any currents with ambiguous inactivation profiles were
labelled as being ‘B’-type currents.
The expression of these currents was found to be different between fed and fasted
neurones. Current A was present in both conditions, however more often in fed neurones:
10/20 recordings from fed neurones, as oppose to only 3/24 for fasted neurones. Current
B was evenly observed between the two conditions: 10/20 recordings assigned to fed
neurones and 14/24 assigned to fasted neurones. Finally, current C was only found in
fasted neurones, with 7 recordings registered (7/24).
Voltage dependence of activation
The existence of a sustained current, more prominent in the A-type current, prompted an
analysis of the voltage-dependence of both, the peak current and at the end of the 600ms
pulse, as a measure of the sustained current (Figure 3.25A).
Figure 3.24- Effect of feeding cycle over the calcium currents of acutely isolated rat CA1 hippocampal
neurones. Whole-cell voltage clamp Ca2+ currents, recorded in neurones from fed and fasted animals,
were evoked in series of depolarization command pulses (600ms in duration), in steps of 10mV, from -
60mV to +30mV, following a hyperpolarizing conditioning pulse at -120mV (300ms in duration). Holding
potential was set at -70mV (see inset). Traces are representative recordings of the 3 types of Ca2+ current
traces observed in fed (n=20) and fasted (n=24) neurones, here termed ‘A’, ‘B’ and ‘C’ (see description
in the text). The quantitative distribution of each type of current trace within both conditions is indicated.
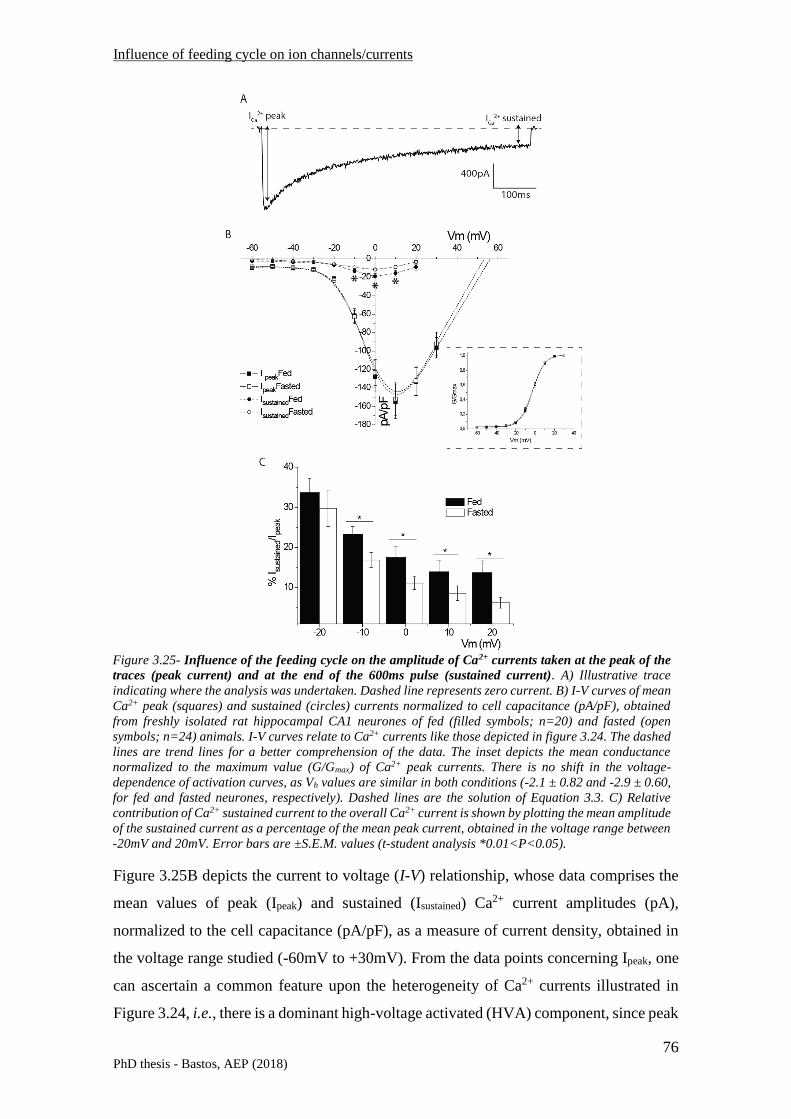
Influence of feeding cycle on ion channels/currents
76 PhD thesis - Bastos, AEP (2018)
Figure 3.25B depicts the current to voltage (I-V) relationship, whose data comprises the
mean values of peak (Ipeak) and sustained (Isustained) Ca2+ current amplitudes (pA),
normalized to the cell capacitance (pA/pF), as a measure of current density, obtained in
the voltage range studied (-60mV to +30mV). From the data points concerning Ipeak, one
can ascertain a common feature upon the heterogeneity of Ca2+ currents illustrated in
Figure 3.24, i.e., there is a dominant high-voltage activated (HVA) component, since peak
Figure 3.25- Influence of the feeding cycle on the amplitude of Ca2+ currents taken at the peak of the
traces (peak current) and at the end of the 600ms pulse (sustained current). A) Illustrative trace
indicating where the analysis was undertaken. Dashed line represents zero current. B) I-V curves of mean
Ca2+ peak (squares) and sustained (circles) currents normalized to cell capacitance (pA/pF), obtained
from freshly isolated rat hippocampal CA1 neurones of fed (filled symbols; n=20) and fasted (open
symbols; n=24) animals. I-V curves relate to Ca2+ currents like those depicted in figure 3.24. The dashed
lines are trend lines for a better comprehension of the data. The inset depicts the mean conductance
normalized to the maximum value (G/Gmax) of Ca2+ peak currents. There is no shift in the voltage-
dependence of activation curves, as Vh values are similar in both conditions (-2.1 ± 0.82 and -2.9 ± 0.60,
for fed and fasted neurones, respectively). Dashed lines are the solution of Equation 3.3. C) Relative
contribution of Ca2+ sustained current to the overall Ca2+ current is shown by plotting the mean amplitude
of the sustained current as a percentage of the mean peak current, obtained in the voltage range between
-20mV and 20mV. Error bars are ±S.E.M. values (t-student analysis *0.01<P<0.05).

Influence of feeding cycle on ion channels/currents
77 PhD thesis - Bastos, AEP (2018)
Ca2+ currents were activated with a threshold higher than -30 mV, with a mean maximum
amplitude attained around 10 mV, either for fed and fasted neurones.
The mean current density, taken at the peak of the traces, shows no differences between
fed and fasted neurones (-155.0 ± 18.27 pA/pF, n = 20, and -152.1 ± 17.53 pA/pF, n =
24, respectively). Peak current values were converted to conductance via the relationship
𝐺 = 𝐼 (𝑉𝑚 − 𝐸𝐶𝑎2+)⁄ where 𝑉𝑚 is the step command voltage and 𝐸𝐶𝑎2+ the reversal
potential estimated from the extrapolation of the rising phase of the I-V curves. The
voltage dependence of activation of peak current was studied normalizing G for its
maximal value (G/Gmax) and plotting the mean values against step command potential
(see inset Figure 2B). Data were fitted with equation 3.3 (Boltzmann distribution).
The average fitting parameters values of activation curves – Vh and Vs - are presented in
table 3.5. Vh values were as follows: -2.1 ± 0.82mV and -2.9 ± 0.60mV, for fed and fasted
neurones, respectively. Vs values were also similar in both conditions: 5.9 ± 0.17 mV/e-
fold and 6.3 ± 0.17 mV/e-fold, for fed and fasted neurones, respectively. The differences
registered are not significant (P > 0.05). These results support that feeding cycle does not
exert any influence on the voltage-dependence of activation of whole-cell Ca2+ currents.
Indeed, no shift and/or apparent deviation in the slope of the activation curves were
observed (inset of Figure 3.25B).
On the other hand, Isustained, also with an activation threshold around -30mV in both
conditions, depicted higher mean current density values in neurones from fed animals.
The maximum values, registered at 0mV, were -18.7 ± 2.92 pA/pF and -11.5 ± 1.50
pA/pF, for fed and fasted neurones, respectively. Differences are significant in the voltage
range from -10mV to 10mV (0.05 > P > 0.01). The relative contribution of sustained
current is illustrated by plotting the average of Isustained as a percentage of Ipeak, obtained in
the voltage range between -20mV and 20mV (figure 3.25C). Fed neurones showed
significantly larger values in the voltage range between -10mV and 20mV (0.05 > P >
0.01). At 0mV, the values were as follows: 17.5 ± 2.81% and 11.1 ± 1.57%, for fed and
fasted neurones, respectively. This is consistent with the higher abundance of current ‘A’
upon feeding.

Influence of feeding cycle on ion channels/currents
78 PhD thesis - Bastos, AEP (2018)
Voltage dependence of steady-state of inactivation (h∞)
The steady-state inactivation of the whole-cell current was measured using 1.5s
conditioning pulses to voltages between -120 and 0 mV with 10 mV increments, from a
holding potential of -70mV. The patch was then subjected to a 1s depolarising step to 0
mV to record the remaining current (Figure 3.26A).
Peak current values were normalized to the maximal response (I/Imax) and plotted against
conditioning pulses to obtain steady-state inactivation curves (Figure 3.26B). The results
showed a complex biphasic curve, well described by a sum of two sigmoids:
𝐼 𝐼𝑚𝑎𝑥 = [𝑎 1 + 𝑒[(𝑉ℎ1−𝑉𝑚/𝑉𝑠1)]⁄ ]⁄ + [(1 − 𝑎)/1 + 𝑒[(𝑉ℎ2−𝑉𝑚)/𝑉𝑠2]] (Equation 3.6),
Figure 3.26- Influence of feeding cycle on steady-state inactivation (h∞) of Ca2+ currents. Whole-cell
voltage clamp Ca2+ currents were evoked by a command step to 0 mV (1s) following a set of pre-pulses
(1.5s) ranging from −120 mV to 0 mV in steps of 10 mV; holding potential of −70 mV (inset). A) Records
were obtained in the command pulse from a neuron of a fed and fasted animal. B) Mean peak Ca2+ current
normalized to the maximum value (I/Imax) as a function of pre-pulse potentials, from neurones of fed (filled
squares; n=13) and fasted (open squares; n=16) animals. The steady-state inactivation curves (h∞) were
best fitted by a sum of sigmoids (equation 2) and the significant shift of the second component is expressed
in the Vh2 values: -36.9 ± 2.02mV and –42.99 ± 2.55mV, for fed and fasted neurones, respectively (t-student
analysis; 0,01<P<0,05). Error bars are ±S.E.M. values.
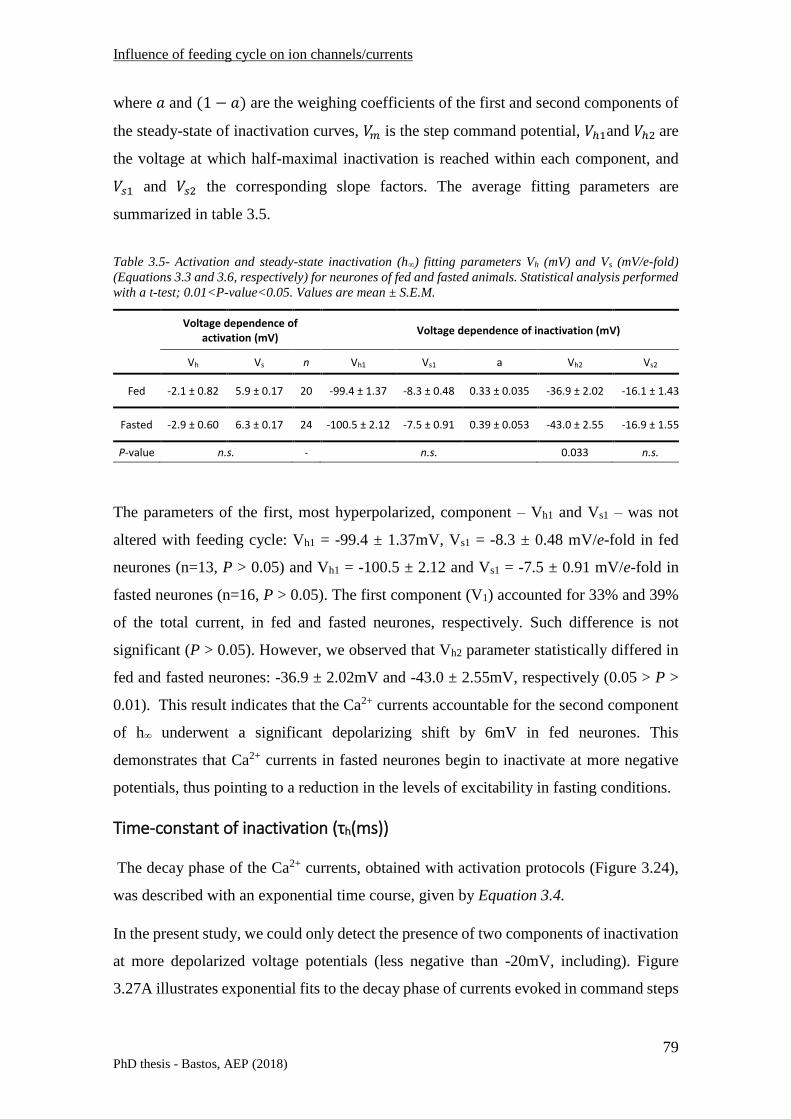
Influence of feeding cycle on ion channels/currents
79 PhD thesis - Bastos, AEP (2018)
where 𝑎 and (1 − 𝑎) are the weighing coefficients of the first and second components of
the steady-state of inactivation curves, 𝑉𝑚 is the step command potential, 𝑉ℎ1and 𝑉ℎ2 are
the voltage at which half-maximal inactivation is reached within each component, and
𝑉𝑠1 and 𝑉𝑠2 the corresponding slope factors. The average fitting parameters are
summarized in table 3.5.
The parameters of the first, most hyperpolarized, component – Vh1 and Vs1 – was not
altered with feeding cycle: Vh1 = -99.4 ± 1.37mV, Vs1 = -8.3 ± 0.48 mV/e-fold in fed
neurones (n=13, P > 0.05) and Vh1 = -100.5 ± 2.12 and Vs1 = -7.5 ± 0.91 mV/e-fold in
fasted neurones (n=16, P > 0.05). The first component (V1) accounted for 33% and 39%
of the total current, in fed and fasted neurones, respectively. Such difference is not
significant (P > 0.05). However, we observed that Vh2 parameter statistically differed in
fed and fasted neurones: -36.9 ± 2.02mV and -43.0 ± 2.55mV, respectively (0.05 > P >
0.01). This result indicates that the Ca2+ currents accountable for the second component
of h∞ underwent a significant depolarizing shift by 6mV in fed neurones. This
demonstrates that Ca2+ currents in fasted neurones begin to inactivate at more negative
potentials, thus pointing to a reduction in the levels of excitability in fasting conditions.
Time-constant of inactivation (τh(ms))
The decay phase of the Ca2+ currents, obtained with activation protocols (Figure 3.24),
was described with an exponential time course, given by Equation 3.4.
In the present study, we could only detect the presence of two components of inactivation
at more depolarized voltage potentials (less negative than -20mV, including). Figure
3.27A illustrates exponential fits to the decay phase of currents evoked in command steps
Voltage dependence of activation (mV)
Voltage dependence of inactivation (mV)
Vh Vs n Vh1 Vs1 a Vh2 Vs2 n
Fed -2.1 ± 0.82 5.9 ± 0.17 20 -99.4 ± 1.37 -8.3 ± 0.48 0.33 ± 0.035 -36.9 ± 2.02 -16.1 ± 1.43 13
Fasted -2.9 ± 0.60 6.3 ± 0.17 24 -100.5 ± 2.12 -7.5 ± 0.91 0.39 ± 0.053 -43.0 ± 2.55 -16.9 ± 1.55 16
P-value n.s. - n.s. 0.033 n.s. -
Table 3.5- Activation and steady-state inactivation (h∞) fitting parameters Vh (mV) and Vs (mV/e-fold)
(Equations 3.3 and 3.6, respectively) for neurones of fed and fasted animals. Statistical analysis performed
with a t-test; 0.01<P-value<0.05. Values are mean ± S.E.M.

Influence of feeding cycle on ion channels/currents
80 PhD thesis - Bastos, AEP (2018)
to -30, and -20 mV from -70 mV holding potential. At -30 mV, the current decayed
monoexponentially with a time constant of 153 ms; at -20 mV, the inactivating phase was
best described by two exponentials, with time constants of 42ms and 266ms.
The effect of feeding cycle over the voltage dependence of τh(ms) was addressed. The
mean values of 𝜏ℎ𝑓 and 𝜏ℎ𝑠, measured in activation protocols, are depicted in figures
3.27B and 3.27C, respectively.
The plot concerning the fast component (Figure 3.27B) demonstrates that 𝜏ℎ𝑓 was voltage
dependent in both fed and fasted neurones. Fed neurones showed slower values of 𝜏ℎ𝑓
nearly in all voltage range studied. At 0mV, we have obtained 46.6 ± 5.86ms (fed
neurones) and 32.3 ± 2.29ms (fasted neurones). The difference is significant at 0mV,
20mV and 30mV (0.05 > P > 0.01). 𝜏ℎ𝑠 (Figure 3.27C) shows that fed and fasted neurones
inactivated in a complex way, suggesting a combination of inactivation mechanisms
(Ribeiro & Costa, 2000). For voltage command steps more depolarized (from 0mV to
Figure 3.27- Effect of feeding cycle on the time-constant of inactivation (τh(ms)) of Ca2+ currents. A)
Illustration of fitting of the decay phase of Ca2+ currents evoked by an activation protocol. The
inactivation could be described by a single (-30mV command pulse) or a by double exponential (-20mV
command pulse), equation 3.4. B) and C) Voltage-dependence of the B) fast and C) slow components of
time-constant of inactivation (τhfast (ms) and τhslow (ms), respectively) measured in activation protocols, of
fed (filled squares) and fasted (open squares) animals. Error bars are ±S.E.M. (* t-test; 0.05 > P > 0.01).
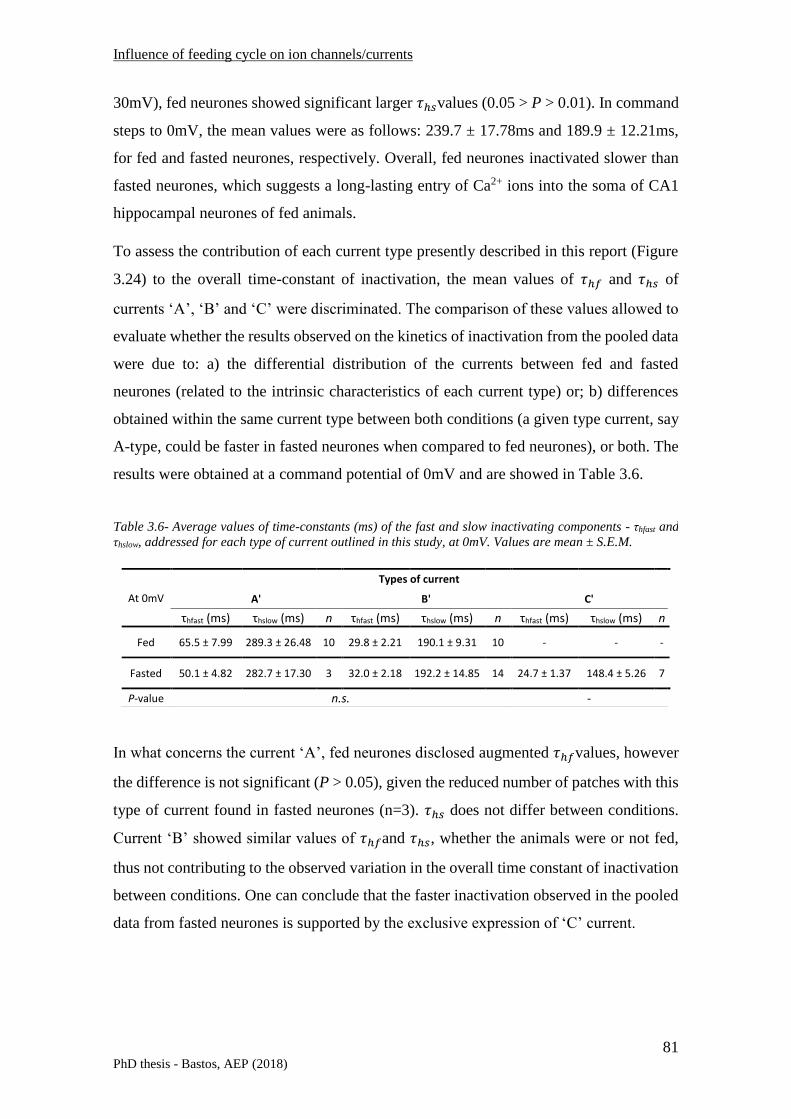
Influence of feeding cycle on ion channels/currents
81 PhD thesis - Bastos, AEP (2018)
30mV), fed neurones showed significant larger 𝜏ℎ𝑠values (0.05 > P > 0.01). In command
steps to 0mV, the mean values were as follows: 239.7 ± 17.78ms and 189.9 ± 12.21ms,
for fed and fasted neurones, respectively. Overall, fed neurones inactivated slower than
fasted neurones, which suggests a long-lasting entry of Ca2+ ions into the soma of CA1
hippocampal neurones of fed animals.
To assess the contribution of each current type presently described in this report (Figure
3.24) to the overall time-constant of inactivation, the mean values of 𝜏ℎ𝑓 and 𝜏ℎ𝑠 of
currents ‘A’, ‘B’ and ‘C’ were discriminated. The comparison of these values allowed to
evaluate whether the results observed on the kinetics of inactivation from the pooled data
were due to: a) the differential distribution of the currents between fed and fasted
neurones (related to the intrinsic characteristics of each current type) or; b) differences
obtained within the same current type between both conditions (a given type current, say
A-type, could be faster in fasted neurones when compared to fed neurones), or both. The
results were obtained at a command potential of 0mV and are showed in Table 3.6.
In what concerns the current ‘A’, fed neurones disclosed augmented 𝜏ℎ𝑓values, however
the difference is not significant (P > 0.05), given the reduced number of patches with this
type of current found in fasted neurones (n=3). 𝜏ℎ𝑠 does not differ between conditions.
Current ‘B’ showed similar values of 𝜏ℎ𝑓and 𝜏ℎ𝑠, whether the animals were or not fed,
thus not contributing to the observed variation in the overall time constant of inactivation
between conditions. One can conclude that the faster inactivation observed in the pooled
data from fasted neurones is supported by the exclusive expression of ‘C’ current.
At 0mV
Types of current
A' B' C'
τhfast (ms) τhslow (ms) n τhfast (ms) τhslow (ms) n τhfast (ms) τhslow (ms) n
Fed 65.5 ± 7.99 289.3 ± 26.48 10 29.8 ± 2.21 190.1 ± 9.31 10 - - -
Fasted 50.1 ± 4.82 282.7 ± 17.30 3 32.0 ± 2.18 192.2 ± 14.85 14 24.7 ± 1.37 148.4 ± 5.26 7
P-value n.s. -
Table 3.6- Average values of time-constants (ms) of the fast and slow inactivating components - τhfast and
τhslow, addressed for each type of current outlined in this study, at 0mV. Values are mean ± S.E.M.

Influence of feeding cycle on ion channels/currents
82 PhD thesis - Bastos, AEP (2018)
The differences observed in Ca2+ currents decay in both conditions can also be quantified
by the analysis of the coefficients of fast and slow inactivating components - afast and
aslow. Figure 3.28A depicts the voltage-dependence of the ratios calculated from the
coefficients in Equation 3.4 (𝑎𝑓/𝑎𝑠).
In the voltage range used, the fast component prevails over the slow component (ratio
greater than 1). In fasted neurones, 𝑎𝑓/𝑎𝑠 increased with depolarization, as a straight
Figure 3.28- Effect of feeding cycle on the coefficients of the inactivating components, afast and aslow.A)
Analysis of the voltage-dependence of the ratio af/as in fed (filled squares) and fasted (open squares)
neurones. Error bars are ±S.E.M. (* t-test; 0.05 > P > 0.01). B) Illustration of the influence of feeding
cycle on the inactivating components of Ca2+ currents. Typical examples of B-type current traces
recorded in fed and fasted neurones, obtained at 0mV. Currents were normalized to peak current values
for a better comprehension of the data. In the upper traces, the fitting was taken within the slow
component of the inactivation of Ca2+ current. The fast component (bottom traces) is obtained by
subtracting the slow traces to the overall current. In fasted neurones, a faster decay and a greater
amplitude of the fast component is observed.

Influence of feeding cycle on ion channels/currents
83 PhD thesis - Bastos, AEP (2018)
consequence of the major contribution of the fast component (Figure 3.28B). In fed
neurones, we observed a decrease in the ratio values, reaching a plateau level close to
unitary value between 0mV and 30mV, which can be explained by convergence of the
values registered for the coefficients of fast and slow components in such voltage range
(data not shown). At potentials more positive than 10 mV, the ratio 𝑎𝑓/𝑎𝑠 clearly differed
in fed and fasted neurones. At 10mV, the mean ratio values were: 1.1 ± 0.10 (fed
neurones) and 1.6 ± 0.18 (fasted neurones). The difference is statistically significant at
10mV and 30mV (0.05 > P > 0.01).
Figure 3.28B sets a graphical explanation of the effect of feeding cycle over the time-
constants and respective coefficients of inactivation. The traces revealed a sharper decay
and a greater amplitude of the fast component in the illustrated fasted neuron, as oppose
to a greater amplitude of the slow component in the fed neuron. This is consistent with
an overall faster inactivation obtained for neurones of fasting animals.

Influence of feeding cycle on ion channels/currents
84 PhD thesis - Bastos, AEP (2018)
3.3.5.2 Discussion
The present report addresses the influence of feeding cycle on the whole-cell Ca2+
currents of rat hippocampal CA1 neurones. Three types of high threshold voltage
activated (HVA) currents with different current decay properties were recorded. Fed
neurones expressed more prominently a slowly-inactivating (here defined as ‘sustained’)
current at the end of the 600ms pulse, whereas currents with the fastest kinetics were
mostly attributed to fasted neurones. This effect of feeding cycle upon the expression of
Ca2+ currents resulted in increased mean values of time-constants of inactivation (τh) upon
feeding. Additionally, a depolarizing shift in the second component of the steady-state
inactivation (h∞) curve was observed in fed neurones.
The distinct whole-cell currents were termed, for simplicity, ‘A’, ‘B’ and ‘C’. Current ‘B’
was found in both conditions, with a similar patch distribution in fed and fasted neurones:
50% and 58%, respectively. The main differences reported here were related to the
differential distribution of the remaining currents. Current ‘A’, characterized by the
presence of a conspicuous sustained current, was observed more often in neurones from
fed animals. This explains the significantly higher amplitude of the sustained current in
fed neurones (see figure 3.25B). In turn, current ‘C’, with the fastest current decay
kinetics, was only observed in fasted neurones.
The heterogeneity of Ca2+ currents observed here must be indicative of distinct molecular
identities at the surface of neuronal plasma membrane. Accordingly, the respective I-V
curves invariably disclosed an activation threshold at -30mV, which means that the
variation on the channel´s phenotype fits within the range of HVA channels (Tsien et al.,
1988; Bean, 1989; Snutch & Reiner, 1992; Catterall, 2000, 2011; Brini et al., 2014). The
absence of a low-threshold activated (LVA) current indicates we could not detect T-type
Ca2+ currents, which is in accordance with several reports on the effect of maturation over
the expression of Ca2+ currents (Fisher et al., 1990; Thompson & Wong, 1991; Campbell
et al., 1996; Thibault & Landfield, 1996; Kortekaas & Wadman, 1997; Porter et al., 1997;
Ribeiro & Costa, 2000). At the age of the animals used in this study (P21-P29),
hippocampal neurones consistently express Ca2+ currents with electrophysiological
properties similar to those in older animals (Lukyanetz et al., 2002), i.e., mostly HVA
and seldom LVA currents. It is established that rat hippocampal CA1 neurones express
all known types of HVA Ca2+ channels (L, N, P, Q and R; Ishibashi et al., 1998; Lenz et

Influence of feeding cycle on ion channels/currents
85 PhD thesis - Bastos, AEP (2018)
al., 1998), being the N- and L- type Ca2+ channels the most predominant categories,
mainly contributing to total HVA calcium current in CA1 hippocampal neurones (Fisher
et al., 1990; Westenbroek et al., 1990; Vreugdenhil & Wadman, 1992; Magee &
Johnston, 1995; Pravettoni et al., 2000; Bowden et al., 2001; Lukyanetz et al., 2002;
Leitch et al., 2009). In the present report, we did not pursuit a pharmacological approach,
nor presented additional single-channel data to distinguish between HVA Ca2+ currents.
However, we provide indications that infer about the phenotype of the Ca2+ channel
currents present in the plasma membrane of fed and fasted neurones, as being either N-
or L-type Ca2+ currents. The slowly-inactivating sustained currents, characteristic of the
‘A’-type currents outlined in this study, are typically described as being L-type current
(Nowycky et al., 1985; Takahashi et al., 1989; Catterall, 2000; Lipscombe, 2002; Helton,
2005), whereas the faster inactivating currents - ‘B’ and ‘C’ types - are likely to be linked
to the expression of mainly N-type channels (Nowycky et al., 1985; Tsien et al., 1988;
Plummer et al., 1989; Plummer & Peter, 1991; McNaughton & Randall, 1997).
In what the voltage dependence of inactivation is concerned, the experimental data points
of h∞ further supports a heterogeneous and differential distribution of Ca2+ channels in rat
hippocampal CA1 neurones during feeding cycle. Both h∞ curves were well fitted by
double Boltzmann functions, suggesting either that at least two distinct types of Ca2+
channels are recruited in the inactivation or that a single population of channels undergoes
multiple inactivation processes (Ribeiro & Costa, 2000; Lukyanetz et al., 2002). As we
recorded Ca2+ currents from the whole surface of the neurones, the results here depicted
must comply with the first hypothesis. Moreover, in fed neurones, Vh2 is significantly
shifted towards depolarized potentials, which is indicative of an increased involvement
of Ca2+ channels that inactivate with stronger depolarizations, another
electrophysiological feature of the L-type channels (Ozawa et al., 1989; Yasuda et al.,
2004; Catterall et al., 2005; Spafford et al., 2006). This result suggests a greater steady-
state availability of this type of channels in fed neurones, which is aligned with the major
fraction of patches recorded with current ‘A’ in neurones from fed animals (50%, 10 out
of 20 patches), in comparison to neurones of fasted animals (12.5%, 3 out of 24 patches).
The distinct profiles of the whole-cell currents can be quantified by the analysis of the
coefficients of fast and slow components of the time-constant of inactivation – afast and
aslow. The ratio afast/aslow showed significant higher values in fasted neurones, mostly due
to a larger contribution of afast, when compared to fed neurones. Our results also depicted

Influence of feeding cycle on ion channels/currents
86 PhD thesis - Bastos, AEP (2018)
an increased prevalence of aslow in fed neurones in relation to fasted neurones, which is
closely related to the presence of the Ca2+ sustained current. The illustration of the
proportions between afast and aslow in figure 3.28B helps to explain the slower mean values
of τhf and τhs observed in fed neurones (see figures 3.27B and 3.27C).
Given the gathered evidence, one can point out that the major contribution of the slowly-
inactivating, resembling L-type currents, will enable the entry of Ca2+ for a longer period
into the soma of fed neurones. On the other hand, the expression of a ‘C-type’ current has
the major contribution to the overall fastest kinetics of inactivation observed in fasted
neurones (see table 3.6 and figure 3.27).
In conclusion, the array of expression of Ca2+ currents in fed and fasted neurones might
be related to a variation in the Ca2+ channels´ phenotype, in the course of feeding cycle.
The predominant ‘A’-type current in fed neurones, in relation to fasted neurones,
anticipates larger entry of Ca2+ ions into the soma during membrane depolarizations,
which may determine significantly different physiological outputs during the feeding
cycle. Indeed, the greater intracellular Ca2+ dynamics envisaged in fed neurones may
reinforce the neuronal synaptic performance, given the vital role of Ca2+ on the signal
transduction processes directly involved on synaptic-dependent memory phenomena, like
Long-Term Potentiation (LTP) (Eccles, 1983; Voronin, 1983; Volianskis & Jensen, 2003;
Zamponi et al., 2015).
Thus, the indication of a larger Ca2+ influx through voltage-gated channels, brought up
by 1) an abundance of a Ca2+-sustained current and 2) the depolarizing shift of Vh2
observed in the h∞ curves, might concur to higher rate of synaptic plasticity events in fed
neurones. Such outcome would endorse the role of hippocampus in inhibiting meal onset
during the post-prandial period, due to the formation of episodic-meal related memories,
as established by other authors (Higgs, 2002, 2008; Parent, 2016). The dynamics of
voltage gated Ca2+ channels observed during the feeding cycle must be related with
molecular mechanisms by which hippocampus integrates information to ensure energy
homeostasis.

Influence of feeding cycle on ion channels/currents
87 PhD thesis - Bastos, AEP (2018)
3.4 References
Afonso RA, Fernandes AB, Santos C, Ligeiro D, Ribeiro RT, Lima IS, Patarrao RS,
Videira PA, Caldeira J & Macedo MP (2012). Postprandial Insulin Resistance in
Zucker Diabetic Fatty Rats is Associated with Parasympathetic-Nitric Oxide Axis
Deficiencies. J Neuroendocrinol 24, 1346–1355.
Almers W (1978). Gating currents and charge movements in excitable membranes. Rev
Physiol Biochem Pharmacol 82, 96–190.
Andersen P, Morris R, Amaral D, Bliss T & O`Keefe J (2007). The Hippocampus Book.
Oxford University Press, Mew York.
Armstrong CM & Bezanilla F (1973). Currents related to movement of the gating
particles of the sodium channels. Nature 242, 459–461.
Armstrong CM & Bezanilla F (1977a). Inactivation of the sodium channel. II. Gating
current experiments. J Gen Physiol 70, 567–590.
Armstrong CM & Bezanilla F (1977b). Inactivation of the sodium channel. II. Gating
current experiments. J Gen Physiol 70, 567–590.
Bean BP (1989). Classes of Calcium Channels in Vertebrate Cells. Annu Rev Physiol
51, 367–384.
Bezanilla F (1977). Inactivation o f the S o d i u m C h a n n e l I . Sodium Current
Experiments. 70, 549–566.
Bezanilla F (2000). The voltage sensor in voltage-dependent ion channels. Physiol Rev
80, 555–592.
Bezanilla F & Armstrong CM (1977). Inactivation of the sodium channel. I. Sodium
current experiments. J Gen Physiol 70, 549–566.
Bliss T V & Collingridge GL (1993). A synaptic model of memory: long-term
potentiation in the hippocampus. Nature 361, 31–39.
Bowden SEH, Fletcher S, Loane DJ & Marrion N V (2001). Somatic Colocalization of
Rat SK1 and D class ( Cav1.2 ) L-type Calcium Channels in Rat CA1
Hippocampal Pyramidal Neurones. J Neurosci 21, 1–6.
Brini M, Calì T, Ottolini D & Carafoli E (2014). Neuronal calcium signaling: Function
and dysfunction. Cell Mol Life Sci 71, 2787–2814.
Bruehl C & Witte OW (2003). Relation Between Bicarbonate Concentration and
Voltage Dependence of Sodium Currents in Freshly Isolated CA1 Neurones of the
Rat. J Neurophysiol.

Influence of feeding cycle on ion channels/currents
88 PhD thesis - Bastos, AEP (2018)
Campbell LW, Hao S-YY, Thibault O, Blalock EM & Landfield PW (1996). Aging
changes in voltage-gated calcium currents in hippocampal CA1 neurones. J
Neurosci 16, 6286–6295.
Carbone E & Lux HD (1987). Kinetics and selectivity of a low-voltage-activated
calcium current in chick and rat sensory neurones. J Physiol 386, 547–570.
Catterall WA (1992). Cellular and molecular biology of voltage-gated sodium channels.
Physiol Rev 72, S15-48.
Catterall WA (2000a). From ionic currents to molecular mechanisms: the structure and
function of voltage-gated sodium channels. Neuron 26, 13–25.
Catterall WA (2011). Voltage-Gated Calcium Channels. Cold Spring Harb Perspect
Biol; DOI: 10.1016/B978-0-323-44733-1.00002-X.
Catterall W a (2000b). Structure and Regulation of Voltage-Gated Ca2+ Channels.
Annu Rev Cell Dev Biol 16, 555.
Catterall W a, Goldin AL & Waxman SG (2005a). International Union of
Pharmacology. XLVII. Nomenclature and structure-function relationships of
voltage-gated sodium channels. Pharmacol Rev 57, 397–409.
Catterall W a, Perez-Reyes E, Snutch TP & Striessnig J (2005b). International Union of
Pharmacology. XLVIII. Nomenclature and structure-function relationships of
voltage-gated calcium channels. Pharmacol Rev 57, 411–425.
Catterall WA, Morrow CS & Hartshorne RP (1979). Neurotoxin binding to receptor
sites associated with voltage-sensitive sodium channels in intact, lysed, and
detergent-solubilized brain membranes. J Biol Chem 254, 11379–11387.
Chad JE, Stanford I, Wheal HV, Williamson R & Woodhall G (1991). Dissociated
neurones from adult rat hippocampus. In Cellular neurobiology: a practical
approach, ed. Chad J & Wheal H, pp. 19–37. Oxford University Press, Oxford.
Chong HL & Ruben PC (2008). Interaction between voltage-gated sodium channels and
the neurotoxin, tetrodotoxin. Channels 2, 407–412.
Clapham DE (2007). Calcium Signaling. Cell 131, 1047–1058.
Costa PF (1996). The kinetic parameters of sodium currents in maturing acutely isolated
rat hippocampal CA1 neurones. Brain Res Dev Brain Res 91, 29–40.
Costa PF, Santos AI & Ribeiro MA (1994). Potassium currents in acutely isolated
maturing rat hippocampal CA1 neurones. Dev Brain Res 83, 216–223.
Curtis BM & Catterall WA (1984). Purification of the Calcium Antagonist Receptor of
the Voltage-Sensitive Calcium Channel from Skeletal Muscle Transverse Tubules.

Influence of feeding cycle on ion channels/currents
89 PhD thesis - Bastos, AEP (2018)
Biochemistry 23, 2113–2118.
Dart C (2010). Lipid microdomains and the regulation of ion channel function. J
Physiol 588, 3169–3178.
Davidson T, Kanoski S, Walls E & Jarrard L (2005). Memory inhibition and energy
regulation. Physiol Behav 86, 731–746.
Davidson TL, Chan K, Jarrard LE, Kanoski SE, Clegg DJ & Benoit SC (2009).
Contributions of the Hippocampus and Medial Prefrontal Cortex to Energy and
Body Weight Regulation. Hippocampus 19, 235–252.
Dolphin AC (2009). Calcium channel diversity: multiple roles of calcium channel
subunits. Curr Opin Neurobiol 19, 237–244.
Eccles JC (1983). Calcium in long-term potentiation as a model for memory.
Neuroscience 10, 1071–1081.
Eijkelkamp N, Linley JE, Baker MD, Minett MS, Cregg R, Werdehausen R, Rugiero F
& Wood JN (2012). Neurological perspectives on voltage-gated sodium channels.
Brain 135, 2585–2612.
Ertel EA, Campbell KP, Harpold MM, Hofmann F, Mori Y, Perez-Reyes E, Schwartz
A, Snutch TP, Tanabe T, Birnbaumer L, Tsien RW & Catterall WA (2000).
Nomenclature of Voltage-Gated Calcium Channels. Neuron 25, 533–535.
Fatt P & Katz B (1953). The electrical properties of crustacean muscle fibres. J Physiol
120, 171–204.
Fernandes J (2002). Single channel sodium currents in rat CA1 neurones at two stages
of maturation: two kinetically distinct channels (thesis). Nova Medical School.
Fernandes J, Marvão P, Santos a I & Costa PF (2001). Sodium channel currents in
maturing acutely isolated rat hippocampal CA1 neurones. Brain Res Dev Brain Res
132, 159–174.
Fisher RE, Gray R & Johnston D (1990). Properties and distribution of single voltage-
gated calcium channels in adult hippocampal neurones. JNeurophysiol 64, 91–104.
Fox AP, Nowycky MC & Tsien RW (1987a). Single‐channel recordings of three types
of calcium channels in chick sensory neurones. J Physiol 394, 173–200.
Fox AP, Nowycky MC & Tsien RW (1987b). Kinetic and pharmacological properties
distinguishing three types of calcium currents in chick sensory neurones. J Physiol
394, 149–172.
French CR, Sah P, Bucketr KJ, Gage PW & Curtin J (1990). A Voltage-dependent
Persistent Sodium Current in Mammalian Hippocampal Neurones. J Gen Physiol

Influence of feeding cycle on ion channels/currents
90 PhD thesis - Bastos, AEP (2018)
0, 1139–1157.
Gleichmann M & Mattson MP (2011). Neuronal Calcium Homeostasis and
Dysregulation. Antioxid Redox Signal 14, 1261–1273.
Goldin AL (1999). Diversity of mammalian voltage-gated sodium channels. Ann N Y
Acad Sci 868, 38–50.
Goldin AL (2003a). Mechanisms of sodium channel inactivation. Curr Opin Neurobiol
13, 284–290.
Goldin AL (2003b). Mechanisms of sodium channel inactivation. Curr Opin Neurobiol
13, 284–290.
Gong B, Rhodes KJ, Bekele-Arcuri Z & Trimmer JS (1999). Type I and type II Na(+)
channel alpha-subunit polypeptides exhibit distinct spatial and temporal patterning,
and association with auxiliary subunits in rat brain. J Comp Neurol 412, 342–352.
Gordon D, Merrick D, Auld V, Dunn R, Goldin AL, Davidson N & Catterall WA
(1987). Tissue-specific expression of the RI and RII sodium channel subtypes.
Proc Natl Acad Sci U S A 84, 8682–8686.
Grubb MS, Shu Y, Kuba H, Rasband MN, Wimmer VC & Bender KJ (2011). Short-
and Long-Term Plasticity at the Axon Initial Segment. J Neurosci 31, 16049–
16055.
Hagiwara S, Ozawa S & Sand O (1975). Voltage clamp analysis of two inward current
mechanisms in the egg cell membrane of a starfish. J Gen Physiol 65, 617–644.
Hamill OP, Marty A, Neher E, Sakmann B & Sigworth FJ (1981). Improved patch-
clamp techniques for high-resolution current recording from cells and cell-free
membrane patches. Pflugers Arch Eur J Physiol 391, 85–100.
Hannapel RC, Henderson YH, Nalloor R, Vazdarjanova A & Parent MB (2017).
Ventral hippocampal neurones inhibit postprandial energy intake. Hippocampus
27, 274–284.
Hebben N, Corkin S, Eichenbaum H & Shedlack K (1985). Diminished ability to
interpret and report internal states after bilateral medial temporal resection: case
H.M. Behav Neurosci 99, 1031–1039.
Helton TD (2005). Neuronal L-Type Calcium Channels Open Quickly and Are
Inhibited Slowly. J Neurosci 25, 10247–10251.
Henderson YO, Nalloor R, Vazdarjanova A & Parent MB (2016). Sweet orosensation
induces Arc expression in dorsal hippocampal CA1 neurones in an Experience-
dependent manner. Hippocampus 26, 405–413.

Influence of feeding cycle on ion channels/currents
91 PhD thesis - Bastos, AEP (2018)
Henderson YO, Smith GP & Parent MB (2013). Hippocampal neurones inhibit meal
onset. Hippocampus 23, 100–107.
Hering S, Sokolov S, Berjukow S, Marksteiner R, Margreiter E & Timin EN (2005).
Calcium Channel Block and Inactivation. Voltage-Gated Calcium Channels281–
293.
Higgs S (2002). Memory for recent eating and its influence on subsequent food intake.
Appetite 39, 159–166.
Higgs S (2008). Cognitive influences on food intake: The effects of manipulating
memory for recent eating. Physiol Behav 94, 734–739.
Hille B (2001). Ion Channels of Excitable Membranes, Third. Sinauer Associates, Inc.
Hirschberg B, Rovner A, Lieberman M & Patlak J (1995). Transfer of twelve charges is
needed to open skeletal muscle Na+ channels. J Gen Physiol 106, 1053–1068.
Hodgkin AL & Huxley AF (1952a). Currents carried by sodium and potassium ions
through the membrane of the giant axon of Loligo. J Physiol 116, 449–472.
Hodgkin AL & Huxley AF (1952b). The dual effect of membrane potential on sodium
cinductance in the giant axon of Loligo. J Physiol 116, 497–506.
Hodgkin AL & Huxley AF (1952c). A quantitative description of membrane current and
its application to conduction and excitation in nerve. J Physiol 117, 500–544.
Hodgkin AL, Huxley AF & Katz B (1952). Measurement of current-voltage relations in
the membrane of the giant axon of Loligo. J Physiol 116, 424–448.
Hodgkin AL & Huxley A.F. (1952). The Components of Membrane Counductance in
the Giant Axon of Loligo. J Physiol 116, 473–496.
Hofmann F, Biel M & Flockerzi V (1994). Molecular basis for Ca2+ channel diversity.
Annu Rev Neurosci 17, 399–418.
Hsu TM, Hahn JD, Konanur VR, Noble EE, Suarez AN, Thai J, Nakamoto EM &
Kanoski SE (2015). Hippocampus ghrelin signaling mediates appetite through
lateral hypothalamic orexin pathways. Elife 4, 1–20.
Hu W, Tian C, Li T, Yang M, Hou H & Shu Y (2009). Distinct contributions of Nav1.6
and Nav1.2 in action potential initiation and backpropagation. Nat Neurosci 12,
996–1002.
Huang H, Priori SG, Napolitano C, O’Leary ME & Chahine M (2011). Y1767C, a novel
SCN5A mutation, induces a persistent Na+ current and potentiates ranolazine
inhibition of Nav1.5 channels. AJP Hear Circ Physiol 300, H288–H299.
Igelmund P, Zhao YQ & Heinemann U (1996). Effects of T-type, L-type, N-type, P-

Influence of feeding cycle on ion channels/currents
92 PhD thesis - Bastos, AEP (2018)
type, and Q-type calcium channel blockers on stimulus-induced pre- and
postsynaptic calcium fluxes in rat hippocampal slices. Exp brain Res 109, 22–32.
Ishibashi H, Murai Y & Akaike N (1998). Effect of nilvadipine on the voltage-
dependent Ca2+ channels in rat hippocampal CA1 pyramidal neurones. Brain
Res121–127.
Isom LL (2001). Sodium Channel β Subunits: Anything but Auxiliary. Neurosci 7, 42–
54.
Jacka FN, Cherbuin N, Anstey KJ, Sachdev P & Butterworth P (2015). Western diet is
associated with a smaller hippocampus: a longitudinal investigation. BMC Med 13,
215.
Jiang Q-X & Gonen T (2012). The influence of lipids on voltage-gated ion channels.
Curr Opin Struct Biol 22, 529–536.
Kasimova MA, Tarek M, Shaytan AK, Shaitan K V. & Delemotte L (2014). Voltage-
gated ion channel modulation by lipids: Insights from molecular dynamics
simulations. Biochim Biophys Acta - Biomembr 1838, 1322–1331.
Kay AR (1991). Inactivation Kinetics of Calcium Current of acutely dissociated CA1
pyramidal cells of the mature guinea-pig hippocampus. J Physiol 437, 27–48.
Kay AR & Wong RKS (1986). Isolation of neurones suitable for patch-clamping from
adult mammalian central nervous systems. J Neurosci Methods 16, 227–238.
Kay AR & Wong RKS (1987). Calcium current activation kinetics in isolated pyramidal
neurones of the CAl region of the mature guinea-pig hippocampus. J Physiol 392,
603–616.
Ketelaars SO., Gorter J., van Vliet E., Lopes da Silva F. & Wadman W. (2001a).
Sodium currents in isolated rat CA1 pyramidal and dentate granule neurones in the
post-status epilepticus model of epilepsy. Neuroscience 105, 109–120.
Ketelaars SOM, Gorter JA, Van Vliet EA, Lopes da Silva FH & Wadman WJ (2001b).
Sodium currents in isolated rat CA1 pyramidal and dentate granule neurones in the
post-status epilepticus model of epilepsy. Neuroscience 105, 109–120.
Kontis KJ & Goldin AL (1997). Sodium channel inactivation is altered by substitution
of voltage sensor positive charges. J Gen Physiol 110, 403–413.
Kortekaas P & Wadman WJ (1997). Development of HVA and LVA calcium currents
in pyramidal CA1 neurones in the hippocampus of the rat. Dev Brain Res 101,
139–147.
Kühn FJ & Greeff NG (1999). Movement of voltage sensor S4 in domain 4 is tightly

Influence of feeding cycle on ion channels/currents
93 PhD thesis - Bastos, AEP (2018)
coupled to sodium channel fast inactivation and gating charge immobilization. J
Gen Physiol 114, 167–183.
Lacinová L (n.d.). Voltage-dependent calcium channels (thesis).
Lehmann-Horn F & Jurkat-Rott K (2003). Nanotechnology for neuronal ion channels. J
Neurol Neurosurg Psychiatry 74, 1466–1475.
Leitch B, Szostek A, Lin R & Shevtsova O (2009). Subcellular distribution of L-type
calcium channel subtypes in rat hippocampal neurones. Neuroscience 164, 641–
657.
Leterrier C, Brachet A, Fache MP & Dargent B (2010). Voltage-gated sodium channel
organization in neurones: Protein interactions and trafficking pathways. Neurosci
Lett 486, 92–100.
Lipscombe D (2002). L-Type Calcium Channels. Highs and New Lows. Circ Res 90,
933–935.
Lipscombe D & Andrade A (2015). Calcium Channel CaVα1 Splice Isoforms - Tissue
Specificity and Drug Action. Curr Mol Pharmacol 8, 22–31.
Llinas BYR & Yarom Y (1981). Electrophysiology of mammalian inferior olivary
neurones in vitro. Different types of voltage-dependent ionic conductances. J
Physiol 315, 549–567.
Llinas R, Sugimori M, Lin JW & Cherksey B (1989). Blocking and isolation of a
calcium channel from neurones in mammals and cephalopods utilizing a toxin
fraction (FTX) from funnel-web spider poison. Proc Natl Acad Sci 86, 1689–1693.
Lukyanetz EA, Shkryl VM & Kostyuk PG (2002). Selective blockade of N-type
calcium channels by levetiracetam. Epilepsia 43, 9–18.
Madison D V & Edson EB (2001). Preparation of hippocampal brain slices. Curr
Protoc Neurosci Chapter 6, Unit 6.4.
Magee JC & Johnston D (1995a). Characterization of single voltage-gated Na+ and
Ca2+ channels in apical dendrites of rat CA1 pyramidal neurones. J Physiol 487,
67–90.
Magee JC & Johnston D (1995b). Synaptic Activation of Voltage-Gated Channels in the
Dendrites of Hippocampal Pyramidal Neurones. Science (80- ) 268, 301–304.
Marban E, Yamagishi T & Tomaselli GF (1998). Structure and function of voltage-
gated sodium channels. J Physiol647–657.
McNaughton NCL & Randall AD (1997). Electrophysiological properties of the human
N-type Ca2+ channel: I. Channel gating in Ca2+ Ba2+ and Sr2+ containing

Influence of feeding cycle on ion channels/currents
94 PhD thesis - Bastos, AEP (2018)
solutions. Neuropharmacology 36, 895–915.
Mickus T, Jung HY & Spruston N (1999a). Properties of slow, cumulative sodium
channel inactivation in rat hippocampal CA1 pyramidal neurones. Biophys J 76,
846–860.
Mickus T, Jung HY & Spruston N (1999b). Slow sodium channel inactivation in CA1
pyramidal cells. Ann N Y Acad Sci 868, 97–101.
Nguyen HM & Goldin AL (2010). Sodium channel carboxyl-terminal residue regulates
fast inactivation. J Biol Chem 285, 9077–9089.
Nowycky MC, Fox AP & Tsien RW (1985). Three types of neuronal calcium channel
with different calcium agonist sensitivity. Nature 316, 440–443.
O’Leary ME, Chen LQ, Kallen RG & Horn R (1995). A molecular link between
activation and inactivation of sodium channels. J Gen Physiol 106, 641–658.
O´Dell TJ & Alger BE (1991). Single calcium channels in rat and guinea-pig
hippocampal neurones. J Physiol 436, 739–767.
Ogden D ed. (1994). Microelectrode techniques: the Plymouth Workshop handbook,
2nd edn. The Company of Biologists.
Ozawa S, Tsuzuki K, Iino M, Ogura A & Kudo Y (1989). Three types of voltage-
dependent calcium current in cultured rat hippocampal neurones. Brain Res 495,
329–336.
Palou A, Remesar X, Arola L, Herrera E & Alemany M (1981). Metabolic effects of
short term food deprivation in the rat. Horm Metab Res 13, 326–330.
Parent MB (2016). Cognitive control of meal onset and meal size: Role of dorsal
hippocampal-dependent episodic memory. Physiol Behav 162, 112–119.
Parent MB, Darling JN & Henderson YO (2014). Remembering to eat: hippocampal
regulation of meal onset. Am J Physiol Regul Integr Comp Physiol 306, R701–
R713.
Patlak J & Horn R (1982). Effect of N-bromoacetamide on single sodium channel
currents in excised membrane patches. J Gen Physiol 79, 333–351.
Perez-reyes E (2003). Molecular Physiology of Low-Voltage-Activated T-type Calcium
Channels. Physiol Rev 83, 117–161.
Plummer MR, Logothetis DE & Hess P (1989). Elementary Properties and
Pharmacological Sensitivities of Calcium Channels in Mammalian Peripheral
Neurones. Neuron 2, 1453–1463.
Plummer MR & Peter H (1991). Reversible uncoupling of inactivation in N-type

Influence of feeding cycle on ion channels/currents
95 PhD thesis - Bastos, AEP (2018)
calcium channels. Nature 351, 657–659.
Porter NM, Thibault O, Thibault V, Chen KC & Landfield PW (1997). Calcium channel
density and hippocampal cell death with age in long-term culture. J Neurosci 17,
5629–5639.
Poveda JA, Giudici AM, Renart ML, Molina ML, Montoya E & Encinar JA (2014).
Lipid modulation of ion channels through specific binding sites. BBA - Biomembr
1838, 1560–1567.
Poveda JA, Marcela Giudici A, Lourdes Renart M, Morales A & González-Ros JM
(2017). Towards understanding the molecular basis of ion channel modulation by
lipids: Mechanistic models and current paradigms. Biochim Biophys Acta -
Biomembr 1859, 1507–1516.
Pravettoni E, Bacci A, Coco S, Forbicini P, Matteoli M & Verderio C (2000). Different
localizations and functions of L-type and N-type calcium channels during
development of hippocampal neurones. Dev Biol 227, 581–594.
Qiao X, Werkman TR, Gorter JA, Wadman WJ & Vliet EA Van (2013). Expression of
sodium channel alpha subunits 1.1, 1.2 and 1.6 in rat hippocampus after kainic
acid-induced epilepsy. Epilepsy Res 106, 1–12.
Ribeiro MA & Costa PF (2000). Kinetic parameters of calcium currents in maturing
acutely isolated CA1 cells. Dev Brain Res 124, 11–23.
Robert Guy H & Conti F (1990). Pursuing the structure and function of voltage-gated
channels. Trends Neurosci 13, 201–206.
Sah P, Gibb AJ & Gage PW (1988). The sodium current underlying action potentials in
guinea pig hippocampal CAI neurones. J Gen Physiol 91, 373–398.
Sakmann B & Neher E eds. (1995). Single-channel recording, Second. Plenum Press,
New York.
Sakmann B & Stuart G (1995). Patch-pipette recordings from the soma, dendrites, and
axon of neurones in brain. In Single-channel recording, ed. Sakmann B & Neher E,
pp. 199–211. Plenum Press, New York.
Schwartzkroin PA (1981). To slice or not to slice. In Electrophysiology of isolated
mammalian CNS preparations, ed. Kerkut GA & Wheal HV. Academic Press,
London.
Simms BA & Zamponi GW (2014). Neuronal voltage-gated calcium channels:
Structure, function, and dysfunction. Neuron 82, 24–45.
Snutch TP & Reiner PB (1992). Ca2+ channels: diversity of form and function. Curr
Influence of feeding cycle on ion channels/currents
96 PhD thesis - Bastos, AEP (2018)
Opin Neurobiol 2, 247–253.
Spruston N (2008). Pyramidal neurones: Dendritic structure and synaptic integration.
Nat Rev Neurosci 9, 206–221.
Stanton PK (1996). LTD, LTP, and the sliding threshold for long-term synaptic
plasticity. Hippocampus 6, 35–42.
Stühmer W, Conti F, Suzuki H, Wang XD, Noda M, Yahagi N, Kubo H & Numa S
(1989). Structural parts involved in activation and inactivation of the sodium
channel. Nature 339, 597–603.
Sun GY, Huang HM, Kelleher JA, Stubbs EB & Sun AY (1988). Marker enzymes,
phospholipids and acyl group composition of a somal plasma membrane fraction
isolated from rat cerebral cortex: a comparison with microsomes and synaptic
plasma membranes. Neurochem Int 12, 69–77.
Takahashi K, Wakamori M & Akaike N (1989). Hippocampal CA1 pyramidal cells of
rats have four voltage-dependent calcium channels. Neurosci Lett 104, 229–234.
Taylor CP (1993). Na+ Currents that fail to inactivate. Trends Neurosci 664, 455–460.
Thibault O & Landfield PW (1996). Increase in Single L-Type Calcium Channels in
Hippocampal Neurones During Aging. Science (80- ) 272, 1017–1020.
Thompson SM & Wong RKS (1991). Development of calcium current subtypes in
isolated rat hippocampal pyramidal cells. J Physiol 439, 671–689.
Toselli M & Taglietti V (1990). Pharmacological Characterization of Voltage-
Dependent Calcium Currents in Rat Hippocampal Neurones. NeurosciLett 112,
70–75.
Tsien RW & Barret CF (2013). A Brief History of Calcium Channel Discovery.
Madame Curie Biosci Database - NCBI Bookshelf.
Tsien RW, Lipscombe D, Madison DV, Bley KR & Fox AP (1988). Multiple types of
neuronal calcium channels and their selective modulation. Trends Neurosci 11,
431–438.
Ulbricht W (2005). Sodium Channel Inactivation: Molecular Determinants and
Modulation. Physiol Rev 85, 1271–1301.
Vacher H, Mohapatra DP & Trimmer JS (2008). Localization and Targeting of Voltage-
Dependent Ion Channels in Mammalian Central Neurones. Physiol Rev 88, 1407–
1447.
Vanoye CG, Lossin C, Rhodes TH & George AL (2006). Single-channel Properties of
Human Na V 1.1 and Mechanism of Channel Dysfunction in SCN1A -associated

Influence of feeding cycle on ion channels/currents
97 PhD thesis - Bastos, AEP (2018)
Epilepsy. J Gen Physiol J Gen Physiol 0, 1–14.
Vedantham V & Cannon SC (1998). Slow inactivation does not affect movement of the
fast inactivation gate in voltage-gated Na+ channels. J Gen Physiol 111, 83–93.
Vilin YY & Ruben PC (2001). Slow Inactivation in Voltage-Gated Sodium Channels:
Molecular Substrates and Contributions to Channelopathies. Cell Biochem Biophys
35, 171–190.
Voronin LL (1983). Long-term potentiation in the hippocampus. Neuroscience 10,
1051–1069.
Vreugdenhil M, Faas GC & Wadman WJ (1998). Sodium currents in isolated rat CA1
neurones after kindling epileptogenesis. Neuroscience 86, 99–107.
Vreugdenhil M & Wadman WJ (1992). Enhancement of calcium currents in rat
hippocampal CA1 neurones induced by kindling epileptogenesis. Neuroscience 49,
373–381.
Wang J, Ou S-W & Wang Y-J (2017). Distribution and function of voltage-gated
sodium channels in the nervous system. Channels 11, 0–0.
Webb JR (2007). Slow inactivation of sodium channels: structural clues and disease
associations (thesis). The University of Texas Southwestern Medical Center at
Dallas.
Westenbroek RE, Ahlijanian MK & Catterall WA (1990). Clustering of L-type Ca2+
channels at the base of major dendrites in hippocampal pyramidal neurones.
Nature 347, 281–284.
Westenbroek RE, Hell JW, Warner C, Dubel SJ, Snutch TP & Catterall W a (1992).
Biochemical properties and subcellular distribution of an N-type calcium channel
alpha 1 subunit. Neuron 9, 1099–1115.
Westenbroek RE, Merrick DK & Catterall WA (1989). Differential subcellular
localization of the RI and RII Na+ channel subtypes in central neurones. Neuron 3,
695–704.
Williams RJP (1970). Cation Distributions and The Energy Status of Cells.
Bioenergetics 1, 215–225.
Wong RKS & Stewart M (1992). Different firing patterns generated in dendrites and
somata of CA1 pyramidal neurones in guinea-pig hippocampus. J Physiol 457,
675–687.
Yang N, George AL & Horn R (1996). Molecular basis of charge movement in voltage-
gated sodium channels. Neuron 16, 113–122.

Influence of feeding cycle on neuronal plasma membrane
98 PhD thesis - Bastos, AEP (2018)
4 Feeding cycle on neuronal Plasma membrane
The previous chapter of this thesis unveiled groundbreaking insights towards the effect
of feeding cycle upon the biophysics and molecular expression of proteins imbedded in
the phospholipid bilayer of the neuronal plasma membrane (PM). Those findings
demanded a research upon the possible influence of the feeding cycle on the bulk lipid of
the PM of rat hippocampus. Specifically, the present chapter provides information
regarding the lipid composition, lateral heterogeneity and physical properties of PM, such
as order and fluidity.
4.1 Plasma Membrane domains – lipid composition and distinct phases
Biological membranes provide physical boundaries between different worlds, separating
the cellular and extracellular environments and the diverse cellular compartments.
Contrary to previous assumptions based on the fluid mosaic model (Singer and Nicolson,
1972), the plasma membrane (PM) is presently described as a mosaic of domains with
different lipid and protein compositions, properties and functions. Lipids are
characterized by a great structural diversity, both in terms of their polar head group, length
and unsaturation degree of their hydrocarbon chains (Van Meer, 2005; Pike, 2009; Quinn
& Wolf, 2010; Sonnino & Prinetti, 2010; Sezgin et al., 2017). The combination of
different head groups and variations in fatty acid tails results in more than a thousand
different lipid species in any eukaryotic cell (Van Meer et al., 2008). Such multiplicity of
structures may induce the lateral segregation of lipids into domains with distinctive
properties in terms of size, rigidity, and thickness (Quinn & Wolf, 2010; Ingólfsson et al.,
2014; Marquês et al., 2015). In this regard, one property of lipids that has fascinated
scientists is their phase behaviour. In model systems, lipids can adopt various fluid and
solid phases, which are characterized by a different spatial arrangement and motional
freedom of each lipid with respect to its neighbours (Van Meer et al., 2008). Since some
of these phases are adopted under physiological conditions of temperature, pH, ionic
Influence of feeding cycle on neuronal plasma membrane
99 PhD thesis - Bastos, AEP (2018)
strength, etc., by lipid species that coexist in cell membranes, it is expected that
arrangements reminiscent of these different phases may be found in biological
membranes in vivo (Elson et al., 2010; de Almeida & Joly, 2014).
The fundaments for the structure and functions of biological membranes are thus
determined, to a considerable extent, by the intrinsic properties and composition of
membrane lipids. Indeed, altered lipid composition is linked to many pathological
conditions, e.g., cancers, HIV infections, diabetes, atherosclerosis, cardiovascular
disease, and Alzheimer’s disease (Van Meer, 2005; Adibhatla & Hatcher, 2008;
Ingólfsson et al., 2017). The brain appears to be especially susceptible to disease states
that are enhanced or accelerated by certain lipid compositions (Mattson, 2005; Adibhatla
& Hatcher, 2008; Sebastião et al., 2013; Escribá & Nicolson, 2014)(Adibhatla & Hatcher,
2008; Sebastião et al., 2013). For instance, specific phosphatidyl inositol phosphate (PIP)
lipids are involved in regulation of aspects of neuronal cell function. In particular, PIPs
can modulate ion flux through PM ion channels (Dart, 2010; Jiang & Gonen, 2012;
Poveda et al., 2014) by direct interaction with the ion channels or by modulating
membrane charge (Ingólfsson et al., 2017).
The structure of biological membranes is mainly defined by three classes of lipids, whose
packing forms the lipid bilayer: glycerophospholipids, which for simplicity will be
designated here by phospholipids (PLs), sphingolipids (SLs) and sterols. PLs, the major
lipids in eukaryotic membranes, contain a diacylglycerol (DAG) moiety as hydrophobic
component with saturated or unsaturated fatty acyl chains of variable length and a polar
head group, usually consisting of an alcohol attached to the phosphate group (Van Meer,
2005; Simons & Sampaio, 2011; van Meer & de Kroon, 2011). The general structure of
PLs and common head groups are shown in Figure 4.1, being phosphatidylcholine (PC)
the most abundant in mammals, followed by phosphatidylethanolamine (PE),
phosphatidylserine (PS), phosphatidylinositol (PI), and phosphatidic acid (PA) (Van
Meer, 2005; Van Meer et al., 2008). The level of saturation of their fatty acyl chains
regulates the rigidity of the biological membranes; the kinked hydrocarbon chains of the
largely unsaturated PLs yield fluid phases in the membranes (also known as ld, liquid-
disordered phase), thus preventing close packing of the lipids within the bilayer. Analysis
of the phospholipid composition of the rat hippocampus shows PC, PE and PS as the
predominant phospholipids (Chavko et al., 1993; Wen & Kim, 2004), while the fatty acid
composition shows enrichment with 16:0 (palmitic), 18:0 (stearic), 18:1 (oleic), 18:2

Influence of feeding cycle on neuronal plasma membrane
100 PhD thesis - Bastos, AEP (2018)
(linoleic), 20:4 (arachinodic) and 22:6 (docosahexaenoic) fatty acids (Ulmann et al.,
2001; Murthy et al., 2002).
Another class of structural lipids is formed by the SLs, whose hydrophobic backbone is
constituted by ceramide (Cer), consisting of a sphingoid base (such as sphingosine; Sph),
which is amide-linked to a fatty acid (Figure 4.2A). The major SLs in mammalian cells
is sphingomyelin (SM), which, like PC, contains a phosphocoline head, and the
glycosphingolipids (GSLs), which contain mono-, di- or oligosaccharides based on
glucosylceramide (GlcCer) and sometimes galactosylceramide (GalCer). These are
important components in nerve cell membranes, where they have essential roles in the
structure and function of myelin, the insulator that allows for rapid nerve conduction. SLs
are usually the cell membrane components with the highest main phase transition
Figure 4.1- General structure of phospholipids and common head groups. PLs contain two fatty acids
ester-linked to glycerol at C-1 and C-2, and a polar head group attached at C-3 via a phosphodiester
bond. The fatty acids in PLs can vary in carbon group length and saturation degree. The different common
polar head groups and global charges of the phospholipid molecule at neutral pH are indicated. PA,
phosphatidic acid; PE, phosphatidylethanolamine; PC, phosphatidylcholine; PS, phosphatidylserine;
PG, phosphatidylglycerol; CL, cardiolipin; PI, phosphatidylinositol. Taken from (Aktas et al., 2014)

Influence of feeding cycle on neuronal plasma membrane
101 PhD thesis - Bastos, AEP (2018)
temperature (Tm), i.e., the temperature at which the lipids undergo a transition from a gel
(or solid-ordered, so) phase, with the acyl chains highly ordered and packed to a fluid
phase, with low order and packing (ld phase) (Marquês et al., 2015). Therefore, SLs hold
large responsibility for the lateral segregation of lipids and are important components of
membrane ordered domains (Figure 4.3). The fact that they have high Tm values means
that at room temperature, at inner human body temperature (37 °C), or at the optimal
growth temperature of many microorganisms (e.g., 30 °C for Saccharomyces cerevisiae),
if isolated, they could exist in a gel or So phase, rather than in the fluid state usually
attributed to biological membranes.
The SLs are fluidized by sterols (cholesterol, in mammalian cell membranes; Figure
4.2B), another class of lipids constituents of eukaryotic membranes. Sterols contain a
tetra-ring hydrophobic core based on the cyclopentane-per-hydro-phenantrene motif,
which can be further extended with an aliphatic chain, and bearing only a hydroxyl group
as the polar part (Bloch, 1957). The preferential interaction between high Tm SLs and
cholesterol is of the utmost importance, as it allows the formation of specialized
microdomains, the so-called ‘lipid rafts’ (Figures 4.2C and 4.3) (Korade & Kenworthy,
2008; Brown & Galea, 2010; de Almeida & Joly, 2014). These domains are in a state
resembling a liquid-ordered (lo) phase, with an acyl chain order similar to the gel phase,
but lateral diffusion on the same order of magnitude as the ld phase (thereby, also
considered fluid) (Bastos et al., 2012). Moreover, they are usually defined as small, highly
dynamic and transient plasma membrane entities, serving as platform for various cellular
processes such as signal transduction and transport (Pike, 2006; Lingwood et al., 2009;
Lingwood & Simons, 2010; Sonnino & Prinetti, 2010; Simons & Sampaio, 2011).
Although these lateral assemblies can arise solely due to lipid-lipid interactions, in cell
membranes lipid-protein and protein-protein interactions also play a vital role in the
formation, properties and function of these domains (Castro et al., 2007; Smith, 2012;
Barrera et al., 2013; Escribá & Nicolson, 2014).

Influence of feeding cycle on neuronal plasma membrane
102 PhD thesis - Bastos, AEP (2018)
4.2 Membrane Probes sensitive to different lipid domains
The study of lipid microdomains requires the use of noninvasive, highly sensitive
techniques with minimal perturbation of cellular integrity and function. Fluorescence
spectroscopy is extensively used for monitoring membrane heterogeneity, due to its
intrinsic sensitivity, suitable time scale, and minimum perturbation (Pucadyil &
Chattopadhyay, 2004; Mukherjee et al., 2007). Thus, fluorescence techniques are suitable
for this task, by providing direct information on molecular interactions and dynamic
events involving biomolecules. As most lipids do not display intrinsic fluorescence, one
needs to label the bilayer with an extrinsic fluorophore (membrane probe). Several
fluorescence properties of membrane probes can be determined - spectral shifts,
fluorescence lifetimes, and fluorescence anisotropy -, which enables us to retrieve
information about the physical properties of the membranes, such as order, charge
distribution, polarity, and hydration. There are, in general, no probes that label
Figure 4.2- Main constituents of the lipid rafts. A) The phosphosphingolipid sphingomyelin (SM) and the
glycosphingolipid glucosylceramide (GlcCer) have a ceramide (Cer) backbone, consisting of a sphingoid
base (such as sphingosine; Sph), which is amide-linked to a fatty acid. SM contains a phosphocoline
headgroup, and in GlcCer the sugar residue attached to ceramide is glucose. B) cholesterol, the sterol of
mammalian cell membranes. Adapted from (Van Meer et al., 2008) C) Defining feature of lipid raft
formation. The preferential interaction between sphingolipids and sterols is due to the saturation of
sphingolipid hydrophobic tails, but also to hydrogen bonding between these lipid species. The amide of the
sphingolipid backbone can both donate and accept a hydrogen bond, and these hydrogen bonds are within
the interfacial region of the membrane, in which the relative scarcity of water increases the stability of
these bonds. Adapted from (Sezgin et al., 2017).
A B
C

Influence of feeding cycle on neuronal plasma membrane
103 PhD thesis - Bastos, AEP (2018)
exclusively a certain type of domain. Therefore, the fluorescence signal is most of the
time a composition of the fluorescence from the probe incorporated in different types of
domains (Bastos et al., 2012).
Membrane probes include fluorescent molecules reminiscent of natural lipids. In the
present study, I have used 1,6- diphenyl-1,3,6-hexatriene (DPH) and trans-parinaric acid
(t-Pna), two of the most commonly used membrane probes in fluorescence spectroscopy
studies (Figure 4.3). The former distributes evenly among most membrane domains, thus
giving an indication of the average or global order of the lipid bilayer (Lentz & Burgess,
1989). The partitioning property of DPH is particularly advantageous since it reports the
phase-averaged rotational properties of fatty acyl chains without bias toward a particular
type of membrane domain. The latter partitions preferentially into gel domains, where it
displays increased fluorescence quantum yield (Sklar et al., 1977), thus being especially
sensitive to changes in the amount and composition of those ordered domains (de Almeida
et al., 2009). The strong preference for such domains makes it possible to detect gel
domains even when these constitute less than 5% of the membrane (Castro et al., 2009;
Marquês et al., 2015). The probe t-PnA presents the additional benefit of displaying a
long lifetime component in its fluorescence intensity decay that is characteristic of the
type of ordered domains being detected, namely gel or so (if clearly above 30 ns) or lo
(below 30 ns) domains (Reyes Mateo et al., 1993a, 1993b; Castro et al., 2009). Both
pertain to a very important class of membrane probes because they align parallel to the
acyl chains of phospholipids/sphingolipids in lipid bilayers and their fluorophore locates
at the hydrophobic core of the bilayer. Therefore, their fluorescence properties reflect
very faithfully direct information on acyl chain packing (Bastos et al., 2012). In addition,
the labeling of membranes with these probes renders a low background noise, given their
strong and fast partition into the membranes, and low quantum yield in water. Another
important feature is their cylindric shape, resulting in minimal perturbation in the system.
Thus, the results can be interpreted without taking into consideration biophysical
complexities on the lipid-water interface/lipid headgroup region or interactions with extra
membrane molecules or domains of membrane proteins (Bastos et al., 2012). The
concomitant application of DPH and t-Pna can be used to obtain an unbiased or
quantitative description of the lipid domains behavior (de Almeida et al., 2009; Castro et
al., 2009; Aresta-Branco et al., 2011; Bastos et al., 2012). However, these probes cannot

Influence of feeding cycle on neuronal plasma membrane
104 PhD thesis - Bastos, AEP (2018)
be used in fluorescence microscopy due to absorption and emission mostly in the UV
spectral region and photobleaching (Bastos et al., 2012).
4.3 Fluorescence spectroscopy – principles and types of measurements
Fluorescence spectroscopy is extensively used in the study of biological membranes,
mostly due to its intrinsic sensitivity, suitable time scale, and minimum perturbation, as
explained above (Pucadyil & Chattopadhyay, 2004; Mukherjee et al., 2007). By assessing
the fluorescence properties of the molecular probes located within the membrane, it
allows the study of a vast variety of physical parameters: fluidity; structural ordering;
Figure 4.3- Schematic depiction of a lipid bilayer exhibiting different lipid phases—Ld, Lo, and gel. The
predicted location of fluorescent probes, such as di-4-ANEPPS, 1,6-diphenyl-1,3,5-hexatriene (DPH),
trans-parinaric acid (t-Pna), and 1-(4-trimethylammoniumphenyl)-6-phenyl-1,3,5-hexatriene (TMA-
DPH), in the different lamellar lipid phases is also depicted. The polar headgroups of sphingolipids are
represented in red and green (types A and B), and that of phospholipids in blue. Sterols (Lo-forming) are
represented by a ring system. Di-4-ANEPPS presents sensitivity to polarity and hydration patterns in the
headgroup region, and membrane dipole potential; partition and fluorescence quantum yield favourable
to sterol-rich domains; DPH reports the global order of the membrane in the hydrophobic core; t-PnA
reports acyl chain packing, has preferential partition for gel phases (red t-PnA), but can be found also in
Lo and Ld phases where it presents intermediate and lower quantum yield, respectively (black t-PnA);
TMA-DPH, similar to DPH, reports the global order of the membrane, but is anchored at the membrane
surface by the TMA group and is more sensitive to hydration. In the present work, I have only used t-Pna
and DPH. Taken from (Marquês et al., 2015).

Influence of feeding cycle on neuronal plasma membrane
105 PhD thesis - Bastos, AEP (2018)
lipid – protein interactions; location of proteins; lateral organization (in the membrane
plane); membrane potentials and molecular mobility (Valeur & Berberan-Santos, 2012).
The fundamentals of fluorescence can be illustrated in a Jablonski energy diagram
(Jabłoński 1935), more recently baptized as Perrin- Jabłoński (Valeur & Berberan-Santos,
2012). Schematically, this diagram shows different energetic states of a chromophore
after absorption of a photon, where transitions between them are depicted with arrows
(Figure 4.4).
Absorption of a photon by a fluorophore leads to the transition of an electron from the
ground state, a singlet for most common organic chromophores (S0) to an excited state
(Sn). The excitation then rapidly (10-13 s) relaxes non-radiatively to the lowest excited
state (S1) via vibrational relaxation and internal conversion (IC). From S1 the fluorophore
can then relax to S0 in several ways: non-radiatively by IC, by intersystem crossing
forming a triplet state, by quenching, by energy transfer to another fluorophore (FRET)
or by fluorescence (emission of a photon).
Fluorescence measurements can be broadly classified into two types: steady-state and
time-resolved. Steady-state measurements, the most common, are those performed with
constant illumination and observation. The sample is illuminated with a continuous beam
of light, and the intensity or emission spectrum is recorded. The combination of a constant
Figure 4.4- The Jablonski energy diagram. Light absorption and emission are represented by vertical,
black arrows. Vibrational relaxation, internal conversion and intersystem crossing are indicated by
light gray dashed arrows. Taken from (Laptenok, 2009).

Influence of feeding cycle on neuronal plasma membrane
106 PhD thesis - Bastos, AEP (2018)
flow of photons, with a nanosecond timescale of fluorescence, results in a constant
(steady-state) concentration of excited fluorophore.
The second type of measurement is time-resolved, which is used for measuring
fluorescence intensity decays or anisotropy decays. For these measurements the sample
is exposed to a pulse of light, where the pulse width is typically shorter than the decay
time of the sample. This intensity decay is recorded with a high-speed detection system
that permits the intensity or anisotropy to be measured on the nanosecond timescale. A
steady state observation is simply an average of the time-resolved phenomena over the
intensity decay of the sample (Lakowicz, 2006). It should also be stressed that time-
resolved techniques have the advantage of not evaluating the total intensity, so they are
much less biased by the known problems associated to steady-state data such as light
scattering, or error in probe concentration (de Almeida et al., 2009).
4.3.1 Steady-state fluorescence anisotropy. Into the rigidity of biological membranes derived from rotational dynamics of excited molecular probes
Fluorescence anisotropy (⟨𝑟⟩) measurements provide information on the size and shape
of proteins or the rigidity of various molecular environments. Anisotropy measurements
are based on the principle of photoselective excitation of fluorophores by polarized light.
Fluorophores preferentially absorb photons whose electric vectors are aligned parallel to
the transition moment of the fluorophore. Upon excitation with polarized light, one
selectively excites those fluorophore molecules whose absorption transition dipole is
parallel to the electric vector of the excitation. Fluorophores absorb light along a
particular direction with respect to the molecular axes. For example, DPH only absorbs
light polarized along its long axis.
Several phenomena can decrease the measured anisotropy to values lower than the
maximum theoretical values. The most common cause is rotational diffusion. Such
diffusion occurs during the lifetime of the excited state and displaces the emission dipole
of the fluorophore. Measurement of this parameter provides information about the relative
angular displacement of the fluorophore between the times of absorption and emission.

Influence of feeding cycle on neuronal plasma membrane
107 PhD thesis - Bastos, AEP (2018)
The extent to which a fluorophore rotates during the excited-state lifetime determines its
polarization or anisotropy, which can be defined by
⟨𝑟⟩ =(𝐼𝑉𝑉−𝐺×𝐼𝑉𝐻)
(𝐼𝑉𝑉+2×𝐺×𝐼𝑉𝐻) (Equation 4.1),
where the different intensities, I, are the vertical and horizontal components of
fluorescence emission in steady-state with vertical (IVV and IVH, respectively) and
horizontal (IHV and IHH, respectively) excitation relatively to the emission axis. G factor
is used to correct the different sensitivity of the detector for the vertical and horizontal
polarization.
In fluid solution most fluorophores rotate extensively in 50 to 100 picoseconds. Hence,
the molecules can rotate many times during the 1–10 nanoseconds excited-state lifetime,
and the orientation of the polarized emission is randomized. For this reason, fluorophores
in non-viscous solution typically display anisotropies near zero. The effects of rotational
diffusion can be decreased if the fluorophore is bound to a macromolecule. Thus,
measurements of fluorescence anisotropy will be sensitive to any factor that affects the
rate of rotational diffusion. The rotational rates of fluorophores in cell membranes also
occur on the nanoscale timescale, and the anisotropy values are thus sensitive to
membrane composition (Lakowicz, 2006). That said, if the fluorophore is confined to a
rigid environment it will not freely rotate, yielding higher values of anisotropy (typically
> 0.3). Conversely, if the fluorophore is contained in a more fluid medium, where it can
rotate more freely, emitted light will not exhibit a preferential polarization orientation. In
this case, one will obtain lower values of anisotropy.
4.3.1.1 Technical instrumentation used in steady-state fluorescence anisotropy
To perform fluorescence anisotropy measurements, one needs to use a spectrofluorometer
device which must be equipped with polarizers, as exemplified in Figure 4.5. Briefly,
xenon arc lamps are the light source generally used due to their high intensity at all
wavelengths ranging upward from 250 nm. These lamps produce excitation light that
follows an optical pathway where monochromators motorize/select both the excitation
and emission wavelengths. The excitation monochromator, for instance, contains two
gratings, which decreases stray light, that is, light with wavelengths different from the

Influence of feeding cycle on neuronal plasma membrane
108 PhD thesis - Bastos, AEP (2018)
chosen one. In fluorescence anisotropy measurements, the light that is not reflected by
the beam splitter passes through a polarizer before reaching the sample chamber. The
light emitted by the sample in a direction perpendicular to the incident beam may
encounter an emission polarizer prior to a subsequent emission wavelength sieve in the
emission monochromator. Finally, the fluorescence is detected with a photomultiplier
tube and quantified with the appropriate electronic devices. The output is usually
presented in graphical form and stored digitally.
4.3.2 Time-resolved fluorescence intensity decays. Into the organization of biological membranes
Time-resolved fluorescence spectroscopy, in particular the determination of fluorescence
lifetimes, is a technique often used in membrane biophysics that allows to retrieve crucial
information about the organization of the membrane, namely the presence of certain types
of lipid domains, the packing of the acyl chains or the extent of water penetration (de
Almeida et al., 2009).
Figure 4.5- Schematic representation of the optical pathway in a conventional fluorometer. Taken
from (Lakowicz, 2006)

Influence of feeding cycle on neuronal plasma membrane
109 PhD thesis - Bastos, AEP (2018)
Time-resolved fluorescence gives information on the kinetics of fluorescence emission
and excited-state lifetimes, that is, the average time the fluorophore spends in the excited
state attained after light absorption and prior to fluorescence emission or deactivation by
other processes. Fluorescence lifetimes, usually in the order of nanoseconds, are sensitive
to biomolecule dynamics, solvent relaxation, and presence of other molecules
(concentration and diffusion coefficient) that decrease the excited-state lifetime (Bastos
et al., 2012).
Since the emission probability decreases with time after excitation, a fluorescence
intensity decay is obtained. The simplest kinetics of fluorescence emission is a first order
law (exponential decay) and the fluorescence (or excited-state) lifetime is the reverse of
the decay rate constant. However, in most cases, the fluorescence decay is more complex
and is usually described by a sum of exponentials,
𝐼(𝑡) = ∑ 𝛼𝑖𝑒(−𝑡 𝜏𝑖⁄ )𝑛
𝑖=1 (Equation 4.2),
where 𝛼𝑖 and 𝜏𝑖 are the normalized amplitude and lifetime of component 𝑖, respectively.
More specifically, 𝛼𝑖 is a pre-exponential factor representing the fractional contribution
to the time-resolved decay of the component with a lifetime 𝜏𝑖, such that ∑ 𝛼𝑖 = 1𝑖 .
Multicomponent decays are indications of heterogeneity and, at the same time, give
information on the biophysical properties and relative abundance of the lipid domains that
are responsible for the appearance of each lifetime. Thus, when resolution of multiple
exponentials is possible, the lifetime components together with their amplitudes contain
information on the type and relative abundance of domains (de Almeida et al., 2009;
Bastos et al., 2012).
Sometimes, due to the unclear physical meaning of each exponential used in the fit to the
experimental decay curve, it is useful to describe the fluorescence kinetics through a
parameter named mean or average fluorescence lifetime (the true mean lifetime of the
excited state since it is weighted by the intensity of each component), given by
⟨𝜏⟩ =∑ 𝛼𝑖𝜏2
𝑖𝑖
∑ 𝛼𝑖𝜏𝑖𝑖 (Equation4.3)
In some cases, where there is a dependence of the quantum yield with the interaction
under studied, the determination of the quantum yield-weighted lifetime (𝜏) (also named
as amplitude-weighted average fluorescence lifetime) becomes more significant. This
parameter can be determined as follows

Influence of feeding cycle on neuronal plasma membrane
110 PhD thesis - Bastos, AEP (2018)
(𝜏) = ∑ 𝛼𝑖𝜏𝑖𝑖 (Equation 4.4)
4.3.2.1 Technical instrumentation used in time-resolved fluorescence intensity decays
Time-resolved experiments are often performed through direct measurements in the time
domain, in which a short pulse of light excites the sample, and the subsequent
fluorescence emission is recorded as a function of time. This is generally achieved using
time-correlated single photon counting (TCSPC), which uses electronics to detect single-
photon events at a detector. By repeating many start-stop signals, a histogram of single-
photon counts in discrete time channels is obtained (O’Connor & Phillips, 1984;
Lakowicz, 2006; Wahl, 2014). The technique of TCSPC consists in exciting the sample
and detecting the arrival time of the first emitted photon. Therefore, this technique is also
called single photon timing (SPT) (de Almeida et al., 2009). In the experiments of this
thesis, a nanoLED, which emits light pulses of short duration (70 ps) and a repetition rate
up to 1 MHz, was used as the light source.
If the condition for detecting a single photon after excitation pulse is fulfilled, i.e., only
one fluorescence photon per excitation pulse is detected and there are no photons coming
from the sample during the “dead time” of the setup, the probability of detecting a photon
in channel i is proportional to the fluorescence intensity at delay time i, meaning that the
histogram of photon arrival times is proportional to the fluorescence intensity decay
(Figure 4.6) (Laptenok, 2009).
Figure 4.6- Time-correlated single photon counting (TCSPC) principle. The arrival time of the first
photon after the excitation pulse is measured and stored in the memory. The histogram of the arrivals
times of photons represents the fluorescence intensity versus time curve. Taken from (Laptenok, 2009).

Influence of feeding cycle on neuronal plasma membrane
111 PhD thesis - Bastos, AEP (2018)
4.4 Materials and Methods
4.4.1 Chemicals
1-Palmitoyl-2-oleoyl-sn-glycero-3-phosphocholine (POPC), 1,2-Dipalmitoyl-sn-
glycero-3-phosphoethanolamine (DPPE) and N-palmitoyl-sphingomyelin (PSM) were
purchased from Avanti Polar Lipids (Alabaster, AL); cholesterol was purchased from
Sigma (St. Louis, MO). Ludox (colloidal silica diluted to 50 weight % in water) was
purchased from Sigma. Trans-parinaric acid (t-PnA) was purchased from Santa Cruz
Biotechnology (Santa Cruz, CA, USA), and 1,6-diphenyl-1,3,5-hexatriene (DPH) from
Invitrogen (Madrid, Spain). Solvents for lipid and probe stock solutions were
spectroscopic grade. All other reagents were of the highest purity available.
4.4.2 Plasma membrane-enriched fraction isolation
Hippocampal plasma membrane fractions were prepared as described previously (Sun et
al., 1988) with some modifications. Briefly, hippocampi from fed and fasted rats were
homogenized in ice-cold homogenization buffer - 0.32M sucrose, 50mM Tris HCl
(pH7.4), 1mM EDTA, 2mM EGTA, 1x protease inhibitor cocktail from Roche®
Diagnostics -, using a glass tissue homogenizer pestle, and centrifuged for 10min at 500g
to sediment nucleus and cell debris. The supernatant was centrifuged at 18800g, for
20min, to obtain a crude mitochondrial pellet. The post-mitochondrial supernatant was
centrifuged at 45500g for 30min, which resulted in the sedimentation of a white-colored
pellet. This pellet, constituted by the crude plasma membranes, was resuspended in a
minimum volume of PBS buffer (in mM): K2HPO4, 1.8; NaH2PO4, 10; NaCl, 137; and
KCl, 2.7 (pH 7.4), with 1x protease inhibitor cocktail. The protein concentration was
determined by the bicinchoninic acid (BCA) protein assay kit (Micro BCA Pierce
Thermo®) using BSA as a standard. Plasma membrane-enriched fractions were stored at
4ºC until use. All steps were performed on ice and centrifugations at 4ºC.
4.4.3 Total lipids extraction
Lipids were extracted by the method of Bligh and Dyer (Bligh & Dyer, 1959). Briefly,
for each 1 ml of sample, 3.75 ml of 1:2 (v/v) chloroform-methanol (CHCl3:MeOH) was
added and vortexed thoroughly for 1 min. Then 1.25 ml of CHCl3 was added and vortexed

Influence of feeding cycle on neuronal plasma membrane
112 PhD thesis - Bastos, AEP (2018)
thoroughly for 1 min. Finally, 1.25 ml of 1 M NaCl was added and again vortexed
thoroughly for 30 sec. Samples were centrifuge at 1,000 g for 5 min at room temperature
to give a two-phase system (aqueous top, organic bottom) and the bottom phase was
recovered and dried under a mild flow of nitrogen, forming a thin layer of lipid in the
bottom of the tube. Total lipid concentration was determined by gravimetry. The dried
extracts were resuspended in a mixture of CHCl3:MeOH (1:1).
4.4.4 Phospholipid and cholesterol quantification
An aliquot of lipid extract was transferred to a test tube and organic solvent evaporated.
Concentration of phosphate (inorganic) was determined with a colorimetric reagent
(ascorbic acid/ammonium heptamolybdate) subsequently to total lipid digestion by
perchloric acid using Na2HPO4 as standard (Rouser et al., 1970). Cholesterol
concentration was estimated by direct treatment of the lipid extracts with a reagent
composed of ferric chloride dissolved in a glacial acetic acid-sulfuric acid mixture
(Zlatkis et al., 1953). Both concentrations were determined spectrophotometrically, with
the following wavelength (λ(nm)): 797 and 550, for phospholipids and cholesterol
determination, respectively.
4.4.5 Membrane preparation for fluorescence spectroscopy measurements
DPH and t-Pna were added from a concentrated stock solution to membranes at a final
probe concentration of 0.5 and 1mol%, respectively, with respect to total phospholipid
content. Membranes containing 50 nmol of total phospholipids were suspended in 1ml of
PBS buffer and used for fluorescence spectroscopy experiments. The resultant probe
concentration was 0.25µM and 0.5µM for DPH and t-Pna, respectively. These conditions
have ensured optimal fluorescence intensity with negligible membrane perturbation.
Probes were incubated for 10 min, at room temperature. Probe concentrations in stock
solutions were determined spectrophotometrically using ε(DPH, 355 nm, chloroform) =
80.6 x 10³ M-1cm-1 and ε(t-PnA, 299.4 nm, ethanol) = 89 x103 M-1cm-1 (Castro et al.,
2007). Blank samples were prepared the same way except that probes were omitted.

Influence of feeding cycle on neuronal plasma membrane
113 PhD thesis - Bastos, AEP (2018)
4.4.6 Fluorescence spectroscopy measurements
The fluorescence measurements were carried out on a Spex Fluorolog 3-22/Tau 3
spectrofluorometer equipped with double grating monochromators in both excitation and
emission light paths from Horiba Jobin Yvon at 23ºC, using 1cm path length quartz
cuvettes.
For steady-state measurements (450 W Xe arc lamp light source), the samples were under
constant magnetic stirring, and the excitation / emission wavelengths were 358nm /
430nm for DPH and 303nm / 404 nm for t-PnA. The steady-state anisotropy (<r>) was
calculated according to equation 1. An adequate blank was subtracted from each intensity
reading. The set of the four intensity components for each sample, depicted in equation
4.1, was measured seven times.
For time-resolved measurements by the single photon counting technique, nanoLED N-
320 (Horiba Jobin Yvon) was used for the excitation of t-PnA, and emission wavelength
was 404 nm. The resolution of the detection system was 50 ps. The number of counts on
the peak channel was 20,000. The number of channels per curve used for the analysis was
~1000. The timescale was 0.1114 ns/channel. Ludox was used as the scatter to obtain the
instrumental response function. The program TRFA Data Processor v.1.4 (Scientific
Software Technologies Center, Minsk, Belarus) was used for the analysis of the
experimental fluorescence decays.
A sum of exponentials (Equation 4.2) was used to describe the fluorescence intensity
decay and the mean fluorescence lifetime was calculated according to equation 4.3. The
goodness of the fit of a given set of observed data was evaluated by the reduced χ2 ratio,
the weighted residuals, and the autocorrelation function of the weighted residuals. A fit
was considered acceptable when plots of the weighted residuals and the autocorrelation
function showed random deviation around zero, with a minimized χ2 value not larger than
1.4. Four exponentials were required to described t-Pna fluorescence intensity decays.
The background (obtained with the blank sample) was subtracted from the decay.
All the data represents the mean ± SEM of 4 independent samples.

Influence of feeding cycle on neuronal plasma membrane
114 PhD thesis - Bastos, AEP (2018)
4.4.7 Thin Layer Chromatography
Individual phospholipids classes and neutral lipids were separated by thin layer
chromatography (TLC). Whatman silica gel-60 plates (20 × 20 cm, 250 μm, GE
Healthcare, England) were heat-activated at 110°C for 1 h, and samples (with 20 µg of
phospholipids) were streaked onto the plates. Phospholipids were separated using
chloroform/methanol/acetic acid/acetone/water solvent system (35:25:4:14:2, Xu et al.,
1996), which separates all major glycerophospholipids. Phospholipids were detected by
staining with Coomassie brilliant blue (Nakamura & Handa, 1984). The mixture of
standard phospholipids was constituted by POPC, DPPE, PSM and cholesterol. Their
concentrations in stock solutions made in chloroform were determined by gravimetry.

Influence of feeding cycle on neuronal plasma membrane
115 PhD thesis - Bastos, AEP (2018)
4.5 Influence of feeding cycle on lipid organization and composition of neuronal plasma membrane
A fractionation protocol has been applied to obtain plasma membrane-enriched fractions
from rat hippocampus (Sun et al., 1988), which were subsequently labeled with the
molecular probes DPH and t-Pna. This important fractionating step allowed me to
overcome expected incorporations of the fluorescence membrane probes into intracellular
compartments (Aresta-Branco et al., 2011; Bastos et al., 2012). These two probes present
different phase partitioning behavior; DPH distributes indistinctly between gel and fluid
phases, whereas t-PnA presents a high preference for gel phase domains, being therefore
an exceptional reporter of this gel phase. Consequently, by combining these two
membrane probes complementary information is obtained (Castro et al., 2007).
The fluorescence properties of DPH and t-Pna were characterized by fluorescence
spectroscopy techniques, mainly steady-state anisotropy and time-resolved fluorescence
intensity decay.
4.5.1 Fluorescence spectroscopy
4.5.1.1 Anisotropy measurements
Fluorescence anisotropy is correlated to the rotational diffusion of probes embedded in
membranes, which is highly sensitive to the packing of lipid acyl chains. The premise
that, for both probes used here, the fluorescence anisotropy is high in the gel and low in
the fluid, allows for a detailed characterization of the lipid phases encountered in the PM
of rat hippocampus.
To understand how the whole membrane system may respond to cellular alterations
brought up by the feeding cycle, the PM-enriched fractions were labeled with DPH, a
probe that is sensitive to its global properties. Its steady-state fluorescence anisotropy is
a well-established parameter to report on the alterations undergone in the global order of
the membrane (de Almeida et al., 2003, 2005; Aresta-Branco et al., 2011).

Influence of feeding cycle on neuronal plasma membrane
116 PhD thesis - Bastos, AEP (2018)
Figure 4.7A shows that the fluorescence anisotropy of DPH is practically the same
between fed and fasted membranes (0.25 in both membranes), meaning that feeding cycle
does not alter the global order/fluidity of PM of rat hippocampus. This anisotropy value,
consistent with another work performed in crude membranes of rat hippocampus
(Schaeffer et al., 2011), unveils that the PM of rat hippocampus is overall highly ordered
(anisotropy of DPH higher than 0.2). The fluorescence anisotropy values measured for
DPH corresponds, roughly, to the one measured for the membrane models mimicking lo
domains, composed by the 1:1:1 equimolar mixture of POPC/PSM/cholesterol, at 23ºC
(de Almeida et al., 2003).
On the other hand, the fluorescence anisotropy of t-Pna (0.27 in both membranes; Figure
7B) indicates that the PM of rat hippocampus does not contain a significant fraction of so
domains, whose typical anisotropy values are higher than 0.3. Additionally, the fact that
anisotropy of t-Pna is only slightly larger than that of DPH indicates that PM of rat
hippocampus is mainly characterized by ld/lo domains. The quantum yield of t-PnA is
moderately higher in this phase (Castro et al., 2007). Feeding cycle also does not alter the
anisotropy of t-Pna, which indicates that the lateral heterogeneity of the most ordered
domains of rat hippocampus does not change whether the animals have or not been fed.
Considering the values obtained, one can conclude that lo-like domains probably
predominate in the plasma membrane crude extract, as expected from the composition
reported for the neuronal membrane (Ingólfsson et al., 2017) (see also next section).
BA
0,00
0,05
0,10
0,15
0,20
0,25
0,30
Fed Fasted
<r>
DP
H
0,00
0,05
0,10
0,15
0,20
0,25
0,30
Fed Fasted
<r>
t-P
na
Figure 4.7- Feeding cycle does not influence the order of plasma membrane domains of rat hippocampus
at the level of the hydrophobic core. The steady-state fluorescence anisotropy of A) DPH and B) t-PnA
was obtained from isolated plasma membrane of fed (black) and fasted (grey) animals. The values are the
mean ± SEM of four independent experiments.

Influence of feeding cycle on neuronal plasma membrane
117 PhD thesis - Bastos, AEP (2018)
4.5.1.2 Fluorescence lifetime measurements
Fluorescence lifetime distribution analysis of membrane probes represents a powerful and
sensitive tool in characterizing the membrane organization and dynamics through the
heterogeneity of population of the probe. The quantum yield of the probes used in this
work behaves differently, i.e., whereas the DPH quantum yield is weakly sensitive to the
lipid phase, t-PnA presents quantum yield values and fluorescence lifetime components
that are typical of each lipid phase. Thus, the plasma membrane of rat hippocampus was
labeled with t-PnA, and the fluorescence decay of the probe was obtained (Figure 4.8).
The fluorescence intensity decays of t-Pna presented in Figure 8A disclose a similar
pattern between fed and fasted membranes. A long lifetime component higher than 30ns
was detected in both cases, which reveals the presence of a gel phase, i.e. a so phase
(Castro et al., 2009; Bastos et al., 2012). This similitude is also depicted in the values
obtained for the mean fluorescence lifetime of t-Pna, as follows: 22.5 ± 1.06 ns and 23.3
± 1.35 ns, for fed and fasted membranes, respectively (Figure 4.8B). Again, these values
are close to the ones measured in model systems with an equimolar mixture of
POPC/PSM/cholesterol (de Almeida et al., 2005). These results indicate that the time that
0 20 40 60 80 100
1
10
100
1000
10000
Countnum
ber
t (ns)
-2
0
2
4
Resi
dual
s
-0,1
0,0
0,1
Auto
corr
ela
tion
0
5
10
15
20
25
30
Fed Fasted
<τ>
(ns)
A
B
Figure 4.8- Feeding cycle does not alter the fluorescence lifetime of t-Pna. A) Fluorescence intensity
decay and B) mean fluorescence lifetime of t-Pna was obtained from fed (black) and fasted (grey)
membranes. In A), top panel: the fluorescence intensity decay was better described by a sum of 4
exponentials (white lines, equation 4.2), and the long lifetime component indicates the presence of gel
domains in the PM of rat hippocampus. Middle panel: random distribution of weighted residuals of the
fitting. Bottom panel: autocorrelation of the residuals. In B), results are mean ± SEM of four independent
experiments.
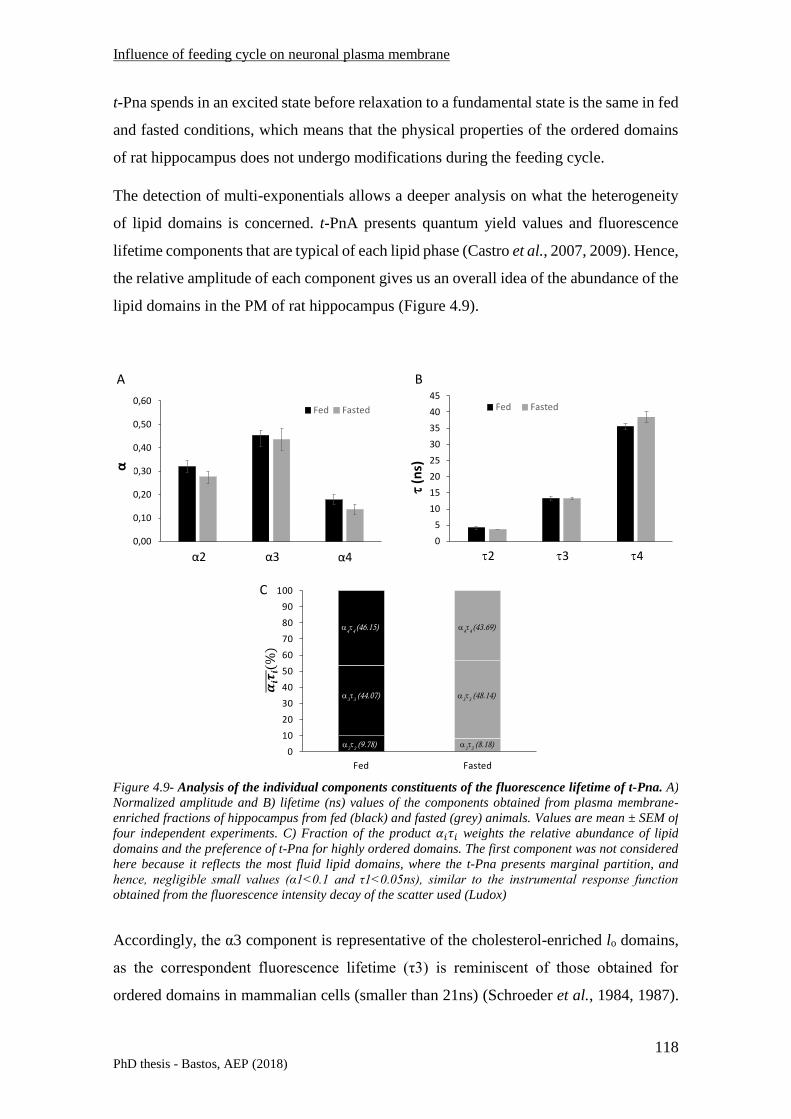
Influence of feeding cycle on neuronal plasma membrane
118 PhD thesis - Bastos, AEP (2018)
t-Pna spends in an excited state before relaxation to a fundamental state is the same in fed
and fasted conditions, which means that the physical properties of the ordered domains
of rat hippocampus does not undergo modifications during the feeding cycle.
The detection of multi-exponentials allows a deeper analysis on what the heterogeneity
of lipid domains is concerned. t-PnA presents quantum yield values and fluorescence
lifetime components that are typical of each lipid phase (Castro et al., 2007, 2009). Hence,
the relative amplitude of each component gives us an overall idea of the abundance of the
lipid domains in the PM of rat hippocampus (Figure 4.9).
Accordingly, the α3 component is representative of the cholesterol-enriched lo domains,
as the correspondent fluorescence lifetime (τ3) is reminiscent of those obtained for
ordered domains in mammalian cells (smaller than 21ns) (Schroeder et al., 1984, 1987).
0,00
0,10
0,20
0,30
0,40
0,50
0,60
α4
α
Fed Fasted
α3α2
0
5
10
15
20
25
30
35
40
45
2 3 4
(ns)
Fed Fasted
0
10
20
30
40
50
60
70
80
90
100
Fed Fasted
a3
3 (44.07)
a4
4(46.15)
a2
2 (9.78)
a3
3 (48.14)
a4
4(43.69)
a2
2 (8.18)
A B
C
Figure 4.9- Analysis of the individual components constituents of the fluorescence lifetime of t-Pna. A)
Normalized amplitude and B) lifetime (ns) values of the components obtained from plasma membrane-
enriched fractions of hippocampus from fed (black) and fasted (grey) animals. Values are mean ± SEM of
four independent experiments. C) Fraction of the product 𝛼𝑖𝜏𝑖 weights the relative abundance of lipid
domains and the preference of t-Pna for highly ordered domains. The first component was not considered
here because it reflects the most fluid lipid domains, where the t-Pna presents marginal partition, and
hence, negligible small values (α1<0.1 and τ1<0.05ns), similar to the instrumental response function
obtained from the fluorescence intensity decay of the scatter used (Ludox)

Influence of feeding cycle on neuronal plasma membrane
119 PhD thesis - Bastos, AEP (2018)
Thus, the larger contribution of α3 (45% and 43% of the total components, in fed and
fasted membranes, respectively; see Figure 4.9A) is linked to the high demand of neuronal
cells for lo domains, where the specialized microdomains (or lipid rafts) are exclusively
localized. In other words, these results indicate that lipid rafts are responsible for almost
50% of the total lipid domains in PM of rat hippocampus. The second most abundant lipid
domain is enclosed in α2, with fluorescence lifetime values < 5ns (Figure 4.9B),
characteristic of (poly)unsaturated phospholipid-enriched ld domains. This component
accounts for an overall contribution of 30% to the PM. The results concerning α2 and α3
components suggest that the PM of rat hippocampus is mainly constitutes by ld-lo
domains, as previously indicated by the results obtained from the fluorescence anisotropy.
As far as I can tell from the literature, this is the first time that t-Pna is applied to label
plasma membrane-enriched fractions of rat hippocampus, and, also, the first time that a
long component typical of the gel phase (>30 ns) is found in plasma membrane of
mammalian cells. The longer component, α4, rendered the following fluorescence
lifetime values: 35.5±0.96 and 38.5 ± 1.70, for fed and fasted membranes, respectively
(Figure 4.9B). This difference is not significant. This result is not quite surprising, for it
is known the great contribution of sphingolipids for neuronal development, functioning,
maintenance and survival (Sonnino & Prinetti, 2016; Olsen & Færgeman, 2017). Thus,
the tendency of sphingolipids to coalesce in the PM into solid (gel)-like domains
contributed to the detection of such long components. However, it is important to recall
that these measurements were carried out at 23⁰C, and thus it is possible that at 37⁰C this
long lifetime component is not detected. In addition, the strong preference of t-PnA for so
domains (2 to 5-fold), which makes it a unique probe able to detect such kind of domains
in complex biological membranes, also means that the value of α4 (roughly 15%-20%,
Figure 4.9A) is a majorant of the actual fraction of such domains in the system under
study.
Overall, these results report the natural lipid organization in the PM of rat hippocampus,
which, apparently, do not suffer any modifications during the feeding cycle. The product
𝛼𝑖𝜏𝑖, depicted in Figure 4.9C, which weights the abundance of the components in the PM
with the preference of the t-pna for more ordered domains, summarizes this general
thought. Remarkably the proportions are evenly distributed among the fed and fasted
membranes. Not surprisingly, the products 𝛼3𝜏3 and 𝛼4𝜏4 represent the larger proportions
which confirms, on one hand, the large abundance of cholesterol-enriched lo domains,

Influence of feeding cycle on neuronal plasma membrane
120 PhD thesis - Bastos, AEP (2018)
and, on the other hand, the preference of t-Pna for the most ordered domains (so) of the
PM.
4.5.2 Biochemical characterization of the plasma membrane of rat hippocampus
4.5.2.1 Lipid content
The assessment of the lipid content of the plasma membrane of rat hippocampus was
attained by applying a widely used lipid extraction method (Bligh & Dyer, 1959), with
which I was able to extract the total lipids from the plasma membrane-enriched fractions
of fed and fasted animals. Concentration of lipid phosphate was determined subsequent
to total digestion by perchloric acid using Na2HPO4 as standard (Rouser et al., 1970) and
cholesterol concentration was estimated by direct treatment of the lipid extracts with a
reagent composed of ferric chloride dissolved in a glacial acetic acid-sulfuric acid mixture
(Zlatkis et al., 1953). Subsequently, the phospholipid to cholesterol molar ratios and their
relative abundance to protein concentration (previously calculated after the isolation of
PM-enriched fractions) were obtained (Table 4.1).
From the results presented in table 4.1, it is reasonable to conclude that feeding cycle did
not exert any influence on the biochemical composition of the PM. All the ratios
calculated did not disclose significant differences between fed and fasted conditions. This
is consistent with the indication that the feeding cycle does not change the order and
lateral heterogeneity (lipid domains segregation in the plane of bilayer phospholipid) of
the PM of rat hippocampus, as illustrated by the anisotropy and fluorescence lifetime
analyses. For example, the fact that cholesterol to phospholipid molar ratio did not show
Phospholipid/Protein
(mol/mg)
Cholesterol/Protein
(mol/mg) Cholesterol/Phopholipida
Fed 3.8 ± 1.07 1.4 ± 0.37 0.4 ± 0.10
Fasted 4.3 ± 1.05 2.1 ± 0.36 0.5 ±0.04
a Molar ratios
Table 4.1- Estimation of cholesterol and phospholipid content of the PM of rat hippocampus. Values are
mean ± SEM (n=4).

Influence of feeding cycle on neuronal plasma membrane
121 PhD thesis - Bastos, AEP (2018)
any significant differences between fed and fasted animals is an insightful clue that the
extent of the coalescence of lipids into lipid-raft domains might be the same in the PM of
hippocampus from fed and fasted animals. In both metabolic conditions, the cholesterol
content, normalized to the phospholipid concentration (cholesterol to phospholipid molar
ratio), is roughly defined by 1mol of cholesterol to 2moles of phospholipid, which is in
agreement with the proportion obtained in native membrane of bovine hippocampus
(Pucadyil & Chattopadhyay, 2004; Mukherjee et al., 2007; Saxena et al., 2015) and with
the estimation made above based on DPH fluorescence anisotropy.
The proteins are also a major component of the PM, as it is well-established that proteins
possess the potential to organize membrane domains, and indeed protein– protein
interactions have been regarded for several years as the main factor responsible for the
stabilization of membrane domains (Prinetti et al., 2009; Sonnino & Prinetti, 2010; Aktas
et al., 2014; Sezgin et al., 2017). Nevertheless, the cooperation between protein- and
lipid-driven lateral organizations is utterly important in the creation of membrane
structural and functional heterogeneity, namely in the formation of specialized
microdomains (commonly known as ‘lipid rafts’), where specific membrane proteins are
essentially located. That said, the results obtained for the content of cholesterol with
respect to total protein (Table 4.1) are another suggestion that the distribution and
abundance of lipid rafts encountered in the PM of rat hippocampus might be the same
whether the animals have or not eaten. Furthermore, the phospholipid to protein ratio
emphasizes the higher abundance of phospholipids in the PM (in relation to cholesterol
and proteins) and the resistance of PM of rat hippocampus on modifying the molecular
dynamics and mosaic organization during the feeding cycle.
4.5.2.2 Phospholipid composition of the PM of rat hippocampus
The phospholipid composition of the PM of rat hippocampus was also addressed by using
Thin Layer Chromatography (TLC) technique. Total lipids extracted from hippocampal
plasma membrane were separated with the following solvent system: chloroform–
methanol–acetic acid–acetone–water, in the ratio 35:25:4:14:2 (Xu et al., 1996).
Phospholipids were detected by staining with Coomassie brilliant blue (Nakamura &
Handa, 1984).

Influence of feeding cycle on neuronal plasma membrane
122 PhD thesis - Bastos, AEP (2018)
The silica gel plate in figure 4.10 depicts the main phospholipids of the PM of rat
hippocampus, being PC and PE the most predominant, followed by SM. This is in
agreement with results obtained by other authors, from experiments performed with rat
hippocampal membranes (Ulmann et al., 2001; Murthy et al., 2002). The stained spots
between PE and PC might be related to the presence of PI and/or PS (Xu et al., 1996).
However, this identification remains elusive as I did not use any standards of these
phospholipids. Regarding the cholesterol, either it was totally eluted, or the staining
method was not adequate for sterol identification. The lanes 7 and 8 show smeared dots
at the starting line which indicates that the application of these samples did not succeed.
However, the overall qualitative comparison of the spots between fed and fasted lanes
allows me to state that the feeding cycle did not have a major influence on the
phospholipid composition of rat hippocampal membranes.
Figure 4.10- Separation of phospholipids constituents of the PM of rat hippocampus by one-dimensional
thin layer chromatography. The plate contains 8 lanes with samples from fasted (lanes 1-4) and fed (lanes
5-8) animals. 20µg of phospholipids were applied at the starting line spots. A mixture of standard
phospholipids (10µg per phospholipid; SM, PC, PE and cholesterol) was applied in lane 9.

Influence of feeding cycle on neuronal plasma membrane
123 PhD thesis - Bastos, AEP (2018)
4.5.3 Conclusions on the influence of feeding cycle on the plasma membrane of rat hippocampus
The results disclosed by the fluorescence anisotropy of DPH indicate that fed and fasted
animals have similar hippocampal global membrane order and, together with the
anisotropy of t-Pna, suggests that the hippocampus of both is essentially constituted by lo
domains, functionally known as lipid-raft domains. These are characterized by a higher
density of lipid-protein interactions, where the ion channels studied on this thesis are
located (Tsui-Pierchala et al., 2002; Lee, 2006; Dart, 2010; Jiang & Gonen, 2012).
Furthermore, as indicated by the individual analysis of the components of fluorescence
lifetime of t-Pna, the abundance of these lipid-raft domains is virtually the same during
the feeding cycle. This might be thought as a safeguard mechanism of the neurones to the
peripheral metabolic variations. Also, the relative contribution of the remaining lipid
domains to the mean fluorescence lifetime of t-Pna is identical in fed and fasted animals.
The thesis that the feeding cycle has no influence on the dynamics of neuronal membranes
is further supported by the fact that lipid content of the PM was kept unaltered whether
the animals were or not fed. The phospholipid composition, as well as the ratios calculated
between the phospholipid, cholesterol and protein concentrations did not change
significantly between the samples extracted from the hippocampus of fed and fasted
animals.
The experiments carried out cannot exclude that more subtle changes might be occurring.
For example, a complete lipidomic profiling of the lipid extracts could reveal changes
that could not be detected by TLC involving minor lipids involved in signaling, such as
PIPs. Also, there are solvent extraction methods that might be more adequate for the full
extraction of gangliosides, which could then be analyzed by TLC using solvent systems
that can separate different ganglioside subtypes. On another hand, the use of other
fluorophores with a preferential location at more surface regions of the membrane would
relay other biophysical properties that were not assessed in this thesis, such as order and
hydration of the PM at the membrane/water interface. Thus, despite that the amount and
packing of lipid raft domains did not change, as indicated by the DPH and t-Pna results,
it is not clear yet whether the feeding cycle influences or not the lipid-protein interactions,
at least, at a surface level.

Influence of feeding cycle on neuronal plasma membrane
124 PhD thesis - Bastos, AEP (2018)
In summary, this chapter provides compelling evidence on the maintenance of the overall
organization and dynamics of neuronal membranes during the feeding cycle.

Influence of feeding cycle on neuronal plasma membrane
125 PhD thesis - Bastos, AEP (2018)
4.6 References
Adibhatla RM & Hatcher JF (2008). Altered Lipid Metabolism in Brain Injury and
Disorders. Subcell Biochem 49, 241–268.
Aktas M, Danne L, Möller P & Narberhaus F (2014). Membrane lipids in
Agrobacterium tumefaciens: biosynthetic pathways and importance for
pathogenesis. Front Plant Sci 5, 1–13.
de Almeida RFM, Fedorov A & Prieto M (2003).
Sphingomyelin/phosphatidylcholine/cholesterol phase diagram: Boundaries and
composition of lipid rafts. Biophys J 85, 2406–2416.
de Almeida RFM & Joly E (2014). Crystallization around solid-like nanosized docks can
explain the specificity, diversity, and stability of membrane microdomains. Front
Plant Sci 5, 1–14.
de Almeida RFM, Loura LMS, Fedorov A & Prieto M (2005). Lipid rafts have different
sizes depending on membrane composition: A time-resolved fluorescence resonance
energy transfer study. J Mol Biol 346, 1109–1120.
de Almeida RFM, Loura LMS & Prieto M (2009). Membrane lipid domains and rafts:
current applications of fluorescence lifetime spectroscopy and imaging. Chem Phys
Lipids 157, 61–77.
Aresta-Branco F, Cordeiro AM, Marinho HS, Cyrne L, Antunes F & De Almeida RFM
(2011). Gel domains in the plasma membrane of Saccharomyces cerevisiae: Highly
ordered, ergosterol-free, and sphingolipid-enriched lipid rafts. J Biol Chem 286,
5043–5054.
Bastos AEP, Scolari S, Stöckl M & De Almeida RFM (2012). Applications of
fluorescence lifetime spectroscopy and imaging to lipid domains in vivo. Methods
Enzymol 504, 57–81.
Bligh EG & Dyer WJ (1959). A rapid method of total lipid extraction and purification.
Can J Biochem Physiol.
Bloch K (1957). The Biological Synthesis of Cholesterol. Vitam Horm 15, 119–150.
Brown AJ & Galea AM (2010). Cholesterol as an evolutionary response to living with
Influence of feeding cycle on neuronal plasma membrane
126 PhD thesis - Bastos, AEP (2018)
oxygen. Evolution (N Y) 64, 2179–2183.
Castro BM, De Almeida RFM, Silva LC, Fedorov A & Prieto M (2007). Formation of
ceramide/sphingomyelin gel domains in the presence of an unsaturated
phospholipid: A quantitative multiprobe approach. Biophys J 93, 1639–1650.
Castro BM, Silva LC, Fedorov A, de Almeida RFM & Prieto M (2009). Cholesterol-rich
fluid membranes solubilize ceramide domains: Implications for the structure and
dynamics of mammalian intracellular and plasma membranes. J Biol Chem 284,
22978–22987.
Chavko M, Nemoto EM & Melick J a (1993). Regional lipid composition in the rat brain.
Mol Chem Neuropathol 18, 123–131.
Dart C (2010). Lipid microdomains and the regulation of ion channel function. J Physiol
588, 3169–3178.
Elson EL, Genin GM, Fried E, Dolbow JE & Genin GM (2010). Phase separation in
biological membranes: integration of theory and experiment. Annu Rev Biophys 39,
207–226.
Escribá PV & Nicolson GL (2014). Membrane structure and function: Relevance of lipid
and protein structures in cellular physiology, pathology and therapy. Biochim
Biophys Acta - Biomembr 1838, 1449–1450.
Ingólfsson HI, Carpenter TS, Bhatia H, Bremer PT, Marrink SJ & Lightstone FC (2017).
Computational Lipidomics of the Neuronal Plasma Membrane. Biophys J 113,
2271–2280.
Ingólfsson HI, Melo MN, Van Eerden FJ, Arnarez C, Lopez CA, Wassenaar TA, Periole
X, De Vries AH, Tieleman DP & Marrink SJ (2014). Lipid organization of the
plasma membrane. J Am Chem Soc 136, 14554–14559.
Jiang Q-X & Gonen T (2012). The influence of lipids on voltage-gated ion channels. Curr
Opin Struct Biol 22, 529–536.
Lakowicz JR (2006). Principles of Fluorescence Spectroscopy, Third. Springer.
Laptenok SP (2009). Global analysis of time-resolved fluorescence microspectroscopy
and applications in biomolecular studies (thesis).

Influence of feeding cycle on neuronal plasma membrane
127 PhD thesis - Bastos, AEP (2018)
Lee AG (2006). Ion channels: A paddle in oil. Nature 444, 697.
Lentz BR & Burgess SW (1989). A dimerization model for the concentration dependent
photophysical properties of diphenylhexatriene and its phospholipid derivatives.
DPHpPC and DPHpPA. Biophys J 56, 723–733.
Lingwood D, Kaiser H-J, Levental I & Simons K (2009). Lipid rafts as functional
heterogeneity in cell membranes. Biochem Soc Trans 37, 955–960.
Lingwood D & Simons K (2010). Lipid rafts as a membrane-organizing principle. Science
(80- ) 327, 46–50.
Marquês JT, Antunes CAC, Santos FC & de Almeida RFM (2015). Biomembrane
Organization and Function: The Decisive Role of Ordered Lipid Domains. Adv
Planar Lipid Bilayers Liposomes 22, 65–96.
Mattson MP (2005). Dietary Modulation of Lipid Rafts. Implications for Disease
Prevention and Treatment. In Membrane Microdomain Signaling. Lipid Rafts in
Biology and Medicine, ed. Mattson MP, pp. 191–201. Humana Press.
Mukherjee S, Kombrabail M, Krishnamoorthy G & Chattopadhyay A (2007). Dynamics
and heterogeneity of bovine hippocampal membranes: Role of cholesterol and
proteins. Biochim Biophys Acta - Biomembr 1768, 2130–2144.
Murthy M, Hamilton J, Greiner RS, Moriguchi T, Salem N, Kim H & Differential HK
(2002). Differential effects of n-3 fatty acid deficiency on phospholipid molecular
species composition in the rat hippocampus. J Lipid Res 43, 611–617.
Nakamura K & Handa S (1984). Coomassie brilliant blue staining of lipids on thin-layer
plates. Anal Biochem 142, 406–410.
O’Connor D V. & Phillips D (David) (1984). Time-correlated single photon counting.
Academic Press.
Olsen ASB & Færgeman NJ (2017). Sphingolipids : Membrane microdomains in brain
development, function and neurological diseases. Open Biol 7, 170069.
Pike LJ (2009). The challenge of lipid rafts. J Lipid Res 50, S323–S328.
Poveda JA, Giudici AM, Renart ML, Molina ML, Montoya E & Encinar JA (2014). Lipid
modulation of ion channels through specific binding sites. BBA - Biomembr 1838,
Influence of feeding cycle on neuronal plasma membrane
128 PhD thesis - Bastos, AEP (2018)
1560–1567.
Pucadyil TJ & Chattopadhyay A (2004). Exploring detergent insolubility in bovine
hippocampal membranes: A critical assessment of the requirement for cholesterol.
Biochim Biophys Acta - Biomembr 1661, 9–17.
Quinn PJ & Wolf C (2010). An X-ray diffraction study of model membrane raft
structures. FEBS J 277, 4685–4698.
Reyes Mateo C, Brochon JC, Pilar Lillo M & Ulises Acuña A (1993a). Lipid clustering
in bilayers detected by the fluorescence kinetics and anisotropy of trans-parinaric
acid. Biophys J 65, 2237–2247.
Reyes Mateo C, Tauc P & Brochon JC (1993b). Pressure effects on the physical properties
of lipid bilayers detected by trans-parinaric acid fluorescence decay. Biophys J 65,
2248–2260.
Rouser G, Fkeischer S & Yamamoto A (1970). Two dimensional then layer
chromatographic separation of polar lipids and determination of phospholipids by
phosphorus analysis of spots. Lipids 5, 494–496.
Saxena R, Shrivastava S & Chattopadhyay A (2015). Cholesterol-induced changes in
hippocampal membranes utilizing a phase-sensitive fluorescence probe. Biochim
Biophys Acta - Biomembr 1848, 1699–1705.
Schaeffer EL, Skaf HD, Novaes B de A, da Silva ER, Martins BA, Joaquim HDG &
Gattaz WF (2011). Inhibition of phospholipase A 2 in rat brain modifies different
membrane fluidity parameters in opposite ways. Prog Neuro-Psychopharmacology
Biol Psychiatry 35, 1612–1617.
Schroeder F, Goetz IE & Roberts E (1984). Membrane Anomalies in Huntington’s
Disease Fibroblasts. J Neurochem526–539.
Schroeder F, Gorka C, Williamson LS & Wood WG (1987). The influence of dolichols
on fluidity of mouse synaptic plasma membranes. BBA - Biomembr 902, 385–393.
Sebastião AM, Colino-Oliveira M, Assaife-Lopes N, Dias RB & Ribeiro JA (2013). Lipid
rafts, synaptic transmission and plasticity: Impact in age-related neurodegenerative
diseases. Neuropharmacology 64, 97–107.

Influence of feeding cycle on neuronal plasma membrane
129 PhD thesis - Bastos, AEP (2018)
Sezgin E, Levental I, Mayor S & Eggeling C (2017). The mystery of membrane
organization: Composition, regulation and roles of lipid rafts. Nat Rev Mol Cell Biol
18, 361–374.
Simons K & Sampaio JL (2011). Membrane Organization and Lipid Rafts. Cold Spring
Harb Perspect Biol1–18.
Sklar LA, Hudson BS, Petersen M & Diamond J (1977). Conjugated Polyene Fatty Acids
on Fluorescent Probes: Spectroscopic Characterization. Biochemistry 16, 813–819.
Sonnino S & Prinetti A (2010). Lipids and Membrane Lateral Organization. Front Physiol
1, 1–9.
Sonnino S & Prinetti A (2016). The role of sphingolipids in neuronal plasticity of the
brain. J Neurochem 137, 485–488.
Sun GY, Huang HM, Kelleher JA, Stubbs EB & Sun AY (1988). Marker enzymes,
phospholipids and acyl group composition of a somal plasma membrane fraction
isolated from rat cerebral cortex: a comparison with microsomes and synaptic
plasma membranes. Neurochem Int 12, 69–77.
Tsui-Pierchala BA, Encinas M, Milbrandt J & Johnson EM (2002). Lipid rafts in neuronal
signaling and function. Trends Neurosci 25, 412–417.
Ulmann L, Mimouni V, Roux S, Porsolt R & Poisson JP (2001). Brain and hippocampus
fatty acid composition in phospholipid classes of aged-relative cognitive deficit rats.
Prostaglandins Leukot Essent Fatty Acids 64, 189–195.
Valeur B & Berberan-Santos MN (2012). Molecular Fluorescence: Principles and
Applications, Second. Wiley-VCH Verlag GmbH & Co. KGaA.
Van Meer G (2005). Cellular lipidomics. EMBO J 24, 3159–3165.
Van Meer G & de Kroon AIPM (2011). Lipid map of the mammalian cell. J Cell Sci 124,
5–8.
Van Meer G, Voelker DR & Feigenson GW (2008). Membrane lipids: Where they are
and how they behave. Nat Rev Mol Cell Biol 9, 112–124.
Wen Z & Kim HY (2004). Alterations in hippocampal phospholipid profile by prenatal
exposure to ethanol. J Neurochem 89, 1368–1377.

Influence of feeding cycle on neuronal plasma membrane
130 PhD thesis - Bastos, AEP (2018)
Xu G, Waki H, Kon K & Ando S (1996). Thin-Layer Chromatography of Phospholipids
and Their Lyso Forms: Application to Determination of Extracts from Rat
Hippocampal CA1 Region. Microchem J 53, 29–33.
Zlatkis A, Zak B & Boyle AJ (1953). A new method for the direct determination of serum
cholesterol. J Lab Clin Med 41, 486–492.

Final considerations
131 PhD thesis - Bastos, AEP (2018)
5 Final considerations
5.1 General discussion
The function of hippocampus as a hub for energy balance is a subject of broad and current
interest. This thesis further exploits this point by giving insights into the mechanisms
underlying the adaptation of intrinsic neuronal membrane properties to variations of
physiological metabolism, brought up by the feeding cycle.
A previous work performed on rat hippocampal CA1 neurones had suggested a marked
impact of feeding cycle on the neuronal excitability (Lima et al., 2012). Here, I have
drawn a set of experiments to further investigate such effect and, accordingly, outline
possible underlying mechanisms. Specifically, I have addressed the hypothesis of the
involvement of voltage gated ion channels into the influence of feeding cycle upon
neuronal activity.
The biophysical behaviour of voltage gated Na+ and Ca2+ currents was analysed, given
their importance in the initiation and propagation of action potentials (INa), and influence
on the influx of the most widely known second messenger, Ca2+, into the neurones (ICa).
The electrophysiology findings were obtained in isolated neurones. The enzymatic and
mechanical digestion steps used in this methodological approach might confer an
unpredictable outcome with respect to structure and shape of the neurones. In order to
duly circumvent this technical idiosyncrasy, I have used neurones with identical shape
and appearance (for more details, see section 3.1.4). Such procedure diminished the
variability of the initial conditions. The efficacy of this visual selection was confirmed by
the similarity of the mean membrane capacitance (pF) values observed between all fed
(9.3 ± 0.31pF; n=72) and fasted (8.8 ± 0.4pF; n=81) neurones used in this thesis. Hence,
as the feeding cycle did not influence the membrane capacitance of neurones, the
physiological differences here outlined are attributed to the actual ion channels`
biophysical properties. For example, the conspicuous effect of feeding cycle upon the Na+
current density (pA/pF) reflects a real increase of the current amplitude (pA, not
normalised; data not shown).
The larger Na+ channel density and higher single-Na+ channel conductance assigned to
fed neurones are the foundations of the significant differences observed in the whole-cell

Final considerations
132 PhD thesis - Bastos, AEP (2018)
Na+ current output. Specifically, increased current density (~1.5 fold) and larger window
current (meaning more channels available to respond to activation), upon feeding,
confirm that the feeding cycle alters inward flux of Na+ ions, which, in turn, influence
neuronal excitability. Furthermore, the overall change in the number of channel
population due to the feeding cycle can be virtually quantified. Dividing the mean
maximum conductance of whole-cell recordings by the mean unitary conductance
calculated in single-channel recordings, one yields an estimate of the number of
functional channels (Ogden, 1994; Sakmann & Neher, 1995; Ashcroft, 2000; Hille, 2001)
present at the surface of the neurones. Following this rationale, we have obtained
1.61 × 10⁹ and 1.38 × 10⁹ sodium channels per cm2 of the soma of CA1 pyramidal cells,
in fed and fasted conditions, respectively.
On the other hand, the effect of feeding cycle upon the whole-cell Ca2+ currents was not
so evident, probably because the fact that intracellular calcium concentration ([Ca2+i])
must be tightly regulated. Any small alteration in [Ca2+i] results in a substantial neuronal
physiological output given that numerous intracellular biochemical processes are
modulated by Ca2+. Amongst them, the processes that reinforce the synaptic performance
have to be highlighted. The influence of Ca2+ ions upon such phenomena is well-
established. Ca2+ modulates several preparatory steps of the synaptic processes, mainly
the release of neurotransmitters into the synaptic cleft. Thus, one may state that the
predominance of voltage gated Ca2+ channels that contribute to a major Ca2+ entry into
the neurones will induce a major Ca2+-dependent neuronal response. In this study I have
showed that fed neurones do gather greater conditions to a boost of Ca2+ influence on
neuronal activity, when compared to fasted neurones.
In conclusion, the results obtained from both currents – INa and ICa - point out to an
augmented synaptic performance, after feeding, given the putative increased neuronal
excitability levels, brought up by INa, and the probable potentiation of intracellular Ca2+-
dependent signal transduction, with respect to ICa. Together, these two observations may
render optimal conditions for supporting synaptic plasticity phenomena in fed neurones.
In this way one could establish a bridge between the two roles of hippocampus, either as
a substrate for learning and memory and as a centre of energy homeostasis. Specifically,
the results presented here endorse the role of hippocampus on regulating the start of a
new meal, by the formation of meal episodic-related memories (Higgs, 2002, 2008;
Henderson et al., 2013; Parent, 2016a, 2016b; Hannapel et al., 2017)

Final considerations
133 PhD thesis - Bastos, AEP (2018)
The observed influence of feeding cycle on the biophysical and molecular expression of
voltage-gated Na+ and Ca2+ channels did not have repercussions on the lipid environment
of the plasma membrane. The results presented in this thesis indicate that the organization
and lipid content of the plasma membrane of rat hippocampus did not endure any
notorious variation during the feeding cycle. Such observation is consistent with the
resemblance of the mean membrane capacitance values between fed and fasted neurones
(see above). The absence of meal driven alterations on the lipid membrane environment
may be regarded as a homeostatic mechanism of central nervous system neurones to
preserve their biological functions regardless the peripheral metabolic state. Thus, despite
the variations in the biophysical and molecular behaviour of voltage-gated Na+ and Ca2+
channels imbedded in the plasma membrane, the overall organization and dynamics of
neuronal membranes must be kept under strict parameters, denotating that it is tightly
regulated, in order to maintain the structure and function of the neurones. In other words,
neurones must have a shield mechanism to preserve their functional viability, either when
the animals are fed or maintained in fasting conditions for a period of, at least, 20 hours,
which corresponds to the maximum fasting time spanned in this study. The suggestion
that the relative contribution of lipid-raft domains did not undergo any alteration during
the feeding cycle is a highly relevant indicator of this protecting mechanism, as these
domains segregate all the molecules responsible for the signaling to the interior of the
cells.
Furthermore, the variation observed in the τhslow of INa is not linked to alterations in the
lateral heterogeneity of the plasma membrane, as suggested in the discussion section of
the voltage-gated Na+ currents chapter. However, it must be noted that the interactions
between the channels and the lipids in the vicinity of the channels were not exploited. The
differences obtained in the τhslow may stem from the greater channel density, since more
channels may take, on average, more time to complete the inactivation process.
Further translational perspective – implications of diet on excitability, seizure
controlling and experimental design considerations
Most of the discussion throughout the thesis was held by the effect of the post prandial
period upon the neuronal activity. However, this work can be viewed from a whole
distinct perspective, by considering the benefits of fasting. This is a subject which is
Final considerations
134 PhD thesis - Bastos, AEP (2018)
undergoing intense study due to its impact on epidemic diseases like obesity, and
subsequent consequences on neurological diseases.
Several clinical studies point to a clear influence of diet in neurological disorders, such
as epilepsy and Alzheimer´s disease. For instance, fasting protocols (Intermittent fasting
diet, caloric restriction diet) or diet protocols that pretend to mimic fasting metabolic
states (ketogenic diet) are thought to develop beneficial effects on mitigating the
frequency of epilepsy seizures (Cunnane et al., 2002; Likhodii et al., 2003; Papandreou
et al., 2006; Bough & Rho, 2007; Hartman & Vining, 2007; Rho, 2017). Such observation
may be related with a constant production of ketone bodies induced by fasting (Cunnane
et al., 2002; Likhodii et al., 2003; Mattson, 2008; McNally & Hartman, 2012; Lima et
al., 2014). However, the molecular mechanisms that overrule such effects are not well
understood. Here, the voltage-gated Na+ channels, widely known to play a central role in
the genesis and alleviation of epilepsy (Goldin, 1999; Denac et al., 2000; Eijkelkamp et
al., 2012; Mantegazza & Catterall, 2012; Kaplan et al., 2016; Deuis et al., 2017), are
regarded to mediate the impact of diet and metabolism in epilepsy. Changes in the
biophysics of the Na+ channels may contribute to seizure susceptibility as they are
exquisitely sensitive sites for determining neuronal excitability. Thus, increased
inhibition or decreased excitability, as observed in fasted neurones, if sufficiently intense,
may influence the normal functioning of the brain in addition to controlling seizures. In
contrast, in fed conditions, increased sodium current amplitude, associated with
depolarizing shift in the voltage dependence of inactivation and hyperpolarizing shift in
the voltage dependence of activation, may result in an increase of AP firing frequency
which, eventually, may fallout in an epileptic activity. In conclusion, the results showed
for fasting condition may have a relationship with the present notion in which a fasting
diet slows down the activity of neurones, preventing the outburst of epilepsy seizures
(Likhodii et al., 2003; Bough & Rho, 2007; Fond et al., 2013; Longo & Mattson, 2014;
Rho, 2017). Indeed, a previous report on whole-cell Na+ currents of hippocampal CA1
neurones of chronic epileptic rats showed electrophysiology characteristics reminiscent
of those reported here for fed neurones (Ketelaars et al., 2001). Additionally, it is
noteworthy to mention that the Na+ channels highlighted in this report - Nav1.1 and
Nav1.2 - have been implied in epilepsy seizure activity (Eijkelkamp et al., 2012;
Mantegazza & Catterall, 2012; Kaplan et al., 2016; Deuis et al., 2017).

Final considerations
135 PhD thesis - Bastos, AEP (2018)
These results constitute a major contribution to ameliorate the understanding of the
molecular mechanisms by which fasting affects central nervous system neurones. The
promotion of Na+ channels as molecular determinants in the impact of feeding cycle on
brain function is of the utmost importance because they can help to explain the
underpinning molecular mechanisms of several epidemiologic studies that relate fasting
with seizure control.
This thesis also infers a very practical implication on how neuroscientists should look at
rat preparations as experimental models. The results outlined here raise the levels of
awareness and control one should have on what the feeding-state of each experimental
design may concern. The present report shows that variations in electrophysiological
recordings may solely due, after all, to the fact that a given animal have eaten or not.
Thus, the feeding cycle must be a condition tightly controlled in all electrophysiology
experimental designs.
5.2 Future perspectives
The findings presently reported might be also translated into the influence of peripheral
physiological metabolism upon cognitive processes, since hippocampus is considered
central in operations related with memory and learning. It is plausible to envisage
different firing patterns in hippocampus slices from fed and fasted rats, which in the long
run may affect consolidation of cognitive processes such as learning and memory. Scaling
out these findings into a more physiological context will enable a more robust
interpretation. Thus, whole-cell current clamp recordings in hippocampal CA1 neurones
within brain slices obtained from fed and fasted rats will help us to confirm and
understand better the higher levels of neuronal excitability This would be done by
studying the action potential shape, firing patterns and induction thresholds. Finally,
synaptic current measurements in hippocampal slices will also be highly valuable to
understand further if there is a potentiation of synaptic function through over feeding and,
accordingly, provide functional implications of physiological metabolism.
Furthermore, to support the interpretation of the results here presented and to answer
questions raised by this work, the following experiments/studies are proposed:

Final considerations
136 PhD thesis - Bastos, AEP (2018)
• Immunostaining studies (western blotting and/or immunocytochemistry) will be
applied to assess the expression of other Nav isoforms, namely Nav1.1, in fed
and fasted neurones.
• Voltage activated Ca2+ currents will be recorded from the isolated neurones
using different selective blockers to confirm the nature of the currents involved
in the tidal variation brought up by the feeding cycle.
• Measurements of cytosolic Ca2+ concentration can be used to confirm the larger
entry of Ca2+ into the fed neurones. This can be done on single neurones by
using ester-loaded with the fluorescent indicator Fura2 and ratiometric
measurements.
• Study the lipid organization at the vicinity of the Na+ channels, in order to
confirm if the plasma membrane exerts any effect on the conformational
rearrangements of the outer pore of the Na+ channels. For such, it is important to
apply fluorescence spectroscopy studies on fluorophores that bind to the
extracellular pore of the channels, such as fluorescent and photoactivatable
fluorescent derivatives of tetrodotoxin (TTX, Angelides, 1981) or fluorescently
labelled derivatives of saxitoxin (STX, Ondrus et al., 2012).

Final considerations
137 PhD thesis - Bastos, AEP (2018)
5.3 References
Angelides KJ (1981). Fluorescent and Photoactivatable Fluorescent Derivatives of
Tetrodotoxin To Probe the Sodium Channel of Excitable Membranes. Biochemistry
20, 4107–4118.
Ashcroft FM (2000). Ion Channels and Disease. Academic Press, Oxford, United
Kingdom.
Bough KJ & Rho JM (2007). Anticonvulsant mechanisms of the ketogenic diet. Epilepsia
48, 43–58.
Cunnane SC, Musa K, Ryan M a, Whiting S & Fraser DD (2002). Potential role of
polyunsaturates in seizure protection achieved with the ketogenic diet.
Prostaglandins Leukot Essent Fatty Acids 67, 131–135.
Denac H, Mevissen M & Scholtysik G (2000). Structure, function and pharmacology of
voltage-gated sodium channels. Naunyn Schmiedebergs Arch Pharmacol 362, 453–
479.
Deuis JR, Mueller A, Israel MR & Vetter I (2017). Neuropharmacology The
pharmacology of voltage-gated sodium channel activators. Neuropharmacology;
DOI: 10.1016/j.neuropharm.2017.04.014.
Eijkelkamp N, Linley JE, Baker MD, Minett MS, Cregg R, Werdehausen R, Rugiero F
& Wood JN (2012). Neurological perspectives on voltage-gated sodium channels.
Brain 135, 2585–2612.
Fond G, Macgregor A, Leboyer M & Michalsen A (2013). Fasting in mood disorders:
Neurobiology and effectiveness. A review of the literature. Psychiatry Res 209, 253–
258.
Goldin AL (1999). Diversity of mammalian voltage-gated sodium channels. Ann N Y
Acad Sci 868, 38–50.
Hannapel RC, Henderson YH, Nalloor R, Vazdarjanova A & Parent MB (2017). Ventral
hippocampal neurones inhibit postprandial energy intake. Hippocampus 27, 274–
284.
Hartman AL & Vining EPG (2007). Clinical Aspects of the Ketogenic Diet. Epilepsia 48,
Final considerations
138 PhD thesis - Bastos, AEP (2018)
31–42.
Henderson YO, Smith GP & Parent MB (2013). Hippocampal neurones inhibit meal
onset. Hippocampus 23, 100–107.
Higgs S (2002). Memory for recent eating and its influence on subsequent food intake.
Appetite 39, 159–166.
Higgs S (2008). Cognitive influences on food intake: The effects of manipulating memory
for recent eating. Physiol Behav 94, 734–739.
Hille B (2001). Ion Channels of Excitable Membranes, Third. Sinauer Associates, Inc.
Kaplan DI, Isom LL & Petrou S (2016). Role of Sodium Channels in Epilepsy. Cold
Spring Harb Perspect Med 6, a022814.
Ketelaars SOM, Gorter JA, Van Vliet EA, Lopes da Silva FH & Wadman WJ (2001).
Sodium currents in isolated rat CA1 pyramidal and dentate granule neurones in the
post-status epilepticus model of epilepsy. Neuroscience 105, 109–120.
Likhodii SS, Serbanescu I, Cortez MA, Murphy P, Snead OC & Burnham WM (2003).
Anticonvulsant properties of acetone, a brain ketone elevated by the ketogenic diet.
Ann Neurol 54, 219–226.
Lima PA, Costa PC, Mondragão M, Alves FM, Costa G, Hardy D, Jalil A, Ogden D &
Auger. C (2012). Metabolic states induced by feeding/fasting influence insulin-
induced excitability and levels of insulin receptor in hippocampal but not cerebellar
neurones. In 8 th FENS Forum of Neuroscience.
Lima P, Sampaio L & Damasceno N (2014). Neurobiochemical mechanisms of a
ketogenic diet in refractory epilepsy. Clinics 69, 699–705.
Longo VD & Mattson MP (2014). Fasting: Molecular Mechanisms and Clinical
Applications. Cell Metab 19, 181–192.
Mantegazza M & Catterall WA (2012). Voltage-gated Na channels. In Jasper´s Basic
Mechanisms of the Epilepsies, 4th edn., pp. 67–96.
Mattson MP (2008). Dietary factors, hormesis and health. Ageing Res Rev 7, 43–48.
McNally MA & Hartman AL (2012). Ketone Bodies in Epilepsy. J Neurochem 121, 28–
35.

Final considerations
139 PhD thesis - Bastos, AEP (2018)
Ogden D ed. (1994). Microelectrode techniques: the Plymouth Workshop handbook, 2nd
edn. The Company of Biologists.
Ondrus AE, Lee HD, Iwanaga S, Parsons WH, Andresen BM, Moerner WE & Bois J Du
(2012). Fluorescent Saxitoxins for Live Cell Imaging of Single Voltage- Gated
Sodium Ion Channels beyond the Optical Diffraction Limit. J Chem Biol 19, 902–
912.
Papandreou D, Pavlou E, Kalimeri E & Mavromichalis I (2006). The ketogenic diet in
children with epilepsy. Br J Nutr 95, 5.
Parent MB (2016a). Dorsal Hippocampal–Dependent Episodic Memory Inhibits Eating.
Curr Dir Psychol Sci 25, 461–466.
Parent MB (2016b). Cognitive control of meal onset and meal size: Role of dorsal
hippocampal-dependent episodic memory. Physiol Behav 162, 112–119.
Rho JM (2017). How does the ketogenic diet induce anti-seizure effects? Neurosci Lett
637, 4–10.
Sakmann B & Neher E eds. (1995). Single-channel recording, Second. Plenum Press,
New York.

Annex I – hippocampal neurones
140 PhD thesis - Bastos, AEP (2018)
6 ANNEX I
6.1 Hippocampus – historical perspective of anatomy and circuitry
There are several reasons the hippocampus has attracted the interest of scientists (…) The
hippocampus has something for everyone (Andersen et al., 2007)
Hippocampus is a complex brain structure embedded deep into the temporal lobe. The
hippocampus received its name from the Italian anatomist Julius Caesar Arantius in the
late 16th century (1587), who considered the three-dimensional form of the human
hippocampus to be reminiscent of the seahorse. The Latin word hippocampus was then
coined from the Greek word hippokampos (hippos meaning “horse” and kampos meaning
“sea monster”). Its terminology has suffered continuous alterations, which resulted in a
certain vagueness regarding the terminology and anatomical description of the
hippocampus (Walther, 2002). Currently, it is accepted that the term hippocampus is
applied for the region of the hippocampal formation that comprises the CA (cornu
ammonis, latin for ‘horn of the ram’) fields (CA3, CA2, CA1), identified by the
neuroanatomist Rafael Lorente de Nó (Lorente de Nó, 1934). In contrast, the term
hippocampal formation is applied to a cytoarchitectonic group of distinct contiguous
regions including the dentate gyrus, hippocampus, subiculum, presubiculum,
parasubiculum, and entorhinal cortex. These six regions are linked, one to the next, by
unique and largely unidirectional (functional) neuronal pathways.
Ramon y Cajal`s monumental effort (Ramón y Cajal, 1893), including an analysis of all
portions of the hippocampal formation in several animal species, allowed him to propose
a first functional circuit diagram of this region. Following his two fundamental laws –
Neuron Doctrine and Dynamic Polarization - he placed arrows indicating his view of the
direction of impulse flow through the hippocampal formation (Figure 6.1). Briefly, the
former principle states that the nerve cell (neuron) is the structural and functional unit of
nervous system circuitry, and nerve cells interact with other nerve cells by way of contact
or contiguity, contrasting with the idea of direct continuity between nerve cells as stated
by the Reticular Theory, held by a contemporary scientist, Camilo Golgi (1886). The
second law states that information flows through a nerve cell, and thus through neural
circuits, in one direction - input to the dendrites, output through the axon -, which, once

Annex I – hippocampal neurones
141 PhD thesis - Bastos, AEP (2018)
again, contradicts Golgi´s concept regarding dendrites function as being the roots of the
nerve cells (Newman et al., 2017).
All the studies undertaken by Ramón y Cajal came, ironically, from preparations made
with Golgi’s method. They ended up sharing the Nobel Prize for Physiology or Medicine
in 1906; Golgi had provided the method and Cajal had given us new and penetrating
insights into the structure of the brain and spinal cord.
6.1.1 Intrinsic hippocampal circuit
The flow of signals between hippocampal neurones is unidirectional, since the output of
a given structure of the hippocampal formation does not flow back to the previous
structure from which it received an input. That said, much of the neocortical input
reaching the hippocampal formation does so through the entorhinal cortex, which can, for
convenience, be considered the first step in the intrinsic hippocampal circuit (Figure 6.2).
Figure 6.1- Santiago Ramon y Cajal and his famous drawing of the hippocampus in his 1911 book
Histologie de Système Nerveux. The arrows give his interpretation of likely impulse direction. Taken
from Andersen et al., 2007

Annex I – hippocampal neurones
142 PhD thesis - Bastos, AEP (2018)
Cells in the superficial layers of the entorhinal cortex give rise to axons that project,
among other destinations, to the dentate gyrus. The projections from the entorhinal cortex
to the dentate gyrus form part of the major hippocampal input pathway called the
perforant path. Although the entorhinal cortex provides the major input to the dentate
gyrus, the dentate gyrus does not project back to the entorhinal cortex. Likewise, the
principal cells of the dentate gyrus, the granule cells, give rise to axons called mossy fibers
that connect with pyramidal cells of the CA3 field of the hippocampus. The CA3 cells,
however, do not project back to the granule cells. The pyramidal cells of CA3, in turn,
are the source of the major input to the CA1 hippocampal field (the Schaffer collateral
axons). Following the pattern of its predecessors, CA1 does not project back to CA3. The
CA1 field of the hippocampus then projects unidirectionally to the subiculum and to the
Figure 6.2- Lamellar or transversal circuitry of the hippocampal formation. A) Neurones in layer II of the
entorhinal cortex (EC) project to the dentate gyrus (DG) and the CA3 field of the hippocampus proper via the
perforant pathway. Neurones in layer III of the entorhinal cortex project to the CA1 field of the hippocampus
and the subiculum via the perforant and alvear pathways. The granule cells of the dentate gyrus project to the
CA3 field of the hippocampus via mossy fiber projections. Pyramidal neurones in the CA3 field of the
hippocampus project to CA1 via Schaffer collaterals. Pyramidal cells in CA1 project to the subiculum. Both
CA1 and the subiculum project back to the deep layers of the entorhinal cortex. B. Projections along the
transverse axis of the hippocampal formation; the dentate gyrus is located proximally and the entorhinal cortex
distally. Taken from (Andersen et al., 2007)

Annex I – hippocampal neurones
143 PhD thesis - Bastos, AEP (2018)
entorhinal cortex, closing the hippocampal processing loop that begins in the superficial
layers of the entorhinal cortex and ends in its deep layers.
6.2 Rat hippocampal CA1 neurones
The rat hippocampal formation is an elongated, banana-shaped structure. The long axis
of the hippocampal formation is referred to as the septotemporal (or dorsal-ventral) axis
and the orthogonal axis as the transverse axis (Figure 6.3).
The transversal axis unveils the laminar/layer organization of the hippocampus, which is
generally similar for all the fields of the hippocampus. The principal cellular layer is
called the pyramidal cell layer, which is tightly packed in CA1 (Figure 6.4). The narrow,
relatively cell-free layer located deep to the pyramidal cell layer is called the stratum
oriens. This layer contains the basal dendrites of the pyramidal cells and several classes
of interneurones. The stratum radiatum is located immediately above the pyramidal cell
layer in CA2 and CA1. The most superficial layer of the hippocampus is called the
stratum lacunosum-moleculare.
Figure 6.3 - Line drawing of the rat brain showing
the septotemporal and transverse axes of the
hippocampal formation

Annex I – hippocampal neurones
144 PhD thesis - Bastos, AEP (2018)
Figure 6.4- Anatomy of rat hippocampal CA1 neuron. A) Camera lucida drawing of a CA1 pyramidal
neuron from the midportion of the field. Note that side branches originate from the primary dendrites
throughout the full extent of the stratum radiatum. Note also the curved and irregular trajectories of
dendritic branches in the stratum lacunosum-moleculare. The axon of this neuron is indicated by an
arrowhead. pcl, pyramidal cell layer; sl-m, stratum lacunosum-moleculare; so, stratum oriens; sr, stratum
radiatum. Bar 100 µm. B) Photomicrographs of intracellularly labeled pyramidal cells in CA1 from rat
hippocampus. Small arrows indicate the initial portion of the axon. Adapted from (Ishizuka et al., 1995).
CA1 pyramidal cells show remarkable homogeneity of their dendritic trees. As well as
being more homogeneous, they are also, on average, smaller than CA3 cells. The total
dendritic length averages approximately 13.5 mm, and the average size of CA1 cell
somata is about 193 µm2 or 15 µm in diameter (Bannister & Larkman, 1995a, 1995b;
Ishizuka et al., 1995).
The CA1 pyramidal neuron is arguably the most studied class of neuron in the brain, and
probably better understood from both structural and functional points of view than any
other type of neuron in the hippocampus. There are enough reasons that justify why most
of the studies have focused on the CA1 region: a) Relative ease of obtaining field potential
recordings and intracellular recordings in this region; b) Schaffer collateral axons from
CA3 form a homogeneous pathway that is easily activated to study synaptic transmission
and plasticity; c) Studies of CA1 are more numerous than adjacent CA3 because it is
A B

Annex I – hippocampal neurones
145 PhD thesis - Bastos, AEP (2018)
generally easier to keep cells in this region alive and healthy in slice and acutely isolated
preparations; d) CA1 pyramidal neurones have been the focus of several studies of
dendritic integration because of the large primary apical dendrite, from which dendritic
patch-clamp recordings can be obtained routinely.
In fact, the electrophysiological studies on CA1 neurones were of the utmost importance
as they have contributed to tremendous advances in understanding synaptic transmission,
integration, and plasticity in the CNS. Thus, the CA1 subfield lends optimal conditions
to study the effect of feeding cycle on the behaviour of ion channels present at the surface
of rat hippocampal neurones.

Annex I – hippocampal neurones
146 PhD thesis - Bastos, AEP (2018)
6.3 References
Andersen P, Morris R, Amaral D, Bliss T & O`Keefe J (2007). The Hippocampus Book.
Oxford University Press, Mew York.
Bannister N & Larkman AU (1995a). Dendritic Morphology of CAl Pyramidal Neurones
From the Rat Hippocampus: 11. Spine Distributions. J Comp Neurol 360, 161–171.
Bannister NJ & Larkman AU (1995b). Dendritic morphology of CA1 pyramidal neurones
from the rat hippocampus: I. Branching patterns. J Comp Neurol 360, 150–160.
Ishizuka N, Cowan WM & Amaral DG (1995). A quantitative analysis of the dendritic
organization of pyramidal cells in the rat hippocampus. J Comp Neurol 362, 17–45.
Newman EA, Araque A, Dubinsky JM, Swanson LW, King L & Himmel E (2017). The
Beautiful Brain. The Drawings of Santiago Ramón y Cajal. Abrams.
Walther C (2002). Hippocampal terminology: Concepts, misconceptions, origins.
Endeavour 26, 41–44.

Annex II – Patch clamp techniques
147 PhD thesis - Bastos, AEP (2018)
7 ANNEX II
7.1 Voltage clamp techniques
Much of what we know about the properties of ion channels in cell membranes has come
from experiments using voltage clamp (VC). The method was first developed by Cole
(Cole, K.S, 1949) and Hodgkin et al. (Hodgkin & Huxley, 1952a, 1952b) for use with the
squid giant axon.
In a VC experiment, the membrane potential of a cell is controlled from an external device
(the VC amplifier), with the goal of measuring the ionic currents that flow through the
channels in the cell membrane at this given command potential. This requires an active
compensation of the current flow across the membrane. The membrane potential is
measured and compared to the command signal; the VC amplifier compensates by active
charge injection the deviation to keep the error as small as possible. The quality of the
current recording is mainly determined by this error signal. In summary, the method
allows ion flow across a cell membrane to be measured as electric current, whilst the
membrane voltage is held under experimental control with a feedback amplifier. The
usefulness of the voltage clamp stems firstly from the fact that it allows the separation of
membrane ionic (through open ion channels) and capacitive (charging of the membrane
capacitance) currents; when the potential is held constant, there will be no capacity
current and the ionic current will be the same as the total membrane current. A further
advantage is that it prevents the regenerative potential response (the action potential) that
is triggered by the activation of voltage-gated ion channels. Thus, it enables the currents
responsible for the action potential to be investigated in a quantitative way.
Many variants of the VC technique have evolved since its advent, and voltage clamp
analysis has been extended to a wide range of tissues.
This thesis encompassed VC methods that are used to measure currents from 1) whole
cells or large areas of membrane containing at least a few hundred channels -macroscopic
currents or whole-cell currents - and from 2) an isolated small patch of membrane
containing just a few (ideally, one) ion channels – microscopic or single-channel currents.
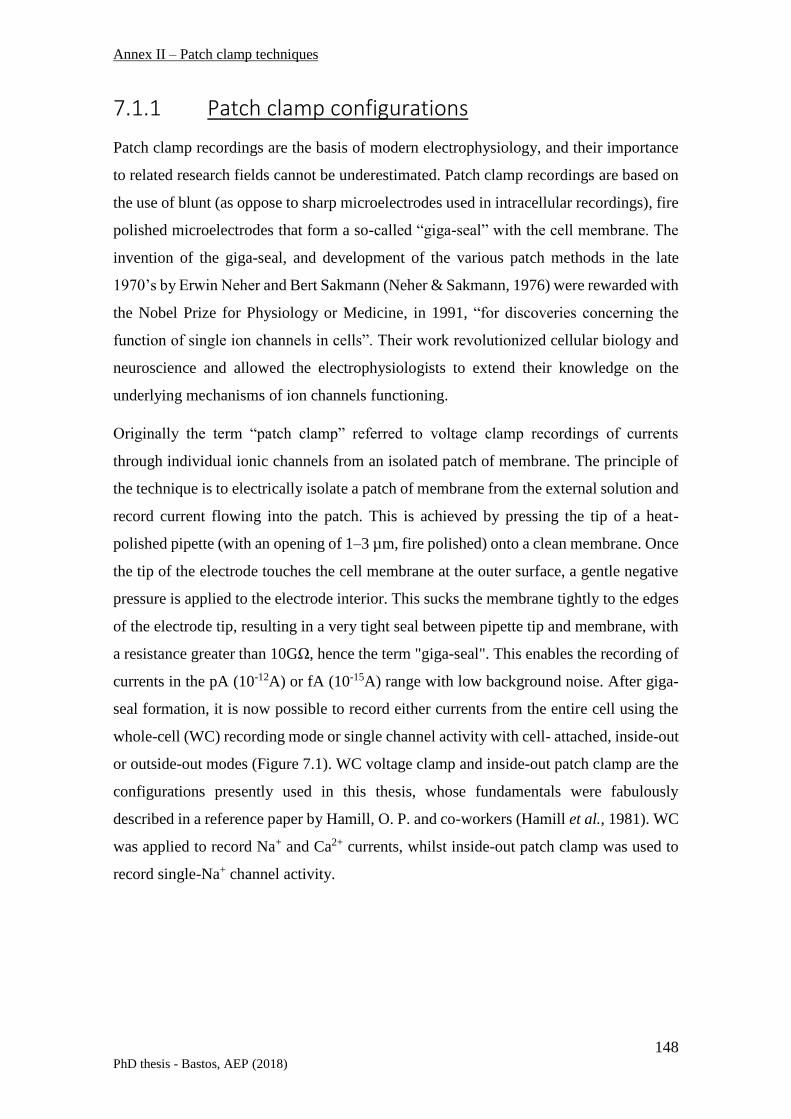
Annex II – Patch clamp techniques
148 PhD thesis - Bastos, AEP (2018)
7.1.1 Patch clamp configurations
Patch clamp recordings are the basis of modern electrophysiology, and their importance
to related research fields cannot be underestimated. Patch clamp recordings are based on
the use of blunt (as oppose to sharp microelectrodes used in intracellular recordings), fire
polished microelectrodes that form a so-called “giga-seal” with the cell membrane. The
invention of the giga-seal, and development of the various patch methods in the late
1970’s by Erwin Neher and Bert Sakmann (Neher & Sakmann, 1976) were rewarded with
the Nobel Prize for Physiology or Medicine, in 1991, “for discoveries concerning the
function of single ion channels in cells”. Their work revolutionized cellular biology and
neuroscience and allowed the electrophysiologists to extend their knowledge on the
underlying mechanisms of ion channels functioning.
Originally the term “patch clamp” referred to voltage clamp recordings of currents
through individual ionic channels from an isolated patch of membrane. The principle of
the technique is to electrically isolate a patch of membrane from the external solution and
record current flowing into the patch. This is achieved by pressing the tip of a heat-
polished pipette (with an opening of 1–3 µm, fire polished) onto a clean membrane. Once
the tip of the electrode touches the cell membrane at the outer surface, a gentle negative
pressure is applied to the electrode interior. This sucks the membrane tightly to the edges
of the electrode tip, resulting in a very tight seal between pipette tip and membrane, with
a resistance greater than 10GΩ, hence the term "giga-seal". This enables the recording of
currents in the pA (10-12A) or fA (10-15A) range with low background noise. After giga-
seal formation, it is now possible to record either currents from the entire cell using the
whole-cell (WC) recording mode or single channel activity with cell- attached, inside-out
or outside-out modes (Figure 7.1). WC voltage clamp and inside-out patch clamp are the
configurations presently used in this thesis, whose fundamentals were fabulously
described in a reference paper by Hamill, O. P. and co-workers (Hamill et al., 1981). WC
was applied to record Na+ and Ca2+ currents, whilst inside-out patch clamp was used to
record single-Na+ channel activity.

Annex II – Patch clamp techniques
149 PhD thesis - Bastos, AEP (2018)
7.1.1.1 Whole-cell and inside-out patch clamp recordings – technical singularities and procedure
Upon formation of a giga seal (cell-attached configuration in figure 7.1), withdrawing the
pipette from the cell (in a sharply upwards movement) results in an excised membrane
patch with its cytoplasmic side exposed to the bath solution - Inside-out patch
configuration. The likely formation of vesicles at the tip of the pipette upon this
movement is prevented by the chelation of calcium ions in the bath solution (Hamill et
al., 1981). This configuration has the advantage of allowing the control of the
transmembrane voltage (inverted in this case), as well as the access to the intracellular
part of the channels. This is extremely important for the study of the influence of
cytoplasmic constituents or second messengers on channel activity or address events that
occur at the cytoplasm milieu of the channels (e.g., removal of fast inactivation by
application of proteases) (Patlak & Horn, 1982; Horn & Vandenberg, 1984; Vandenberg
Figure 7.1- Schematic representation of
the procedures for various recording
configurations. A fine tipped (about 0.5 to
5µm in tip diameter) glass patch electrode
is used as a current monitor and the voltage
in the pipette is held at a desired level. The
first step in applying the technique is the
formation of a high resistance seal between
the patch electrode and the surface of the
cell. Once the seal is established, several
recording configurations are available to
the investigator, and these fall into two
broad categories. On the one hand, current
flow through the patch of membrane under
the electrode tip can be monitored, in which
case single channel currents are usually
recorded. Alternatively, for whole cell
recording, the patch of membrane can be
disrupted so that the electrode monitors
current flow through the entire cell surface.
Taken from (Lehmann-Horn & Jurkat-Rott,
2003)

Annex II – Patch clamp techniques
150 PhD thesis - Bastos, AEP (2018)
& Horn, 1984; Patlak, 1991). However, the lower structure stability of the excised patch
(when compared to cell-attached patch), along with the loss of cytoplasmic constituents
might impair the intrinsic behavior of ion channel proteins. Moreover, the signal-to-noise
output is a major concern, as the currents are recorded in a pA range, instead the nA
(1000-fold) obtained in WC (see Table 7.1). Hence, to attain a proper single channel
recording with low noise levels, one needs to comply with a demanding setting up, whose
laborious steps are described in the materials and methods section of chapter 3 (section
3.1.6).
Instead of withdrawing the patch pipette from the membrane after seal formation,
application of gentle suction will disrupt the membrane patch directly under the pipette,
leading to the formation of a low resistance (in the MΩ range) pathway between the cell
interior and the solution in the pipette – whole-cell (WC) configuration. The interior of
the cell and the solution of the pipette become contiguous and the currents passing
through the entire cell membrane are recorded. This configuration is equivalent to
intracellular recording with sharp microelectrodes and has the advantage that it can be
applied to very tiny or flat cells that would be impossible to impale. However, because
the cell interior is being perfused with pipette solution, this configuration has the
disadvantage that certain cytosolic factors important for cellular function may be washed
out.
Formation of the WC configuration becomes immediately apparent by the sudden
appearance of large capacity transients at the beginning and end of the test pulse, which
reflect the charging and discharging of the capacitance of the cell membrane. These
transients can be minimized using the whole-cell capacitance (Cm) cancellation and series
resistance (Rs) compensation dials on the patch-clamp amplifier. This allows a crude
estimation of the cell capacitance (and hence cell size) to be made because cell
membranes have a constant specific capacitance of 1µF/cm2. Smaller Cm and Rs values
render better voltage clamping conditions, as the membrane reaches the steady-state
voltage command potential rather faster.

Annex II – Patch clamp techniques
151 PhD thesis - Bastos, AEP (2018)
Single-channel recordings, thus, have their own particularities when compared to WC.
The most relevant differences are depicted in table 7.1, highlighting the conditions used
in this work.
7.1.2 Principles of patch-clamp recording – technical instrumentation
The patch pipettes are mounted on a pipette holder that connects the Ag wire electrode
(coated with AgCl), immersed into the pipette solution, directly to the headstage amplifier
(Figure 7.2). Patch clamp amplifiers are based on a current-to-voltage (I/V) converter
circuit, which transfers the pipette current into an equivalent output voltage. Therefore,
they cannot measure membrane potentials directly. The key element in the patch clamp
recording is the feedback amplifier in the headstage (Figure 7.2, inset).
Single-channel (inside-out)
patch clampWhole-cell
Pipette
Tip diameter (µm) 1 to 2 2 to 3
Rod length (cm) ~3 ~5
Shank Coating Sylgard -
Resistance 13-25 MΩ 3-5 MΩ
Outside/Inside diameter
(mm)1.5/0.86 1.5/1.05
Capacitance ↓ ↑
Seal resistance >10GΩ MΩ
Recording currents pA (10-12A); fA (10-15A) nA (10-9A)
Table 7.1- Main technical differences between the two patch clamp configurations used in this study.
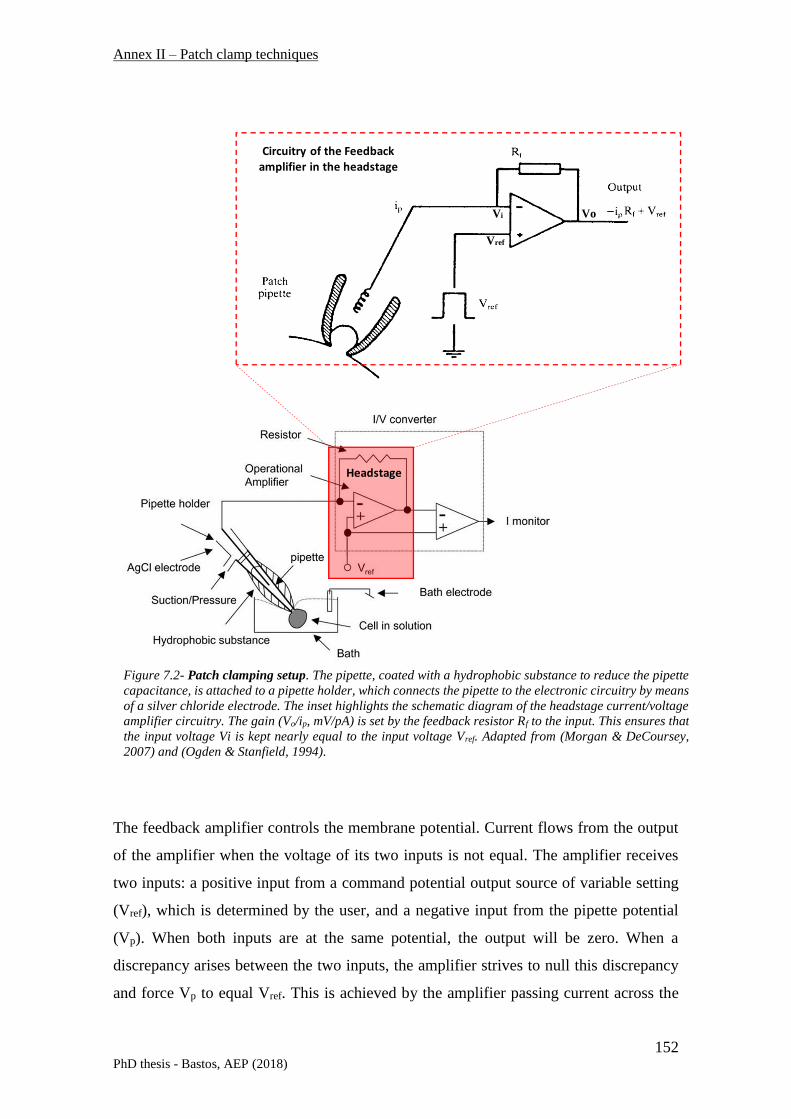
Annex II – Patch clamp techniques
152 PhD thesis - Bastos, AEP (2018)
The feedback amplifier controls the membrane potential. Current flows from the output
of the amplifier when the voltage of its two inputs is not equal. The amplifier receives
two inputs: a positive input from a command potential output source of variable setting
(Vref), which is determined by the user, and a negative input from the pipette potential
(Vp). When both inputs are at the same potential, the output will be zero. When a
discrepancy arises between the two inputs, the amplifier strives to null this discrepancy
and force Vp to equal Vref. This is achieved by the amplifier passing current across the
Headstage
Circuitry of the Feedback amplifier in the headstage
Figure 7.2- Patch clamping setup. The pipette, coated with a hydrophobic substance to reduce the pipette
capacitance, is attached to a pipette holder, which connects the pipette to the electronic circuitry by means
of a silver chloride electrode. The inset highlights the schematic diagram of the headstage current/voltage
amplifier circuitry. The gain (Vo/ip, mV/pA) is set by the feedback resistor Rf to the input. This ensures that
the input voltage Vi is kept nearly equal to the input voltage Vref. Adapted from (Morgan & DeCoursey,
2007) and (Ogden & Stanfield, 1994).
Vi
Vref
Vo

Annex II – Patch clamp techniques
153 PhD thesis - Bastos, AEP (2018)
feedback resistor, Rf, to drive the inside of the cell to the reference potential. This current
supplied by the feedback amplifier is equal and opposite to the current carried by ions
flowing across the membrane. The current flowing through the pipette (Ip) to clamp the
cell membrane is proportional to the voltage drop (Vout - Vp) across the resistor, Rf,
according to Ohm's law
−𝑖𝑝𝑅𝑓 = 𝑉𝑜𝑢𝑡 − 𝑉𝑟𝑒𝑓 (Equation 7.1)
In practice, therefore, pipette current is monitored by a differential amplifier that
constantly measures the difference between Vref and Vout. This subtraction, which happens
in a later stage on the circuitry, generates an output voltage that is purely proportional to
the patch membrane current (recorded as opening and closures of individual channels).
Thus, since the potential in the pipette is equal to Vref, the patch membrane potential can
be held in a steady state level or changed in stepwise fashion by changing Vref. During
recordings, pulses from a computer (Vcommand) were used to change Vref in a stepwise way.
From Equation 7.1, it follows that the sensitivity of current measurement is inversely
proportional to the size of the Rf, with a large resistor enabling measurement of smaller
current amplitudes and lower background noise levels. For recording currents in the pA
range, a high value feedback resistor Rf is needed (up to 50 GΩ). In the inside-out
configuration presently used, another approach suitable for high-resolution recordings has
been applied - the “capacitive feedback” technique (also called integrating headstage).
Here, a capacitor replaces the feedback resistor and the headstage circuit becomes an
integrator. This approach has a superior noise performance compared to the resistive
feedback, as long as the input (stray) capacitance can be kept low (clearly below 10 pF).
In the whole cell configuration, larger currents are needed (in the nA range), therefore,
the feedback resistor is in the range of a few ten MΩ. Subsequently, the voltage drop
across the pipette resistance cannot be ignored, and needs to be compensated
electronically, by adjusting the Rs compensation dial on the electromer.

Annex II – Patch clamp techniques
154 PhD thesis - Bastos, AEP (2018)
7.2 References
Hamill OP, Marty A, Neher E, Sakmann B & Sigworth FJ (1981). Improved patch-clamp
techniques for high-resolution current recording from cells and cell-free membrane
patches. Pflugers Arch Eur J Physiol 391, 85–100.
Hodgkin AL & Huxley AF (1952a). A quantitative description of membrane current and
its application to conduction and excitation in nerve. J Physiol 117, 500–544.
Hodgkin AL & Huxley AF (1952b). Currents carried by sodium and potassium ions
through the membrane of the giant axon of Loligo. J Physiol 116, 449–472.
Hodgkin AL & Huxley AF (1952c). The dual effect of membrane potential on sodium
cinductance in the giant axon of Loligo. J Physiol 116, 497–506.
Hodgkin AL, Huxley AF & Katz B (1952). Measurement of current-voltage relations in
the membrane of the giant axon of Loligo. J Physiol 116, 424–448.
Hodgkin AL & Huxley A.F. (1952). The Components of Membrane Counductance in the
Giant Axon of Loligo. J Physiol 116, 473–496.
Horn R & Vandenberg CA (1984). Statistical properties of single sodium channels. J Gen
Physiol 84, 505–534.
Lehmann-Horn F & Jurkat-Rott K (2003). Nanotechnology for neuronal ion channels. J
Neurol Neurosurg Psychiatry 74, 1466–1475.
Morgan D & DeCoursey TE (2007). Analysis of electrophysiological properties and
responses of neutrophils. In Neutrophil Methods and Protocols. Methods in
Molecular Biology, ed. Quinn MT, DeLeo FR & Bokoch GM, pp. 139–175. Humana
Press.
Neher E & Sakmann B (1976). Single-channel currents recorded from membrane of
denervated frog muscle fibres. Nature 260, 799–802.
Ogden D & Stanfield P (1994). Patch clamp techniques for single channel and whole-cell
recording. In Microelectrode techniques: the Plymouth Workshop handbook,
Patlak J & Horn R (1982). Effect of N-bromoacetamide on single sodium channel currents
in excised membrane patches. J Gen Physiol 79, 333–351.

Annex II – Patch clamp techniques
155 PhD thesis - Bastos, AEP (2018)
Vandenberg CA & Horn R (1984). Inactivation viewed through single sodium channels.
J Gen Physiol 84, 535–564.