down-regulation of htra1 activates the epithelial ... · down-regulation of htra1 activates the...
TRANSCRIPT

Down-Regulation of HtrA1 Activates the Epithelial-Mesenchymal Transition and ATM DNA DamageResponse PathwaysNing Wang1, Kristin A. Eckert1, Ali R. Zomorrodi2, Ping Xin1, Weihua Pan1, Debra A. Shearer3,
Judith Weisz3, Costas D. Maranus2, Gary A. Clawson1,4*
1 Gittlen Cancer Research Institute & Department of Pathology, College of Medicine, Pennsylvania State University, Hershey, Pennsylvania, United States of America,
2 Department of Chemical Engineering, Pennsylvania State University, University Park, Pennsylvania, United States of America, 3 Department of Obstetrics & Gynecology,
Pennsylvania State University, Hershey, Pennsylvania, United States of America, 4 Materials Research Institute, Pennsylvania State University, University Park, Pennsylvania,
United States of America
Abstract
Expression of the serine protease HtrA1 is decreased or abrogated in a variety of human primary cancers, and higher levelsof HtrA1 expression are directly related to better response to chemotherapeutics. However, the precise mechanisms leadingto HtrA1 down regulation during malignant transformation are unclear. To investigate HtrA1 gene regulation in breastcancer, we characterized expression in primary breast tissues and seven human breast epithelial cell lines, including twonon-tumorigenic cell lines. In human breast tissues, HtrA1 expression was prominent in normal ductal glands. In DCIS and ininvasive cancers, HtrA1 expression was greatly reduced or lost entirely. HtrA1 staining was also reduced in all of the humanbreast cancer cell lines, compared with the normal tissue and non-tumorigenic cell line controls. Loss of HtrA1 geneexpression was attributable primarily to epigenetic silencing mechanisms, with different mechanisms operative in thevarious cell lines. To mechanistically examine the functional consequences of HtrA1 loss, we stably reduced and/oroverexpressed HtrA1 in the non-tumorigenic MCF10A cell line. Reduction of HtrA1 levels resulted in the epithelial-to-mesenchymal transition with acquisition of mesenchymal phenotypic characteristics, including increased growth rate,migration, and invasion, as well as expression of mesenchymal biomarkers. A concomitant decrease in expression ofepithelial biomarkers and all microRNA 200 family members was also observed. Moreover, reduction of HtrA1 expressionresulted in activation of the ATM and DNA damage response, whereas overexpression of HtrA1 prevented this activation.Collectively, these results suggest that HtrA1 may function as a tumor suppressor by controlling the epithelial-to-mesenchymal transition, and may function in chemotherapeutic responsiveness by mediating DNA damage responsepathways.
Citation: Wang N, Eckert KA, Zomorrodi AR, Xin P, Pan W, et al. (2012) Down-Regulation of HtrA1 Activates the Epithelial-Mesenchymal Transition and ATM DNADamage Response Pathways. PLoS ONE 7(6): e39446. doi:10.1371/journal.pone.0039446
Editor: Surinder K. Batra, University of Nebraska Medical Center, United States of America
Received August 22, 2011; Accepted May 21, 2012; Published June 26, 2012
Copyright: � 2012 Wang et al. This is an open-access article distributed under the terms of the Creative Commons Attribution License, which permitsunrestricted use, distribution, and reproduction in any medium, provided the original author and source are credited.
Funding: Funds for this study were obtained from the National Institutes of Health (CA40145; www.nih.gov) and from the Gittlen Cancer Research Foundation.The funders had no role in study design, data collection and analysis, decision to publish, or preparation of the manuscript.
Competing Interests: The authors have declared that no competing interests exist.
* E-mail: [email protected]
Introduction
HtrA1 (also referred to as Prss11, or IGFBP-5) is a member of
the High Temperature Requirement Factor A (HtrA) family of
oxidative stress-response proteases. The human HtrA1 gene was
initially identified as being expressed in normal human fibroblasts,
but not after their transformation with SV40 [1]. HtrA1 is
expressed as an Mr 51,000 precursor with a signal sequence,
which presumably targets some HtrA1 for secretion. However, we
have also observed intracellular (cytoplasmic and nuclear) HtrA1
forms in a variety of epithelial cell types, as well as an Mr 29,000
intranuclear proteolytically active form [2]. HtrA1 is ubiquitously
expressed in normal human tissues; for example, De Luca et al.
documented high HtrA1 expression levels in mature layers of
epidermis, in secretory breast epithelium, in liver, and in tubules of
the renal cortex [3], suggesting it may have many functions. In
fact, HtrA1 has been implicated in diverse diseases, particularly
age-related macular degeneration [4] and nervous system arteri-
opathies (CARASIL; see [5]).
A number of studies have suggested that HtrA1 may function as
a tumor suppressor. HtrA1 has been reported to be absent or
substantially down-regulated in a variety of cancers during their
progression, including gastric, breast, ovarian [6], endometrial [7]
and hepatocellular [8] carcinomas, as well as mesothelioma [9]
and melanoma [10]. Down-regulation of HtrA1 expression in the
ovarian cancer cell line SKOV3 promoted cell anchorage-
independent growth, while over-expression of HtrA1 in another
ovarian cancer cell line OV2O2 induced cell death [11]. A similar
down-regulation of HtrA1 was observed in melanomas, and over-
expression of HtrA1 inhibited cell proliferation in vivo in a mouse
model [10].
Modulation of HtrA protein levels may have relevance for
cancer therapy, as supported by a number of findings in animal
models and human cancers [12,13]. First, HtrA1 is involved in
PLoS ONE | www.plosone.org 1 June 2012 | Volume 7 | Issue 6 | e39446
estrogen-induced nephrocarcinogenesis in Syrian hamsters [14].
Within the first 5 h of estrogen treatment, HtrA1 RNA and
protein increased significantly, presumably as a result of the
induced oxidative stress. However, during prolonged estrogeniza-
tion and cancer development, significant reductions in HtrA1
RNA and protein were observed [15]. Second, HtrA1 expression in
human ovarian cancers was significantly decreased compared with
normal ovary or with benign ovarian neoplasms [14]. Third, HtrA1
RNA and protein expression was decreased in human endometrial
cancers vs. normal controls [16,17], with significant negative
correlations between HtrA1 and TGFb1 levels [16], and HtrA1
protein expression and endometrial cancer grade [17]. Fourth,
positive, statistically significant relationships have been found
between HtrA1 expression level and survival in patients with
gastric cancer [18] and mesothelioma [9]. Fifth, overexpression of
HtrA1 in a metastasis-competent melanoma cell line strongly
inhibited proliferation and invasive capability, and reduced HtrA1
expression was related to progression of melanomas in patient
samples [10]. Despite these correlations, the tumor suppressor
function(s) of HtrA1 has not yet been definitively tested or proven
in animal models.
In addition to its potential role as a tumor suppressor, HtrA1
also has been implicated in chemotherapeutic responsiveness.
Folgueira et al. identified HtrA1 as one of a cohort of only 3 genes
(HtrA1, MTSS1, CLPTM1) that could distinguish doxorubicin-
responsive from non-responsive breast cancers in 95% of samples
[19]. Chien and co-workers [11] showed that HtrA1 expression
enhanced sensitivity to cisplatin and paclitaxel, whereas down-
regulation attenuated cytotoxicity. Down-regulation of HtrA1 was
associated with resistance to apoptosis [20]. Importantly, the
induction of apoptosis by HtrA1 was dependent upon its protease
activity [11]. Expression levels of HtrA1 in patients with ovarian or
gastric cancers correlated with their response rate to cisplatin-
based treatment regimens [6,18]. All of these findings suggest that
down-regulation of HtrA1 plays an essential role in resistance to
chemotherapy.
Functionally, HtrA1 inhibits cell migration via association with
microtubules [21], and tubulins are known HtrA1 substrates [22].
These data are provocative, as intermediate filaments are
recognized as an important target for oxidative damage [23,24]
and certain chemotherapeutics. Recent data suggest that the
epithelial-mesenchymal transition (EMT) may play a critical role
in the regulation of drug resistance [25–29]. For example, higher
E-cadherin expression in cancers cells correlates with greater
sensitivity to EGFR kinase inhibitors, while mesenchymal-like cells
are more drug-resistant [30]. Cancer cells can also undergo
adaptive changes after therapy to develop drug resistance that may
involve programs like the EMT [31]. To date, the mechanisms
that can induce the EMT involve multiple extracellular triggers
and intracellular signaling pathways [32,33,34]. Deregulation of
the response to reactive oxygen species (ROS) also has been
related to the EMT [25].
Here, we examined HtrA1 expression in human breast
specimens, including ‘‘normal’’ ductal epithelium, ductal carcino-
ma in situ (DCIS) and invasive cancers. Normal ductal epithelium
displays a spectrum of intensity of immunohistochemical (IHC)
staining for 4-hydroxynonenal, a marker indicative of oxidative
stress [35]. Normal ductal epithelium routinely showed strong
staining for HtrA1, with characteristic patterns of staining. In
marked contrast, DCIS and invasive cancers showed greatly
reduced or abrogated expression of HtrA1. Using the immortal-
ized MCF10A model, we created stable cell lines with major
reductions in HtrA1 expression and a stable cell line over-
expressing HtrA1. Using these cell lines, we examined the effects
of altered HtrA1 expression levels using gene expression and
microRNA (miR) arrays. We observed significant alterations of
genes involved in modulating the EMT phenotype, and validated
the EMT changes by several approaches, including EMT
biomarkers and cellular phenotypic properties. We also observed
effects of HtrA1 expression levels on genes involved in the DNA
damage response, and assessed functional changes in ATM-
regulated proteins following acute oxidative stress as a conse-
quence of HtrA1 expression levels. These results provide clues
regarding the seemingly disparate roles of HtrA1 as both a
putative tumor suppressor and as a modulator of chemotherapeu-
tic responsiveness.
Results
Characterization of HtrA1 in Human Breast Cancers andBreast Epithelial Cell Lines
We began by examining human breast cancer specimens using
IHC. For initial studies, 3 examined 3 antibody preparations for
HtrA1. We observed a relatively high background staining with
the polyclonal antisera preparation which has been widely used for
previous studies on HtrA1. We therefore obtained 2 affinity
purified HtrA1 antibodies; both showed similar staining patterns,
although staining was uniformly stronger with one of them (from
Sigma), which was used for subsequent studies. Normal ductal
epithelium showed strong IHC staining for HtrA1, which
manifested in different staining patterns within the same tissue
specimens. One characteristic staining pattern showed prominent
nuclear staining in ductal epithelial cells (Figure 1, panels N7 &
N8), whereas other glands showed balanced cytoplasmic + nuclear
staining (Figure 1, panels N1–N3). A third less common pattern
often showed prominent HtrA1 staining within the myoepithelial
cells in basement membrane Figure 1, panel N9), as well as in
blood vessels. In DCIS and invasive cancers, HtrA1 expression
was greatly reduced or lost entirely (Figure 1, panels CA1–CA6).
Vimentin (VIM) staining in DCIS and invasive cancers was quite
variable, with occasional glands showing strong epithelial staining
focally localized to the basolateral regions (data not shown).
We next examined HtrA1 transcript levels in 7 breast epithelial
cell lines, including 5 human breast cancer (hBC) cell lines (MCF7,
MDA-MB-231, MDA-MB-468, NM2C5, and M4A4), and 2
immortalized non-tumorigenic cell lines (MCF10A and MCF12A),
by QPCR. HtrA1 gene expression was dramatically decreased in
hBC cells compared to their non-tumorigenic counterparts
(Figure 2). The differences were generally greater than 20X
(P,0.005), except for the MDA-MB-231 cell line, which showed
HtrA1 mRNA levels which were ,50% of those found in
MCF10A cells. We further confirmed the expression differences by
Northern blot analysis (Figure 2), which showed a single transcript.
Immunoblot analyses demonstrated that HtrA1 protein expression
was high in the non-tumorigenic MCF12A and MCF10A cell
lines, but undetectable in all of the hBC cell lines tested (Figure 3).
Results from the MDA-MD-231 cell line indicate a translational
block, since HtrA1 mRNA is relatively high but the protein is
absent.
Loss of gene expression could arise from several mechanisms,
including genetic and epigenetic changes. We examined the cell
lines for genetic defects in HtrA1. Analysis of genomic DNA did
not show any loss of HtrA1, and DNA sequence analysis of the
1.5 kbp cDNAs produced from expressed transcripts revealed no
point mutations in any of the cell lines (data not shown). To test
potential epigenetic mechanisms, we examined HtrA1 promoter
methylation status, focusing on the 800bp upstream of the HtrA1
transcription start site, which is GC-rich and includes two CpG
Loss of HtrA1 Triggers EMT and DNA Damage Response
PLoS ONE | www.plosone.org 2 June 2012 | Volume 7 | Issue 6 | e39446

Loss of HtrA1 Triggers EMT and DNA Damage Response
PLoS ONE | www.plosone.org 3 June 2012 | Volume 7 | Issue 6 | e39446

islands within the 2561 to 2266 bp region. Using bisulfite gene
sequencing, we observed an inverse correlation between mRNA
levels and DNA methylation status from within this region, which
encompasses a total of 35 CpGs (Figure 4). In MCF10A and
MCF12A cells, ,60% of the CpGs were found to be
unmethylated (Figure 4). In contrast, of the CpGs examined in
the tumorigenic cell lines, only 3–6% were unmethylated in the
NM2C5 and M4A4 cell lines, and no unmethylated CpGs were
detected in the MCF7 cell line. These results suggest that the
decreased expression of HtrA1 in these cell lines may be caused by
promoter hypermethylation. All CpGs in the 14 total analyzed
(from the more distal CpG island, 2501 to 2415 bp) in the MDA-
MB-231 cell line were unmethylated (Figure 4). However, we were
unable to sequence the more proximal CpG island in the MDA-
MB-231 cell line for unclear reasons, although the PCR product
was the same size as those from the other cell lines. From the
results, the more distal CpG sites appear to have greater
importance in silencing of HtrA1 expression (for example,
compare the MDDA-MB-231 profile to that of MDA-MB-468).
Figure 1. Immunohistochemical Staining of Human Breast Tissues for HtrA1. Breast tissue specimens were obtained at reductionmammoplasties (from eight subjects used as normal controls, Panels N-1 through N-9), and from mastectomies from five patients with breast cancer(Panels CA-1 through CA-6). Sections from controls were not counterstained, while sections from breast cancers were counterstained with VectorTM
methylgreen, due to the greatly diminished immunostaining observed for HtrA1 in DCIS/cancers. Images were captured using a Nikon Eclipse E600microscope with Nomarski optics and a Spot Digital Camera (Diagnostic Instruments, Inc.) with Image Pro Plus software (version 2). In normal controlsthere was consistent immunostaining for HtrA1, albeit with heterogeneity both in the intensity and subcellular localization of immunostaining. PanelsN-1 through N-9 illustrate the three basic patterns of subcellular localization of immunostaining of epithelial cells in mammary ducts in normalcontrols; 1) Immunostaining of both the basal and luminal epithelial cells (N-1 through N-3); 2) Predominant immunostaining in luminal epithelialcells (N-4 through N-6), often with prominent nuclear immunostaining (N-7 & N-8); and 3) Immunostaining only of basal myoepithelial cells (N-9).These patterns may reflect oxidative stress in different microenvironments (35). Panels CA-1 through CA-6 illustrate the decreased HtrA1immunostaining in the DCIS components of invasive breast cancers (CA-1 through CA-4), and complete loss of HtrA1 immunostaining in invasivecomponents of breast cancers (CA-5 and CA-6) which we characteristically observed. Panels CA-2 and CA-3 show an intraductal DCIS lesionphotographed at low (20X) and high (40X) power, respectively. Note that in DCIS immunostaining of the basal layer (although fragmented) is present.Control sections incubated with cocktail from which the primary HtrA1 antibody was omitted were uniformly immunonegative. Bars indicate 50 mm,as indicated.doi:10.1371/journal.pone.0039446.g001
Figure 2. HtrA1 Gene Expression in hBC cell lines. RNA was isolated from the various human breast epithelial cell lines and expression levels ofHtrA1 mRNA were determined using QPCR (Lower Panel) and Northern blot analyses (Upper Panel) as described. Results are representative ofmultiple independent analyses. Expression levels were 20–25X higher in the non-tumorigenic MCF10A and 12A cell lines, with very low expressionlevels in most of the hBC cell lines (MDA-MB-231 was the exception; see text). b-actin transcript were used as to assess loading on Northern blots.doi:10.1371/journal.pone.0039446.g002
Loss of HtrA1 Triggers EMT and DNA Damage Response
PLoS ONE | www.plosone.org 4 June 2012 | Volume 7 | Issue 6 | e39446

Figure 3. HtrA1 Protein Expression in hBC cell lines. Cells (as indicated) were extracted into nuclear (N) and cytoplasmic (C) fractions asdescribed (Materials & Methods), and proteins were analyzed by Immunoblot analyses using the polyclonal antibody against human HtrA1. b-actinwas used as a loading control, and DEK was used to assess the nuclear/cytoplasmic fractionation (DEK is exclusively nuclear). The larger Mr bandsseen in the MCF12A and MCF10A/Flp cell lines are consistent with dimers, trimers, etc., although this was not confirmed. MCF10A/Flp is the parentalFlp-in cell line which was used to produce the various MCF10A/siRNA or Htra1 cell lines. Results are from a representative experiment.doi:10.1371/journal.pone.0039446.g003
Figure 4. Promoter Methylation Status in the MCF10A cell lines. Candidate CpG islands were identified in the HtrA1 promoter sequence,within the upstream region from bp 2561 to 2266. DNA was extracted from the various cell lines and analyzed via bisulfite sequencing. The topmostPanel shows this region of interest, which is expanded in the dark strip from F1–R1, with CpG sites indicated by vertical lines (the total of 35 CpGs aremarked). Unmethylated CpGs identified by bisulfite sequencing are depicted in the lower panels for the various cell lines, as indicated on the right.doi:10.1371/journal.pone.0039446.g004
Loss of HtrA1 Triggers EMT and DNA Damage Response
PLoS ONE | www.plosone.org 5 June 2012 | Volume 7 | Issue 6 | e39446

Histone deacetylation is another possible epigenetic mechanism
for down-regulation of HtrA1 gene expression. There is some
supportive evidence for this mechanism provided by the studies of
Zupkovitz et al., which reported that the mouse HtrA1 gene was
one of those negatively regulated by mouse histone deacetylase 1
(HDAC1) [36]. We used decitabine (DEC), a DNA methyltrans-
ferase inhibitor, and trichostatin A (TSA), a histone deacetylase
inhibitor, to characterize the role of DNA methylation and histone
deacetylation in controlling HtrA1 gene expression. Four hBC cell
lines (MDA-MB-231, MDA-MB-468, MCF7, and M4A4) were
treated with DMSO (as a solvent control), 5 mM DEC, 300 nM
TSA, or DEC + TSA in combination for 72 hr. After the
treatment, RNA was harvested and subjected to QPCR analysis
for HtrA1 (Figure 5). Two of the cell lines showing complete
promoter methylation (MCF7 and M4A4) showed little response
to either inhibitor (with M4A4 cells, the small response was
attributable to DEC alone). However, the 2 cell lines which
showed only partial promoter methylation (MDA-MB-231 and
MDA-MB-468) showed highly significant (p,0.01) increases in
HtrA1 expression levels. These results indicated that HtrA1
expression in MDA-MB-231 and MDA-MB-468 cell lines was
inhibited (albeit to different extents) by histone deacetylation,
whereas the gene silencing in MCF7 and M4A4 cells was due
largely to DNA hypermethylation. In the MCF7 cell line, DNA
methylation and histone deacetylation may be cooperating in
down-regulation of HtrA1 gene expression. Overall, the results
demonstrate that HtrA1 is consistently down-regulated in all hBC
cell lines, and that the down-regulation is due to various epigenetic
mechanisms.
Mechanistic studies of HtrA1 function(s) in MCF10A
cells. To generate cell lines with stably down-regulated or up-
regulated HtrA1 expression, we performed a library selection to
identify optimally accessible target sites within HtrA1 mRNA, as
previously described [37]. We selected four sites (Figure 6A), and
designed short-hairpin RNAs (shRNAs) targeting these sites. We
used MCF10A cells and the Flp-In system with expression vectors
containing HtrA1-targeted shRNAs, and produced 4 independent
cell lines with significant down-regulation of HtrA1 expression. We
also created a cell line over-expressing HtrA1 by using a construct
containing the 1.5 kbp full-length HtrA1 coding sequence. An
MCF10A cell line carrying an shRNA targeted to human
papilloma virus was used as an irrelevant control cell line
(designated MCF10A/HPVsh).
The levels of HtrA1 protein expression in the over-expressing
cell line (designated MCF10A/HtrA1), and the down-regulated
cell lines (designated MCF10A/siRNA1-4), were evaluated using
immunoblots (Figure 6B). Using an antibody raised against a 22 aa
peptide within the HtrA1 protease domain, we observed doublet
bands at ,Mr 35–38,000 in the cytoplasmic extracts. In nuclear
extracts, we detected an additional band at ,Mr 29,000. In the
over-expressing MCF10A/HtrA1 cell line, we observed an
increase (2X) in cytoplasmic HtrA1 expression levels of the Mr
35–38,000 doublet, and a 2- to 3-fold increase in the proteolyt-
ically active Mr 29,000 nuclear form. In the various MCF10A/
siRNA1-4 cell lines, we observed markedly decreased ($90%)
expression of HtrA1, relative to both the parental MCF10A and
the MCF10A/HPVsh vector control cell lines (Figure 6B).
Compared to the parental MCF10A cell line, the MCF10A/
HtrA1 siRNA cells appeared to be smaller, whereas the over-
expressing MCF10A/HtrA1 cells appeared to be larger, and these
observations were confirmed by measuring cell areas (data not
shown). In cell growth experiments (Figure 6C), down-regulation
Figure 5. Effects of DNA methyltransferase and histone deacetylase inhibitors on HtrA1 transcript levels in human breast cancercell lines. The indicated cell lines were treated with the DNA methyltransferase inhibitor decitabine (DEC) and/or with the histone deacetylaseinhibitor TSA, as described, and resultant effects on HtrA1 transcript levels were determined using QPCR. Values 6 SEs are shown from arepresentative experiment, which was repeated 2 times. Values for Dec and TSA were significant at p,0.01 for the MDA-MB-231 and 2468 cell lines.Inset shows an expanded view of the MCF7 and M4A4 results.doi:10.1371/journal.pone.0039446.g005
Loss of HtrA1 Triggers EMT and DNA Damage Response
PLoS ONE | www.plosone.org 6 June 2012 | Volume 7 | Issue 6 | e39446

of HtrA1 significantly increased cell growth rate (p,0.01 at days 4
and 6). Over-expression of HtrA1 induced a slightly slower growth
rate, but this was not statistically significant.
We next examined the migration and invasion capabilities of
the various cell lines in a transwell assay. We found that one of the
two MCF10A/siRNA cell lines tested showed significantly
increased migration ability (p-value ,0.01), while the MCF10A/
HtrA1 over-expressing cell line showed a significant decrease in
migration (p-value ,0.01) (Figure 7A). Both the MCF10A/
siRNA1 and/siRNA4 cell lines showed significantly increased
invasion ability compared to the control cell line (p-value ,0.01;
see Figure 7B), while the vector control and over-expressing
MCF10A/HtrA1 cell lines showed no change in invasion
capability.
Acquiring such an increased motile phenotype is one of the
typical features of the EMT. Thus, we examined expression of
VIM, as a marker for mesenchymal differentiation, in the various
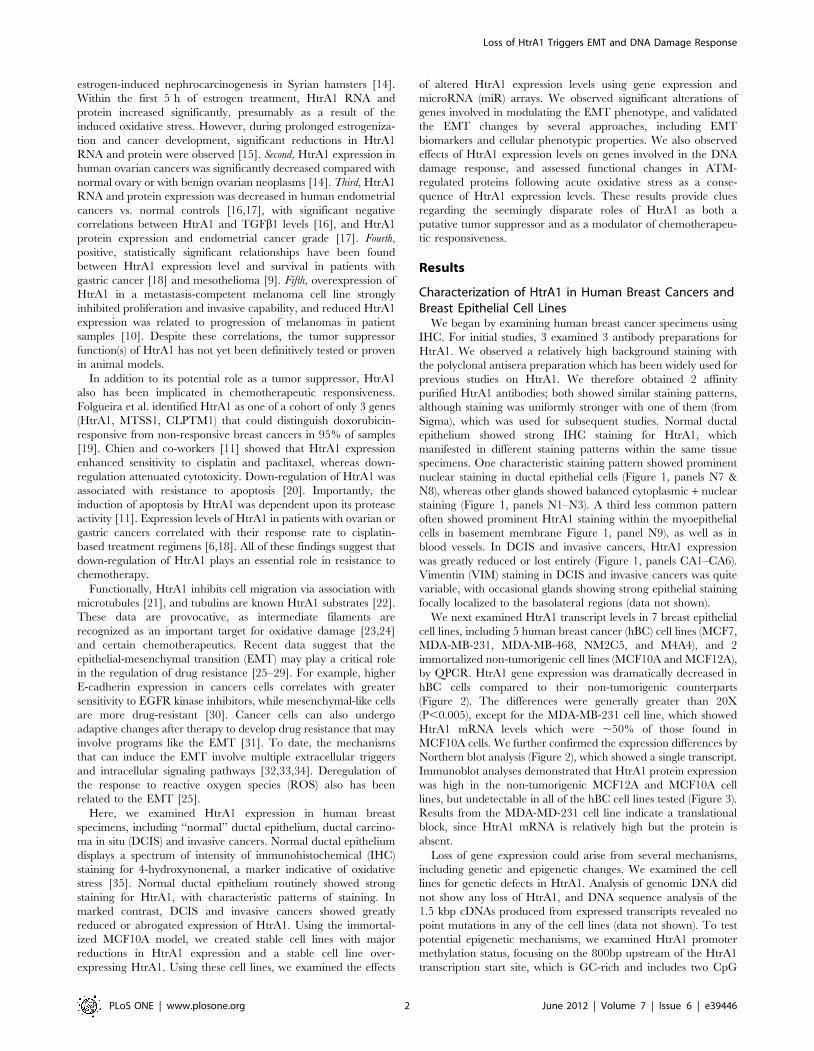
MCF-10A modified cell lines. Interestingly, VIM staining was
heterogeneous in the parental MCF10A cell line (Figure 8B),
where ,25–30% of cells in the sampled populations displayed
positive staining. In this regard, breast cancer epithelial cell lines
(specifically including MCF10A cells) have been shown to exhibit
heterogeneous staining for CD44, CD24, and epithelial specific
markers [38], which presumably correlates with the heterogeneous
VIM staining in the parental control MCF10A cells. Similarly,
Figure 6. Characterization of MCF10A cell lines carrying HtrA1 siRNA and overexpression vectors. A random antisense oligonucleotidelibrary was used to identify optimally accessible sites in HtrA1 mRNA. SiRNAs (short hairpin RNAs) were designed to target these sites, and stablytransfected cell lines were developed from MCF10A cells (4 independent cell lines, designated MCF10A/siRNA1-4). A control cell line expressing anirrelevant siRNA (designated MCF10A/HPVsh) was also developed. In parallel, we also developed a cell line over-expressing HtrA1 (designatedMCF10A/HtrA1). (A). Target sites empirically identified in HtrA1 mRNA. Identified domains within HtrA1 include: SS, signal sequence; IGFBP, IGFbinding site; KI, Kazal Type I protease inhibitor domain; Trypsin-like protease domain; PDZ, PDZ binding domain. (B) Immunoblot analysis for HtrA1protein. Cytoplasmic and nuclear protein fractions were prepared from the developed cell lines (as indicated), and were probed with a polyclonalantibody preparation directed against a region in the trypsin-like protease domain. As is evident, the reductions in HtrA1 protein levels were .90%compared with the various MCF10A and MCF10A/HPVsh cells. Right panel shows HtrA1 in concentrated culture medium. (C) Cells were plated andgrowth was measured over a 6 day period. Both of the MCF10A cell lines tested (MCF10A/siRNA1 and siRNA4) grew significantly faster than thecontrol cells (p,0.01 at days 4 and 6). Over-expression of HtrA1 in the MCF10A/HtrA1 cells had no effect on cell growth rate.doi:10.1371/journal.pone.0039446.g006
Loss of HtrA1 Triggers EMT and DNA Damage Response
PLoS ONE | www.plosone.org 7 June 2012 | Volume 7 | Issue 6 | e39446

,10–15% of MCF10A/HPVsh vector control cells showed
positive VIM staining. In contrast to control cells, essentially all
MCF10A/siRNA cells under-expressing HtrA1 showed uniformly
strong, positive VIM staining, whereas the MCF10/HtrA1 over-
expressing cells showed little or no VIM staining (Figure 8C). In
addition, MCF10A/siRNA cell lines showed markedly decreased
staining for the epithelial and myoepithelial cell biomarkers
KRT5/6/18 (data not shown).Effects of modulating HtrA1 levels on global gene
expression profiles. In order to understand the full range of
phenotypic consequences of modulating HtrA1 levels, we exam-
ined changes in genome-wide gene expression, using the
MCF10A/HtrA1 over-expressing cell line and 2 of the
MCF10A/siRNA cell lines, and the Illumina Human Whole
Genome Beadchip assay. We used two methods to analyze the
data: gene clustering and signaling pathway analysis. First, 1402
genes were identified for cluster analysis by considering changes in
expression levels in the MCF10A/siRNA cells that were greater
than 50% compared to the control cell line (at p,0.01). We used
the Silhouette measurement to determine the optimal number of
clusters. Using this analysis, the optimal number of clusters was
determined to be 22 (Silhouette width = 0.384) (Figure 9). We
detected genes whose expression was inversely correlated with
HtrA1 expression level, as well as genes whose expression was
positively correlated with HtrA1 expression levels. Clusters 19, 6,
and 2 were the top three clusters, based on the magnitude of
changes in gene expression levels, which showed expression
changes inversely correlated with HtrA1 expression level. As
examples, cluster 19 (4 genes) contained VIM (2 loci), cluster 6 (21
genes) included FGFR3, IGFBP2, and TNFRSF6B, and cluster 2
(281 genes) included many interesting genes such as LAMB1,
RAD21, ATM, HIF1A, FGFRL1, VEGFB, VEGFC, H2AFX,
MTA1, and PTPRE, PTPLA, and POLR3GL. Clusters 12, 21,
and 4 were the top four clusters positively correlated with HtrA1
expression level. Cluster 12 (10 genes) included CD24, cluster 21
(23 genes) prominently included a number of histone genes, and
cluster 4 (22 genes) included PRSS8, KRT15, CLDN7, and
CDH1. We confirmed changes in transcript levels for many of the
pertinent genes using QPCR, including VIM, CDH1, CLDN1,
and ATM (not shown).
The gene expression profiling results highlighted several
interesting changes. First, many EMT marker genes and EMT-
related transcription factors were significantly changed when
HtrA1 expression was down-regulated (Table 1). We observed
substantially increased expression of mesenchymal marker genes
such as VIM (9 to 34X), ECM2 (1.3 to 1.6X), and LAMB1 (1.8 to
2.2X). The direct regulators of these genes include several classes
of transcription factors, which were also significantly elevated
(p,0.01), including bHLH, TWIST, forkhead, and homeobox
factors (data not shown). Concomitantly, down-regulation of
HtrA1 significantly decreased expression of many epithelial
markers, including E-Cadherin (CDH1), claudin1 (CLDN1) and
claudin7 (CLDN7), and many cytokeratins (such as KRT 8), and
over-expression of HtrA1 significantly decreased expression of
these markers (Table 1). The TGFb signaling pathway can be a
prominent driver of the EMT [39–40]. However, in our
experiments we did not detect any consistent inverse correlation
between HtrA1 levels and the expression of TGFb1 in the
microarray results. We also did not observe any relationship
between HTrA1 and TGFb1 levels in ELISA assays from cell
culture media (not shown).
Cancer stem cells (CSC) can self-renew and differentiate to
recapitulate the cellular heterogeneity of the original tumor [41],
and Al-Hajj et al. have isolated CD44+, CD242/low breast cancer
initiating cells with CSC-like properties [42]. Surprisingly, we
observed an ,90% decrease of CD24 gene expression in
MCF10A/siRNA cell lines, with an average 100% increase in
CD44 expression (Table 1). We also detected a 2.6 to 3.6X
increased expression of ALDH1L1 in the same HtrA1 down-
regulated cells (Table 1), accompanied by parallel changes in a
number of additional ALDH1 transcripts. Whether a subpopula-
tion of putative CD242/CD44+/ALDH1+ cells truly exist in the
MCF10A/siRNA cells is unclear, but our results could point to an
additional role for HtrA1 in breast carcinogenesis.
Figure 7. Migration and Invasion Assay. The MCF10A-derived celllines were tested for migration and invasive capability in a transwellassay, using uncoated (migration) or basement membrane-extractcoated (invasion) wells. Results are from 3 independent experiments.Panel A: Migration. The vector control cell line MCF10A/HPVsh did notdiffer in migration from the parental MCF10A cell line. The MCF10A/HtrA1 cell line over-expressing HtrA1 showed significantly decreased(p,0.01) migration vs. the control cell lines. However, MCF10A/siRNA4cell line showed significantly increased migration (p,0.01), whereas theMCF10A/siRNA1 showed an increase of borderline significance. Panel B:Invasion. The MCF10A/HPVsh and MCF10A/HtrA1 cell lines did not differin invasion capability from the parental MCF10A cell line. However,both MCF10A/siRNA1 and 4 cell lines showed significant increases(p,0.01) in invasive capability.doi:10.1371/journal.pone.0039446.g007
Loss of HtrA1 Triggers EMT and DNA Damage Response
PLoS ONE | www.plosone.org 8 June 2012 | Volume 7 | Issue 6 | e39446
The MCF10A/siRNA cell lines showed significant transcrip-
tional up-regulation of many components in the nuclear protein
kinase ataxia telangiectasis mutated (ATM)-initiated DNA damage
response network; ATM is a major sensor of DNA damage. In
addition to ATM, expression of signaling mediators, such as
53BP1, MDC1 and MCPH1, and downstream targets, such as
p53, H2AFX, H2AFY2, NASP, and RAD21, were all increased
when HtrA1 levels were decreased (Table 1). Levels of many of the
same genes showed contrasting decreases in HtrA1-overexpressing
cells (Table 1). With regard to DNA metabolism, we also observed
significant (p,0.01) coordinated transcriptional up-regulation of a
number of DNA polymerases, including PolM, PolE2, PolD3, and
PolS, suggesting that both replicative and repair DNA machinery
was affected by HtrA1 down-regulation.
Finally, pathways important in cancer progression were affected
by HtrA1 expression levels. For example, factors within the
angiogenesis and HIF pathways, such as HIF1A, VHL, FGF
family members, AKT1, and VEGFB/C genes, all showed major
increases in the HtrA1 down-regulated MCF10A/siRNA cell lines
and decreases in the MCF10A/HtrA1 over-expressing cell line
(Table 1). Each of the MCM2-7 genes showed coordinated down-
regulation, which is of interest because these MCM proteins are
negative regulators of HIF1 [43] and exposure to hypoxia leads to
their down-regulation. We also observed that AKT was phos-
phorylated (at Ser473) in the MCF10A/siRNA cell lines using
immunoblot analysis (not shown); this site is involved in control of
AKT activity [44], and is of further interest because it predicts
chemoresponsiveness to paclitaxel in breast cancer [45].
Functional Characterization of the DDR in Response toAltered HtrA1 Expression
We examined whether the transcriptional up-regulation of
ATM reflected activation of the functional pathway, via immu-
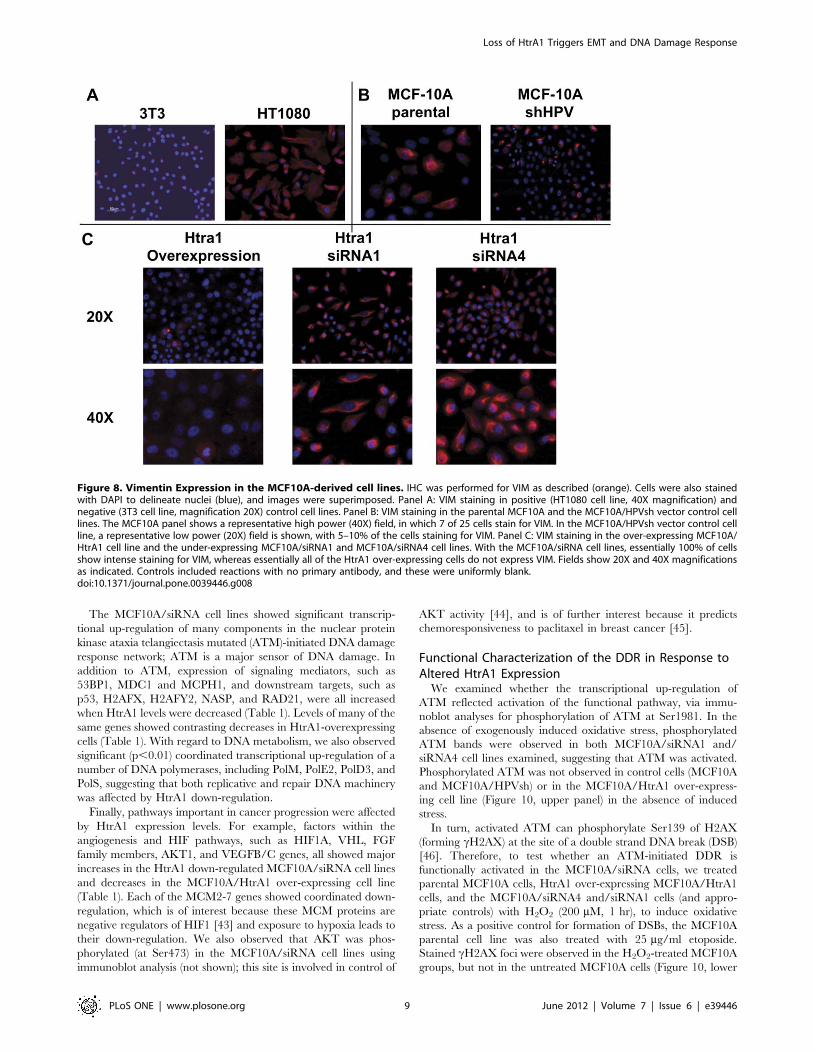
noblot analyses for phosphorylation of ATM at Ser1981. In the
absence of exogenously induced oxidative stress, phosphorylated
ATM bands were observed in both MCF10A/siRNA1 and/
siRNA4 cell lines examined, suggesting that ATM was activated.
Phosphorylated ATM was not observed in control cells (MCF10A
and MCF10A/HPVsh) or in the MCF10A/HtrA1 over-express-
ing cell line (Figure 10, upper panel) in the absence of induced
stress.
In turn, activated ATM can phosphorylate Ser139 of H2AX
(forming cH2AX) at the site of a double strand DNA break (DSB)
[46]. Therefore, to test whether an ATM-initiated DDR is
functionally activated in the MCF10A/siRNA cells, we treated
parental MCF10A cells, HtrA1 over-expressing MCF10A/HtrA1
cells, and the MCF10A/siRNA4 and/siRNA1 cells (and appro-
priate controls) with H2O2 (200 mM, 1 hr), to induce oxidative
stress. As a positive control for formation of DSBs, the MCF10A
parental cell line was also treated with 25 mg/ml etoposide.
Stained cH2AX foci were observed in the H2O2-treated MCF10A
groups, but not in the untreated MCF10A cells (Figure 10, lower
Figure 8. Vimentin Expression in the MCF10A-derived cell lines. IHC was performed for VIM as described (orange). Cells were also stainedwith DAPI to delineate nuclei (blue), and images were superimposed. Panel A: VIM staining in positive (HT1080 cell line, 40X magnification) andnegative (3T3 cell line, magnification 20X) control cell lines. Panel B: VIM staining in the parental MCF10A and the MCF10A/HPVsh vector control celllines. The MCF10A panel shows a representative high power (40X) field, in which 7 of 25 cells stain for VIM. In the MCF10A/HPVsh vector control cellline, a representative low power (20X) field is shown, with 5–10% of the cells staining for VIM. Panel C: VIM staining in the over-expressing MCF10A/HtrA1 cell line and the under-expressing MCF10A/siRNA1 and MCF10A/siRNA4 cell lines. With the MCF10A/siRNA cell lines, essentially 100% of cellsshow intense staining for VIM, whereas essentially all of the HtrA1 over-expressing cells do not express VIM. Fields show 20X and 40X magnificationsas indicated. Controls included reactions with no primary antibody, and these were uniformly blank.doi:10.1371/journal.pone.0039446.g008
Loss of HtrA1 Triggers EMT and DNA Damage Response
PLoS ONE | www.plosone.org 9 June 2012 | Volume 7 | Issue 6 | e39446

panels). cH2AX staining intensity was significantly decreased in
the MCF10A/HtrA1 over-expressing cell line, and was signifi-
cantly increased in the MCF10A/siRNA4 and/siRNA1 cell lines
(Figure 10).
Decreased HtrA1 expression results in down-regulation
of microRNA 200 family members. Given the important
roles of miRs in cellular regulation, we also performed a genome-
wide analysis of miR profiles in the various MCF10A cell lines
using the Illumina v2 MicroRNA Beadchip Assay, containing
1146 miR genes. An unsupervised analysis of miRs showed that
291 miRs showed differential expression in the analyses, using
p,0.05 as a screening criterion. By focusing on changes in
expression of at least 40%, with a p-value ,0.05, the number of
differentially expressed miRs was reduced to 140 (MCF10A/
siRNA1,/siRNA2,/siRNA3, and/siRNA4 cell lines had 53, 16,
32, and 39 significantly changed miRs, respectively), vs. the
control MCF10A/HPVsh cell line.
Cluster analysis showed that the optimal number of clusters for
the p,0.05 results was 22. Cluster 3, for example, contained miR-
429, 200a, 200a*, 200b, 200b*, and 376c, while closely related
Clusters 6 and 8 contained miR-200c* and 141, respectively.
Imposing a False Discovery Rate (FDR) of ,0.05 reduced the
number of differentially expressed miRs to 41 across the
MCF10A/siRNA cell lines. Using the FDR correction, the
optimal number of clusters was 19. Cluster 1 contained miR-
200a, 429, 200b, and 200a*, while Cluster 6 contained 200c*.
With an exceedingly stringent Sidak correction, only 4 differen-
tially regulated miRs were identified; miR-200a, 345, 376c, and
888. miR345 is a methylation-sensitive miR (down-regulated)
which is involved in cell proliferation and invasion in colorectal
cancer [47], while miR-376c (here up-regulated) enhances
ovarian cancer cell survival and has been implicated in
chemoresistance [48].
Figure 9. Cluster Analysis of Whole Genome Gene Expression Data. Genes showing significant changes (and a minimum of 50% change) inexpression levels (at p,0.01) in MCF10A/siRNA cell lines vs. controls (3 independent experiments) were analyzed by Cluster Analysis. Gene expressionprofiles in MCF10A/siRNA3 and siRNA4 cell lines, and in the MCF10A/HtrA1 over-expressing cell lines, were determined vs. the control cell line. Theoptimal number of clusters was found to be 22, and the centroids for the various individual clusters are indicated. Clusters 19, 6, and 2 showed thegreatest changes in expression levels in the MCF10A/siRNA cell lines which were inversely correlated with HtrA1 expression levels. Clusters 12, 21, and4 showed the greatest changes in expression levels that were positively correlated with HtrA1 expression levels.doi:10.1371/journal.pone.0039446.g009
Loss of HtrA1 Triggers EMT and DNA Damage Response
PLoS ONE | www.plosone.org 10 June 2012 | Volume 7 | Issue 6 | e39446

Considering all analyses, the miR-200 family members (miR-
429, 200a(a*), 200b(b*), 200c(c*), and miR-141) were consistently
identified as differentially regulated in response to altered HtrA1
expression (Table 2). The miR-200 family members showed highly
significant decreases in expression with ranged from ,40% to
more than 90%. One other miR showing a major change was
miR-34c-3p. miR-34c-3p has been found to produce decreases in
anchorage-independent growth, migration, and invasion in siHa
cells [49], and miR-34 has also been found to be down-regulated
in prostate cancer [50], where it otherwise exhibits tumor
suppressor properties. Stinson et al. have recently reported that
miR-221/222 promotes the EMT in breast cancer by targeting
TRPS1 [51]. In contrast, here we observed increased expression of
miR-221/222 with overexpression of HtrA1 (221, 221*, 222, and
222* levels were 1.25, 1.65, 1.38, and 1.50 vs. control, respectively)
and unchanged or slightly decreased expression in the MCF10A/
siRNA1-4 cell lines (221, 221*, 222, and 222* were 0.8260.11,
1.0460.33, 0.8960.08, and 1.4760.45 vs. control, respectively).
Discussion
Here, using a high quality affinity-purified antibody, we
demonstrated that HtrA1 is strongly expressed in normal ductal
epithelium in human breast tissue specimens. Expression patterns
included strong epithelial staining (both cytoplasmic + nuclear, or
prominently nuclear), as well as a pattern of intense HtrA1 staining
of the basement membrane surrounding ducts (also including
blood vessels; Figure 1, N panels). These diverse staining patterns
were characteristically observed focally throughout the same tissue
specimens, and presumably reflect the diversity of microenviron-
mental influences. In marked contrast, HtrA1 expression was
greatly reduced or lost entirely in DCIS and invasive carcinomas
(Figure 1, CA panels). We are currently expanding our IHC
studies, using a multiplexed approach to co-localize HtrA1, VIM,
and 4-hydroxynonenal, as well as additional markers of oxidative
stress.
In concordance, HtrA1 expression was significantly reduced in
all of the breast cancer cell lines examined, compared with their
non-tumorigenic counterparts. HtrA1 gene expression silencing
was due to epigenetic modifications, including at least promoter
DNA hypermethylation, histone deacetylation, and translation
inhibition. These experimental findings provide empirical support
for the prediction that HtrA1 would be epigenetically regulated in
breast cancer cell lines [52].
For mechanistic studies, we created MCF-10A cell lines which
stably under- or over-expressed HtrA1. We found that substan-
tially decreased expression of HtrA1 stimulated cell growth and
triggered the EMT. Evidence of EMT included acquisition of
mesenchymal attributes, such as expression of various markers
(VIM, etc.) and functional properties (increased invasion). Global
gene expression studies showed down-regulation of numerous
epithelial markers (CDH1 and CLDNs) and major decreases in the
miR200 family, known regulators of the EMT. In addition to the
EMT changes, we observed alterations in the expression profiles of
many CSC-associated genes and ATM DDR pathway compo-
nents in response to changes in HtrA1 levels, potentially providing
a link to HtrA1’s puzzling role in response to chemotherapeutics.
Functionally, we demonstrated activation of the DNA damage
sensor, ATM, in cells with decreased HtrA1 levels, and we found
that HtrA1 expression levels were inversely correlated with
formation of cH2AX foci in response to an acute oxidative insult.
Interestingly, we have also made a number of attempts to over-
express HtrA1 in MCF7 cells. In all attempts, no over-expressing
clones could be obtained, so ‘‘re-expression’’ of HtrA1 in this
context may produce cell death.
Proteases play essential roles in multiple biological processes.
Beyond their functions in protein catabolism, proteases can
selectively cleave substrates and thus influence cell behavior,
survival, and death [53]. For many years, proteases (especially
extracellular) have been implicated in tumor progression, with the
probably overly simplistic assumption that they can degrade
extracellular matrix thus facilitating cell migration and invasion
(see [54]). However, this assumption has not translated into clinical
utility; in recent clinic trial studies, treatment of patients with
broad-range metalloproteinase inhibitors showed no effects, or
even produced an acceleration of tumor growth [55,56]. This
finding suggests that some extracellular proteases might actually
have anti-tumor properties. For example, the serine proteases
PRSS3 (also known as trypsinogen IV), PRSS8 (prostasin), and
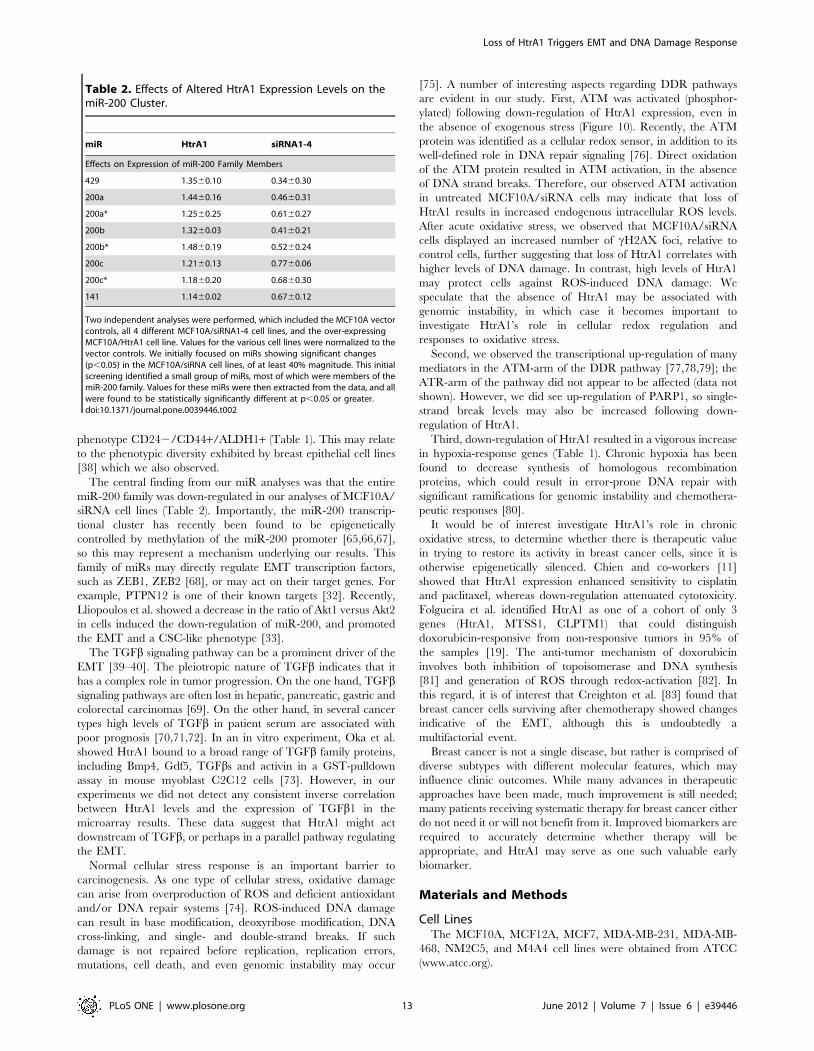
Table 1. Selected significantly altered genes associated withEMT, ATM-DDR, and CSC pathways.
Gene Symbol siRNA4 siRNA3 HtrA1
EMT Marker Genes
CDH1 0.091 0.826 1.381
CLDN1 0.259 0.374 1.454
CLDN7 0.114 0.681 1.135
VIM 33.634 8.976 0.590
ECM2 1.321 1.617 0.675
LAMB1 1.795 2.188 1.074
KRT8 0.417 0.508 1.485
ATM DNA Damage Response Components
ATM* 1.947, 1.775 1.662, 1.501 0.946, 0.992
H2AFX 1.502 1.651 1.115
H2AFY2 1.291 1.403 0.917
NASP 1.705 1.669 0.828
TP53 2.092 2.225 1.066
TP53BP1 1.254 1.240 0.923
RBBP8 1.487 1.347 0.923
AKT1* 1.348, 1.420 1.474, 1.071 0.969
POLM 1.547 1.770 0.916
RAD21 1.407 1.500 1.018
ALDH1B1 1.187 1.221 0.924
Breast Cancer Stem Cell Markers
CD24* 0.083, 0.062 0.175, 0.190 2.515, 2.129
CD44 2.308 1.877 1.256
ALDH1L1 3.572 2.647 0.869
Angiogenesis and HIF Signaling Pathways
VHL 1.321 1.361 0.728
HIF1A* 1.850, 1.739 1.746, 1.514 1.091, 1.033
VEGFB 1.630 1.472 0.946
VEGFC 1.665 1.563 1.137
FGFR4 1.576 1.788 0.852
FGFR3 2.597 1.435 0.577
FGFBP1 2.400 1.500 0.718
EGFR 1.381 1.326 0.988
Values represent fold change relative to MCF10A vector control values. Allvalues are significant at p,0.01. * Genes with 2 independent loci measured.doi:10.1371/journal.pone.0039446.t001
Loss of HtrA1 Triggers EMT and DNA Damage Response
PLoS ONE | www.plosone.org 11 June 2012 | Volume 7 | Issue 6 | e39446
PRSS21 (testisin) were categorized as tumor-protective proteases
in the human degradome [57]. We suggest that HtrA1 may
represent another tumor suppressor in this group.
The EMT is fundamental during embryonic development, and
has a parallel role in tumorigenesis [58,59]. More importantly,
EMT has been found to contribute to tumor invasion, metastasis,
and acquisition of therapeutic resistance. Therefore, targeting
EMT-associated processes is a promising avenue in chemothera-
pies. We demonstrate that HtrA1 expression levels are inversely
correlated with motility and invasion (Figure 7), and acquisition of
increased motility is one of the typical features of EMT. Down-
regulation of HtrA1 significantly decreased many ‘‘epithelial’’
genes, including E-Cadherin, claudins, and cytokeratins, whereas
mesenchymal marker genes such as vimentin, ECM2, and
LAMB1 showed increased expression in the MCF10A/siRNA
cell lines (Table 1). The direct regulators of these genes include
several classes of transcription factors, many of which were highly
expressed in the MCF10A/siRNA cell lines. Hypoxia is another
event that can promote the EMT [43,60,61,62,63,64], via
mechanisms involving HIF-1a. In fact, HIF-1a has been found
to induce genetic alterations by suppressing DNA repair [60,61],
and short-term hypoxia induces a reversible EMT that requires
the transcription factor Twist1 [60]. Many components within the
angiogenesis and HIF pathways were affected by HtrA1 down-
regulation (Table 1). Finally, the EMT has been associated with
acquisition of a cancer stem cell (CSC)-like phenotype [34]. In our
microarray analysis data, we observed that decreased expression of
HtrA1 was associated with acquisition of the breast CSC
Figure 10. Examination of MCF10A-derived cell lines for p-ATM and formation of cH2AX foci. Upper Panel. Immunoblot analyses forphosphorylated ATM were performed as described, specifically examining the Ser1981 site. The Upper Panel shows phosphorylated ATM (with b-actin as a loading control). ‘‘+’’ indicates H2O2 treatment with 100 mM H2O2 for 2 h to induce oxidative stress, vs. ‘‘-‘‘ for no treatment. Numbersindicate cell lines as follows: 1 = MCF10A, 2 = MCF10A/HtrA1, 3 = MCF10A/HPVsh, 4 = MCF10A/siRNA1, and 5 = MCF10A/siRNA4. Phosphorylated ATM(pATM, at Ser1981) is observed in the absence of any treatment in both MCF10A/siRNA cell lines examined, whereas no pATM is observed in theMCF10A and MCF10A/HPVsh control cell lines, or the over-expressing MCF10A/HtrA1 cell line. Lower Panels. Cells were either untreated or treatedwith 200 mM H2O2 for 1 h, and then IHC analysis was performed, with staining for cH2AX foci using an antibody specific for phosphorylated Ser139 asdescribed. Over-expression of HtrA1 effectively blocked formation of cH2AX foci following acute treatment with H2O2, whereas foci formation wasincreased in MCF10A/siRNA1 (generally by ,50%) and/siRNA4 cells, dramatically so in the latter. Etoposide treatment was used as a positive controlwith MCF10A cells. Foci formation is unchanged in the MCF10A/HPVsh vector control cell line. Results are from a representative experiment, whichwas repeated once with analogous results.doi:10.1371/journal.pone.0039446.g010
Loss of HtrA1 Triggers EMT and DNA Damage Response
PLoS ONE | www.plosone.org 12 June 2012 | Volume 7 | Issue 6 | e39446
phenotype CD242/CD44+/ALDH1+ (Table 1). This may relate
to the phenotypic diversity exhibited by breast epithelial cell lines
[38] which we also observed.
The central finding from our miR analyses was that the entire
miR-200 family was down-regulated in our analyses of MCF10A/
siRNA cell lines (Table 2). Importantly, the miR-200 transcrip-
tional cluster has recently been found to be epigenetically
controlled by methylation of the miR-200 promoter [65,66,67],
so this may represent a mechanism underlying our results. This
family of miRs may directly regulate EMT transcription factors,
such as ZEB1, ZEB2 [68], or may act on their target genes. For
example, PTPN12 is one of their known targets [32]. Recently,
Lliopoulos et al. showed a decrease in the ratio of Akt1 versus Akt2
in cells induced the down-regulation of miR-200, and promoted
the EMT and a CSC-like phenotype [33].
The TGFb signaling pathway can be a prominent driver of the
EMT [39–40]. The pleiotropic nature of TGFb indicates that it
has a complex role in tumor progression. On the one hand, TGFbsignaling pathways are often lost in hepatic, pancreatic, gastric and
colorectal carcinomas [69]. On the other hand, in several cancer
types high levels of TGFb in patient serum are associated with
poor prognosis [70,71,72]. In an in vitro experiment, Oka et al.
showed HtrA1 bound to a broad range of TGFb family proteins,
including Bmp4, Gdf5, TGFbs and activin in a GST-pulldown
assay in mouse myoblast C2C12 cells [73]. However, in our
experiments we did not detect any consistent inverse correlation
between HtrA1 levels and the expression of TGFb1 in the
microarray results. These data suggest that HtrA1 might act
downstream of TGFb, or perhaps in a parallel pathway regulating
the EMT.
Normal cellular stress response is an important barrier to
carcinogenesis. As one type of cellular stress, oxidative damage
can arise from overproduction of ROS and deficient antioxidant
and/or DNA repair systems [74]. ROS-induced DNA damage
can result in base modification, deoxyribose modification, DNA
cross-linking, and single- and double-strand breaks. If such
damage is not repaired before replication, replication errors,
mutations, cell death, and even genomic instability may occur
[75]. A number of interesting aspects regarding DDR pathways
are evident in our study. First, ATM was activated (phosphor-
ylated) following down-regulation of HtrA1 expression, even in
the absence of exogenous stress (Figure 10). Recently, the ATM
protein was identified as a cellular redox sensor, in addition to its
well-defined role in DNA repair signaling [76]. Direct oxidation
of the ATM protein resulted in ATM activation, in the absence
of DNA strand breaks. Therefore, our observed ATM activation
in untreated MCF10A/siRNA cells may indicate that loss of
HtrA1 results in increased endogenous intracellular ROS levels.
After acute oxidative stress, we observed that MCF10A/siRNA
cells displayed an increased number of cH2AX foci, relative to
control cells, further suggesting that loss of HtrA1 correlates with
higher levels of DNA damage. In contrast, high levels of HtrA1
may protect cells against ROS-induced DNA damage. We
speculate that the absence of HtrA1 may be associated with
genomic instability, in which case it becomes important to
investigate HtrA1’s role in cellular redox regulation and
responses to oxidative stress.
Second, we observed the transcriptional up-regulation of many
mediators in the ATM-arm of the DDR pathway [77,78,79]; the
ATR-arm of the pathway did not appear to be affected (data not
shown). However, we did see up-regulation of PARP1, so single-
strand break levels may also be increased following down-
regulation of HtrA1.
Third, down-regulation of HtrA1 resulted in a vigorous increase
in hypoxia-response genes (Table 1). Chronic hypoxia has been
found to decrease synthesis of homologous recombination
proteins, which could result in error-prone DNA repair with
significant ramifications for genomic instability and chemothera-
peutic responses [80].
It would be of interest investigate HtrA1’s role in chronic
oxidative stress, to determine whether there is therapeutic value
in trying to restore its activity in breast cancer cells, since it is
otherwise epigenetically silenced. Chien and co-workers [11]
showed that HtrA1 expression enhanced sensitivity to cisplatin
and paclitaxel, whereas down-regulation attenuated cytotoxicity.
Folgueira et al. identified HtrA1 as one of a cohort of only 3
genes (HtrA1, MTSS1, CLPTM1) that could distinguish
doxorubicin-responsive from non-responsive tumors in 95% of
the samples [19]. The anti-tumor mechanism of doxorubicin
involves both inhibition of topoisomerase and DNA synthesis
[81] and generation of ROS through redox-activation [82]. In
this regard, it is of interest that Creighton et al. [83] found that
breast cancer cells surviving after chemotherapy showed changes
indicative of the EMT, although this is undoubtedly a
multifactorial event.
Breast cancer is not a single disease, but rather is comprised of
diverse subtypes with different molecular features, which may
influence clinic outcomes. While many advances in therapeutic
approaches have been made, much improvement is still needed;
many patients receiving systematic therapy for breast cancer either
do not need it or will not benefit from it. Improved biomarkers are
required to accurately determine whether therapy will be
appropriate, and HtrA1 may serve as one such valuable early
biomarker.
Materials and Methods
Cell LinesThe MCF10A, MCF12A, MCF7, MDA-MB-231, MDA-MB-
468, NM2C5, and M4A4 cell lines were obtained from ATCC
(www.atcc.org).
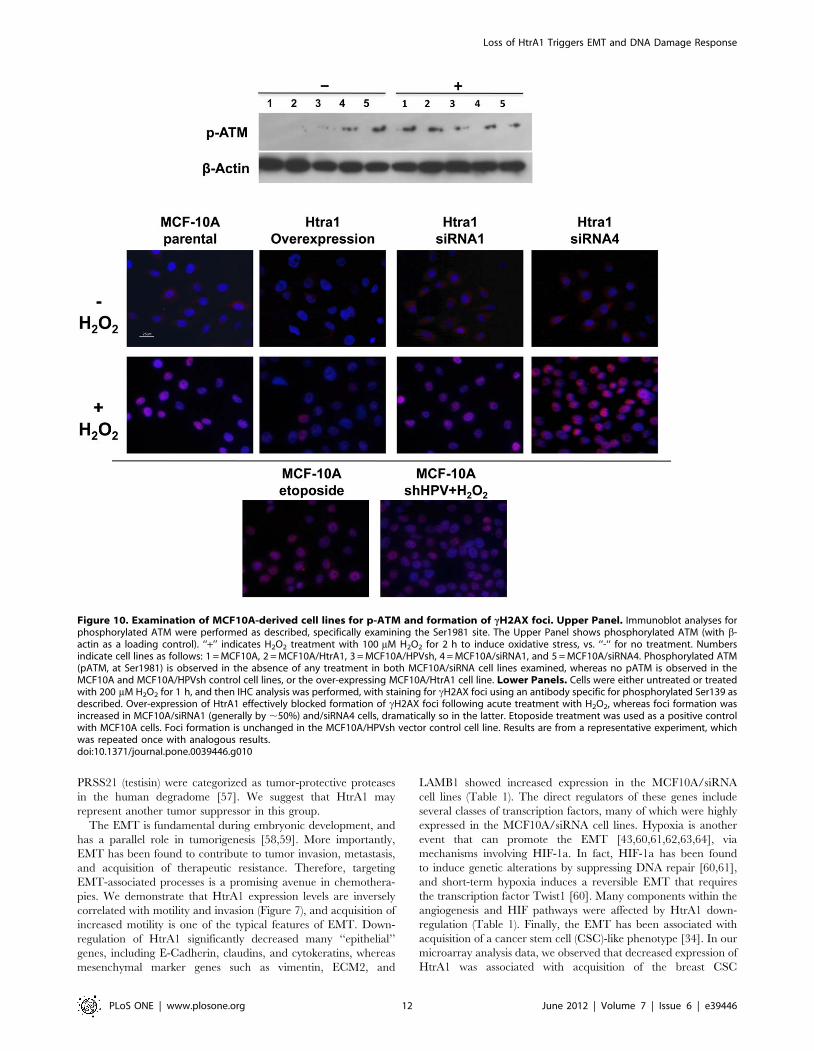
Table 2. Effects of Altered HtrA1 Expression Levels on themiR-200 Cluster.
miR HtrA1 siRNA1-4
Effects on Expression of miR-200 Family Members
429 1.3560.10 0.3460.30
200a 1.4460.16 0.4660.31
200a* 1.2560.25 0.6160.27
200b 1.3260.03 0.4160.21
200b* 1.4860.19 0.5260.24
200c 1.2160.13 0.7760.06
200c* 1.1860.20 0.6860.30
141 1.1460.02 0.6760.12
Two independent analyses were performed, which included the MCF10A vectorcontrols, all 4 different MCF10A/siRNA1-4 cell lines, and the over-expressingMCF10A/HtrA1 cell line. Values for the various cell lines were normalized to thevector controls. We initially focused on miRs showing significant changes(p,0.05) in the MCF10A/siRNA cell lines, of at least 40% magnitude. This initialscreening identified a small group of miRs, most of which were members of themiR-200 family. Values for these miRs were then extracted from the data, and allwere found to be statistically significantly different at p,0.05 or greater.doi:10.1371/journal.pone.0039446.t002
Loss of HtrA1 Triggers EMT and DNA Damage Response
PLoS ONE | www.plosone.org 13 June 2012 | Volume 7 | Issue 6 | e39446

Derivation of MCF10A-based Cell LinesThe Flp-In system (Invitrogen) was used to create stably
transfected MCF10A-derived cell lines using a two–step sequential
procedure. First, pFRT/lacZeo plasmid DNA was purified and
linearized with ApaI endonuclease and then transfected into the
parental MCF10A cell line. This construct encodes a Flp-
recombination site. Zeocin antibiotic (80 mg/ml) was used for
selection of stable integrants (for ,30 days). MCF10A/Flp positive
clones were verified by b-gal staining and screened by Southern
analysis to identify single-copy clones for the next transfection.
Second, the pcDNA5/FRT expression vectors were produced,
which contained either: a) the HtrA1 full-length coding sequence,
which was driven by human CMV promoter; or b) HtrA1-targeted
siRNAs, which were driven by two opposing Pol III promoters, H1
and U6 (see [84]). These were co-transfected with pOG44, a
plasmid encoding the Flp recombinase, into MCF10A/Flp cell
line. Hygromycin antibiotic (30–40 mg/ml, for ,30 days) was used
to select cells stably overexpressing HtrA1 (denoted MCF10A/
HtrA1) or stably expressing the HtrA1-targeted siRNAs (4
separate siRNAs were used to produce 4 different siRNA-
expressing cell lines, denoted MCF10A/siRNA1-4). Target sites
for the siRNAs were identified by library selection of accessible
sites as previously described [37]. Positive clones were checked for
loss of b-gal activity, and HtrA1 expression levels were
determined.
The full-length mRNA for the coding region of HtrA1 was 113–
1555 bp (the HtrA1 sequence, 2133 bp, NM_002775 in NCBI
GenBank, is 2133 bp).
The sequences used for siRNAs1-4 were:
siRNA1: GATCTAAAAAGCCGCCGGTCATCGTCCTGCATT
(544–564 bp).
CTAGAATGCAGGACGATGACCGGCGGCTTTTTA.
siRNA2: GATCTAAAAACCGTGGTTCATATCGAATTGTTT
(659–679 bp).
CTAGAAACAATTCGATATGAACCACGGTTTTTA.
siRNA3: GATCTAAAAAGGTGCCACTTACGAAGCCAAATT
(819–839 bp).
CTAGAATTTGGCTTCGTAAGTGGCACCTTTTTA.
siRNA4: GATCTAAAAACACGGAGTCCCATGACCGACATT
(1204–1224 bp).
CTAGAATGTCGGTCATGGGACTCCGTGTTTTTA.
Cell growth studies. To monitor the cell growth rate in the
MCF10A/siRNA and MCF10A/HtrA1 transfected cell lines,
56104 cells for each cell line were plated in 10 cm plates on day 0.
Cells were continuously cultured for 6 days in DMEM/F12
medium +5% Horse serum, 20 ng/ml human epidermal growth
factor, 0.01 mg/ml bovine insulin, 100 ng/ml cholera toxin,
500 ng/ml hydrocortisone, 95% and 30 mg/ml Hygromycin
selection antibiotic, with culture medium replaced every 2 days.
Cells were counted on day 2, day 4 and day 6, with triplicate plates
for each count.
For analysis of cell size, on day 4 areas of 50 randomly-selected
cells for each cell line were measured (blindly), using the ImageJ
program and statistics available from http://imagej.nih.gov.
QPCR for HtrA1. Total RNA from MCF10A, MCF12A,
MCF7, MDA-MB-231, MDA-MB-468, NM2C5, and M4A4 cells
(obtained from ATCC) were extracted with Qiagen RNeasy mini
kit (cat. #74904). Quantitative real-time PCR was performed as
previously reported [85] with the QuantiTect Probe RT-PCR kit
(Qiagen, Cat. # 204443) using a Stratagene Mx4000 QPCR
systems (Agilent Technologies). All quantification data were
normalized to Tata-box binding protein (TBP), which acts as an
internal control. The following primers and probe were used for
human HtrA1, 59-TTGTTTCGCAAGCTTCCGTT-39 (for-
ward), 59-ACGTGGGCATTTGTCACGA T-39 (reverse), 59-
FAM-TCTAAACGAGAGGTGCCGGTGGCTAGT-BHQ-39
(probe); for human TBP, 59-CACGGCACTGATTTT-
CAGTTCT-39 (forward), 59-TTCTTGCTGCCAGTCTG-
GACT-39 (reverse), 59-HEX-TGTGCACAGGAGCCAAGAGT-
GAAGA-BHQ-39 (probe). Data were analyzed using the
manufacturer’s supplied software.
Northern blotting. Total RNA for each cell line was
extracted with Qiagen RNeasy mini kit (cat. #74904). For
Northern analysis, we used NorthernMax-Gly kits from Ambion
(#AM1946). 15 mg of RNA for each sample was electrophoresed
in a 1% agarose denaturing gel. RNAs were transferred to
MAGNAgraph nylon membranes (Osmonics, #NJ0HYA0010).
Blots were probed for HtrA1, using a 1.5kb full-length cDNA
probe. A 2.1kb b-actin cDNA probe was used to document
loading. Both probes were labeled with DECAprime II kit
(Ambion, #AM1456). The blot was exposed to X-ray film and
developed 24 h later.
Analysis of DNA methylation in the HtrA1 promoter
region. The promoter sequence for the human HtrA1 gene was
obtained from the UCSC Genome Bioinformatics website (www.
genome.ucsc.edu). Possible transcription factor binding sites were
examined in the 2000 bp promoter sequence before the
transcription start site using the TRANSFAC database (www.
gene-regulation.com/databases.html).
EpiTech Bisulfite kits from QIAGEN (cat. # 59104) was used
for complete bisulfite conversion and cleanup of DNA for
methylation analysis. Briefly, 1 mg genomic DNA was incubated
with sodium bisulfite buffer in a thermocycler condition for 5 hr.
After the incubation, converted DNAs were cleaned up with the
kit. The cleanup products were directly used for PCR and
sequencing.
For amplification, the F1 and R1 is the primer pair designed on
MethPrimer (www. urogene.org/methprimer) was used. F1 is the
forward primer 59-TTTATTATTTTATTGTGGGTTTGGG,
R1 is the reverse primer, 59-AATAAAACTTTA-
CAAAAAAACCCTAC, which amplifies the 2561 to 2266bp
promoter region. Regions were sequenced 2 independent times.
One used sequencing the PCR product directly, and the other
time the products were cloned into TOPO vector, and the plasmid
sample was then sequenced.
Effects of decitabine and trichostatin A on HtrA1
expression. MDA-MB-231, MDA-MB-468, MCF7, M4A4
cells were examined in these experiments. Decitabine (DEC) was
from Tocris (Cat. No. 2624), and trichostatin A (TSA) was from
Sigma (T8552). 56105 cells were plated in 6-cm plates for
individual treatment, one day prior to treatment. For the
experiment, DMSO, DEC (5mM), TSA (300nM) or DEC +TSA combination was added to medium and cells were incubated
for 72 h. Total RNA was then extracted as above, and samples
were used for QPCR analysis.
Immunoblot Analyses
1) Characterization for HtrA1 expression level. Cells were
extracted with NE-PER nuclear and cytoplasmic extraction
reagents (Thermo Scientific #78833). 2 mg of cytoplasmic,
12 mg of nuclear, and 180 mg protein from cell culture
medium were separated by electrophoresis using 10%SDS-
PAGE. Proteins were transferred to Immobilon-FL PVDF
membranes (Millipore, #IPFL00010), and membranes were
blocked with 6% milk in TBST for 1.5 hr at RT. Primary
antibody was generally a rabbit polyclonal anti-human HtrA1
(Imgenex, IMX-6518A); it was used at 1:5000 dilution, and
incubation was overnight at 4 C. Secondary antibody was
Loss of HtrA1 Triggers EMT and DNA Damage Response
PLoS ONE | www.plosone.org 14 June 2012 | Volume 7 | Issue 6 | e39446
anti-rabbit IgG, HRP-linked (Cell Signaling Technology,
#7074). Where indicated, primary antibody was a mouse
monoclonal anti-human HtrA1 (R&D Systems, #MAB2916,
raised against HtrA1aa23-480). It was used at 1:500 dilution,
with anti-mouse secondary antibody.
2) As loading control, b-actin mouse monoclonal antibody from
Santa Cruz (#SC-47778) was used, and for assessing the
nuclear/cytoplasmic fractionation, a rabbit polyclonal anti-
DEK antibody was used (Aviva Systems Biology, #P100637;
DEK is a nuclear protein).
3) Phosphorylation of DNA damage response components. The
same amount of cells for each cell line was plated (26104
cells/cm2) the day before experiment. The next day, cells
were treated with 0 or 100 mM of H2O2 in medium for 2
hours. Then whole cell lysates were harvested and analyzed
with mouse monoclonal anti-phospho-ATM (ser1981) (Up-
state, #05-740). As loading control, a b-actin mouse
monoclonal antibody from Santa Cruz was used (#SC-
47778). Secondary antibodies were from Cell Signaling
Technology (anti-mouse IgG, HRP-linked, #7076; anti-
rabbit IgG, HRP-linked, #7074).
Immunohistochemical staining of human breast
tissues. The use of tissues in this study was authorized by the
Institutional Review Board. Human breast tissue from mastecto-
mies and reduction mammoplasties were fixed in 10% neutral
buffered formalin for 12–24 h and embedded in paraffin. At least
3 specimens of normal, DCIS, and invasive carcinomas were
examined on multiple occasions. Formalin-fixed, paraffin-embed-
ded (FFPE) tissues were sectioned at 5 mm, transferred onto Fisher
SuperfrostPlus slides, deparaffinized through a graded alcohol
series, rehydrated and then subjected to antigen retrieval using
Vector Antigen Unmasking Solution, pH 6.0 (cat.# H-3300) for
1 h at 80uC. Endogenous peroxidase was inhibited with 0.3%
H2O2 for 30 min at room temperature. The sections were
incubated in a humidity chamber overnight at 4uC with one of
3 antibodies against HtrA1:1) Sigma ‘‘Prestige’’ (cat. #HPA036655), an affinity-purified rabbit polyclonal, at a dilution
1:50. This antibody yielded the best results; 2) Abcam (cat. #ab38610), an affinity-purified rabbit polyclonal IgG, at a dilution
1:50; and 3) IMGENEX cat. # IMX5136 polyclonal rabbit
antisera. Immunocytochemistry was completed using Vector
Immpress anti-rabbit kits (cat# MP-7401) with Vector Immpact
DAB (cat. #SK-4105 ) as chromagen. Where indicated, Vector
Methyl Green was used as a counterstain; this was generally
necessary in the DCIS and invasive cancer specimens, since HtrA1
staining was greatly reduced or lost. Negative controls routinely
included adjacent sections from each sample that were incubated
with 2.5% normal horse serum provided without the primary
antibody.
Cellular immunofluorescence staining. Cells were plated
at 2–36104 cells/cm2 on the chamber slides the day before
staining. On the experiment day, cells were rinsed with PBS first,
then fixed in 10% neutral buffered formalin for 20 min at RT.
After rinsing with PBS, cells were permeablized in PBS/
0.2%Triton-X for 10 min at RT and then blocked with 2.5%
secondary species serum in PBS/0.1% Triton-X for 1hr at RT.
Primary antibody was diluted in the same blocking buffer and
incubated with samples at 4oC overnight. On the following day,
cells were washed with PBS/0.2%Triton-X 3X for 3min, and then
incubated with secondary antibody for 1 hr at RT. They were
washed again with PBS/0.2%Triton-X 3X for 3min. After the
final wash, DAPI was used to counterstain cells for 5min and they
were then mounted for microscopy. Antibodies used were:
1. Mouse monoclonal to Vimentin (V9) (NeoMarkers)
2. Donkey anti-mouse secondary antibody (Cy3)
3. Mouse monoclonal to Cytokeratin 5+6+18 (Abcam,
#ab49289)
4. Rabbit polyclonal secondary antibody to mouse IgG-H&L
(FITC) (Abcam, #ab97045)
Analysis of phosphorylated cH2AX foci. Cells were plated
at 46104 cells/cm2 on the chamber slides the day before staining.
24 hours later, cells were treated with hydrogen peroxide at
200 mM for 1 hr. This time was chosen after time-course
experiments. Where indicated, etoposide (at 25 mg/ml) was
applied to serve as a positive control for formation of DNA
double-strand break. After the treatment, cells were fixed with
10% neutral buffered formalin for 20 min at RT. After rinsing
with PBS, cells were permeablized in PBS/0.2%Triton-X for
10 min at RT and then treated with 2.5% goat serum in PBS/
0.1% Triton-X for 1hr at RT. Then biotin-conjugated anti-
phospho-H2AX (Millipore, #16-193, which is specific for
phosphoserine 139) antibody was diluted in the same blocking
buffer and incubated with samples at 4oC overnight. On the
following day, cells were washed with PBS/0.2%Triton-X 3X for
3 min, and then incubated with tetramethylrhodamine-conjugated
streptavidin antibody (Molecular Probes #S870) for 30 min at
RT, followed by washing with PBS/0.2%Triton-X 3X for 3min.
Cell migration and invasion assays. 96 well HTS
transwell permeable supports with 8 mm pores were obtained
from Corning (Cat. No. 3374) and used for migration and
invasion assays. 5x Basement Membrane Extract (BME) coating
solution was obtained from Trevigen (Cat. No. 3455-096-02). Cell
migration and invasion was quantified using Calcein-AM (Biotium
#80011-3), in a 3-day protocol. On Day1, the appropriate
transwell inserts were coated with 1x Basement Membrane
Extract, and incubated at 37o C overnight in 5% CO2. Some of
the wells were uncoated for migration assays. On Day2, 46104
cells were plated in each transwell insert, and stimulated with FBS
attractant (blank wells were used for background subtraction). On
Day 3, a standard curve was established for each cell line, which
allowed conversion of fluorescent values to number of cells, and
detection of cells which passed through the membrane was
performed with a fluorescence plate reader (Synergy HT, with
KC4 software fro Bio-Tek Instruments) with excitation filter at
485 nm and emission filter at 520 nm.
Acute induction of oxidative stress. Cells were washed
with PBS and then incubated with 100 mM DCFH_DA in
medium in 5% CO2 at 37u for 30 min. After DCFH-DA was
removed, cells were washed and treated with a series of
concentrations of H2O2 in medium (0–400 mM). Fluorescence
of cells was immediately measured using a plate reader (485nm for
excitation, 530nm for emission). Data points were taken every
30min for 2hr. Fluorescence was essentially linear over the
concentration range tested, and 200 mM was selected. The
nonionic, nonpolar DCFH-DA (29,79-dichlorofluorescin diacetate)
crosses cell membranes and is hydrolyzed enzymatically by
intracellular esterases to non-fluorescent DCFH. In the presence
of reactive oxygen species (ROS), DCFH is oxidized to highly
fluorescent dichlorofluorescein (DCF). Therefore, the intracellular
DCF fluorescence can be used as an index to quantify the overall
ROS in cells.
MicroRNA array analysis. 2 independent analyses were
performed for all 4 MCF10A/siRNA cell lines, as well for MCF10A
vector control and the over-expressing MCF10A/HtrA1 cell lines. 5
x 104 cells were plated and cultured as described under Cell Growth
Studies, and cells were harvested after day 4. Analyses were
Loss of HtrA1 Triggers EMT and DNA Damage Response
PLoS ONE | www.plosone.org 15 June 2012 | Volume 7 | Issue 6 | e39446

performed using the Illumina v2 Human MicroRNA Assay
Beadchip assay (Illumina, San Diego, CA) in the PSU-COM
Functional Genomics Core Facility. RNA quality and concentration
was assessed using an Agilent 2100 Bioanalyzer with RNA Nano
LabChip (Agilent, Santa Clara, CA). cRNA was synthesized from
200 ng of total RNA according to manufacturer’s instructions. The
method targets specific sequences with sets of oligonucleotides which
are extended, and labeled during PCR amplification. miRs were
polyadenylated using Poly-A Polymerase (PAS, Illumina). The
introduced poly-A tail was then used as a priming site for cDNA
synthesis. The primer used in cDNA synthesis was biotinylated and
contained a universal PCR primer sequence. The biotinylated
cDNA was annealed to miR-specific oligonucleotides that corre-
spond to all of the targeted microRNAs (1146 human microRNAs).
The resulting single-stranded fluor-labeled PCR product was
hybridized on the beadchip overnight with a temperature ramp
from 60uC to 45uC. Following hybridization, beadchips were
washed and scanned with a BeadArray Reader (Illumina, San
Diego, CA). A project was created with resultant scan data imported
into GenomeStudio 1.0 (Illumina). Results were exported to
GeneSpring 7.3 (Agilent Technologies). Measurements less than
0.01 were then set to 0.01, arrays normalized to the 50th percentile,
and individual genes normalized to the median of controls.Gene expression microarray analysis. 3 independent
microarray analyses were performed for each of the cell lines
examined. 5 x10⁴ cells were plated and cultured as described in
Cell Growth Studies, and cells were harvested after day 4.
Microarray analyses were performed using the Illumina Human
Whole Genome Beadchip (Illumina, San Diego, CA) in the PSU-
COM Functional Genomics Core Facility. RNA quality and
concentration was assessed using an Agilent 2100 Bioanalyzer with
RNA Nano LabChip (Agilent, Santa Clara, CA). cRNA was
synthesized by TotalPrep Amplification (Ambion, Austin, TX)
from 500 ng of RNA according to manufacturer’s instructions. T7
oligo (dT)-primed reverse transcription was used to produce first
strand cDNA. cDNA then underwent second strand synthesis and
RNA degradation by DNA Polymerase and RNase H, followed by
filtration clean up. In vitro transcription (IVT) was employed to
generate multiple copies of biotinylated cRNA. The labeled cRNA
was purified using filtration, quantified by NanoDrop, and
volume-adjusted for a total of 1.5 mg/sample. Samples were
fragmented, and denatured before hybridization for 18 hours at
58uC. Following hybridization, beadchips were washed and
fluorescently labeled. Beadchips were scanned with a BeadArray
Reader (Illumina, San Diego, CA). A project was created with
resultant scan data imported into GenomeStudio 1.0 (Illumina).
Results were exported to GeneSpring 7.3 (Agilent Technologies).
Measurements less than 0.01 were then set to 0.01, arrays
normalized to the 50th percentile, and individual genes normalized
to the median of controls.
Standard FDR [86,87] and Sidak [88] corrections were used to
further analyze microarray data.
Silhouette Measure to Determine the Optimal Number ofClusters
To determine the optimal number of clusters we used the
Silhouette width index [89]. This Silhouette width for each point is a
measure of how close that point is to the points of its own cluster
compared to points in other clusters: s(i) = b(i) – a(i)/max{a(i),b(i)}
with b(i) = mink{B(i,k)} where,
s(i) = Silhouette width for each point i
a(i) = The average distance between point i and points of its
own cluster
B(i,k) = The average distance between point i and points of
another cluster k b(i) = The minimum of the average distance
between point i and all other points in other clusters
The Silhouette width value ranges from 21 to 1.
– A value close to 1 means that the sample is well clustered.
– A value close to zero means that it could be assigned to another
cluster as well.
– A value close to 21 means that that the point i has been most
likely misclassified.
We can compute the average Silhouette width for each cluster
and for the entire dataset. The optimal number of clusters would
be the one that maximizes the overall Silhouette width for the
entire dataset.Statistical analyses. For all the quantitative real-time PCR,
cell growth rate, migration and invasion, phosphorylated-cH2AX
cell staining assays, a Student’s paired t test was used to determine
statistical significance (Microsoft Excel). Results are expressed as
means 6 SE. Values were considered as statistically significant if
P,0.05.
Acknowledgments
We wish to thank Dr. Robert Brucklacher in the Microarray core facility.
Author Contributions
Conceived and designed the experiments: NW KAE GAC. Performed the
experiments: NW PX WP DAS. Analyzed the data: ARZ KAE JW CDM
GAC. Contributed reagents/materials/analysis tools: GAC CDM. Wrote
the paper: NW KAE JW CDM GAC.
References
1. Zumbrunn J, Trueb B (1996) Primary structure of a putative serine protease
specific for IGF-binding proteins. FEBS Lett 398: 187–192.
2. Clawson GA, Bui V, Xin P, Wang N, Pan W (2008) Intracellular localization of
the tumor suppressor HtrA1/Prss11 and its association with HPV16 E6 and E7
proteins. J Cellular Biochem 105: 81–88.
3. De Luca A, De Falco M, Severino A, Campioni M, Santini D, et al. (2003)
Distribution of the serine protease HtrA1 in normal human tissues. J Histochem
Cytochem 51: 1279–1284.
4. Yang Z, Camp N, Sun H, Tong Z, Gibbs D, et al. (2006) A variant of the
HTRA1 gene increases susceptibility to age-related macular degeneration.
Science 314: 992–993.
5. Fukutake T (2011) Cerebral autosomal recessive arteriopathy with subcortical
infarcts and leukoencephalopathy (CARASIL): from discovery to gene
identification. J Stroke Cerebrovasc Dis 20: 85–93.
6. Chien J, Staub J, Hu S, Erickson-Johnson M, Couch F, et al. (2004) A candidate
tumor suppressor HtrA1 is downregulated in ovarian cancer. Oncogene 23:
1636–1644.
7. Mullany SA, Moslemi-Kebria M, Rattan R, Khurana A, Clayton A, et al. (2011)
Expression and functional significance of HtrA1 loss in endometrial cancer. Clin
Cancer Res 17: 427–436.
8. Zhu F, Jin L, Luo TP, Luo GH, Tan Y, et al. (2010) Serine protease HtrA1
expression in human hepatocellular carcinoma. Hepatobiliary Pancreat Dis Int
9: 508–512.
9. Baldi A, Mottolese M, Vincenzi B, Campioni M, Mellone P, et al. (2008) The
serine protease HtrA1 is a novel prognostic factor for human mesothelioma.
Pharmacogenomics 9: 1069–1077.
10. Baldi A, De Luca A, Morini M, Battista T, Felsani A, et al. (2002) The HtrA1
serine protease is down-regulated during human melanoma progression and
represses growth of metastatic melanoma cells. Oncogene 21: 6684–6688.
11. Chien J, Aletti G, Baldi A, Catalano V, Muretto P, et al. (2006) Serine protease
HtrA1 modulates chemotherapy-induced cytotoxicity. J Clin Invest 116: 1994–
2004.
12. Chien J, Campioni M, Shridhar V, Baldi A (2009) HtrA serine proteases as
potential therapeutic targets in cancer. Curr Cancer Drug Targets 9: 451–468.
13. Zurawa-Janicka D, Skorko-Glonek J, Lipinska B (2010) HtrA proteins as targets
in therapy of cancer and other diseases. Expert Opin Ther Targets 14: 665–679.
Loss of HtrA1 Triggers EMT and DNA Damage Response
PLoS ONE | www.plosone.org 16 June 2012 | Volume 7 | Issue 6 | e39446
14. Narkiewicz J, Klasa-Mazurkiewicz D, Zurawa-Janicka D, Skorko-Glonek J,
Emerich J, et al. (2008) Changes in mRNA and protein levels of human HtrA1,
HtrA2, and HtrA3 in ovarian cancer. Clin Biochem 41: 561–569.
15. Zurawa-Janicka D, Kobiela J, Stefaniak T, Wozniak A, Narkiewicz J, et al.
(2008) Changes in expression of serin eproteases HtrA1 and HtrA2 during
estrogen-induced oxidative strress and nephrocarcinogenesis in male Syrian
hamster. Acta Biochim Pol 55: 9–19.
16. Narkiewicz J, Lapinski-Szumczyk S, Jurawa-Janicka D, Skorko-Glonek J,
Emerich J, et al. (2009) Expression of human HtrA1, HtrA2, HtrA3, and
TGF-beta1 genes in primary endometrial cancer. Oncol Rpt 21: 1529–1537.
17. Bowden M, Di Nezza-Cossens L, Jobling T, Salamonsen L, Nie G (2006) Serine
protease HTRA1 and HTRA3 are down-regualted with increasing grades of
human endometrial cancer. Gynecol Oncol 103: 253–260.
18. Catalona V, Pasquale M, d-Avino A, Shridhar V, Staccioli MP, et al. (2011)
HtrA1, a potential predictor of response to cisplatin-based combination
chemotherapy in gastric cancer. Histopathology 58: 669–678.
19. Folgueira M, Carraro D, Brentani H, Patrao D, Barbosa E, et al. (2005) Gene
expression profile associated with response to doxorubicin-based therapy in
breast cancer. Clin Cancer Res 11: 7434–7443.
20. He X, Ota T, Liu P, Chien J, Shridhar V (2010) Downregulation of HtrA1
promotes resistance to anoikis and peritoneal dissemination of ovarian cancer
cells. Cancer Res 70: ePub Apr 13.
21. Chien J, Ota T, Aletti G, Shridhar R, Boccellino M, et al. (2009) Serine protease
HtrA1 associates with microtubules and inhibits cell migration. Mol Cell Biol 29:
4177–4187.
22. Chien J, He X, Shridhar V (2009) Identification of tubulins as substrates of
serine protease HtrA1 by mixture-based oriented peptide library screening. J Cell
Biochem 107: 253–263.
23. Strnad P, Stumptner C, Zatloukal K, Denk H (2008) Intermediate filament
cytoskeleton of the liver in health and disease. Histochem Cell Biol 129: 735–
749.
24. Rogers KR, Morris CJ, Blake DR (1989) Cytoskeletal rearrangement by
oxidative stress. Int J Tissue React 11: 309–314.
25. Wang Z, Li Y, Sarkar FH (2010) Signaling mechanism(s) of reactive oxygen
species in Epithelial-Mesenchymal Transition reminiscent of cancer stem cells in
tumor progression. Curr Stem Cell Res Ther 5: 74–80.
26. Ahmed N, Abubaker K, Findlay J, Quinn M (2010) Epithelial mesenchymal
transition and cancer stem cell-like phenotypes facilitate chemoresistance in
recurrent ovarian cancer. Curr Cancer Drug Targets 10: 268–278.
27. Wang Z, Li Y, Ahmad A, Azmi AS, Kong D, et al. (2010) Targeting miRNAs
involved in cancer stem cell and EMT regulation: An emerging concept in
overcoming drug resistance. Drug Resist Updat 13: 109–118.
28. Iwatsuki M, Mimori K, Yokobori T, Ishi H, Beppu T, et al. (2010) Epithelial-
mesenchymal transition in cancer development and its clinical significance.
Cancer Sci 101: 293–299.
29. Voulgari A, Pintzas A (2009) Epithelial-mesenchymal transition in cancer
metastasis: mechanisms, markers and strategies to overcome drug resistance in
the clinic. Biochim Biophys Acta 1796: 75–90.
30. Witta SE, Gemmill RM, Hirsch FR, Coldren CD, Hedman K, et al. (2006)
Restoring E-cadherin expression increases sensitivity to epidermal growth factor
receptor inhibitors in lung cancer cell lines. Cancer Res 66: 944–950.
31. Singh A, Settleman J (2010) EMT, cancer stem cells and drug resistance: an
emerging axis of evil in the war on cancer. Oncogene 29: 4741–4751.
32. Gregory PA, Bert AG, Paterson EL, Barry SC, Tsykin A, et al. (2008) The iR-
200 family and miR-205 regulate epithelial to mesenchymal transition by
argeting ZEB1 and SIP1/. Nature Cell Biol 10: 593–601.
33. Iliopoulos D, Polytarchou C, Hatziapostolou M, Kottakis F, Maroulakou IG, et
al. (2009) MicroRNAs differentially regulated by Akt isoforms control EMT and
stem cell renewal in cancer cells. Sci Signal 2: ra62.
34. Polyak K, Weinberg RA (2009) Transitions between epithelial and mesenchymal
states: acquisition of malignant and stem cell traits. Nat Rev Cancer 9: 265–273.
35. Weisz J, Shearer DA, Murata E, Patrick SD, Han B, et al. (2012) Identification
of mammary epithelial cells subject to chronic oxidative stress in mammary
epithelium of young women and teenagers living in USA. Cancer Biol Therapy
13: 1–13.
36. Zupkovitz G, Tischler J, Posch M, Sadzak I, Ramsauer K, et al. (2006) Negative
and positive regulation of gene expression by mouse histone deacetylase 1. Mol
Cell Biol 26: 7913–7928.
37. Pan W, Xin P, Clawson GA (2010) MicroRNAs align with accessible sites in
target mRNAs. J Cell Biochem 109: 509–518.
38. Fillmore CM, Kuperwasser C (2008) Human breast cancer cell lines contain
stem-like cells that self-renew, give rise to phenotypiclly diverse progeny and
survive chemotherapy. Breast Can Res 10: R25.
39. Liu Y (2004) Epithelial to mesenchymal transition in renal fibrogenesis:
pathologic significance, molecular mechanism, and therapeutic intervention.
J Am Soc Nephrol 15: 1–12.
40. Holian J, Qi W, Kelly DJ, Zhang Y, Mreich E, et al. (2008) Role of Kruppel-like
factor 6 in transforming growth factor-beta1-induced epithelial-mesenchymal
transition of proximal tubule cells. Am J Physiol Renal Physiol 295: F1388–
1396.
41. Singh SK, Hawkins C, Clarke ID, Squire JA, Bayani J, et al. (2004)
Identification of human brain tumour initiating cells. Nature 432: 396–401.
42. Al-Hajj M, Wicha MS, Benito-Hernandez A, Morrison SJ, Clarke MF (2003)
Prospective identification of tumorigenic breast cancer cells. Proc Natl Acad
Sci U S A 100: 3983–3988.
43. Hubbi ME, Luo W, Baek JH, Semenza GL (2011) MCM proteins are negative
regulators of hypoxia-inducible factor 1. Mol Cell 42: 700–712.
44. Cicenas J (2008) The potential role of AKT phosphorylation in human cancers.
Int J Biol Markers 23: 1–9.
45. Yang SX, Costantino JP, Kim C, Mamounas EP, Nguyen D, et al. (2010) AKT
phosphorylation at Ser473 predicts benefit of paclitaxel chemotherapy in node-
positivebreast cancer. J Clin Oncol 28: 2974–2981.
46. Rogakou EP, Boon C, Redon C, Bonner WM (1999) Megabase chromatin
domains involved in DNA double-strand breaks in vivo. J Cell Biol 146: 905–
916.
47. Tang JT, Wang JL, Du W, Hong J, Zhao SL, et al. (2011) MicroRNA 345, a
methylation-sensitive microRNA is involved in cell proliferation and invasion in
human colorectal cancer. Carcinogenesis 32: 1207–1215.
48. Ye G, Fu G, Cui S, Zhao S, Bernaudo S, et al. (2011) MicroRNA 376c enhances
ovarian cancer cell survival by targeting activin receptor-like kinase 7:
implications for chemoresistance. J Cell Sci 124: 359–368.
49. Lopez JA, Alvarez-Salas LM (2011) Differential effects of miR-34c-3p and miR-
34c-5p on SiHa cells proliferation, apoptosis, migration and invasion. Biochem
Biophys Res Commun 409: 513–519.
50. Hagman Z, Larne O, Edsjo A, Bjartell A, Ehrnstrom RA, et al. (2010) miR-34c
is downregulated in prostate cancer and exerts tumor suppressive functions.
Int J Cancer 127: 2768–2776.
51. Stinson S, Lackner MR, Adai AT, Yu N, Kim H-J, et al. (2011) TRPS1
targeting by miR-221/222 promotes the epithelial-to-mesenchymal transition in
breast cancer. Science Signaling 4: 1–11.
52. Loss LA, Sadanandam A, Durinck S, Nautival S, Flaucher D, et al. (2010)
Prediction of epigenetically regulated genes in breast cancer cell lines. BMC
Bioinformatics 11: 305.
53. Turk B (2006) Targeting proteases: successes, failures and future prospects. Nat
Rev Drug Discov 5: 785–799.
54. Radisky D, Bissell M (2006) Matrix metalloproteinase-induced genomic
instability. Curr Opin Genet Dev 16: 45–50.
55. Coussens LM, Fingleton B, Matrisian LM (2002) Matrix metalloproteinase
inhibitors and cancer: trials and tribulations. Science 295: 2387–2392.
56. Overall CM, Lopez-Otin C (2002) Strategies for MMP inhibition in cancer:
innovations for the post-trial era. Nat Rev Cancer 2: 657–672.
57. Lopez-Otin C, Matrisian LM (2007) Emerging roles of proteases in tumour
suppression. Nat Rev Cancer 7: 800–808.
58. Thiery JP (2003) Epithelial-mesenchymal transitions in development and
pathologies. Curr Opin Cell Biol 15: 740–746.
59. Dvorak HF (1986) Tumors: wounds that do not heal. Similarities between tumor
stroma generation and wound healing. N Engl J Med 315: 1650–1659.
60. Yoo YG, Christensen J, Gu J, Huang LE (2011) HIF-1(alpha) mediates tumor
hypoxia to confer a perpetual mesenchymal phenotype for malignant
progression. Sci Signal 21: pt4.
61. Yoo YG, Christensen J, Huang LE (2011) HIF-1a confers aggressive malignant
traits on human tumor cells independent of its canonical transcription function.
Cancer Res 71: 1244–1252.
62. Kimbro KS, Simons JW (2006) Hypoxia-inducible factor-1 in human breast and
prostate cancer. Endoc Relat Cancer 13: 739–749.
63. Axelson H, Fredlund E, Overberger M, Landberg G, Pahlman S (2005)
Hypoxia-induced dedifferentiation of tumor cells – a mechanisms behind
heterogeneity and aggressiveness of solid tumors. Semin Cell Dev Biol 16: 554–
563.
64. Van den Eynden GG, Van Laere SJ, Van der Auwera I, Gilles L, Burn JL, et al.
(2007) Differential expression of hypoxia and (lymph)angiogenesis-related genes
at different metastatic sites in breast cancer. Clin Exp Metastasis 24: 13–23.
65. Ceppi P, Mudduluru G, Kumarswamy R, Rapa I, Scagliotti GV, et al. (2010)
Loss of miR-200c expression induces an aggressive, invasive, and chemoresistant
phenotype in non-small cell lung cancer. Mol Cancer Res 8: 1207–1216.
66. Vrba L, Jensen TJ, Garbe JC, Heimark RL, Cress AE, et al. (2010) Role for
DNA methylation in the regulation of miR-200c and miR-141 expression in
normal and cancer cells. PLoS One 13: e8697.
67. Davalos V, Moutinho C, Villanueva A, Boque R, Silva P, et al. (2011) Dynamic
epigenetic regulation of the microRNA-200 family mediates epithelial and
mesenchymal transitions in human tumorigenesis. Oncogene doi:10.1038/
onc.2011.383 Epub ahead of print.
68. Moreno-Bueno G, Portillo F, Cano A (2008) Transcriptional regulation of cell
polarity in EMT and cancer. Oncogene 27: 6958–6969.
69. Biswas S, Criswell TL, Wang SE, Arteaga CL (2006) Inhibition of transforming
growth factor-beta signaling in human cancer: targeting a tumor suppressor
network as a therapeutic strategy. Clin Cancer Res 12: 4142–4146.
70. Saito H, Tsujitani S, Oka S, Kondo A, Ikeguchi M, et al. (2000) An elevated
serum level of transforming growth factor-beta 1 (TGF-beta 1) significantly
correlated with lymph node metastasis and poor prognosis in patients with
gastric carcinoma. Anticancer Res 20: 4489–4493.
71. Shariat SF, Kim JH, Andrews B, Kattan MW, Wheeler TM, et al. (2001)
Preoperative plasma levels of transforming growth factor beta(1) strongly predict
clinical outcome in patients with bladder carcinoma. Cancer 92: 2985–2992.
Loss of HtrA1 Triggers EMT and DNA Damage Response
PLoS ONE | www.plosone.org 17 June 2012 | Volume 7 | Issue 6 | e39446

72. Ivanovic V, Demajo M, Krtolica K, Krajnovic M, Konstantinovic M, et al.
(2006) Elevated plasma TGF-beta1 levels correlate with decreased survival of
metastatic breast cancer patients. Clin Chim Acta 371: 191–193.
73. Oka C, Tsujimoto R, Kajikawa M, Koshiba-Takeuchi K, Ina J, et al. (2004)
HtrA1 serine protease inhibits signaling mediated by tgf-beta family proteins.
Development 131: 1041–1053.
74. Valko M, Rhodes CJ, Moncol J, Izakovic M, Mazur M (2006) Free radicals,
metals and antioxidants in oxidative stress-induced cancer. Chem Biol Interact
160: 1–40.
75. Klaunig JE, Kamendulis LM, Hocevar BA (2010) Oxidative stress and oxidative
damage in carcinogenesis. Toxicol Pathol 38: 96–109.
76. Guo Z, Kozlov S, Lavin MF, Person MD, Paull TT (2010) ATM activation by
oxidative stress. Science 330: 517–521.
77. Polo SE, Jackson SP (2011) Dynamics of DNA damage response proteins at
DNA breaks: a focus on protein modifications. Genes Dev 25: 409–433.
78. Matsuoka S, Ballif BA, Smogorzewska A, McDonald ER, Hurov KE, et al.
(2007) ATM and ATR substrate analysis reveals extensive protein networks
reponsive to DNA damage. Science 316: 1160–1166.
79. Shiloh Y (2006) The ATM-mediated DNA-damage reponse: taking shape.
Trend Biochem Sci 31: 402–410.
80. Chan N, Koritzinsky M, Zhao H, Bindra R, Glazer PM, et al. (2008) Chronic
hypoxia decreases synthesis of homologous recombination proteins to offset
chemoresistance and radioresistance. Cancer Res 68: 605–614.
81. Kalyanaraman B, Joseph J, Kalivendi S, Wang S, Konorev E, et al. (2002)
Doxorubicin-induced apoptosis: implications in cardiotoxicity. Mol CellBiochem 234–235: 119–124.
82. Kotamraju S, Kalivendi SV, Konorev E, Chitambar CR, Joseph J, et al. (2004)
Oxidant-induced iron signaling in Doxorubicin-mediated apoptosis. MethodsEnzymol 378: 362–382.
83. Creighton CJ, Li X, Landis M, Dixon JM, Neumeister VM, et al. (2009)Residual breast cancers after conventional therapy display mesenchymal as well
as tumor-initiating features. Proc Natl Acad Sci 106: 13820–13825.
84. Pan WH, Clawson GA (2006) Identifying accessible sites in RNA: the first step indesigning antisense reagents. Curr Med Chem 13: 3083–3103.
85. Pan W, Xin P, Morrey J, Clawson G (2004) A Self-Processing RibozymeCassette: Utility against Human Papillomavirus 11 E6/E7 mRNA and Hepatitis
B virus. Mol Therapy 9: 596–606.86. Benjamini Y, Hochbert Y (1995) Controlling the false discovery rate: A practical
and powerful approach to multiple testing. J Royal Statistical Soc,
Serie B (Methodological) 57: 289–300.87. Benjamini Y, Yekutieli D (2001) The control of the false discovery rate in
multiple testing under dependency. Annals Statistics 29: 1165–1188.88. Abdi H (2007) Bonferroni and Sidak corrections for multiple comparisons. In:
Salkind NJ, editor. Encyclopedia of Measurement and Statistics. Thousand
Oaks, CA: Sage.89. Kaufman L, Rousseauw PJ (1990) Finding groups in data. An introduction to
cluster analysis. New York, New York: Wiley.
Loss of HtrA1 Triggers EMT and DNA Damage Response
PLoS ONE | www.plosone.org 18 June 2012 | Volume 7 | Issue 6 | e39446