download (4mb) - northumbria research link
TRANSCRIPT
Citation: Purcell, Paul (2013) The characterisation of polymicrobial bacterial communities in the lower respiratory tract of individuals with chronic pulmonary disease. Doctoral thesis, Northumbria University.
This version was downloaded from Northumbria Research Link: http://nrl.northumbria.ac.uk/11824/
Northumbria University has developed Northumbria Research Link (NRL) to enable users to access the University’s research output. Copyright © and moral rights for items on NRL are retained by the individual author(s) and/or other copyright owners. Single copies of full items can be reproduced, displayed or performed, and given to third parties in any format or medium for personal research or study, educational, or not-for-profit purposes without prior permission or charge, provided the authors, title and full bibliographic details are given, as well as a hyperlink and/or URL to the original metadata page. The content must not be changed in any way. Full items must not be sold commercially in any format or medium without formal permission of the copyright holder. The full policy is available online: http://nrl.northumbria.ac.uk/policies.html

The characterisation of polymicrobial
bacterial communities in the lower
respiratory tract of individuals with chronic
pulmonary disease
Paul J. Purcell
PhD
2013

The characterisation of polymicrobial
bacterial communities in the lower
respiratory tract of individuals with chronic
pulmonary disease
Paul J. Purcell
A thesis submitted in partial fulfilment of
the requirements of the University of
Northumbria at Newcastle for the degree
of Doctor of Philosophy
Research undertaken in the School of
Life Sciences and in collaboration with the
Freeman Hospital, Newcastle upon Tyne
January 2013
iii
Publications relating to thesis
Publications
Purcell, P.J., Jary, H., Nicholson, A. Perry, J.D., Lanyon, C., Smith, D., Cummings, S.P., De-
Soyza, A. (2012). Polymicrobial airway bacterial communities in adult non-CF
bronchiectasis patients (in preparation for submission).
Purcell, P.J., Cummings, S.P., Jary, H., De-Soyza, A., & Perry, J.D. (2012). Changes in the
lower airway bacterial communities from adult non-CF bronchiectasis populations are
significantly associated with exacerbations and the presence of Haemophilus influenzae.
European Respiratory Journal 40: Supplement 56: 450s.
Purcell, P.J., Nelson, A., Fisher, A., Perry, J.D., De-Soyza, A., & Cummings, S.P. (2011).
Molecular fingerprinting and metagenomic analysis reveals a polymicrobial element in
patients with chronic obstructive pulmonary disease. Thorax 66: Supplement 4: A11-A12.
Cummings, S.P., Nelson, A., Purcell, P.J., De-Soyza, A., Bourke, S.J., & Perry, J.D. (2010).
A comparative study of polymicrobial diversity in CF and non-CF bronchiectasis. Thorax 65:
Supplement 4: A13-A14.
Oral presentations
Purcell, P.J., Nelson, A., Fisher, A., Perry, J.D., De-Soyza, A., & Cummings, S.P. (2011).
Molecular fingerprinting and metagenomic analysis reveals a polymicrobial element in
patients with chronic obstructive pulmonary disease. Presented at the British Thoracic
Society Winter Meeting, London, 7th
December 2011.
Purcell, P.J., Nelson, A., & Cummings, S.P. (2009). Comparison of DNA polymerase
enzymes in DGGE studies of bacterial communities in soil. Presented at the 15th
Molecular
Microbial Ecology Group Meeting, Aberdeen University, 30th
July 2009.
Poster presentations
Purcell, P.J., Cummings, S.P., Jary, H., De-Soyza, A., & Perry, J.D. (2012). Changes in the
lower airway bacterial communities from adult non-CF bronchiectasis populations are
significantly associated with exacerbations and the presence of Haemophilus influenzae.
Presented at the European Respiratory Society Annual Congress Conference, Austria,
Vienna, 3rd
September 2012.
Purcell, P.J., De-Soyza, A., Jary, H., Perry, J.D., Cummings, S.P. (2011). PCR-DGGE
mediated studies of non-CF bronchiectasis individuals reveals a polymicrobial community.
Presented at the Society for General Microbiology Spring Conference, Harrogate
International Centre, 13th
April 2011.
iv
Abstract
Microbial diversity encompasses the whole of the Earth’s biosphere and is incredibly vast.
The microbial diversity of three disparate micro-environments using two culture-independent
techniques (denaturing gradient gel electrophoresis (DGGE) and 454-pyrosequencing) were
revealed. Five commercially available DNA polymerase (pol) enzymes were assessed in
determining the bacterial community generated in sandy soil. The V3 region of the 16S rRNA
gene was targeted for amplification by polymerase chain reaction (PCR). Using a PCR-
DGGE approach, different DNA pols exhibited differences in the DGGE profiles produced.
Both high-fidelity DNA pols Ex Taq™ Hot Start (HS) and Platinum® Pfx detected greater
microbial diversity present within sandy soil than the other DNA polymerase enzymes.
We employed Ex Taq™ HS to characterise the microbial communities present in two
chronic respiratory tract diseases, non-cystic fibrosis bronchiectasis (nCFBR) and chronic
obstructive pulmonary disease (COPD). Seventy individuals expectorated sputum, and using
16S and 28S rRNA PCR-DGGE polymicrobial communities were revealed. From the 70
patients investigated, 20 presented with symptoms consistent with an exacerbation, the
remainder being clinically stable. Demographic and culture data were used in constrained
ordination analyses to identify any significant associations between these data and changes in
the sputum microbiota. The data presented indicates that bacterial lung communities in adult
nCFBR patients have distinct differences between exacerbating and clinically stable episodes.
Persistent colonisation by Pseudomonas aeruginosa is significantly associated with reduced
lung function, and is negatively correlated with Haemophilus influenzae carriage. Bacterial
communities seem to be predominantly assembled by stochastic processes. Fungal taxa
present were scarce.
Stable COPD populations have been previously investigated using culture-dependent
techniques. Eleven clinically stable COPD patients had a bronchoalveolar lavage (BAL) fluid
taken from the right lower lobe. Both 16S and 28S rRNA PCR-DGGE was performed on all
clinical samples from extracted DNA. Co-migration of bands was then compared to a 16S
and 28S standard ladder consisting of pure cultivars. Additionally, execution of 454-
pyrosequencing and interrogation of the V3-V5 region of 16S rRNA genes resulted in 1799
unique OTUs being identified. Dominant bacterial genera identified were Streptococcus,
Arthrobacter, and Staphylococcus respectively. Bacterial taxa identified were then subjected
to multivariate statistical analysis to identify relationships between the microbial
communities and patient phenotypes. Metagenomic analysis demonstrated that heterogeneous
bacterial populations exist in all eleven individuals. This preliminary study shows that the
lungs of COPD sufferers are colonised with multiple species of bacteria and demonstrate that
a complex microbial community is present. Furthermore, bacterial phylotypes resolved to
class-level indicated three potential drivers of community structure within the COPD lung
microbiome: lung function, moderate and severe COPD progression, and smoking status in
cohort. The identification of a greater number of bacterial taxa was also apparent in culture-
negative patients using both PCR-DGGE and 454-pyrosequencing approaches.

v
List of tables _____________________________________________________________________________ xi
List of figures _____________________________________________________________________________ xii
Acknowledgements _______________________________________________________________________ xv
List of abbreviations _____________________________________________________________________ xviii
Chapter One: General introduction ____________________________________________________________ 1
1.1 A global view of micro-organism biodiversity__________________________________________________ 1
1.2 The origins of modern molecular microbiology ________________________________________________ 2
1.3 Culture-dependent microbiology ___________________________________________________________ 4
1.4 Culture-independent microbiology __________________________________________________________ 6
1.5 The bacterial ribosome and 16S rRNA _____________________________________________________ 10
1.6 The human microbiome ________________________________________________________________ 12
1.7 Microbial ecology _____________________________________________________________________ 13
1.8 Microbial biofilms ______________________________________________________________________ 14
1.9 Polymicrobial infections _________________________________________________________________ 16
1.10 The respiratory tract __________________________________________________________________ 18
1.10.1 Chronic respiratory tract diseases _____________________________________________________ 19
1.10.2 Respiratory tract defence mechanisms _________________________________________________ 21
1.11 Aims and objectives of research undertaken________________________________________________ 24
Chapter Two: Materials & methods ___________________________________________________________ 25
2.1 DNA polymerase enzymes and microbial diversity ____________________________________________ 25
2.1.1 Sandy soil sampling strategy __________________________________________________________ 25
2.1.2 DNA extraction from sandy soil ________________________________________________________ 25
2.1.3 Bacterial community detection PCR ____________________________________________________ 26
2.1.3.1 V3 rDNA amplification using AmpliTaq™ DNA polymerase _______________________________ 28
2.1.3.2 V3 rDNA amplification using Ex Taq™ Hot Start DNA polymerase __________________________ 28
2.1.3.3 V3 rDNA amplification using GoTaq® Hot Start DNA polymerase __________________________ 29
2.1.3.4 V3 rDNA amplification using Platinum® Pfx DNA polymerase _____________________________ 29
2.1.3.5 V3 rDNA amplification using Taq DNA polymerase ______________________________________ 29
2.1.4 Agarose gel electrophoresis of V3 rDNA amplicons ________________________________________ 30
2.1.5 Denaturing gradient gel electrophoresis of the bacterial community ____________________________ 30
2.1.5.1 Assembly of parallel gradient gel sandwich ____________________________________________ 30
2.1.5.2 Casting of parallel denaturing gradient gel ____________________________________________ 31
2.1.5.3 Assembly of the upper buffer chamber before electrophoresis of amplicons___________________ 33

vi
2.1.5.4 V3 rDNA amplicon preparation and loading on DGGE apparatus ___________________________ 34
2.1.5.5 DGGE of V3 rDNA amplicon technical replicates in sandy soil samples ______________________ 35
2.1.6 Statistical and ecological analyses of bacterial community profiling ____________________________ 35
2.1.6.1 DGGE profile capture and analysis __________________________________________________ 35
2.1.6.2 Shannon diversity index derivation __________________________________________________ 36
2.1.6.3 Principal components analysis _____________________________________________________ 37
2.2 Bacterial and fungal standard organism ladders for semi-quantitative DGGE analyses in patient cohorts __ 37
2.2.1 Bacterial 16S standard ladder construction _______________________________________________ 37
2.2.2 Fungal 28S standard ladder construction ________________________________________________ 39
2.2.2.1 Fungal isolates selection and collection ______________________________________________ 39
2.2.2.2 Extraction of fungal gDNA from isolates ______________________________________________ 40
2.2.2.3 PCR amplification of 28S rDNA segments_____________________________________________ 41
2.2.2.4 Agarose gel electrophoresis of 28S rDNA segments _____________________________________ 42
2.2.2.5 DGGE of U1-U2 rDNA PCR fragments _______________________________________________ 42
2.3 PCR-DGGE study of a cross-sectional cohort with non-CF bronchiectasis _________________________ 43
2.3.1 Patient cohort selection and ethical considerations _________________________________________ 43
2.3.2 Sputum sample collection and diagnostic microbiology _____________________________________ 44
2.3.3 DNA extraction from sputum clinical samples _____________________________________________ 44
2.3.4 Bacterial community detection PCR ____________________________________________________ 46
2.3.5 Fungal community detection PCR ______________________________________________________ 47
2.3.6 Agarose gel electrophoresis of both V3 and U1-U2 rDNA amplicons ___________________________ 48
2.3.7 Molecular fingerprinting of bacterial and fungal communities in patient cohort ____________________ 48
2.3.7.1 DGGE of V3 rDNA amplicons ______________________________________________________ 48
2.3.7.2 DGGE of U1-U2 rDNA amplicons ___________________________________________________ 49
2.3.8 Bacterial and fungal DGGE profile capture and analysis _____________________________________ 49
2.3.9 Ecological analysis inferred from DGGE profiling __________________________________________ 50
2.3.9.1 Raup-Crick similarity index ________________________________________________________ 51
2.3.10 Ordination analyses by Canoco _______________________________________________________ 51
2.4 Molecular fingerprinting and metagenomic analysis in a chronic obstructive pulmonary disease cohort ___ 52
2.4.1 Sampling methodology and ethical considerations within patient cohort _________________________ 52
2.4.2 DNA extraction from bronchoalveolar lavage and bronchial secretion fluid clinical samples __________ 53
2.4.3 ‘Semi-nested’ bacterial community detection PCR in BAL and BS fluid samples __________________ 54
2.4.4 ‘Semi-nested’ fungal community detection PCR in BAL and BS fluid samples ____________________ 55
vii
2.4.5 Agarose gel electrophoresis of both V3 and U1-U2 rDNA amplicons from BAL and BS fluid samples __ 56
2.4.6 Molecular fingerprinting of the bacterial and fungal community within BAL and BS fluid samples _____ 57
2.4.6.1 DGGE of V3 rDNA amplicons from BAL and BS fluid samples _____________________________ 57
2.4.6.2 DGGE of U1-U2 rDNA amplicons from BAL and BS fluid samples __________________________ 57
2.4.7 Metagenomic analysis of BAL and BS fluid samples ________________________________________ 58
2.4.8 Statistical and ecological analysis of COPD patient cohort ___________________________________ 58
Chapter Three: DNA polymerase enzymes and microbial diversity __________________________________ 59
3.1 Abstract _____________________________________________________________________________ 59
3.2 Background __________________________________________________________________________ 59
3.3 Results _____________________________________________________________________________ 65
3.3.1 Optimisation of PCR amplifications _____________________________________________________ 65
3.3.2 Ecological analysis from DGGE profiles generated _________________________________________ 68
3.3.2 Statistical analysis from DGGE profiles generated _________________________________________ 75
3.4 Discussion ___________________________________________________________________________ 84
3.5 Conclusions__________________________________________________________________________ 87
Chapter Four: PCR-DGGE study of a cross-sectional cohort with non-cystic fibrosis bronchiectasis _________ 88
4.1 Abstract _____________________________________________________________________________ 88
4.2 Background __________________________________________________________________________ 89
4.3 Results _____________________________________________________________________________ 93
4.3.1 Patient cohort analysis ______________________________________________________________ 93
4.3.2 Microbial culture analysis ____________________________________________________________ 94
4.3.3 Ecological analysis of bacterial community _______________________________________________ 95
4.3.4 Fungal DGGE analysis _____________________________________________________________ 106
4.3.5 Bacterial community assembly _______________________________________________________ 106
4.4 Discussion __________________________________________________________________________ 106
4.5 Conclusions_________________________________________________________________________ 112
Chapter Five: Molecular fingerprinting and metagenomic analysis in a chronic obstructive pulmonary disease
cohort ________________________________________________________________________________ 113
5.1 Abstract ____________________________________________________________________________ 113
5.2 Background _________________________________________________________________________ 114
5.3 Results ____________________________________________________________________________ 116
5.3.1 Patient cohort analysis _____________________________________________________________ 116
5.3.2 Culture-dependent analysis of clinical samples ___________________________________________ 117

viii
5.3.3 Ecological analysis of bacterial and fungal communities by DGGE ____________________________ 117
5.3.4 Metagenomic analysis by 454-pyrosequencing of bacterial community ________________________ 124
5.4 Discussion __________________________________________________________________________ 132
5.4.1 Bacterial community analysis in COPD cohort by PCR-DGGE _______________________________ 132
5.4.2 Metagenomic analysis of bacterial communities in COPD cohort _____________________________ 137
5.4.3 Fungal community analysis in COPD cohort by PCR-DGGE ________________________________ 146
5.4.4 Microbial community profiles by ordination analysis _______________________________________ 150
5.5 Conclusions_________________________________________________________________________ 152
References ____________________________________________________________________________ 154
Appendix 1: Chemicals and media __________________________________________________________ 186
A1.1 1 % (w/v) agarose gel ________________________________________________________________ 186
A1.2 Molecular biology dyes _______________________________________________________________ 186
A1.2.1 10 mL 6× bromophenol blue loading dye ______________________________________________ 186
A1.2.2 10 mL DCode™ dye solution reagent _________________________________________________ 186
A1.2.3 10 mL 2× DCode™ gel loading dye __________________________________________________ 186
A1.3 Denaturing solutions for DGGE experiments ______________________________________________ 187
A1.4 10 % (w/v) ammonium persulphate (APS) _________________________________________________ 187
A1.5 Running buffers for gel-based experiments _______________________________________________ 188
A1.5.1 2 L 50× TAE solution ______________________________________________________________ 188
A1.5.2 1 L 1× TAE solution _______________________________________________________________ 188
A1.6 Bacteriology and mycology media ______________________________________________________ 188
A1.6.1 Basic recipe for 1 L Luria-Bertani (LB) media and broth ___________________________________ 188
A1.6.2 NADsens agar and broth __________________________________________________________ 189
A1.6.3 Basic recipe for 100 mL Sabourad broth _______________________________________________ 189
Appendix 2: Molecular base-pair markers _____________________________________________________ 190
Appendix 3: Cross-sectional nCFBR cohort demographic data ____________________________________ 191
Appendix 4: Microbiology Department at the Freeman Hospital SOP: Sputum and related samples ________ 197
Introduction ____________________________________________________________________________ 199
Types of specimen ______________________________________________________________________ 199
Bronchial aspirate ______________________________________________________________________ 199
Bronchial brushing _____________________________________________________________________ 199
Bronchial washings ____________________________________________________________________ 200
Pleural fluid __________________________________________________________________________ 200

ix
Tracheal aspirate ______________________________________________________________________ 200
Transthoracic aspirate __________________________________________________________________ 200
Transtracheal aspiration _________________________________________________________________ 200
Clinical associations _____________________________________________________________________ 200
Empyema ____________________________________________________________________________ 200
Lower respiratory tract infection ___________________________________________________________ 201
Pleurisy _____________________________________________________________________________ 201
Pneumonia ___________________________________________________________________________ 202
Community acquired pneumonia __________________________________________________________ 202
Hospital acquired pneumonia _____________________________________________________________ 203
Pneumonia in special situations and patient groups____________________________________________ 203
Aspiration pneumonia: _________________________________________________________________ 203
Lung abscess: _______________________________________________________________________ 203
Cystic fibrosis __________________________________________________________________________ 204
Fungal infections ________________________________________________________________________ 204
Immunosuppression _____________________________________________________________________ 206
Mycobacterial disease ____________________________________________________________________ 206
Nocardia and Actinomyces infections ________________________________________________________ 206
Parasitic infections ______________________________________________________________________ 207
Specimen processing ____________________________________________________________________ 208
Preparation of Sputasol _________________________________________________________________ 209
Sputum Culture Protocol ________________________________________________________________ 209
Pleural Fluids Culture Protocol ____________________________________________________________ 210
Tissues and Biopsies Culture Protocol ______________________________________________________ 210
Respiratory Swab Culture Protocol ________________________________________________________ 210
BAL Samples _________________________________________________________________________ 211
Introduction _________________________________________________________________________ 211
Bronchoalveolar lavage (BAL) ___________________________________________________________ 211
Non directed bronchoalveolar lavage (NBL) ________________________________________________ 211
Culture of BAL samples ________________________________________________________________ 211
Interpretation guidelines __________________________________________________________________ 212
Charts ________________________________________________________________________________ 213
BAL Samples (Diagnostic/Donor/Recipient) __________________________________________________ 213

x
Sputum ______________________________________________________________________________ 214
Bronchiectasis sputum __________________________________________________________________ 215
Cystic fibrosis sputum __________________________________________________________________ 216
Cough swabs _________________________________________________________________________ 217
Pleural fluids __________________________________________________________________________ 218
Lung tissue samples, biopsy and PM materials, empyema ______________________________________ 219
Lung abscess and aspiration pneumonia sputum _____________________________________________ 220
Transplant assessment and post lung transplant sputum _______________________________________ 221
Respiratory Sample Quick Guide __________________________________________________________ 222
Appendix 5: COPD cohort demographic data __________________________________________________ 225
Phenotypic and conventional microbiology culture data __________________________________________ 225
xi
List of tables
Table 2.1: Bacterial species utilised in 16S standard ladder construction: p. 38
Table 3.1: Comparison of DNA pols utilised to determine microbial diversity in sandy soil
samples: p. 64
Table 3.2: Comparison of microbial diversity in the five sandy soil samples analysed by
DGGE: p. 69
Table 3.3: Comparison of mean number of bands detected and H′ sc ores calculated using
technical replicates of the five DNA polymerase enzymes assessed: p. 70
Table 3.4: Comparison of H′ scores generated by each DNA pol replicate and significant
differences in diversities detected in SS1R: p. 76
Table 3.5: Comparison of H′ scores generated by each DNA pol replicate and significant
differences in diversities detected in SS2R: p. 77
Table 3.6: Comparison of H′ scores generated by each DNA pol replicate and significant
differences in diversities detected in SS3R: p. 77
Table 3.7: Comparison of H′ scores generated by each DNA pol replicate and significant
differences in diversities detected in SS4R: p.78
Table 3.8: Comparison of H′ scores generated by each DNA pol replicate and significant
differences in diversities detected in SS5R: p. 78
Table 4.1: Summary of patient demographic data: p. 94
Table 5.1: Number of reads and OTUs assigned per COPD subject from metagenomic
analysis: p. 124

xii
List of figures
Fig. 1.1: The universal tree of life (ToL) representing the three known domains, Archaea,
Bacteria, and Eucarya: p. 3
Fig. 1.2: Principals of DNA pyrosequencing: p. 8
Fig. 1.3: Conserved and hypervariable regions within the 16S rRNA gene: p. 9
Fig. 1.4: The rrnB operon showing nucleolytic processing of the rrnB primary transcript: p.
11 Fig. 3.1A-E: Gel images showing final PCR amplifications of V3 rDNA fragments by each
DNA pol technical replicate in sandy soil samples 1-5: pp. 66-67 Fig. 3.2A-E: DGGE profiles (35-55 % denaturing gradient) of SS1R-SS5R showing V3
rDNA fragments from all DNA pol technical replicates assessed: pp. 72-74
Fig. 3.3A-E: PCA of SS1R-SS5R from each of the DGGE profiles generated and DNA pol
technical replicates assessed: p. 79-83
Fig. 4.1A-G: DGGE profiles of whole nCFBR cohort investigated using a 16S rRNA PCR-
DGGE culture-independent approach: pp. 96-99
Fig. 4.2: Canonical correspondence analysis of whole patient nCFBR cohort: p. 102
Fig. 4.3: Canonical correspondence analysis of exacerbated nCFBR sub-cohort: p. 104
Fig. 4.4 Canonical correspondence analysis of stable nCFBR sub-cohort: p. 105
Fig. 5.1: DGGE profile (32.5-60 % denaturing gradient) showing amplified V3 rDNA
fragments in COPD cohort: p. 119
Fig. 5.2: DGGE profile (40-60 % denaturing gradient) showing amplified U1-U2 rDNA
amplicons in COPD cohort: p. 120
Fig. 5.3: Redundancy analysis showing ordination plot of the bacterial community analysed
by DGGE and environmental variables in COPD cohort: p. 122

xiii
Fig. 5.4: Canonical correspondence analysis showing ordination plot of the fungal
community analysed by DGGE and environmental variables in COPD cohort: p. 123
Fig. 5.5: Rarefaction curve showing sample coverage diversity in COPD cohort: p. 127
Fig 5.6: Ranking of bacterial genera within COPD cohort: p. 128
Fig. 5.7: Bacterial genus population in COPD cohort: p. 129
Fig. 5.8: Bacterial class-level population in COPD cohort: p. 130
Fig. 5.9: CCA of bacterial phylotypes resolved to class-level showing potential drivers of the
COPD bacterial community in the COPD subjects analysed: p. 131

xiv
For my parents who will always believe in me.
And for Josephine Purcell, Peter Purcell,
Glen Purcell, Keith Purcell, and Lorraine Purcell, RIP.
“The Earth is a microbial planet, on which macro-organisms are recent additions ― highly
interesting and extremely complex in ways that most microbes aren’t, but in the final analysis
relatively unimportant in a global context” (Prof. Mark Wheelis in a personal communication
to Prof. Carl Woese, 1998).

xv
Acknowledgements
I remember when I first enrolled at Northumbria University way back to embark on a road
of reading for the BSc award. Even back then, I have always wanted to fulfil my ambition of
submitting for a Ph.D. The road leading to this realisation could not have been possible
without certain influences, events, and the many people that I have been introduced to in my
life. The following individuals below have been instrumental to me in achieving this goal.
I would personally like to thank Prof. Stephen Cummings for giving me this unique
opportunity in addition to his guidance, forethought, encouragement, and patience in all
aspects in the body of work contained herein.
Additional thanks to Prof. John Perry and Audrey Perry for extra support in the clinical
microbiology aspects and collection of patient clinical specimens, without which, this project
would not have been achievable. I would like to show my gratitude to you both for allowing
me to carry out the required genomic DNA extractions and the use of the facilities at the
Freeman Hospital, Microbiology Department.
Thanks also to Dr. Anthony De-Soyza for his invaluable knowledge, thoughtful
suggestions and discussions, especially in regards to the more clinical aspects of the research
project; in particular, patient recruitment and selection. A special mention must be given to
Dr. Hannah Jary for organising and complying all of the patient phenotypic data in the non-
CF bronchiectasis cohort. Additional thanks also to Dr. Syba S. Sunny for providing extra
clinical information regarding the cross-sectional non-CF bronchiectasis patient cohort.
I owe a great deal of gratitude to my immediate research colleagues and friends in the
Cummings group: Jesmine Lim for thoughtful discussions; Dr. Andrew Nelson for his
invaluable advice and direction in relation to the technical aspects of the project; Dr. Caroline
Orr for her statistical intuition and guidance; and Chris Stewart for his tuition in the
metagenomic aspects of this project. I would like to thank you all for your support and
kindness.

xvi
I would like to collectively thank colleagues past and present who I had the pleasure of
working alongside with not only in Lab A321 but also within the School of Life Sciences:
Paul Agnew, Linda Barlow, Vivien Brindley, Dr. Alistair Brown, Dr. Lynn Dover, Susan
Carlile Harry Elliott, David Harrison, Beth Gibson, Dr. Alan Jones, Dr. Amanda Jones, Dr.
Clare Lanyon, Dr. Anna Lindsay, Suzanne Lonsdale, Dr. Peter Maskrey, Fiona McKie-Bell,
Dr. Kay Paget, Deborah Pettitt, Dr. Richard Ranson, Dr. Steve Reed, Dr. Bryan Singer, Dr.
Darren Smith, Derek Stobo, David Thomas, Dr. Hannah Walden, Karen Walker, Jennifer
Wright, and Robert Young. A special thanks to the following colleagues, as without their
encouragement as an undergraduate and I would not have pursued this goal: Dr. Chris
Baldwin, Prof. Gary Black, Dr. Geoff Bosson, Dr. Mark Daniels, Dr. David Holmes, and
Prof. Iain Sutcliffe.
I would also like to give thanks to the many Ph.D. researchers that I have met and worked
with on this journey (you know who you are and you are too numerous to mention!).
Additional thanks to Lee Barrett for the endless debates on politics, film, music and assorted
subject matters! I also offer my thanks to my close friends and colleagues at M&S.
Finally, I owe a great deal of thanks to four very special people in my life: mum, dad,
Simon and Natalie (who has at times endured this Ph.D. with me and kept me going when the
going was very tough). Thank you all for your tireless support, patience and love in helping
me achieve this goal.

xvii
Declaration:
I declare that the work contained in this thesis has not been submitted for any other award
and that it is all my own work. I also confirm that this work fully acknowledges opinions,
ideas and contributions from the work of others. The work was carried out in collaboration
with the Microbiology Department, Freeman Hospital, Newcastle upon Tyne.
Name:
Signature:
Date:

xviii
List of abbreviations
A: adenine
AIDS: acquired immunodeficiency syndrome
amoA: gene encoding ammonium oxygenase enzyme(s)
AB: AmpliTaq® DNA polymerase (Applied Biosystems™)
ANOVA: analysis of variance
APS: ammonium persulphate
bTEFAP: bacterial tag-encoded FLX-Titanium amplicon pyrosequencing
BAL: bronchoalveolar lavage
BALF: bronchoalveolar lavage fluid
BCC: Burkholderia cepacia complex
bp: base pairs
BPB: bromophenol blue
BS: bronchial secretion
BSA: bovine serum albumin
C: cytosine
cAMP: cyclic-adenosine monophosphate
CCA: canonical correspondence analysis
cDNA: complementary deoxyribonucleic acid
CF: cystic fibrosis
CFTR: gene encoding the CF transmembrane conductance regulator protein
xix
cm: centimetre(s)
CO2: carbon dioxide
COPD: chronic obstructive pulmonary disease
CS#X: COPD subject where X denotes patient number enrolled in study
DCA: detrended correspondence analysis
DCs: dendritic cells
DGGE: denaturing gradient gel electrophoresis
dH2O: distilled water
DHLPC: denaturing high-performance liquid chromatography
DPI: dots per inch
DNA: deoxyribonucleic acid
dNTPs: deoxyribonucleoside triphosphates
dsDNA: double-stranded deoxyribonucleic acid
dsRNA: double-stranded ribonucleic acid
EDTA: ethylenediamine tetraacetic acid
ET: Ex Taq™ Hot Start DNA polymerase (TAKARA BIO INC.)
EPS: extracellular polymeric substances
FEV1: forced expiratory volume in one second
FEV1%: forced expiratory volume in one second predicted
FVC: forced vital capacity
g: acceleration under gravity
g: gram(s)

xx
G: guanine
gDNA: genomic deoxyribonucleic acid
GOLD: Global Initiative for Chronic Obstructive Lung Disease
GT: GoTaq® Hot Start DNA polymerase (Promega)
h: hour(s)
H: hydrogen
H′: Shannon diversity index
HCl: hydrochloric acid
HIV: human immunodeficiency virus
HMP: Human Microbiome Project
HPMV: human metapneumovirus
HCPC: Health & Care Professions Council
HRCT: high-resolution computed tomography
HS: hot start
IgA: immunoglobulin A
IL-1: interleukin 1
J′: species evenness
L: litre
LB: Luria-Bertani
LMG: Laboratory of Microbiology, University of Ghent
ln: natural logarithm
LPS: lipopolysaccharide
xxi
LRR: leucine-rich-repeat
LRT: lower respiratory tract
LTA: lipoteichoic acid
M molar
m: metre(s)
mA: milliamp(s)
mg: milligram(s)
Mg2+
: magnesium cation
MΩ mega ohm(s)
MgCl2: magnesium chloride
MgSO4: magnesium sulphate
min: minute(s)
MM: master-mix
Mn2+
: manganese cation
µ: micro
n: nano
NAD: nicotinamide dinucleotide
NaCl: sodium chloride
NaOH: sodium hydroxide
NBD1: nucleotide binding domain 1
NCDs: non-communicable diseases
nCFBR: non-cystic fibrosis bronchiectasis

xxii
NCTC: National Collection of Typed Cultures
NGS: next-generation sequencing
nifH: gene encoding nitrogenase enzyme(s)
NIH: National Institutes of Health
NKCs: natural killer cells
nt: nucleotide(s)
NTHI: non-typeable Haemophilus influenzae
NTM: non-tuberculosis mycobacteria
O2: diatomic oxygen
OTU: operational taxonomic unit
PAMPs: pathogen associated molecular pattern(s)
PC: principal component
PCA: principal components analysis
PCoA: principal co-ordinates analysis
PCR: polymerase chain reaction
Pg: petagram(s)
Pfx: Platinum® Pfx DNA polymerase (Invitrogen™)
pol: polymerase(s)
PPi: pyrophosphate
PPMs: potentially pathogenic micro-organisms
PRRs: pattern-recognition receptors
QS: quorum sensing

xxiii
R: species richness
RDA: redundancy analysis
rDNA: ribosomal deoxyribonucleic acid
Rf: relative front
RLL: right-lower lobe
RNA: ribonucleic acid
rpm: revolutions per minute
rpoB: gene encoding for RNA polymerase β subunit
rRNA: ribosomal ribonucleic acid
rrn: operon encoding 16S rRNA, 23S rRNA, and 5S rRNA genes
rrs: gene encoding 16S rRNA
RSV: respiratory syncytial virus
RTI: respiratory tract infection
RTL: Research and Testing Laboratories, LLC.
s: second(s)
S: Svedberg unit(s)
SD: standard deviation
SDS: sodium dodecyl sulphate
SL: standard ladder(s)
SOP: standard operating procedure
spp.: species
SSCP: single strand conformation polymorphism
xxiv
ssDNA: single-stranded deoxyribonucleic acid
SSU: small subunit
SSXR: soil sample X (denotes sample number) replicates
T: thymine
TAE: tris-acetate-EDTA
Taq: New England Biolabs® Inc. Taq DNA polymerase
TEMED: N,N,N′,N′-tetramethylethylenediamine
TGGE: temperature gradient gel electrophoresis
TIFF: tagged image file format
TLRs: Toll-like receptors
ToL: tree of life
T-RFLP: terminal-restriction fragment length polymorphism
URT: upper respiratory tract
UV: ultra-violet
V: volt(s)
WHO: World Health Organization
1°: primary
3′: 3 prime
5′: 5 prime

1
Chapter One: General introduction
1.1 A global view of micro-organism biodiversity
The biosphere of Earth is absolutely dependent on micro-organisms since they are
required to sustain almost every form of life on the planet and are also key drivers in almost
all geochemical cycles (Madigan et al., 2009). Since the landmark paper published by Woese
and Fox in 1977, followed by subsequent developments in molecular biology in the 1980s,
microbial diversity on Earth is recognised as being greater than microbiologists had ever
envisioned. Over evolutionary time, diversity has led to the successful proliferation and
colonisation of micro-organisms across an extensive range of habitats. Environments such as
soil, the ocean, the subsurface, and indeed macro-organisms including humans, harbour an
extraordinary number of prokaryotes (Whitman et al., 1998). In addition, the many
prokaryotic phyla have species capable of colonising a multitude of environments
inhospitable to other forms of life for example: hot springs situated in Yellowstone Park
(Hugenholtz et al., 1998b), the high temperatures and extremely low pH niche of the
thermoacidicphilic euryarchaeon Picrophilus torridus (Futterer et al., 2004), the deep sea
(DeLong et al., 1994), hydrothermal vents (Huber et al., 2000), the sea ice of the Antarctic
(Thomas and Dieckmann, 2002), and even in the permanent ice both in Lake Bonney and
Lake Vostok (Christner et al., 2001, Gordon et al., 2000, Priscu et al., 1999).
Estimates of the total number of prokaryotes on Earth are in the order of 4-6 × 1030
cells
with a biomass of 350-550 Pg of carbon (1 Pg = 1015
g) (Whitman et al., 1998). Owing to the
inconceivable numbers of bacterial cells present in our biosphere, their rapid growth and
ability to demonstrate physiological and genetic adaptability this group of organisms has
incredible genetic diversity (Hindré et al., 2012). Putting these numbers into perspective is
indeed a daunting task, it has been estimated that one ton of soil contains at least 4 × 10⁶
different taxa (Curtis et al., 2002). Quoting Pace, et al., “we are only scratching the surface of
a vast reservoir of microbial diversity” (Pace et al., 2012).

2
1.2 The origins of modern molecular microbiology
A sobering aspect to consider in terms of the many species of bacteria that inhabit the
Earth is that estimates of only 1 % of all microbial species have been identified and
characterised by classical culture-based techniques (Amman et al., 1995, Staley and
Konopka, 1985). Historically, before the advent of molecular sequence-based phylogenetics
much of microbial life (and its genetic diversity) was alluded to and previous hypotheses
regarding the kingdoms of life constituted five: animals, plants, fungi, protists, and monera
(protozoa and bacteria respectively) (Whittaker, 1969). This model was adopted primarily on
the previous knowledge of the macro-organisms around us within the biosphere, and rather
ignorantly, bacteria themselves were thought to be unimportant; the term “prokaryote” itself
was defined rather negatively in comparison to their eukaryotic counterparts in the 1960s
(Stainer and van Niel, 1962). The advances in molecular biology in the next decade made
possible the inference of phylogenetics across all the kingdoms of life by comparison of
ribosomal ribonucleic acid sequences. In addition to the seminal work carried out by Pace
and collaborators using these techniques enabled a reconstruction of the history of life and
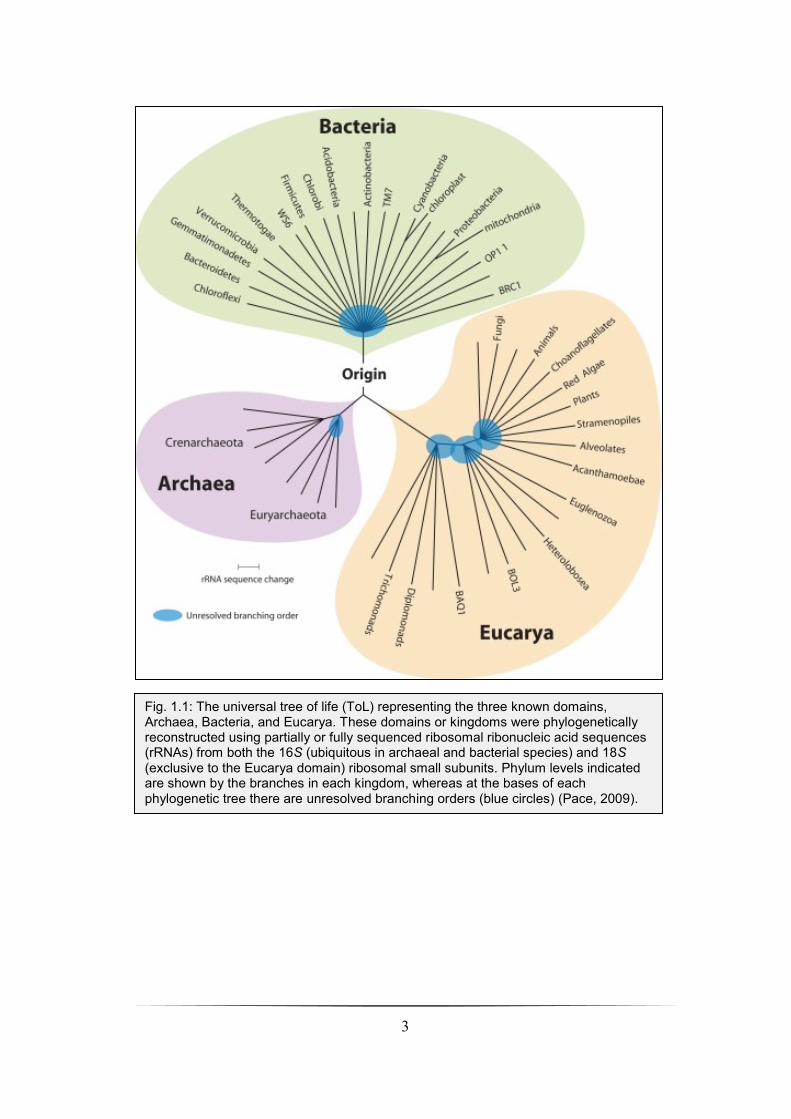
proposed a new model consisting of the now-recognised three primary lines of evolutionary
descent as opposed to the initial standard two in the universal tree of life (Woese, 1987,
Woese and Fox, 1977, DeLong and Pace, 2001, Olsen et al., 1986). These are now formally
designated “urkingdoms” or “domains” represented by the Eucarya (eukaryotes), Bacteria
(initially termed the eubacteria) and Archaea (initially termed archaebacteria) (Fig. 1.1)
(Woese et al., 1990).
3
Fig. 1.1: The universal tree of life (ToL) representing the three known domains, Archaea, Bacteria, and Eucarya. These domains or kingdoms were phylogenetically reconstructed using partially or fully sequenced ribosomal ribonucleic acid sequences (rRNAs) from both the 16S (ubiquitous in archaeal and bacterial species) and 18S (exclusive to the Eucarya domain) ribosomal small subunits. Phylum levels indicated are shown by the branches in each kingdom, whereas at the bases of each phylogenetic tree there are unresolved branching orders (blue circles) (Pace, 2009).

4
1.3 Culture-dependent microbiology
Classical culture-based microbiological techniques pioneered by Beijerinck, Koch,
Pasteur, van Leeuwenhoek, and Windogradsky maintained and developed microbiological
research for centuries (Keller and Zengler, 2004). Culture-dependent microbiology is crucial
if one is to characterise and gain a significant understanding of a bacterial species or micro-
organism, its physiology, or access to its metabolic pathways via genes dispersed throughout
its genome (Keller and Hohn, 1997, Palleroni, 1997, Yu et al., 2002). However, using
traditional enrichment and cultivation techniques accepts the issue that such techniques are
highly selective and biased towards the growth of specific bacterial species.
This facet of traditional culture-based microbiology is no more apparent than in the
modern clinical microbiology laboratory where these techniques are used in conjunction with
modern molecular-based methodologies for the routine isolation of potentially pathogenic
micro-organisms (PPMs) from patient specimens (i.e., the detection of aetiological agents by
providing conditions they require to grow in vitro (Rogers et al., 2009a)). Indeed, using
selective media for effective isolation requires that the PPMs in question must grow to at
least 105 cells in density in order for these bacterial colonies to be visualised (Keller and
Zengler, 2004). One must also bear in mind that for isolation of the aetiological agent(s), the
selective media employed biases in favour of fast-growing and high density forming micro-
organisms that have the capacity to withstand high concentrations of nutrients and have the
ability to grow in isolation (Keller and Zengler, 2004). A great number of traditional
cultivation techniques fail to isolate many micro-organisms from most natural habitats,
including humans. A major contributing factor of this, is that the traditional cultivation
techniques employed such as selection and isolation of specific microbes utilise conditions
for growth in vitro that are completely different to the natural environment from which many
of these micro-organisms originate from (Eilers et al., 2000, Torvisk et al., 2002).
The major limiting factor in using culture-based microbiology to isolate aetiological
agents is that culture-based techniques do not consider the role of polymicrobial infections or
the vast numbers of microbial taxa that colonise the human host. Indeed, bacteria infecting
human tissues are often part of mixed bacterial communities, in particular when mucosal
barriers have been compromised (Brogden et al., 2005). Contextually, we sometimes need to
consider infection as a complex microbial milieu (Rogers et al., 2009a). This is very

5
important if appropriate treatment regimens are to be adopted and tailored to the individual
patient infected with one or more pathogenic organisms. The advent of culture-independent
techniques has revealed these microbial communities within the human host in greater detail
than ever before and also enables investigators to appreciate the magnitude of the task
involved in characterising these communities.

6
1.4 Culture-independent microbiology
Culture-independent techniques have revealed a vast world of microbial diversity
remaining to be discovered and placed microbes, once thought to be insignificant, firmly
back into their respective positions in the universal tree of life (Pace et al., 2012). Molecular
fingerprinting methods such as denaturing gradient gel electrophoresis (DGGE), temperature
gradient gel electrophoresis (TGGE), terminal restriction fragment length polymorphism (T-
RFLP), single strand conformation polymorphism (SSCP), and denaturing high-performance
liquid chromatography (DHLPC) have enabled researchers to analyse microbial communities
from several ecosystems; these techniques are collectively known as microbial profiling
(Nocker et al., 2007). These fingerprinting techniques have usually targeted the 16S rRNA
gene(s) (Hugenholtz et al., 1998a, Pace et al., 1986) or sometimes functional genes encoding,
for example, ammonium mono-oxygenase (amoA) (Horz et al., 2000, Yeager et al., 2005),
nitrogenase (nifH) (Rosado et al., 1998, Widmer et al., 1999), and RNA polymerase B (rpoB)
(Adékambi et al., 2008, Ormeno-Orrillo et al., 2006, Renouf et al., 2006) for the analysis of
sub-populations that exhibit certain functional properties within a community (Nocker et al.,
2007). Total community DNA is extracted and used as a template for PCR amplification of
the 16S rRNA gene(s), PCR fragments are then either analysed by electrophoresis (DGGE,
TGGE, SSCP, and T-RFLP) or chromatography (DHLPC) (Nocker et al., 2007). Resolution
of the different bacterial species within the community is achieved as a function of DNA
sequence variation within the amplified 16S rDNA fragments as these are usually of similar
size (Hamady and Knight, 2009, Nocker et al., 2007). Finally, from the community profiles
generated, one can analyse the banding patterns or clustering of specific bands using
statistical techniques such as Principal Co-ordinates Analysis (PCoA) (Dollhopf et al., 2001).
More recently, the next-generation sequencing (NGS) analysers developed by Roche,
Illumina®, and Applied Biosystems™ have taken sequencing to the next level via
deployment of multiple platforms and different sequencing technologies paving the way for
the era of metagenomics that we now live in. This ‘next level’ can be further defined as what
is commonly known as ‘deep sequencing’, i.e., massively parallel sequencing ― the
simultaneous sequencing of several hundred thousand DNA fragments with read lengths
exceeding that of 100 base pairs (bp) (McPherson, 2009). The term metagenomics is defined
as “culture-independent studies of the collective set of genomes of mixed microbial
communities and applies to explorations of all microbial genomes in consortia that reside in

7
environmental niches, in plants, or in animal hosts (Petrosino et al., 2009). Using 454-
pyrosequencing as an example of a NGS platform; briefly, DNA pyrosequencing or
sequencing synthesis is based on the detection of released inorganic pyrophosphate (PPi)
during DNA synthesis. Visible light (i.e., photons) is generated by a cascade of enzymatic
reactions and the amplitude of each light signal is proportionally represented by the
incorporation of nucleotides (Fig. 1.2) (Novais and Thorstenson, 2011). In metagenomic
studies using massively parallel sequencing technology, DNA pyrosequencing targets
hypervariable regions within bacterial 16S rRNA genes amplified by PCR. By using millions
of single-stranded DNA fragments from isolated genomic DNA (gDNA) as sequencing
templates attached to beads in emulsion PCR, amplification occurs within each emulsion
droplet. Each bead carrying millions of copies of unique DNA templates are all denatured
and every bead attached to a single-stranded DNA (ssDNA) clone are deposited into tiny
chambers before being exposed to another set of smaller beads carrying immobilised
enzymes which are responsible for DNA pyrophosphate sequencing. Nucleotide composition
of each ssDNA fragment is elucidated by the associative release of PPi and generation of
photons (Margulies et al., 2005). Exploitation of 16S rRNA gene(s) in culture-independent
studies of the microbiota of metazoan subjects and the environment has enabled microbial
ecologists to not only infer the phylogenetic relationships of the bacterial communities but to
also detect uncultivable species of bacteria from many taxa using modern sequencing
technologies coupled with molecular fingerprinting methodologies. From the original 11
phyla described by Woese and colleagues nearly 30 years ago (Woese et al., 1985), the
bacterial phyla now number 53 thanks in part to the impact of 16S rRNA gene sequencing
from uncultivable bacterial species (Rappé and Giovannoni, 2003).

8
Fig. 1.2: Principals of DNA pyrosequencing. 1.) Single-stranded DNA (ssDNA) in PCR amplicon serves as template for hybridisation of a sequencing primer incubated with four enzymes, DNA polymerase, adenosine triphosphate (ATP) sulphurylase, luciferase, and apyrase in addition to the substrates adenosine 5′ phosphosulphate (APS), and luciferin. 2.) Addition of the first deoxyribonucleoside triphosphate (dNTP) into the reaction results in catalysis of this dNTP by the DNA polymerase enzyme via insertion into the DNA strand but only if it is complementary to the base in the template strand. Incorporation of these complementary bases is associated with the release of inorganic pyophosate (PPi). Subsequently, the amount of PPi released is related to the amount of incorporated nucleotides in the reaction, i.e, in equimolar quantities. 3.) Conversion of PPi to ATP is executed by the enzyme ATP sulphurylase in the presence of APS. The generation of photons proportional to the amount of ATP released from the primary conversion from PPi to ATP is from the ATP product itself driving the luciferase-mediated conversion of luciferin to oxyluciferin. Detection of photons in the luciferase-catalysed reaction is achieved by a charge coupled device chip and is visualised by a peak in the program (i.e., raw data output). The light signal produced is proportional to the number of nucleotides incorporated. 4.) The nucleotide-degrading enzyme, apyrase, continuously degrades unincorporated nucleotides and ATP. Subsequent addition of nucleotides only occurs once this degradation process is complete. 5.) The complementary DNA strand is synthesised continually by the sequential addition of dNTPs in which the nucleotide sequence data is determined by the signal peaks visualised in the program output and then annotated appropriately (Novais and Thorstenson, 2011, Qiagen). Abbreviations: ADP, adenosine diphosphate; AMP, adenosine monophosphate; dNDP, deoxyribonucleoside diphosphate; dNMP, deoxyribonucleoside monophosphate.
1
5
4
3
2

9
In particular, culture-based microbial identification to nucleic acid sequencing is now
becoming more commonplace in diagnostic microbiology laboratories. In the past this
approach has been infrequently adopted due to the technical expertise needed to perform
DNA sequencing using Sanger technologies (Petrosino et al., 2009). Developments using
Sanger-sequencing showed that 16S rRNA genes contain 9 hypervariable regions, V1-V9, in
which ~ < 500 bp of the 16S rDNA coding sequence was required in order to generate genus-
and species-level pathogen identification (Kolbert and Persing, 1999, Lane et al., 1985). The
hypervariable V1-V9 regions (50-100 bases in size) situated within the 16S rRNA genes in all
bacteria are interspersed between highly conserved regions (Fig. 1.3); indeed, all 16S rRNA
vary in their nucleotide sequence composition, but the conserved regions remain as they
were, unchanged, conserved invariant through time across nearly all bacterial species due to
their essential functions within the bacterial cell (van de Peer et al., 1996, Jonasson et al.,
2002). This key property coupled with the inherent nature of 16S rRNA in addition to high
information content and universal distribution reveals why 16S rRNA is utilised for
phylogenetic analysis, microbial community profiling, and more recently, metagenomic
studies using NGS technology.
Fig. 1.3: Conserved and hypervariable regions within the 16S rRNA gene. The conserved regions interspersed throughout this gene are indicated in grey (C1-C9), whereas the hypervariable regions (V1-V9) are represented by different colours. Each hypervariable region ranges from ~ 50-100 base pairs in length. The V4 subregion, as an example, shows PCR amplification using primers that target the hypervariable region of interest (pink circles in full length 16S rRNA gene and pink arrows representing primer-binding sites) and the sequencing primer site (blue bottom arrow). Metagenomic sequencing using 454-pyrosequencing technologies utilise multiple hypervariable regions of the 16S rRNA gene to generate greater read lengths and sequence
coverage in microbial identification (Petrosino et al., 2009).

10
The V1-V9 regions themselves have been shown to demonstrate different efficacies in
terms of the species or genus phylotypes resolved within the microbial community analysed
and their respective environments sampled. A study by Chakravorty et al., has shown that the
V2 and V3 regions were the most effective at independent genus identification (Chakravorty
et al., 2007); in particular is the application of the V3 hypervariable region in microbial
community profiling PCR-DGGE mediated studies in which Yu, et al, (2004) showed that
amplification of the V3 region within rrs genes generated better DGGE profiles than the
other hypervariable regions amplified and analysed (Yu and Morrison, 2004).
In summary, culture-independent techniques have been an indispensable aid in describing
the many microbial consortia in the biosphere of planet Earth and in us, human beings. In the
following section we will demonstrate that we are collectively as a species intimately
involved and indeed in contact with a characteristic microbiota incorporating bacteria,
viruses, archaea, protozoans, and fungi (Foxman et al., 2008).
1.5 The bacterial ribosome and 16S rRNA
The constant manufacturing processes involved in protein biosynthesis occur on the
ribosome and these play a key role in a bacterium’s ability to proliferate in the environment,
providing implications for bacterium-host interactions and crucially pathogenicity (Moss et
al., 2007). This massive macro-molecular protein, 21 nm in size is comprised of both the 30S
and 50S subunits which associate together via self-assembly forming the intact 70S bacterial
ribosome (Ramakrishnan, 2002). Several publications of the three-dimensional structure of
the ribosome have revealed the 30S and 50S subunits in great detail (Ban et al., 2000, Cate et
al., 1999, Schluenzen et al., 2000, Schuwirth et al., 2005, Wimberly et al., 2000). Both
subunits contain rRNA; the smaller 30S subunit comprising of 16S rRNA (1542 nt) and 21
ribosomal proteins (termed r-proteins), the larger 50S subunit is composed of two rRNAs,
23S (2904 nt) and 5S (120 nt) rRNA and 33 proteins (Noller and Nomura, 1996).
Within the rrnB operon (Fig. 1.4) downstream from both promoters P1 and P2, the 16S
rRNA is encoded by the rrs genes; these express the formation of the small subunit (SSU)
16S rRNA ubiquitous in all bacterial species (one copy of this gene is always present in the
bacterial genome ― although copy number can vary between bacterial species; e.g., model
organisms such as Bacillus subtilis, Clostridium perfringens, Escherichia coli, and

11
Lactococcus lactis have been previously shown to possess 10 (both in B. subtilis and C.
perfringens) (Garnier et al., 1991, LaFuci et al., 1986), 7 (Kiss et al., 1977), and 6 (Beresford
and Condon, 1991, Tulloch et al., 1991) rrn operons respectively) (Kaczanowska and Rydén-
Aulin, 2007). Assembly of the prokaryotic ribosome is extremely complex and an in depth
discussion of its assembly and multiple functions is beyond the scope of this thesis.
Fig. 1.4: The rrnB operon showing nucleolytic processing of the rrnB primary transcript. Downstream promoters P1 and P2 in the rrnB operon encode the formation of both 16S and 23S rRNA species and their associated ribosomal proteins (r-proteins) (not shown). Both the 5′ and 3′ sites are indicated in addition to the promoter and termination regions (P1, P2, T1, and T2 respectively). Also indicated are the processing sites of RNase III (III), RNase G (G), RNase E (E), RNase P (P), RNase T (T), and unknown RNases (?). These RNases process and chemically modify the pre-mature rRNA species in the positions shown above generating mature 16S and 23S rRNA species (Kaczanowska and Rydén-Aulin, 2007).

12
1.6 The human microbiome
In humans, estimates of the total amount of bacteria that colonise the gastrointestinal tract
(GIT) outnumber our ‘own’ cells by up to 10-fold (Poxton, 2010). Acquisition of many
bacterial taxa present in the gut is due to the early colonisation of these bacteria when the
neonate first passes through the birth canal during labour (Palmer et al., 2007). The gut is not
the only microbial ecosystem located in the human body, the skin, urogenital tract, and
indeed the upper respiratory tract, have significant and complex bacterial communities
(Gonzalez et al., 2011, Turnbaugh et al., 2007). These ubiquitous micro-organisms are an
essential part of human evolution. In particular, mutual bacterial colonisation of the human
mucosal surface interface forms a co-evolutionary relationship which benefits both the
numerous bacterial species which inhabit these regions and the host; e.g., the upper
respiratory tract (URT) and GIT plays host to ~ 600 and 1,000 unique species of bacteria
respectively; identified as either permanent residents, others as transiently colonising these
mucosal sites (Aas et al., 2005, Manson et al., 2008).
The Human Microbiome Project (HMP) of the National Institutes of Health (NIH) was
launched in 2007 in a venture to begin to understand and characterise the human-associated
microbiota and microbiome factors; i.e., collectively, the microbes that inhabit us and the
genes in all of these micro-organisms (Gonzalez et al., 2011). We are only beginning to
appreciate the full impact of the human microbiota in health and disease and the genetic
diversity that encompasses the human microbiome in chronic diseases such as obesity
(Turnbaugh et al., 2009), Crohn’s disease (Eckburg and Relman, 2007) and other metabolic
disorders (Spencer et al., 2011). Indeed micro-organisms are absolutely essential for human
health offering beneficial effects such as the maintenance of pH in the oral and vaginal
cavities, stimulation of the immune system, both innate and cellular, the prevention of
invasion by PPMs, digestion of ingested foods through phase III metabolism processes, and
finally providing nutrients vital to our health (Foxman et al., 2008). Most research is
presently centred around bacterial diversity, whether this is through NGS or molecular
fingerprinting methodologies, of the human microbiota, and several studies on bacterial
diversity have been published on the GIT (Eckburg et al., 2005, Qin et al., 2010, Zoetendal et
al., 1998), skin (Fierer et al., 2008, Gao et al., 2007), female urogenital tract (Brown et al.,
2007, Zhou et al., 2007) URT (Charlson et al., 2010), and lungs (Hilty et al., 2010) of
individuals amongst others. However, the human microbiome is not only comprised of
13
bacteria, other studies looking at both fungal and viral metagenomics (termed mycobiome(s)
and virome(s) respectively) in human hosts have also recently been published looking at both
diseased and non-diseased cohorts (Ghannoum et al., 2010, Reyes et al., 2010, Willner et al.,
2009).
1.7 Microbial ecology
How does one make sense or comprehend this mass of genomic information contained
within the human microbiome? In the GIT alone, it has been hypothesised that the entire gene
complement of the intestinal microbiota was ~ 150 times larger than our own, many of these
genes being uniquely encoded within this microbial assemblage (Qin et al., 2010). One way
to tackle the increasing amounts of data and begin to model the numerous interactions within
this abundance of microbes is to use microbial ecology hypotheses, i.e., looking at the
microbial communities that make up the human microbiome from an ecological perspective.
Using a microbial ecological framework provides microbiologists and the biomedical
community powerful schemes for hypothesis testing of the HMP datum (Dethlefsen et al.,
2007, Robinson et al., 2010). Microbial community ecology arose from macro-ecology, i.e.,
the ecological frameworks used to study both the plant and animal kingdoms defined as
“multi-species assemblages, in which organisms live together in an environment and interact
with each other” (Knoopka, 2009). Using these frameworks enables microbial ecologists to
better elucidate the way in which microbial communities that are part of the human
microbiome contiguously interact within environmental niches inside the human body over
space and time (Gonzalez et al., 2011). In addition, the investigation of the micro-
environment within and its concurrent effects on the distribution and abundance of microbial
species will provide a better understanding of the communities that inhabit us (Gonzalez et
al., 2011). Adapting these theories and applying them to the microbial world has taken time,
but nevertheless two studies in 2006 combined the metagenomic strategies with microbial
ecology modelling for the datum generated; the first investigated the metagenomics of the
microbial community in water from an iron mine in Minnesota (Edwards et al., 2006).
Subsequently, a second study elaborated the metagenomics of rare members of several
microbial communities using massively parallel pyrotag sequencing (Sogin et al., 2006).
With this data, ecological measurements of richness, diversity, and similarity were all used
for data analysis.
14
In essence, microbial diversity within sample types analysed, can be performed using three
measures: alpha, beta, and gamma diversity indices defined by Whittaker in which (i), alpha
diversity quantifies the richness of the species (number of taxa) in a niche; (ii), beta diversity
compares the diversity between environments thus describing how disparate communities are
structured in different niches; and (iii), gamma diversity in which both the alpha and beta
diversity of communities from different landscapes and geographical regions are measured
(Whittaker, 1972, Whittaker, 1969). In the microbial world, the definition of the term species
is pragmatic (Amman et al., 1995). Conceptually speaking the term species encompasses
those individuals as a group interbreeding within a species but isolated from other groups
(i.e., other species) by genetic recombination barriers (Mayr, 1957). However, bacteria and
some eukaryotes are asexual, contradicting this assumption, thus not forming ecologically
distinct species defined genetically (Amman et al., 1995). Nevertheless, bacterial species are
still defined by the use of operational taxonomic units (OTUs), i.e., the binning of coding
nucleotide sequences from 16S rRNA genes to form species-level OTUs at a phylogenetic
distance of 0.03, equivalent to 97 % nucleotide similarity against reference species sequence
databases (Robinson et al., 2010). In addition to species diversity, other factors implicated in
microbial ecology are biological divers of community structure, spatial patterning and
temporal dynamics. All of these factors are hypothesised to affect the human microbiota.
1.8 Microbial biofilms
It has been recognised for some time now that microbes very rarely exist in isolation in
natural, industrial, and medical habitats; microbes, and in particular bacteria, tend to form
aggregated complex three-dimensional structures (Stickler, 1999). These aggregated bacterial
cells are embedded within a hydrated matrix of extracellular polymeric substances (EPS)
termed biofilms (Costerton et al., 1999, Donlan and Costerton, 2002). A polymicrobial
biofilm therefore can be further defined as an eclectic assortment of fungi, bacteria, and
viruses, attached to biotic and abiotic sites within the human host (Peters et al., 2012). Studies
conducted on polymicrobial biofilm communities within the oral cavity enabled an initial
understanding of the properties of biofilms.
Using bacteria as an example, the formation of biofilms is a result of an ancient adaptation
(Hall-Stoodley et al., 2004) that prokaryotes utilise as a mode of growth in hostile
environments, enabling the colonisation of new niches via dispersal mechanisms (Hall-
15
Stoodley and Stoodley, 2005, Mai-Prochnow et al., 2008, Purvedorj-Gage et al., 2005).
Polymicrobial biofilm formation is through sequential attachment mechanisms termed co-
aggregation, in which one species of microbe attaches itself to an appropriate substrate and
then subsequently becomes a scaffold for other micro-organisms to facilitate adherence and
biofilm formation (Rickard et al., 2003). Microbial biofilms are important both in healthy and
diseased individuals due to several characteristics such as (i), phenotypic heterogeneity (ii),
cell-cell communication via quorum sensing (QS), (iii), recalcitrance against antimicrobial
compounds and (iv), resistance to both host phagocytic defences and antibodies (Hall-
Stoodley and Stoodley, 2009). All of these properties enable biofilm infections to persist in
the host despite administration of antimicrobial therapies and sustained host innate and
cellular immune responses. Microbial biofilms are also beneficial to the host; specifically
speaking, the abundance of conserved bacterial genera in the oral cavity has been previously
shown using implanted sterile enamel chips into the mouths of human volunteers
demonstrating the early colonization (~ 4 h) of Streptococcus spp. in addition to other genera
such as Actinomyces, Gemella, Granulicatella, Neisseria, Prevotella, Rothia, and Veillonella
(Diaz et al., 2006). Changes in this conservation of specific bacterial genera, whether over a
rapid or slower time, has been hypothesised to promote disease-associated phenotypes within
the human host; one example of this is the administration of broad-spectrum antibiotics
which can severely affect the global bacterial populations within the community in the gut,
i.e., reducing the protective properties of the polymicrobial commensals, thus allowing the
proliferation of more invasive and resistant bacterial species in the site affected (Dethlefsen et
al., 2008).
16
1.9 Polymicrobial infections
Just as polymicrobial biofilms are comprised not only of bacteria, but also viruses and
fungi, polymicrobial infections can be defined as acute and chronic diseases caused by
various combinations of viruses, bacteria, fungi, and also parasites (either protozoan or
metazoan in origin) (Brogden et al., 2005). Further to this definition, polymicrobial infections
are hypothesised to play a significant role within the human host and can manifest themselves
via three distinct processes, although these processes could be all in unison (Brogden et al.,
2005):
1. The generation of an environmental niche inside the human host due to the
presence of one microbial species facilitates the colonisation of this niche by
other PPMs.
2. When one species of microbe is present, this predisposes the host to subsequent
colonisation by other micro-organisms.
3. Two or more non-pathogenic microbes are present and cause disease through
synergistic effects in the host.
Some of the above concepts have been touched on recently, especially in relation to the
theoretical concepts presented in microbial ecology, a key point here is that in polymicrobial
infections, microbe-microbe interactions such as microbial interference can actually suppress
the proliferation of other micro-organisms in the environmental niche generated, this
interference can occur between PPMs or between probiotic microbes and pathogens (Bogaert
et al., 2004). Synergistically, an environmental niche is generated by one microbe, as in
periodontal disease, and this leads to subsequent colonisation by other PPMs (Palmer et al.,
2001). Bacterial-viral synergism also plays a strong role in polymicrobial infections, for
example, the isolation of human metapneumovirus (HPMV) in a range of debilitating
respiratory tract conditions in conjunction with other viruses such as severe acute respiratory
syndrome, with coronavirus, and bronchiolitis with respiratory syncytial virus (RSV) (Chan
et al., 2003, Greensill et al., 2003). Infection with the measles virus also greatly pre-disposes
the host to secondary infections with bacterial agents (Slifka et al., 2003); these secondary
bacterial and viral infections can be attributed to the primary viral infection exhibiting and
inducing an immunosuppressive effect within the host thus leading to, but not always, severe
detrimental results. Additionally, infection with respiratory tract viruses can greatly pre-

17
dispose the host to colonisation or subsequent infection with a secondary micro-organism via
destruction of the epithelial lining of the respiratory tract thus increasing bacterial adhesion
and up-regulation of bacterial cell-surface receptors with the immunosuppressive properties
of the viral infection which can lead to bacterial super-infections (Peltola and McCullers,
2004).
What is the basis for polymicrobial interactions in the human host and their origin? In all
humans there is a co-evolutionary relationship between the host and their microbiome, this
co-evolution has developed over time for thousands of years and has consequently resulted in
species-specific physical and chemical interactions between microbes; these microbe-microbe
interactions are employed due to the large variety and concentration of micro-organisms
present and relatively minute amount of physical space available within us (Peters et al.,
2012). Microbe-microbe interactions can be expressed variously within the host such as
immunomodulation, augmented virulence phenotypes in trans, colonisation enhancement
factors, cell-cell communication via QS, and contact-dependent attachment (Peleg et al.,
2010).
Indeed, polymicrobial infections within human hosts are being increasingly recognised
both in nosocomial and community settings as these several conditions imply: (i), human
deficiency virus-acquired immunodeficiency syndrome (HIV-AIDS) patients in Africa are
co-infected with malarial protozoan parasites and/or with Mycobacterium tuberculosis in
addition to other micro-organisms (Lawn, 2004), (ii), bacterial vaginosis infection in women
involves the increase in the mixed bacterial populations of Gardnerella vaginalis, Gram-
positive anaerobic cocci and Gram-negative anaerobic rods such as Peptostreptococcus spp.
and Prevotella spp. respectively, in addition to Mycoplasma hominis and Ureaplasma
urealyticum as the Lactobacillus sub-populations rapidly decline (Hill, 1993, Persson et al.,
2009, Pybus and Onderdonk, 1999), (iii), dental caries in the oral cavity is an extremely
common condition affecting most of the adult population and younger children in which the
hard enamel, dentin, and cementum surface surrounding the soft dental pulp is broken down
(Holst, 2005). Breakdown of the hard dental surface is first by the creation of a polymicrobial
biofilm ― i.e., dental plaque ― and secondly, the fermentation of carbohydrate sugars such
as sucrose and fructose into lactic acid by several species of bacteria such as Actinomyces
viscosus, Lactobacillus acidophilus, Nocardia spp., Streptococcus mutans, and the yeast

18
Candida albicans (Kinke et al., 2009, Minah and Loesche, 1977), (iv), chronic lower
respiratory tract (LRT) infections in cystic fibrosis (CF) and chronic obstructive pulmonary
disease (COPD) individuals are now thought to be polymicrobial in nature due to extensive
studies, especially in CF where culture-independent techniques were employed (Erb-
Downward et al., 2011, Harris et al., 2007, Hilty et al., 2010, Rogers et al., 2005a, Rogers et
al., 2004, Rogers et al., 2003, Sethi et al., 2009, Sethi and Murphy, 2008, Sibley et al., 2006,
Veeramachaneni and Sethi, 2006).
1.10 The respiratory tract
The respiratory system in humans is categorised into two separate components, the upper
and lower respiratory tract, both operate in unison for the effective and efficient distribution
of air, from the external environment into the internal environment of the lungs. The URT
serves to warm and moisten the air when inspiration occurs protecting the LRT from PPMs
and other foreign particles such as allergens, but also enabling for effective gaseous
exchange. The LRT is responsible for the gaseous exchange of diatomic oxygen (O2) in the
alveoli to the peripheral blood capillaries that line the connecting tissues. Here O2 diffuses
across the membrane and enters erythrocytes, initially binding to haemoglobin in the process,
that are circulating in the blood capillaries before releasing O2 to the tissues and cells around
and within the body where required. In humans, the process of respiratory function is an
essential physiological process; it is the gaseous exchange of diatomic oxygen and carbon
dioxide between blood and the external atmosphere (Bourke, 2002, Marieb and Hoehn,
2007).
The lung is the major interface between the internal and external environment of the
human host, inspired air is abundant with opportunistic and pathogenic bacteria, viral and
fungal micro-organisms (Bourke, 2002). Despite this constant exposure to potentially harmful
particles, the health of an individual is maintained by sophisticated and complex host defence
mechanisms (Stockley, 1998, Wilson et al., 1996). Defences such as the mucocilliary
escalator which inhibits adherence and facilitates particle removal are dependent on bronchial
epithelium integrity (Stockley, 1998). In addition, are antimicrobial agents such as lysozyme
and lactoferrin that inhibit bacterial replication, secretory immunoglobulin A (IgA), and
scavenging macrophages (Stockley, 1998).

19
1.10.1 Chronic respiratory tract diseases
Chronic respiratory tract diseases are of major global importance; they are increasing in
incidence worldwide and are now classified by the World Health Organisation (WHO) as
non-communicable diseases (NCDs) in addition to cardiovascular disease, cancer, and
diabetes, collectively they account for the highest rates of mortality on a global scale than all
other causes combined (Reardon, 2011). Chronic respiratory diseases encompass conditions
such as CF, COPD, non-cystic fibrosis bronchiectasis, and asthma amongst others. Asthma
and COPD present problems worldwide, both in terms of morbidity and mortality, but also in
economic costs on healthcare resources. Asthma is a chronic inflammatory airway disease in
which individuals suffer from exacerbations which result in chest tightness, wheezing, cough
and dyspnoea, all symptoms associated with airway obstruction (Jarjour and Kelly, 2002). In
the Western world, asthma is the most common chronic respiratory disease affecting 10 % of
adults and 30 % of children, in the U.S. alone, 1.75 million asthma-related emergency
department visits and 456 000 asthma-related hospitalisations were recorded contributing
towards one-third of the total $14.7 billion annual U.S. asthma-related health care
expenditure (Akinbami et al., 2011, American Lung Association). Chronic obstructive
pulmonary disease is primarily induced by cigarette smoking and is characterised by
irreversible airflow limitation and chronic inflammation in the LRT (Pauwels et al., 2001).
COPD is an increasingly leading cause of morbidity and mortality globally, but woefully
under-recognised (Pauwels and Rabe, 2004); from 1990 to 2020, the 30 year projection of
COPD ranking will be a rise from sixth to third most common cause of mortality and fifth in
the cause of disability worldwide (Lopez and Murray, 1998). Economically, in the U.K.,
£500 million is spent annually through direct healthcare costs relating to COPD in addition to
24 million working days also wasted (British Lung Foundation, 2006).
Cystic fibrosis is the most common recessive autosomal genetic disorder affecting
individuals of Caucasian descent, ~ 1:2,500 children are afflicted with the condition from
birth and ~ 70,000 adults and children are thought to be affected with CF worldwide (Cystic
Fibrosis Foundation, World Health Organization, 2002) Genetically, CF is caused by a
mutation in the cystic fibrosis transmembrane conductance regulator (CFTR) gene located on
the long arm of chromosome 7, encoding for a membrane-bound cyclic-adenosine
monophosphate (cAMP)-regulated chloride channel (Kerem et al., 1989, Riordan et al., 1989,
Rommens et al., 1989). Mutations of the CFTR gene vary tremendously, and > 1,500

20
mutations and sequence variants have been identified presently and deposited into the Cystic
Fibrosis Genetic Analysis Consortium. Although many of these mutations are rare, only four
occur at > 1 % frequency, in particular, the most frequent mutation F508del exists in the
region of DNA within the CFTR gene that encodes for one of two nucleotide-binding
domains (NBDs), i.e., NBD1 (Döring and Ratjen, 2005). The mutation in NBD1 results in
abnormal transport of chloride and sodium ions affecting water transport across mucus-rich
epithelial tissues inducing systemic pathophysiological effects in CF individuals where the
CFTR gene is expressed in various organs such as the respiratory, gastrointestinal, and
reproductive tracts, the pancreas, and liver (Tizzano and Buchwald, 1995). Physiological
dysfunction in the respiratory tract is the leading cause of morbidity in CF individuals as ~ 90
% die of respiratory failure due to this CFTR defect consequently leading to several
cascading factors; dehydration of the airway mucous, reduced mucocilliary clearance,
mucous retention, and predisposition of the CF patient to recurrent chronic lung infections
(Boucher, 2002, George et al., 2009).
One of the main defining clinical features in CF and COPD is bronchiectasis; an abnormal
dilatation of the bronchi and bronchioles due to repeated cycles of respiratory tract infection
and subsequent inflammation (Barker, 2002, O'Donnell, 2008). Bronchiectasis is a highly
debilitating disease which can cause premature mortality and chronic morbidity in some
instances due to severe pulmonary infections and lung function impairment (Alzeer et al.,
2007, King et al., 2005). The paradigm relating to chronic infection in bronchiectasis is a
vicious circle of continual transmural infection and inflammation followed by mediator
release, the retention of inflammatory secretions and micro-organisms in the LRT cause
further lung tissue damage thus accelerating pulmonary obstruction and recurrent chest
infection (Cole, 1986). Patients with CF present with a very severe form of bronchiectasis,
but increasingly, other individuals are now being diagnosed with an idiopathic variant of this
disease, termed non-CF bronchiectasis (nCFBR). The term idiopathic arises from the initial
diagnosis of nCFBR in many patients in which the aetiology of the disease is unknown. The
increasing frequency in the diagnosis of nCFBR is due to the widespread use of high-
resolution chest computed tomography (HRCT) scanning (Cohen and Sahn, 1999), although
the prevalence of nCFBR globally is unknown (O'Donnell, 2008). However, a recent study
conducted in the U.S. alone revealed that 110,000 individuals may be receiving treatment for

21
nCFBR with an annual cost to the U.S. healthcare system of $630 million respectively
(Weycker et al., 2005).
Most, if not all, individuals who are afflicted with asthma, COPD, CF, and nCFBR suffer
from punctuated episodes of exacerbations, i.e., a worsening of symptoms which induce
airway obstruction in these patients clinically presented as dyspnoea, cough, chest pain, and
wheeze. Exacerbations can be triggered by several factors, including a secondary infection of
both the URT and LRT of several aetiologies, but they also vary in their severity and
frequency in the chronic respiratory disease briefly described above. In summary, chronic
respiratory tract diseases play a significant role in the morbidity, mortality, and economies
not only in the Western world, but increasingly in the developing world.
Cough, breathlessness, wheeze, chest pain, and sputum production, all major symptoms of
respiratory disease may be indicative of acute or chronic respiratory tract infection (Leach,
2007). As the respiratory tract is a continuous entity, via the nose to the alveoli, respiratory
tract infections (RTI) are distinguished by diagnoses of the ‘preferred focus’ of the infectious
agent, either in the URT or LRT, although there can be at times ambiguity concerning this
issue; for instance, the parainfluenza virus can infect the nasopharynx, larynx, trachea, and
occasionally the bronchi and bronchioles resulting in the common cold, laryngotracheitis
(croup), bronchitis, bronchiolitis, or pneumonia respectively (Goering et al., 2008). The
aetiology of respiratory tract infection may be bacterial, viral or fungal in origin. Some
patients may already present with an underlying lung disease such as nCFBR, CF, and
COPD, of which infection in the upper and lower respiratory tract is a secondary disease, but
nevertheless a critical contributing factor to the morbidity and mortality of the individual in
question. For the purposes of the investigative work contained herein, the author will focus
primarily on lower respiratory tract infections in non-CF bronchiectasis and COPD.
1.10.2 Respiratory tract defence mechanisms
Approximately 14,000 L of air is processed on a daily basis by the human lungs, of which
contact between the external and internal environments is in constant flux, the integrity of the
thin alveolar membrane must be maintained at all times to ensure efficient O2 and CO2
gaseous exchange within the host; thus the recognition, and conduct, of particulate matter
without resulting in excessive inflammation is critically important (Valdivia-Arenas et al.,
2007). The fragile alveolar epithelial layer itself is protected by non-specific factors such as

22
the cough reflex mechanism, ciliary beat, and mucocilliary escalator, in addition to several
complex host innate defences comprising of both pulmonary cellular and humoral elements.
Pulmonary innate cellular components are mediated by the airway and alveolar epithelial
cells, but also leukocytes, both resident and recruited, including natural killer cells (NKCs),
dendritic cells (DCs), cytotoxic T cells, macrophages, and neutrophils; antimicrobial products
secreted into the epithelial lining fluid such as collectins, defensins, lysozyme, lactoferrin,
secretory IgA, and cathelicidins are all constituents of the pulmonary humoral innate system
(Zass and Schwartz, 2005). All of the above factors mitigate a collective role in the innate
immune system including initial defence mechanisms against micro-organisms and clearance,
but also crucially, subsequent activation of the adaptive immune system (Medzhitov and
Janeway, 1997).
Recognition of PPMs in the respiratory tract is achieved by cell-surface conserved
signature pathogen-associated molecular patterns (PAMPs) which are then mediated in turn
by pattern-recognition receptors (PRRs) lining the airway epithelium, present in secretory
components of the innate immune system and the cell-surface of leukocytes. Patter-
recognition receptors are able to facilitate recognition of micro-organisms because of several
common characteristics in that PAMPs are highly conserved and therefore critical to micro-
organism subsistence, PPRs themselves are expressed constitutively within the host thus
enabling detection of pathogens irrespective of life-cycle stage (Akira et al., 2006). The goal
in the recognition of PPMs via PAMP-PPR mediation in the respiratory tract is two-fold; (i),
to allow effective and efficient recognition of said PPMs by macrophages consequently
leading to phagocytosis and induction of inflammatory mediators (Bals and Hiemstra, 2004),
and (ii), to allow for discrimination between non-pathogenic and pathogenic elements that
may come into contact with the airway epithelium in which the high specificity of PAMP-
PPR interactions confer for these actions (Zass and Schwartz, 2005).
Toll-like receptors (TLRs) are an evolutionary conserved group of type I integral
membrane glycoproteins characterised by their extracellular leucine-rich-repeat (LRR) motifs
and COOH-terminal cytoplasmic signalling domains homologous to the interleukin 1 (IL-1)
receptor in which the primary function of TLR molecules is that of PRRs (Baus and Fenton,
2004, Bowie and O'Neil, 2000). Twelve mammalian TLRs to date have been identified in
mammalian hosts, TLR-2 and TLR-4 are the most extensively studied of the TLR families,
23
but all recognise related PAMPs from viral, bacterial, and fungal origins via highly specific
binding to microbial ligands mediated by the variable LRR domain and intracellular
signalling carried out by the conserved COOH-terminal intracellular tail (Armstrong et al.,
2004). For example, TLR-2 and TLR-4 have all been shown to primarily bind to lipoteichoic
acid (LTA) and lipopolysaccharide (LPS), both constitutive components of bacterial Gram-
positive and Gram-negative cell wall composition respectively (Akira et al., 2006, Bals and
Hiemstra, 2004, Zass and Schwartz, 2005); in addition, TLR2 has also been shown to bind to
mycobacterial lipoarabinomannan, suggesting a defensive role in Mycobacterium
tuberculosis infection and other atypical mycobacterial agents (Drennan et al., 2004, Reiling
et al., 2002, Weiland et al., 2004). Molecular display of TLRs is not only limited to the
respiratory tract epithelial cells and leukocytes but also DCs, B cells, and T cell subtypes,
including extracellular (e.g., TLR-2 and TRL-4 bind to bacterial cell wall components LTA
and LPS as previously discussed) and intracellular expression (e.g., TLRs 3 and 9 utilise viral
nucleic acid double-stranded RNA (dsRNA) and DNA as receptors respectively
(Alexopoulou et al., 2001, Hochrein et al., 2004, Tabeta et al., 2004)) modes (Akira et al.,
2006). Constant modulation of TLR expression is an essential governing factor of the innate
immune response if the host is effectively able to counter-attack insults by PPMs and respond
to environmental stresses such as allergens thus inducing an inflammatory cascade and the
release of components that comprise the adaptive immune response such as cytokines and
chemokines (Zass and Schwartz, 2005). Indeed, as has been previously elucidated, an
inflammatory cascade in the LRT in response to tissue architecture insults can in fact be
occasionally detrimental to the host as seen in asthma, COPD, nCFBR, and CF respiratory
conditions in which the innate immune response plays a pivotal role in the governance of
these disease phenotypes.

24
1.11 Aims and objectives of research undertaken
The primary goal of the investigative work undertaken was to characterise the microbial
communities in two chronic obstructive respiratory disease patient cohorts whilst also
inferring the optimum DNA polymerase enzyme to perform the culture-independent analysis
using an environmental matrix (sandy soil). Determination of a suitable DNA polymerase
will aid in the subsequent investigation and characterisation of the polymicrobial
communities of the lung microbiome. Using PCR-DGGE technique analysis both in cross-
sectional patient cohorts presenting with nCFBR and COPD we aim to examine the effects of
bacterial and fungal communities in the LRT and their relation to intrinsic and extrinsic
factors such as pulmonary function, patient gender, height, and antimicrobial therapy, etc.
25
Chapter Two: Materials & methods
2.1 DNA polymerase enzymes and microbial diversity
2.1.1 Sandy soil sampling strategy
Soil samples were taken from dunes located on Longsands Beach, Tynemouth, North East
England (55⁰ 1’ 8.66’’ N, 1⁰ 25’ 36.23’’ W) in October 2008. The sand dunes themselves had
typical plant cover for the area, consisting mainly of Marram grass (Ammophila spp.). Five
plots (1.5 m x 0.5 m) were created 1 m (± 0.25 m) up the dune. Within each of the five plots
sandy soil was taken from five randomly placed sub plots at a depth of 20 cm. The sandy soil
was then combined to create one sample per plot before being stored at -80 °C.
2.1.2 DNA extraction from sandy soil
Microbial genomic deoxyribonucleic acid (gDNA) extraction from sandy soil was
performed using a MO BIO PowerSoil™ DNA Isolation Kit. To the PowerBead Tubes
provided in the kit, 0.25 g of soil was added before being gently vortexed. Sixty µL of
Solution C1 was then pipetted and mixed in the PowerBead tubes by inversion following
addition of the lysis buffer. PowerBead Tubes were then vortexed (Vortex-Genie2™) at
maximum speed for 10 min; these were secured horizontally to the vortexer using the MO
BIO Vortex Adaptor tube holder. Following this, the PowerBead tubes were then centrifuged
at room temperature for 1 min at 10 000 g in which the supernatant was then transferred to
a clean sterile 2 mL microfuge tube. Two hundred and fifty µL of Solution C2 was then
added to the supernatant. This supernatant was then vortexed for 5 s and incubated for 5 min
at 4 °C before being centrifuged at 10 000 g at room temperature for 1 min to form a cell
pellet. Avoiding the cell pellet, 600 µL of supernatant was transferred to a clean, sterile 2 mL
collection tube in which 200 µL of Solution C3 was added and then vortexed briefly. An
incubation time at 4 °C for 5 min followed before the collection tubes were centrifuged at 10
000 g at room temperature for 1 min.
Again, transfer of the supernatant (up to 750 µL in volume) to a clean 2 mL collection
tube was performed before the addition of 1.2 mL Solution C4 to the transferred supernatant
26
(ensuring at the same time that the Solution C4 supernatant mix did not exceed the rim of the
2 mL collection tube). Approximately 650 µL was then loaded onto a Spin Filter and
centrifuged at 10 000 g for 1 min at room temperature after which any flow through liquid
was discarded. This Spin Filter process was repeated twice more (i.e., a total of three loads
was required to pass through the Spin Filter). Five hundred µL of Solution C5 (ethanol wash
solution) was added before centrifugation at 10 000 g for 1 min at room temperature in
which the flow through liquid was discarded from the 2 mL collection tube. Centrifugation at
10 000 g was carried out again for 1 min at room temperature for effective removal of any
residual ethanol wash solution (these trace amounts can interfere with many downstream
DNA applications). After removal of Solution C5, the Spin Filter was placed into a clean
sterile 2 mL collection tube and 100 µL of Solution C6, an elution buffer (10 mM Tris), was
added to the centre of the white filter membrane releasing the previously bound gDNA from
the silica Spin Filter membrane. The final step was to centrifuge the 2 mL collection tube at
10 000 g for 1 min at room temperature after which the released gDNA (50 µL in volume)
was collected. The Spin Filter was discarded and the extracted gDNA was stored at -80 °C.
2.1.3 Bacterial community detection PCR
Bacterial community detection by polymerase chain reaction (PCR) in all five soil samples
was performed by amplification of the V3 hypervariable region within the bacterial 16S
rRNA gene using extracted gDNA as template. Primers V3F-GC (5′-CGC CCG CCG CGC
GCG GCG GGC GGG GCG GGG GCA CGG GGG GCC TAC GGG AGG CAG CAG-3′)
and V3R (5′- ATT ACC GCG GCT GCT GG-3′) were used producing amplicons of 16S
rDNA regions of different bacterial species in the soil community as previously shown
(Muyzer et al., 1993). Amplification of the 16S rDNA V3 regions corresponded to positions
341 to 534 in Escherichia coli. Forward primer V3F-GC has an additional 40-bp GC-rich
nucleotide sequence (GC-clamp) attached to its 5′ end allowing for higher sensitivity in
detection of bacterial genomic DNA sequence variation in denaturing gradient gel
electrophoresis (DGGE) processing and greater PCR fragment stability (Sheffield et al.,
1989). Addition of bovine serum albumin (BSA) was also introduced into the PCR as this has
been previously shown to relieve inhibitory substances such as humic acids which are present
in soil and other environmental samples (Kreader, 1996).

27
Positive and negative controls were set up in all PCR experiments. Positive control
bacterial gDNA was extracted from a pure culture of Haemophilus influenzae (NCTC
(National Collection of Typed Cultures) no. 11931 (generously donated by Prof. J.D. Perry,
Freeman Hospital, Microbiology Department, Newcastle upon Tyne, U.K.)) for confirmation
of V3 region amplicons. A negative control set up was for the determination of any
environmental contaminants that may be present during PCR. Five different DNA
polymerases (pols) were implemented for enzymatic amplification of the V3 hypervariable
region: Platinum® Pfx (Invitrogen™
), TaKaRa Ex Taq™ Hot Start (TAKARA BIO INC.),
AmpliTaq® (Applied Biosystems™), GoTaq® Hot Start (Promega), and Taq (New England
BioLabs®, Inc.) respectively. All DNA polymerases used generated technical replicates for
each sandy soil sample, 3 50 µL vials of amplicons per pol, eventually yielding 15 batches
of amplicons altogether for each sandy soil sample analysed by DGGE. Common to the entire
repertoire of Taq DNA pols executed here was a touchdown protocol (commonly referred to
as touchdown PCR), and a manual and automatic hot start (HS). Touchdown PCR reduces the
formation of spurious by-products, created in the amplification process, by increasing the
expected initial annealing temperature by 10 °C (Don et al., 1991); i.e., 65 °C as opposed to
55 °C in this instance and then reducing the annealing temperature by 0.5 °C per cycle in
PCR. Automatic HS DNA pols such as Ex Taq™ HS employ an antibody bound enzyme in
which the activation temperature (e.g., 97 °C) results in release of the previously bound pol
inhibiting not only spurious PCR product formation before initiation, but also minimising
non-specific annealing primers to non-target DNA regions. Manual HS protocols execute a
pol not bound to an antibody, but instead involve manually pipetting the pol at a specific
volume and temperature (i.e., 80 °C) into the incubated sample once initial DNA template
denaturation has been completed (i.e., 97 °C for 5 min). Introduction of DNA pols as a
manual HS into PCR mirrors the purposes of automatic HS DNA pols. In summary, all of the
above enzymes required different PCR conditions for satisfactory amplification of the V3
rDNA PCR fragments. These conditions were programmed into a thermocycler (Eppendorf
Mastercycler gradient) according to the manufacturer’s recommendations for each DNA pol
used in PCR. These conditions are described below.

28
2.1.3.1 V3 rDNA amplification using AmpliTaq™ DNA polymerase
The PCR performed using AmpliTaq® (Applied Biosystems™) pol involved the use of a
manual HS and a touchdown protocol on a Mastercycler gradient (Eppendorf). PCR reagents
per reaction were added as follows: 0.5 µM primers (both forward (V3F-GC) and reverse
(V3R)), 1 GeneAmp® Buffer (Applied Biosystems™), 0.3 mM each dNTP (New England
BioLabs®, Inc.), 2 mM MgCl2 (SIGMA® Life Science), 10 µg/µL BSA (Promega), 1.25 U
AmpliTaq® and 2 µL of DNA template made up to 50 µL with sterile 18.2 Ω H20
(MILLIPORE, Direct-Q™ Ultra Pure Water Systems, MILLIPAK® 0.22 µm filter). Samples
were incubated for 5 min at 97 °C executing an initial denaturation step of template DNA
before holding at 80 °C indefinitely to allow a manual HS via introduction of AmpliTaq® pol
into the sample; then 96 °C for 1 min, 65 °C for 1 min, with a reduction of 0.5 °C per cycle
until touchdown at 55 °C. Primer extension lasted for 30 s at 72 °C and this was repeated for
20 cycles. An additional fifteen cycles was carried out at 94 °C for 1 min, 55 °C for 1 min, 72
°C for 3 min and a final extension time of 72 °C for 30 min. This extended final DNA
elongation step was implemented to reduce the formation of artifactual double bands which
can be problematic in microbial community profiling techniques such as DGGE (Janse et al.,
2004).
2.1.3.2 V3 rDNA amplification using Ex Taq™ Hot Start DNA polymerase
Unlike the above conditions, PCR fragments amplified using Ex Taq™ HS (TAKARA
BIO INC.) pol utilised an automatic HS and a touchdown protocol on a Mastercycler
gradient (Eppendorf). PCR reagents per reaction were added as follows: 0.5 µM primers
(both forward (V3F-GC) and reverse (V3R)), 1 Ex Taq Buffer (TAKARA BIO INC.), 0.2
mM each dNTP (TAKARA BIO INC.), 1 mM MgCl2, 10 µg/µL BSA (Promega), 1.25 U Ex
Taq™ HS and 2 µL of DNA template made up to a total volume of 50 µL with sterile 18.2
MΩ H2O (MILLIPORE, Direct-Q™ Ultra Pure Water Systems, MILLIPAK® 0.22 µm
filter). Samples were incubated for 5 min at 97 °C releasing antibody bound polymerase Ex
Taq™ HS, then at 96 °C for 1 min, 65 °C for 1 min, with a reduction of 0.5 °C per cycle until
touchdown at 55 °C. Primer extension lasted for 30 s at 72 °C and this was repeated for 20
cycles. An additional fifteen cycles was carried out at 94 °C for 1 min, 55 °C for 1 min, 72 °C
for 3 min and a final extension time of 72 °C for 30 min.

29
2.1.3.3 V3 rDNA amplification using GoTaq® Hot Start DNA polymerase
Amplification of V3 rDNA using GoTaq® HS (Promega) pol was carried out with both an
automatic HS and touchdown conditions on an Eppendorf Mastercycler gradient. PCR
reagents per reaction were added as follows: 0.5 µM primers (both forward (V3F-GC) and
reverse (V3R)), 2 Colorless GoTaq® Buffer (Promega), 0.3 mM each dNTP (New England
BioLabs®, Inc.), 1 mM MgCl2 (Promega), 10 µg/µL BSA (Promega), 1.25 U GoTaq® HS
and 2 µL of DNA template made up to 50 µL with sterile 18.2 Ω H20 (MILLIPORE, Direct-
Q™ Ultra Pure Water Systems, MILLIPAK® 0.22 µm filter). Samples were incubated for 5
min at 97 °C, releasing antibody bound polymerase GoTaq® HS, then at 96 °C for 1 min, 65
°C for 1 min, with a reduction of 0.5 °C per cycle until touchdown at 55 °C. Primer extension
lasted for 30 s at 72 °C and this was repeated for 20 cycles. An additional fifteen cycles was
carried out at 94 °C for 1 min, 55 °C for 1 min, 72 °C for 3 min and a final extension time of
72 °C for 30 min.
2.1.3.4 V3 rDNA amplification using Platinum® Pfx DNA polymerase
Platinum® Pfx (Invitrogen™) pol conditions differed from the Taq DNA pol enzymes
employed here as no touchdown PCR was carried out. However, an automatic HS was still
performed. PCR reagents were added as follows: 0.5 µM primers (both forward (V3F-GC)
and reverse (V3R)), 2 Pfx Amplification Buffer (Invitrogen™), 0.5 Pfx Enhancer Solution
(Invitrogen™), 0.3 mM each dNTP (New England BioLabs®, Inc.), 1 mM MgSO4
(Invitrogen™), 10 µg/µL BSA (Promega), 1.25 U Platinum® Pfx and 2 µL of DNA template
made up to 50 µL with sterile 18.2 Ω H20 (MILLIPORE, Direct-Q™ Ultra Pure Water
Systems, MILLIPAK® 0.22 µm filter). Samples were incubated at 94 °C for 4 min
initialising DNA template denaturation and release of bound Platinum® Pfx pol. Following
this, 35 cycles at 97 °C for 30 s, 65 °C for 30 s, and 68 °C for 30 s were performed with a
final elongation step at 68 °C for 30 min.
2.1.3.5 V3 rDNA amplification using Taq DNA polymerase
New England BioLabs® Inc., Taq pol amplification of V3 rDNA amplicons was executed
on a Mastercycler gradient (Eppendorf) using a manual HS and touchdown PCR. PCR
reagents per reaction were added as follows: 0.5 µM primers (both forward (V3F-GC) and
reverse (V3R)), 1 Standard Taq Reaction Buffer (New England BioLabs® Inc.), 0.3 mM
each dNTP (New England BioLabs®, Inc.), 2 mM MgCl2 (SIGMA® Life Science), BSA
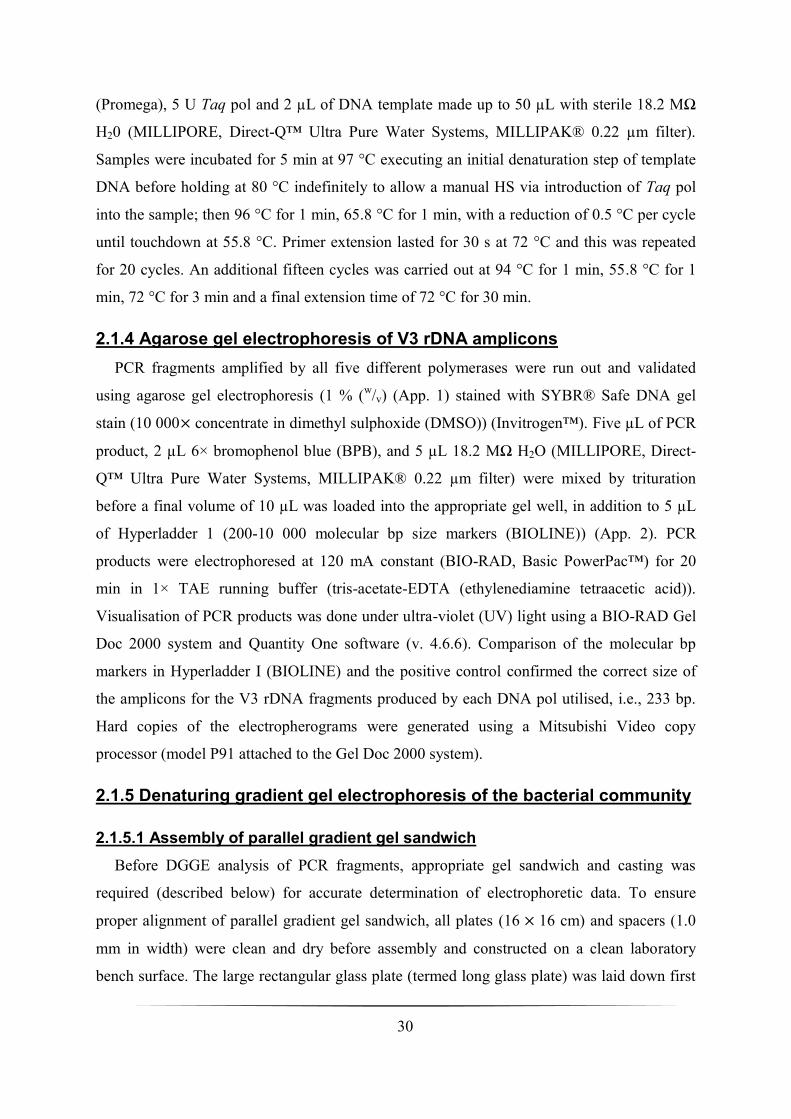
30
(Promega), 5 U Taq pol and 2 µL of DNA template made up to 50 µL with sterile 18.2 MΩ
H20 (MILLIPORE, Direct-Q™ Ultra Pure Water Systems, MILLIPAK® 0.22 µm filter).
Samples were incubated for 5 min at 97 °C executing an initial denaturation step of template
DNA before holding at 80 °C indefinitely to allow a manual HS via introduction of Taq pol
into the sample; then 96 °C for 1 min, 65.8 °C for 1 min, with a reduction of 0.5 °C per cycle
until touchdown at 55.8 °C. Primer extension lasted for 30 s at 72 °C and this was repeated
for 20 cycles. An additional fifteen cycles was carried out at 94 °C for 1 min, 55.8 °C for 1
min, 72 °C for 3 min and a final extension time of 72 °C for 30 min.
2.1.4 Agarose gel electrophoresis of V3 rDNA amplicons
PCR fragments amplified by all five different polymerases were run out and validated
using agarose gel electrophoresis (1 % (w/v) (App. 1) stained with SYBR® Safe DNA gel
stain (10 000 concentrate in dimethyl sulphoxide (DMSO)) (Invitrogen™). Five µL of PCR
product, 2 µL 6× bromophenol blue (BPB), and 5 µL 18.2 MΩ H2O (MILLIPORE, Direct-
Q™ Ultra Pure Water Systems, MILLIPAK® 0.22 µm filter) were mixed by trituration
before a final volume of 10 µL was loaded into the appropriate gel well, in addition to 5 µL
of Hyperladder 1 (200-10 000 molecular bp size markers (BIOLINE)) (App. 2). PCR
products were electrophoresed at 120 mA constant (BIO-RAD, Basic PowerPac™) for 20
min in 1× TAE running buffer (tris-acetate-EDTA (ethylenediamine tetraacetic acid)).
Visualisation of PCR products was done under ultra-violet (UV) light using a BIO-RAD Gel
Doc 2000 system and Quantity One software (v. 4.6.6). Comparison of the molecular bp
markers in Hyperladder I (BIOLINE) and the positive control confirmed the correct size of
the amplicons for the V3 rDNA fragments produced by each DNA pol utilised, i.e., 233 bp.
Hard copies of the electropherograms were generated using a Mitsubishi Video copy
processor (model P91 attached to the Gel Doc 2000 system).
2.1.5 Denaturing gradient gel electrophoresis of the bacterial community
2.1.5.1 Assembly of parallel gradient gel sandwich
Before DGGE analysis of PCR fragments, appropriate gel sandwich and casting was
required (described below) for accurate determination of electrophoretic data. To ensure
proper alignment of parallel gradient gel sandwich, all plates (16 16 cm) and spacers (1.0
mm in width) were clean and dry before assembly and constructed on a clean laboratory
bench surface. The large rectangular glass plate (termed long glass plate) was laid down first
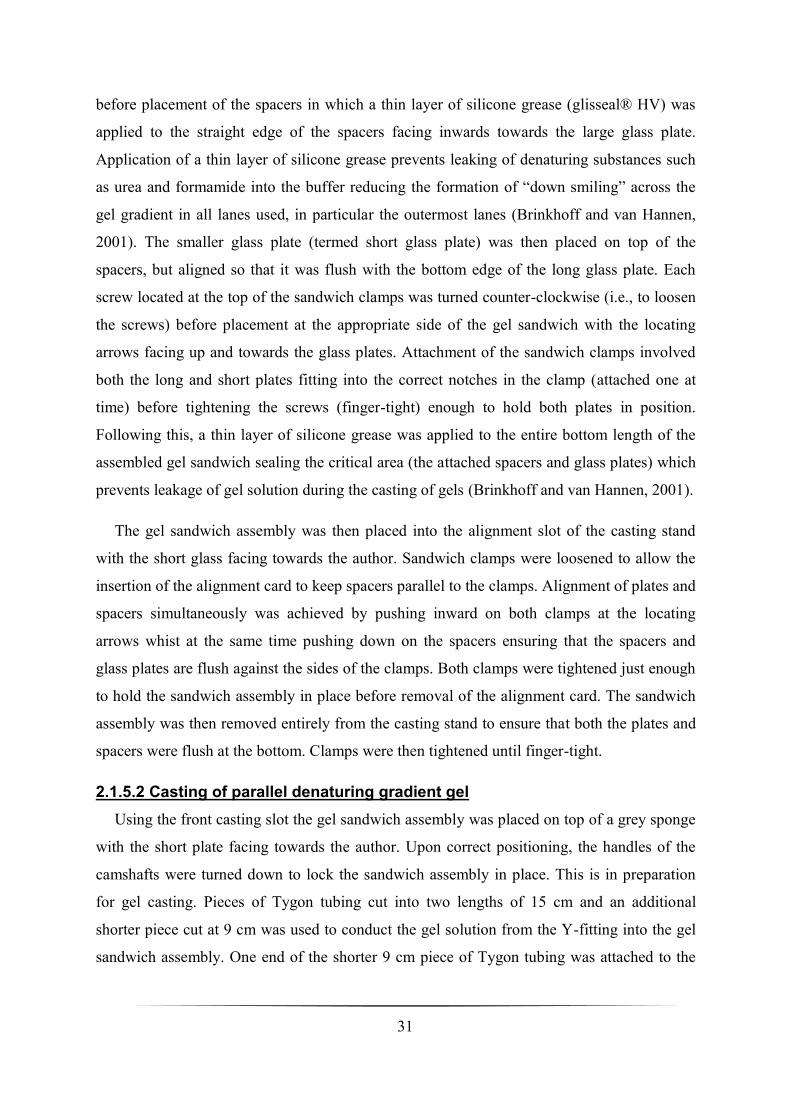
31
before placement of the spacers in which a thin layer of silicone grease (glisseal® HV) was
applied to the straight edge of the spacers facing inwards towards the large glass plate.
Application of a thin layer of silicone grease prevents leaking of denaturing substances such
as urea and formamide into the buffer reducing the formation of “down smiling” across the
gel gradient in all lanes used, in particular the outermost lanes (Brinkhoff and van Hannen,
2001). The smaller glass plate (termed short glass plate) was then placed on top of the
spacers, but aligned so that it was flush with the bottom edge of the long glass plate. Each
screw located at the top of the sandwich clamps was turned counter-clockwise (i.e., to loosen
the screws) before placement at the appropriate side of the gel sandwich with the locating
arrows facing up and towards the glass plates. Attachment of the sandwich clamps involved
both the long and short plates fitting into the correct notches in the clamp (attached one at
time) before tightening the screws (finger-tight) enough to hold both plates in position.
Following this, a thin layer of silicone grease was applied to the entire bottom length of the
assembled gel sandwich sealing the critical area (the attached spacers and glass plates) which
prevents leakage of gel solution during the casting of gels (Brinkhoff and van Hannen, 2001).
The gel sandwich assembly was then placed into the alignment slot of the casting stand
with the short glass facing towards the author. Sandwich clamps were loosened to allow the
insertion of the alignment card to keep spacers parallel to the clamps. Alignment of plates and
spacers simultaneously was achieved by pushing inward on both clamps at the locating
arrows whist at the same time pushing down on the spacers ensuring that the spacers and
glass plates are flush against the sides of the clamps. Both clamps were tightened just enough
to hold the sandwich assembly in place before removal of the alignment card. The sandwich
assembly was then removed entirely from the casting stand to ensure that both the plates and
spacers were flush at the bottom. Clamps were then tightened until finger-tight.
2.1.5.2 Casting of parallel denaturing gradient gel
Using the front casting slot the gel sandwich assembly was placed on top of a grey sponge
with the short plate facing towards the author. Upon correct positioning, the handles of the
camshafts were turned down to lock the sandwich assembly in place. This is in preparation
for gel casting. Pieces of Tygon tubing cut into two lengths of 15 cm and an additional
shorter piece cut at 9 cm was used to conduct the gel solution from the Y-fitting into the gel
sandwich assembly. One end of the shorter 9 cm piece of Tygon tubing was attached to the

32
Y-fitting, the other end a luer coupling with a 19 gauge needle (BD Microlance™ 3). This
needle was then inserted in between the short and long glass plates of the sandwich assembly
located in the centre before being taped (parcel tape providing the most stable attachment) to
the forward facing side of the long glass plate Two other luer couplings were also connected
to one end of both long Tygon 15 cm tubing pieces in addition to both 30 mL syringes (BD).
Each syringe labelled either HI (for the high density solution) and LO (for the low density
solution) had attached a plunger cap, positioned exactly onto each syringe plunger “head”.
Both syringes were correctly positioned into a syringe sleeve (with volume gradations
visible); lever attachment screw was in the same plane as the flat or back side of the sleeve.
This alignment enabled effective and undisturbed delivery of the denaturing gradient gel
solution from the Gradient Delivery System. The cam wheel on the Gradient Delivery System
was rotated back to its starting position (i.e., clockwise) with the delivery volume set to 16
mL.
Two 50 mL centrifuge tubes (SARSTEDT) labelled either HI (for high density solutions)
or LO (for low density solutions) were used for preparation of denaturing gel solutions in a
fume hood (Morgan and Grundy (Unitform) Ltd.). One hundred µL of DCode™ dye (App. 1)
was pipetted into the HI 50 mL centrifuge tube before the addition of (i), 20 mL of 55 %
denaturing gradient solution (12 % acrylamide/bis-acrylamide of gel percentage) (App. 1),
216 µL of 10 % (w/v) ammonium persulphate (APS (SIGMA-ALDRICH®)) (App. 1), and
then 21.6 µL of N,N,N′,N′-tetramethylethylenediamine (TEMED (SIGMA-ALDRICH®))
before the 50 mL centrifuge tube was inverted several times to mix contents; and (ii), into the
LO 50 mL centrifuge tube, 20 mL of 35 % denaturing gradient solution (12 %
acrylamide/Bis-acrylamide of gel percentage) (App. 1) 216 µL of 10 % (w/v) ammonium
persulphate (APS), and then 21.6 µL of TEMED before the centrifuge tube was inverted
several times to mix contents. Using the 30 mL syringes, with 15 cm Tygon tubing attached,
~ 18 mL of each denaturing gradient solution was withdrawn from both the HI and LO
centrifuge tubes and into the appropriately labelled syringe vials. Any air bubbles present (in
particular in the LO syringe) were removed at this time by turning the syringe upside down
and gently tapping the syringe against a hard surface in addition to pushing these solutions to
the end of the tubing to remove any further air bubbles.

33
The two syringes were then placed into the Gradient Delivery System syringe holder on
each side, both designated LO and HI density side, by insertion of the lever attachment
screws into the lever groove. Following this, the ‘free’ ends of the 15 cm Tygon tubing from
the 30 mL syringes were then slid over and attached to both ‘free’ ends of the Y-fitting ready
for denaturing gradient solution distribution. The cam wheel of the Gradient Delivery System
was then rotated in a counter clockwise direction at a steady flowing pace with two hands in a
constant motion for delivery of the denaturing gel solution from the attached syringes into the
gel sandwich assembly. Once dispensed to the top of the short plate, the 19 gauge needle with
Tygon tubing still attached was removed and placed into a 500 mL beaker of hot water before
careful insertion of a 16-tooth comb. The gel was then left to polymerise for 1 h before use.
Both HI and LO syringes were removed from the Gradient Delivery System with Tygon
tubing still attached and then using the syringes themselves were thoroughly rinsed with hot
water from the 500 mL beaker to remove any excess denaturing gel solution. This was
repeated several times and performed quickly after gel casting to avoid premature gel
polymerisation taking place inside the syringes, Tygon tubing and Y-fitting. After gel
polymerisation (1 h from the initial gel casting procedure), the 16-tooth comb was removed
by pulling it straight up and slowly as not to disturb the cast wells within the gel. Distilled
water (dH2O) was finally dispensed across the top of the short plate to fill all of the wells
ready for sample loading.
2.1.5.3 Assembly of the upper buffer chamber before electrophoresis of
amplicons
After gel polymerisation, the gel sandwich was released from the casting stand by turning
the camshafts 180° to the up position and pulling them both outward and placed to the side on
the bench. Laying the inner core flat on a bench, the gel sandwich assembly was then placed
into position so the locating pins on the core fitted into the grooves on the outside surface of
the sandwich clamps at an approximate angle of 20 °. The gel sandwich was then locked into
position against the inner core by pushing up against the locating pins with the end result
being that the upper edge of the short inner glass plate was seated against the notches of the
U-shaped gasket and the tabs of both sandwich clamps held securely against the latch
assemblies on both sides of the inner core. These above steps were repeated once again in
order to attach a second gel sandwich assembly on the reverse side of the inner core, except
soil sample 5 replicates (SS5R), in which only one gel sandwich assembly was required for
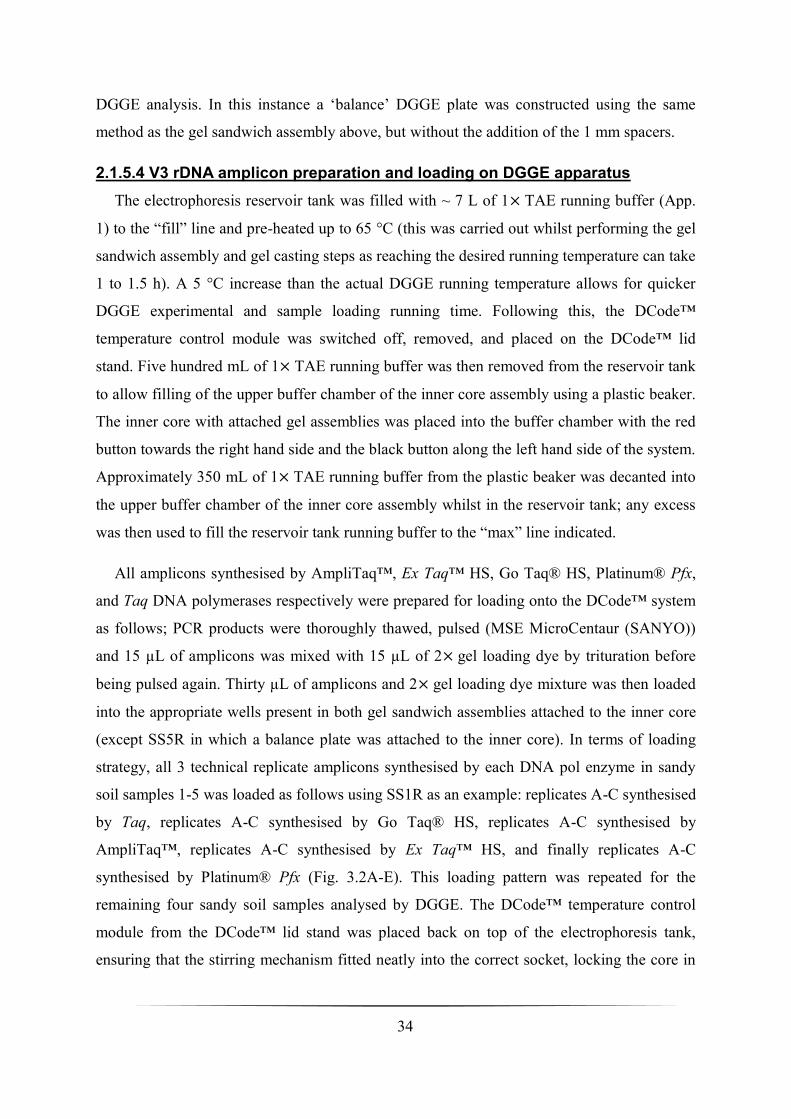
34
DGGE analysis. In this instance a ‘balance’ DGGE plate was constructed using the same
method as the gel sandwich assembly above, but without the addition of the 1 mm spacers.
2.1.5.4 V3 rDNA amplicon preparation and loading on DGGE apparatus
The electrophoresis reservoir tank was filled with ~ 7 L of 1 TAE running buffer (App.
1) to the “fill” line and pre-heated up to 65 °C (this was carried out whilst performing the gel
sandwich assembly and gel casting steps as reaching the desired running temperature can take
1 to 1.5 h). A 5 °C increase than the actual DGGE running temperature allows for quicker
DGGE experimental and sample loading running time. Following this, the DCode™
temperature control module was switched off, removed, and placed on the DCode™ lid
stand. Five hundred mL of 1 TAE running buffer was then removed from the reservoir tank
to allow filling of the upper buffer chamber of the inner core assembly using a plastic beaker.
The inner core with attached gel assemblies was placed into the buffer chamber with the red
button towards the right hand side and the black button along the left hand side of the system.
Approximately 350 mL of 1 TAE running buffer from the plastic beaker was decanted into
the upper buffer chamber of the inner core assembly whilst in the reservoir tank; any excess
was then used to fill the reservoir tank running buffer to the “max” line indicated.
All amplicons synthesised by AmpliTaq™, Ex Taq™ HS, Go Taq® HS, Platinum® Pfx,
and Taq DNA polymerases respectively were prepared for loading onto the DCode™ system
as follows; PCR products were thoroughly thawed, pulsed (MSE MicroCentaur (SANYO))
and 15 µL of amplicons was mixed with 15 µL of 2 gel loading dye by trituration before
being pulsed again. Thirty µL of amplicons and 2 gel loading dye mixture was then loaded
into the appropriate wells present in both gel sandwich assemblies attached to the inner core
(except SS5R in which a balance plate was attached to the inner core). In terms of loading
strategy, all 3 technical replicate amplicons synthesised by each DNA pol enzyme in sandy
soil samples 1-5 was loaded as follows using SS1R as an example: replicates A-C synthesised
by Taq, replicates A-C synthesised by Go Taq® HS, replicates A-C synthesised by
AmpliTaq™, replicates A-C synthesised by Ex Taq™ HS, and finally replicates A-C
synthesised by Platinum® Pfx (Fig. 3.2A-E). This loading pattern was repeated for the
remaining four sandy soil samples analysed by DGGE. The DCode™ temperature control
module from the DCode™ lid stand was placed back on top of the electrophoresis tank,
ensuring that the stirring mechanism fitted neatly into the correct socket, locking the core in

35
place, and the power, pump, and heater were all switched back on with a final adjustment of
the initial running temperature; i.e., 60 °C as opposed to 65 °C.
2.1.5.5 DGGE of V3 rDNA amplicon technical replicates in sandy soil samples
When a running temperature of 60 °C was finally obtained, technical replicates of V3
rDNA GC-clamped PCR fragments, amplified by the five different DNA polymerase
enzymes in each sandy soil sample, were analysed by DGGE using the DCode™ Universal
Mutation Detection System (BIO-RAD) on a 35-55 % denaturing gradient for 4.5 h at a
constant of 200 V (Basic PowerPac™, BIO-RAD). All gels were removed before staining
with SYBR Green nucleic acid stain I (Invitrogen™) for 30 min on a shaking platform at 75
rpm (Edmund Bühler, KM-2). The staining solution was then decanted and any excess
present on the gel(s) was rinsed off with distilled dH20. Visualisation of denaturing gels was
under UV light using a BIO-RAD Gel Doc 2000 system and Quantity One software (v.
4.6.6). Hard copies of DGGE bacterial community profiles from each sandy soil sample and
pol type were generated using a Mitsubishi Video copy processor (model P91 attached to the
Gel Doc 2000 system).
2.1.6 Statistical and ecological analyses of bacterial community profiling
2.1.6.1 DGGE profile capture and analysis
The BIO-RAD Gel Doc 2000 system was used to capture all of the DGGE profile images
(i.e., a photograph taken where the gel is converted into a digital file (TDS 1-D scan file
format) producing an electropherogram) produced from the assessment of the DNA pol
enzymes and the analysis performed using the included Quantity One software (version
4.6.6). Initial DGGE profiles captured were then converted to an inverted electropherogram
(i.e., black bands set against a white background producing a clearer image for band
discrimination). From here, a rolling ball algorithm was selected manually to subtract any
background interference so peak detection performed represented actual bands and not
artifacts. Lanes within the DGGE profile were created manually and subsequently framed to
address DGGE experimental nuances such as ‘smiling’ and ‘leaning’ by the creation of lane
anchors that could be manipulated to centralize all of the bands produced in each
corresponding lane. Band detection itself was carried out using Quantity One’s auto-detect
software algorithm with lane width set to 4.100 mm preventing lane overlap. Subsequently,
detected bands in the DGGE profile were assessed by eye and either removed or added using
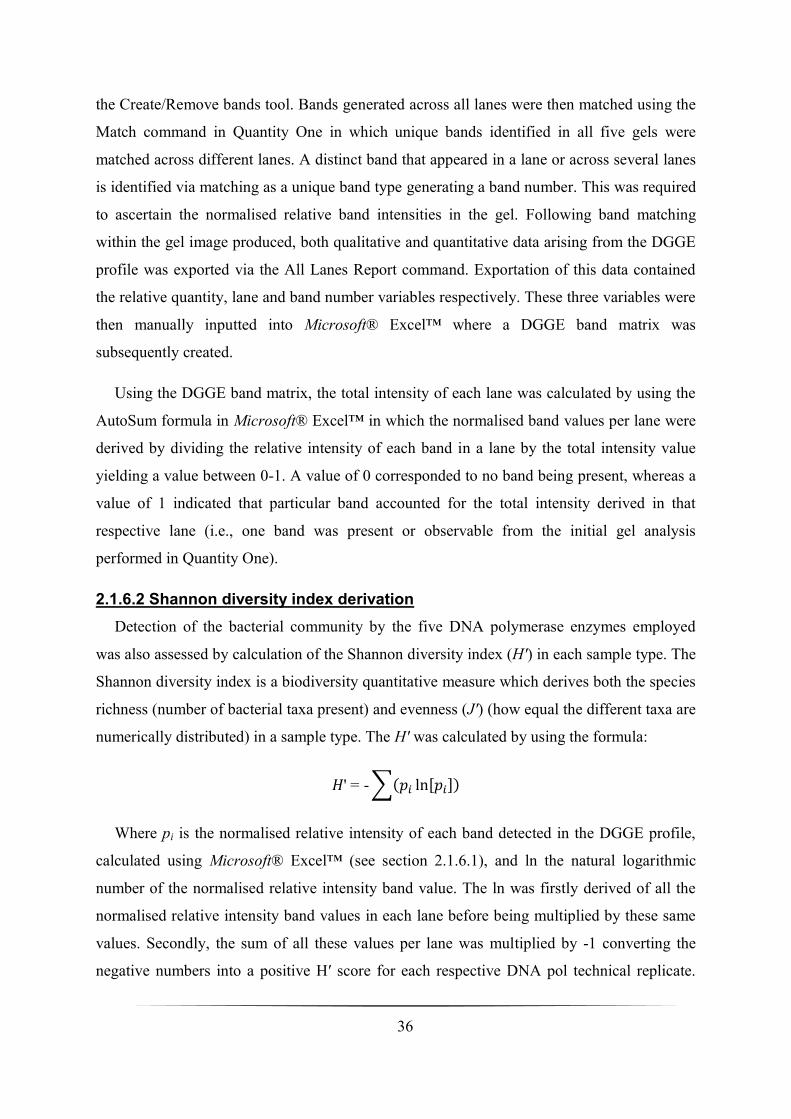
36
the Create/Remove bands tool. Bands generated across all lanes were then matched using the
Match command in Quantity One in which unique bands identified in all five gels were
matched across different lanes. A distinct band that appeared in a lane or across several lanes
is identified via matching as a unique band type generating a band number. This was required
to ascertain the normalised relative band intensities in the gel. Following band matching
within the gel image produced, both qualitative and quantitative data arising from the DGGE
profile was exported via the All Lanes Report command. Exportation of this data contained
the relative quantity, lane and band number variables respectively. These three variables were
then manually inputted into Microsoft® Excel™ where a DGGE band matrix was
subsequently created.
Using the DGGE band matrix, the total intensity of each lane was calculated by using the
AutoSum formula in Microsoft® Excel™ in which the normalised band values per lane were
derived by dividing the relative intensity of each band in a lane by the total intensity value
yielding a value between 0-1. A value of 0 corresponded to no band being present, whereas a
value of 1 indicated that particular band accounted for the total intensity derived in that
respective lane (i.e., one band was present or observable from the initial gel analysis
performed in Quantity One).
2.1.6.2 Shannon diversity index derivation
Detection of the bacterial community by the five DNA polymerase enzymes employed
was also assessed by calculation of the Shannon diversity index (H′) in each sample type. The
Shannon diversity index is a biodiversity quantitative measure which derives both the species
richness (number of bacterial taxa present) and evenness (J′) (how equal the different taxa are
numerically distributed) in a sample type. The H′ was calculated by using the formula:
∑( [ ])
Where pi is the normalised relative intensity of each band detected in the DGGE profile,
calculated using Microsoft® Excel™ (see section 2.1.6.1), and ln the natural logarithmic
number of the normalised relative intensity band value. The ln was firstly derived of all the
normalised relative intensity band values in each lane before being multiplied by these same
values. Secondly, the sum of all these values per lane was multiplied by -1 converting the
negative numbers into a positive H′ score for each respective DNA pol technical replicate.

37
Species richness (R) (i.e., the number of bacterial taxa present) was derived from the number
of bands produced per lane per DNA pol technical replicate.
2.1.6.3 Principal components analysis
Once all normalised values were deduced in all five DGGE profiles generated, they were
then copied and pasted into the PAST (v. 1.85) software program (Hammer and Harper,
2001) and subjected to multivariate analysis using principal components analysis (PCA). All
Eigenvalues (a measure of variation in each axis measured in PCA) were < 1 so the PCA
scores generated were accepted. The PCA scores of the first two axes of variation, principal
components 1 and 2 (PC1 is the x-axis whereas PC2 represents the y-axis) were then used to
plot graphs for each sandy soil sample and DNA pol technical replicate represented. The PC1
and PC2 percentage of variation were then added together to deduce the cumulative
percentage of variation explained in the outputs. The variance between the DNA pol assessed
and their detection of the bacterial diversity in each sample type was deduced by inputting
both PC1 and PC2 scores into Minitab® 15 (v. 15.1.30.0). Variances along the x-axis and y-
axis corresponding to PC1 and PC2 were subjected to a one-way ANOVA (analysis of
variance) (confidence level was set at 95 %) where a P-value was calculated indicating
whether there was a significant difference or not between the five DNA pol employed in the
diversity generated in all five sandy soil samples. Additionally, a Tukey’s test was performed,
a post ad hoc ANOVA to determine if amplicons generated by the DNA pol enzymes
differed.
2.2 Bacterial and fungal standard organism ladders for semi-
quantitative DGGE analyses in patient cohorts
2.2.1 Bacterial 16S standard ladder construction
Nine bacterial species were selected for 16S standard ladder (SL) construction as these
were all associated with microbial infection in both cystic fibrosis (CF) and non-CF
bronchiectasis (nCFBR) individuals. These bacterial organisms (table 2.1) were comprised of
reference strains from the NCTC, Laboratory of Microbiology, University of Ghent (LMG)
and fully identified wild type strains from the Freeman Hospital, Microbiology Department,
Newcastle upon Tyne.
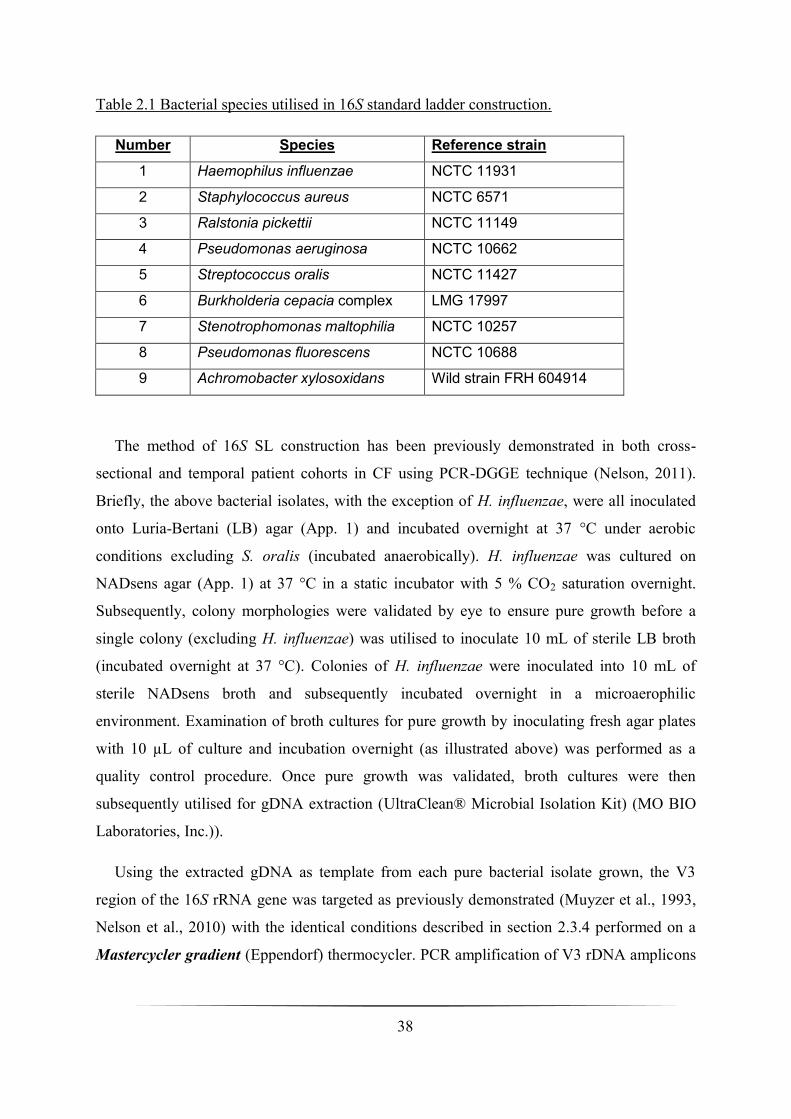
38
Table 2.1 Bacterial species utilised in 16S standard ladder construction.
Number Species Reference strain
1 Haemophilus influenzae NCTC 11931
2 Staphylococcus aureus NCTC 6571
3 Ralstonia pickettii NCTC 11149
4 Pseudomonas aeruginosa NCTC 10662
5 Streptococcus oralis NCTC 11427
6 Burkholderia cepacia complex LMG 17997
7 Stenotrophomonas maltophilia NCTC 10257
8 Pseudomonas fluorescens NCTC 10688
9 Achromobacter xylosoxidans Wild strain FRH 604914
The method of 16S SL construction has been previously demonstrated in both cross-
sectional and temporal patient cohorts in CF using PCR-DGGE technique (Nelson, 2011).
Briefly, the above bacterial isolates, with the exception of H. influenzae, were all inoculated
onto Luria-Bertani (LB) agar (App. 1) and incubated overnight at 37 °C under aerobic
conditions excluding S. oralis (incubated anaerobically). H. influenzae was cultured on
NADsens agar (App. 1) at 37 °C in a static incubator with 5 % CO2 saturation overnight.
Subsequently, colony morphologies were validated by eye to ensure pure growth before a
single colony (excluding H. influenzae) was utilised to inoculate 10 mL of sterile LB broth
(incubated overnight at 37 °C). Colonies of H. influenzae were inoculated into 10 mL of
sterile NADsens broth and subsequently incubated overnight in a microaerophilic
environment. Examination of broth cultures for pure growth by inoculating fresh agar plates
with 10 µL of culture and incubation overnight (as illustrated above) was performed as a
quality control procedure. Once pure growth was validated, broth cultures were then
subsequently utilised for gDNA extraction (UltraClean® Microbial Isolation Kit) (MO BIO
Laboratories, Inc.)).
Using the extracted gDNA as template from each pure bacterial isolate grown, the V3
region of the 16S rRNA gene was targeted as previously demonstrated (Muyzer et al., 1993,
Nelson et al., 2010) with the identical conditions described in section 2.3.4 performed on a
Mastercycler gradient (Eppendorf) thermocycler. PCR amplification of V3 rDNA amplicons
39
was verified by agarose gel electrophoresis (as previously described in section 2.1.4) before
being subsequently run out for DGGE analysis (DCode™ Universal Mutation Detection
System (BIO-RAD)) on a 32.5-60 % denaturing gradient (12 % acrylamide/bis-acrylamide of
gel percentage) (App. 1). Two µL of pure V3 rDNA amplicons mixed with 2 µL 2× loading
dye was required before 4 µL was loaded into each well. The V3 rDNA amplicons from each
bacterial species were also pooled and run out for DGGE analysis (36 µL in total (18 µL PCR
products of 9 different bacterial species and 18 µL 2 gel loading dye)). Electrophoresis of
bacterial isolate V3 rDNA amplicons was performed at 200 V constant (Basic PowerPac™,
BIO-RAD) for 4.5 h, stained with SYBR Green nucleic acid stain I (Invitrogen™), incubated
for 30 min (75 rpm on a shaking platform (Edmund Bühler, KM-2)), de-stained briefly with
dH2O, before visualisation under UV light (BIO-RAD Gel Doc 2000 system and Quantity
One software (v. 4.6.6)). Hard copies were generated as previously described. Pure V3 rDNA
single bacterial strain PCR products amplified from the bacterial isolates listed above were to
comprise the 16S SL. Execution of this 16S SL was essential for inter-comparison of the
bacterial DGGE community profiles generated in all of the patient cohorts analysed enabling
inter-gel alignment via these internal standards (Tourlomousis et al., 2010).
2.2.2 Fungal 28S standard ladder construction
2.2.2.1 Fungal isolates selection and collection
Seven fungal species were selected and utilised for the construction of the 28S SL for
fungal community studies in all patient cohorts enlisted. Selection of the following was based
on the implication of all species being opportunistic invasive respiratory pathogens in CF
patients. Fungal species chosen were comprised of one spore-forming species, Aspergillus
fumigatus, and five yeast-forming species: Candida albicans, Candida dubliniensis, Candida
glabrata, Candida parapsilosis, Exophiala dermatitidis, and Scedosporium apiospermum. All
fungal collections prior to gDNA extraction were generously donated by Mrs. Claire
Rennison at the Freeman Hospital, Microbiology Department, Newcastle upon Tyne. The
fungal isolates themselves were from clinical samples, identified in the Microbiology
Department laboratory according to standard operating procedure (SOP) affiliated with the
Freeman Hospital.

40
2.2.2.2 Extraction of fungal gDNA from isolates
Extraction of fungal gDNA was performed using an UltraClean® Microbial Isolation Kit
(MO BIO Laboratories, Inc.) in a Class II safety airflow cabinet (envair Bio 2+) with
amendments to the protocol. Fungal species were firstly inoculated in 100 mL of sterile
Sabourad (OXOID) liquid broth (pH 7.0) (App. 1) before being incubated (SANYO) at 22 °C
for 7 days. Following incubation, a tea spoonful of sterile glass beads (3 mm diameter) was
dropped into each fungal culture species before being placed in an orbital shaker (New
Brunswick Scientific Ltd.) for 10 min at 200 rpm, 37 °C. This step is critical as it aids in the
rupture and softening of the previously hard mycelial wall (prominent in the spore-forming
species A. fumigatus) seen after the first incubation step.
From the yeast cultures grown, 1.8 mL of microbial culture (broth liquid medium) was
pipetted into a clean, sterile 2 mL microfuge tube and centrifuged at 10 000 g for 1 min at
room temperature before the supernatant was decanted. The tubes were then spun down again
at 10 000 g at room temperature generating a cell pellet. Any supernatant still present was
removed by a pipette tip. For A. fumigatus fungal culture: using a clean pair of forceps
(washed down with 70 % v/v ethanol), a small piece of softened mycelia present at the top of
the Sabourad broth was transferred to a clean sterile 2 mL collection tube, centrifuged at 10
000 g for 1 min at room temperature before the supernatant was discarded. Again, this was
spun down once more at 10 000 g for 1 min at room temperature in which any supernatant
still present was removed by pipette as in the yeast species above. Cell pellets were
resuspended in 300 µL of MicroBead Solution then gently vortexed before transfer of
resuspended cells to MicroBead Tubes. Fifty µL of MD1 Solution was then added to the
Microbead Tubes.
Fungal cell preps (in MicroBead Tubes) were then heated at 70 °C for 10 min as an
additional aid in fungal cell lysis. Following this incubation step, fungal cell preps were then
vortexed at maximum speed for 10 min using the Mo Bio Vortex Adapter tube holder. After
bead beating step, the 2 mL MicroBead Tubes were then centrifuged at 10 000 g for 1 min
at room temperature. The supernatant (~ 300-350 µL) was aliquoted into a clean sterile 2 mL
collection tube in which 100 µL of Solution MD2 was then added. Microfuge tubes were
gently vortexed for 5 s then incubated at 4 °C for 5 min. Following this incubation step,
fungal cell preps were centrifuged at 10 000 g for 1 min at room temperature. The entire
41
volume of supernatant (~ 450 µL) was then transferred to a clean sterile 2 mL collection tube,
whilst avoiding the cell debris pellet. Solution MD3 was briefly shaken and 900 µL was
aliquoted to the recently transferred supernatant and then vortexed for 5 s.
Seven hundred µL was then loaded into the Spin Filter and centrifuged at 10 000 g for 1
min at room temperature twice. All flow through liquid following this centrifugation step was
discarded. Three hundred µL of MD4 Solution was then added before centrifugation at room
temperature for 1 min at 10 000 g. Flow through liquid from Spin Filter was again
discarded before repeating the above centrifugation step (10 000 g at room temperature for
1 min). Spin Filter basket was then removed and placed into a new clean sterile 2 mL
collection tube in which 50 µL of Solution MD5 was pipetted to the centre of the white filter
membrane. Microfuge tubes containing Spin Filter baskets were then finally centrifuged at
room temperature for 1 min, 10 000 g to elute isolated fungal gDNA. The Spin Filter
basket was discarded and fungal gDNA was stored at -80 °C.
2.2.2.3 PCR amplification of 28S rDNA segments
Amplification of all seven fungal isolates using extracted gDNA was used as template for
PCR. Two conserved regions flanking a highly variable region within the 28S rRNA gene
were selected as previously demonstrated for amplification of small segments of 28S rDNA
(Sandhu et al., 1995). Universal fungal primers U1F (5′-GTG AAA TTG TTG AAA GGG
AA-3′) and U2R-GC (5′-CGC CCG CCG CGC GCG GCG GGC GGG GCG GGG GCA
CGG-3′) primer sets were executed, in addition to Ex Taq™ HS pol (TAKARA BIO INC.),
to enzymatically amplify small segments of 28S rDNA (U1-U2 rDNA fragments). Both
universal fungal primers both refer to co-ordinate numbers 403-422 (forward primer U1F)
and 645-662 (reverse primer U2R) of the reference Saccharomyces cerevisiae 28S rRNA
gene (Sandhu et al., 1995). As in the bacterial community detection PCR, addition of a GC-
clamp was executed, however, this was attached to the reverse fungal primer (U2R-GC) to
aid in genomic sequence variation detection in DGGE (Sheffield; 1989). The PCR of the
fungal isolates was performed on a Mastercycler gradient (Eppendorf). PCR reagents for this
reaction were added as follows: 0.5 µM primers (both forward (U1F) and reverse (U2R-GC)),
1 Ex Taq Buffer (TAKARA BIO INC.), 0.2 mM each dNTP (TAKARA BIO INC.), 1 mM
MgCl2, 10 µg/µL BSA (Promega), 1.25 U Ex Taq™ HS and 1 µL of gDNA template made
up to a total volume of 50 µL with sterile 18.2 MΩ H2O (MILLIPORE, Direct-Q™ Ultra

42
Pure Water Systems, MILLIPAK® 0.22 µm filter). An automatic HS and touchdown PCR
protocol was utilised in which the conditions were an initial denaturation step of 97 °C for 5
min, 94 °C for 1 min, 60 °C for 1 min with a reduction of 1.0 °C per cycle reaching
touchdown at 50 °C and 72 °C for 1 min repeated for 10 cycles. An additional 25 cycles were
performed at 94 °C for 3 min, 50 °C for 1 min, and 72 °C for 1 min. As previously
introduced, a final extension time at 72 °C for 30 min was implemented in addition to the
touchdown protocol (Don et al., 1991, Janse et al., 2004).
2.2.2.4 Agarose gel electrophoresis of 28S rDNA segments
The small pure 28S rDNA fragments from each fungal isolate were validated for
amplification by running PCR products out on a 1 % (w/v) agarose gel stained with SYBR®
Safe DNA gel stain (10 000 concentrate in (DMSO) (Invitrogen™). PCR fragments were
then electrophoresed for 20 min at 120 mA constant (BIO-RAD, Basic PowerPac™) in 1
TAE running buffer with 5 µL of PCR product, 2 µL 6 BPB, and 5 µL 18.2 MΩ H2O
(MILLIPORE, Direct-Q™ Ultra Pure Water Systems, MILLIPAK® 0.22 µm filter) mixed
prior to 10 µL loaded into each well. Five µL of Hyperladder I (200-10 000 molecular bp-
size markers (BIOLINE)) was also added, in which after electrophoresis amplicons migrated
between the 200 and 400-bp marker sizes (amplicon size was 300 bp in length, including the
GC-clamp attached to U2R-GC reverse primer) confirmed under UV light (Gel Doc 2000
system and Quantity One software (v. 4.6.6) (BIO-RAD). Hard copies of the
electropherograms were generated using a Mitsubishi Video copy processor (model P91
attached to the Gel Doc 2000 system).
2.2.2.5 DGGE of U1-U2 rDNA PCR fragments
The amplification of 28S rDNA segments (termed U1-U2 rDNA) using PCR from the
fungal isolates selected for 28S standard ladder construction were subsequently analysed by
DGGE to validate individual fungal strain migration position and pooled amplicon migration
positions; a necessity when the fungal communities were amplified in patient cohorts
investigated in thesis. Fungal species standard ladder analysis was performed using the
DCode™ Universal Mutation Detection System (BIO-RAD) where U1-U2 rDNA fragments
from each fungal isolate were run out on a 40-60 % denaturing gradient (12 %
acrylamide/bis-acylamide of gel percentage) (App. 1) in addition to a balance plate attached
to the inner core. Four µL of each fungal strain and its amplicons were loaded into the

43
appropriate gel wells (2 µL pure fungal strain U1-U2 rDNA and 2 µL 2× loading dye).
Additionally, all fungal species amplicons were pooled together (28 µL (14 µL PCR products
of 7 different fungal species and 14 µL 2× gel loading dye)) and loaded onto the DGGE
apparatus. All PCR fragments were then electrophoresed at 70 V constant (Basic
PowerPac™, BIO-RAD) for 17 h, stained with SYBR Green nucleic acid stain I
(Invitrogen™), incubated for 30 min at 75 rpm, (Edmund Bühler, KM-2) and de-stained
briefly with dH2O, before being finally visualised under UV light (BIO-RAD Gel Doc 2000
system and Quantity One software (v. 4.6.6)). Hard copies of the fungal 28S standard ladder
were generated by using a Mitsubishi Video copy processor (model P91 attached to the Gel
Doc 2000 system).
2.3 PCR-DGGE study of a cross-sectional cohort with non-CF
bronchiectasis
2.3.1 Patient cohort selection and ethical considerations
Ethical approval was obtained from County Durham and Tees Valley research ethics
committee. The inclusion criteria were adult out-patients attending a specialist bronchiectasis
weekly clinic in North East England (Freeman Hospital, Newcastle upon Tyne) with a
clinical diagnosis of non-cystic fibrosis bronchiectasis (nCFBR) diagnosed by high-resolution
computed tomography (HRCT) scanning. Seventy patients (App. 3) were enrolled into the
study in which all non-CF aetiologies were included with the related nCFBR condition.
Information on bronchiectasis aetiology, patient sex, age, clinical status, forced expiratory
volume in one second (FEV1) and one second predicted (FEV1% predicted) in addition to
inhaled antibiotic therapy was collected. Patient cohort enrolled consisted both of clinically
stable and exacerbated individuals. For clinical status an exacerbation was defined as per the
British Thoracic Society 2010 Bronchiectasis guidelines in the presence of increased cough,
malaise and increased sputum volume and purulence (Pasteur et al., 2010). Frequent
exacerbators within cohort were defined as those patients who had greater than 3 episodes
over this period (Pasteur et al., 2010). Aetiological designation was based upon the suggested
protocols (Pasteur et al., 2001). Cystic fibrosis genotyping and/or sweat testing was
undertaken as suggested by national guidelines.

44
2.3.2 Sputum sample collection and diagnostic microbiology
Spontaneously expectorated sputum samples were collected from an outpatient cohort of
an adult nCFBR population. Samples were divided with one half being used for genomic
DNA extraction (below) whilst the remainder underwent routine microbial culture using 10
µL aliquots of Sputasol (OXOID) treated and homogenised sputum according to the
standardised Health Protection Agency methodology at the Department of Microbiology,
Freeman Hospital, Newcastle-upon-Tyne (see App. 4 for standard operating procedure (SOP)
regarding the selective media employed from this sample type). Information, from up to 10
years previously, on patient sex, age, clinical and microbiological status, FEV1, and inhaled
antibiotic therapy was collected. The definitions of Pasteur et al., (2001) were used to define
persistent infection in study cohort.
2.3.3 DNA extraction from sputum clinical samples
All DNA extractions on sputum samples in patient cohort were performed using an
UltraClean® Microbial DNA Isolation Kit (MO BIO Laboratories, Inc.) in a Microflow
Peroxide Advanced Bio Safety Cabinet (Class I) at the Freeman Hospital, Microbiology
Department. Before collection of extracted gDNA from sputum all samples were thawed
thoroughly and then vortexed (Vortex-Genie2™) rigorously after addition of an approximate
equal volume of sputolysin (if required as most sputum samples varied in their degree of
purulence). The addition of sputolysin breaks down any mucus plugs that may be present in
the sputum sample and aids in the creation of a more aqueous solution enabling the sample
supernatant to pass through the 0.2 µm filter without obstruction.
Once mucus plugs in sample were dissolved, 1.8 mL from aqueous solution (i.e., the
sputum sample) was aliquoted into a sterile 2 mL collection tube before being spun down at
10 000 g (SIGMA® 12094 rotor) at room temperature for 1 min in a microcentrifuge
(SIGMA®). The supernatant was discarded leaving behind another mucus plug. At this stage
all sputum samples extracted for gDNA left behind varying amounts of mucus plugs. As a
precautionary step, any mucus plugs which exceeded > 200 µL needed be to be aliquoted off
to approximately < 200 µL to ensure unobstructed flow through 0.22 µm filter at a later stage.
Following this the sample was spun down again at 10 000 g to maximally concentrate and
pellet microbial cells. Any supernatant present in sample was discarded. The cell pellet was
re-suspended in 300 µL of MicroBead Solution containing salts and a buffer stabilising and
45
homogeneously dispersing the microbial cells present in the re-suspension solution prior to
cellular lysis. After addition of MicroBead Solution re-suspended cells were gently vortexed
to aid in microbial cell dispersion before being transferred to a MicroBead Tube. Fifty µL of
MD1 solution (i.e., lysis buffer) was then added to re-suspended cells. The lysis buffer
contains the anionic detergent sodium dodecyl sulphate (SDS) and other chaotropic salts
(undisclosed in kit protocol, but these can be guanidine hydrochloric acid (HCl), guanidine
thiocyanate, urea, and lithium perchlorate). Both chemical agents aid in cellular lysis, the
former acting to breakdown fatty acids and cell membrane lipids via solubilisation; the latter,
in addition to also breaking down the cellular membrane, plays an important role in the
disruption of hydrogen bonds, van der Waals forces, and hydrophobic interactions.
All MicroBead Tubes were then secured horizontally using the MO BIO Vortex Adapter
tube holder and subsequently vortexed at maximum speed for 10 min to release ssDNA from
lysed cells. Recovery of gDNA from cell debris was achieved by centrifuging at room
temperature the 2 mL MicroBead Tubes at 10 000 g for 1 min in which the supernatant
(now containing the gDNA) was transferred to a clean 2 mL microfuge tube. One hundred µL
of MD2 Solution was added to the supernatant and then vortexed for 5 seconds before being
incubated at 4 °C for 5 min. Solution MD2 precipitates both non-DNA and inorganic material
present in proteins and cell debris. After incubation, the supernatant was then spun down at
room temperature at 10 000 g for 1 min.
Avoiding the pellet, as this contained non-DNA organic and inorganic materials (i.e., cell
debris and proteins), the entire supernatant volume was transferred into an empty syringe vial
(BD) with filter (PALL Gelman Laboratory, Acrodisc® Syringe Filter, 0.2 µm Supor®
membrane, non-pyrogenic) attached before insertion of the syringe plunger. Once inserted,
plunger was pushed down to filter sterilise the supernatant into an empty, clean 2 mL
collection tube. Filter sterilisation of the supernatant ensured the removal of any tubercular
agents that may be still present in the supernatant processed. Approximately 200-300 µL of
supernatant volume was collected after this step.
Solution MD3 was shaken before use and then 900 µL of this was added to the filter
sterilised supernatant and subsequently vortexed for 5 s. Solution MD3 creates a high salt
concentration which is necessary for the binding of the gDNA to the Spin Filter in the
following step. Seven hundred µL of supernatant was loaded into the Spin Filter and

46
centrifuged (room temperature) at 10 000 g for 1 min before the flow through was
discarded. The remaining supernatant was added to the Spin Filter and this process was
repeated once more. Again, all flow through liquid was disposed of as the gDNA is
selectively bound to the silica membrane in the Spin Filter device allowing impurities such as
protein and polysaccharides to pass unobstructed in the flow through liquid. Three hundred
µL of Solution MD4 (an ethanol based wash solution) was then added to further clean the
gDNA bound to the silica membrane removing residues of salt and other impurities that may
be still present in the previous step. All flow through liquid containing ethanol wash solution
waste and contaminants was discarded as before. The Spin Filter was then spun down at 10
000 g for 1 min at room temperature to remove any residual ethanol wash solution present
(essential for a clean eluant). The Spin Filter basket was then placed in a new clean 2 mL
collection tube before addition of 50 µL Solution MD5 (an elution buffer containing 10 mM
Tris, pH 8) to the centre of the white membrane. The collection tube containing the Spin
Filter was centrifuged at 10 000 g at room temperature for 1 min eluting the gDNA bound
to the filter membrane. The elution buffer solution MD5 allows this, as release of the bound
DNA is permitted only in the presence of this elution buffer as it contains no salt (previously,
DNA was bound to the silica Spin Filter membrane only in the presence of salt). Following
elution of the gDNA (50 µL in volume) the Spin Filter was discarded and the gDNA was
stored at -80 °C.
2.3.4 Bacterial community detection PCR
As previously described, the V3 hypervariable region of the 16S rRNA gene was targeted
for enzymatic amplification using gDNA as template. Primer sets V3F-GC (5′-CGC CCG
CCG CGC GCG GCG GGC GGG GCG GGG GCA CGG GGG GCC TAC GGG AGG CAG
CAG-3′) and V3R (5′- ATT ACC GCG GCT GCT GG-3′) as previously shown (Muyzer et
al., 1993, Nelson et al., 2010) were utilised to produce different V3 rDNA fragments
amplified from multiple species of bacteria present in the clinical sputum samples. As before,
a 40-bp GC-rich nucleotide sequence was attached to the 5′ end of the forward primer V3F-
GC (Sheffield et al., 1989).
An automatic HS and touchdown PCR protocol (Don et al., 1991) was performed on a
Mastercycler gradient (Eppendorf) with the PCR reagents per reaction added as follows: 0.5
µM primers (both forward (V3F-GC) and reverse (V3R)), 1 Ex Taq Buffer (TAKARA BIO

47
INC.), 0.2 mM each dNTP (TAKARA BIO INC.), 1 mM MgCl2, 10 µg/µL BSA (Promega),
1.25 U Ex Taq™ HS pol and 1 µL of gDNA template made up to a total volume of 50 µL
with sterile 18.2 MΩ H2O (MILLIPORE, Direct-Q™ Ultra Pure Water Systems,
MILLIPAK® 0.22 µm filter). Positive (extracted gDNA from a pure culture of H. influenzae,
NCTC no. 11931) and negative controls were also set up to determine the correct size of the
V3 rDNA fragments and to rule out any environmental DNA contamination. Samples were
incubated for 5 min at 97 °C releasing antibody bound polymerase Ex Taq™ HS, then at 96
°C for 1 min, 65 °C for 1 min, with a reduction of 0.5 °C per cycle until touchdown at 55 °C.
Primer extension lasted for 30 s at 72 °C and this was repeated for 20 cycles. An additional
15 cycles was carried out at 94 °C for 1 min, 55 °C for 1 min, 72 °C for 3 min and a final
extension time of 72 °C for 30 min as previously described (Janse et al., 2004).
2.3.5 Fungal community detection PCR
As previously described in the 28S standard ladder construction sections, in addition to the
bacterial community, we also investigated the fungal community in the cross-sectional
cohort. Using primer sets U1F (5′-GTG AAA TTG TTG AAA GGG AA-3′) and U2R-GC
(5′-CGC CCG CCG CGC GCG GCG GGC GGG GCG GGG GCA CGG-3′) to target
conserved regions containing hyper-variable regions within the 28S rRNA gene, small
fragments of 28S rDNA were generated using gDNA as template (Sandhu et al., 1995,
Nelson, 2011).
An automatic HS and touchdown PCR protocol was performed on an Eppendorf
Mastercycler gradient apparatus. Reagents for this reaction were added as follows: 0.5 µM
primers (both forward (U1F) and reverse (U2R-GC)), 1 Ex Taq Buffer (TAKARA BIO
INC.), 0.2 mM each dNTP (TAKARA BIO INC.), 1 mM MgCl2, 10 µg/µL BSA (Promega),
1.25 U Ex Taq™ HS (TAKARA BIO INC.) and 1 µL of gDNA template made up to a total
volume of 50 µL with sterile 18.2 MΩ H2O (MILLIPORE, Direct-Q™ Ultra Pure Water
Systems, MILLIPAK® 0.22 µm filter). Conditions for the PCR were as follows: an initial
denaturation step of 97 °C for 5 min, 94 °C for 1 min, 60 °C for 1 min with a reduction of 1.0
°C per cycle reaching touchdown at 50 °C and 72 °C for 1 min repeated for 10 cycles. An
additional 25 cycles were performed at 94 °C for 3 min, 50 °C for 1 min, and 72 °C for 1
min, with a final extension time at 72 °C for 30 min implemented as previously described in
addition to the touchdown protocol (Don et al., 1991, Janse et al., 2004). Positive and

48
negative controls were also conducted confirming the correct size of the fungal U1-U2 rDNA
amplicons (using extracted gDNA from a pure culture of A. fumigatus) and validation of any
environmental sources of contamination.
2.3.6 Agarose gel electrophoresis of both V3 and U1-U2 rDNA amplicons
Regions amplified from both the 16S and 28S rRNA genes in extracted gDNA, i.e., V3
and U1-U2 rDNA fragments, were confirmed by running PCR products on a 1 % (w/v)
agarose gel stained with SYBR® Safe DNA gel stain (10 000 concentrate in (DMSO)
(Invitrogen™). PCR fragments were electrophoresed for 20 min at 120 mA constant (BIO-
RAD, Basic PowerPac™) in 1 TAE running buffer with 5 µL of PCR product, 2 µL 6
BPB, and 5 µL 18.2 MΩ H2O (MILLIPORE, Direct-Q™ Ultra Pure Water Systems,
MILLIPAK® 0.22 µm filter) mixed prior to 10 µL loaded into each well. Five µL of
Hyperladder I (200-10 000 molecular bp-size markers (BIOLINE)) was also added, in which
after electrophoresis, positive confirmation of both the V3 and U1-U2 rDNA fragments was
validated (233 and 300 bp in size respectively) under UV light (Gel Doc 2000 system and
Quantity One software (v. 4.6.6) (BIO-RAD). Hard copies of the electropherograms were
generated using a Mitsubishi Video copy processor (model P91 attached to the Gel Doc 2000
system).
2.3.7 Molecular fingerprinting of bacterial and fungal communities in
patient cohort
2.3.7.1 DGGE of V3 rDNA amplicons
Molecular fingerprinting of V3 rDNA amplicons in cross-sectional patient cohort was
carried out using a DCode™ Universal Mutation Detection System (BIO-RAD) run out on a
32.5-60 % denaturing gradient (12 % acrylamide/bis-acrylamide of gel percentage) (App. 1)
with a balance plate attached to the inner core of the DCode™ system apparatus. PCR
fragments generated from each clinical sample (30 µL (15 µL PCR product and 15 µL 2 gel
loading dye) were loaded onto wells in the denaturing gel in addition to a 16S standard ladder
(36 µL (18 µL PCR products of 9 different bacterial species and 18 µL 2 gel loading dye)).
Electrophoresis of V3 rDNA amplicons was performed at 200 V constant (Basic
PowerPac™, BIO-RAD) for 4.5 h, stained with SYBR Green nucleic acid stain I
(Invitrogen™), incubated for 30 min (75 rpm on a shaking platform (Edmund Bühler, KM-
2)), de-stained briefly with dH2O, before visualisation under UV light (BIO-RAD Gel Doc

49
2000 system and Quantity One software (v. 4.6.6)). Hard copies of the bacterial community
DGGE profiles in cross-sectional patient cohort were generated (Mitsubishi Video copy
processor (model P91) attached to the Gel Doc 2000 system).
2.3.7.2 DGGE of U1-U2 rDNA amplicons
Fungal community analysis of nCFBR cohort was performed using the DCode™
Universal Mutation Detection System (BIO-RAD) on a 40-60 % denaturing gradient (12 %
acrylamide/bis-acylamide of gel percentage) in addition to a balance plate attached to the
inner core. Amplicons consisting of U1-U2 rDNA fragments from each patient sample, (30
µL (15 µL PCR product and 15 µL 2 gel loading dye)) were loaded appropriately, in
addition to a 28S standard ladder (28 µL (14 µL PCR products of 7 different fungal species
and 14 µL 2 gel loading dye)) were electrophoresed at 70 V constant (Basic PowerPac™,
BIO-RAD) for 17 h, stained with SYBR Green nucleic acid stain I (Invitrogen™), incubated
for 30 min at 75 rpm, (Edmund Bühler, KM-2) and de-stained briefly with dH2O, before
being finally visualised under UV light (BIO-RAD Gel Doc 2000 system and Quantity One
software (v. 4.6.6)). Hard copies of the fungal community DGGE profiles in the cross-
sectional patient cohort were generated as previously described.
2.3.8 Bacterial and fungal DGGE profile capture and analysis
Both bacterial and fungal DGGE profiles generated were first captured in the Quantity
One software (v. 4.6.6) program, cropped appropriately and then copied. These copied
DGGE profiles were then exported as TIFF (tagged image file format) picture files at 276
dots per inch (DPI) resolution and subsequently imported into TotalLab’s Phoretix 1D
(TotalLab Ltd.) via a new experimentation file being created. All DGGE profiles imported
were subsequently converted into the inverted version of the DGGE profiles, thus
measurements were all subsequently inverted. Processing of both the bacterial and fungal
DGGE community profiles firstly involved the creation of lanes and appropriate framing
before suitable adjustment to compensate for inter-gel variance effects such as lane bending.
Once these changes were implemented and accepted, background detection was removed
from the DGGE profiles using the rolling ball software algorithm (100 pixel radius) in
Phoretix 1D. Detection of bands in gels was performed using the automatic detection
algorithm, before bands and gel artefacts were either removed or added manually by eye;
band width was also assessed and adjusted manually by eye.
50
Inter-gel alignment was achieved by executing both 16S and 28S SLs for bacterial and
fungal community detection, important in relative front (Rf) calibration function
(Tourlomousis et al., 2010). Comprising of 16S and 28S rRNA gene amplicons derived from
pure cultures of selected relevant species, these served as internal markers in which all lanes
were aligned relative to. Lane alignment was manually created and adjusted by the
assignment of standard Rf values for the most reproducible bands (in particular the 16S SL)
present in the standard ladders based upon migration distance through gel as these were
approximately the same between gels analysed. Both 16S and 28S standard ladders contained
> 5 reference bands throughout entire patient cohort analysis and for inter-gel alignment this
has been suggested for accurate interpolation of multiple gels (Tourlomousis et al., 2010).
The Rf lines created were then manipulated to correct for common inter-gel effects such as
‘smiling’ and ‘leaning’. Once accomplished, the current Phoretix 1D experiment was saved
and closed.
Using TotalLab’s Phoretix 1D Pro program, a database was created in which all of the
previously analysed DGGE profiles in Phoretix 1D were subsequently added to this database.
Alignment of all gels was first validated by eye and then using the compare lanes software
algorithm tool. Once alignment of gels was visually accepted, all gels and their respective
standard ladders were matched using the match gel function in Phoretix 1D Pro. Following
this, an automatic DGGE band matrix was then created using the Rf values and relative
intensities of all detected bands in the experimental file. Both band presence and relative
intensities were exported to Microsoft® Excel™ for further statistical and ecological
analysis. The exported band presence matrix was directly utilised for the species richness in
patient cohort (see below). The relative band intensities were normalised as previously
described in section 2.1.6.1 (DGGE profile capture and analysis).
2.3.9 Ecological analysis inferred from DGGE profiling
Examination of the structure of the bacterial communities present in the sputum samples
analysed by DGGE was performed. Biodiversity measures such as species richness (R) (the
number of taxa present), evenness (J′) (the proportion contributed to the community by each
taxa), and Shannon diversity (H′) (a diversity index giving a measure of both species numbers
and the evenness of their abundance), were calculated using the exported DGGE band matrix
in Microsoft® Excel™. Note that fungal biodiversity measures could not be carried out due

51
to scarce detection in patient cohort (only three fungal taxa in whole cohort). The H′ derived
from the normalised band values in Excel™ has been previously described in section 2.1.6.2
(Shannon diversity index derivation). This was conducted for the entire patient cohort
analysed by DGGE and the bacterial community profiles generated. The J′ was also derived
once the H′ was calculated, executed by the following formula:
( )
Where J′ is the species evenness derived from the natural logarithm (ln) of the sum of the
species richness (R) value per lane divided by the H′ of that particular lane.
2.3.9.1 Raup-Crick similarity index
The Raup-Crick similarity index was used to assess if the bacterial communities present in
each patient were non-randomly (P = 0.05 ≤ or ≥ 0.95) or stochastically (P = > 0.05 and <
0.95) assembled using the PAST software program in which the probabilities were calculated
by 200 pair-wise Monte Carlo simulations (Hammer and Harper, 2001).
2.3.10 Ordination analyses by Canoco
Matrices derived from the normalisation of the band relative intensities were subjected to
ordination analyses by using the Canoco (v. 4.5.1) software package with ordination plots
being generated by CanoDraw (v. 4.14). In Microsoft® Excel™, normalised band matrices
were copied onto the clipboard before being transposed into a data file format suitable for
Canoco using the WCanoImp (v. 4.5.2.0) plug-in. Environmental variables such as patient
phenotypic data (age, gender, current colomycin and azithromycin therapy, etc.) were
assigned either contiguous values (e.g., age, FEV1% predicted) or a binary system to denote
indiscreet variables (positive values = 1; negative values = 0).
Band matrices were firstly analysed by detrended correspondence analysis (DCA) in
Canoco to determine 1° axis length, used to ascertain what appropriate ordination analysis to
use. If 1° axis length was < 3 SD (standard deviation units of species turnover) a redundancy
analysis (RDA; a constrained linear ordination method) was executed as opposed to > 3 SD
in which canonical correspondence analysis (CCA (a constrained unimodel ordination
method)) was chosen instead. Statistical analysis of both the bacterial community, discreet
and indiscreet variables was performed using full model Monte Carlo testing (499

52
permutations) with significant factors identified if P-values were < 0.05 and not significant if
P = > 0.05. Following analysis, analysed data was then imported into CanoDraw for
generation of ordination plots containing samples (patient subject number) and environmental
factors. Ambiguity between discreet and indiscreet variables was solved by assigning discreet
factors with centroids whereas contiguous variables were represented by an arrow. Patient
samples analysed by DGGE, i.e, the normalised band matrices plotted, could be denoted by
different shapes and colours in CanoDraw for clarity if deemed necessary. Ordination
analyses of the bacterial profiles, derived from the initial DGGE analysis seek to represent
the similarity between the bacterial communities from each sample. Profiles that have a
similar community structure and composition group more closely together. Constrained
unimodel (canonical) analyses show variation between the sample profiles that can be
explained by the measured categorical and continuous environmental variables (ter Braak and
Šmilauer, 2002).
2.4 Molecular fingerprinting and metagenomic analysis in a chronic
obstructive pulmonary disease cohort
2.4.1 Sampling methodology and ethical considerations within patient
cohort
Eleven clinically stable patients (App. 5), comprised of smokers and ex-smokers with
GOLD (Global Initiative for Chronic Obstructive Lung Disease) stages II and III of chronic
obstructive pulmonary disease (COPD) attended a routine clinic at the Freeman Hospital,
Newcastle upon Tyne, to undergo bronchoscopy, in which a bronchoalveloar lavage (BAL)
fluid was produced (except in one patient, where bronchial secretion (BS) fluids were
obtained instead due to difficulty of BAL fluid extraction). The BAL and BS fluids were then
processed for conventional microbiology testing in the Microbiology Department at the
Freeman Hospital, Newcastle upon Tyne, under Health Protection Agency protocols (SOP in
App. 4), where the remaining aliquots of clinical specimen fluids were stored at -80 °C prior
to microbial gDNA extraction. Ethical approval for this study was granted by Northumbria
University’s School of Life Sciences Research Ethics Committee and Newcastle upon Tyne
Hospitals NHS Foundation Trust.
53
2.4.2 DNA extraction from bronchoalveolar lavage and bronchial
secretion fluid clinical samples
Microbial gDNA extraction from BAL and BS fluid samples was achieved using an
UltraClean® Microbial DNA Isolation Kit (MO BIO Laboratories, Inc.) in a Microflow
Peroxide Advanced Bio Safety Cabinet (Class I) at the Freeman Hospital, Microbiology
Department, Newcastle upon Tyne with amendments to the kit protocol. All fluid samples (<
5 mL in volume) contained in a 25 mL plastic universal were thawed thoroughly and then
vortexed (Vortex-Genie2™) rigorously with addition of an equal volume of sputolysin
(added only to slightly purulent fluid samples to aid in breakage of any mucus plugs present
and enabling passage of the supernatant through the 0.22 µm filter (in later stages of this
procedure)). Both the BAL and BS fluid samples were then centrifuged at 3000 g for 10
min at room temperature (CENTAUR, P20075 rota) before the supernatant was decanted
carefully and the cellular pellet resuspended in 300 µL of MicroBead Solution within the 25
mL universal tube. This was gently vortexed and 500 µL of this mix was then transferred to a
MicroBead Tube in which 50 µL of MD1 solution was added.
The MicroBead Tubes were then secured horizontally using the MO BIO Vortex Adaptor
tube holder and vortexed at maximum speed for 10 min before being spun down at 10 000
g (SIGMA® 12094 rotor) at room temperature for 1 min in a microcentrifuge (SIGMA®).
The supernatant was then transferred to a clean, sterile 2 mL Collection Tube with ~ 300-350
µL of supernatant present. One hundred µL of Solution MD2 was then added to the
supernatant and vortexed for 5 s and then incubated at 4 °C for 5 min. Following this
incubation step, the 2 mL Collection Tubes were then centrifuged at 10 000 g for 1 min at
room temperature. A 2 mL syringe (BD) was attached to a filter (PALL Gelman Laboratory,
Acrodisc® Syringe Filter, 0.2 µm Supor® membrane, non-pyrogenic) and the syringe
plunger removed and placed to one side. The entire supernatant medium from the 2 mL
Collection Tube was then transferred to the empty syringe vial and filter-sterilised, via re-
attachment of the syringe plunger into the syringe vial, by pushing the supernatant through
the 0.2 µm filter into another clean, sterile 2 mL Collection Tube. As previously described,
this filter-sterilisation process was an extra step introduced into the gDNA extraction
procedure to circumvent possible exposure to any tubercular agents that may have been
present in the clinical sample. Less than 300 µL of supernatant volume should have been
dispensed from the filter, although this varied due to the amount of BAL and BS fluids
54
originating from the 25 mL universal tube. Syringe and filter apparatus were discarded after
use and only used once.
Nine hundred µL of shaken and mixed Solution MD3 was then added to the filtered
supernatant, vortexed for 5 s, before 750 µL of this mixture was added to a Spin Filter before
being initially centrifuged at 10 000 g for 1 min at room temperature. Any flow through
liquid was discarded and the remaining supernatant was added to the Spin Filter and
centrifuged again at 10 000 g for 1 min at room temperature. All flow through liquid was
discarded. Three hundred µL of Solution MD4 was then added to the Spin Filter before being
centrifuged at 10 000 g for 1 min at room temperature. Again, any flow through liquid was
discarded and the Spin Filter was centrifuged at 10 000 g for 1 min at room temperature.
The spin filter basket was removed and the Spin Filter was placed into a new 2 mL Collection
Tube in which 50 µL of Solution MD5 was pipetted directly into the centre of the white filter
membrane. A final centrifugation at 10 000 g at room temperature for 1 min was required
to release the gDNA (50 µL in volume) from the filter membrane. Following this, the Spin
Filter itself was discarded and the eluted gDNA from the BAL and BS samples was stored at
-80 °C prior to downstream processing.
2.4.3 ‘Semi-nested’ bacterial community detection PCR in BAL and BS
fluid samples
As previously described in the nCFBR materials and methods sections, the bacterial
community in the eleven COPD patients enrolled was amplified using Ex Taq™ HS pol
(TAKARA BIO INC.). Primers V3F-GC (5′-CGC CCG CCG CGC GCG GCG GGC GGG
GCG GGG GCA CGG GGG GCC TAC GGG AGG CAG CAG-3′) and V3R (5′- ATT ACC
GCG GCT GCT GG-3′) targeted the V3 hypervariable region of the 16S rRNA gene resulting
in the enzymatic amplification of V3 rDNA amplicons using extracted gDNA as template as
previously shown (Muyzer et al., 1993). As before, the forward primer V3F-GC had a 40-bp
GC-rich nucleotide sequence attached to its 5′ end enabling greater detection of variances in
bacterial gDNA within the V3 rDNA amplicons and PCR fragment stability when analysed
by DGGE (Sheffield et al., 1989).
An automatic HS and touchdown PCR protocol was performed on a Mastercycler
gradient (Eppendorf) with the PCR reagents per reaction added as follows: 0.5 µM primers
(both forward (V3F-GC) and reverse (V3R)), 1 Ex Taq Buffer (TAKARA BIO INC.), 0.2

55
mM each dNTP (TAKARA BIO INC.), 1 mM MgCl2, 10 µg/µL BSA (Promega), 1.25 U Ex
Taq™ HS pol and 1 µL of gDNA template made up to a total volume of 50 µL with sterile
18.2 MΩ H2O (MILLIPORE, Direct-Q™ Ultra Pure Water Systems, MILLIPAK® 0.22 µm
filter). Positive (extracted gDNA from a pure culture of H. influenzae, NCTC no. 11931) and
negative controls were also set up to determine the correct size of the V3 rDNA fragments
and to rule out any environmental DNA contamination. Samples were incubated for 5 min at
97 °C releasing antibody bound polymerase Ex Taq™ HS, then at 96 °C for 1 min, 65 °C for
1 min, with a reduction of 0.5 °C per cycle until touchdown at 55 °C. Primer extension lasted
for 30 s at 72 °C and this was repeated for 20 cycles. An additional fifteen cycles was carried
out at 94 °C for 1 min, 55 °C for 1 min, 72 °C for 3 min and a final extension time of 72 °C
for 30 min. Following this completed reaction, the V3 rDNA amplicons were then used as
DNA template for a second round of bacterial community amplification with exactly the
same concentrations and conditions outlined above (a ‘semi-nested’ approach). As previously
described, implementation of both a touchdown protocol and a longer final extension time
was executed to circumvent spurious PCR product and double band formation bias on DGGE
analyses (Don et al., 1991, Janse et al., 2004). These implementations were also executed on
the consecutive round of PCR when the V3 rDNA fragments were utilised as template.
2.4.4 ‘Semi-nested’ fungal community detection PCR in BAL and BS fluid
samples
As in the cross-sectional nCFBR patient cohorts, community fungal PCR on a
Mastercycler gradient (Eppendorf) was also performed in addition to universal bacterial
community detection. PCR primers specific for the amplification of variable regions within
the 28S rRNA gene ubiquitous in the fungal genome were utilized as shown previously
(Sandhu et al., 1995). PCR using the U1F (5′-GTG AAA TTG TTG AAA GGG AA-3′) and
U2R-GC (5′-CGC CCG CCG CGC GCG GCG GGC GGG GCG GGG GCA CGG-3′) primer
sets were executed, in addition to Ex Taq™ HS pol (TAKARA BIO INC.) to enzymatically
amplify small segments of 28S rDNA (U1-U2 rDNA fragments).
PCR reagents for this reaction were added as follows: 0.5 µM primers (both forward
(U1F) and reverse (U2R-GC)), 1 Ex Taq Buffer (TAKARA BIO INC.), 0.2 mM each dNTP
(TAKARA BIO INC.), 1 mM MgCl2, 10 µg/µL BSA (Promega), 1.25 U Ex Taq™ HS and 1
µL of gDNA template made up to a total volume of 50 µL with sterile 18.2 MΩ H2O

56
(MILLIPORE, Direct-Q™ Ultra Pure Water Systems, MILLIPAK® 0.22 µm filter). An
automatic HS and touchdown PCR protocol was utilised in which the conditions were an
initial denaturation step of 97 °C for 5 min, 94 °C for 1 min, 60 °C for 1 min with a reduction
of 1.0 °C per cycle reaching touchdown at 50 °C and 72 °C for 1 min repeated for 10 cycles.
An additional 25 cycles were performed at 94 °C for 3 min, 50 °C for 1 min, and 72 °C for 1
min. As previously introduced, a final extension time at 72 °C for 30 min was implemented
in addition to the touchdown protocol ((Don et al., 1991, Janse et al., 2004). Following this
completed reaction, the U1-U2 rDNA amplicons were then used as DNA template for a
second round of fungal community amplification with exactly the same concentrations and
conditions outlined above (a ‘semi-nested’ approach). Both positive and negative controls
were executed for confirmation of the correct size of the fungal U1-U2 rDNA amplicons
(using extracted gDNA from a pure culture of A. fumigatus) and to rule out any
environmental sources of contamination.
2.4.5 Agarose gel electrophoresis of both V3 and U1-U2 rDNA amplicons
from BAL and BS fluid samples
Amplicons generated from bacterial and fungal community PCR from BAL and BS fluid
samples were validated for positive amplification of their respective 16S and 28S rRNA gene
segments by running out PCR fragments on an agarose gel (1 % (w/v) and electrophoresing at
120 mA constant for 20 min (BIO-RAD, Basic PowerPac™). The agarose gel was stained
with SYBR® Safe DNA gel stain (10 000 concentrate in DMSO) (Invitrogen™) prior to
use for visualisation under UV light. Five µL of PCR product, 2 µL 6× BPB, and 5 µL 18.2
MΩ H2O (MILLIPORE, Direct-Q™ Ultra Pure Water Systems, MILLIPAK® 0.22 µm filter)
were mixed by trituration before a final volume of 10 µL was loaded into the appropriate gel
well, in addition to 5 µL of Hyperladder 1 (BIOLINE). Using a BIO-RAD Gel Doc 2000
system and Quantity One software (v. 4.6.6) comparison of the molecular base pair markers
in Hyperladder I (BIOLINE), in addition to the positive control, confirmed the correct sizes
of both types of amplicons; i.e., V3 and U1-U2 rDNA fragments (233 bp and 300 bp in size
respectively). Hard copies of the electropherograms were generated using a Mitsubishi Video
copy processor (model P91 attached to the Gel Doc 2000 system).

57
2.4.6 Molecular fingerprinting of the bacterial and fungal community
within BAL and BS fluid samples
2.4.6.1 DGGE of V3 rDNA amplicons from BAL and BS fluid samples
Bacterial molecular fingerprinting within the BAL and BS clinical samples was carried out
using DGGE as previously described on a DCode™ Universal Mutation Detection System
(BIO-RAD) on a 32.5-60 % denaturing gradient (12 % acrylamide/bis-acrylamide of gel
percentage). Amplicons from all 11 patients in addition to a 16S SL consisting both of V3
rDNA fragments were loaded appropriately into wells; 30 µL (15 µL PCR product and 15 µL
2 gel loading dye) and 36 µL (18 µL PCR products of 9 different bacterial species (see
above) and 18 µL 2 gel loading dye) respectively. PCR fragments were electrophoresed for
4.5 h at 200 V constant (Basic PowerPac™, BIO-RAD), stained with SYBR Green nucleic
acid stain I (Invitrogen™) and incubated for 30 min at 75 rpm (Edmund Bühler, KM-2), de-
stained briefly with dH2O, before being finally visualised under UV light (BIO-RAD Gel Doc
2000 system and Quantity One software (v. 4.6.6)). A hard copy of the bacterial community
DGGE profile in this particular patient cohort was also generated (Mitsubishi Video copy
processor (model P91) attached to the Gel Doc 2000 system).
2.4.6.2 DGGE of U1-U2 rDNA amplicons from BAL and BS fluid samples
Fungal community analysis of COPD cohort was performed using the DCode™ Universal
Mutation Detection System (BIO-RAD) on a 40-60 % denaturing gradient (12 %
acrylamide/bis-acylamide of gel percentage). As before, all eleven patient amplicons (30 µL
(15 µL PCR product and 15 µL 2 gel loading dye)) were loaded appropriately, in addition
to a 28S SL (28 µL (14 µL PCR products of 7 different fungal species (see above) and 14 µL
2 gel loading dye)). Electrophoresis of U1-U2 rDNA amplicons was executed at 70 V
constant (Basic PowerPac™, BIO-RAD) for 17 h, stained with SYBR Green nucleic acid
stain I (Invitrogen™) and incubated for 30 min at 75 rpm, (Edmund Bühler, KM-2) de-
stained briefly with dH2O, before being finally visualised under UV light (BIO-RAD Gel Doc
2000 system and Quantity One software (v. 4.6.6)). A hard copy of the fungal community
DGGE profile in the COPD patient cohort was also generated (Mitsubishi Video copy
processor (model P91) attached to the Gel Doc 2000 system).
58
2.4.7 Metagenomic analysis of BAL and BS fluid samples
Extraction of gDNA from both BAL and BS fluid samples yielded 50 µL of eluted gDNA,
20 µL of which was sent to Research and Testing Laboratories (RTL) LLC. (Lubbock, Texas,
U.S.) for 454-pyrosequencing generating the metagenomic data within patient cohort. The
bacterial tag-encoded FLX-Titanium amplicon pyrosequencing (bTEFAP) method targeted
the V3-V5 hypervariable regions of the 16S rRNA gene creating amplicon libraries (Dowd et
al., 2008). Primer sets corresponded to 341F (5′-CC TAC GGG AGG CAG CAG-3′) and
907R (5′-CC GTC AAT TCC TTT GAG TTT-3′) co-ordinates of the reference E. coli 16S
rRNA gene in addition to sample nucleotide bar codes. Roche A & B primers were then
implemented to perform pyrosequencing by established methods (Dowd et al., 2008).
Resulting 16S pyroamplicon sequences were then pre-processed and aligned using the
SILVA reference alignment database, before being trimmed and eliminated for chimeras as
previously described (Costello et al., 2009) in the open-source, platform-independent,
community-supported software program mother (http://www.mothur.org) (Schloss et al.,
2009). The processed 16S pyroamplicon reads were then subsequently analysed and assigned
OTUs with a 3 % cutoff with further analysis of the metagenomic data following the Costello
Stool Analysis example (http://www.mothur.org/wiki/Costello_stool_analysis).
2.4.8 Statistical and ecological analysis of COPD patient cohort
From both the PCR-DGGE and metagenomic profiles generated, these were analysed
using Canoco for Windows (v.4.5.1) with the ordination plots displayed in CanoDraw (v.
4.14). Band and metagenomic matrices data was transposed into a suitable format for Canoco
for Windows using WCanoImp (v. 4.5.2.0) plug-in and ordination plots and subsequent
analysis was performed as previously described in section 2.3.10 (Ordination analyses by
Canoco).

59
Chapter Three: DNA polymerase enzymes and microbial diversity
3.1 Abstract
Molecular fingerprinting techniques such as denaturing gradient gel electrophoresis
(DGGE) enable the analysis of microbial communities in a variety of environments.
However, a ‘gold standard’ DNA polymerase (pol) enzyme used to determine the microbial
diversity in any given sample type is yet to be established. Reviewing the current literature,
five DNA polymerase enzymes, Platinum® Pfx (Invitrogen™
), TaKaRa Ex Taq™ Hot Start
(TAKARA BIO INC.), AmpliTaq® (Applied Biosystems™), GoTaq® Hot Start Polymerase
(Promega), and Taq (New England BioLabs®, Inc.) have all been widely utilised to study
microbial diversity from a variety of different environments. These five DNA pol enzymes
were assessed to determine the microbial diversity generated in sandy soil taken from dunes
on Longsands Beach, Tynemouth, North East England. Using DNA extraction to obtain
genomic DNA (gDNA) from sandy soil, the variable V3 region of the 16S rRNA gene was
amplified with the five DNA pol using PCR conditions set out by the manufacturer’s
recommendations for each enzyme. The PCR products from all five DNA pol reactions were
compared by DGGE and multivariate analysis to determine the similarity of the profiles. Data
strongly suggests that Platinum® Pfx and TaKaRa Ex Taq™ Hot Start detected greater
microbial diversity present within sandy soil than the other DNA pol enzymes employed.
3.2 Background
Since the origins of life on Earth, polynucleotide pols exhibited the first signs of
enzymatic activity early in the course of evolution; if absent, accurate and efficient genome
replication would not have occurred, thus preventing the pre-requisites of evolution itself
(Steitz, 1999). Evidently, accurate processing of genetic information in all organisms from
parent to offspring is an absolutely essential process if the preservation and survival of all
species is to continue; however, a critical step in species continuity is the tolerances in base-
pair mutation rates occurring over time, but providing life with an evolutionary selective
advantage over other species (Perler et al., 1996). This preservation of the Watson-Crick
structure in DNA during replication and repair is performed by DNA pol enzymes (Beard and

60
Wilson, 2003), a ubiquitous family of enzymes that are composed of functionally distinct
domains and subdomains (Steitz, 1999). Characteristics of the DNA pol enzymes are often
described as having a broad structural homology to that of the right hand, with “thumb”,
“palm” and “fingers” sub-domains, all a common structural theme (Kohlstaedt et al., 1992).
These enzymes can be further divided into several distinct families deduced from the
structural homologies displayed from crystallographic studies and amino acid sequences in
which the DNA pol families A, B, C, D, X and Y have all been characterised (Bebenek and
Kunkel, 2004, Delarue et al., 1990, Joyce and Steitz, 1994). The best known and the most
intensively studied is the DNA pols from the A family which include DNA pol I and Klenow
fragments (a truncated version of this enzyme, which includes the C-terminal portion,
containing the 3′ → 5′-exonuclease and pol domains) isolated from Escherichia coli and
Bacillus DNA pol I in which the crystal structures of the above have been previously
published (Ollis et al., 1985, Beese et al., 1993, Kiefer et al., 1998). Different DNA pol
families exhibit general functions: (i), families B, C, and D and their respective DNA pols
appear to be involved in chromosomal replication, (ii), A and B families exclusively promote
the replication of DNA in viruses and bacteriophages, and (iii), DNA repair mechanisms are
incorporated in all six families (Pavlov et al., 2004).
Structurally homologous to all DNA pol families is the palm sub-domain ― the X family
is unusual in that the DNA pol enzymes are described as being “left handed” and thus not
homologous with the other families above (Steitz et al., 1994, Beard and Wilson, 2000) ―
whereas across all DNA pol families, the finger and thumb domains differ in structure
(Brautigam and Steitz, 1998). The palm sub-domain provides the catalytic action necessary
for the addition of nucleotides via three catalytic residues that co-ordinate with two essential
divalent metal ions that assist in the nucleotidyl transferase reaction (Steitz et al., 1994). The
acquisition of two magnesium (Mg2+
) cations is critical in the accurate synthesis of DNA,
however, manganese (Mn2+
) cations can be implemented as opposed to Mg2+
ions resulting in
an increase in synthesising error rate during DNA replication but enabling numerous DNA
pols to use RNA template as an alternative to DNA (Pavlov et al., 2004). Despite all of these
differences in their tertiary structures, DNA pols all operate and synthesise new nucleotides
via a standard catalysed reaction in which the addition of a nucleotide is added to the 3′-end
of a DNA primer.
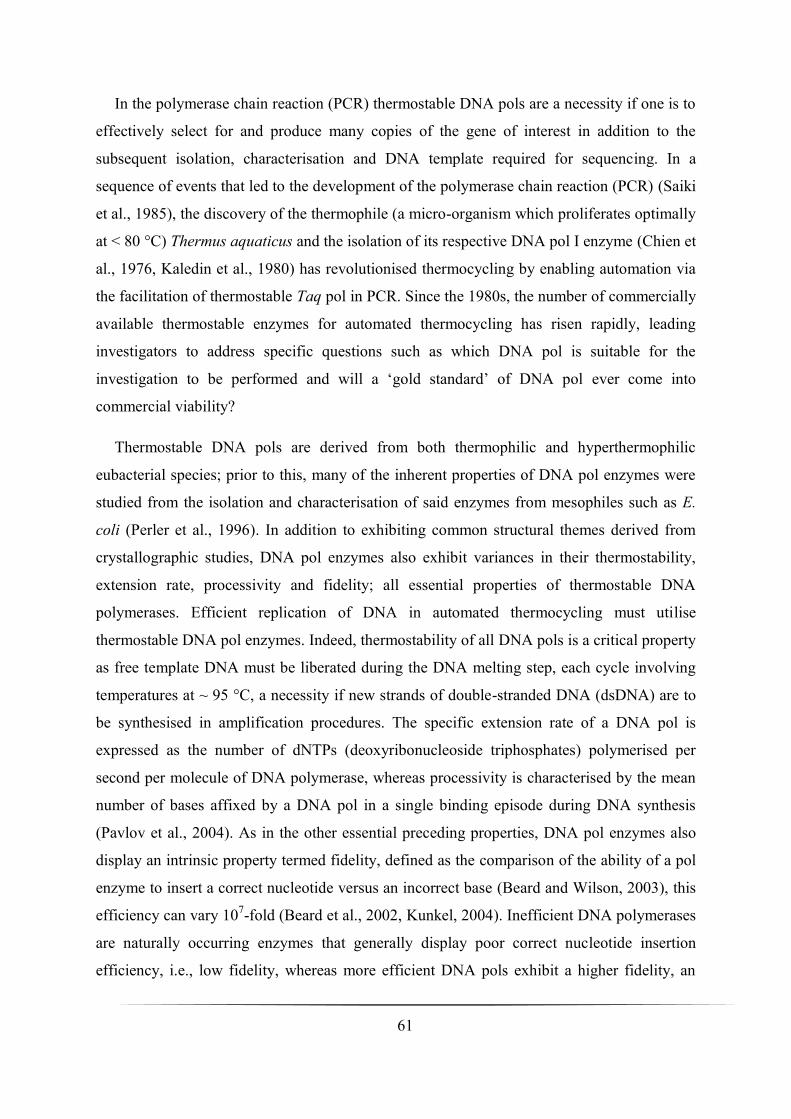
61
In the polymerase chain reaction (PCR) thermostable DNA pols are a necessity if one is to
effectively select for and produce many copies of the gene of interest in addition to the
subsequent isolation, characterisation and DNA template required for sequencing. In a
sequence of events that led to the development of the polymerase chain reaction (PCR) (Saiki
et al., 1985), the discovery of the thermophile (a micro-organism which proliferates optimally
at < 80 °C) Thermus aquaticus and the isolation of its respective DNA pol I enzyme (Chien et
al., 1976, Kaledin et al., 1980) has revolutionised thermocycling by enabling automation via
the facilitation of thermostable Taq pol in PCR. Since the 1980s, the number of commercially
available thermostable enzymes for automated thermocycling has risen rapidly, leading
investigators to address specific questions such as which DNA pol is suitable for the
investigation to be performed and will a ‘gold standard’ of DNA pol ever come into
commercial viability?
Thermostable DNA pols are derived from both thermophilic and hyperthermophilic
eubacterial species; prior to this, many of the inherent properties of DNA pol enzymes were
studied from the isolation and characterisation of said enzymes from mesophiles such as E.
coli (Perler et al., 1996). In addition to exhibiting common structural themes derived from
crystallographic studies, DNA pol enzymes also exhibit variances in their thermostability,
extension rate, processivity and fidelity; all essential properties of thermostable DNA
polymerases. Efficient replication of DNA in automated thermocycling must utilise
thermostable DNA pol enzymes. Indeed, thermostability of all DNA pols is a critical property
as free template DNA must be liberated during the DNA melting step, each cycle involving
temperatures at ~ 95 °C, a necessity if new strands of double-stranded DNA (dsDNA) are to
be synthesised in amplification procedures. The specific extension rate of a DNA pol is
expressed as the number of dNTPs (deoxyribonucleoside triphosphates) polymerised per
second per molecule of DNA polymerase, whereas processivity is characterised by the mean
number of bases affixed by a DNA pol in a single binding episode during DNA synthesis
(Pavlov et al., 2004). As in the other essential preceding properties, DNA pol enzymes also
display an intrinsic property termed fidelity, defined as the comparison of the ability of a pol
enzyme to insert a correct nucleotide versus an incorrect base (Beard and Wilson, 2003), this
efficiency can vary 107-fold (Beard et al., 2002, Kunkel, 2004). Inefficient DNA polymerases
are naturally occurring enzymes that generally display poor correct nucleotide insertion
efficiency, i.e., low fidelity, whereas more efficient DNA pols exhibit a higher fidelity, an

62
increased capacity for correct base insertion during DNA replication and other mechanisms
(Beard and Wilson, 2003).
As previously stated, the inherent microbial diversity within Earth’s biosphere is vast. Due
to the limitations in using culture-dependent techniques and the ‘great plate count anomaly’ a
paradigm was created in that an incomprehensible amount of bacteria are uncultivable and
are therefore alluded to us (Amman et al., 1995, Rappé and Giovannoni, 2003, Staley and
Konopka, 1985). However, in the last two decades culture-independent methodologies
encompassing molecular fingerprinting techniques such as DGGE have emerged to provide
investigators with powerful tools for discerning the many microbial communities that
comprise the biosphere. Microbial communities have been identified and characterised from
an extensive number of dissimilar natural habitats, not only around us, but also within us
(Postec et al., 2005, Fujimoto et al., 2003, Vitali et al., 2007, Brakstad et al., 2008, Edenborn
and Sexstone, 2007, van de Wiele et al., 2004).
In terms of the other molecular fingerprinting methods briefly elaborated on, DGGE is one
of the most established culture-independent techniques used in molecular microbial ecology
studies (Muyzer and Smalla, 1998) as for most laboratories the initial implementation and
cost-effectiveness of next generation sequencing (NGS) platforms is too high. Operating on
principles and modifications since 1983 when it was first introduced (Fischer and Lerman,
1983); small PCR fragments (~ 200-700 base pairs (bp)) are amplified from variable regions
within the 16S rRNA gene representing members from the bacterial community.
Amplification of these variable regions (e.g., the V3 region yielding V3 rDNA fragments) is
usually performed by universal PCR primers resulting in amplicons of approximately the
same length, thus, PCR products analysed by DGGE cannot be separated on traditional
agarose or non-denaturing acrylamide gels. The bacterial community produced from the pool
of V3 rDNA amplicons from extracted total gDNA in either environmental or clinical
samples are separated out on a linear chemical denaturing gradient (urea and formamide)
embedded within an acrylamide gel matrix according to genome fragment base-composition,
i.e., guanine (G) and cytosine (C) content (Hovig et al., 1991) and a decrease in the
electrophoretic mobility of the partially melted dsDNA molecules (Muyzer, 1999).
Differential migration of these heterogeneous PCR amplicons containing gDNA sequence
variation is achieved by the amount of denaturant in the gradient and the dissociation of the

63
two DNA strands containing differences in the number of hydrogen (H) bonds between the
complementary nucleotides binding the DNA strands together; i.e., three H bonds bind G and
C, as opposed to adenine (A) and thymine (T) which only contain two H bonds (Nakatsu,
2007). Thus, PCR fragments containing a greater amount of GC-rich amplicons will take
longer to denature and dissociate migrating towards the bottom of the gradient in which the
partial melting point of these GC-rich DNA fragments is reached, whereas AT-rich DNA
sequences will migrate towards the top of the denaturant gradient. Once this partial melting
temperature has been achieved, the DNA fragments can no longer migrate through the
denaturing gradient and are immobilised because of the transition of the DNA macromolecule
from a helical to partially melted structure, thus dsDNA sequence variation is not only
separated out by GC-content, but also variations in the partial melting temperatures thus
affecting dissimilar immobilisation points within the linear denaturing gradient of the PCR
amplicons analysed (Muyzer and Smalla, 1998). Further to this, the attachment of a GC-
clamp (a GC-rich nucleotide sequence) to the 5′-end of one of the universal primers can
facilitate greater detection of sequence variants within the community being analysed as this
increases PCR fragment stability as it migrates through the denaturing gradient, increasing
the melting temperature, thus preventing complete dissociation of the dsDNA into single-
stranded DNA (ssDNA) (Muyzer and Smalla, 1998). Attachment of a GC-clamp in PCR-
DGGE mediated studies in microbial ecology studies under optimum running conditions in
DGGE can result in the detection of ~ 100 % of sequence variants within the microbial
community in DNA fragments ≤ 500 bp in size (Sheffield et al., 1989, Myers et al., 1985).
Thus DGGE can represent a global ‘snapshot’ of the microbial population structure and
diversity analysed by said technique (Nakatsu, 2007) from when it was first introduced to
study bacterial communities in soil (Muyzer et al., 1993).
In PCR-DGGE mediated studies of environmental samples and indeed human clinical
samples, a variety of thermostable DNA polymerases are utilised in order to ascertain the
microbial communities present. In this study, five DNA pols were assessed to analyse the
bacterial communities in sandy soil obtained from dunes on Longsands Beach, Tynemouth,
North East England. These were, AmpliTaq® (Applied Biosystems™), GoTaq® Hot Start
Polymerase (Promega), Platinum® Pfx (Invitrogen™
), TaKaRa Ex Taq™ Hot Start
(TAKARA BIO INC.), and Taq (New England BioLabs®, Inc.). All of the thermostable
DNA polymerases used in this study were originally isolated from strains of T. aquaticus
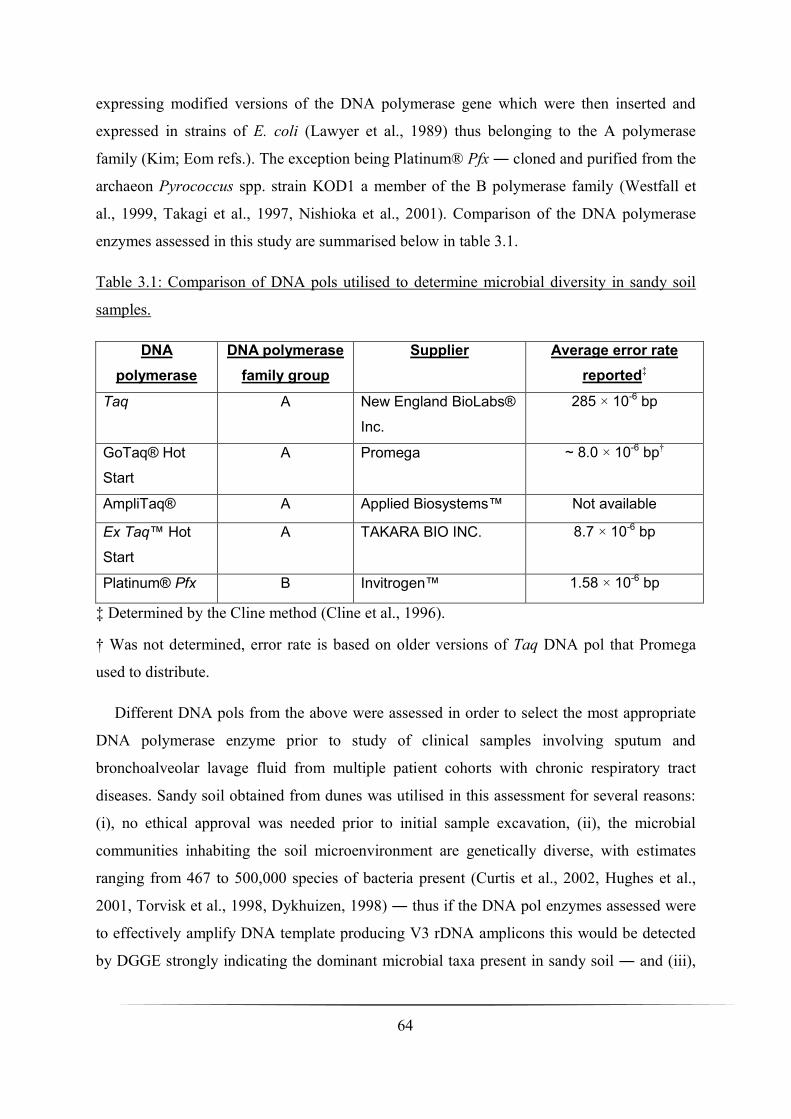
64
expressing modified versions of the DNA polymerase gene which were then inserted and
expressed in strains of E. coli (Lawyer et al., 1989) thus belonging to the A polymerase
family (Kim; Eom refs.). The exception being Platinum® Pfx ― cloned and purified from the
archaeon Pyrococcus spp. strain KOD1 a member of the B polymerase family (Westfall et
al., 1999, Takagi et al., 1997, Nishioka et al., 2001). Comparison of the DNA polymerase
enzymes assessed in this study are summarised below in table 3.1.
Table 3.1: Comparison of DNA pols utilised to determine microbial diversity in sandy soil
samples.
DNA
polymerase
DNA polymerase
family group
Supplier Average error rate
reported‡
Taq A New England BioLabs®
Inc.
285 × 10-6 bp
GoTaq® Hot
Start
A Promega ~ 8.0 × 10⁻⁶ bp†
AmpliTaq® A Applied Biosystems™ Not available
Ex Taq™ Hot
Start
A TAKARA BIO INC. 8.7 × 10⁻⁶ bp
Platinum® Pfx B Invitrogen™ 1.58 × 10⁻⁶ bp
‡ Determined by the Cline method (Cline et al., 1996).
† Was not determined, error rate is based on older versions of Taq DNA pol that Promega
used to distribute.
Different DNA pols from the above were assessed in order to select the most appropriate
DNA polymerase enzyme prior to study of clinical samples involving sputum and
bronchoalveolar lavage fluid from multiple patient cohorts with chronic respiratory tract
diseases. Sandy soil obtained from dunes was utilised in this assessment for several reasons:
(i), no ethical approval was needed prior to initial sample excavation, (ii), the microbial
communities inhabiting the soil microenvironment are genetically diverse, with estimates
ranging from 467 to 500,000 species of bacteria present (Curtis et al., 2002, Hughes et al.,
2001, Torvisk et al., 1998, Dykhuizen, 1998) ― thus if the DNA pol enzymes assessed were
to effectively amplify DNA template producing V3 rDNA amplicons this would be detected
by DGGE strongly indicating the dominant microbial taxa present in sandy soil ― and (iii),

65
humic acids consisting of complex polyphenolic compounds produced from the
decomposition of organic matter within soil sediments can strongly inhibit PCR (Tsai and
Olsen, 1992b, Tsai and Olsen, 1992a), sandy soil contains less of these interfering humic
substances due to a relative lack of organic matter content as opposed to agricultural soils.
From here, once the appropriate DGGE profiles were generated, statistical methods were
executed to ascertain if there was a difference within the community generated from the
pooled V3 rDNA fragments amplified in each sandy soil sample analysed by each DNA pol
enzyme employed.
3.3 Results
3.3.1 Optimisation of PCR amplifications
As previously described in Chapter Two, steps were taken to minimise artefacts, spurious
and heteroduplex PCR products (Don et al., 1991, Janse et al., 2004); relief of sample
inhibitors was also implemented (Kreader, 1996). In terms of optimisation of each DNA pol
assessed, both Ex Taq™ HS and GoTaq® HS followed the protocol closely outlined as
previously described (Muyzer et al., 1993) producing the amplifications in figure 3.1A and B.
The only differences between the Ex Taq™ HS and GoTaq® HS PCR experiments were
buffer, dNTP, and MgCl2 concentrations per reaction. Applied Biosystems™ AmpliTaq®
was optimised using an MgCl2 concentration gradient set-up experiment (0.5-2 mM MgCl2),
optimum MgCl2 concentration was 1 mM. However, despite repeated attempts at adjustment
of GeneAmp® Buffer and AmpliTaq® DNA pol volumes in multiple reactions, V3 rDNA
amplification was still poor (figure 3.1C). Taq (New England BioLabs® Inc.) DNA pol was
optimised by slight adjustment to the annealing temperature using a temperature gradient
(ranging from 53-63 °C, optimum annealing temperature was at 55.8 °C) and addition of 5 U
Taq pol instead of 2.5 U. Pfx DNA pol was optimised by the addition of Pfx Enhancer
Solution (Invitrogen™) at 0.5 concentration as opposed to 1 concentration. Final
amplification of V3 rDNA fragments using both Taq and Pfx are shown in figures 3.1D and E
respectively.
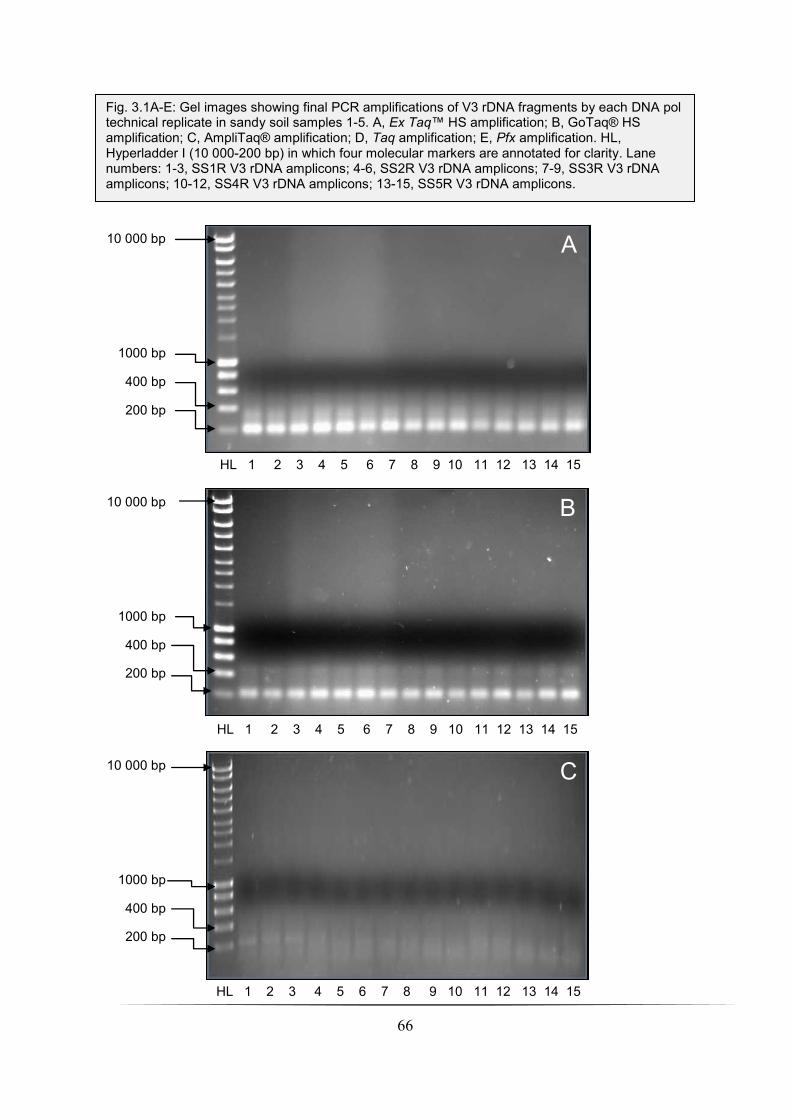
66
B
C
HL 1 2 3 4 5 6 7 8 9 10 11 12 13 14 15
HL 1 2 3 4 5 6 7 8 9 10 11 12 13 14 15
10 000 bp
1000 bp
400 bp
200 bp
10 000 bp
1000 bp
400 bp
200 bp
10 000 bp
1000 bp
400 bp
200 bp
Fig. 3.1A-E: Gel images showing final PCR amplifications of V3 rDNA fragments by each DNA pol technical replicate in sandy soil samples 1-5. A, Ex Taq™ HS amplification; B, GoTaq® HS amplification; C, AmpliTaq® amplification; D, Taq amplification; E, Pfx amplification. HL, Hyperladder I (10 000-200 bp) in which four molecular markers are annotated for clarity. Lane numbers: 1-3, SS1R V3 rDNA amplicons; 4-6, SS2R V3 rDNA amplicons; 7-9, SS3R V3 rDNA amplicons; 10-12, SS4R V3 rDNA amplicons; 13-15, SS5R V3 rDNA amplicons.
A
HL 1 2 3 4 5 6 7 8 9 10 11 12 13 14 15
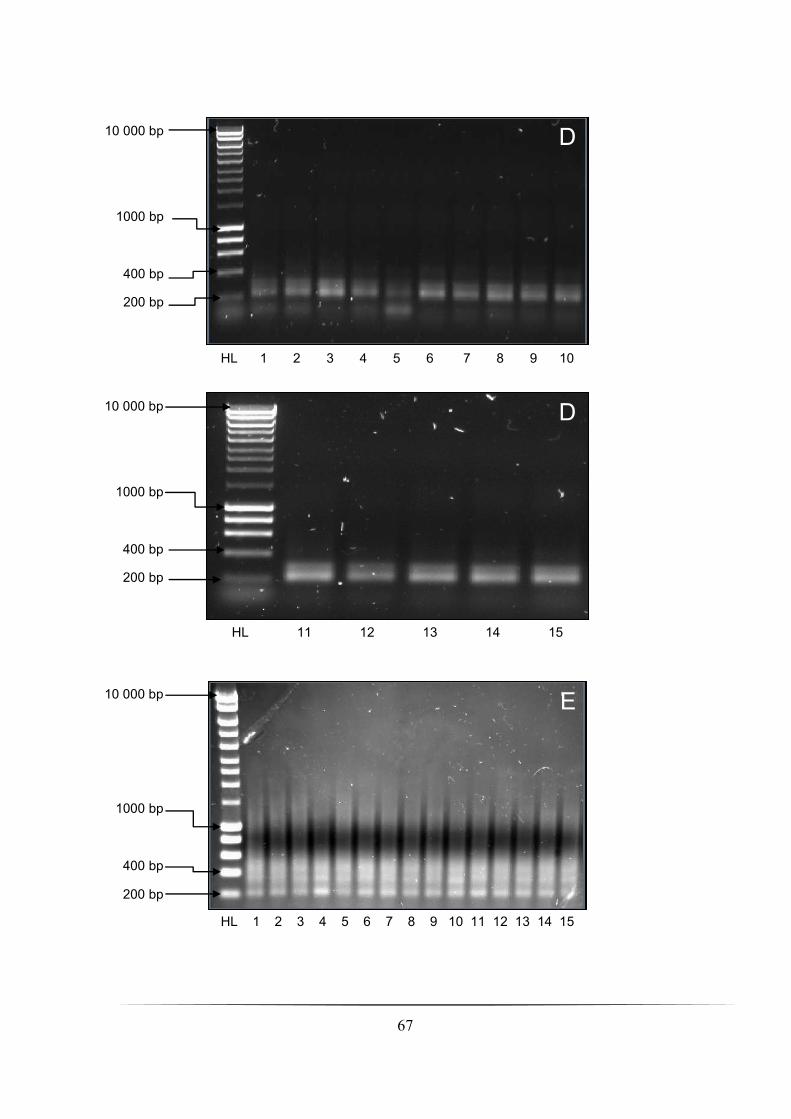
67
D
D
E
HL 1 2 3 4 5 6 7 8 9 10 11 12 13 14 15
HL 11 12 13 14 15
HL 1 2 3 4 5 6 7 8 9 10
10 000 bp
1000 bp
400 bp
200 bp
10 000 bp
1000 bp
400 bp
200 bp
10 000 bp
1000 bp
400 bp
200 bp
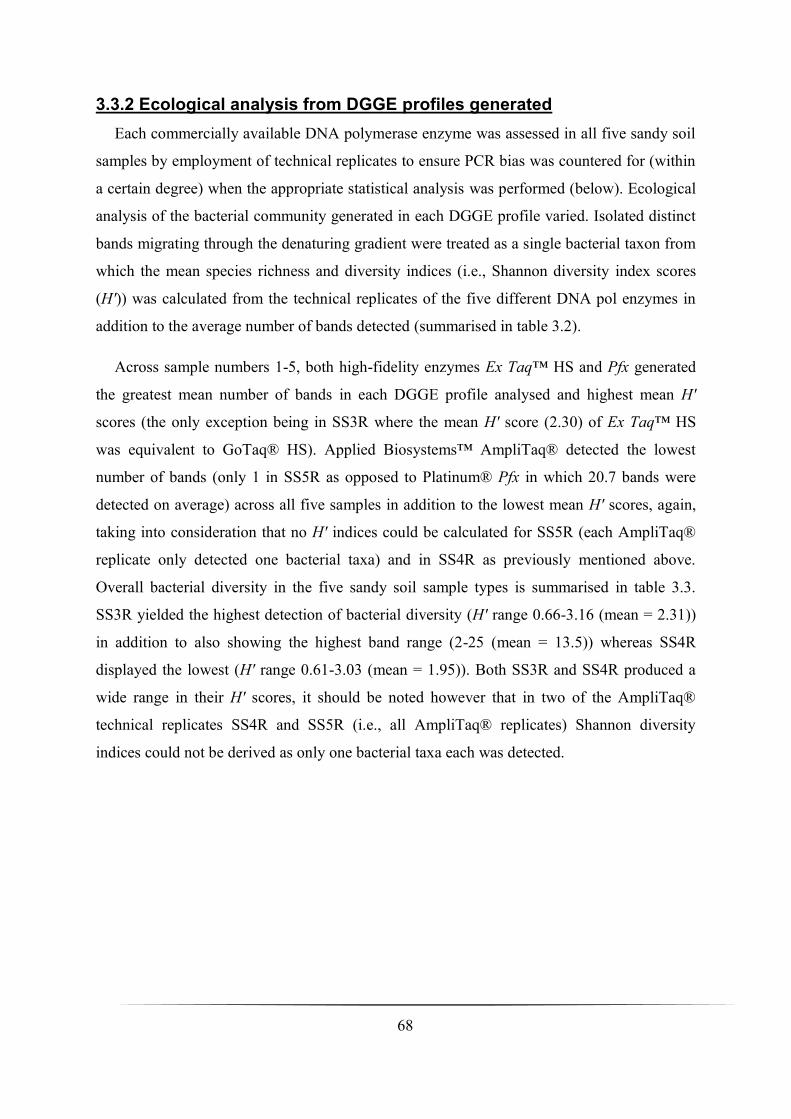
68
3.3.2 Ecological analysis from DGGE profiles generated
Each commercially available DNA polymerase enzyme was assessed in all five sandy soil
samples by employment of technical replicates to ensure PCR bias was countered for (within
a certain degree) when the appropriate statistical analysis was performed (below). Ecological
analysis of the bacterial community generated in each DGGE profile varied. Isolated distinct
bands migrating through the denaturing gradient were treated as a single bacterial taxon from
which the mean species richness and diversity indices (i.e., Shannon diversity index scores
(H′)) was calculated from the technical replicates of the five different DNA pol enzymes in
addition to the average number of bands detected (summarised in table 3.2).
Across sample numbers 1-5, both high-fidelity enzymes Ex Taq™ HS and Pfx generated
the greatest mean number of bands in each DGGE profile analysed and highest mean H′
scores (the only exception being in SS3R where the mean H′ score (2.30) of Ex Taq™ HS
was equivalent to GoTaq® HS). Applied Biosystems™ AmpliTaq® detected the lowest
number of bands (only 1 in SS5R as opposed to Platinum® Pfx in which 20.7 bands were
detected on average) across all five samples in addition to the lowest mean H′ scores, again,
taking into consideration that no H′ indices could be calculated for SS5R (each AmpliTaq®
replicate only detected one bacterial taxa) and in SS4R as previously mentioned above.
Overall bacterial diversity in the five sandy soil sample types is summarised in table 3.3.
SS3R yielded the highest detection of bacterial diversity (H′ range 0.66-3.16 (mean = 2.31))
in addition to also showing the highest band range (2-25 (mean = 13.5)) whereas SS4R
displayed the lowest (H′ range 0.61-3.03 (mean = 1.95)). Both SS3R and SS4R produced a
wide range in their H′ scores, it should be noted however that in two of the AmpliTaq®
technical replicates SS4R and SS5R (i.e., all AmpliTaq® replicates) Shannon diversity
indices could not be derived as only one bacterial taxa each was detected.
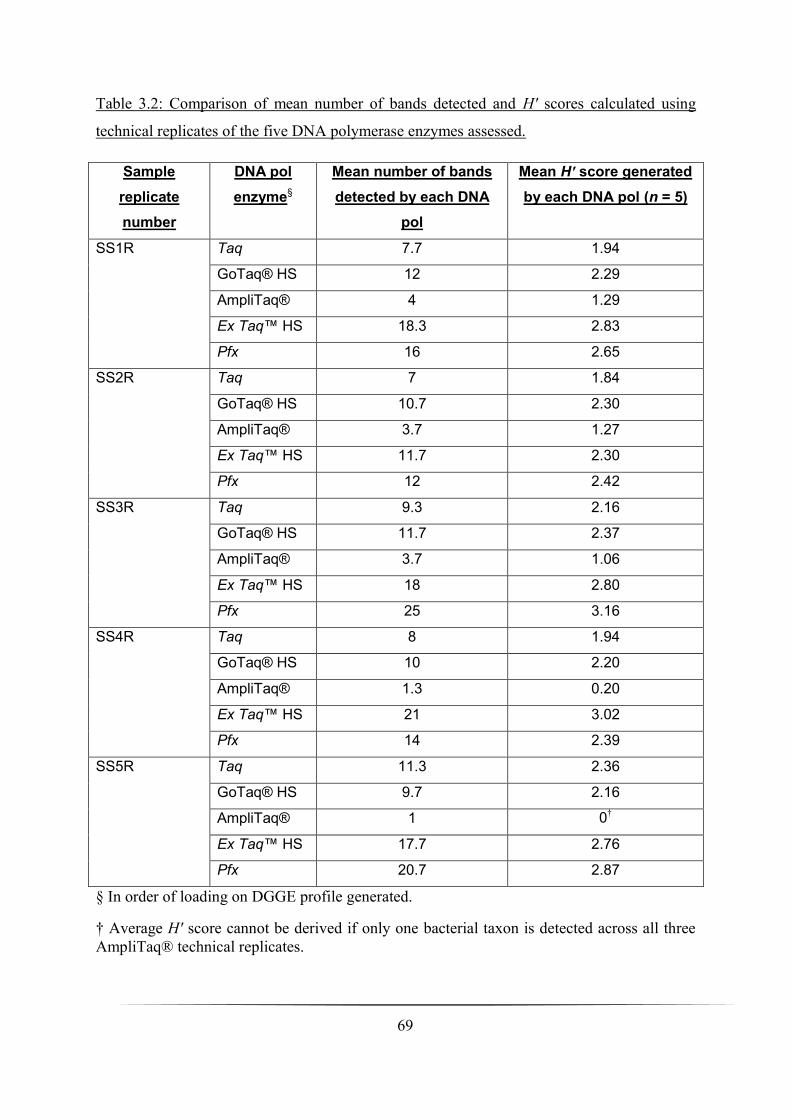
69
Table 3.2: Comparison of mean number of bands detected and H′ scores calculated using
technical replicates of the five DNA polymerase enzymes assessed.
Sample
replicate
number
DNA pol
enzyme§
Mean number of bands
detected by each DNA
pol
Mean H′ score generated
by each DNA pol (n = 5)
SS1R Taq 7.7 1.94
GoTaq® HS 12 2.29
AmpliTaq® 4 1.29
Ex Taq™ HS 18.3 2.83
Pfx 16 2.65
SS2R Taq 7 1.84
GoTaq® HS 10.7 2.30
AmpliTaq® 3.7 1.27
Ex Taq™ HS 11.7 2.30
Pfx 12 2.42
SS3R Taq 9.3 2.16
GoTaq® HS 11.7 2.37
AmpliTaq® 3.7 1.06
Ex Taq™ HS 18 2.80
Pfx 25 3.16
SS4R Taq 8 1.94
GoTaq® HS 10 2.20
AmpliTaq® 1.3 0.20
Ex Taq™ HS 21 3.02
Pfx 14 2.39
SS5R Taq 11.3 2.36
GoTaq® HS 9.7 2.16
AmpliTaq® 1 0†
Ex Taq™ HS 17.7 2.76
Pfx 20.7 2.87
§ In order of loading on DGGE profile generated.
† Average H′ score cannot be derived if only one bacterial taxon is detected across all three
AmpliTaq® technical replicates.
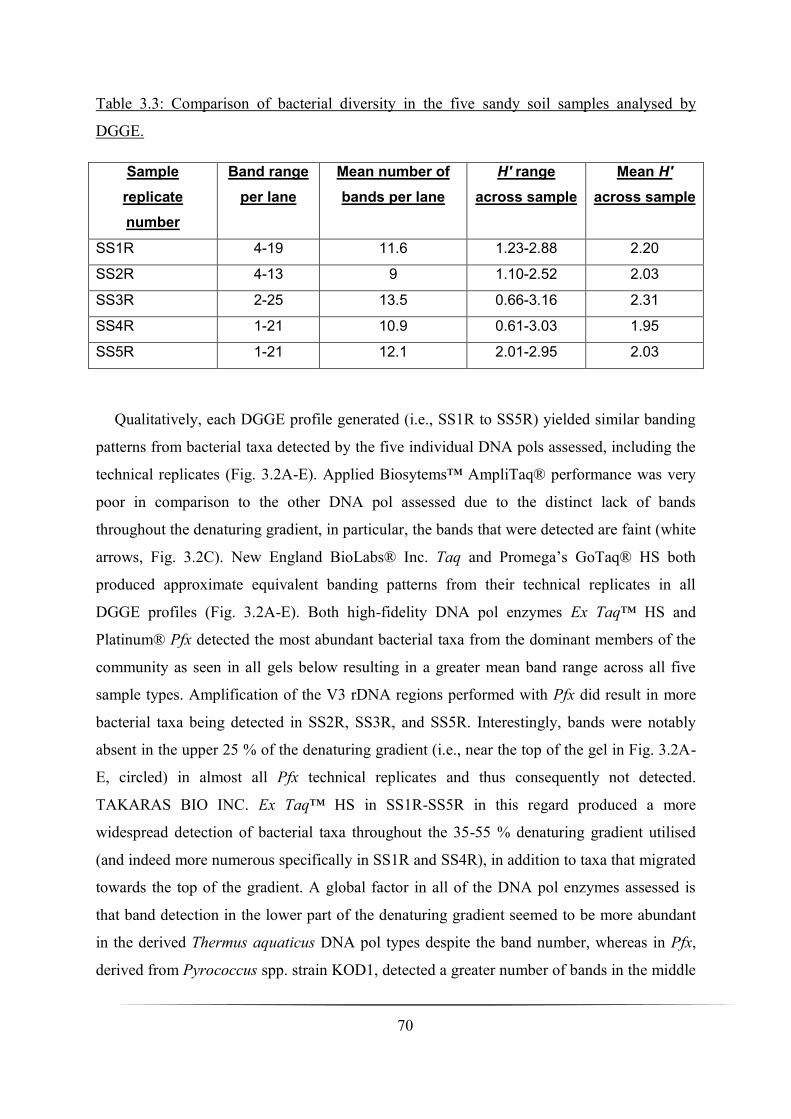
70
Table 3.3: Comparison of bacterial diversity in the five sandy soil samples analysed by
DGGE.
Sample
replicate
number
Band range
per lane
Mean number of
bands per lane
H′ range
across sample
Mean H′
across sample
SS1R 4-19 11.6 1.23-2.88 2.20
SS2R 4-13 9 1.10-2.52 2.03
SS3R 2-25 13.5 0.66-3.16 2.31
SS4R 1-21 10.9 0.61-3.03 1.95
SS5R 1-21 12.1 2.01-2.95 2.03
Qualitatively, each DGGE profile generated (i.e., SS1R to SS5R) yielded similar banding
patterns from bacterial taxa detected by the five individual DNA pols assessed, including the
technical replicates (Fig. 3.2A-E). Applied Biosytems™ AmpliTaq® performance was very
poor in comparison to the other DNA pol assessed due to the distinct lack of bands
throughout the denaturing gradient, in particular, the bands that were detected are faint (white
arrows, Fig. 3.2C). New England BioLabs® Inc. Taq and Promega’s GoTaq® HS both
produced approximate equivalent banding patterns from their technical replicates in all
DGGE profiles (Fig. 3.2A-E). Both high-fidelity DNA pol enzymes Ex Taq™ HS and
Platinum® Pfx detected the most abundant bacterial taxa from the dominant members of the
community as seen in all gels below resulting in a greater mean band range across all five
sample types. Amplification of the V3 rDNA regions performed with Pfx did result in more
bacterial taxa being detected in SS2R, SS3R, and SS5R. Interestingly, bands were notably
absent in the upper 25 % of the denaturing gradient (i.e., near the top of the gel in Fig. 3.2A-
E, circled) in almost all Pfx technical replicates and thus consequently not detected.
TAKARAS BIO INC. Ex Taq™ HS in SS1R-SS5R in this regard produced a more
widespread detection of bacterial taxa throughout the 35-55 % denaturing gradient utilised
(and indeed more numerous specifically in SS1R and SS4R), in addition to taxa that migrated
towards the top of the gradient. A global factor in all of the DNA pol enzymes assessed is
that band detection in the lower part of the denaturing gradient seemed to be more abundant
in the derived Thermus aquaticus DNA pol types despite the band number, whereas in Pfx,
derived from Pyrococcus spp. strain KOD1, detected a greater number of bands in the middle

71
of the gradient. All DGGE profiles generated showed heteroduplex artefacts (i.e., double
band formations that migrate through the denaturing gradient very close together) and these
have been putatively identified with examples shown in Fig. 3.2A, B, and D. These double
bands were common in all Taq, GoTaq® HS, and Ex Taq™ HS technical replicates across all
five sample types.

72
A
B
Taq GT AB ET Pfx
Fig. 3.2A-E: DGGE profiles (35-55 % denaturing gradient) of SS1R-SS5R showing V3 rDNA fragments from all DNA pol technical replicates assessed. SS1R = A; SS2R = B; SS3R = C; SS4R = D, and SS5R = E. Top of the denaturing gradient is shown (35 %) along with the bottom (55 %). Migration direction of the amplicons and denaturing gradient is indicated on the left in gels A-E (arrow). Technical replicates of each DNA pol enzyme are indicated above each DGGE profile (A-E) respectively. Non-detection of bands by Pfx in all technical replicates across SS1R-SS5R is circled. Examples of putative artefacts in DGGE profiles are shown (black arrows) whereas detection of taxa by AmpliTaq® is indicated because of faint bands produced in gel profiles (white arrows). AB, AmpliTaq®; ET, Ex Taq™ HS; GT, GoTaq® HS.
55%
35%
55%
35%
Taq GT AB ET Pfx
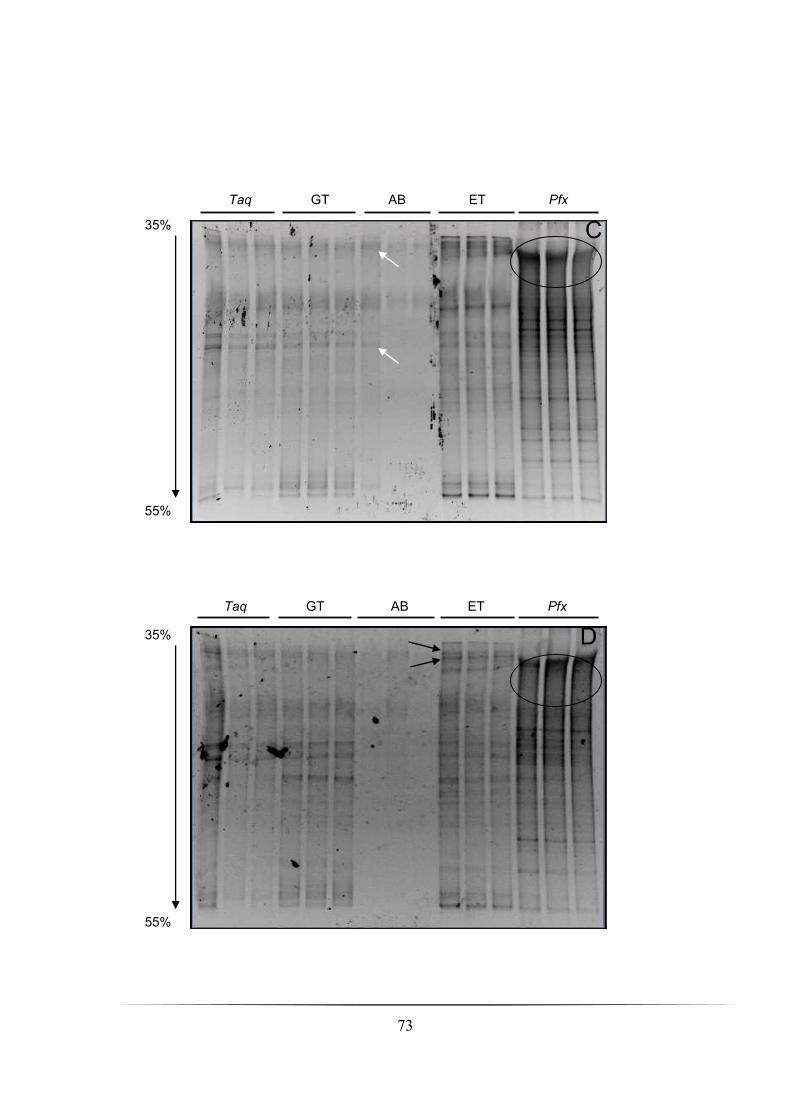
73
35% C
55%
55%
35% D
Taq GT AB ET Pfx
Taq GT AB ET Pfx
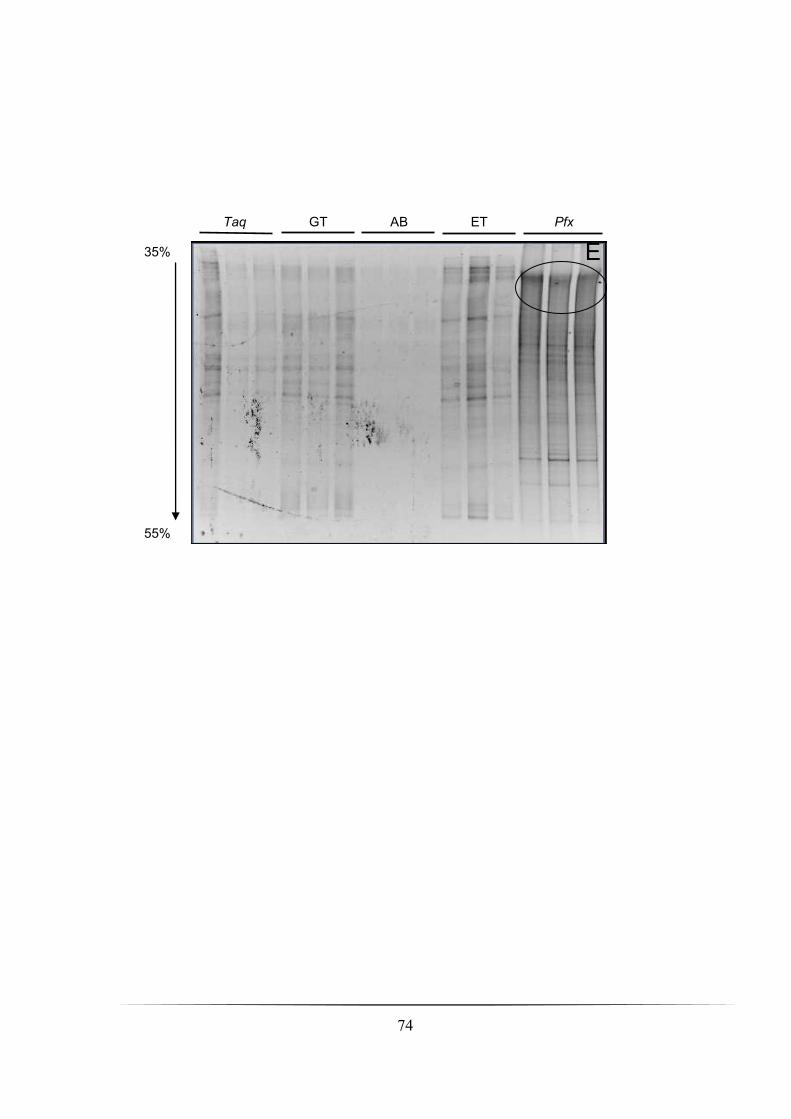
74
35%
55%
E
Taq GT AB ET Pfx
75
3.3.2 Statistical analysis from DGGE profiles generated
All DGGE profiles generated and the number of taxa detected by each DNA pol enzyme
was then subjected to principal components analysis (PCA) to see if there were any
differences between enzyme and sandy soil sample. The first two components were displayed
in the outputs (x- and y-axis) accounting for the cumulative percentage variance explained
with SS5R showing the highest percentage variation at 84 %, followed by 80 % (SS4R), 61
% (SS3R), 44 % (SS2R), and finally 59 % (SS1R). All P-values derived from the first
principal component output by one-way ANOVA (analysis of variation) were significant
indicating that there was differences in the number of bacterial taxa detected between the
disparate DNA pol enzymes assessed in each DGGE profile (SS1R, P = < 0.001, SS2R, P =
0.001, SS4R, P = < 0.001, and SS5R, P = < 0.001) with the exception of SS3R (P = 0.118).
Furthermore, from the PCA outputs a difference can be clearly seen in the clustering between
the disparate types of thermostable polymerases assessed and their technical replicates. Both
high-fidelity pols Ex Taq™ and Pfx exclusively cluster together in all of the DGGE profiles
(Fig. 3.3A-E). This strongly suggests that though they detected the most number of bacterial
taxa in comparison to the other enzymes, there was still a difference between these two
enzyme’s performances in some of the soil samples analysed due to spatial distribution. All
second principal components analysed were not significant indicating that there was no inter-
sample variance between the DGGE profiles SS1R-SS5R examined.
We next wanted to investigate whether there was a difference in bacterial taxa detected by
the technical replicates analysed in SS1R-SS5R. Shannon diversity index scores generated by
each thermostable DNA pol enzyme technical replicate were calculated and then a one-way
ANOVA was performed using Tukey’s test to determine which thermostable enzymes were
significantly different from each other in terms of their microbial diversity detected. All P-
values were significant (SS1R-SS5R, P = < 0.001) between the H′ scores obtained by each
DNA pol in each soil sample showing differences in the microbial diversity detected using
the five different thermostable enzymes (tables 3.4-3.8). In all five samples analysed,
AmpliTaq® thermostable DNA pol was significantly different from the other DNA
polymerases assessed (tables 3.4-3.8 (P = < 0.001)). However in SS1R, (GoTaq® HS and
Taq; table 3.4 (P = < 0.001)), SS2R (Taq; table 3.5 (P = < 0.001)) and SS4R (Ex Taq™ HS;
table 3.7 (P = < 0.001)) DNA pol enzymes indicated in brackets were also significantly
different to the other in addition to AmpliTaq® based on their H′ scores. In SS5R all DNA
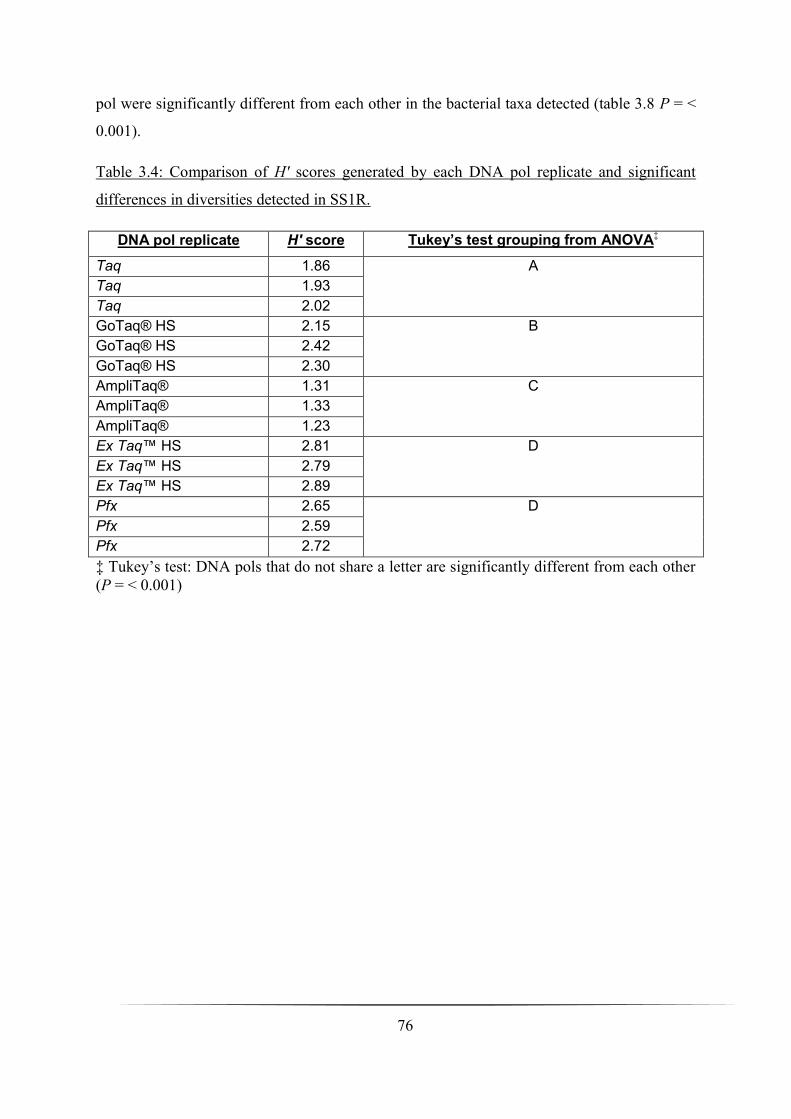
76
pol were significantly different from each other in the bacterial taxa detected (table 3.8 P = <
0.001).
Table 3.4: Comparison of H′ scores generated by each DNA pol replicate and significant
differences in diversities detected in SS1R.
DNA pol replicate H′ score Tukey’s test grouping from ANOVA‡
Taq 1.86 A
Taq 1.93
Taq 2.02
GoTaq® HS 2.15 B
GoTaq® HS 2.42
GoTaq® HS 2.30
AmpliTaq® 1.31 C
AmpliTaq® 1.33
AmpliTaq® 1.23
Ex Taq™ HS 2.81 D
Ex Taq™ HS 2.79
Ex Taq™ HS 2.89
Pfx 2.65 D
Pfx 2.59
Pfx 2.72
‡ Tukey’s test: DNA pols that do not share a letter are significantly different from each other
(P = < 0.001)

77
Table 3.5: Comparison of H′ scores generated by each DNA pol replicate and significant
differences in diversities detected in SS2R.
DNA pol replicate H′ score Tukey’s test grouping from ANOVA
Taq 2.17 A
Taq 1.78
Taq 1.56
GoTaq® HS 2.33 B
GoTaq® HS 2.34
GoTaq® HS 2.24
AmpliTaq® 1.34 C
AmpliTaq® 1.38
AmpliTaq® 1.10
Ex Taq™ HS 2.44 B
Ex Taq™ HS 2.35
Ex Taq™ HS 2.10
Pfx 2.39 B
Pfx 2.52
Pfx 2.34
Table 3.6: Comparison of H′ scores generated by each DNA pol replicate and significant
differences in diversities detected in SS3R.
DNA pol replicate H′ score Tukey’s test grouping from ANOVA
Taq 2.34 A
Taq 2.13
Taq 1.99
GoTaq® HS 2.38 A
GoTaq® HS 2.39
GoTaq® HS 2.33
AmpliTaq® 1.83 B
AmpliTaq® 0.69
AmpliTaq® 0.66
Ex Taq™ HS 2.83 A
Ex Taq™ HS 2.79
Ex Taq™ HS 2.79
Pfx 3.16 A
Pfx 3.16
Pfx 3.15

78
Table 3.7: Comparison of H′ scores generated by each DNA pol replicate and significant
differences in diversities detected in SS4R.
DNA pol replicate H′ score Tukey’s test grouping from ANOVA
Taq 2.25 A
Taq 1.77
Taq 1.79
GoTaq® HS 2.28 A
GoTaq® HS 2.16
GoTaq® HS 2.17
AmpliTaq® 0 B
AmpliTaq® 0.60
AmpliTaq® 0
Ex Taq™ HS 3.0 C
Ex Taq™ HS 3.0
Ex Taq™ HS 3.0
Pfx 2.43 A
Pfx 2.24
Pfx 2.51
Table 3.8: Comparison of H′ scores generated by each DNA pol replicate and significant
differences in diversities detected in SS5R.
DNA pol replicate H′ score Tukey’s test grouping from ANOVA
Taq 2.60 A
Taq 2.29
Taq 2.18
GoTaq® HS 2.21 B
GoTaq® HS 2.01
GoTaq® HS 2.25
AmpliTaq® 0 C
AmpliTaq® 0
AmpliTaq® 0
Ex Taq™ HS 2.78 D
Ex Taq™ HS 2.94
Ex Taq™ HS 2.54
Pfx 2.84 E
Pfx 2.84
Pfx 2.95

79
Taq
Taq Taq
GT
GT ET
AB AB
AB
ET
GT
ET
Pfx
Pfx
Pfx
-0.15
-0.1
-0.05
0
0.05
0.1
0.15
0.2
0.25
0.3
0.35
-0.5 -0.4 -0.3 -0.2 -0.1 0 0.1 0.2 0.3
PC
2:
13
% o
f va
ria
tio
n e
xp
lain
ed
PC1: 46% of variation explained
A: PCA of SS1R DNA polymerase technical replicates Fig. 3.3A-E: PCA of SS1R-SS5R from each of the DGGE profiles generated and DNA pol technical replicates assessed. SS1R = A; SS2R = B; SS3R = C; SS4R = D; SS5R = E. Each DNA pol technical replicate is indicated in the PCA ouput (AB, AmpliTaq®; ET, Ex Taq™ HS; GT, GoTaq® HS; Pfx, Platinum® Pfx; Taq, New England BioLabs® Inc. Taq). The x-axis (PC1) explains the most variation followed by the y-axis (PC2) explaining the second most variation in the PCA output. This variation is shown as two percentages indicated on both the x- and y-axes respectively.

80
Taq
Taq
Taq
GT GT
GT
AB
AB
AB
ET
ET
ET
Pfx
Pfx
Pfx
-0.3
-0.2
-0.1
0
0.1
0.2
0.3
0.4
0.5
-0.3 -0.2 -0.1 0 0.1 0.2 0.3
PC
2:
20
% o
f va
ria
tio
n e
xp
lain
ed
PC1: 24% of variation explained
B: PCA of SS2R DNA polymerase technical replicates

81
Taq Taq
Taq
GT
GT GT
AB
AB
AB
ET
ET
ET Pfx
Pfx
Pfx
-0.5
-0.4
-0.3
-0.2
-0.1
0
0.1
0.2
0.3
0.4
-0.2 -0.1 0 0.1 0.2 0.3 0.4 0.5 0.6
PC
2:
21
% o
f va
ria
tio
n e
xp
lain
ed
PC1: 40% of variation explained
C: PCA of SS3R DNA polymerase technical replicates

82
Taq
Taq
Taq
GT
GT GT
AB
AB
AB
ET
ET ET Pfx
Pfx
Pfx
-0.3
-0.2
-0.1
0
0.1
0.2
0.3
-0.4 -0.2 0 0.2 0.4 0.6 0.8 1PC
2:
10
% o
f va
ria
tio
n e
xp
lain
ed
PC1: 70% of variation explained
D: PCA of SS4R DNA technical polymerase replicates
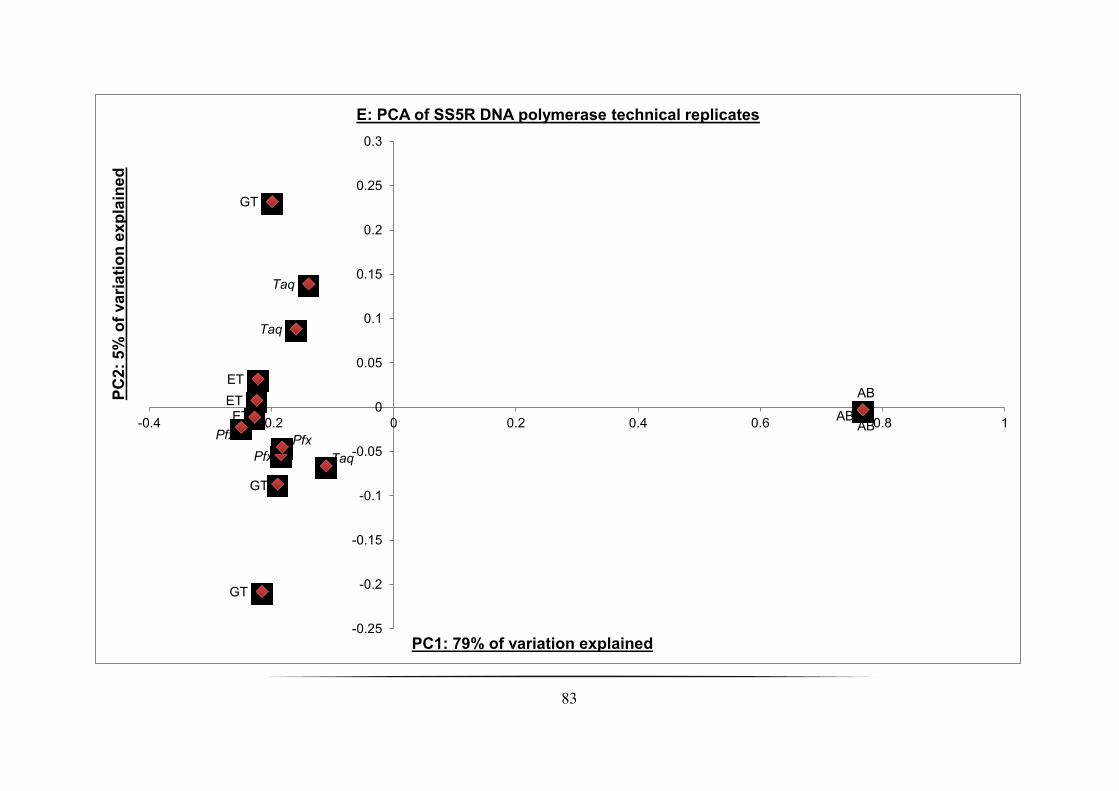
83
Taq
Taq
Taq
GT
GT
GT
AB AB
AB ET
ET
ET
Pfx
Pfx
Pfx
-0.25
-0.2
-0.15
-0.1
-0.05
0
0.05
0.1
0.15
0.2
0.25
0.3
-0.4 -0.2 0 0.2 0.4 0.6 0.8 1
PC
2:
5%
of
va
ria
tio
n e
xp
lain
ed
PC1: 79% of variation explained
E: PCA of SS5R DNA polymerase technical replicates
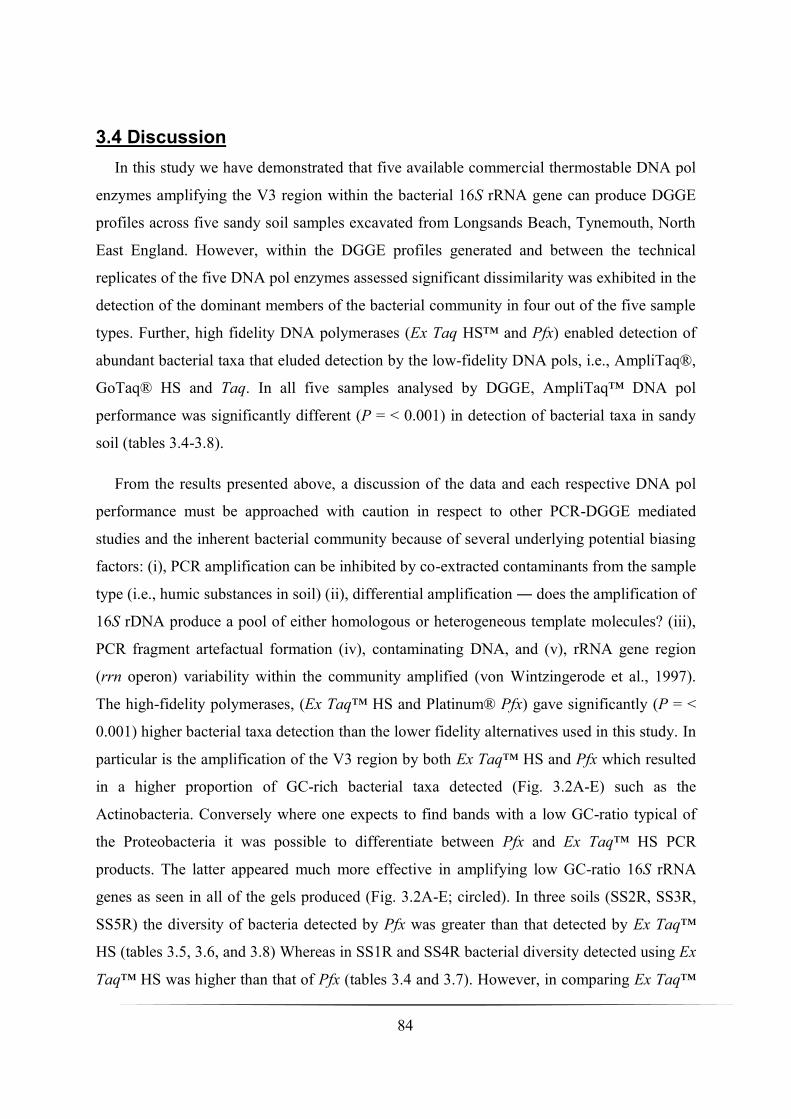
84
3.4 Discussion
In this study we have demonstrated that five available commercial thermostable DNA pol
enzymes amplifying the V3 region within the bacterial 16S rRNA gene can produce DGGE
profiles across five sandy soil samples excavated from Longsands Beach, Tynemouth, North
East England. However, within the DGGE profiles generated and between the technical
replicates of the five DNA pol enzymes assessed significant dissimilarity was exhibited in the
detection of the dominant members of the bacterial community in four out of the five sample
types. Further, high fidelity DNA polymerases (Ex Taq HS™ and Pfx) enabled detection of
abundant bacterial taxa that eluded detection by the low-fidelity DNA pols, i.e., AmpliTaq®,
GoTaq® HS and Taq. In all five samples analysed by DGGE, AmpliTaq™ DNA pol
performance was significantly different (P = < 0.001) in detection of bacterial taxa in sandy
soil (tables 3.4-3.8).
From the results presented above, a discussion of the data and each respective DNA pol
performance must be approached with caution in respect to other PCR-DGGE mediated
studies and the inherent bacterial community because of several underlying potential biasing
factors: (i), PCR amplification can be inhibited by co-extracted contaminants from the sample
type (i.e., humic substances in soil) (ii), differential amplification ― does the amplification of
16S rDNA produce a pool of either homologous or heterogeneous template molecules? (iii),
PCR fragment artefactual formation (iv), contaminating DNA, and (v), rRNA gene region
(rrn operon) variability within the community amplified (von Wintzingerode et al., 1997).
The high-fidelity polymerases, (Ex Taq™ HS and Platinum® Pfx) gave significantly (P = <
0.001) higher bacterial taxa detection than the lower fidelity alternatives used in this study. In
particular is the amplification of the V3 region by both Ex Taq™ HS and Pfx which resulted
in a higher proportion of GC-rich bacterial taxa detected (Fig. 3.2A-E) such as the
Actinobacteria. Conversely where one expects to find bands with a low GC-ratio typical of
the Proteobacteria it was possible to differentiate between Pfx and Ex Taq™ HS PCR
products. The latter appeared much more effective in amplifying low GC-ratio 16S rRNA
genes as seen in all of the gels produced (Fig. 3.2A-E; circled). In three soils (SS2R, SS3R,
SS5R) the diversity of bacteria detected by Pfx was greater than that detected by Ex Taq™
HS (tables 3.5, 3.6, and 3.8) Whereas in SS1R and SS4R bacterial diversity detected using Ex
Taq™ HS was higher than that of Pfx (tables 3.4 and 3.7). However, in comparing Ex Taq™
85
HS and Pfx high-fidelity pols only significant differences between the two were observed in
SS4R and SS5R (P = < 0.001). In SS1R, SS2R, and SS3R there was no significant difference.
Production of PCR artefacts and chimeras is a confounding factor that may lead to an
over-estimation of the microbial diversity present in the sample analysed, however, the
formation of these anomalies is not uncommon in DGGE (Muyzer, 1999). Chimera formation
is generated by incompletely synthesised extended DNA fragments annealing together
producing closely related sequences generating recombinants between starting templates
(Judo et al., 1998, Bradley and Hillis, 1997). Differentiation between original haplotypes and
chimeras generated can be problematic resulting in occasionally an overestimation of the
community diversity in microbial ecology studies (von Wintzingerode et al., 1997,
Hugenholtz and Huber, 2003, Berney et al., 2004). A study reported several years ago has
tried to circumvent this problem by introducing an additional extension time of 30 min
reducing the formation of double bands in PCR-DGGE analysis in environmental microbial
diversity PCR (Janse et al., 2004). This longer extension time was implemented here in all
DNA pol technical replicates carried out at the end of each PCR cycle. GC-clamp attachment
to the forward primer, although designed to improve sequence heterogeneity from the pool of
amplicons in analysis by DGGE, can induce effects such as G quartet or four-stranded
tetraplex formation caused by multiple adjacent G residues (Poon and Macgregor, 1998, Poon
and Macgregor, 2000). Further, a recently published study suggested the procurement of
enough oligonucleotides incorporating a GC-clamp in a single batch for a project to avoid the
GC-clamp sequence itself actually affecting DGGE profiles due to differences in
performance between repeat syntheses of GC-clamp oligonucleotide primers from disparate
batches (Rettedal et al., 2010).
Duplex banding patterns seen in the DGGE profiles (Fig. 3.2A, B, and D) could also be
attributed to the formation of spurious PCR products after the addition of the DNA pol to the
reagent master mix (MM). This can be circumvented by the induction of either a manual or
automatic HS; with the exception of Ex Taq™ HS, GoTaq® HS and Platinum® Pfx, (all
bound to a proprietary antibody) both AmpliTaq® and Taq were introduced into the master-
mix via a manual HS procedure, but despite this process, poor AmpliTaq® performance was
unequivocal in bacterial taxa detection unlike that of its counterpart Taq. A previous study
assessed the impact of DNA polymerase bound to a proprietary antibody on the resulting
86
PCR products synthesised. This demonstrated an increased specificity, sensitivity, and yield,
in addition to reducing the formation of spurious PCR products before the PCR was actually
initialised (Sharkey et al., 1994).
Assessment of the microbial diversity in sandy soil samples using the T. aquaticus derived
DNA pol enzymes (i.e., Taq, GoTaq® HS, and AmpliTaq®) produced similar banding
patterns in most replicates across SS1R-SS5R. However, AmpliTaq® amplification of pooled
V3 rDNA amplicons produced very faint bands in the denaturing gradient (Fig. 3.2C; white
arrows). It is questionable if this is a true reflection of AmpliTaq®’s capability in comparison
to the other DNA pols. Further optimisation of AmpliTaq® is probably required to draw
satisfactory results and conclusions. Detection of hypothetical GC-rich bacterial taxa was
noticeable in both GoTaq® HS and Taq, although less so than in Ex Taq™ HS and Pfx.
Another mitigating factor in the variances of DGGE profiles generated from the
commercially available thermostable enzymes assessed here, concerns the DNA pol property
of fidelity. The DNA pols Taq, GoTaq®, and AmpliTaq® carry out DNA replication and
repair with a low degree of fidelity and have a low proofreading capacity in comparison to Ex
Taq™ and Pfx. In relation to this, it can be suggested that the formation of PCR-mediated
recombination or chimeras, giving rise to heteroduplex PCR products, would increase when
using Taq, GoTaq® HS, or AmpliTaq® when assessing the microbial diversity in any given
environmental type in PCR-DGGE studies. It is worth noting that despite the higher mean
band ranges and H′ scores produced by both Ex Taq™ HS and Pfx, the risk of artefactual
PCR products is decreased compared to their lower-fidelity counterparts. Surprisingly, it has
been previously shown that even high-fidelity DNA pols insert incorrect nucleotides with
similar efficiencies to that of naturally occurring low-fidelity polymerases (Beard and
Wilson, 2003). This finding concludes that right from selection of DNA pol in PCR-DGGE
mediated investigations, there will always be an inherent bias, and as thus, this must be taken
into account from the data presented.

87
3.5 Conclusions
In summary, all DNA pol enzymes employed in this study could have been optimised
further, in particular AmpliTaq®, raising concerns over its true performance in the microbial
community detection from the sample types collected herein. What is apparent, and
significant in four out of the five samples analysed (P = < 0.001), is that from the DNA pol
technical replicates assessed is that PCA shows that the higher-fidelity pols Ex Taq™ HS and
Platinum® Pfx cluster together explaining some of the variance observed. This variance can
be attributed between the other DNA pols assessed, in addition to greater bacterial taxa
detection and H′ scores generated. From the data presented, comprising both the multivariate
analysis and DGGE profiles generated, Ex Taq™ HS DNA pol proved the most effective in
best representing the microbial communities present in the samples analysed by DGGE
despite the inherent limitations of this approach outlined above. Thus Ex Taq™ HS will be
implemented in the PCR-DGGE mediated studies in two chronic respiratory tract disorders
presented further in this body of work.

88
Chapter Four: PCR-DGGE study of a cross-sectional cohort with non-cystic
fibrosis bronchiectasis
4.1 Abstract
The aim was to investigate the polymicrobial communities in sputum samples derived from
an adult non-cystic fibrosis bronchiectasis cohort that consisted of 70 individuals (25 males
and 45 females). Twenty patients had symptoms consistent with an exacerbation, the
remainder were clinically stable. DNA was extracted from sputum samples of all patients.
Universal primers were used to amplify fragments both within the 16S and 28S rRNA genes.
Amplicons were analysed by denaturing gradient gel electrophoresis. Demographic and
culture data were used in constrained ordination analyses to identify any significant
associations between these data and changes in the sputum microbiota. Standard culture
indicated that 19 (27 %) sputum samples were negative for recognised pathogens. Molecular
analyses demonstrated these samples contained a bacterial diversity (mean = 7 taxa) not
significantly different to culture positive sputum. There was a significant difference between
the bacterial community structure in the sputum samples of exacerbated patients compared to
those that were clinically stable (P = 0.002). Antibiotic administration within 1 month of
sampling caused no significant changes to the microbial community investigated.
Haemophilus influenzae carriage is identified as a significant driver (P = 0.006) of change in
the microbial community structure. Further, H. influenzae was not identified in samples (n =
12) that harboured Pseudomonas aeruginosa. Consistent with earlier studies, the persistent
presence of P. aeruginosa (n = 23) determined by culture was significantly correlated with
reduced lung function (P = < 0.001). In adult non-CF bronchiectasis patients bacterial lung
communities show significant differences between exacerbation and clinically stable states
and also when H. influenzae is present. Antibiotic administration does not significantly alter
these microbial communities. Persistent colonisation by P. aeruginosa is significantly
associated with reduced lung function, and is negatively correlated with H. influenzae
carriage.

89
4.2 Background
Bronchiectasis is a highly debilitating disease causing severe pulmonary infections and
lung function decline resulting in chronic morbidity, and in some cases, premature mortality
(King et al., 2005). The disease itself was initially characterised in 1819 by René Théophile
Hyacinthe Laënnec in which from his writings, he described that “This affection of the
bronchioles is always produced by chronic catarrh, or by some other disease attended by
long, violent, and often repeated fits of coughing” (Laënnec, 1962). Presently, bronchiectasis
is defined by irreversible abnormal dilatation of one or more bronchi, with chronic airway
inflammation, associated with chronic cough and sputum production, recurrent chest
infections, and airflow obstruction (Barker, 2002, Cohen and Sahn, 1999, Wilson and
Boyton, 2006). In terms of a primary phenotype, bronchiectasis exists in two forms; (i) cystic
fibrosis (a genetically inherited disease resulting in a severe form of bronchiectasis
(Strausbaugh and Davis, 2007)), and (ii), non-cystic fibrosis bronchiectasis (nCFBR).
Contributing factors that induce nCFBR can be physical obstruction or post infectious
damage, genetic defects (as observed in cystic fibrosis (CF)), abnormal host defence
mechanisms or autoimmune disease, in many cases nCFBR is idiopathic (Pasteur et al.,
2001).
Diagnosis of nCFBR using high-resolution computed tomography (HRCT) reveals
varying structural and anatomic phenotypes within either one lobe or both lobes of the lung,
pending local or more commonly general distribution of the disease in the lower lobes (King
et al., 2006). These characteristic phenotypes defined by Reid described three main subtypes
of bronchiectasis; (i), smooth dilation of the bronchi giving rise to the tubular form (ii),
dilated bronchi populated with multiple indentations ― varicose phenotype and (iii), cystic,
dilated bronchi terminating in blind sacs (Reid, 1950). As opposed to HRCT, pathology of
bronchiectasis lung tissue specimens by Whitwell resulted in the addition of three sub-types
of the bronchiectasis phenotype: (i), follicular (ii), saccular and (iii), atelectatic. From his
findings, infiltration of the bronchial wall with inflammatory cells in conjunction with the
loss of elastin, and in more severe cases, muscle and cartilage injury was associated with
bronchial dilatation (Whitwell, 1952). In conjunction with HRCT and Whitwell’s description,
the dominant form of bronchiectasis disease today is the follicular sub-type corresponding to
the tubular phenotype. In this form, as Whitwell had previously shown earlier; in the small
airways lymphoid follicle formation by the infiltration of inflammatory cells in the bronchial

90
walls is extensive, causing obstruction of the small airways. Conversely, in the larger
airways, dilation is followed by the loss of elastin, cartilage and muscle (King, 2011b).
Paradoxically, studies have shown that in bronchiectasis individuals, lung function decline
occurs gradually with loss of forced expiratory volume in one second (FEV1), despite the
characteristic dilatation of the airways (King et al., 2005, Martínez-García et al., 2007, Twiss
et al., 2006). Explanation of this paradox is demonstrated by Whitwell’s original pathology
findings demonstrating that during large airway dilation, the small airways were obstructed;
net effect of the pulmonary tree is airflow obstruction as composition of this is in the small
airways (King, 2011a). Pulmonary airflow obstruction in bronchiectasis caused by structural
anatomic changes is critical as they adversely affect normal airway clearance and impede
innate immunity mechanisms (Morrisey, 2007). Indeed, bronchiectasis pathophysiology
defines the impairment, control, prevention, and resolution of respiratory tract diseases.
Cole’s original paradigm in bronchiectasis disease states that a vicious circle of recurrent or
persistent airway infection and inflammation promotes additional lung tissue structural insults
predisposing bronchiectasis individuals to prolonged infection ― a self-promoting cycle
(Cole, 1986).
Chronic airway infection is strongly associated with bronchiectasis disease and this
appears to contribute to the underlying pathogenesis of the disease, with progressive lung
damage resulting from recurrent bacterial infections and inflammatory responses (Wilson and
Boyton, 2006). Previous studies investigating the bacteriology of nCFBR from several types
of clinical samples have identified common lower respiratory tract pathogens including
Haemophilus influenzae, Pseudomonas aeruginosa, Streptococcus pneumoniae, and
Moraxella catarrhalis; other less frequently encountered isolates are Staphylococcus aureus
and non-tuberculosis mycobacterial (NTM) species (Angrill et al., 2002, King et al., 2007,
Pasteur et al., 2001, Nicotra et al., 1995). S. aureus involvement in nCFBR is uncommon and
repeated culture isolation from sputa is suggestive of cystic fibrosis, particularly in younger
patients (King, 2011a). When using sputa to investigate the aetiology of nCFBR infection,
both H. influenzae and P. aeruginosa are the most commonly cultured pathogens with many
isolated strains showing significant antibiotic resistance (King, 2011a, Angrill et al., 2002).
Infection with H. influenzae in the lower airways in nCFBR is almost always associated with
the non-typeable strain of this species. A normal resident of the upper respiratory tract (URT)
in most persons, non-typeable strains lack a polysaccharide capsule where recurrent or

91
chronic lower airway infection with non-typeable H. influenzae (NTHI) in nCFBR is
common place (Grimwood, 2011). Persistence of NTHI in the lower airways is due to several
mechanisms such as antigenic drift, protease secretion, expression of multiple adhesion
molecules, and intracellular survival in either host lung macrophages or epithelial cells
(Murphy et al., 2009). Indeed, infection with NTHI is a dynamic process as different strains
of this organism can infect bronchiectasis patients sequentially as previously shown in CF
(Román et al., 2004). Furthermore the lung bronchi have been shown to exhibit a dynamic
turnover of lower respiratory tract (LRT) pathogens; the acquisition of new bacterial strains
in bronchiectasis has been investigated in which patients were continually colonised with
Moraxella catarrhalis, but strains of this bacterium were shown to have a continuous
turnover every 2-3 months (Klingman et al., 1995).
As opposed to H. influenzae, and the other bacterial isolates above, P. aeruginosa
colonisation of the URT is infrequent in healthy individuals as it is rapidly cleared from the
lower airways (Garau and Gomez, 2003). Indeed, P. aeruginosa infection with nCFBR in
children is rare; however, in older individuals presenting with bronchiectasis, infection with
P. aeruginosa is much more common. Individuals with nCFBR harbouring no pathogens
showed the mildest disease whereas isolation of P. aeruginosa had the most severe
bronchiectasis (King et al., 2007). Concurrently, isolation of H. influenzae tended to be from
patients with moderately impaired pulmonary function (King et al., 2007). P. aeruginosa is
widely dispersed throughout the environment and is a superb opportunistic respiratory
pathogen able to acclimatise to the niche micro-environment of the lung as it is particularly
adapted to binding to the damaged epithelial lining of the pulmonary tree in chronic
respiratory diseases (de Bentzmann et al., 1996), but more specifically in CF. Most of our
understanding of P. aeruginosa and its mechanisms of infection in individuals presenting
with nCFBR is through extensive work carried out in CF where it is the most important
pathogenic isolate (de Vrankrijker et al., 2010). Infection with P. aeruginosa in CF is
comprised of three phases: no infection, intermittent infection, followed eventually by
chronic infection, in which the pathogen undergoes gradual mutational changes in its
bacterial genome in response to the micro-environmental challenges in the CF lung (Li et al.,
2005). One of the major mutational changes in P. aeruginosa in the CF lung is the
development from a non-mucoid to mucoid phenotype commonly isolated by culture in
chronically infected patients (Foweraker, 2009). Establishment of this mucoid phenotype

92
plays a major role in phagocytic evasion, increased tolerance to toxic oxygen free radicals
mediated by neutrophils and resistance to antibiotics (Murray et al., 2007). The production of
biofilms by P. aeruginosa is a critical factor in the treatment of CF patients, as the bacteria
within them are inherently difficult to eradicate as antibiotics bind to the extracellular matrix
as opposed to penetrating the inner matrix in addition to exhibiting increased resistance to the
host immune system (Foweraker, 2009) (Davies and Bilton, 2009). Biofilm formation
subsequently leads to persistent infection thus resulting in severe damage to the lung tissue
architecture.
Chronic infection in nCFBR with P. aeruginosa is associated with an increase in airflow
obstruction, sputum production, hospitalisations, in addition to extensive lung disease and
worsening in quality of life in patients’ afflicted (King, 2011b, Martínez-García et al., 2007,
Wells et al., 1993). As a result of this, the presence and persistence of P. aeruginosa has been
identified as a marker of bronchiectasis severity, although it remains unclear whether this is
linked to accelerated lung function decline (Davis et al., 2006). Frequent exacerbations
experienced by bronchiectasis patients may contribute to the progressive decline of lung
function (Martínez-García et al., 2007) though the cause of these remains poorly understood.
Exacerbations are frequently managed with antibiotics, however, viral infections may also be
significant in many cases but their role requires clarification (King, 2011a). In CF
bronchiectasis, there is a significant contribution to exacerbations by fungal pathogens
(Bouchara et al., 2009). However, their role, if any, in nCFBR remains to be elucidated.
In this study our aim was to undertake a community level investigation of the microbiome
associated with the nCFBR lung, to characterise their diversity and structure, and to
determine whether differences in the communities reflect the clinical status of the patient, the
presence or absence of culturable pathogens or show significant changes in response to the
interventions used in the clinic to manage patient outcomes.
93
4.3 Results
4.3.1 Patient cohort analysis
Seventy patients (25 male, 45 female) were enrolled in this study (App. 3), both consisting
of clinically stable and exacerbating outpatients currently diagnosed with nCFBR at time of
sampling. The mean FEV1 derived was 1.47 L (± 0.78 L) with a mean age of 61.6 ± 12.9
years across cohort. Between the males and females comprising cohort, the absolute FEV1
values were significantly higher in males 1.84 vs. 1.26 litre (P = 0.002). However, there was
no significant difference in the age (P = 0.492) or the FEV1% predicted between the sexes (P
= 0.785). Similarly, the distribution of genders between the culture-negative, exacerbated,
non-exacerbated, H. influenzae and P. aeruginosa colonisation states were not significantly
different to the overall sex ration of the cohort. For 61 of the 70 patients, data on the number
of exacerbations reported in the preceding 12 months was available. Frequent exacerbators
were defined as those patients who had greater than 3 episodes over this period, 38 patients in
the cohort satisfied this criterion. At the time of sample collection 20 patients reported
symptoms consistent with an exacerbation defined as per the British Thoracic Society (BTS)
2010 bronchiectasis guidelines by the presence of increased cough, malaise, increased
sputum volume and purulence (Pasteur et al., 2010). A summary of the patient demographic
data is shown in table 4.1.

94
Table 4.1: Summary of patient demographic data.
All patients (n = 70)
Non-exacerbated sub-cohort (n = 50)
Exacerbated sub-cohort (n = 20)
Demographic data:
Age (years) 61.6 ± 12.9 61.2 ± 12.9 62.5 ± 13.4
Female population in cohorts (%) 45 (64.3) 30 (60) 15 (75)
FEV1 (L) in both genders:
Male population
Female population
1.47
1.84a†
1.26b
1.46
1.86a
1.17b
1.50
1.77a
1.41b
FEV1% predicted 58.3 % 56.3 % 64.9 %
Frequent exacerbators (%) (n = 61§) 38 (54) 26 (52) 12 (60)
Culture-negative (%) 19 (27) 11 (22) 8 (40)
H. influenzae colonisation (%) 12 (17.1) 7 (14) 5 (25)
P. aeruginosa colonisation (%)
Never isolated
Intermittently isolated
Persistent isolation
28 (40)
17 (24)
25 (36)
17 (34)
12 (24)
21 (42)
11 (55)
5 (25)
4 (20)
Recent Abx¿ 16 (23) 10 (20) 6 (30)
§ Frequent exacerbation data was only available for 61 patients in total cohort.
¿ Antibiotic treatment within the last month other than colomycin or azithromycin.
† FEV1 (L) values in male and female populations followed by different letters are
significantly different (P = <0.05).
4.3.2 Microbial culture analysis
In whole cohort, 51 patients (73%) from the sputa examined were culture-positive for
pathogenic microorganisms; the remainder being classified as either no growth or culture
identified mouth flora only (additionally defined as culture-negative because of non-isolation
of associated respiratory pathogens). The most common pathogenic organisms isolated from
sputa were P. aeruginosa (PA) found in 39 % and H. influenzae (HI) in 17 % of patients
respectively, however, there were no instances of both these taxa being found within a single
sputum sample. Only three clinical samples were culture positive for fungal species:

95
Aspergillus fumigatus was isolated from patient 32 and Candida spp. both from patients 8
and 44 respectively.
Assessment of lung function showed that patient’s culture negative for pathogens, or those
harbouring HI, had similar values. But these were significantly higher (P = 0.0001 and P =
0.0002 respectively) than individuals whose sputum was positive for PA isolation. From the
medical records examined, 25 individuals were culture-positive for PA isolation from all
previous sputum samples submitted for microbiological testing; these patients were defined
as persistently colonised. A further 18 individuals were intermittently colonised and 28 were
culture-negative for PA isolated from all previously submitted sputum samples. Following
these criteria, we next examined the relationship between the presence and persistence of PA
infection and forced expiratory volume in one second predicted (FEV1% predicted). This
demonstrated a significant reduction in FEV1% predicted (P = < 0.001) between those ever
and those never colonised by PA sub-groups. Further, FEV1% predicted lung function was
significantly reduced in persistently versus intermittently colonised (P = 0.004) and
persistently versus never colonised patients (P = < 0.001). However, FEV1% predicted was
not significantly different between those with intermittent PA carriage and those where PA
had not been isolated (P = 0.1). In patients culture-positive for HI the FEV1% predicted was
significantly higher than the FEV1% predicted of individual’s chronically infected with P.
aeruginosa (P = < 0.001). Patients experiencing frequent exacerbations (i.e., > 3
exacerbations per annum; n = 38) were predominantly culture-positive for the presence of
known lung pathogens (71 %). Within this sub-group of exacerbating individuals, 50 % were
colonised with PA and 10.5 % with HI but co-isolation of these two respiratory pathogens
was never observed. Pulmonary function (FEV1% predicted) was not significantly different
between patients who frequently exacerbated and the remaining individuals that did not.
4.3.3 Ecological analysis of bacterial community
The bacterial community profiles generated from the PCR-DGGE analysis produced 45
distinct band classes with a mean of 8.4 bands per lane (band range 1-18 per lane) (Fig. 4.1A-
G). Each individual DGGE band was presumed to be a single bacterial taxon and was used as
a measure of species richness. The mean bacterial Shannon diversity (H′) was 1.53 (range 0-
2.55) and the mean species evenness (J′) of the bacterial communities was 0.78 (range 0.197-
0.992). Species evenness is a biodiversity measure used to ascertain how equal the bacterial

96
community is in this instance via quantification; whereas the H′ is a measure of both species
richness and evenness in the community analysed. Analysis of variance on the entire cohort’s
community profiles showed that there was no significant difference associated with the
number of taxa, community diversity or evenness between those sputum samples where there
was a self- reported exacerbation. Similarly, there were no significant differences between
taxa or community diversity indices in patients who were never, intermittently or persistently
colonised with P. aeruginosa or where H. influenzae could be isolated from sputa samples.
SL 1 2 3 4 5 SL 6 7 8 9 10 11 SL
A
Fig. 4.1A-G: DGGE profiles of whole nCFBR cohort investigated using a 16S rRNA PCR-DGGE culture-independent approach. Amplicons were run out on a 32.5-60 % denaturing gradient (shown by arrow). Each band migrated was treated as a single bacterial taxon for the purposes of community profiling and multivariate statistical analysis subsequently carried out. Patient numbers are represented by a sequential series of numbers above each lane. Those lanes denoted with an X (and a red line) represent those individuals removed from the study. Patients indicated with blue, green and red arrows represent patients that are culture-negative and culture-positive for only H. influenzae or P. aeruginosa respectively. The 16S standard ladder (SL) comprised of V3 rDNA fragments derived from pure bacterial cultivars is also shown. Because of the inter-gel variation in the 16S SL reproducibility, the Rf values (in parentheses) derived for each bacterial species are only indicated in DGGE profile D for clarification purposes. AX, Achromobacter xylosoxidans; BCC, Burkholderia cepacia complex; HI, Haemophilus influenzae; PA, Pseudomonas aeruginosa; RP, Ralstonia pickettii; SA, Staphylococcus aureus and SM, Stenotrophomonas maltophilia. Co-migration of bands against the HI and PA 16S SL markers are
indicated in green and red rectangles respectively.
32.5%
60%
PA (Rf: 0.200)
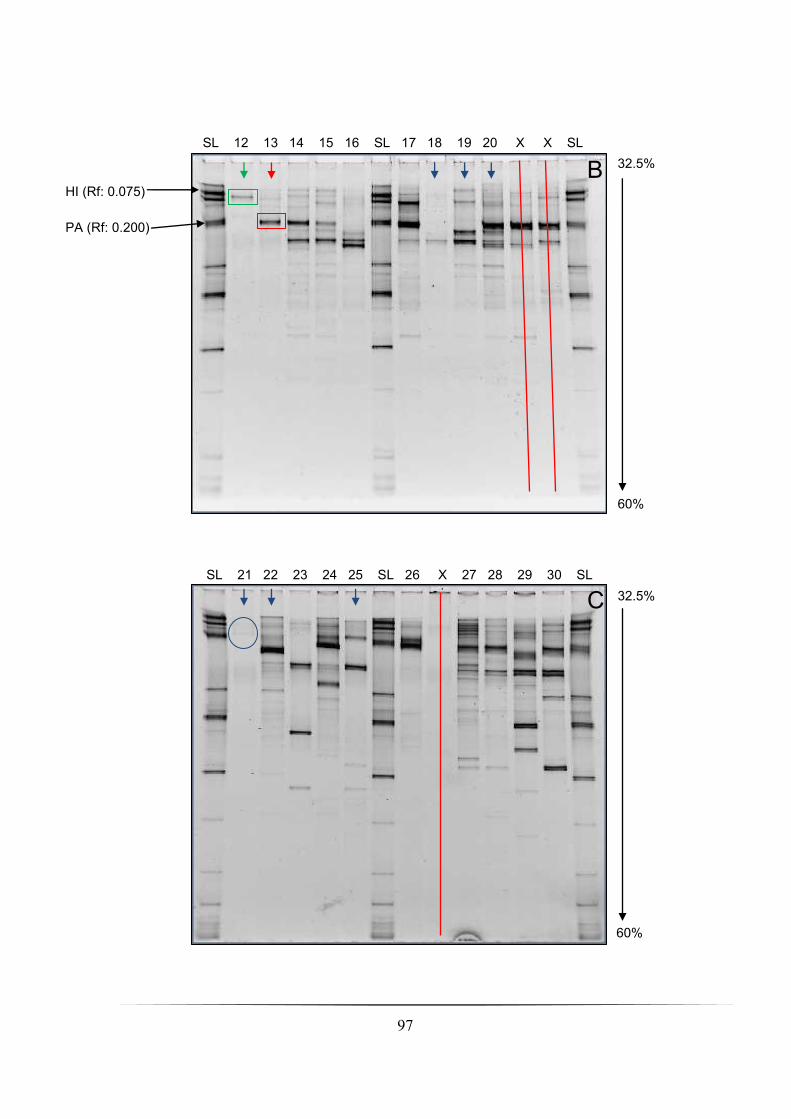
97
SL 12 13 14 15 16 SL 17 18 19 20 X X SL
SL 21 22 23 24 25 SL 26 X 27 28 29 30 SL
B
C
32.5%
60%
32.5%
60%
HI (Rf: 0.075)
PA (Rf: 0.200)

98
SL 31 32 33 34 35 SL 36 37 38 39 40 41 SL
SL 42 43 44 45 46 SL 47 48 49 50 51 52 SL
D
E 32.5%
60%
32.5%
60%
HI (Rf: 0.075)
SA (Rf: 0.100)
RP (Rf: 0.140)
PA (Rf: 0.200)
BCC/SM
(Rf: 0.400)
AX (Rf: 0.560)
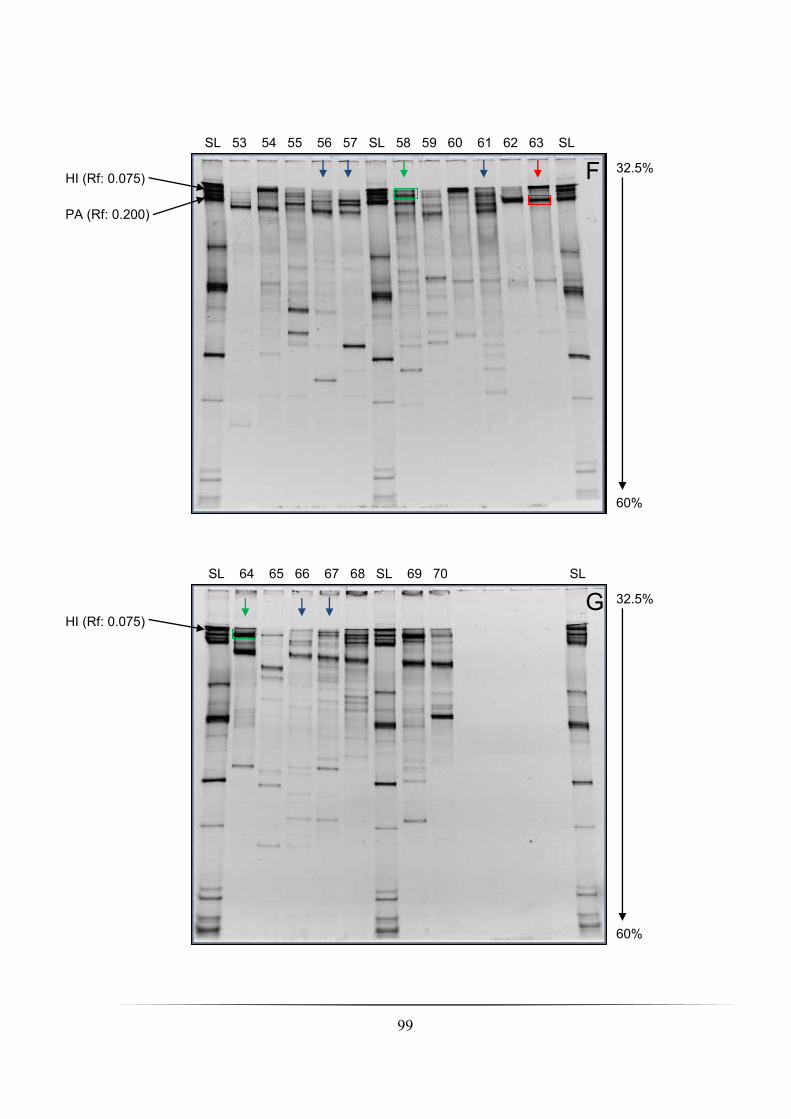
99
SL 53 54 55 56 57 SL 58 59 60 61 62 63 SL
SL 64 65 66 67 68 SL 69 70 SL
F
G 32.5%
60%
32.5%
60%
HI (Rf: 0.075)
PA (Rf: 0.200)
HI (Rf: 0.075)
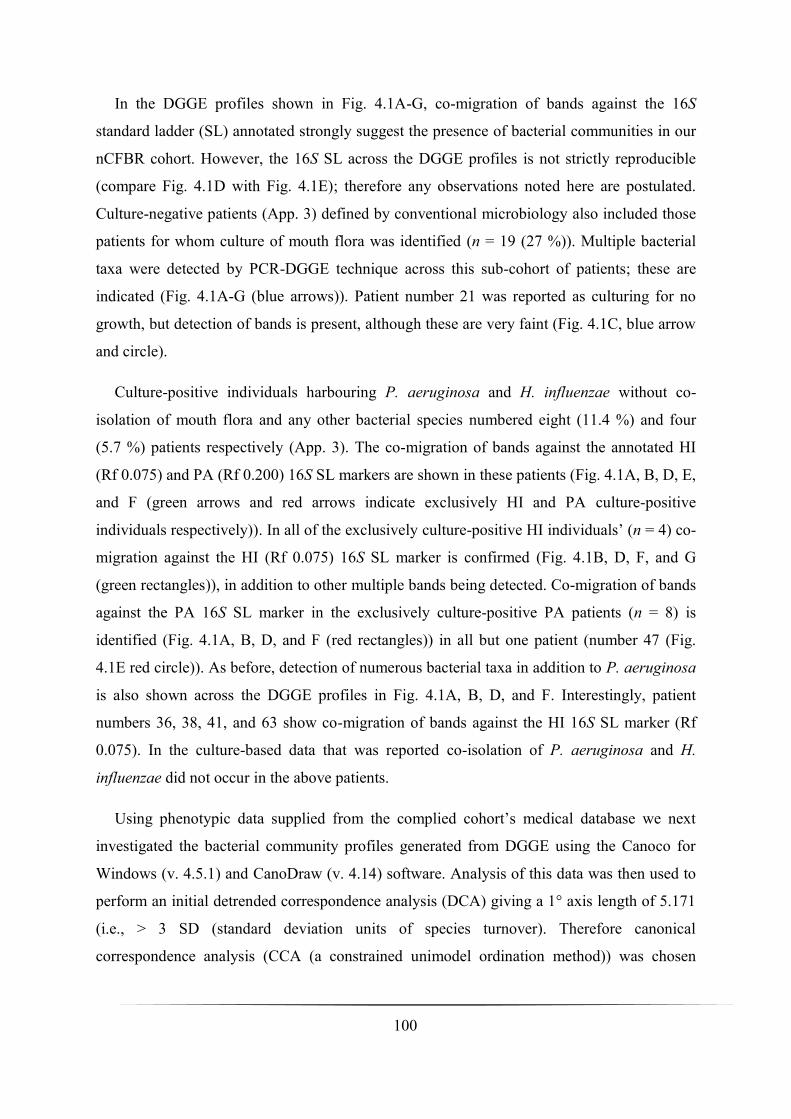
100
In the DGGE profiles shown in Fig. 4.1A-G, co-migration of bands against the 16S
standard ladder (SL) annotated strongly suggest the presence of bacterial communities in our
nCFBR cohort. However, the 16S SL across the DGGE profiles is not strictly reproducible
(compare Fig. 4.1D with Fig. 4.1E); therefore any observations noted here are postulated.
Culture-negative patients (App. 3) defined by conventional microbiology also included those
patients for whom culture of mouth flora was identified (n = 19 (27 %)). Multiple bacterial
taxa were detected by PCR-DGGE technique across this sub-cohort of patients; these are
indicated (Fig. 4.1A-G (blue arrows)). Patient number 21 was reported as culturing for no
growth, but detection of bands is present, although these are very faint (Fig. 4.1C, blue arrow
and circle).
Culture-positive individuals harbouring P. aeruginosa and H. influenzae without co-
isolation of mouth flora and any other bacterial species numbered eight (11.4 %) and four
(5.7 %) patients respectively (App. 3). The co-migration of bands against the annotated HI
(Rf 0.075) and PA (Rf 0.200) 16S SL markers are shown in these patients (Fig. 4.1A, B, D, E,
and F (green arrows and red arrows indicate exclusively HI and PA culture-positive
individuals respectively)). In all of the exclusively culture-positive HI individuals’ (n = 4) co-
migration against the HI (Rf 0.075) 16S SL marker is confirmed (Fig. 4.1B, D, F, and G
(green rectangles)), in addition to other multiple bands being detected. Co-migration of bands
against the PA 16S SL marker in the exclusively culture-positive PA patients (n = 8) is
identified (Fig. 4.1A, B, D, and F (red rectangles)) in all but one patient (number 47 (Fig.
4.1E red circle)). As before, detection of numerous bacterial taxa in addition to P. aeruginosa
is also shown across the DGGE profiles in Fig. 4.1A, B, D, and F. Interestingly, patient
numbers 36, 38, 41, and 63 show co-migration of bands against the HI 16S SL marker (Rf
0.075). In the culture-based data that was reported co-isolation of P. aeruginosa and H.
influenzae did not occur in the above patients.
Using phenotypic data supplied from the complied cohort’s medical database we next
investigated the bacterial community profiles generated from DGGE using the Canoco for
Windows (v. 4.5.1) and CanoDraw (v. 4.14) software. Analysis of this data was then used to
perform an initial detrended correspondence analysis (DCA) giving a 1° axis length of 5.171
(i.e., > 3 SD (standard deviation units of species turnover). Therefore canonical
correspondence analysis (CCA (a constrained unimodel ordination method)) was chosen

101
subjecting the entire cohort (n = 70) with permutation testing under full model (499
permutations) constraining the bacterial community profile variance with 14 measured
variables: presence of an exacerbation at sampling (P = 0.002); culture-positive for
pathogenic micro-organisms (P = 0.01); isolation of HI and PA from sputum (P = 0.006 and
0.06 respectively); persistent isolation of PA (P = 0.06); intermittent isolation of PA (P =
0.003); no isolation of PA (P = ND (not determined); antibiotic treatment within 1 month of
sample submission (P = 0.2); both current colomycin and azithromycin treatment (P = 0.8
and 0.6 respectively) gender (P = 0.2); FEV1% predicted (P = 0.7); frequent exacerbation (P
= 0.9) and finally age (P = 0.6). From the CCA three of the above variables tested for were
significant: current exacerbation at time of sampling (P = 0.002), culture-positive isolation of
H. influenzae (P = 0.006), and intermittent isolation of P. aeruginosa (P = 0.003). These
variables were significantly associated with the variance of the community structure (Fig.
4.2). Culture-positive identification of P. aeruginosa from sputum almost approached
significance (P = 0.062).
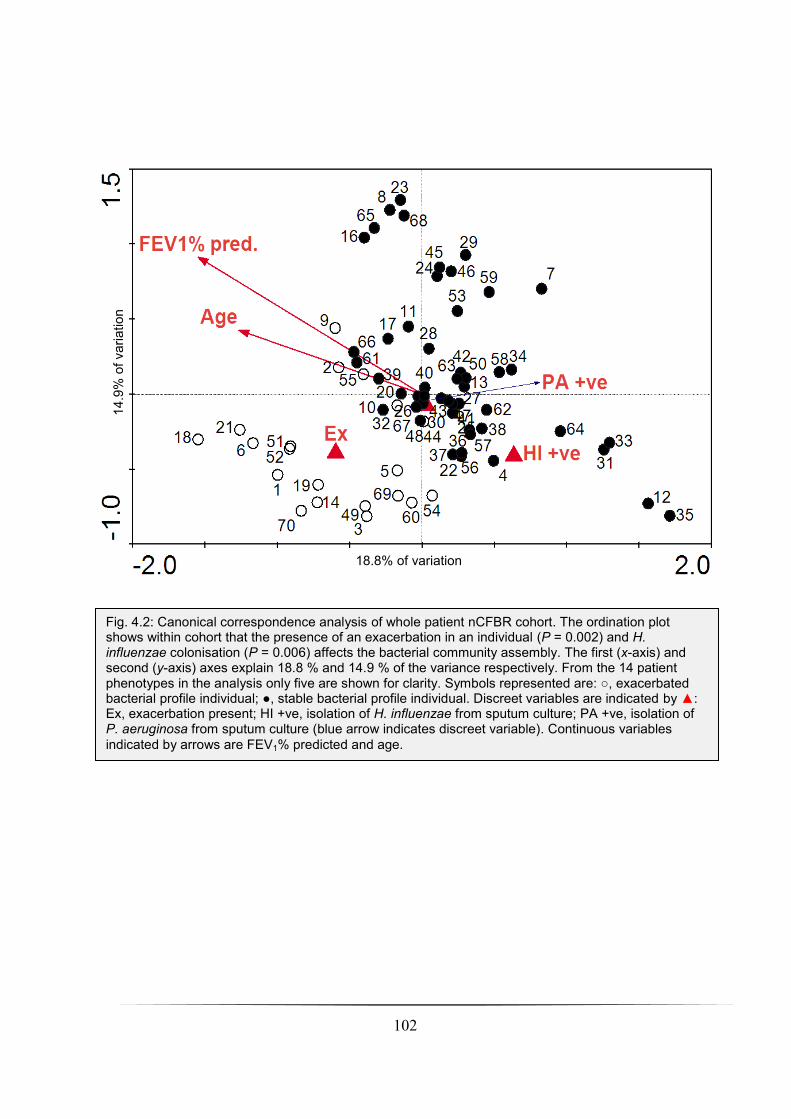
102
Fig. 4.2: Canonical correspondence analysis of whole patient nCFBR cohort. The ordination plot shows within cohort that the presence of an exacerbation in an individual (P = 0.002) and H. influenzae colonisation (P = 0.006) affects the bacterial community assembly. The first (x-axis) and second (y-axis) axes explain 18.8 % and 14.9 % of the variance respectively. From the 14 patient phenotypes in the analysis only five are shown for clarity. Symbols represented are: , exacerbated bacterial profile individual; , stable bacterial profile individual. Discreet variables are indicated by : Ex, exacerbation present; HI +ve, isolation of H. influenzae from sputum culture; PA +ve, isolation of P. aeruginosa from sputum culture (blue arrow indicates discreet variable). Continuous variables
indicated by arrows are FEV1% predicted and age.
18.8% of variation
explained
14.9
% o
f vari
ation
expla
ine
d
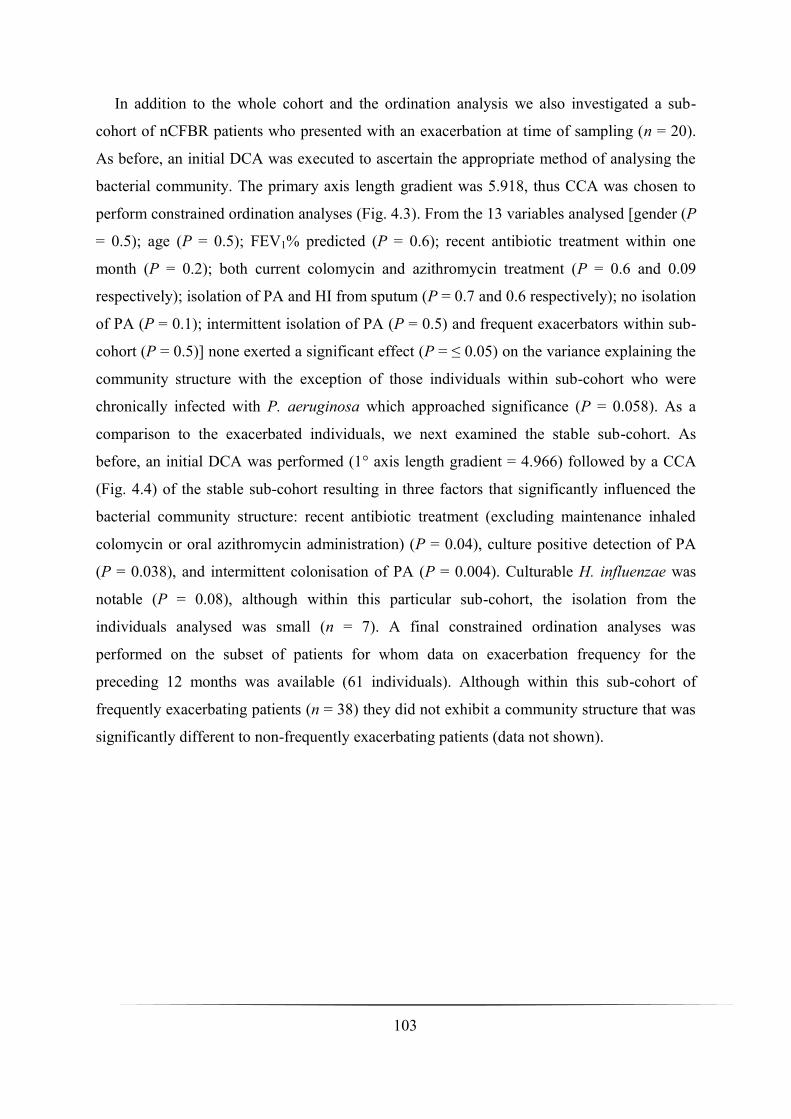
103
In addition to the whole cohort and the ordination analysis we also investigated a sub-
cohort of nCFBR patients who presented with an exacerbation at time of sampling (n = 20).
As before, an initial DCA was executed to ascertain the appropriate method of analysing the
bacterial community. The primary axis length gradient was 5.918, thus CCA was chosen to
perform constrained ordination analyses (Fig. 4.3). From the 13 variables analysed [gender (P
= 0.5); age (P = 0.5); FEV1% predicted (P = 0.6); recent antibiotic treatment within one
month (P = 0.2); both current colomycin and azithromycin treatment (P = 0.6 and 0.09
respectively); isolation of PA and HI from sputum (P = 0.7 and 0.6 respectively); no isolation
of PA (P = 0.1); intermittent isolation of PA (P = 0.5) and frequent exacerbators within sub-
cohort (P = 0.5)] none exerted a significant effect (P ≤ 0.05) on the variance explaining the
community structure with the exception of those individuals within sub-cohort who were
chronically infected with P. aeruginosa which approached significance (P = 0.058). As a
comparison to the exacerbated individuals, we next examined the stable sub-cohort. As
before, an initial DCA was performed (1° axis length gradient = 4.966) followed by a CCA
(Fig. 4.4) of the stable sub-cohort resulting in three factors that significantly influenced the
bacterial community structure: recent antibiotic treatment (excluding maintenance inhaled
colomycin or oral azithromycin administration) (P = 0.04), culture positive detection of PA
(P = 0.038), and intermittent colonisation of PA (P = 0.004). Culturable H. influenzae was
notable (P = 0.08), although within this particular sub-cohort, the isolation from the
individuals analysed was small (n = 7). A final constrained ordination analyses was
performed on the subset of patients for whom data on exacerbation frequency for the
preceding 12 months was available (61 individuals). Although within this sub-cohort of
frequently exacerbating patients (n = 38) they did not exhibit a community structure that was
significantly different to non-frequently exacerbating patients (data not shown).

104
Fig. 4.3: Canonical correspondence analysis of exacerbated nCFBR sub-cohort. Within this sub-cohort only chronic infection with P. aeruginosa (PA) approached significance (P = 0.058). The first (x-axis) and second (y-axis) axes explain 16.1 % and 12.8 % of the variance respectively. From the 14 patient phenotypes in the analysis only three are shown for clarity. Symbols represented are: , individuals with chronic PA infection bacterial profile; , individuals with non-chronic PA infection bacterial profile. Discreet variables are indicated by : chronic PA infection (blue arrow indicates discreet variable). Continuous variables indicated by arrows are FEV1% predicted and age.
16.1% of variation explained
12.8
% o
f vari
ation
expla
ine
d

105
Fig. 4.4: Canonical correspondence analysis of stable nCFBR sub-cohort. Discreet variables indicated by (blue arrows for clear indication) such as recent antibiotic treatment (RAbx) (P = 0.036), isolation of P. aeruginosa (PA) from sputum (P = 0.0038), and intermittent colonisation with P. aeruginosa (PAi) (P = 0.004) exerted an effect on the bacterial community structure in sub-cohort. Both gender and isolation of H. influenzae (HI) are shown in the CCA output as they were notable from the analysis performed (P = 0.06 and P = 0.08 respectively). The first (x-axis) and second (y-axis) axes explain 19.4 % and 15.8 % of the variance respectively. Symbols represented are: , individuals with recent antibiotic treatment bacterial profile; , non-treatment of antibiotics in patient bacterial profile. Continuous variables indicated by arrows are FEV1% predicted and age.
19.4% of variation
explained
15.8
% o
f vari
ation
expla
ine
d

106
4.3.4 Fungal DGGE analysis
From the DGGE analysis performed on whole cohort of the fungal community 1 distinct
band position was produced in two sputum samples, one each in patients 50 and 65. The band
was compared with a standard ladder of pure fungal isolates and co-migrated with the band
corresponding to Candida glabrata.
4.3.5 Bacterial community assembly
A total of 2,450 Raup-Crick pair-wise comparisons were carried out and the analysis
found that 71 (3 %) of pair-wise comparisons yielded statistically different (P ≤ 0.05)
communities than would be expected by chance; 225 (9 %) of pair-wise comparisons were
statistically similar (P ≥ 0.95) and the remaining 2,154 (88 %) had no statistical
significance (P 0.05 ≥ ≤ 0.95).
4.4 Discussion
We have demonstrated three substantive findings from the data presented. Firstly, that the
bacterial community profiles from exacerbating individuals were significantly different from
those of stable patients (Fig 4.1). From the twenty individuals recruited into the study that
were exacerbating when sputum was collected, fourteen individuals had not yet been
prescribed antibiotics for their symptoms suggesting that the data was not confounded by
therapeutic intervention. The remaining six patients were administered recent antibiotics. The
impact of exacerbation in nCFBR is in contrast to studies on the lower airway bacterial
community in the CF lung which significantly resulted in no change in community
composition as a result of these exacerbations (Tunney et al., 2011, Sibley et al., 2008). Both
culture-dependent and culture-independent studies in chronic obstructive pulmonary disease
(COPD) suggest that acquisition of new strains is highly associated with a risk of a COPD
exacerbation (Murphy et al., 2008, Sethi et al., 2002). Further studies are, therefore, needed to
define if nCFBR exacerbations are more analogous to COPD exacerbations rather than CF
exacerbations.
Secondly, as in previous studies (Angrill et al., 2002) we found 27 % of samples were
culture-negative for recognised pathogens. Molecular analyses demonstrated that these
samples did contain a bacterial community with on average 7 taxa which was not
significantly different from the culture-positive sputum. Measures of community diversity,

107
species richness and evenness did not indicate that these indices were significantly different
between the communities from culture-positive and culture-negative sputum. Moreover, the
community structure was also not significantly different between sputum samples that were
culture-positive or -negative. The significance of those taxa that are not routinely identified
by culture is unknown. Under some circumstances they may be pathogenic (Tunney et al.,
2008), or the increased bacterial load they represent may be associated with airway
inflammation and decline in lung function (Weinrich and Korsgaard, 2008). These data are
important when considering the management of a patient who fails to respond to antibiotic
regimens based on sensitivity results of the predominant species with culture data.
Finally, we have also shown that the presence of H. influenzae is significantly associated
with a distinct microbial community structure (Fig 4.2). In other studies, it is the most
common pathogen isolated from the nCFBR lung (Angrill et al., 2002, King et al., 2007,
Pasteur et al., 2001) and is particularly prevalent in paediatric patients. However, in our study
the most prevalent organism isolated from sputum was P. aeruginosa, which is in agreement
with a much earlier study (Nicotra et al., 1995), followed by H. influenzae. Infection with H.
influenzae typically follows a pattern of sequential colonisation by different strains of the
bacteria (Grimwood, 2011). H. influenzae stimulates mucous production and adheres to and
damages epithelial cells, there may also be a role for biofilm formation in resisting host
clearance from the lung (King, 2011a). A previous study on a cohort of paediatric CF
bronchiectasis patients identified that there was an inverse relationship between P.
aeruginosa and H. influenzae in both culture and metagenomic analyses of the microbial
communities (Klepac-Ceraj et al., 2010). However, it was unclear whether the inhibition of
H. influenzae was due to repeated antibiotic exposure, the arrival of P. aeruginosa, or indeed
both factors. It is striking in our study that H. influenzae was never co-isolated from sputum
with P. aeruginosa, which supports the observations of Klepac-Ceraj et al. (2010). Moreover,
H. influenzae was present in patients who had been subjected to long term and repeated
antibiotic therapy. This suggests a potentially significant relationship between P. aeruginosa
colonisation and the loss of H. influenzae from the LRT. P. aeruginosa has been shown to
inhibit the growth of H. influenzae in vitro (Riley and Hoffman, 1986) and the interaction
between these two major pathogens deserves further study.
108
There has been some evidence to suggest the stratification of patients with nCFBR based
on colonisation with P. aeruginosa, with those chronically infected showing significantly
lower lung function than intermittently or never colonised patients (Davis et al., 2006, King
et al., 2007, Martínez-García et al., 2007). Our data supports these finding with a significant
reduction in FEV1 % predicted (P = < 0.001) between those persistently versus intermittently
colonised (P = 0.002) and persistently versus never colonised patients (P = < 0.001). The
presence of P. aeruginosa has been previously linked to reduced diversity in the bacterial
communities in the CF lung (Klepac-Ceraj et al., 2010). Bacterial communities isolated from
older CF patients are less diverse, more phylogenetically similar and increasingly dominated
by Pseudomonas than those of younger CF patients (Cox et al., 2010). Within the total
nCFBR cohort there was not a significant association between a patient ever having been
colonised by P. aeruginosa and the bacterial community structure. In the stable cohort (n =
50) the bacterial communities which are intermittently colonised with P. aeruginosa are
significantly different from those never or persistently colonised (Fig. 4.3). In CF, persistent
colonisation is associated with mucoid strains of P. aeruginosa and those that have acquired
mutations enhance their adaptation to the CF lung (Grimwood, 2011). In contrast, these
adaptations are not observed in COPD strains with P. aeruginosa infections being more
intermittent and sporadic (Rakhimova et al., 2009). Currently, the persistence of P.
aeruginosa infection and its impact on the overall bacterial community in nCFBR is not
known. Our data suggests that P. aeruginosa infections are less likely to persist than those
seen in CF as only 23 of 70 patients showed persistent P. aeruginosa infection. It has also
been shown that measures of quality of life are significantly lower in patients colonised by P.
aeruginosa compared to those that were culture-negative or where H. influenzae was the
predominant pathogen (Wilson et al., 1997). The factors determining persistence require
further study as they may allow new therapeutic interventions and a reduction in the
morbidity associated with persistent P. aeruginosa infection.
In this study, the patient cohort was recruited from an nCFBR out-patients clinic and as a
result the administration of different antibiotics to individuals within the cohort may be a
confounding factor to these analyses. We identified 25 patients that were not receiving any
antibiotics for one month prior to the collection of samples. Ordination analyses showed that
these individuals did not have a significantly different bacterial community to those who
were receiving antibiotic therapy. Clinical observations show that antibiotics suppress the

109
symptoms of exacerbations but have limited effects on chronic symptoms (Anwar et al.,
2008). This may be because the non-CF community as in the CF lung are spatially
heterogeneous. As a result antibiotic treatment may be ineffective against infections in some
areas of the lung (Willner et al., 2012). Our data suggests that antibiotics do not cause a
significant perturbation of the bacterial community in the lower airway as determined by
analysis of expectorated sputum.
The assembly of the bacterial community in the nCFBR lung does not follow strictly niche
or neutral processes, Whereas, the Raup-Crick similarity index of the cohort profiles showed
that the majority (88 %) of pair wise comparisons between bacterial profiles indicated neutral
(random) community assembly as is observed in the CF lung (van der Gast et al., 2011).
Ordination analyses demonstrated a significant role of exacerbation and, colonisation by H.
influenzae on the community structure suggesting that these factors were drivers for a
specific niche community to develop. Similar observations have been reported in other
microbial systems (Dumbrell et al., 2010) where initial community assembly is by random
immigration of taxa. However, as a community structure develops and interacts with the host
lung, environmental niches develop that are occupied by species best adapted to them,
resulting in highly adaptable species such as P. aeruginosa being common components of the
lung microbiome. There appears little consistent colonisation by fungal pathogens within this
patient cohort, which is in contrast to the CF airway where fungi have been implicated with
lung function decline and increased exacerbations (Bouchara et al., 2009, Chotirmall et al.,
2010).
Although we have demonstrated that the lower airways of nCFBR patients are dominated
by numerous bacterial taxa by a 16S rRNA PCR-DGGE strategy, there are still limitations in
using this approach. Firstly, the reproducibility of the 16S SL across the DGGE profiles
generated and their inherent variance (Fig. 4.1A-G) between these profiles means that the
assignment of any bacterial taxa must be postulated. This is additionally confounded by the
lack of sequencing data to support our claims when comparing the co-migration of bands in
individual patients against the 16S SL markers. Indeed, it has been previously demonstrated
that PCR fragments from different bacterial species can also migrate at the same rate
confounding bacterial species identification even further (Jackson et al., 2000). Other caveats
in using 16S rRNA PCR-DGGE technique to analyse microbial communities also include

110
heterogeneity in the 16S rRNA gene itself which can often lead to an overestimation of the
bacterial community being investigated (Dahllöf et al., 2000, Nübel et al., 1996). Another
problem is that the microbial population in using PCR-DGGE is misrepresented or biased
because of the detection limits in using the technique, i.e., the rDNA amplicons generated
only represent the dominant members present in the community (Muyzer and Smalla, 1998).
Analysis of sputa using conventional microbiology resulted in either H. influenzae or P.
aeruginosa being isolated; none were co-isolated in our whole patient cohort. However, using
PCR-DGGE we have revealed that in four patients (Fig. 4.1D and F (numbers 36, 38, 41, and
63)) who were exclusively culture-positive for P. aeruginosa, co-migration of bands
corresponding to the HI 16S SL marker were identified. This identification of H. influenzae is
postulated as comparing bands against a 16S SL is limited by several factors, such as the
above. Additionally, the identification of these co-migrated bands could also be assigned
either Haemophilus parainfluenzae or Haemophilus haemolyticus. However, without any
sequencing data available from the multitude of bands in each patient presented here, the
identification of H. influenzae and indeed any other bacterial taxon is presumptive at best.
Previous studies have demonstrated that even with molecular phylotyping techniques, the
assignment of species within the Haemophilus genus itself is difficult (Hedegaard et al.,
2001, Nørskov-Lauritsen et al., 2009). An additional culture-independent approach which
would have supplemented the data from our PCR-DGGE analysis would have been to
employ a deep sequencing strategy via 454-pyrosequencing.
Using conventional microbiology resulted in the detection of 14 bacterial taxa (12 taxa
were identified to species level, the two remaining taxa identified to genus level) across our
patient cohort. However, in each patient the maximum number of bacterial taxa identified
was only two species. Selective media in diagnostic microbiology laboratories is a mitigating
factor in this. The use of artificial media is limited in that only 1 % of bacteria can be cultured
in vitro (Amman et al., 1995, Rappé and Giovannoni, 2003, Staley and Konopka, 1985) this
is in addition that several human diseases are now being increasingly recognised as being
polymicrobial in nature. Nevertheless, the employment of selective media is still very useful
for the determination of bacterial species morphotypes such as the mucoid phenotype in P.
aeruginosa which is frequently observed in chronically infected CF patients (Foweraker,
2009).

111
In the past decade it has been previously shown that using culture-independent techniques
to investigate other chronic pulmonary diseases that LRT infections could be polymicrobial
in nature, as seen in CF (Bittar et al., 2008, Harris et al., 2007, Rogers et al., 2005a, Rogers et
al., 2004, Rogers et al., 2003) and increasingly in (COPD) (Cabrera-Rubio et al., 2012, Erb-
Downward et al., 2011, Hilty et al., 2010, Huang et al., 2010, Pragman et al., 2012, Sze et al.,
2012). Clinical microbiology studies in nCFBR executed a conventional microbiological
approach using sputum as a diagnostic marker of bacterial infection. Presently, no studies
exist that have investigated the lung microbiome of non-cystic fibrosis patients employing
metagenomic culture-independent techniques Recently, a study by Maughan et al., (2012)
profiled lung tissue samples in both nCFBR (n = 10) and CF (n = 21) patients by a 16S rRNA
clone library approach. They demonstrated a significant bacterial diversity in the
bronchiectasis patients analysed, 955 16S rRNA gene sequences were obtained respectively,
pertaining to 20 genera being identified in the bronchiectasis sub-cohort alone. Additionally,
the most prevalent genus was that of Pseudomonas which was present in all ten
bronchiectasis patients profiled. Interestingly, H. influenzae was detected in only one nCFBR
individual. Maughan, et al., (2012) suggest that this could be attributable to the sample type
analysed; tissue sections from end-stage lung disease as opposed to sputum in earlier nCFBR
studies in which the isolation of H. influenzae is highly prevalent (Angrill et al., 2002, King
et al., 2007, Nicotra et al., 1995, Pasteur et al., 2001). The authors also concluded that no
significant differences in the community structure between the nCFBR and CF patients were
observed (Maughan et al., 2012).
The recent study by Maughan, et al., (2012) partly corroborates our culture-independent
data, in particular the finding of significant bacterial diversity in their cross-sectional cohort
against our conventional microbiology data. However, in the 16S rRNA PCR-DGGE
methodology we carried out, expectorated sputum was profiled for bacterial community
analysis not lung tissue sections. Additionally, a comparison of the bacterial genera that was
identified in the above study from our own data cannot be drawn as no sequencing data was
available from our own DGGE profiles that were generated in our nCFBR cohort.
112
4.5 Conclusions
We have demonstrated that the microbial community of the lower airway in nCFBR is
dominated by bacterial taxa. Using a 16S rRNA PCR-DGGE approach has revealed several
putative bacterial taxa in patients who were initially diagnosed as being culture-negative by
using conventional microbiology, although these additional bands could represent the
microbial flora in the URT. Furthermore, application of this culture-independent technique
has enabled us to discern both H. influenzae and P. aeruginosa taxa identification in four
patients who were all exclusively culture-positive for P. aeruginosa. This assignment of the
above taxa in these patients is postulated as no sequencing data was obtainable from any of
the PCR-DGGE profiles generated in conjunction to the limitations of the technique
employed.
Patient exacerbations appear to be associated with a significant shift in the bacterial
community therefore, identifying the taxa responsible for these changes are a priority as they
may help explain the cause of exacerbation events. H. influenzae, when present in the lower
airway, is associated with a distinct community profile. However, there appears to be a
negative correlation between the presence of P. aeruginosa and the persistence of H.
influenzae. Understanding the nature of this interaction is of interest as it may cast light on
the persistence of H. influenzae in the lower airway and the dynamics of the microbial
community as a whole. In agreement with other studies we have demonstrated that P.
aeruginosa is a significant pathogen in nCFBR. Patient cohorts do appear to be stratifiable on
the basis of the presence and persistence of infection by this bacterium which may be relevant
to the design of future intervention trials.

113
Chapter Five: Molecular fingerprinting and metagenomic analysis in a chronic obstructive pulmonary
disease cohort
5.1 Abstract
Culture-independent studies of chronic obstructive pulmonary disease (COPD) are only
recently coming to light. Little is known about the role of bacterial colonisation in stable
COPD populations. Earlier studies used sputum and classical conventional microbiological
techniques to characterise infection in COPD patients. Bronchoalveolar lavage (BAL) fluid
was taken from the right lower lobe (RLL) from which genomic DNA (gDNA) was
extracted. This was then used as template for amplification of 16S rRNA and 28S rRNA
genes. Amplicons were then run out for molecular fingerprinting by denaturing gradient gel
electrophoresis (DGGE). Metagenomic analysis of the 16S rRNA gene using 454-
pyrosequencing was also performed. Both culture-independent techniques and the bacterial
taxa identified were then subjected to multivariate statistical analysis. Culture-based detection
resulted in four species. The DGGE profiles produced a distinct number of bands in each
sample. The co-migration of bands in each BAL sample was compared against a 16S and 28S
standard ladder enabling putative assessment of which taxa were present. Metagenomic
analysis generated 1799 unique OTUs (operational taxonomic units) with the dominant
genera identified being Streptococcus, Arthrobacter, and Staphylococcus species respectively
across patient cohort. Bacterial OTUs resolved to class-level were found to be significantly
associated with lung function (P = 0.002), moderate and severe COPD (P = 0.04), and
smoking status (P = 0.05) of patient phenotypes in cohort. Using two culture-independent
approaches we have characterised a polymicrobial community in eleven clinically stable
COPD patients. Against conventional microbial culture, we have demonstrated the detection
of a greater number of bacterial taxa and identified potential drivers of community structure
within the COPD lung microbiome.

114
5.2 Background
Chronic obstructive pulmonary disease is a serious and highly debilitating condition which
is an increasing global health problem, ranked the sixth most common cause of mortality
worldwide in 1990 (Barnes, 2007), by the year 2020 it is predicted to become the third most
common cause of death worldwide and fifth in the cause of disability (Lopez and Murray,
1998). COPD is defined as “a disease state characterised by airflow limitation that is not fully
reversible. The airflow limitation is usually progressive and associated with an abnormal
inflammatory response of the lungs to noxious particles and gases” (Pauwels et al., 2001).
Overall, the most determining factor in the cause of COPD is cigarette smoking (> 95 % of
cases in developed countries); however, several other risk factors have been proposed:
genetic disposition, poor diet, occupational exposure, and air pollution (Barnes et al., 2003).
COPD patients commonly exhibit a disparate, overlapping, multi-factorial pathology of the
lower respiratory tract (LRT); including chronic bronchitis, emphysema, mucus plugging,
asthma, bronchiectasis, and bronchiolitis (Stockley et al., 2009). Chronic illnesses such as
cardiovascular disease, depression, osteoporosis, and lung cancer have also been shown to be
adjunct risk factors in patients with COPD (Decramer et al., 2008). Lung pathology in COPD
patients leads to episodes of acute exacerbations, i.e., increased dyspnoea, cough, sputum
volume and purulence. Over time as COPD progresses, these exacerbations both increase in
frequency and severity leading to higher rates of morbidity and mortality in patients
(Wedzicha and Wilkinson, 2006).
Historically, the cause of exacerbations was hypothesised to be predominantly by tobacco
smoke. However, in the past two decades the cellular and pathological mechanisms that occur
during bacterial and viral infections in the respiratory tract has been defined more clearly. In
light of this knowledge, there is considerable evidence that infection in COPD patients is now
the predominant cause of exacerbations (Sethi et al., 2002, Papi et al., 2006, Murphy et al.,
2008, Murphy et al., 2005), although the roles that bacterial and viral agents predispose
COPD patients to colonisation or infection with initial development of this disease is less
clear and still controversial (Huang and Lynch, 2011). Lung structural damage caused by
COPD gives rise to disruption of the innate respiratory tract defences causing mucus gland
hypertrophy, hypersecretion, mucocilliary escalator disruption, airway antimicrobial peptide
down regulation, and impaired alveolar macrophage function, facilitating the adherence of
bacteria when they come into contact with the lower epithelial airways (Bourke, 2002, Sethi

115
et al., 2009). Colonisation of bacteria in the lower airways induces not only chronic infection
in some cases, but also elicits an inflammatory response in COPD patients; both of these
factors mitigate disease progression. This phenomenon is known as the vicious circle
hypothesis proposed several years ago (Murphy and Sethi, 1992).
The role of bacteria in exacerbations has been primarily investigated in COPD using
culture-dependent approaches. These methods have led to the routine isolation of four
bacterial pathogens, non-typeable Haemophilus influenzae (NTHI), Moraxella catarrhalis,
Streptococcus pneumoniae, and Pseudomonas aeruginosa (Sethi and Murphy, 2001);
acquisition of new bacterial strains relating to these four species isolates has been previously
shown to induce exacerbations in COPD patients resulting in notably increased airway
inflammation in contrast to those COPD patients whose exacerbations were not associated
with a new strain (Sethi et al., 2007). Indeed, bacterial infection in COPD is associated with ~
50 % of exacerbations with isolation of H. influenzae species accounting for 20-30 % of
known bacterial isolates in COPD patients (Huang and Lynch, 2011). Other bacterial isolates
such as Staphylococcus aureus, Haemophilus parainfluenzae, Haemophilus haemolyticus,
and members from the Enterobacteriaceae family have also been detected in COPD but their
role in exacerbating the condition of the disease, particularly in stable COPD patients is
unlikely (Sethi and Murphy, 2008). The use of culture-independent techniques exploiting the
bacterial 16S rRNA gene for metagenomic analysis has only recently come to light in COPD
(Erb-Downward et al., 2011, Hilty et al., 2010, Huang et al., 2010), unlike that of CF disease
where several studies have been previously published (Bittar et al., 2008, Harris et al., 2007,
Rogers et al., 2005a, Rogers et al., 2004, Rogers et al., 2003). Publications in COPD using
these culture-independent techniques have successfully demonstrated that the lower airways
of COPD subjects are composed of a resident microbial community (termed the lung
microbiome), critically, said studies have also elucidated that the LRT in healthy individuals
is also colonised with bacteria thus challenging the notion that the lower airways are a
completely sterile environment. Definitively speaking, the presence of a lung microbiome in
healthy individuals must be approached with caution as they are practical challenges in
sampling the lower airways in human subjects such as oropharyngeal contamination in
addition to the establishment of what actually constitutes a “healthy” individual in terms of
pulmonary disease, as some conditions can be sub-clinical in their presentation. These
116
measures must also be expressed when assessing the lung microbiome in other chronic
pulmonary diseases previously mentioned.
As well as bacterial, viral infection is hypothesised to be a major determinant in inducing
acute exacerbations in COPD patients especially during the winter season (Wedzicha, 2004).
Viruses such as influenza A and B, rhinovirus, and adenovirus are highly prevalent in the
community during these months and could be triggers of acute exacerbations in COPD
patients. Pulmonary function decline and increases in clinical symptom severity in viral and
bacterial co-infection in COPD patients has also been shown in exacerbations thus
lengthening hospital bed stay (Papi et al., 2006, Wilkinson et al., 2006). Fungal infection
induced acute exacerbation in COPD is currently undefined and their pathogenesis is not yet
known, however, associations between the eukaryotic fungal pathogen Pneumocystis jiroveci
and lower airway colonisation in COPD has been demonstrated (Morris et al., 2004).
This chapter describes a comparison between traditional culture-based detection versus
both molecular fingerprinting and a metagenomic approach via DGGE and next generation
sequencing provided by 454-pyrosequencing from the eleven clinical samples analysed.
Colonisation of bacteria in the lower airways due to the impairment of the innate immune
system in the respiratory tract in COPD patients is hypothesised to be major contributing
factor for the induction of acute exacerbations. This constant microbe-host agonist
autoimmune response plays a major role in the damage of the lung tissue architecture as in
the vicious circle hypothesis. The investigation of these colonising bacteria, and indeed viral
infection, in COPD is critical for effective prophylactic and antibiotic administration regimen
development to treat this increasingly significant disease.
5.3 Results
5.3.1 Patient cohort analysis
From the 11 patients within the cohort (App. 5), they were two females (CS#9 and CS#12)
and nine males, of which 3 were current smokes (CS#5, CS#9, and CS#10) the rest ex-
smokers (n = 8). Patient CS#11 was unable to submit a BAL sample so bronchial secretions
(BS) were produced instead. Mean age (65), height (1.65 m), forced expiratory volume in one
second (FEV1) (1.40), and FEV1% predicted (50 %) of cohort were also calculated

117
respectively. The FEV1% predicted was also used to ascertain how severe the COPD was in
each patient according to the GOLD (Global Initiative for Chronic Obstructive Lung Disease)
stages of COPD. Patients at time of sampling presented with either GOLD stage II (i.e.,
moderate COPD clinical diagnosis; FEV1/FVC (forced vital capacity) < 0.7 L or 50 % ≤
FEV1 < 80 % predicted (CS#4, CS#7, CS#9, and CS#12)) or GOLD stage III (i.e., severe
COPD; FEV1/FVC < 0.7 L or 30 % ≤ FEV1 < 50 % predicted (CS#1, CS#3, CS#5, CS#6,
CS#8, CS#10, and CS#11)). Two patients were not receiving treatment for their COPD at the
time of sampling (CS#4 and CS#9); only one patient (CS#4) had a previous high-resolution
computed tomography (HRCT) scan resulting in a diagnosis of emphysema in addition to
their COPD condition.
5.3.2 Culture-dependent analysis of clinical samples
All eleven patients enrolled in the study had routine culture and sensitivity testing
performed in the Microbiology Department, Freeman Hospital, Newcastle upon Tyne, by
Health & Care Professions Council (HCPC) registered Biomedical Scientists on the clinical
samples submitted, i.e., 10 BALFs and 1 BS sample. Note that sample numbers do not follow
consecutively as COPD subject 2 (CS#2) was later found not to be diagnosed with COPD and
was subsequently removed from this study. From the eleven COPD subjects, five were
positive for isolation of potentially pathogenic bacterial species, in which four COPD
subjects’ yielded typical bacterial species associated with COPD exacerbations (CS#1, S.
pneumoniae; CS#3, H. influenzae; CS#8, M. catarrhalis, H. influenzae; and CS#10, M.
catarrhalis). Detection of an atypical pathogen in COPD was observed in CS#6 in which
growth for Chryseobacterium indologenes was positive. The remaining six other COPD
subjects yielded culture-negative growth; CS#4, CS#5, CS#7, CS#9, CS#11, and CS#12. Out
of the 11 COPD patients, only CS#3 was positive for the growth of the yeast forming
Candida spp. (species name was undetermined form the culture-based data provided).
5.3.3 Ecological analysis of bacterial and fungal communities by DGGE
Molecular fingerprinting analysis by DGGE of the 11 COPD subjects yielded 23 and 18
distinct bands for the bacterial and fungal community analysed respectively. From the
bacterial DGGE profile generated (Fig. 5.1) a mean of 8 bands per lane was deduced (2-17
bands present per lane), whereas in the fungal DGGE profile (Fig. 5.2), band range was less,
2-10 bands per lane, with a mean value of 5 bands per lane. Each individual band from the
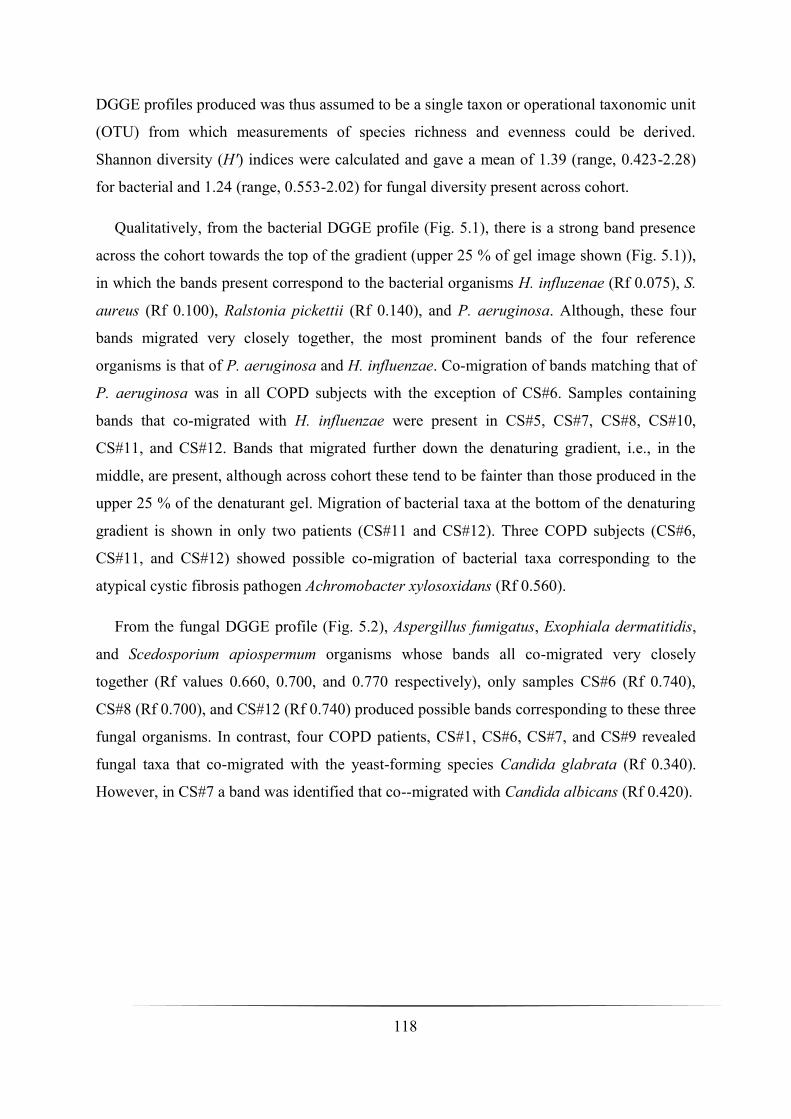
118
DGGE profiles produced was thus assumed to be a single taxon or operational taxonomic unit
(OTU) from which measurements of species richness and evenness could be derived.
Shannon diversity (H′) indices were calculated and gave a mean of 1.39 (range, 0.423-2.28)
for bacterial and 1.24 (range, 0.553-2.02) for fungal diversity present across cohort.
Qualitatively, from the bacterial DGGE profile (Fig. 5.1), there is a strong band presence
across the cohort towards the top of the gradient (upper 25 % of gel image shown (Fig. 5.1)),
in which the bands present correspond to the bacterial organisms H. influzenae (Rf 0.075), S.
aureus (Rf 0.100), Ralstonia pickettii (Rf 0.140), and P. aeruginosa. Although, these four
bands migrated very closely together, the most prominent bands of the four reference
organisms is that of P. aeruginosa and H. influenzae. Co-migration of bands matching that of
P. aeruginosa was in all COPD subjects with the exception of CS#6. Samples containing
bands that co-migrated with H. influenzae were present in CS#5, CS#7, CS#8, CS#10,
CS#11, and CS#12. Bands that migrated further down the denaturing gradient, i.e., in the
middle, are present, although across cohort these tend to be fainter than those produced in the
upper 25 % of the denaturant gel. Migration of bacterial taxa at the bottom of the denaturing
gradient is shown in only two patients (CS#11 and CS#12). Three COPD subjects (CS#6,
CS#11, and CS#12) showed possible co-migration of bacterial taxa corresponding to the
atypical cystic fibrosis pathogen Achromobacter xylosoxidans (Rf 0.560).
From the fungal DGGE profile (Fig. 5.2), Aspergillus fumigatus, Exophiala dermatitidis,
and Scedosporium apiospermum organisms whose bands all co-migrated very closely
together (Rf values 0.660, 0.700, and 0.770 respectively), only samples CS#6 (Rf 0.740),
CS#8 (Rf 0.700), and CS#12 (Rf 0.740) produced possible bands corresponding to these three
fungal organisms. In contrast, four COPD patients, CS#1, CS#6, CS#7, and CS#9 revealed
fungal taxa that co-migrated with the yeast-forming species Candida glabrata (Rf 0.340).
However, in CS#7 a band was identified that co--migrated with Candida albicans (Rf 0.420).
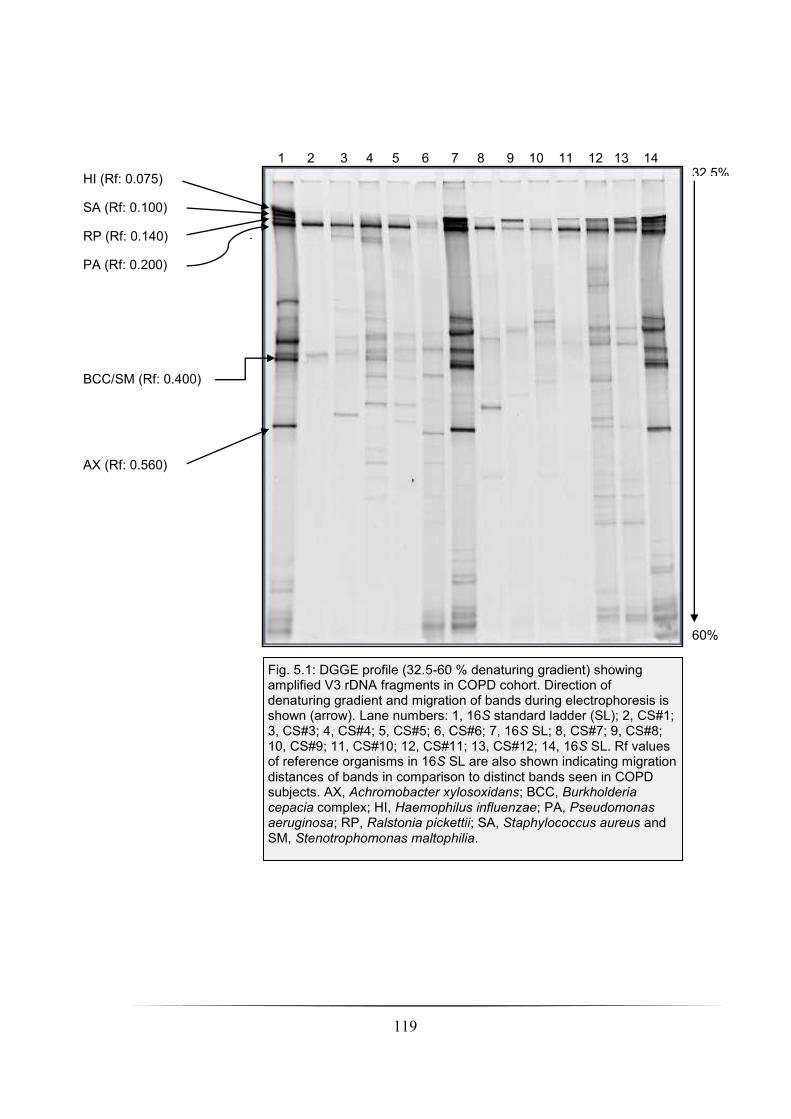
119
HI (Rf: 0.075)
SA (Rf: 0.100)
RP (Rf: 0.140)
PA (Rf: 0.200)
BCC/SM (Rf: 0.400)
AX (Rf: 0.560)
Fig. 5.1: DGGE profile (32.5-60 % denaturing gradient) showing amplified V3 rDNA fragments in COPD cohort. Direction of denaturing gradient and migration of bands during electrophoresis is shown (arrow). Lane numbers: 1, 16S standard ladder (SL); 2, CS#1; 3, CS#3; 4, CS#4; 5, CS#5; 6, CS#6; 7, 16S SL; 8, CS#7; 9, CS#8; 10, CS#9; 11, CS#10; 12, CS#11; 13, CS#12; 14, 16S SL. Rf values of reference organisms in 16S SL are also shown indicating migration distances of bands in comparison to distinct bands seen in COPD subjects. AX, Achromobacter xylosoxidans; BCC, Burkholderia cepacia complex; HI, Haemophilus influenzae; PA, Pseudomonas aeruginosa; RP, Ralstonia pickettii; SA, Staphylococcus aureus and SM, Stenotrophomonas maltophilia.
1 2 3 4 5 6 7 8 9 10 11 12 13 14 32.5%
60%
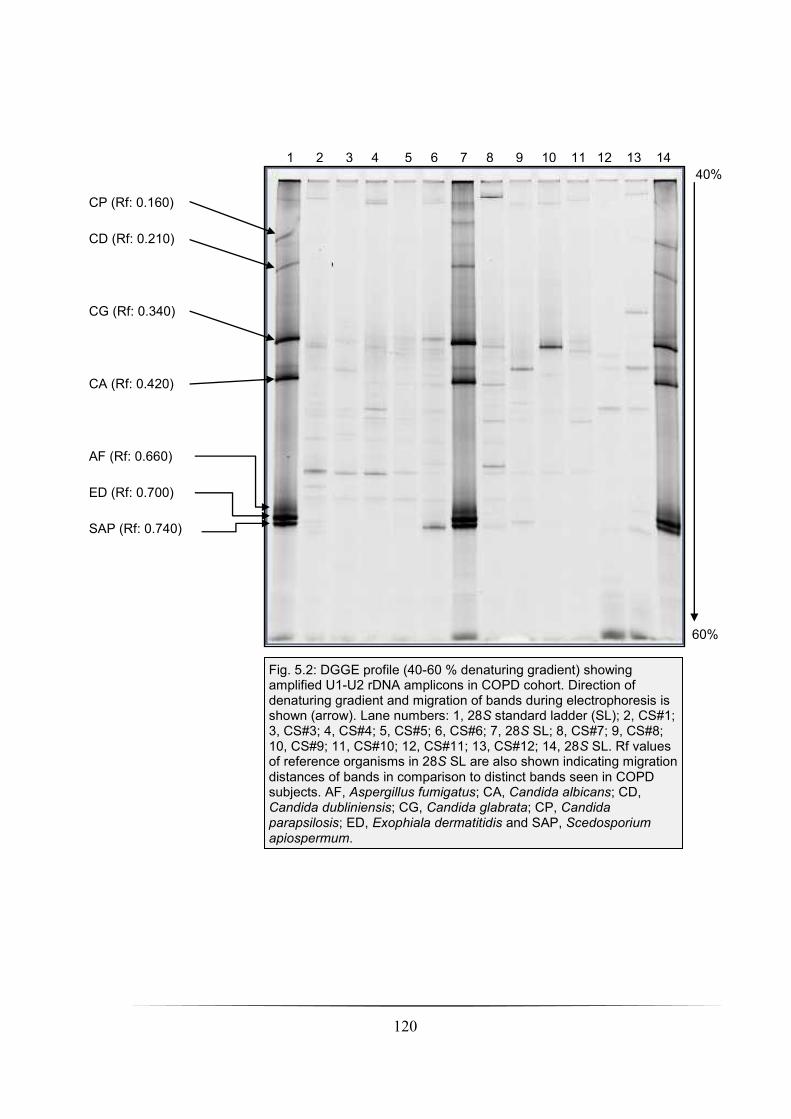
120
Fig. 5.2: DGGE profile (40-60 % denaturing gradient) showing amplified U1-U2 rDNA amplicons in COPD cohort. Direction of denaturing gradient and migration of bands during electrophoresis is shown (arrow). Lane numbers: 1, 28S standard ladder (SL); 2, CS#1; 3, CS#3; 4, CS#4; 5, CS#5; 6, CS#6; 7, 28S SL; 8, CS#7; 9, CS#8; 10, CS#9; 11, CS#10; 12, CS#11; 13, CS#12; 14, 28S SL. Rf values of reference organisms in 28S SL are also shown indicating migration distances of bands in comparison to distinct bands seen in COPD subjects. AF, Aspergillus fumigatus; CA, Candida albicans; CD, Candida dubliniensis; CG, Candida glabrata; CP, Candida parapsilosis; ED, Exophiala dermatitidis and SAP, Scedosporium apiospermum.
1 2 3 4 5 6 7 8 9 10 11 12 13 14
CP (Rf: 0.160)
CD (Rf: 0.210)
CG (Rf: 0.340)
CA (Rf: 0.420)
AF (Rf: 0.660)
ED (Rf: 0.700)
SAP (Rf: 0.740)
40%
60%
121
Ordination plots using Canoco for Windows (v. 4.5.1) of both the bacterial and fungal
communities in the COPD cohort analysed were produced. The bacterial community from the
DGGE profile generated was analysed by detrended correspondence analysis (DCA)
producing a 1° axis length of 2.336 (i.e., < 3 SD (standard deviation units of species turnover)
so a redundancy analysis (RDA; a constrained linear ordination method) was executed to
analyse the relationship between the bacterial taxa present and environmental variables
within cohort at time of sampling. Using Monte Carlo full model permutation testing (499
permutations), analysis of both the contiguous and discreet variables (seven in total
including: age (P = 0.612); FEV1% predicted (P = 0.488); gender (P = 0.374); GOLD COPD
stage (P = 0.662); height (P = 0.444) and smoking status (P = 0.274)) against the bacterial
community resulted in no significant association between these variables and the variance
seen in the community profile. GOLD COPD stages II and III discreet variables were
removed from the RDA ordination plot for clarity (Fig. 5.3). The two axes explained 61.5 %
and 19.3 % of the variation.
The fungal community analysed by DGGE was also used to generate a second ordination
plot in which DCA resulted in a 1° axis length of 3.745 (> 3 SD), therefore canonical
correspondence analysis (CCA; a constrained unimodel ordination method) was utilised to
investigate the relationship between the fungal taxa and seven environmental variables within
cohort as above; age; FEV1% predicted; gender; GOLD COPD stage; height and smoking
status. As before, full model Monte Carlo permutation execution of the fungal community
present and the environmental variables resulted in no significant associations between the
variance of the community profiles and the discreet and continuous variables (age (P= 0.456);
FEV1% predicted (P = 0.75); gender (P = 0.526); GOLD COPD stage (P = 0.3); height (P =
0.252) and smoking status (P = 0.596)). The first and second axes explained 31.8 % (x-axis)
and 26.7 % (y-axis) variation observed in the dataset (Fig. 5.4). As previously, GOLD COPD
stages II and III discreet variables were removed in the fungal CCA ordination plot for the
purposes of clarity.

122
Fig. 5.3: Redundancy analysis showing ordination plot of the bacterial community analysed by DGGE and environmental variables in COPD cohort. An association with the relationship between community structure and environmental variables was not significant. The x-axis explains 61.5 % of the variation, whereas the y-axis explains 19.3 % respectively. Environmental factors shown consisted of both continuous (height and FEV1% predicted) and indiscreet variables (smoking status and patient gender). CS.X, COPD subject number ( male; female); ES, ex-smoker; F, female; FEV1 Pr, FEV1% predicted; M, male.
61.5% of variation
explained
19.3
% o
f vari
ation
expla
ine
d

123
Fig. 5.4: Canonical correspondence analysis showing ordination plot of the fungal community analysed by DGGE and environmental variables in COPD cohort. Associations with the relationship between community structure and environmental variables were not significant. The x-axis explains 31.8 % of the variation, whereas the y-axis explains 26.7 % respectively. Environmental factors shown consisted of both continuous (height and FEV1% predicted) and indiscreet variables (smoking status and patient gender). CS.X, COPD subject number ( male; female); ES, ex-smoker; F, female; FEV1 Pr, FEV1% predicted; M, male.
31.8% of variation
explained
26.7
% o
f vari
ation

124
5.3.4 Metagenomic analysis by 454-pyrosequencing of bacterial
community
Analysis of the entire cohort by 454-pyrosequencing from extracted gDNA using the
bacterial tag-encoded FLX-Titanium amplicon pyrosequencing (bTEFAP) method created
16S rDNA amplicon libraries (Dowd et al., 2008). Following quality control procedures,
pyro-amplicons consisting of 380 base pairs (bp) in length were obtained and then assigned to
1,799 unique OTUs generated from the metagenomic data analysis. Following this, a
rarefaction curve was generated to ascertain the diversity of the bacterial community present
in the clinical samples analysed from the sampling effort (Fig. 5.5). The number of reads per
sample and unique number of OTUs assigned are summarised below in table 5.1.
Table 5.1: Number of reads and OTUs assigned per COPD subject from metagenomic
analysis.
COPD subject number Number of reads Number of unique OTUs assigned
CS#1 2415 504
CS#3 2715 532
CS#4 2308 136
CS#5 3536 447
CS#6 2239 271
CS#7 2657 55
CS#8 1775 126
CS#9 2122 182
CS#10 2148 366
CS#11 542 51
CS#12 557 3
We next investigated the most abundant bacterial genera represented within the
community in cohort in rank order. A large number of unique OTUs (1,799) were generated
from the 454-pyrosequencing reads therefore any OTUs assigned with < 100 reads per COPD
subject were excluded from further analysis. Consequently, assignment of OTUs with > 100
reads was included for further metagenomic analysis of cohort. After this meta-data analysis
criterion was met, this resulted in 36 OTUs being designated at genus-level within the cohort,

125
of which 29 were classified bacterial genera and 7 designated unclassified (Fig. 5.6). Further,
from the rankings attributed to the most abundant OTUs, the percentages of these OTUs per
COPD subject was determined reflecting the bacterial community at genus level that was
present at time of sampling (Fig. 5.7). In terms of abundance, Streptococcus, Arthrobacter,
and Staphylococcus were the most prevalent. Strikingly, no OTUs representing the
Pseudomonas genus were identified within cohort. Investigating individual COPD subjects
displayed a heterogeneous bacterial population across the cohort when resolved to genus-
level. In samples CS#7, CS#11, and CS#12 the phylogenetic diversity was lower than that
seen in the other COPD subjects. Both CS#7 and CS#11 had four bacterial genera present:
Granulicatella Prevotella, Streptococcus, and Veillonella. CS#12 was comprised of only two
dominant bacterial genera, Staphylococcus and Streptococcus respectively in the BAL sample
analysed. The most abundant genus-level OTUs (i.e., 36) were then resolved to class-level in
which 9 different bacterial classes were assigned: Acidobacteria; Actinobacteria; Bacilli;
Bacteroidia; Clostridia; α-proteobacteria; β-proteobacteria; γ-proteobacteria and δ-
proteobacteria (Fig. 5.8). All COPD subjects were dominated with the Actinobacteria class,
with the exception of CS#7, CS#11, and CS#12. These three patients were most prevalent for
Bacilli class. The second most dominant bacterial class was that of the α-Proteobacteria,
again though, this class was absent in patients CS#7, CS#11, and CS#12.
Ordination analysis using the bacterial community at genus-level was performed. Using
the most abundant OTUs generated from the metagenomic analysis (i.e., > 100 reads per
OTU designated). An initial DCA was executed to analyse the relationship between the
COPD subject bacterial genera in cohort against both discreet and continuous variables
resulting in a 1° axis length of 10.776 (axis length > 3 SD). Therefore, canonical
correspondence analysis was performed (data not shown as CCA ordination plot is indistinct)
resulting in two significant environmental variables: gender (P = 0.026) and height (P =
0.03). Other environmental variables investigated were not significant such as age (P =
0.218), FEV1% predicted (P = 0.136), GOLD COPD stage (P = 0.076), and smoking status
(P = 0.268). Following this, a further investigation of the bacterial community variance at
class-level (Fig. 5.9) and their associations with the discreet and continuous variables was
conducted in order to ascertain what were the dominant drivers in shaping the COPD
community structure. Using CCA (DCA yielded a 1° axis length of 16.969 (> 3 SD)) and the
above environmental variables against the nine different bacterial phylotypes represented at
126
class-level within cohort, two significant factors were identified: FEV1% predicted (P =
0.002) and GOLD COPD stage (P = 0.04). Smoking status of the COPD subjects, i.e., ex-
smoker or current smoker approached significance (P = 0.05). The remaining continuous and
discreet variables consisting of age, gender, and height from the CCA output were not
significant as P-values of 0.186, 0.132, and 0.14 were all obtained. Both bacterial phylotypes
and environmental variables in cohort by CCA (78.4 % (x-axis) and 12.1 % (y-axis)
accounted for the percentage of variation explained) are shown in the final output (Fig. 5.9).
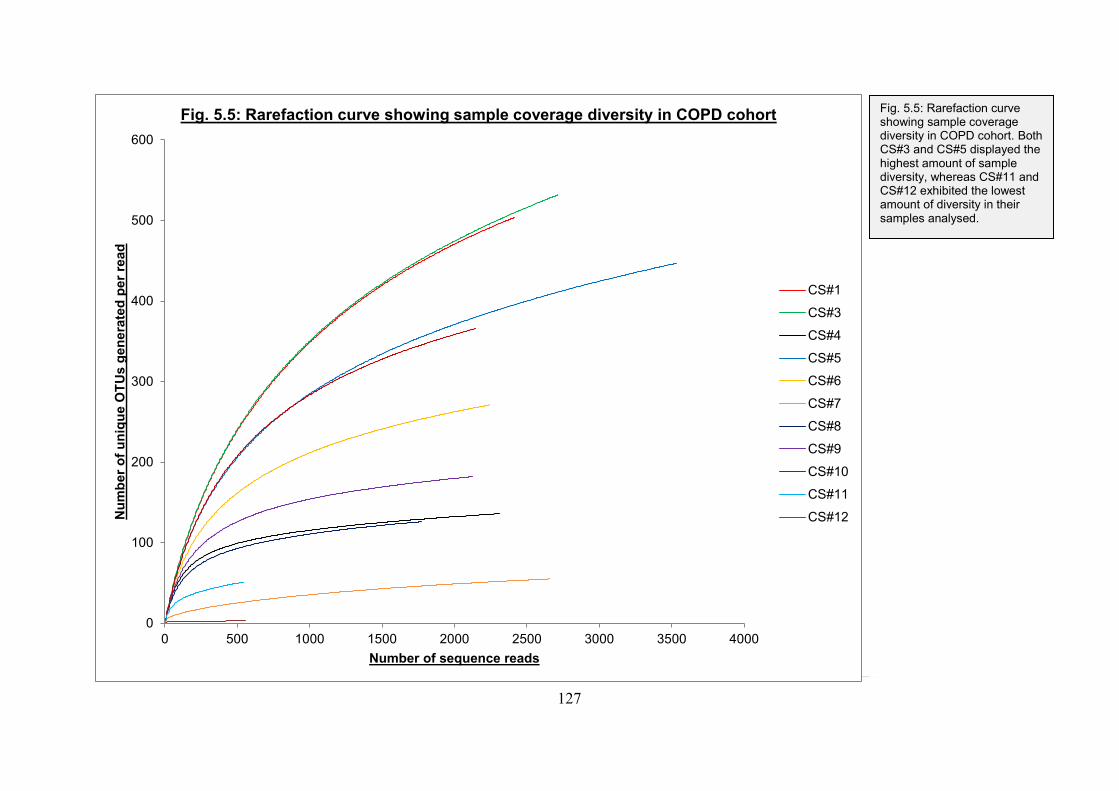
127
0
100
200
300
400
500
600
0 500 1000 1500 2000 2500 3000 3500 4000
Nu
mb
er
of
un
iqu
e O
TU
s g
en
era
ted
per
read
Number of sequence reads
Fig. 5.5: Rarefaction curve showing sample coverage diversity in COPD cohort
CS#1
CS#3
CS#4
CS#5
CS#6
CS#7
CS#8
CS#9
CS#10
CS#11
CS#12
[Type a quote from the document or the summary
of an interesting point. You can position the text box
anywhere in the document. Use the Text Box Tools
tab to change the formatting of the pull quote text
box.]
[Type a quote from the document or the summary
of an interesting point. You can position the text box
anywhere in the document. Use the Text Box Tools
tab to change the formatting of the pull quote text
box.]
Fig. 5.5: Rarefaction curve showing sample coverage diversity in COPD cohort. Both CS#3 and CS#5 displayed the highest amount of sample diversity, whereas CS#11 and CS#12 exhibited the lowest amount of diversity in their samples analysed.

128
0
200
400
600
800
1000
1200
1400
Str
epto
co
ccus
Art
hro
ba
cte
r
Str
epto
co
ccus
Sta
ph
ylo
coccus
Veill
onella
Cry
pto
spo
rang
ium
Baln
eim
on
as
Nitrilir
up
tor
Pro
sth
ecom
icro
biu
m
Actino
pla
nes
Un
cla
ssifie
d
Gra
nu
lica
tella
Sphin
go
mo
nas
Nitro
ba
cte
r
Cry
pto
spo
rang
ium
Un
cla
ssifie
d
Pim
elo
bacte
r
Azo
sp
irill
um
Phae
ospir
illum
Phaselic
ystis
Un
cla
ssifie
d
Un
cla
ssifie
d
Rh
odo
fera
x
Me
thylo
sin
us
Un
cla
ssifie
d
Un
cla
ssifie
d
Rh
izobiu
m
Ru
belli
mic
rob
ium
Azo
sp
irill
um
Allo
kutz
neri
a
Un
cla
ssifie
d
No
ca
rdio
ide
s
Ste
roid
ob
acte
r
Spha
erispo
rangiu
m
Pre
vo
tella
Pro
sth
ecom
icro
biu
m
Nu
mb
er
of
read
s p
er
OT
U a
ssig
ned
Bacterial genera classification
Fig. 5.6 Ranking of bacterial genera within COPD cohort Fig. 5.6: Ranking of bacterial genera within COPD cohort. The most abundant genera across cohort numbered 36 after exclusion of those OTUs that generated < 100 reads per COPD subject. Streptococcus, Arthrobacter, and Staphylococcus were the
most abundant bacterial genera present in patient cohort from the 454-pyrosequencing analysis.
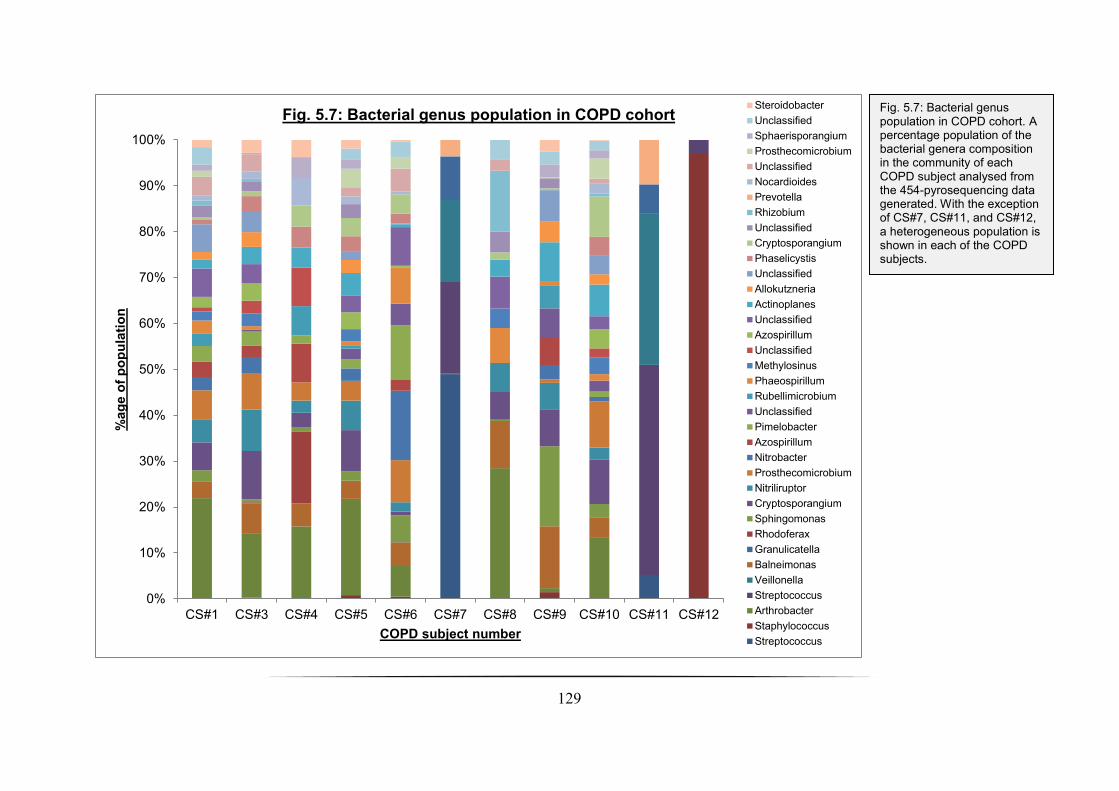
129
0%
10%
20%
30%
40%
50%
60%
70%
80%
90%
100%
CS#1 CS#3 CS#4 CS#5 CS#6 CS#7 CS#8 CS#9 CS#10 CS#11 CS#12
%ag
e o
f p
op
ula
tio
n
COPD subject number
Fig. 5.7: Bacterial genus population in COPD cohort Steroidobacter
Unclassified
Sphaerisporangium
Prosthecomicrobium
Unclassified
Nocardioides
Prevotella
Rhizobium
Unclassified
Cryptosporangium
Phaselicystis
Unclassified
Allokutzneria
Actinoplanes
Unclassified
Azospirillum
Unclassified
Methylosinus
Phaeospirillum
Rubellimicrobium
Unclassified
Pimelobacter
Azospirillum
Nitrobacter
Prosthecomicrobium
Nitriliruptor
Cryptosporangium
Sphingomonas
Rhodoferax
Granulicatella
Balneimonas
Veillonella
Streptococcus
Arthrobacter
Staphylococcus
Streptococcus
Fig. 5.7: Bacterial genus population in COPD cohort. A percentage population of the bacterial genera composition in the community of each COPD subject analysed from the 454-pyrosequencing data generated. With the exception of CS#7, CS#11, and CS#12, a heterogeneous population is shown in each of the COPD subjects.

130
0%
10%
20%
30%
40%
50%
60%
70%
80%
90%
100%
CS#1 CS#3 CS#4 CS#5 CS#6 CS#7 CS#8 CS#9 CS#10 CS#11 CS#12
%ag
e o
f p
op
ula
tio
n
COPD subject number
Fig. 5.8: Bacterial class-level population in COPD cohort
Acidobacteria
Beta-proteobacteria
Delta-proteobacteria
Actinobacteria
Bacilli
Bacteroidia
Clostridia
Alpha-proteobacteria
Gamma-proteobacteria
Fig. 5.8: Bacterial class-level population in COPD cohort. Resolution of the 36 most abundant genera at class-level reveals that all of the COPD subjects with the exception of CS#7, CS#11, and CS#12 are populated in bacterial members comprised of the Actinobacteria and α-
proteobacteria. The Bacilli class completely dominates CS#12, but also constitutes a significant member of population bacterial class in CS#7 and CS#11.

131
Fig. 5.9: Canonical correspondence analysis of bacterial phylotypes resolved to class-level showing potential drivers of the COPD bacterial community in the COPD subjects analysed. Associations with the relationship between community structure and environmental variables were significant in FEV1% predicted (P = 0.002), GOLD COPD stage status (P = 0.04), and smoking status in patient (P = 0.05). The x-axis explained 78.4 % of the variation and the y-axis explained 12.1 % of the variation respectively. Environmental factors shown consisted of both continuous (height and FEV1% predicted) and indiscreet variables (smoking status and patient gender). CS.X, COPD subject number ( male; female); ES, ex-smoker; F, female; FEV1 Pr, FEV1% predicted; M, male. Bacterial class abbreviations: Acido, Acidobacteria; Actino, Actinobacteria; Bacteroi, Bacteroidia; Clostrid, Clostridia; α-proteo, α-proteobacteria; b-proteo, β-proteobacteria; g-proteo, γ-proteobacteria.
78.4% of variation
explained
12.1
% o
f vari
ation
expla
ine
d
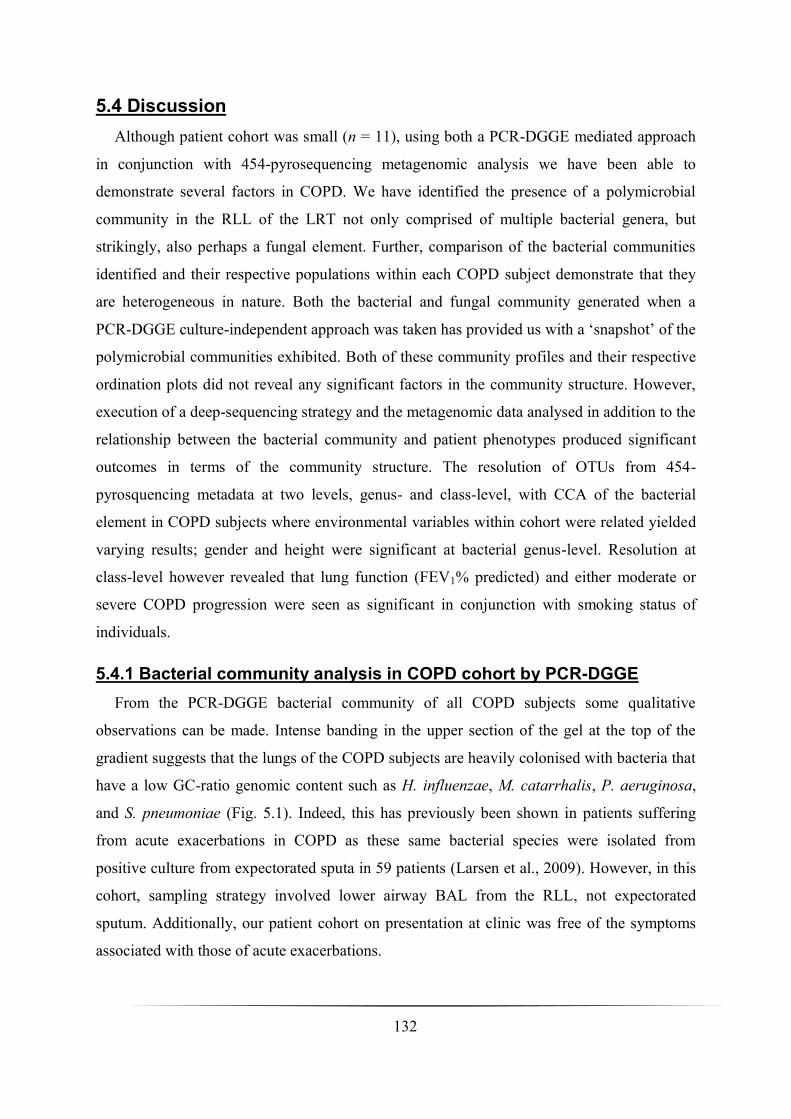
132
5.4 Discussion
Although patient cohort was small (n = 11), using both a PCR-DGGE mediated approach
in conjunction with 454-pyrosequencing metagenomic analysis we have been able to
demonstrate several factors in COPD. We have identified the presence of a polymicrobial
community in the RLL of the LRT not only comprised of multiple bacterial genera, but
strikingly, also perhaps a fungal element. Further, comparison of the bacterial communities
identified and their respective populations within each COPD subject demonstrate that they
are heterogeneous in nature. Both the bacterial and fungal community generated when a
PCR-DGGE culture-independent approach was taken has provided us with a ‘snapshot’ of the
polymicrobial communities exhibited. Both of these community profiles and their respective
ordination plots did not reveal any significant factors in the community structure. However,
execution of a deep-sequencing strategy and the metagenomic data analysed in addition to the
relationship between the bacterial community and patient phenotypes produced significant
outcomes in terms of the community structure. The resolution of OTUs from 454-
pyrosquencing metadata at two levels, genus- and class-level, with CCA of the bacterial
element in COPD subjects where environmental variables within cohort were related yielded
varying results; gender and height were significant at bacterial genus-level. Resolution at
class-level however revealed that lung function (FEV1% predicted) and either moderate or
severe COPD progression were seen as significant in conjunction with smoking status of
individuals.
5.4.1 Bacterial community analysis in COPD cohort by PCR-DGGE
From the PCR-DGGE bacterial community of all COPD subjects some qualitative
observations can be made. Intense banding in the upper section of the gel at the top of the
gradient suggests that the lungs of the COPD subjects are heavily colonised with bacteria that
have a low GC-ratio genomic content such as H. influenzae, M. catarrhalis, P. aeruginosa,
and S. pneumoniae (Fig. 5.1). Indeed, this has previously been shown in patients suffering
from acute exacerbations in COPD as these same bacterial species were isolated from
positive culture from expectorated sputa in 59 patients (Larsen et al., 2009). However, in this
cohort, sampling strategy involved lower airway BAL from the RLL, not expectorated
sputum. Additionally, our patient cohort on presentation at clinic was free of the symptoms
associated with those of acute exacerbations.
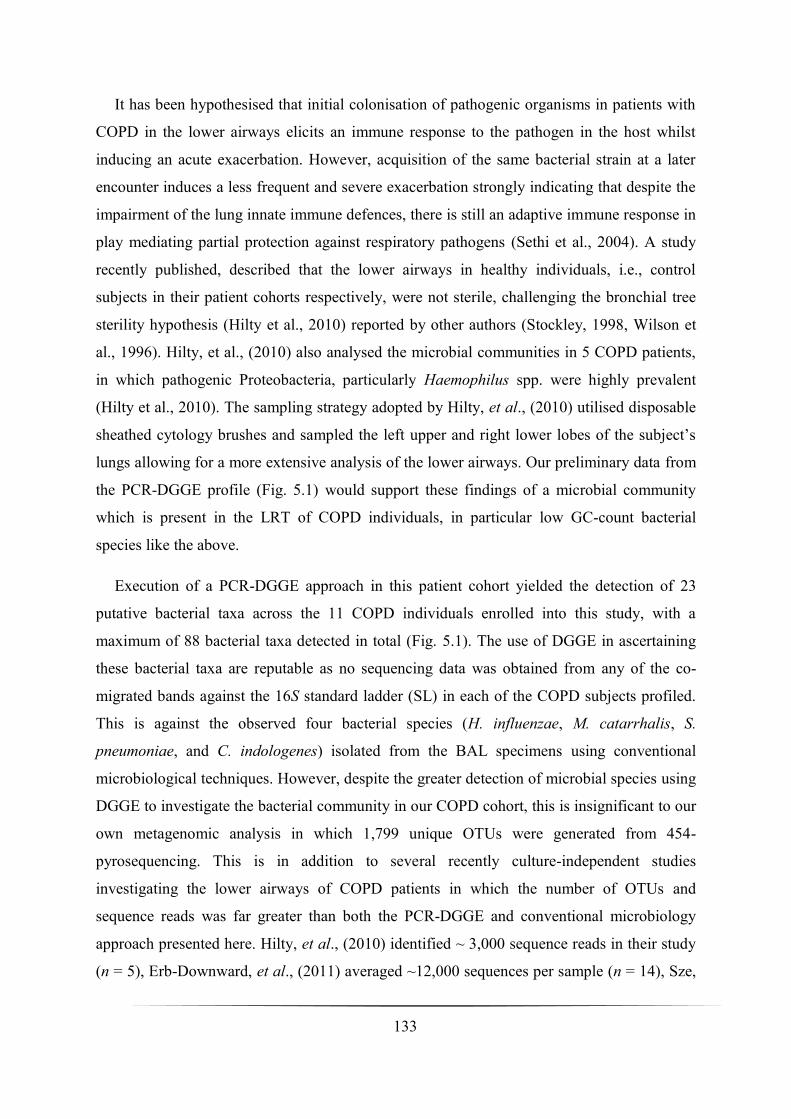
133
It has been hypothesised that initial colonisation of pathogenic organisms in patients with
COPD in the lower airways elicits an immune response to the pathogen in the host whilst
inducing an acute exacerbation. However, acquisition of the same bacterial strain at a later
encounter induces a less frequent and severe exacerbation strongly indicating that despite the
impairment of the lung innate immune defences, there is still an adaptive immune response in
play mediating partial protection against respiratory pathogens (Sethi et al., 2004). A study
recently published, described that the lower airways in healthy individuals, i.e., control
subjects in their patient cohorts respectively, were not sterile, challenging the bronchial tree
sterility hypothesis (Hilty et al., 2010) reported by other authors (Stockley, 1998, Wilson et
al., 1996). Hilty, et al., (2010) also analysed the microbial communities in 5 COPD patients,
in which pathogenic Proteobacteria, particularly Haemophilus spp. were highly prevalent
(Hilty et al., 2010). The sampling strategy adopted by Hilty, et al., (2010) utilised disposable
sheathed cytology brushes and sampled the left upper and right lower lobes of the subject’s
lungs allowing for a more extensive analysis of the lower airways. Our preliminary data from
the PCR-DGGE profile (Fig. 5.1) would support these findings of a microbial community
which is present in the LRT of COPD individuals, in particular low GC-count bacterial
species like the above.
Execution of a PCR-DGGE approach in this patient cohort yielded the detection of 23
putative bacterial taxa across the 11 COPD individuals enrolled into this study, with a
maximum of 88 bacterial taxa detected in total (Fig. 5.1). The use of DGGE in ascertaining
these bacterial taxa are reputable as no sequencing data was obtained from any of the co-
migrated bands against the 16S standard ladder (SL) in each of the COPD subjects profiled.
This is against the observed four bacterial species (H. influenzae, M. catarrhalis, S.
pneumoniae, and C. indologenes) isolated from the BAL specimens using conventional
microbiological techniques. However, despite the greater detection of microbial species using
DGGE to investigate the bacterial community in our COPD cohort, this is insignificant to our
own metagenomic analysis in which 1,799 unique OTUs were generated from 454-
pyrosequencing. This is in addition to several recently culture-independent studies
investigating the lower airways of COPD patients in which the number of OTUs and
sequence reads was far greater than both the PCR-DGGE and conventional microbiology
approach presented here. Hilty, et al., (2010) identified ~ 3,000 sequence reads in their study
(n = 5), Erb-Downward, et al., (2011) averaged ~12,000 sequences per sample (n = 14), Sze,
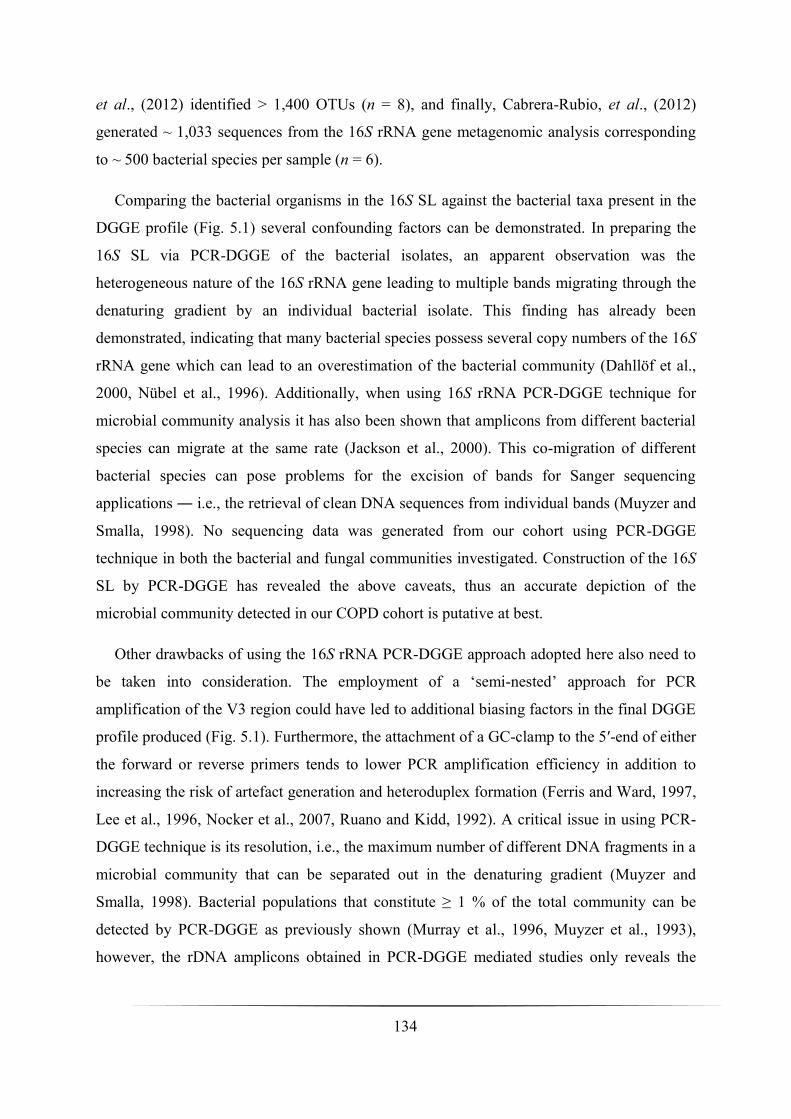
134
et al., (2012) identified > 1,400 OTUs (n = 8), and finally, Cabrera-Rubio, et al., (2012)
generated ~ 1,033 sequences from the 16S rRNA gene metagenomic analysis corresponding
to ~ 500 bacterial species per sample (n = 6).
Comparing the bacterial organisms in the 16S SL against the bacterial taxa present in the
DGGE profile (Fig. 5.1) several confounding factors can be demonstrated. In preparing the
16S SL via PCR-DGGE of the bacterial isolates, an apparent observation was the
heterogeneous nature of the 16S rRNA gene leading to multiple bands migrating through the
denaturing gradient by an individual bacterial isolate. This finding has already been
demonstrated, indicating that many bacterial species possess several copy numbers of the 16S
rRNA gene which can lead to an overestimation of the bacterial community (Dahllöf et al.,
2000, Nübel et al., 1996). Additionally, when using 16S rRNA PCR-DGGE technique for
microbial community analysis it has also been shown that amplicons from different bacterial
species can migrate at the same rate (Jackson et al., 2000). This co-migration of different
bacterial species can pose problems for the excision of bands for Sanger sequencing
applications ― i.e., the retrieval of clean DNA sequences from individual bands (Muyzer and
Smalla, 1998). No sequencing data was generated from our cohort using PCR-DGGE
technique in both the bacterial and fungal communities investigated. Construction of the 16S
SL by PCR-DGGE has revealed the above caveats, thus an accurate depiction of the
microbial community detected in our COPD cohort is putative at best.
Other drawbacks of using the 16S rRNA PCR-DGGE approach adopted here also need to
be taken into consideration. The employment of a ‘semi-nested’ approach for PCR
amplification of the V3 region could have led to additional biasing factors in the final DGGE
profile produced (Fig. 5.1). Furthermore, the attachment of a GC-clamp to the 5′-end of either
the forward or reverse primers tends to lower PCR amplification efficiency in addition to
increasing the risk of artefact generation and heteroduplex formation (Ferris and Ward, 1997,
Lee et al., 1996, Nocker et al., 2007, Ruano and Kidd, 1992). A critical issue in using PCR-
DGGE technique is its resolution, i.e., the maximum number of different DNA fragments in a
microbial community that can be separated out in the denaturing gradient (Muyzer and
Smalla, 1998). Bacterial populations that constitute ≥ 1 % of the total community can be
detected by PCR-DGGE as previously shown (Murray et al., 1996, Muyzer et al., 1993),
however, the rDNA amplicons obtained in PCR-DGGE mediated studies only reveals the
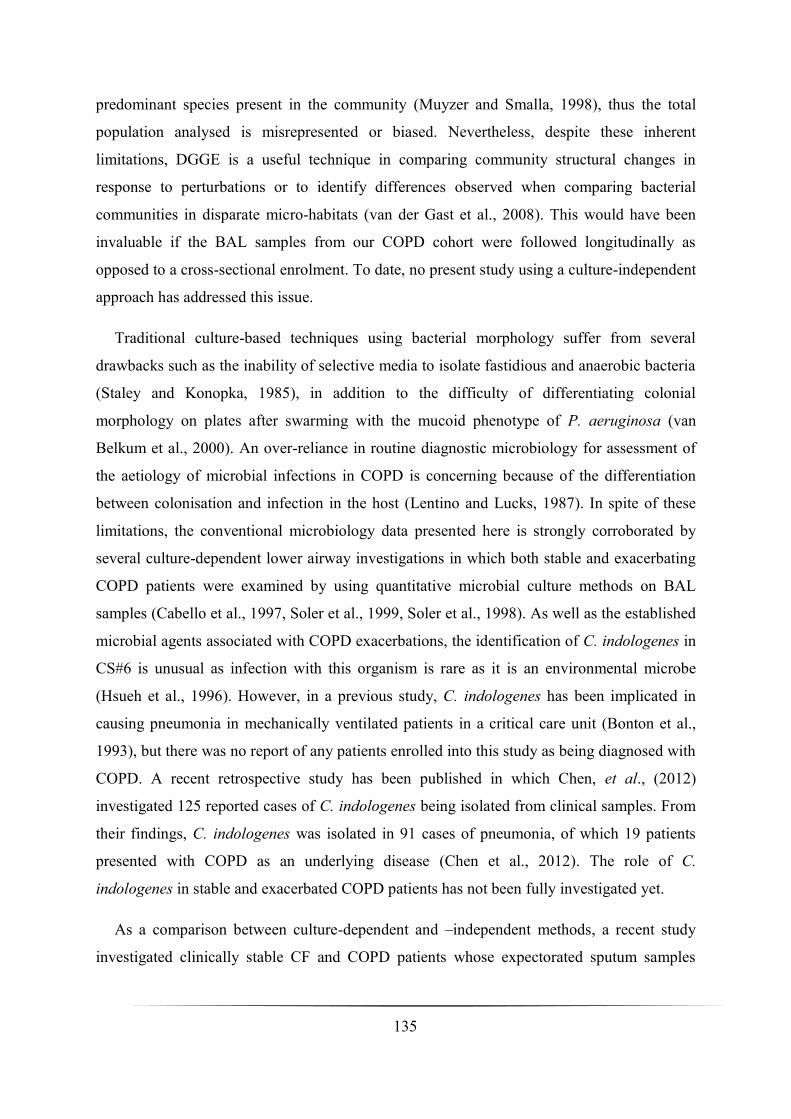
135
predominant species present in the community (Muyzer and Smalla, 1998), thus the total
population analysed is misrepresented or biased. Nevertheless, despite these inherent
limitations, DGGE is a useful technique in comparing community structural changes in
response to perturbations or to identify differences observed when comparing bacterial
communities in disparate micro-habitats (van der Gast et al., 2008). This would have been
invaluable if the BAL samples from our COPD cohort were followed longitudinally as
opposed to a cross-sectional enrolment. To date, no present study using a culture-independent
approach has addressed this issue.
Traditional culture-based techniques using bacterial morphology suffer from several
drawbacks such as the inability of selective media to isolate fastidious and anaerobic bacteria
(Staley and Konopka, 1985), in addition to the difficulty of differentiating colonial
morphology on plates after swarming with the mucoid phenotype of P. aeruginosa (van
Belkum et al., 2000). An over-reliance in routine diagnostic microbiology for assessment of
the aetiology of microbial infections in COPD is concerning because of the differentiation
between colonisation and infection in the host (Lentino and Lucks, 1987). In spite of these
limitations, the conventional microbiology data presented here is strongly corroborated by
several culture-dependent lower airway investigations in which both stable and exacerbating
COPD patients were examined by using quantitative microbial culture methods on BAL
samples (Cabello et al., 1997, Soler et al., 1999, Soler et al., 1998). As well as the established
microbial agents associated with COPD exacerbations, the identification of C. indologenes in
CS#6 is unusual as infection with this organism is rare as it is an environmental microbe
(Hsueh et al., 1996). However, in a previous study, C. indologenes has been implicated in
causing pneumonia in mechanically ventilated patients in a critical care unit (Bonton et al.,
1993), but there was no report of any patients enrolled into this study as being diagnosed with
COPD. A recent retrospective study has been published in which Chen, et al., (2012)
investigated 125 reported cases of C. indologenes being isolated from clinical samples. From
their findings, C. indologenes was isolated in 91 cases of pneumonia, of which 19 patients
presented with COPD as an underlying disease (Chen et al., 2012). The role of C.
indologenes in stable and exacerbated COPD patients has not been fully investigated yet.
As a comparison between culture-dependent and –independent methods, a recent study
investigated clinically stable CF and COPD patients whose expectorated sputum samples
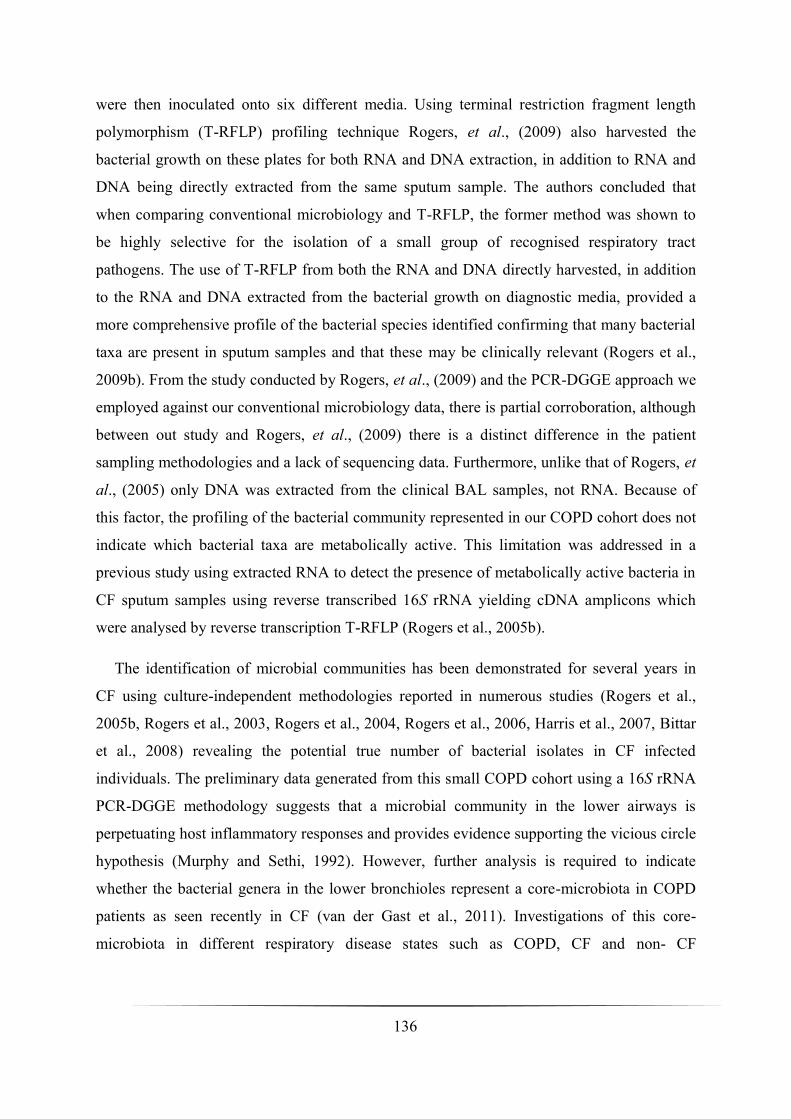
136
were then inoculated onto six different media. Using terminal restriction fragment length
polymorphism (T-RFLP) profiling technique Rogers, et al., (2009) also harvested the
bacterial growth on these plates for both RNA and DNA extraction, in addition to RNA and
DNA being directly extracted from the same sputum sample. The authors concluded that
when comparing conventional microbiology and T-RFLP, the former method was shown to
be highly selective for the isolation of a small group of recognised respiratory tract
pathogens. The use of T-RFLP from both the RNA and DNA directly harvested, in addition
to the RNA and DNA extracted from the bacterial growth on diagnostic media, provided a
more comprehensive profile of the bacterial species identified confirming that many bacterial
taxa are present in sputum samples and that these may be clinically relevant (Rogers et al.,
2009b). From the study conducted by Rogers, et al., (2009) and the PCR-DGGE approach we
employed against our conventional microbiology data, there is partial corroboration, although
between out study and Rogers, et al., (2009) there is a distinct difference in the patient
sampling methodologies and a lack of sequencing data. Furthermore, unlike that of Rogers, et
al., (2005) only DNA was extracted from the clinical BAL samples, not RNA. Because of
this factor, the profiling of the bacterial community represented in our COPD cohort does not
indicate which bacterial taxa are metabolically active. This limitation was addressed in a
previous study using extracted RNA to detect the presence of metabolically active bacteria in
CF sputum samples using reverse transcribed 16S rRNA yielding cDNA amplicons which
were analysed by reverse transcription T-RFLP (Rogers et al., 2005b).
The identification of microbial communities has been demonstrated for several years in
CF using culture-independent methodologies reported in numerous studies (Rogers et al.,
2005b, Rogers et al., 2003, Rogers et al., 2004, Rogers et al., 2006, Harris et al., 2007, Bittar
et al., 2008) revealing the potential true number of bacterial isolates in CF infected
individuals. The preliminary data generated from this small COPD cohort using a 16S rRNA
PCR-DGGE methodology suggests that a microbial community in the lower airways is
perpetuating host inflammatory responses and provides evidence supporting the vicious circle
hypothesis (Murphy and Sethi, 1992). However, further analysis is required to indicate
whether the bacterial genera in the lower bronchioles represent a core-microbiota in COPD
patients as seen recently in CF (van der Gast et al., 2011). Investigations of this core-
microbiota in different respiratory disease states such as COPD, CF and non- CF

137
bronchiectasis could prove valuable for additional studies in the lower airways of individuals
afflicted with these diseases.
5.4.2 Metagenomic analysis of bacterial communities in COPD cohort
As previously shown, we have identified a diverse bacterial community present in the
LRT of the RLL in a cohort of eleven COPD subjects. Further, using constrained community
ordination analysis we also have demonstrated that specific COPD phenotypic features
significantly affect the community structure. Culture-dependent microbiological studies
focusing in COPD have long been able to identify four main bacterial species, all thought to
induce acute exacerbations in COPD: NTHI, M. catarrhalis, S. pneumoniae, and P.
aeruginosa (Sethi and Murphy, 2001). Recently though, investigators using 16S rRNA
community profiling techniques have revealed that the COPD lung microbiome is composed
of a greater community richness than previously hypothesised (Erb-Downward et al., 2011,
Hilty et al., 2010, Huang et al., 2010). Comparing these studies against the work performed
here, interesting observations can be made. Huang and co-authors investigated a small cohort
of eight COPD patients being managed for severe respiratory exacerbations. Using 16S rRNA
PhyloChip technology on endotracheal aspirate (ETA) samples they were able to define
1,213 bacterial taxa present of which 38 bacterial phyla and 140 distinct families were
characterised in the lower airways of the COPD cohort investigated. Among the families
detected were Alteromonadaceae, Burkholderiaceae, Comamonadaceae, Enterobacteriaceae,
Helicobacteraceae, Pasteurellaceae, and Pseudomonadaceae respectively (Huang et al.,
2010). Further, despite all of the COPD subjects enrolled into the study being administered
broad-spectrum antimicrobial therapies, the ETAs analysed from the patients harboured an
average of 411 bacterial taxa. Although this patient cohort was very selective and small in
number, it does confirm our current findings of a microbial community residing in the lower
airways even though 16S rRNA profiling was determined by different culture-independent
techniques. However, the diversity reported between our data and Huang, et al., (2010)
differs dramatically. This difference can be attributed to the fact that in our cohort, sample
extraction was performed on eleven clinically stable COPD patients, i.e., non-exacerbating.
In contrast, Huang, et al., (2010) demonstrated that from their 16S rRNA community
profiling analysis, patients were positive for the detection of P. aeruginosa (belonging to the
bacterial family Pseudomonadaceae) in all subjects enrolled. Conversely, in our cohort the

138
detection of P. aeruginosa was not represented in any of the COPD subjects we analysed in
significant numbers.
Acquisition of new strains in P. aeruginosa has been previously shown to induce acute
exacerbations in COPD individuals (Murphy et al., 2008). Additionally, using lower-airway
protected brush sampling procedures, Rosell, et al., detected the presence of P. aeruginosa in
their COPD cohort (Rosell et al., 2005); thus between the Huang COPD patient cohort and
our study cohort, the absence of P. aeruginosa taxa from our metagenomic analysis could
explain the clinically stable state of the COPD subjects we investigated. Another plausible
reason for the organism’s absence from our own metagenomic analysis can be attributed to
insufficient numbers present from the OTUs generated from the number of sequence reads.
Strikingly, an absence of the Haemophilus genera has also been observed from our cohort. H.
influenzae has long been implicated in COPD bacterial infections and a critical factor in the
induction of acute exacerbations in COPD patients (Sethi and Murphy, 2008). The detection
of the Haemophilus genera in insignificant numbers from the 454-pyrosequencing analysis
could be again attributed to the stable state of cohort when sampling was undertaken.
Retrospectively though, H. influenzae itself is notorious for persistent colonisation in the
lungs of COPD sufferers with selected strains persisting for months to years (Murphy et al.,
2004). A common disease phenotype of COPD is chronic bronchitis and colonisation of the
lower airways is usually associated with NTHI (Cabello et al., 1997) with new strain
acquisition and colonisation of the lungs being a continuous and dynamic process (Samuelson
et al., 1995). Indeed, such is the persistence of H. influenzae in COPD and other chronic
pulmonary diseases, that a previous study investigated the distribution of H. influenzae in
explanted lung tissues from individuals suffering from end-stage pulmonary diseases
including COPD, CF and non-CF bronchiectasis (Möller et al., 1998). H. influenzae was
detected both in the respiratory epithelium and sub-epithelial layers in the explanted lung
tissues analysed from the pulmonary end-stage disease patients. This finding strongly
suggests that H. influenzae plays an invasive role, but also persists in patients with severe
lung disease, spreading throughout the pulmonary tree especially in COPD and CF patients
(Möller et al., 1998). Additional previous studies have also shown that multiple strains of
NTHI can colonise the respiratory tract in concert in chronic bronchitis settings (Murphy et
al., 1999, Groeneveld et al., 1988). Excluding H. influenzae, both H. parainfluenzae and H.
139
haemolyticus are believed to play a role in COPD bacterial infection but their roles in acute
exacerbations is uncertain (Sethi and Murphy, 2008).
In another study of COPD subjects, Erb-Downward, et al., (2011) investigated the lung
microbiome by using massively parallel 454-pyrosequencing of bacterial 16S amplicons from
not only collected BAL samples but also in explanted lung tissues. They demonstrated three
key findings: (i), that the bacterial lung microbiome is present and diverse, but different from
the nasopharynx and oral cavity sites, (ii), that a decrease in pulmonary function is associated
with a decrease in bacterial community diversity, i.e., the dominance of Pseudomonas spp.,
and (iii), the micro-anatomic sites sampled and analysed within the lung gave rise to disparate
microbial communities between them.
In their study, 14 subjects were analysed (7 ‘healthy’ smokers, 4 individuals with COPD
(1 mild, 2 moderate, and 1 severe), and 3 non-smokers with no smoking history or evidence
of lung disease) and from the metagenomic analysis performed in this cohort, the dominant
phyla in the COPD subjects were the Bacteroidetes, Firmicutes, and Proteobacteria. At
genus-level, the dominant bacterial genera in the COPD subjects were Pseudomonas,
Streptococcus, Prevotella, Fusobacterium, and Veillonella respectively (Erb-Downward et
al., 2011). In contrast, our meta-analysis demonstrated that the predominant bacterial genera
were Streptococcus, Arthrobacter, and Staphylococcus indicating a very heterogeneous
distribution of microbial diversity across COPD patients. However, in three of our COPD
subjects, CS#7, CS#11, and CS#12, the diversity was limited; in particular CS#12 (moderate
COPD) only the bacterial genera Streptococcus and Staphylococcus spp. were detected. This
dominance of a very few bacterial genera could be attributed to the one sampling site (RLL)
from where the BAL was taken in cohort. Erb-Downward, et al., (2011) also demonstrated
that sampling from multiple micro-anatomical sites within the lungs demonstrated local
differences in the bacterial communities inhabiting them highlighting that bacterial species in
the lower airways of COPD patient’s exhibit differences not just globally, but also locally.
The observations by Erb-Downward, et al., (2011) have only been recently partly
corroborated by Sze, et al., (2012), although there is still contrasting data presented in their
study. The authors of this study investigated the lung tissue microbiome in very severe COPD
patients (GOLD stage IV (n = 4)) and compared them to other explanted lung tissues
obtained from individuals who were non-smokers (n = 8) and current smoker control subjects

140
(n = 8). Lung tissue samples were also collected from CF patients (n = 8) acting as a positive
control sub-group ― the lungs of CF individuals have been previously shown to contain
bacteria and this finding is well documented, both in cross-sectional and temporal studies
(Cox et al., 2010, Harris et al., 2007) ― for the culture-independent analyses that was carried
out in this study.
Executing an approach using terminal-restriction fragment length polymorphism (T-
RFLP) and pyrotag sequencing spanning the V1-V3 hypervariable regions within the 16S
rRNA gene, Sze, et al., concluded that the lung tissue microbiome from the COPD GOLD
stage 4 patients was significantly different from all of the other lung tissue sections
investigated. Strikingly, from their metagenomic analysis in the study both the Lactobacillus
and Burkholderia genera were significantly associated with the COPD GOLD IV explanted
lung tissues. Additionally, both of the above genera represented the top five bacterial species
within this sample group (i.e., two Burkholderia spp. and three Lactobacillus spp. were
identified, although all were unclassified to species level) (Sze et al., 2012). The bacterial
community composition within the GOLD 4 sub-group conflicts with that of the data shown
in the Erb-Downward, et al., (2011) and Huang, et al., (2010) COPD microbiome studies.
With our own meta-analysis a comparison cannot be deduced as no GOLD stage IV patients
were recruited into our study. However, Sze, et al., (2012) state the differences in their study
design and COPD patient selection in relation to the two aforementioned studies. They
suggest that their investigation reflects the microbiome of lung parenchymal tissue as
opposed to the above previous studies which examined the COPD lung bacterial community
composition by BAL, ETA, and bronchial brushing collections respectively. Despite some of
the conflicting data presented by Sze and co-authors, they conclude that a major limitation in
their study was the exclusion of moderate and severe COPD patients (GOLD stages II and III
respectively), and as thus, extrapolation of the Burkholderia and Lactobacillus genera found
in their GOLD IV explanted lung tissue samples cannot be made across the other GOLD
stages in COPD because of this constraint.
A concerning factor from the metagenomic dataset shown across this patient cohort is the
high prevalence of the bacterial genus Arthrobacter; in this study Arthrobacter spp. was one
of the predominant bacterial genera present in all COPD subjects except CS#7, CS#11, and
CS#12 (Fig. 5.7). Arthrobacter species that are implicated and isolated in clinical human
141
infection are rare as individuals are continually exposed to Arthrobacter strains in the
environment (Funke et al., 1996). The first documented cases of Arthrobacter infection in
patients isolated from clinical specimens by using 16S rRNA gene sequencing methods were
reported in 1996 resulting in two new Arthrobacter species being identified: Arthrobacter
cumminsu (isolated from a urine sample and skin swab) and Arthrobacter woluwensis
(isolated from blood culture from a patient presenting with human immunodeficiency virus
(HIV) infection) (Funke et al., 1996). Following this, Bernasconi et al., (2004) reported a
case of infective endocarditis in a patient (HIV-seronegative habitual drug user) in which A.
woluwensis was subsequently isolated and only identified through full-fragment 16S rDNA
sequencing (Bernasconi et al., 2004). Initial laboratory diagnosis presumptively identified the
organism as Corynebacterium aquaticum using conventional microbiology assays. In
addition to the Bernasconi case report, there have been only five other documented cases of
clinical disease involving Arthrobacter spp. none of which involved the pulmonary tree:
bacteraemia (2 cases), severe phlebitis (1 case), post-operative endophthalmitis (1 case) and a
patient presenting with Whipple’s syndrome (1 case) (Bodaghi et al., 1998, Esteban et al.,
1996, Hsu et al., 1998, Wauters et al., 2000). The rarity of cases pertaining to the
Arthrobacter genus can be attributed to its relatively low pathogenicity and the challenges in
its precise identification using conventional microbiological techniques such as the above,
possibly biasing in a low recovery rate of Arthrobacter species (Bernasconi et al., 2004). In
our COPD subjects, the dominance of the Arthrobacter genus in the metagenomic analysis
could be from an environmental source either directly, i.e., Arthrobacter and
Corynebacterium spp. may be a part of the human skin flora, or indirectly. This could be one
reason why our metagenomic data-set conflicts with the other COPD lung microbiome
studies and as such should be taken into consideration.
In comparing the conventional microbiology data from the COPD cohort to our meta-
analysis, the application of a deep-sequencing strategy through 454-pyrosequencing yielded
many different bacterial taxa across our COPD patient cohort, in which 1,799 unique OTUs
were generated representative to genus-level. Conventional microbiology of patient BAL
samples resulted in only four species being isolated: C. indologenes (CS#6), H. influenzae
(CS#3, CS#8), M. catarrhalis (CS#8, CS#10), and S. pneumoniae (CS#1). Interestingly, from
the meta-analysis employed in our study, none of the above genera were identified in our
patient cohort from the data shown (Fig. 5.6 and Fig. 5.7) with the exception of the
142
Streptococcus genus (CS#7, CS#11, and CS#12). Nevertheless, Chryseobacterium (CS#11),
Haemophilus (CS#7, CS#10, and CS#11), and the Moraxella (CS#10) genera were present in
the COPD subjects analysed in this study (indicated in parentheses), but the assignment of
OTUs pertaining to these three particular genera accounted for < 100 sequence reads per
OTU. Strikingly, the detection of all the above genera by 454-pyrosequencing conflicts with
the conventional microbiology data as Chryseobacterium, Haemophilus, and Moraxella spp.
was not detected by culture-based methodologies in CS#7, CS#10, and CS#11 respectively.
COPD subject #1 was positive for S. pneumoniae growth by culture, but the Streptococcus
genus itself was not assigned to any OTUs in this individual from the meta-analysis
performed. Only the isolation of M. catarrhalis by culture in CS#10 corroborates both the
culture-dependent and metagenomic analysis performed, as the Moraxella genus was also
present in CS#10, although the OTU assigned to this genus generated 80 reads.
Historically, from earlier studies, bacterial infection in COPD was established as a
potential driver in exacerbations in these patient populations (Burrows and Earle, 1969, Tager
and Speizer, 1975). The application of conventional microbiological methods in COPD has
primarily identified four organisms highly prevalent in exacerbating COPD patient
populations: H. influenzae, M. catarrhalis, S. pneumoniae, and P. aeruginosa (Ko et al.,
2005, Larsen et al., 2009, Miravitlles et al., 1999, Sethi et al., 2002, Soler et al., 1998).
Furthermore, several preliminary studies have been carried out on stable COPD patient
cohorts investigating the bronchial tree bacteriologic flora (Brumfit et al., 1957, Lees and
McNaught, 1959, Potter et al., 1968). Despite these earlier studies demonstrating the role of
bacterial infection and exacerbations in COPD, this paradigm is still controversial. Earlier
studies used sputum as a diagnostic measure for determining the role of bacterial infection in
COPD (Gump et al., 1976, Lambert and Stern, 1972, McHardy et al., 1980). The execution of
sputum as a diagnostic marker coupled with conventional microbiology is limited because of
the complexity in the differentiation between colonisation and infection in the individual
(Lentino and Lucks, 1987). Furthermore, culture-dependent microbiology of sputum also
carries the risk of culturing those organisms that are residents in the URT, thus potentially
leading to contamination of the culture plates being analysed.
Comparison and interpretation of the data from the conventional microbiology approach
employed here to other studies investigating the respiratory tract flora in stable COPD
143
patients are difficult because of the differences in microbiological methods and patient
selections executed. Some comparisons can be made however from other studies. From our
study, culture-dependent microbiology was conducted on BALF samples (with the exception
of patient CS#11 in which BS were obtained instead) obtained from the RLL. Additionally,
all individuals were stable at presentation before bronchoscopy was performed. The
conventional microbiology data is in stark contrast to a study by Cabello, et al., (1997) in
which they investigated the distal airways of 18 stable non-exacerbating COPD patients by
using quantitative culture techniques on both bronchoscopic protected specimen brush (PSB)
and BAL samples in the RLL. In their study, Cabello, et al., (1997) categorised any bacterial
agents identified as either PPMs (potentially pathogenic micro-organisms) or non-PPMs
(non-potentially pathogenic micro-organisms. The former being those micro-organisms well
established in respiratory tract infections (Gram-positive cocci (S. aureus and S.
pneumoniae); Gram-negative rods (P. aeruginosa); Enterobacteriaceae and Haemophilus spp;
and Gram-negative cocci (M. catarrhalis)). The latter comprising of bacterial species such as
Streptococcus viridans group, Neisseria spp., and Corynebacterium spp. which are normally
associated with either the oropharyngeal or gastrointestinal flora, playing no role in
respiratory infection in non-immunocompromised individuals (Cabello et al., 1997).
Cultivation of micro-organisms using both PSB and BAL samples resulted in 22 non-
PPMs and 7 PPMs being isolated across 15 COPD patients in their cohort. From the BAL
samples analysed, only two COPD patients yielded positive growth, S. pneumoniae and S.
viridans, a PPM and non-PPM respectively. However, 15 COPD patients were positive for
bacterial colonisation using PSB technique, resulting in the isolation of 27 micro-organisms,
both comprising 5 PPMs (H. influenzae, S. pneumoniae, and S. aureus isolates) and 22 non-
PPMs (S. viridans, Neisseria spp., plasma-co-agulase S. aureus, and Corynebacterium spp.
isolates) (Cabello et al., 1997). In our cohort, five patients yielded positive growth from the
BAL samples cultured. Three bacterial species according to the Cabello, et al., (1997)
categorisation were classified as PPMs: H. influenzae (CS#3, CS#8), M. catarrhalis (CS#8,
CS#10), and S. pneumoniae (CS#1). It is also interesting to note that in the Cabello study,
both M. catarrhalis and P. aeruginosa were negative for growth in both BAL and PSB
samples analysed, unlike in our COPD cohort in which M. catarrhalis was present in CS#8
and CS#10 by culture respectively.

144
Preceding Cabello, et al., (1997) are two earlier studies by Fagon, et al., (1990) and
Monsó, et al., (1995) which both used PSB lower airway sampling technique and quantitative
culture to characterise the lower airways in COPD patients. The former study by Fagon, et
al., (1990) investigated the lower airways of COPD inpatient’s mechanically ventilated
suffering from severe exacerbations, whereas the latter study by Monsó, et al., (1995)
sampled the lower pulmonary tree in stable and moderately severe exacerbating COPD
outpatients. Evidence for bacterial bronchial pathogens in 50 % of cases was confirmed by
both studies using PSB, with the remaining 50 % of cases implying the absence of pathogens
(Fagon et al., 1990, Monsó et al., 1995). A comparison in the validity of both study’s findings
against other techniques such as BAL was not performed by Fagon, et al., (1990) and Monsó,
et al., (1995) as BAL samples from the lower bronchial tree were not analysed in both COPD
cohorts enrolled into both studies. Retrospectively, a comparison of our conventional
microbiology culture data cannot be made, but both studies corroborate by culture-dependent
techniques that the lower airways in COPD patients are colonised both in exacerbated and
stable COPD populations. Indeed, other studies have shown that the lungs of stable COPD
populations are colonised with bacteria and this has been subsequently demonstrated to
contribute towards to the severity and frequency of patient exacerbations (Patel et al., 2002,
Rosell et al., 2005, White et al., 2003, Wilkinson et al., 2003).
From their original characterisation of the bronchial COPD pulmonary tree, Soler, et al.,
(1999) investigated 18 control (8 non-smokers and 18 smokers) and 53 stable COPD subjects
(28 mild, 11 moderate, and 13 severe COPD phenotypes based on FEV1) using PSB and BAL
sampling techniques. As before, a quantitative conventional microbiology approach was
carried out as in the previous studies (Cabello et al., 1997, Soler et al., 1998) in which they
found from the PSB and BAL sample analysis, the vast majority of PPMs isolated from both
patient cohorts were community acquired, i.e., S. pneumoniae, S. aureus, H. influenzae, and
M. catarrhalis. Indeed, from the COPD cohort subjected to culture-dependent microbiology,
9 (mild), 11 (moderate), and 2 (severe) COPD patients respectively, was culture-positive for
PPMs (Soler et al., 1999). In corroboration with the previous study by Soler, et al., (1997),
the most prevalent non-PPM isolated was S. viridans. The findings by Soler, et al., (1999),
partly confirm our findings both by culture-dependent and –independent means as they
conclusively found that both patient cohorts analysed, in particular their COPD cohort by

145
BAL sample analyses, were frequently colonised by community acquired PPMs in the
bronchial tree (Soler et al., 1999).
The remaining COPD subjects (CS#4, CS#5, CS#7, CS#9, CS#11, and CS#12) in our
study were all culture-negative from the conventional microbiology investigation. Although,
from the 454-pyrosequencing approach employed, detection of many bacterial taxa was
evident. This is clearly apparent in CS#4, CS#5, and CS#9, in which 136, 447, and 182 OTUs
pertaining to bacterial genera respectively, were generated from the sequencing reads
obtained (Table 5.1). In COPD subjects #7, #11, and #12, in which the number of bacterial
genera detected by 454-pyrosequencing was much lower in comparison to the other COPD
subjects, the number of OTUs observed is indicative of several bacterial species recovered
from the RLL in the BAL samples analysed. Additionally, from the data presented in Fig. 5.7
it is evident that the COPD subjects diagnosed as being culture-negative indeed harbour a
lower airway bacterial population varying in diversity.
Furthermore, despite this diagnosis by conventional microbiology, the use of BAL for
culture-based microbiological detection is still advantageous over the culture-based methods
using sputum as a diagnostic tool, although bronchoscopy itself is still a highly invasive
examination technique. The main advantage being that BAL provides an in situ
representation of the lower airways in healthy or diseased individuals (Reynolds, 2011).
However, a previous initial study has demonstrated that recovery of BAL from patients for
microbial culture can also yield oropharyngeal commensals; these can sometimes be
designated as normal or mouth flora by an individual identifying bacterial species on culture
media (Reynolds and Newball, 1974). This identification of normal or mouth flora could
have been a biasing factor leading to the conflicting culture-dependent and metagenomic data
presented above. The retrieval of BAL however, for the detection of bacterial infection in
COPD alongside other investigations is still preferable over sputum due to the decreased risk
of contamination from URT organisms in either the oro- or nasopharyngeal cavity.
The use of conventional microbiology for analysis in COPD, and indeed other chronic
respiratory diseases such as CF, is also limited in its detection due to the selective nature of
the media employed; investigation of the LRT using traditional culture-based methodologies
under standard conditions can only culture up to 30 % of bacteria (Suau et al., 1999), this is
in addition to culture-dependent techniques being very labour intensive. Also, the

146
differentiation of bacterial strains isolated from the same species is a confounding factor as
these strains cannot be detected by conventional microbiology. Thus detection of different
bacterial strains can only be accomplished by molecular typing methods such as pulsed-field
electrophoresis. As has been recently shown in the last decade, acquisition of different
bacterial strains in COPD is strongly associated with the induction of acute exacerbations in
these patient populations (Murphy et al., 2005, Murphy et al., 2007, Sethi et al., 2002, Sethi
et al., 2007).
Because of these limitations, many researchers investigating the lower bronchial tree in
COPD are now using modern 16S rRNA molecular profiling techniques to reveal a bacterial
diversity that is greater than previously imagined; this is now being realised (Cabrera-Rubio
et al., 2012, Erb-Downward et al., 2011, Hilty et al., 2010, Huang et al., 2010, Pragman et al.,
2012, Sze et al., 2012). The preliminary research conducted in CF in the last decade using
culture-independent techniques provides a foundation for much of the investigative work
carried out in COPD. This approach has resulted in CF now being increasingly recognised as
a polymicrobial disease (Rogers et al., 2009a). This is in addition to the complexity of the
human oral microbiome and the just recently postulated core respiratory tract microbiome
(Avila et al., 2009, Han et al., 2012). Culture-based detection in chronic respiratory tract
diseases via expectorated sputum and bronchial washings are still essential for the diagnosis
of acute infections or the determination of a carrier state in the patient (Reynolds, 2011).
Despite the above limitations, traditional based cultivation of bacterial pathogens still has its
advantages though. In CF this is particularly important as conventional microbiological
methods enable the detection of the mucoid phenotype established by P. aeruginosa in
chronically infected CF patients (Fegan et al., 1990, Hassett et al., 2002, Martin et al., 1993,
Sokol et al., 1994, Yu et al., 2002). Differentiation between P. aeruginosa morphotypes is
critical in a diagnostic microbiology laboratory as it has been demonstrated that within these
morphotypes there is an inherent variability in their antimicrobial susceptibility patterns
(Foweraker et al., 2005), thus this can affect the antibiotic treatment regimen of the CF
patients concerned.
5.4.3 Fungal community analysis in COPD cohort by PCR-DGGE
The possibility of a fungal element in stable COPD patients has not been widely reported.
Here our analysis revealed a significant and diverse fungal community. This raises several
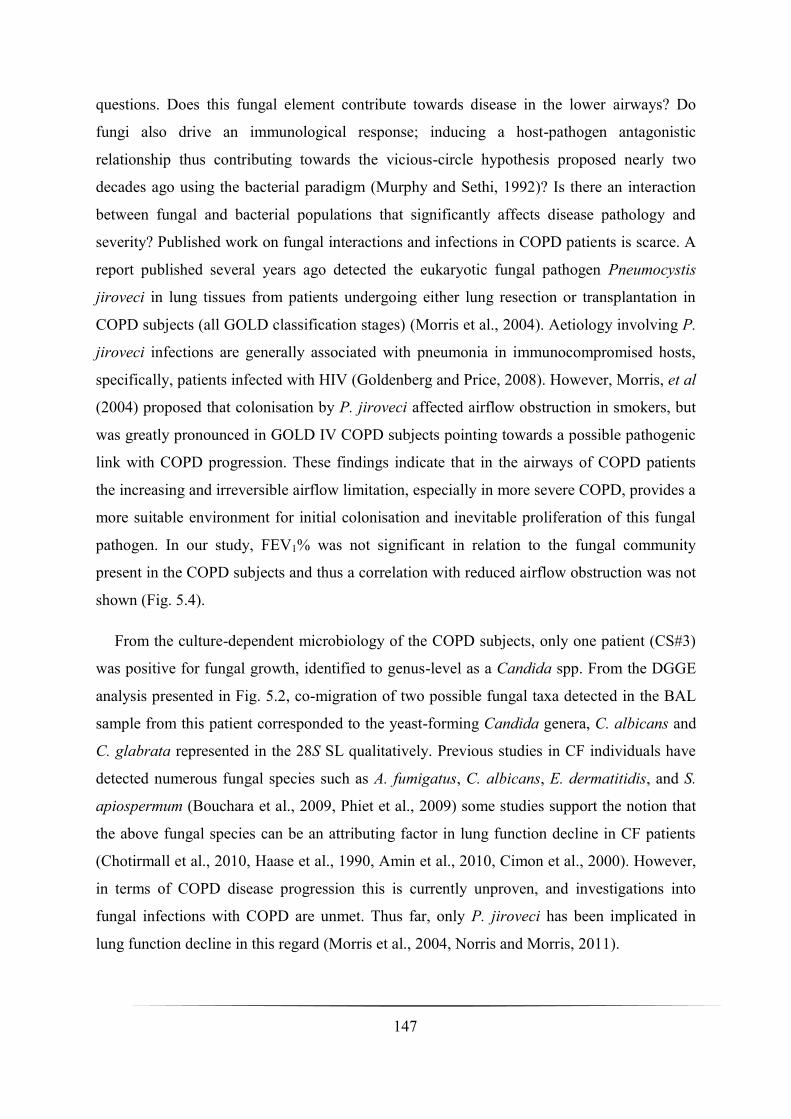
147
questions. Does this fungal element contribute towards disease in the lower airways? Do
fungi also drive an immunological response; inducing a host-pathogen antagonistic
relationship thus contributing towards the vicious-circle hypothesis proposed nearly two
decades ago using the bacterial paradigm (Murphy and Sethi, 1992)? Is there an interaction
between fungal and bacterial populations that significantly affects disease pathology and
severity? Published work on fungal interactions and infections in COPD patients is scarce. A
report published several years ago detected the eukaryotic fungal pathogen Pneumocystis
jiroveci in lung tissues from patients undergoing either lung resection or transplantation in
COPD subjects (all GOLD classification stages) (Morris et al., 2004). Aetiology involving P.
jiroveci infections are generally associated with pneumonia in immunocompromised hosts,
specifically, patients infected with HIV (Goldenberg and Price, 2008). However, Morris, et al
(2004) proposed that colonisation by P. jiroveci affected airflow obstruction in smokers, but
was greatly pronounced in GOLD IV COPD subjects pointing towards a possible pathogenic
link with COPD progression. These findings indicate that in the airways of COPD patients
the increasing and irreversible airflow limitation, especially in more severe COPD, provides a
more suitable environment for initial colonisation and inevitable proliferation of this fungal
pathogen. In our study, FEV1% was not significant in relation to the fungal community
present in the COPD subjects and thus a correlation with reduced airflow obstruction was not
shown (Fig. 5.4).
From the culture-dependent microbiology of the COPD subjects, only one patient (CS#3)
was positive for fungal growth, identified to genus-level as a Candida spp. From the DGGE
analysis presented in Fig. 5.2, co-migration of two possible fungal taxa detected in the BAL
sample from this patient corresponded to the yeast-forming Candida genera, C. albicans and
C. glabrata represented in the 28S SL qualitatively. Previous studies in CF individuals have
detected numerous fungal species such as A. fumigatus, C. albicans, E. dermatitidis, and S.
apiospermum (Bouchara et al., 2009, Phiet et al., 2009) some studies support the notion that
the above fungal species can be an attributing factor in lung function decline in CF patients
(Chotirmall et al., 2010, Haase et al., 1990, Amin et al., 2010, Cimon et al., 2000). However,
in terms of COPD disease progression this is currently unproven, and investigations into
fungal infections with COPD are unmet. Thus far, only P. jiroveci has been implicated in
lung function decline in this regard (Morris et al., 2004, Norris and Morris, 2011).
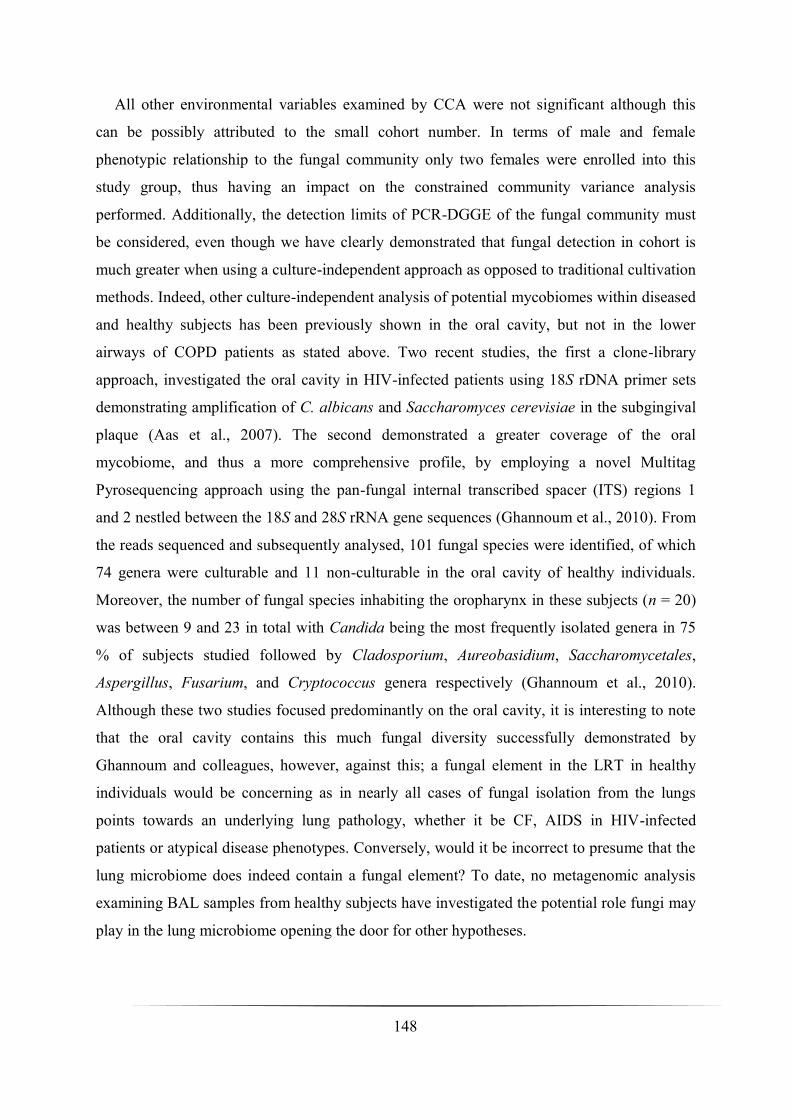
148
All other environmental variables examined by CCA were not significant although this
can be possibly attributed to the small cohort number. In terms of male and female
phenotypic relationship to the fungal community only two females were enrolled into this
study group, thus having an impact on the constrained community variance analysis
performed. Additionally, the detection limits of PCR-DGGE of the fungal community must
be considered, even though we have clearly demonstrated that fungal detection in cohort is
much greater when using a culture-independent approach as opposed to traditional cultivation
methods. Indeed, other culture-independent analysis of potential mycobiomes within diseased
and healthy subjects has been previously shown in the oral cavity, but not in the lower
airways of COPD patients as stated above. Two recent studies, the first a clone-library
approach, investigated the oral cavity in HIV-infected patients using 18S rDNA primer sets
demonstrating amplification of C. albicans and Saccharomyces cerevisiae in the subgingival
plaque (Aas et al., 2007). The second demonstrated a greater coverage of the oral
mycobiome, and thus a more comprehensive profile, by employing a novel Multitag
Pyrosequencing approach using the pan-fungal internal transcribed spacer (ITS) regions 1
and 2 nestled between the 18S and 28S rRNA gene sequences (Ghannoum et al., 2010). From
the reads sequenced and subsequently analysed, 101 fungal species were identified, of which
74 genera were culturable and 11 non-culturable in the oral cavity of healthy individuals.
Moreover, the number of fungal species inhabiting the oropharynx in these subjects (n = 20)
was between 9 and 23 in total with Candida being the most frequently isolated genera in 75
% of subjects studied followed by Cladosporium, Aureobasidium, Saccharomycetales,
Aspergillus, Fusarium, and Cryptococcus genera respectively (Ghannoum et al., 2010).
Although these two studies focused predominantly on the oral cavity, it is interesting to note
that the oral cavity contains this much fungal diversity successfully demonstrated by
Ghannoum and colleagues, however, against this; a fungal element in the LRT in healthy
individuals would be concerning as in nearly all cases of fungal isolation from the lungs
points towards an underlying lung pathology, whether it be CF, AIDS in HIV-infected
patients or atypical disease phenotypes. Conversely, would it be incorrect to presume that the
lung microbiome does indeed contain a fungal element? To date, no metagenomic analysis
examining BAL samples from healthy subjects have investigated the potential role fungi may
play in the lung microbiome opening the door for other hypotheses.

149
Critically, the PCR-DGGE approach adopted here is constrained by the choice of primer
set and the ‘semi-nested’ PCR performed. The DGGE profile in Fig. 5.2 representing the
fungal community in cohort must be approached, to a degree, with caution. Firstly, the
attachment of a GC-clamp to the reverse universal fungal primer U2R-GC may mirror the
effects observed in GC-clamp attachment amplicon variation in PCR-DGGE studies of
bacterial 16S rRNA gene community profiling leading consequently to artefactual production
such as chimeras and heteroduplex formation (Muyzer and Smalla, 1998, Rettedal et al.,
2010). To counter these effects we used a single batch of primers to offset any potential bias
that has been previously reported in using multiple batches of a single primer (Rettedal et al.,
2010). Additionally, during the PCR and subsequent amplification of the universal regions
within the 28S rRNA gene, an additional 30 min during the final elongation step was
implemented to further reduce the formation of any artefacts which could adversely affect the
fungal community analysis (Janse et al., 2004). Thirdly, because cohort is small and only one
clinical sample (either BAL or BS (in the case of CS#11)) was analysed the data at best can
only attempt to provide a ‘snapshot’ of the microbial community identified. Longitudinal
studies in this cohort using gDNA from BAL to generate both bacterial and fungal
communities via PCR-DGGE profiles would have been complementary to the data presented.
Additionally, no sequence data is available from the fungal community.
Retrospectively in terms of a paradigm; fungal infection could have a role in disease
progression in COPD subjects in relation to polymicrobial infection processes. Impaired
innate lung defence mechanisms in the LRT in COPD induced primarily by smoking in
addition to the fungal mycobiome in the oral cavity could predispose COPD patients to
fungal infection. The action of smoking on the lower airways has been previously shown to
cause defects in mucocilliary clearance thus effecting mucocilliary escalator function, and
inducing surfactant abnormalities (Finley and Ladman, 1972, Vastag et al., 1985, Stanley et
al., 1986, Verra et al., 1995, Honda et al., 1996). Both of these dysfunctional properties
suggestively increase the probability of fungal colonisation in the LRT, as in bacterial
colonisation, and in turn decrease the fundamental mechanisms necessary for pathogen
clearance.
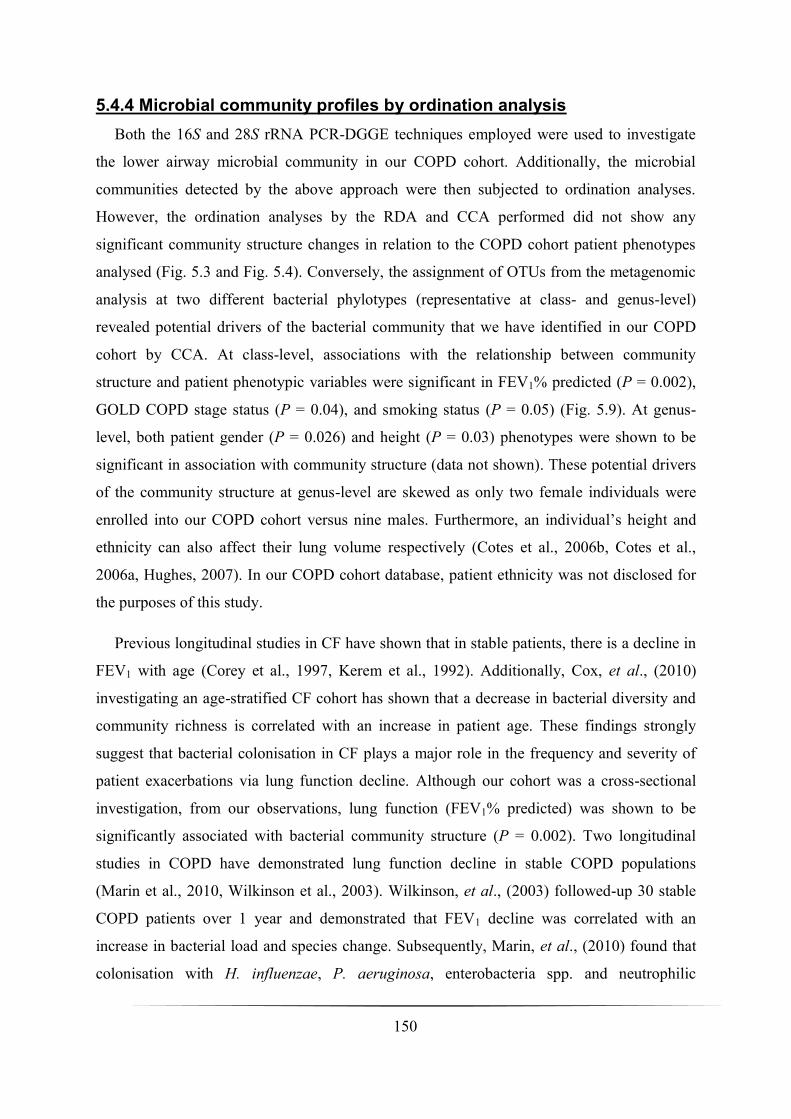
150
5.4.4 Microbial community profiles by ordination analysis
Both the 16S and 28S rRNA PCR-DGGE techniques employed were used to investigate
the lower airway microbial community in our COPD cohort. Additionally, the microbial
communities detected by the above approach were then subjected to ordination analyses.
However, the ordination analyses by the RDA and CCA performed did not show any
significant community structure changes in relation to the COPD cohort patient phenotypes
analysed (Fig. 5.3 and Fig. 5.4). Conversely, the assignment of OTUs from the metagenomic
analysis at two different bacterial phylotypes (representative at class- and genus-level)
revealed potential drivers of the bacterial community that we have identified in our COPD
cohort by CCA. At class-level, associations with the relationship between community
structure and patient phenotypic variables were significant in FEV1% predicted (P = 0.002),
GOLD COPD stage status (P = 0.04), and smoking status (P = 0.05) (Fig. 5.9). At genus-
level, both patient gender (P = 0.026) and height (P = 0.03) phenotypes were shown to be
significant in association with community structure (data not shown). These potential drivers
of the community structure at genus-level are skewed as only two female individuals were
enrolled into our COPD cohort versus nine males. Furthermore, an individual’s height and
ethnicity can also affect their lung volume respectively (Cotes et al., 2006b, Cotes et al.,
2006a, Hughes, 2007). In our COPD cohort database, patient ethnicity was not disclosed for
the purposes of this study.
Previous longitudinal studies in CF have shown that in stable patients, there is a decline in
FEV1 with age (Corey et al., 1997, Kerem et al., 1992). Additionally, Cox, et al., (2010)
investigating an age-stratified CF cohort has shown that a decrease in bacterial diversity and
community richness is correlated with an increase in patient age. These findings strongly
suggest that bacterial colonisation in CF plays a major role in the frequency and severity of
patient exacerbations via lung function decline. Although our cohort was a cross-sectional
investigation, from our observations, lung function (FEV1% predicted) was shown to be
significantly associated with bacterial community structure (P = 0.002). Two longitudinal
studies in COPD have demonstrated lung function decline in stable COPD populations
(Marin et al., 2010, Wilkinson et al., 2003). Wilkinson, et al., (2003) followed-up 30 stable
COPD patients over 1 year and demonstrated that FEV1 decline was correlated with an
increase in bacterial load and species change. Subsequently, Marin, et al., (2010) found that
colonisation with H. influenzae, P. aeruginosa, enterobacteria spp. and neutrophilic
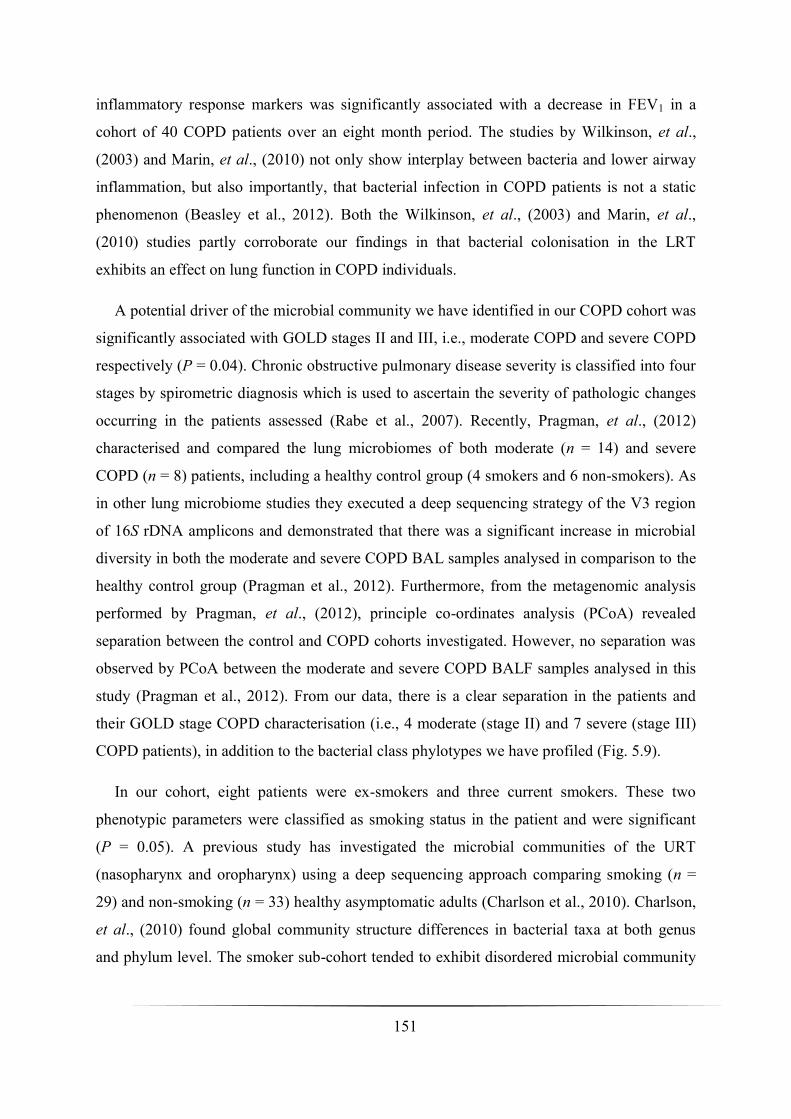
151
inflammatory response markers was significantly associated with a decrease in FEV1 in a
cohort of 40 COPD patients over an eight month period. The studies by Wilkinson, et al.,
(2003) and Marin, et al., (2010) not only show interplay between bacteria and lower airway
inflammation, but also importantly, that bacterial infection in COPD patients is not a static
phenomenon (Beasley et al., 2012). Both the Wilkinson, et al., (2003) and Marin, et al.,
(2010) studies partly corroborate our findings in that bacterial colonisation in the LRT
exhibits an effect on lung function in COPD individuals.
A potential driver of the microbial community we have identified in our COPD cohort was
significantly associated with GOLD stages II and III, i.e., moderate COPD and severe COPD
respectively (P = 0.04). Chronic obstructive pulmonary disease severity is classified into four
stages by spirometric diagnosis which is used to ascertain the severity of pathologic changes
occurring in the patients assessed (Rabe et al., 2007). Recently, Pragman, et al., (2012)
characterised and compared the lung microbiomes of both moderate (n = 14) and severe
COPD (n = 8) patients, including a healthy control group (4 smokers and 6 non-smokers). As
in other lung microbiome studies they executed a deep sequencing strategy of the V3 region
of 16S rDNA amplicons and demonstrated that there was a significant increase in microbial
diversity in both the moderate and severe COPD BAL samples analysed in comparison to the
healthy control group (Pragman et al., 2012). Furthermore, from the metagenomic analysis
performed by Pragman, et al., (2012), principle co-ordinates analysis (PCoA) revealed
separation between the control and COPD cohorts investigated. However, no separation was
observed by PCoA between the moderate and severe COPD BALF samples analysed in this
study (Pragman et al., 2012). From our data, there is a clear separation in the patients and
their GOLD stage COPD characterisation (i.e., 4 moderate (stage II) and 7 severe (stage III)
COPD patients), in addition to the bacterial class phylotypes we have profiled (Fig. 5.9).
In our cohort, eight patients were ex-smokers and three current smokers. These two
phenotypic parameters were classified as smoking status in the patient and were significant
(P = 0.05). A previous study has investigated the microbial communities of the URT
(nasopharynx and oropharynx) using a deep sequencing approach comparing smoking (n =
29) and non-smoking (n = 33) healthy asymptomatic adults (Charlson et al., 2010). Charlson,
et al., (2010) found global community structure differences in bacterial taxa at both genus
and phylum level. The smoker sub-cohort tended to exhibit disordered microbial community

152
structure than the non-smoking sub-cohort, including an increase in diversity in both the
oropharyngeal and nasopharyngeal sites sampled (Charlson et al., 2010). Additionally, the
smoker sub-cohort URT microbiome was also characterised by more bacterial genera
potentially associated with respiratory tract disease. The data presented by Charlson, et al.,
(2010) is in agreement with our own data suggesting that smoking status in a COPD patient
can exhibit an effect on the community structure, although in the above study only the URT
was sampled not the LRT.
5.5 Conclusions
The culture-independent techniques against the conventional culture-based methods have
enabled us to characterise the lung microbiome in a small cohort of moderate and severe
COPD patients. We have also demonstrated that the lower airways in our COPD cohort are
composed of a polymicrobial community using both a PCR-DGGE and deep sequencing
strategy. Both these bacterial and fungal elements may drive the perpetuating immunological
response playing a role in the vicious circle hypothesis. However, no sequencing data was
obtained when using a 16S and 28S PCR-DGGE approach so the profiles we have generated
using this technique is putative at best.
The metagenomic data analysed from the 454-pyrosequencing reads has shown that each
COPD subject was host to heterogeneous bacterial populations, with the most dominant
genera being Streptococcus, Arthrobacter, and Staphylococcus spp. respectively. The deep
sequencing approach has enabled us to characterise this COPD cohort to reveal a diverse
population in the RLL of the pulmonary tree. The most prevalent bacterial genera we have
identified conflicts with other metagenomic studies which have previously profiled the
COPD lung microbiome in both stable and exacerbating COPD populations. However, all
previous studies executed different sampling strategies involving their COPD cohorts
respectively.
From the ordination analyses, both bacterial and fungal communities identified by PCR-
DGGE exhibited no significance in terms of patient phenotype and community structure.
However, from the metagenomic analysis, the bacterial community identified and resolved to
genus-level, both gender and height are shown to be significant in community structure.
Resolution at class-level revealed that lung function (FEV1% predicted), COPD disease

153
progression (GOLD stage II or III), and smoking status, were all associated with community
structure in the cohort analysed.
Molecular-based detection techniques in COPD could point the way towards a greater
understanding of the microbial communities in colonised individuals and elucidate the
complex mechanisms between host and microbe and their role in the induction of
exacerbations.
154
References
AAS, J. A., BARBUTO, S. M., ALPAGOT, T., OLSEN, I., DEWHIRST, F. E. & PASTER,
B. J. 2007. Subgingival plaque microbiota in HIV. Journal of Clinical
Periodontology, 34, 189-195.
AAS, J. A., PASTER, B. J., STOKES, L. N., OLSEN, I. & DEWHIRST, F. E. 2005.
Defining the normal bacterial flora of the oral cavity. Journal of Clinical
Microbiology, 43, 5721-5732.
ADÉKAMBI, T., DRANCOURT, M. & RAOULT, D. 2008. The rpoB gene as a tool for
clinical microbiologists. Trends in Microbiology, 17, 37-45.
AKINBAMI, L. J., MOORMAN, J. E. & LIU, X. 2011. Asthma prevalence, health care use,
and mortality: United States, 2005-2009. National Health Statistics Reports, 1-14.
AKIRA, S., UEMATSU, S. & TAKEUCHI, O. 2006. Pathogen recognition and innate
immunity. Cell, 124, 783-801.
ALEXOPOULOU, L., HOLT, A. C., MEDZHITOV, R. & FLAVELL, R. A. 2001.
Recognition of double-stranded RNA and activation of NF-κB by Toll-like receptor 3.
Nature, 413, 732-738.
ALZEER, A. H., MASOOD, M., BASHA, S. J. & SHAIK, S. A. 2007. Survival of
bronchiectatic patients with respiratory failure in ICU. BMC Pulmonary Medicine, 7,
17.
AMERICAN LUNG ASSOCIATION. Trends in asthma morbidity and mortality [Online].
Available: http://www.lung.org/lung-disease/asthma/resources/ [Accessed 17th March
2012].
AMIN, R., DUPUIS, A., AARON, S. D. & RATJEN, F. 2010. The effect of chronic infection
with Aspergillus fumigatus on lung function and hospitalisation in patients with cystic
fibrosis. 137.
AMMAN, R. I., LUDWIG, W. & SCHLEIFER, K. H. 1995. Phylogenetic identification and
in situ detection of individual microbial cells without cultivation. Microbiological
Reviews, 59, 143-169.
ANGRILL, J., AGUSTÍ, C., DE CELIS, R., RAÑÓ, A., GONZALEZ, J., SOLÉ, T.,
XAUBET, A., RODRIGUEZ-ROISIN, R. & TORRES, A. 2002. Bacterial
colonisation in patients with bronchiectasis: Microbiological pattern and risk factors.
Thorax, 57, 15-19.
155
ANWAR, G. A., BOURKE, S. C., AFOLABI, G., MIDDLETON, P. G., WARD, C. &
RUTHERFORD, R. M. 2008. Effects of long-term low-dose azithromycin in patients
with non-CF bronchiectasis. Respiratory Medicine, 102, 1494-1496.
ARMSTRONG, L., MEDFORD, A. R., UPPINGTON, K. M., ROBERSTON, J.,
WITHERDEN, I. R., TETELY, T. D. & MILLAR, A. B. 2004. Expression of
functional Toll-like receptor-2 and -4 on alveolar epithelial cells. American Journal of
Respiratory Cell and Molecular Biology, 31, 241-245.
AVILA, M., OJCIUS, D. M. & YILMAZ, Ö. 2009. The oral microbiota: Living with a
permanent guest. DNA and Cell Biology, 25, 405-411.
BALS, R. & HIEMSTRA, P. S. 2004. Innate immunity in the lung: How epithelial cells fight
against respiratory pathogens. European Respiratory Journal, 23, 327-333.
BAN, N., NISSEN, P., HANSEN, J., MOORE, P. B. & STEITZ, T. A. 2000. The complete
atomic structure of the large ribosomal subunit at 2.4 Å resolution. Science, 289, 905-
920.
BARKER, A. F. 2002. Bronchiectasis. New England Journal of Medicine, 346, 1383-1393.
BARNES, P. J. 2007. Chronic obstructive pulmonary disease: A growing but neglected
global epidemic. PLoS Medicine, 4, 779-780.
BARNES, P. J., SHAPIRO, S. D. & PAUWELS, R. A. 2003. Chronic obstructive pulmonary
disease: molecular and cellular mechanisms. European Respiratory Journal, 22, 672-
688.
BAUS, S. & FENTON, M. J. 2004. Toll-like receptors: Function and roles in lung disease.
American Journal of Physiology: Lung Cellular and Molecular Physiology, 286, 887-
892.
BEARD, W. A., SHOCK, D. D., VANDE BERG, B. J. & WILSON, S. H. 2002. Efficiency
of correct nucleotide insertion governs DNA polymerase fidelity. The Journal of
Biological Chemistry, 277, 47393-47398.
BEARD, W. A. & WILSON, S. H. 2000. Structural design of a eukaryotic DNA repair
polymerase: DNA polymerase β. Mutations Research, 460, 231-244.
BEARD, W. A. & WILSON, S. H. 2003. Structural insights into the origins of DNA
polymerase fidelity. Structure, 11, 489-496.
BEASLEY, V., JOSHI, P. V., SINGANAYAGAM, A., MOLYNEAUX, P. L., JOHNSTON,
S. L. & MALLIA, P. 2012. Lung microbiology and exacerbations in COPD.
International Journal of COPD, 7, 555-569.
BEBENEK, K. & KUNKEL, T. A. 2004. Functions of DNA polymerases. Advances in
Protein Chemistry, 69, 137-163.

156
BEESE, L. S., DERBYSHIRE, V. & STEITZ, T. A. 1993. Structure of DNA polymerase I
Klenow fragment bound to duplex DNA. Science, 260, 352-355.
BERESFORD, T. & CONDON, S. 1991. Cloning and partial characterisation of genes for
ribonucleic acid in Lactococcus lactis subsp. lactis. FEMS Microbiology Letters, 62,
319-323.
BERNASCONI, E., VALSANGIACOMO, C., PEDUZZI, R., CAROTA, A., MOCCETTI,
T. & FUNKE, G. 2004. Arthrobacter woluwensis subacute infective endocarditis:
Case report and review of the literature. Clinical Infectious Diseases, 38, 27-31.
BERNEY, C., FAHRNI, J. & PAWLOWSKI, J. 2004. How many novel eukaryotic
'kingdoms'? Pitfalls and limitations of environmental DNA surveys. BMC Biology, 2,
13.
BITTAR, F., RICHET, H., DUBUS, J. C., REYNAUD-GAUBERT, M., STREMLER, N.,
SARLES, J., RAOULT, D. & ROLAIN, J. M. 2008. Molecular detection of multiple
emerging pathogens in sputa from cystic fibrosis patients. PLoS ONE, 3, e2908.
BODAGHI, B., DAUGA, C., CASSOUX, N., WECHSLER, B., MERLE-BERAL, H.,
POVEDA, J. D., PIETTE, J. C. & LEHOANG, P. 1998. Whipple's syndrome (uveitis,
B27-negative spondylarthropathy, meningitis, and lymphadenopathy) associated with
Arthrobacter sp. infection. Ophthalmology, 105, 1891-1896.
BOGAERT, D., VAN BELKUM, A., SLUIJTER, M., LUIJENDIJK, A., DE GROOT, R.,
RÜMKE, H. C., VERBRUGH, H. A. & HERMANS, P. W. M. 2004. Colonisation by
Streptococcus pneumoniae and Staphylococcus aureus in healthy children. Lancet,
363, 1871-1872.
BONTON, M. J. M., VAN TIEL, F. H., VAN DER GEEST, S., SMEETS, H. G. W.,
STOBBERINGH, E. E. & GAILLARD, C. A. 1993. Topical antimicrobial
prophylaxis of nosocomial pneumonia in mechanically ventilated patients.
Microbiological observations. Infection, 21, 137-139.
BOUCHARA, J. P., HSIEH, H. Y., CROQUEFER, S., BARTON, R., MARCHAIS, V.,
PIHET, M. & CHANG, T. C. 2009. Development of an oligonucleotide array for
direct detection of fungi in sputum samples from patients with cystic fibrosis. Journal
of Clinical Microbiology, 47.
BOUCHER, R. C. 2002. An overview of the pathogenesis of cystic fibrosis lung disease.
Advanced Drug Delivery Reviews, 54, 1359-1371.
BOURKE, S. J. 2002. Respiratory Tract Infections: A Clinical Overview. In: SUSSMAN, M.
(ed.) Molecular Medical Microbiology. London: Academic Press.
BOWIE, A. & O'NEIL, L. A. 2000. The interleukin-1 receptor/Toll-like receptor
superfamily: Signal generators for pro-inflammatory interleukin and microbial
products. Journal of Leukocyte Biology, 67, 508-514.

157
BRADLEY, R. D. & HILLIS, D. M. 1997. Recombinant DNA sequences generated by PCR
amplification. Molecular Biology and Evolution, 14.
BRAKSTAD, O. G., NONSTAD, I., FAKSNESS, L. G. & BRANDVIK, P. J. 2008.
Responses of microbial communities in artic sea ice after contamination by crude
petroleum oil. Microbial Ecology, 55, 540-552.
BRAUTIGAM, C. A. & STEITZ, T. A. 1998. Structural and functional insights provided by
crystal structures of DNA polymerases and their substrate complexes. Current
Opinion in Structural Biology, 8, 54-63.
BRINKHOFF, T. & VAN HANNEN, E. J. 2001. Use of silicone grease to avoid "smiling
effect" in denaturing gradient gel electrophoresis. Journal of Rapid Methods and
Automation in Microbiology, 9, 259-261.
BRITISH LUNG FOUNDATION 2006. Lost in translation: Bridging the communication gap
in COPD.
BROGDEN, K. A., GUTHMILLER, J. M. & TAYLOR, C. E. 2005. Human polymicrobial
infections. Lancet, 365, 253-255.
BROWN, C. J., WONG, M., DAVIS, C. C., KANTI, A., ZHOU, X. & FORNEY, L. J. 2007.
Preliminary chacterisation of the normal microbiota of the human vulva using
cultivation-independent methods. Journal of Medical Microbiology, 56, 271-276.
BRUMFIT, W., WILLOUGHBY, M. & BROMLEY, L. 1957. Evaluation of sputum in
chronic bronchitis. Lancet, 270, 1306-1309.
BURROWS, B. & EARLE, R. H. 1969. Course and prognosis of chronic obstructive lung
disease: A prospective study of 200 patients. The New England Journal of Medicine,
280, 397-404.
CABELLO, H., TORRES, A., CELIS, R., EL-EBIARY, M., DE LA BELLACASA, J. P.,
XAUBET, J., GONZALEZ, J., AGUSTÍ, C. & SOLER, N. 1997. Bacterial
colonisation of distal airways in healthy subjects and chronic lung disease: A
bronchoscopic study. European Respiratory Journal, 10, 1137-1144.
CABRERA-RUBIO, R., GARCIA-NÙÑEZ, M., SETÓ, L., ANTÓ, J. M., MOYA, A.,
MONSÓ, E. & MIRA, A. 2012. Microbiome diversity in the bronchial tracts of
patients with chronic obstructive pulmonary disease. Journal of Clinical
Microbiology, 50, 3562-3568.
CATE, J. H., YUSUPOV, M. M., YUSUPOVA, G. Z., EARNEST, T. N. & NOLLER, H. F.
1999. X-ray crystal structures of 70S ribosome functional complexes. Science, 285,
2095-2104.
CHAKRAVORTY, S., HELB, D., BURDAY, M., CONNELL, N. & ALLAND, D. 2007. A
detailed analysis of 16S ribosomal RNA gene segments for the diagnosis of
pathogenic bacteria. Journal of Microbiological Methods, 69, 330-339.
158
CHAN, P. K., TAM, J. S., LAM, C. W., CHAN, E., WU, A., LI, C. K., BUCKLEY, T. A.,
NG, K. C., JOYNT, G. M., CHENG, F. W. T. & OTHERS 2003. Human
metapneumovirus detection in patients with severe acute respiratory syndrome.
Emerging Infectious Diseases, 9, 1058-1063.
CHARLSON, E. S., CHEN, J., CUSTERS-ALLEN, R., BITTINGER, K., LI, H., SINHA, R.,
HWANG, J., BUSHMAN, F. D. & COLLMAN, R. G. 2010. Disordered microbial
communities in the upper respiratory tract of cigarette smokers. PLos One, 5, e15216.
CHEN, F. L., WANG, G. C., TENG, S. O., OU, T. Y., YU, F. L. & LEE, W. S. 2012.
Clinical and epidemiological features of Chryseobacterium indologenes infections:
Analysis of 215 cases (in press). Journal of Microbiology, Immunology and Infection
[Online].
CHIEN, A., EDGAR, D. B. & TRELA, J. M. 1976. Deoxyribonucleic acid polymerase from
the extreme thermophile Thermus aquaticus. Journal of Bacteriology, 127, 1550-
1557.
CHOTIRMALL, S. H., O'DONOGHUE, E., BENNETT, K., GUNARATNAM, C., O'NEIL,
S. J. & MCELVANEY, N. G. 2010. Sputum Candida albicans presages FEV1 decline
and hospital-treated exacerbations in cystic fibrosis. Chest, 138, 1186-1195.
CHRISTNER, B. C., MOSLEY-THOMPSON, E., THOMPSON, L. G. & REEVE, J. N.
2001. Isolation of bacteria and 16S rDNAs from Lake Vostok accretion ice.
Environmental Microbiology, 3, 570-577.
CIMON, B., CARRERE, J., VINATIER, J. F., CHAZALETTE, J. P., CHABASSE, D. &
BOUCHARA, J. P. 2000. Clinical significance of Scedosporium apiospermum in
patients with cystic fibrosis. European Journal of Clinical Microbiology & Infectious
Diseases, 19, 53-56.
CLINE, J., BRAMAN, J. C. & HOGREFE, H. H. 1996. PCR fidelity of Pfu DNA
polymerase and other thermostable DNA polymerases. Nucleic Acids Research, 24,
3546-3551.
COHEN, M. & SAHN, S. A. 1999. Bronchiectasis in systemic diseases. Chest, 116, 1063-
1074.
COLE, P. J. 1986. Inflammation: a two-edged sword--the model of bronchiectasis. European
Journal of Respiratory Diseases. Supplement, 147, 6-15.
COREY, M., EDWARDS, L., LEVISON, H. & KNOWLES, M. 1997. Longitudinal analysis
of pulmonary function in patients with cystic fibrosis. The Journal of Pediatrics, 131,
809-814.
COSTELLO, E. K., LAUBER, C. L., HAMADY, M., FIERER, N., GORDON, J. I. &
KNIGHT, R. 2009. Bacterial community variation in human body habitats across
space and time. Science, 326, 1694-1697.

159
COSTERTON, J. W., STEWART, P. S. & GREENBERG, E. P. 1999. Bacterial biofilms: A
common cause of persistant infections. Science, 284, 1318-1322.
COTES, J. E., CHINN, D. J. & MILLER, M. R. 2006a. Genetic diversity: Reference values
in non-Caucasians. Lung Function: Physiology, Measurement and Application in
Medicine. Blackwell Publishing Ltd.
COTES, J. E., CHINN, D. J. & MILLER, M. R. 2006b. Reference values for lung function in
white (Caucasian) children and adults. Lung Function: Physiology, Measurement and
Application in Medicine. 6th ed.: Blackwell Publishing Ltd.
COX, M. J., ALLGAIER, M., TAYLOR, B., BAEK, M. S., HUANG, Y. J., DALY, R. A.,
KARAOZ, U., ANDERSEN, G. L., BROWN, R., FUJIMURA, K. E. & ET AL 2010.
Airway microbiota and pathogen abundance in age-stratified cystic fibrosis patients.
PloS One, 5, e11044.
CURTIS, T. P., SLOAN, W. T. & SCANNELL, J. W. 2002. Estimating prokaryotic diversity
and its limits. Proceedings of the National Academy of Sciences of the United States
of America, 99, 10494-10499.
CYSTIC FIBROSIS FOUNDATION. About Cystic Fibrosis [Online]. Available:
http://www.cff.org/AboutCF/ [Accessed 17th March 2012].
DAHLLÖF, I., BAILLIE, H. & KJELLEBERG, S. 2000. rpoB-based microbial community
analysis avoids limitations inherent in 16S rRNA gene intraspecies heterogeneity.
Applied and Environmental Microbiology, 66, 3376-3380.
DAVIES, J. C. & BILTON, D. 2009. Bugs, biofilms, and resistance in cystic fibrosis.
Respiratory Care, 54, 628-640.
DAVIS, G., WELLS, A. U., DOFFMAN, S., WATANABE, S. & WILSON, R. 2006. The
effect of Pseudomonas aeruginosa on pulmonary function in patients with
bronchiectasis. European Respiratory Journal, 28, 974-979.
DE BENTZMANN, S., ROGER, P. & PURCHELLE, E. 1996. Pseudomonas aeruginosa
adherence to remodelling respiratory epithelium. European Respiratory Journal, 9,
2145-2150.
DE VRANKRIJKER, A. M. M., WOLFS, T. F. W. & VAN DER ENT, C. K. 2010.
Challenging and emerging pathogens in cystic fibrosis. Paediatric Respiratory
Reviews, 11, 246-254.
DECRAMER, M., RENNARD, S., TROOSTERS, T., MAPEL, D. W., GIARDINO, N.,
MANNINO, D., WOUTERS, E., SETHI, S. & COOPER, G. B. 2008. COPD as a
lung disease with systemic consequences: clinical impact, mechanisms, and potential
for early intervention. Journal of Chronic Obstructive Pulmonary Disease, 5, 235-
256.
DELARUE, M., POCH, O., TORDO, N., MORAS, D. & ARGOS, P. 1990. An attempt to
unify the structure of polymerases. Protein Engineering, 3, 461-467.
160
DELONG, E. F. & PACE, N. R. 2001. Environmental diversity of bacteria and archaea.
Systematic Biology, 50, 470-478.
DELONG, E. F., WU, K. Y., PREZELIN, B. B. & JOVINE, R. V. 1994. High abundance of
Archaea in Antarctic marine picoplankton. Nature, 371, 695-697.
DETHLEFSEN, L., HUSE, S., SOGIN, M. L. & RELMAN, D. A. 2008. The pervasive
effects of an anitbiotic on the human gut microbiota, as revealed by deep 16S rRNA
sequencing. PLoS Biology, 6, e280.
DETHLEFSEN, L., MCFALL-NGAI, M. & RELMAN, D. A. 2007. An ecological and
evolutionary perspective on human-microbe mutualism and disease. Nature, 449, 811-
818.
DIAZ, P. I., CHALMERS, N. I., RICKARD, A. H., KONG, C., MILBURN, C. L.,
PALMER, R. J., JR. & KOLENBRANDER, P. E. 2006. Molecular characterisation of
subject-specific oral microflora during initial colonisation of enamel. Applied and
Environmental Microbiology, 72, 2837-2848.
DOLLHOPF, S. L., HASHSHAM, S. A. & TIEDJE, J. M. 2001. Interpreting 16S rDNA T-
RFLP data: Application of self-organising maps and principal component analysis to
describe community dynamics and convergence. Microbial Ecology, 42, 495-505.
DON, R. H., COX, P. T., WAINWIRGHT, B. J., BAKER, K. & MATTICK, J. S. 1991.
"Touchdown" PCR to circumvent spurious priming during gene amplification.
Nucleic Acids Research, 19, 4008.
DONLAN, R. M. & COSTERTON, J. W. 2002. Biofilms: Survival mechanisms of clinically
relevant micro-organisms. Clinical Microbiology Reviews, 15, 167-193.
DÖRING, G. & RATJEN, F. 2005. Cystic fibrosis molecular cell biology. In: MEYERS, R.
A. (ed.) Encylopedia of Molecular Cell Biology and Molecular Medicine. 2nd ed.
Weinheim: Wiley-VCH.
DOWD, S. E., CALLAWAY, T. R., WOLCOTT, R. D., SUN, Y., MCKEEHAN, T.,
HAGEVOORT, R. G. & EDRINGTON, T. S. 2008. Evaluation of the bacterial
diversity in the faeces of cattle using 16S rDNA bacterial tag-encoded FLX amplicon
pyosequencing (bTEFAP). BMC Microbiology, 8, 125.
DRENNAN, M. B., NICOLLE, D., QUESNIAUX, V. J. F., JACOBS, M., ALLIE, N.,
MPAGI, J., FRÉMOND, C., WAGNER, H., KIRSCHNING, C. & RYFFEL, B. 2004.
Toll-like receptor 2 deficient mice succumb to Mycobacterium tuberculosis infection.
American Journal of Pathology, 164, 49-57.
DUMBRELL, A. J., NELSON, M., HELGASON, T., DYTHAM, C. & FITTER, A. H. 2010.
Relative roles of niche and neutral processes in structuring a soil microbial
community. ISME, 4, 337-45.
DYKHUIZEN, D. E. 1998. Santa Rosalia revisted: Why are they so many species of
bacteria? Antonie Van Leeuwenhoek, 73, 25-33.

161
ECKBURG, P. B., BIK, E. M., BERNSTEIN, C. N., PURDOM, E., DETHLEFSEN, L.,
SARGENT, M., GIL, S. R., NELSON, K. E. & RELMAN, D. A. 2005. Diversity of
the human intestinal microbial flora. Science, 308, 1635-1638.
ECKBURG, P. B. & RELMAN, D. A. 2007. The role of microbes in Crohn's disease.
Clinical Infectious Diseases, 44, 256-262.
EDENBORN, S. L. & SEXSTONE, A. J. 2007. DGGE fingerprinting of culturable soil
bacterial communities complements culture-independent analyses. Soil Biology &
Biochemistry, 39, 1570-1579.
EDWARDS, R., RODRIGUEZ-BRITO, B., WEGLEY, L., HAYNES, M., BREITBART, M.,
PETERSON, D., SAAR, M., ALEXANDER, S., ALEXANDER, E. & ROHWER, F.
2006. Using pyrosequencing to shed light on deep mine microbial ecology. BMC
Genomics, 7, 57.
EILERS, H., PERNTHALER, J., GLÖCKNER, F. O. & AMANN, R. 2000. Culturability and
in situ abundance of pelagic bacteria from the North Sea. Applied and Environmental
Microbiology, 66, 3044-3051.
ERB-DOWNWARD, J. R., THOMPSON, D. L., HAN, M. K., FREEMAN, C. M.,
MCCLOSKEY, L., SCHMIDT, L. A., YOUNG, V. B., TOEWS, G. B., CURTIS, J.
L., SUNDARAM, B., MARTINEZ, F. J. & HUFFNAGLE, G. B. 2011. Analysis of
the lung microbiome in the "healthy" smoker and in COPD. PLos One, 6, e16384.
ESTEBAN, J., BUENO, J., PEREZ-SANTONJA, J. J. & SORIANO, F. 1996.
Endophthalmitis involving an Arthrobacter-like organism following intraocular lens
implantation. Clinical Infectious Diseases, 23, 1180-1181.
FAGON, J. Y., CHASTRE, J., TROUILLET, J. L., DOMART, Y., DOMBRET, M. C.,
BORNET, M. & GIBERT, C. 1990. Characterisation of distal microflora during acute
exacerbations of chronic bronchitis. American Review of Respiratory Disease, 142,
1004-1008.
FEGAN, M., FRANCIS, P., HAYWARD, A. C., DAVIS, G. H. & FUERST, J. A. 1990.
Phenotypic conversion of Pseudomonas aeruginosa in cystic fibrosis. Journal of
Clinical Microbiology, 28, 1143-1146.
FERRIS, M. J. & WARD, D. M. 1997. Seasonal distributions of dominant 16S rRNA-defined
populations in a hot spring microbial mat examined by denaturing gradient gel
electrophoresis. Applied and Environmental Microbiology, 63, 1375-1381.
FIERER, N., HAMADY, M., LAUBER, C. L. & KNIGHT, R. 2008. The influence of sex,
handedness, and washing on the diversity of hand surface bacteria. Proceedings of the
National Academy of Sciences of the United States of America, 105, 17994-17999.
FINLEY, T. N. & LADMAN, A. J. 1972. Low yield of pulmonary surfactant in cigarette
smokers. The New England Journal of Medicine, 286, 223-227.
162
FISCHER, S. G. & LERMAN, L. S. 1983. DNA fragments differing by single base-pair
substitutions are separated in denaturing gradient gels: Correspondence with melting
theory. Proceedings of the National Academy of Sciences of the United States of
America, 80, 1579-1583.
FOWERAKER, J. E. 2009. Recent advances in the microbiology of respiratory tract infection
in cystic fibrosis. British Medical Bulletin, 89, 93-110.
FOWERAKER, J. E., LAUGHTON, C. R., BROWN, D. F. J. & BILTON, D. 2005.
Phenotypic variability of Pseudomonas aeruginosa in sputa from patients with acute
infective exacerbation of cystic fibrosis and its impact on the validity of antimicrobial
susceptibility testing. Journal of Antimicrobial Chemotherapy, 55, 921-927.
FOXMAN, B., GOLDBERG, D., MURDOCK, C., XI, C. & GILSDORF, J. R. 2008.
Conceptualising human microbiota: From multicelled organ to ecological community.
Interdisciplinary Perspectives on Infectious Diseases, 2008, 1-5.
FUJIMOTO, C., MAEDA, H., KOKEGUCHI, S., TAKASHIBA, S., NISHIMURA, F.,
ARAI, H., FUKUI, K. & MURAYAMA, Y. 2003. Application of denaturing gradient
gel electrophoresis (DGGE) to the analysis of microbial communities of subgingival
plaque. Journal of Peridontal Research, 38, 440-445.
FUNKE, G., HUTSON, R. A., BERNARD, K. A., PFYFFER, G. E., WAUTER, G. &
COLLINS, M. D. 1996. Isolation of Arthrobacter spp. from clinical specimens and
description of Arthrobacter cumminsii sp. nov. and Arthrobacter woluwensis sp. nov.
Journal of Clinical Microbiology, 34, 2356-2363.
FUTTERER, O., ANGELOV, A., LIESEGANG, H., GOTTSCHALK, G., SCHLEPER, C.,
SCHEPERS, B., DOCK, C., ANTRANIKAN, G. & LIEBL, W. 2004. Genome
sequence of Picrophilus torridus and its implications for life around pH 0.
Proceedings of the National Academy of Sciences of the United States of America,
101, 9091-9096.
GAO, Z., TSENG, C. H., PEI, Z. & BLASER, M. J. 2007. Molecular analysis of the human
forearm superficial skin bacterial biota. Proceedings of the National Academy of
Sciences of the United States of America, 104, 2927-2932.
GARAU, J. & GOMEZ, L. 2003. Pseuodmonas aeruginosa pneumonia. Current Opinion in
Infectious Diseases, 16, 135-143.
GARNIER, T., CANARD, B. & COLE, S. T. 1991. Cloning, mapping, and molecular
characterisation of the rRNA operon of Clostridium perfingens. Journal of
Bacteriology, 173, 5431-5438.
GEORGE, A. M., JONES, P. M. & MIDDLETON, P. G. 2009. Cystic fibrosis infections:
Treatment strategies and prospects. FEMS Microbiology Letters, 300, 153-164.
GHANNOUM, M. A., JUREVIC, R. J., MUKHERJEE, P. K., CUI, F., SIKAROODI, M.,
NAQVI, A. & GILLEVET, P. M. 2010. Characterisation of the oral fungal
microbiome (mycobiome) in healthy individuals. PLoS Pathogens, 6, e1000713.

163
GOERING, R. V., DOCKRELL, H. M., ZUCKERMAN, M., WAKELIN, D., ROITT, I. M.,
MIMS, C. & CHIODINI, P. L. 2008. Mims' Medical Microbiology, China, Mosby,
Elsevier Ltd.
GOLDENBERG, S. & PRICE, N. 2008. Opportunistic fungal lung infections. Medicine, 36,
295-299.
GONZALEZ, A., CLEMENTE, J. C., SHADE, A., METCALF, J. L., SONG, S.,
PRITHIVIRAJ, B., PALMER, B. E. & KNIGHT, R. 2011. Our microbial selves:
What ecology can teach us. EMBO Reports, 12, 775-784.
GORDON, D. A., PRISCU, J. & GIOVANNONI, S. J. 2000. Origin and phylogeny of
microbes living in permanent Antarctic lake ice. Microbial Ecology, 39, 197-202.
GREENSILL, J., MCNAMARA, P. S., DOVE, W., FLANAGAN, B., SMYTH, R. L. &
HART, C. A. 2003. Human metapneumovirus in severe respiratory syncytial virus
bronchiolitis. Emerging Infectious Diseases, 9, 372-375.
GRIMWOOD, K. 2011. Airway microbiology and host defences in paediatric non-CF
bronchiectasis. Paediatric Respiratory Reviews, 12, 111-118.
GROENEVELD, K., VAN ALPEN, L., EIJK, P. P., JANSEN, H. M. & ZANEN, H. C. 1988.
Changes in outer membrane proteins of non-typeable Haemophilus influenzae in
patients with chronic obstructive pulmonary disease. Journal of Infectious Diseases,
158, 360-365.
GUMP, D. W., PHILLIPS, C. A., FORSYTH, B. R., MCINTOSH, K., LAMBORN, K. R. &
STOUCH, W. H. 1976. Role of infection in chronic bronchitis. American Review of
Respiratory Disease, 113, 465-474.
HAASE, G., SKOPNIK, H. & KUSENBACH, G. 1990. Exophiala dermatitidis infection in
cystic fibrosis. Lancet, 336, 188-189.
HALL-STOODLEY, L., COSTERTON, J. W. & STOODLEY, P. 2004. Bacterial biofilms:
From the environment to infectious disease. Nature Reviews Microbiology, 2, 95-108.
HALL-STOODLEY, L. & STOODLEY, P. 2005. Biofilm formation and dispersal and the
trasnmission of human pathogens. Trends in Microbiology, 1, 7-10.
HALL-STOODLEY, L. & STOODLEY, P. 2009. Evolving concepts in biofilm infections.
Cellular Microbiology, 11, 1034-1043.
HAMADY, M. & KNIGHT, R. 2009. Microbial community profiling for human microbiome
projects: Tools, techniques, and challenges. Genome Research, 19, 1141-1152.
HAMMER, Ø. & HARPER, D. A. T. 2001. PAST: Palaeontological Statistics software
package for education and data analysis. Palaeontologia Electronica, 4, 9.
HAN, M. K., HUANG, Y. J., LIPUMA, J. J., BOUSHEY, H. A., BOUCHER, R. C.,
COOKSON, W. O., CURTIS, J. L., ERB-DOWNWARD, J. R., LYNCH, S. V.,

164
SETHI, S., TOWES, G. B., YOUNG, V. B., WOLFGANG, M. C., HUFFNAGLE, G.
B. & MARTINEZ, F. J. 2012. Significance of the microbiome in obstructive lung
disease. Thorax, 67, 456-463.
HARRIS, J. K., DE GROTTE, M. A., SAGEL, S. D., ZEMANICK, E. T., KAPSNER, R.,
PENVARI, C., KAESS, H., DETERDING, R. R., ACCURSO, F. J. & PACE, N. R.
2007. Molecular identification of bacteria in bronchoalveolar lavage fluid from
children with cystic fibrosis. Proceedings of the National Academy of Sciences of the
United States of America, 104, 20529-20533.
HASSETT, D. J., CUPPOLETTI, J., TRAPNELL, B., LYMAR, S. V., ROWE, J. J., YOON,
S. S., HILLIARD, G. M., PARVATIYAR, K., KAMANI, M. C., WOZNIAK, D. J.,
HWANG, S. H., MCDERMOTT, T. R. & OCHSNER, U. A. 2002. Anaerobic
metabolism and quorum sensing by Pseudomonas aeruginosa biofims in chronically
infected cystic fibrosis airways: Rethinking anitbiotic treatment strategies and drug
targets. Advanced Drug Delivery Reviews, 54, 1425-1443.
HEDEGAARD, J., OKKELS, H., BRUUN, B., KILIAN, M., MORTENSEN, K. K. &
NØRSKOV-LAURITSEN, N. 2001. Phylogeny of the genus Haemophilus as
determined by comparison of partial infB sequences. Microbiology, 147, 2599-2609.
HILL, G. B. 1993. The microbiology of bacterial vaginosis. American Journal of Obstetrics
and Gynecology, 169, 450-454.
HILTY, M., BURKE, C., PEDRO, H., CARDENAS, P., BUSH, A., BOSSLEY, C.,
DAVIES, J., ERVINE, A., POULTER, L., PACHTER, L., MOFFATT, M. F. &
COOKSON, W. O. C. 2010. Disordered microbial communities in asthmatic airways.
PLoS ONE, 5, e8578.
HINDRÉ, T., KNIBBE, C., BELSON, G. & SCHNEIDER, D. 2012. New insights into
bacterial adaptation through in vivo and in silico experimental evolution. Nature
Reviews Microbiology, 10, 352-365.
HOCHREIN, H., SCHLATTER, B., O'KEEFFE, M., WAGNER, C., SCHMITZ, F.,
SCHIEMANN, M., BAUER, S., SUTER, M. & WAGNER, H. 2004. Herpes simplex
virus type-1 induces IFN-α production via Toll-like receptor 9-dependent and -
independent pathways. Proceedings of the National Academy of Sciences of the
United States of America, 101, 11416-11421.
HOLST, D. 2005. Causes and prevention of dental caries: a perspective on cases and
incidence. Oral Health and Preventative Dentistry, 3, 9-14.
HONDA, Y., TAKAHASHI, H., KUROKI, Y., AKINO, T. & ABE, S. 1996. Decreased
contents of surfactant proteins A and D in BAL fluids of healthy smokers. Chest, 109,
1006-1009.
HORZ, H. P., ROTTHAUWE, J. H., LUKOW, T. & LIESACK, W. 2000. Identification of
major subgroups of ammonia-oxidising bacteria in environmental samples by T-RFLP
analysis of amoA PCR products. Journal of Microbiological Methods, 39, 197-204.
165
HOVIG, E., SMITH-SØRENSEN, B., BRØGGER, A. & BØRRESEN, A. L. 1991. Constant
denaturant gel-electrophoresis, a modification of denaturing gradient gel-
electrophoresis, in mutation detection. Mutations Research Letters, 262, 63-71.
HSU, C. L., SHIH, L. Y., LEU, H. S., WU, C. L. & FUNKE, G. 1998. Septicaemia due to
Arthrobacter species in a neutropaenic patient with acute lymphoblastic leukaemia.
Clinical Infectious Diseases, 27, 1334-1335.
HSUEH, P. R., HSIUE, T. R., WU, J. J., TENG, L. J., HO, S. W., HSIEH, W. C. & LUH, K.
T. 1996. Flavobacterium indologenes bacteraemia: Clinical and microbiological
characteristics. Clinical Infectious Diseases, 23, 550-555.
HUANG, Y. J., KIM, E., COX, M. J., BRODIE, E. L., BROWN, R., WIENER-KRONISH, J.
P. & LYNCH, S. V. 2010. A persistent and diverse airway microbiota present during
chronic obstructive pulmonary disease exacerbations. OMICS A Journal of Integrative
Biology, 14, 9-59.
HUANG, Y. J. & LYNCH, S. V. 2011. The emerging relationship between the airway
microbiota and chronic respiratory disease: Clinical implications. Expert Reviews of
Respiratory Medicine, 6, 809-821.
HUBER, R., HUBER, H. & STETTER, K. O. 2000. Towards the ecology of
hyperthermophiles: Biotopes, new isolation strategies and novel metabolic properties.
FEMS Microbiology Reviews, 24, 615-623.
HUGENHOLTZ, P., GOEBEL, B. M. & PACE, N. R. 1998a. Impact of culture-independent
studies on the emerging phylogenetic view of bacterial diversity. Journal of
Bacteriology, 180, 4765-4774.
HUGENHOLTZ, P. & HUBER, T. 2003. Chimeric 16S rDNA sequences of diverse origin
are accumulating in the public databases. International Journal of Systematic and
Evolutionary Microbiology, 53, 289-293.
HUGENHOLTZ, P., PITULLE, C., HERSCHBERGER, K. L. & PACE, N. R. 1998b. Novel
division level bacteria diversity in a Yellowstone hot spring. Journal of Bacteriology,
180, 366-376.
HUGHES, J. B., HELLMANN, J. J., RICKETTS, T. H. & BOHANNAN, B. J. M. 2001.
Counting the uncountable: Statistical approaches to estimating microbial diversity.
Applied and Environmental Microbiology, 67, 4399-4406.
HUGHES, J. M. B. 2007. Pulmonary function: The basics. Medicine, 36, 142-150.
JACKSON, C. R., RODEN, E. E. & CHURCHILL, P. F. 2000. Denaturing gradient gel
electrophoresis can fail to separate 16S rDNA fragments with multiple base
differences. Molecular Biology Today, 1, 49-51.
JANSE, I., BOK, J. & ZWART, G. 2004. A simple remedy against artifactual double bands
in denaturing gradient gel electrophoresis. Journal of Microbiological Methods, 57,
279-281.

166
JARJOUR, N. N. & KELLY, E. A. B. 2002. Pathogenesis of asthma. The Medical Clinics of
North America, 86, 925-936.
JONASSON, J., OLOFSSON, M. & MONSTEIN, H. J. 2002. Classification, identification
and subtyping of bacteria based on pyrosequencing and signature matching of 16S
rDNA fragments. APMIS, 110, 263-72.
JOYCE, C. M. & STEITZ, T. A. 1994. Function and structure relationships in DNA
polmerases. Annual Review of Biochemistry, 63, 777-822.
JUDO, M. S. B., WEDEL, A. B. & WILSON, C. 1998. Stimulation and suppression of PCR-
mediated recombination. Nucleic Acids Research, 26, 1819-1825.
KACZANOWSKA, M. & RYDÉN-AULIN, M. 2007. Ribsome biogenesis and the
translation process in Escherichia coli. Microbiology and Molecular Reviews, 71,
477-494.
KALEDIN, A. S., SLIUSARENKO, A. G. & GORODETSKII, S. I. 1980. Isolation and
properties of DNA polymerase from extreme thermophilic bacteria Thermus
aquaticus YT-1s. Biokhimiia, 45, 644-651.
KELLER, M. & ZENGLER, K. 2004. Tapping into microbial diversity. Nature Reviews
Microbiology, 2, 141-150.
KELLER, N. P. & HOHN, T. M. 1997. Metabolic pathway gene clusters in filamentous
fungi. Fungal Gentics and Biology, 21, 17-29.
KEREM, B. S., ROMMENS, J. M., BUCHANAN, J. A., MARKIEWICZ, D., COX, T. K.,
CHAKRAVARTI, A., BUCHWALD, M. & TSUI, L. C. 1989. Identification of the
cystic fibrosis gene: Genetic analysis. Science, 245, 1073-1080.
KEREM, E., REISMAN, J., COREY, M., CANNY, G. J. & LEVISON, H. 1992. Prediction
of mortality in patients with cystic fibrosis. The New England Journal of Medicine,
326, 1187-1191.
KIEFER, J. R., MAO, C., BRAMAN, J. C. & BEESE, L. S. 1998. Visualsing DNA
replication in a catalytically active Bacillus DNA polymerase crystal. Nature, 391,
304-307.
KING, P. T. 2011a. Pathogenesis of bronchiectasis. Paediatric Respiratory Reviews, 12, 104-
110.
KING, P. T. 2011b. The pathophysiology of bronchiectasis. International Journal of COPD,
4, 411-419.
KING, P. T., HOLDSWORTH, S. R., FREEZER, N. J., VILLANUEVA, E., GALLAGHER,
M. & HOLMES, P. W. 2005. Outcome in adult bronchiectasis. COPD: Journal of
Chronic Obstructive Pulmonary Disease, 2, 27-34.

167
KING, P. T., HOLDSWORTH, S. R., FREEZER, N. J., VILLANUEVA, E. & HOLMES, P.
W. 2006. Characterisation of the onset and presenting clinical features of adult
bronchiectasis. Respiratory Medicine, 100, 2183-2189.
KING, P. T., HOLDSWORTH, S. R., FREEZER, N. J., VILLANUEVA, E. & HOLMES, P.
W. 2007. Microbiologic follow-up study in adult bronchiectasis. Respiratory
Medicine, 101, 1633-1638.
KINKE, T., KNEIST, S., DE SOET, J. J., KUHLISCH, E., MAUERBERGER, S., FÖSTER,
A. & KLIMM, W. 2009. Acid production by oral strains of Candida albicans and
lactobacilli. Caries Research, 43, 83-91.
KISS, A., SAIN, B. & VENETIANER, P. 1977. The number of rRNA genes in Escherichia
coli. FEBS Letters, 79, 77-79.
KLEPAC-CERAJ, V., LEMON, K. P., MARTIN, T. R., ALLGAIER, M., LORY, S.,
BRODIE, E. L., LYNCH, S. V., BOHANNAN, B. J. M., GREEN, J. L., MAURER,
B. A. & KOLTER, R. 2010. Relationship between cystic fibrosis respiratory tract
bacterial communities and age, genotype, antibiotics and Pseudomonas aeruginosa.
Environmental Microbiology, 12, 1293-1303.
KLINGMAN, K. L., PYE, A., MURPHY, T. F. & HILL, S. L. 1995. Dynamics of respiratory
tract colonisation by Branhamella catarrhalis in bronchiectasis. American Journal of
Respiratory and Critical Care Medicine, 152, 1072-1078.
KNOOPKA, A. 2009. What is microbial community ecology? ISME, 3, 1223-1230.
KO, F. W. S., NG, T. K. C., LI, T. S. T., FOK, J. P. C., CHAN, M. C. H., WU, A. K. L. &
HUI, D. S. C. 2005. Sputum bacteriology in patients with acute exacerbations of
COPD in Hong Kong. Respiratory Medicine, 99, 454-460.
KOHLSTAEDT, L. A., WANG, J., FRIEDMAN, J. M., RICE, P. A. & STEITZ, T. A. 1992.
Crystal structure at 3.5 Å of HIV-1 reverse transcriptase complexed with an inhibitor.
Science, 256, 1781-1790.
KOLBERT, C. P. & PERSING, D. H. 1999. Ribosomal DNA sequencing as a tool for
identification of bacterial pathogens. Current Opinion in Microbiology, 2, 299-305.
KREADER, C. A. 1996. Relief of amplification inhibition in PCR with bovine serum
albumin or T4 gene 32 protein. Applied and Environmental Microbiology, 62, 1102-
1106.
KUNKEL, T. A. 2004. DNA replication fidelity. The Journal of Biological Chemistry, 279,
16895-16898.
LAËNNEC, R. T. H. 1962. A treatise on the disase of the chest, New York: Library of the
New York Academy of Medicine, Hafner Publishing.
168
LAFUCI, G., WIDOM, R. L., EISNER, R. L., JARVIS, E. D. & RUDNER, R. 1986.
Mapping of rRNA genes with integratable plasmids in Bacillus subtilis. Journal of
Bacteriology, 165, 204-214.
LAMBERT, H. P. & STERN, H. 1972. Infective factors in exacerbations of bronchitis and
asthma. British Medical Journal, 30, 323-327.
LANE, D. J., PACE, B., OLSEN, G. J., STAHL, D. A., SOGIN, M. L. & PACE, N. R. 1985.
Rapid determination of 16S ribosomal RNA sequences for phylogenetic analyses.
Proceedings of the National Academy of Sciences of the United States of America, 82,
6955-6959.
LARSEN, M. V., JANNER, J. H., NIELSEN, S. D., FRIIS-MØLLER, A., RINGBAEK, T. &
LANGE, P. 2009. Bacteriology in acute exacerbation of chronic obstructive
pulmonary disease in patients admitted to hospital. Scandinavian Journal of Infectious
Diseases, 41, 26-32.
LAWN, S. D. 2004. AIDS in Africa: The impact of co-infections on the pathogenesis of
HIV-1 infection. Journal of Infection, 48, 1-12.
LAWYER, F. C., STOFFEL, S., SAIKI, R. K., MYAMBO, K., DRUMMOND, R. &
GELFAND, D. H. 1989. Isolation, characterisation, and expression in Escherichia
coli of the DNA polymerase gene from Thermus aquaticus. The Journal of Biological
Chemistry, 264, 6427-6437.
LEACH, R. M. 2007. Symptoms and signs of respiratory disease. Medicine, 36, 119-125.
LEE, D. H., ZO, Y. G. & KIM, S. J. 1996. Non-radioactive method to study genetic profiles
of natural bacterial communitites by PCR-single-strand-conformation polymorphism.
Applied and Environmental Microbiology, 62, 3112-3120.
LEES, A. W. & MCNAUGHT, W. 1959. Bacteriology of the lower respiratory tract
secretions: Sputum and upper respiratory tract secretions in "normals" and chronic
bronchitis. Lancet, 274, 1112-1115.
LENTINO, J. R. & LUCKS, D. A. 1987. Nonvalue of sputum culture in the management of
lower respiratory tract infections. Journal of Clinical Microbiology, 25, 758-762.
LI, Z., KOSOROK, M. R., FARRELL, P. M., LAXOVA, A., WEST, S. E. H., GREEN, C.
G., COLLINS, J., ROCK, M. J. & SPLAINGARD, M. L. 2005. Longitudinal
development of mucoid Pseudomonas aeruginosa infection and lung disease
progression in children with cystic fibrosis. The Journal of the American Medical
Association, 293, 581-588.
LOPEZ, A. D. & MURRAY, C. C. 1998. The global burden of disease, 1990-2020. Nature
Medicine, 4, 1241-1243.
MADIGAN, M. T., MARTINKO, J. M., DUNLOP, P. V. & CLARK, D. P. 2009. Brock
Biology of Microorganisms, London, Pearson Education Ltd.
169
MAI-PROCHNOW, A., LUCAS-ELIO, P., EGAN, S., THOMAS, T., WEBB, J. S.,
SANCHEZ-AMAT, A. & KJELLEBERG, S. 2008. Hydrogen peroxide linked to
lysine oxidase activity facilitates biofilm differentiation and dispersal in several
Gram-negative bacteria. Journal of Bacteriology, 190, 5493-5501.
MANSON, J. M., RAUCH, M. & GILMORE, M. S. 2008. The commensal microbiology of
the gastrointestinal tract. Advances in Experimental Medicine and Biology, 635, 15-
28.
MARGULIES, M., EGHOLM, M., ALTMAN, W. E., ATTIYA, S., BADER, J. S.,
BEMBEN, L. A., BERKA, J., BRAVERMAN, M. S., CHEN, Y. J., CHEN, Z. & ET
AL 2005. Genome sequencing in microfabricated high-density picolitre reactors.
Nature, 437, 376-380.
MARIEB, E. N. & HOEHN, K. 2007. Human Anatomy & Physiology, London, Pearson
Education Ltd.
MARIN, A., MONSÓ, E., GARCIA-NÙÑEZ, M., SAULEDA, J., NOGUERA, A., PONS, J.,
AGUSTÍ, A. & MOREA, J. 2010. Variability and effects of bronchial colonisation in
patients with moderate COPD. European Respiratory Journal, 35, 295-302.
MARTIN, D. W., SCHURR, M. J., MUDD, M. H. & DERETIC, V. 1993. Differentiation of
Pseudomonas aeruginosa into the alginate-producing form: Inactivation of mucB
causes conversion to mucoidy. Molecular Microbiology, 9, 497-506.
MARTÍNEZ-GARCÍA, M. A., SOLER-CATALUÑA, J. J., PERPIÑÁ-TORDERA, M.,
ROMÁN-SÁNCHEZ, P. & SORIANO, J. 2007. Factors associated with lung function
decline in adult patients with stable non-cystic fibrosis bronchiectasis. Chest, 132,
1565-1572.
MAUGHAN, H., CUNNINGHAM, K. S., WANG, P. W., ZHANG, Y., CYPEL, M.,
CHAPARRO, C., TULLIS, D. E., WADELL, T. K., KESHAVJEE, S., LIU, M.,
GUTTMAN, D. S. & HWANG, D. M. 2012. Pulmonary bacterial communities in
surgically re-sected non-cystic fibrosis bronchiectasis lungs are similar to those in
cystic fibrosis. Pulmonary Medicine, Volume 2012, Article ID 746358.
MAYR, E. 1957. The Species Problem, Washington, D.C., American Association for the
Advancement of Science.
MCHARDY, V. U., INGLIS, J. M., CALDER, M. A., CROFTON, J. W., GREGG, I.,
RYLAND, D. A., TAYLOR, P., CHADWICK, M., COOMBS, D. & RIDDELL, R.
W. 1980. A study of infective and other factors in exacerbations of chronic bronchitis.
British Journal of Diseases of the Chest, 74, 228-238.
MCPHERSON, J. D. 2009. Next-generation gap. Nature Methods, 6, S2-S5.
MEDZHITOV, R. & JANEWAY, C. A., JR. 1997. Innate immunity: Impact on the adaptive
immune response. Current Opinion in Immunology, 9, 4-9.

170
MINAH, G. E. & LOESCHE, W. J. 1977. Sucrose metabolism by prominent members of the
flora isolated from cariogenic and non-cariogenic dental plaques. Infection and
Immunity, 17, 55-61.
MIRAVITLLES, M., ESPINOSA, C., FERNÁNDEZ-LASO, E., MARTOS, J. A.,
MALDONADO, J. A. & GALLEGO, M. 1999. Relationship between bacterial flora
in sputum and functional impairment in patients with acute exacerbations of COPD.
Chest, 116, 40-46.
MÖLLER, L. V. M., TIMENS, W., B.W., V. D., KOOI, K., DE WEVER, B., DANKERT, J.
& VAN ALPHEN, L. 1998. Haemophilus influenzae in lung explants of patients with
end-stage pulmonary disease. American Journal of Respiratory and Critical Care
Medicine, 157, 950-956.
MONSÓ, E., RUIZ, J., ROSELL, A., MANTEROLA, J., FIZ, J., MOREA, J. & AUSINA, V.
1995. Bacterial infection in chronic obstructive pulmonary disease: A study of stable
and exacerbated outpatients using the protected specimen brush. American Journal of
Respiratory and Critical Care Medicine, 152, 1316-1320.
MORRIS, A., SCIURBA, F. C., LEBEDEVA, I. P., GITHAIGA, A., ELLIOTT, W. M.,
HOGG, J. C., HUANG, L. & NORRIS, K. A. 2004. Association of chronic
obstructive pulmonary disease severity and Pneumocystis colonisation. American
Journal of Respiratory and Critical Care Medicine, 170, 408-413.
MORRISEY, B. M. 2007. Pathogenesis of bronchiectasis. Clinics in Chest Medicine, 28,
289-296.
MOSS, T., LANGLOSIS, F., GAGNON-KUGLER, T. & STEFANOVSKY, V. 2007. A
housekeeper with power of attorney: The rRNA genes in ribosome biogenesis.
Cellular and Molecular Life Sciences, 64, 29-49.
MURPHY, T. F., BRAUER, A. L., ESCHBERGER, K., LOBBINS, P., GROVE, L., CAI, X.
& SETHI, S. 2008. Pseudomonas aeruginosa in chronic obstructive pulmonary
disease. American Journal of Respiratory and Critical Care Medicine, 177, 853-860.
MURPHY, T. F., BRAUER, A. L., GRANT, B. J. B. & SETHI, S. 2005. Moraxella
catarrhalis in chronic obstructive pulmonary disease. American Journal of
Respiratory and Critical Care Medicine, 172, 195-199.
MURPHY, T. F., BRAUER, A. L., SCHIFFMACHER, A. T. & SETHI, S. 2004. Persistent
colonisation by Haemophilus influenzae in chronic obstructive pulmonary disease.
American Journal of Respiratory and Critical Care Medicine, 170, 266-272.
MURPHY, T. F., BRAUER, A. L., SETHI, S., KILIAN, M., CAI, X. & LESSE, A. J. 2007.
Haemophilus haemolyticus: A human respiratory tract commensal to be distinguished
from Haemophilus influenzae. Journal of Infectious Diseases, 195, 81-89.
MURPHY, T. F., FADEN, H., BAKALETZ, L. O., KYD, J. M., FORSGREN, A.,
CAMPOS, J., VIRJI, M. & PELTON, S. I. 2009. Non-typeable Haemophilus
171
influenzae as a pathogen in children. The Pediatric Infectious Disease Journal, 28,
43-48.
MURPHY, T. F., SETHI, S., KLINGMAN, K. L., BRUEGGEMAN, A. B. & DOERN, G. V.
1999. Simultaneous respiratory tract colonisation by multiple strains of non-typeable
Haemophilus influenzae in chronic obstructuve pulmonary disease: Implications for
antibiotic therapy. Journal of Infectious Diseases, 180, 404-409.
MURPHY, T. J. & SETHI, S. 1992. Bacterial infection in chronic obstructive pulmonary
disease. American Review of Respiratory Disease, 146, 1067-1083.
MURRAY, A. E., HOLLIBAUGH, J. T. & ORREGO, C. 1996. Phylogenetic compositions
of bacterioplankton from two California estuaries compared by denaturing gradient
gel electrophoresis of 16S rDNA fragments. Applied and Environmental
Microbiology, 62, 2676-2680.
MURRAY, T. S., EGAN, M. & KAZMIERCZAK, B. I. 2007. Pseudomonas aeruginosa
chronic colonisation in cystic fibrosis patients. Current Opinion in Pediatrics, 19, 83-
88.
MUYZER, G. 1999. DGGE/TGGE a method for identifying genes from natural ecosystems.
Current Opinion in Microbiology, 2, 317-322.
MUYZER, G., DE WAAL, E. C. & UITTERLINDEN, A. G. 1993. Profiling of complex
microbial populations by denaturing gradient gel electrophoresis analysis of
polymerase chain reaction-amplified genes coding for 16S rRNA. Applied and
Environmental Microbiology, 59, 695-700.
MUYZER, G. & SMALLA, K. 1998. Application of denaturing gradient gel electrophoresis
(DGGE) and temperature gradient gel electrophoresis (TGGE) in microbial ecology.
Antonie van Leeuwenhoek, 73, 127-141.
MYERS, R. M., FISCHER, S. G., LERMAN, L. S. & MANIATIS, T. 1985. Nearly all single
base substitutions in DNA fragments joined to a GC-clamp can be detected by
denaturing gradient gel electrophoresis. Nucleic Acids Research, 13, 3131-3145.
NAKATSU, C. H. 2007. Soil microbial community analysis using denaturing gradient gel
electrophoresis. Soil Science Society of America Journal, 71, 563-571.
NELSON, A. 2011. An investigation of the polymicrobial nature of lower respiratory tract
infections in cystic fibrosis patients. Ph. D., University of Northumbria at Newcastle.
NELSON, A., DE-SOYZA, A., BOURKE, S. J., PERRY, J. D. & CUMMINGS, S. P. 2010.
Assessment of sample handling practices on microbial activity in sputum samples
from patients with cystic fibrosis. Letters in Applied Microbiology, 51, 272-277.
NICOTRA, M. B., RIVERA, M., DALE, A. M., SHEPHERD, R. & CARTER, R. 1995.
Clinical, pathophysiologic, and microbiologic characterisation of bronchiectasis in an
aging cohort. Chest, 108, 955-961.

172
NISHIOKA, M., MIZUGUCHI, H., FUJIWARA, S., KOMATSUBARA, S.,
KITABAYASHI, M., UEMURA, H., TAKAGI, M. & IMANAKA, T. 2001. Long
and accurate PCR with a mixture of KOD DNA polymerase and its exonuclease
deficient mutant enzyme. Journal of Biotechnology, 88, 141-149.
NOCKER, A., BURR, M. & CAMPER, A. K. 2007. Genotypic microbial community
profiling: A critical technical review. Microbial Ecology, 54, 276-289.
NOLLER, H. F. & NOMURA, M. 1996. Ribsomes. In: NEIDHARDT, F. C. (ed.)
Escherichia coli and Salmonella: Cellular and molecular biology. 2nd ed.
Washington, D.C.: ASM Press.
NORRIS, K. A. & MORRIS, A. 2011. Pneumocystis infection and the pathogenesis of
chronic obstructive pulmonary disease. Immunologic Research, 50, 175-180.
NØRSKOV-LAURITSEN, N., OVERBALLE, M. D. & KILIAN, M. 2009. Delineation of
the species Haemophilus influenzae by phenotype, multilocus sequence phylogeny,
and detection of marker genes. Journal of Bacteriology, 191, 822-831.
NOVAIS, R. C. & THORSTENSON, Y. R. 2011. The evolution of pyrosequencing for
microbiology: From genes to genomes. Journal of Microbiological Methods, 86, 1-7.
NÜBEL, U., ENGELEN, B., FELSKE, A., SNAIDR, J., WIESHUBER, A., AMMAN, R. I.,
WOLFGANG, L. & BACKHAUS, H. 1996. Sequence heterogeneties of genes
encoding 16S rRNAs in Paenibacillus polymyxa detected by temperature gradient gel
electrophoresis. Journal of Bacteriology, 178, 5636-5643.
O'DONNELL, A. E. 2008. Bronchiectasis. Chest, 134, 815-823.
OLLIS, D. L., BRICK, P., HAMLIN, R., XUONG, N. G. & STEITZ, T. A. 1985. Structure
of large fragment of Escherichia coli DNA polymerase I complexed with dTMP.
Nature, 313, 762-766.
OLSEN, G. J., LANE, D. J., GIOVANNONI, S. J., PACE, N. R. & STAHL, D. A. 1986.
Microbial ecology and evolution: A ribosomal RNA approach. Annual Review of
Microbiology, 40, 337-365.
ORMENO-ORRILLO, E., VINUESA, P., ZUNIGA-DAVILA, D. Z. & MARTINEZ-
ROMERO, E. 2006. Molecular diversity of native bradyrhizobia isolated from lima
bean (Phaseolus lunatus L.) in Peru. Systematic and Applied Microbiology, 29, 253-
262.
PACE, N. R. 2009. Mapping the tree of life: Progress and prospects. Microbiology and
Molecular Biology Reviews, 73, 565-576.
PACE, N. R., SAPP, J. & GOLDENFIELD, N. 2012. Phylogeny and beyond: Scientific,
historical, and conceptual significance of the first tree of life. Proceedings of the
National Academy of Sciences of the United States of America, 109, 1011-1018.
173
PACE, N. R., STAHL, D. A., LANE, D. J. & OLSEN, G. J. 1986. The analysis of natural
microbial-populations by ribosomal-RNA sequences. Advances in Microbial Ecology,
9, 1-55.
PALLERONI, N. J. 1997. Prokayotic diversity and the importance of culturing. Antonie Van
Leeuwenhoek International Journal of General and Molecular Microbiology, 72, 3-
19.
PALMER, C., BIK, E. M., DIGIULIO, D. B., RELMAN, D. A. & BROWN, P. O. 2007.
Development of the human infant intestinal microbiota. PLoS Biology, 5, e177.
PALMER, R. J., JR., KAZMERZAK, K., HANSEN, M. C. & KOLENBRANDER, P. E.
2001. Mutualism versus independence: Strategies of mixed-species oral bioflims in
vitro using saliva as the sole nutrient source. Infection and Immunity, 69, 5794-5804.
PAPI, A., BELLETTATTO, M., BRACCIONI, F., ROMAGNOLI, M., CASOLARI, P.,
CARAMORI, G., FABBRI, L. M. & JOHNSTON, S. L. 2006. Infections and airway
inflammation in chronic obstructive pulmonary disease severe exacerbations.
American Journal of Respiratory and Critical Care Medicine, 173, 1114-1121.
PASTEUR, M. C., BILTON, D. & HILL, A. T. 2010. British Thoracic Society guideline for
non-CF bronchiectasis. Thorax. Supplement 1, 65, 1-58.
PASTEUR, M. C., HELLIWELL, S. M., HOUGHTON, S. J., WEBB, S. C., FOWERAKER,
J. E., COULDEN, R. A., FLOWER, C. D., BILTON, D. & KEOGAN, M. T. 2001.
An investigation into causative factors in patients with bronchiectasis. American
Journal of Respiratory and Critical Care Medicine, 162, 1277-1284.
PATEL, I. S., SEEMUNGAL, T. A. R., WILKS, M., LLOYD-OWEN, S. J., DONALDSON,
G. C. & WEDZICHA, J. A. 2002. Relationship between bacterial colonisation and the
frequency, character, and severity of COPD exacerbations. Thorax, 57, 759-764.
PAUWELS, R. A., BUIST, A. S., CALVERLEY, P. M. A., JENKINS, C. R. & HURD, S. S.
2001. Global strategy for the diagnosis, management, and prevention of chronic
obstructive pulmonary disease. NHLBI/WHO Global Initiative for Chronic
Obstructive Lung Disease (GOLD) Workshop Summary. American Journal of
Respiratory and Critical Care Medicine, 163, 1256-1276.
PAUWELS, R. A. & RABE, K. F. 2004. Burden and clinical features of chronic obstructive
pulmonary disease (COPD). Lancet, 364, 613-620.
PAVLOV, A. R., PAVLOVA, N. V., KOZYAVKIN, S. A. & SLESAREV, A. I. 2004.
Recent developments in the optimisation of thermostable DNA polymerases for
efficient applications. Trends in Biotechnology, 22, 253-260.
PELEG, A. Y., HOGAN, D. A. & MYLONAKIS, E. 2010. Medically important bacterial-
fungal interactions. Nature Reviews Microbiology, 8, 340-349.
174
PELTOLA, V. T. & MCCULLERS, J. A. 2004. Respiratory viruses predisposing to bacterial
infections: Role of neuraminidase. The Pediatric Infectious Disease Journal, 23, S87-
97.
PERLER, F. B., KUMAR, S. & KONG, H. 1996. Thermostable DNA polymerases. Advances
in Protein Chemistry, 48, 377-435.
PERSSON, R., HITTI, J., VERHELST, R., VANEECHOUTTE, M., PERSSON, R.,
HIRSCHI, R., WEIBEL, M., ROTHEN, M., TEMMERMAN, M., PAUL, K. &
ESCHENBACH, D. 2009. The vaginal microflora in relation to gingivitis. BMC
Infectious Diseases, 9, 6.
PETERS, B. M., JABRA-RIZK, M. A., O'MAY, G. A., COSTERTON, J. W. & SHIRTLIFF,
M. E. 2012. Polymicrobial interactions: Impact on pathogenesis and human disease.
Clinical Microbiology Reviews, 25, 193-213.
PETROSINO, J. F., HIGHLANDER, S., LUNA, R. A., GIBBS, R. A. & VERSALOVIC, J.
2009. Metagenomic pyrosequencing and microbial identification. Clinical Chemistry,
55, 856-866.
PHIET, M., CARRERE, J., CIMON, B., CHABASSE, D., DELHAES, L., SYMOENS, F. &
BOUCHARA, J. P. 2009. Occurance and relevance of filamentous fungi in
respiratory secretions of patients with cystic fibrosis - a review. Medical Mycology,
47, 387-397.
POON, K. & MACGREGOR, R. B. 1998. Unusual behaviour exhibited by multi-stranded
guanine-rich DNA complexes. Biopolymers, 45, 427-434.
POON, K. & MACGREGOR, R. B. 2000. Formation and structural determinants of multi-
stranded guanine-rich DNA complexes. Biophysical Chemistry, 84, 205-216.
POSTEC, A., URIOS, L., LESONGEUR, F., OLLIVIER, B., QUERELLOU, J. &
GODFROY, A. 2005. Continuous enrichment culture and molecular fingerprinting
monitoring to investigate the microbial diversity of thermophiles inhabiting deep-sea
hydrothermal ecosystems. Current Microbiology, 50, 138-144.
POTTER, R. T., ROTMAN, F., FERNÁNDEZ, F., MCNEILL, T. M. & CHAMBERLAIN,
J. M. 1968. The bacteriology of the lower respiratory tract: Bronchoscopic study of
100 clinical cases. American Review of Respiratory Disease, 97, 1051-1061.
POXTON, I. 2010. Bacterial communities in the gut and consequences of upsetting them.
Microbiology Today, 37, 232-235.
PRAGMAN, A. A., KIM, H. B., REILLY, C. S., WENDT, C. & ISAACSON, R. E. 2012.
The lung microbiome in moderate and severe chronic obstructive pulmonary disease.
PLos One, 7, e47305.
PRISCU, J., ADAMS, E. E., LYONS, W. B., VOYTEK, M. A., MOGK, D. W., BROWN, R.
L., MCKAY, C. P., TAKACS, C. D., WELCH, K. A., WOLF, C. F., KIRSHTEIN, J.
175
D. & AVCI, R. 1999. Geomicrobiology of subglacial ice above Lake Vostok. Science,
286, 2141-2144.
PURVEDORJ-GAGE, B., COSTERTON, J. W. & STOODLEY, P. 2005. Phenotypic
differentiation and seeding dispersal in non-mucoid and mucoid Pseudomonas
aeruginosa biofilms. Microbiology, 151, 1569-1576.
PYBUS, V. & ONDERDONK, A. B. 1999. Microbial interactions in the vaginal ecosystem,
with emphasis on the pathogenesis of bacterial vaginosis. Microbes and Infection, 1,
285-292.
QIAGEN. Principles of pyrosequencing [Online]. Available:
http://www.pyrosequencing.com/DynPage.aspx?id=7454 [Accessed 5th October
2012].
QIN, J., LI, R., RAES, J., ARUMUGAM, M., BURGDORF, K. S., MANICHANH, C.,
NIELSEN, T., PONS, N., LEVENEZ, F., YAMADA, T. & ET AL 2010. A human
gut microbial gene catalogue established by metagenomic sequencing. Nature, 464,
59-65.
RABE, K. F., HURD, S., ANZUETO, A., BARNES, P. J., BUIST, S. A., CALVERLEY, P.,
FUKUCHI, Y., JENKINS, C., RODRIGUEZ-ROISIN, R., VAN WHEEL, C. &
ZIELENSKI, J. 2007. Global strategy for the diagnosis, management, and prevention
of chronic obstructive pulmonary disease. GOLD Executive Summary. American
Journal of Respiratory and Critical Care Medicine, 176, 532-555.
RAKHIMOVA, E., WIEHLMANN, L., BRAUER, A. L., SETHI, S., MURPHY, T. F. &
TÜMMLER, B. 2009. Pseudomonas aeruginosa population biology in chronic
obstructive pulmonary disease. Journal of Infectious Diseases, 200, 1928-1935.
RAMAKRISHNAN, V. 2002. Ribosome structure and the mechanism of translation. Cell,
108, 557-572.
RAPPÉ, M. S. & GIOVANNONI, S. J. 2003. The uncultured microbial majority. Annual
Review of Microbiology, 57, 369-394.
REARDON, S. 2011. A world of chronic disease. Science, 333, 558-559.
REID, L. 1950. Reduction in bronchial subdivisions in bronchiectasis. Thorax, 5, 223-247.
REILING, N., HÖLSCHER, C., FEHRENBACH, A., KRÖGER, S., KIRSCHNING, C. J.,
GOYERT, S. & EHLERS, S. 2002. Toll-like receptor (TLR)2- and TLR4-mediated
pathogen recognition in resistance to airborne infection with Mycobacterium
tuberculosis. The Journal of Immunology, 169, 3480-3484.
RENOUF, V., CLAISSE, O., MIOT-SERTIER, C. & LONVAUD-FUNEL, A. 2006. Lactic
acid bacteria evolution during winemaking: Use of rpoB gene as a target for PCR-
DGGE analysis. Food Microbiology, 23, 136-145.
176
RETTEDAL, E. A., CLAY, S. & BRÖZEL, V. S. 2010. GC-clamp primer batches yield 16S
rRNA gene amplicon pools with variable GC clamps, affecting denaturing gradient
gel electrophoresis profiles. FEMS Microbiology Letters, 312, 55-62.
REYES, A., HAYNES, M., HANSON, N., ANGLY, F. E., HEATH, A. C., ROHWER, F. &
GORDON, J. I. 2010. Viruses in the faecal microbiota of monozygotic twins and their
mothers. Nature, 466, 334-338.
REYNOLDS, H. Y. 2011. Bronchoalveolar lavage and other methods to define the human
respiratory tract milieu in health and disease. Lung, 189, 87-99.
REYNOLDS, H. Y. & NEWBALL, H. H. 1974. Analysis of proteins and respiratory cells
obtained from human lungs by bronchial lavage. Journal of Laboratory and Clinical
Medicine, 84, 559-573.
RICKARD, A. H., GILBERT, P., HIGH, N. J., KOLENBRANDER, P. E. & HANDLEY, P.
S. 2003. Bacterial co-aggregation: An integral process in the development of multi-
species biofilms. Trends in Microbiology, 11, 94-100.
RILEY, T. V. & HOFFMAN, D. C. 1986. Interference with Haemophilus influenzae growth
by other micro-organisms. FEMS Microbiology Letters, 33, 55-58.
RIORDAN, J. R., ROMMENS, J. M., KEREM, B. S., ALON, N., ROZMAHEL, R.,
GRZELCZAK, Z., ZIELENSKI, J., LOK, S., PLAVSIC, N., CHOU, J. L. & ET AL
1989. Identification of the cystic fibrosis gene: Cloning and characterisation of
complementary DNA. Science, 245, 1066-1073.
ROBINSON, C. J., BOHANNAN, B. J. M. & YOUNG, V. B. 2010. From structure to
function: The ecology of host-associated microbial communities. Microbiology and
Molecular Biology Reviews, 74, 453-476.
ROGERS, G. B., CARROLL, M. P. & BRUCE, K. D. 2009a. Studying bacterial infections
through culture-independent approaches. Journal of Medical Microbiology, 58, 1401-
1418.
ROGERS, G. B., CARROLL, M. P., CONNETT, G. J., SERISIEAR, D. J., HOCKEY, P. M.,
KEHAGIA, V. & JONES, G. R. 2005a. Bacterial community diversity in the CF lung.
Pediatric Pulmonology, 40, 95-97.
ROGERS, G. B., CARROLL, M. P., SERISIER, D. J., HOCKEY, P. M., JONES, G. &
BRUCE, K. D. 2004. Characterisation of bacterial community diversity in cystic
fibrosis lung infections by use of 16S ribosomal DNA terminal restriction fragment
length polymorphism profiling. Journal of Clinical Microbiology, 42, 5176-5183.
ROGERS, G. B., CARROLL, M. P., SERISIER, D. J., HOCKEY, P. M., JONES, G.,
KEHAGIA, V., CONNETT, G. J. & BRUCE, K. D. 2006. Use of 16S rRNA gene
profiling by terminal restriction fragment length polymorphism analysis to compare
bacterial communities in sputum and mouthwash samples from patients with cystic
fibrosis. Journal of Clinical Microbiology, 44, 2601-2604.

177
ROGERS, G. B., CARROLL, M. P., SERISIER, D. J., HOCKEY, P. M., KEHAGIA, V.,
JONES, G. R. & BRUCE, K. D. 2005b. Bacterial activity in cystic fibrosis lung
infections. Respiratory Research, 6, 49.
ROGERS, G. B., DANIELS, T. W., TUCK, A., CARROLL, M. P., CONNETT, G. J.,
DAVID, G. J. P. & BRUCE, K. D. 2009b. Studying bacteria in respiratory specimens
by using conventional and molecular microbiological approaches. BMC Pulmonary
Medicine, 9, 14.
ROGERS, G. B., HART, C. A., MASON, J. R., HUGHES, M., WALSHAW, M. J. &
BRUCE, K. D. 2003. Bacterial diversity in cases of lung infection in cystic fibrosis
patients: 16S ribosomal DNA (rDNA) length heterogeneity PCR and 16S rRNA
terminal restriction fragment length polymorphism profiling. Journal of Clinical
Microbiology, 41, 3548-3558.
ROMÁN, F., CANTÓN, R., PÉREZ-VÁZQUEZ, M., BAQUERO, F. & CAMPOS, J. 2004.
Dynamics of long-term colonisation of respiratory tract by Haemophilus influenzae in
cystic fibrosis patients shows a marked increase in hypermutable strains. Journal of
Clinical Microbiology, 42, 1450-1459.
ROMMENS, J. M., IANNUZZI, M. C., KEREM, B. S., DRUMM, G., DEAN, M.,
ROZMAHEL, R., COLE, J. L., KENNEDY, D., HIDAKA, N. & ET AL 1989.
Identification of the cystic fibrosis gene: Chromosome walking and jumping. Science,
245, 1059-1065.
ROSADO, A. S., DUARTE, G. F., SELDIN, L. & VAN ELSAS, J. D. 1998. Genetic
diveristy of nifH gene sequences in Paenibacillus azotofixans strains and soil samples
analysed by denaturing gradient gel electrophoresis of PCR-amplified gene fragments.
Applied and Environmental Microbiology, 64, 2770-2779.
ROSELL, A., MONSÓ, E., SOLER, N., TORRES, F., ANGRILL, J., RIISE, G.,
ZALACAÍN, R., MORERA, J. & TORRES, A. 2005. Microbiologic determinants of
exacerbation in chronic obstructive pulmonary disease. Archives of Internal Medicine,
165, 891-897.
RUANO, G. & KIDD, K. K. 1992. Modeling of heteroduplex formation during PCR from
mixtures of DNA templates. Genome Research, 2, 112-116.
SAIKI, R. K., SCHARF, S., FALOONA, F., MULLIS, K. B., HORN, G. T., ERLICH, H. A.
& ARNHEIM, N. 1985. Enzymatic amplification of β-globin genomic sequences and
restriction site analysis for diagnosis of sickle cell anaemia. Science, 230, 1350-1354.
SAMUELSON, A., FREIJD, A., JONASSON, J. & LINDBERG, A. A. 1995. Turnover of
non-encapsulated Haemophilus influenzae in the nasopharynges of otitis-prone
children. Journal of Clinical Microbiology, 33, 2027-2031.
SANDHU, G. S., KLINE, B. C., STOCKMAN, L. & ROBERTS, G. D. 1995. Molecular
probes for diagnosis of fungal infections. Journal of Clinical Microbiology, 33, 2913-
2919.

178
SCHLOSS, P., WESTCOTT, S. L., RYABIN, T., HALL, J. R., HARTMANN, M.,
HOLLISTER, E. B., LESNIEWSKI, R. A., OAKLEY, B. B., PARKS, D. H.,
ROBINSON, C. J., SAHL, J. W., STRES, B. & ET AL 2009. Introducing mothur:
Open-source, platform-independent, community-supported software for describing
and comparing microbial communities. Applied and Environmental Microbiology, 75,
7537-7541.
SCHLUENZEN, F., TOCILJ, A., ZARIVACH, R., HARMS, J., GLUEHMANN, M.,
JANELL, D., BASHAN, A., BARTELS, H., AGMON, I., FRANCESCHI, F. &
YONATH, A. 2000. Structure of functionally activated small ribosomal subunit at 3.3
Å resolution. Cell, 102, 615-623.
SCHUWIRTH, B. S., BOROVINSKAYA, M. A., HAU, C. W., ZHANG, W., VILA-
SANJURJO, A., HOLTON, J. M. & CATE, J. H. D. 2005. Structures of the bacterial
ribosome at 3.5 Å resolution. Science, 310, 827-834.
SETHI, S., EVANS, N., GRANT, B. J. B. & MURPHY, T. J. 2002. New strains of bacteria
and exacerbations of chronic obstructive pulmonary disease. New England Journal of
Medicine, 347, 465-471.
SETHI, S., MALLIA, P. & JOHNSTON, S. L. 2009. New paradigms in the pathogenesis of
chronic obstructive pulmonary disease II. Proceedings of the American Thoracic
Society, 6, 532-534.
SETHI, S. & MURPHY, T. F. 2001. Bacterial infection in chronic obstructive pulmonary
disease in 2000: a state of the art review. Clinical Microbiology Reviews, 14, 336-363.
SETHI, S. & MURPHY, T. F. 2008. Infection in the pathogenesis and course of chronic
obstructive pulmonary disease. The New England Journal of Medicine, 359, 2355-65.
SETHI, S., WRONA, C., ESCHBERGER, K., LOBBINS, P., CAI, X. & MURPHY, T. F.
2007. Inflammatory profile of new bacterial strain exacerbations of chronic
obstructive pulmonary disease. American Journal of Respiratory and Critical Care
Medicine, 177, 491-497.
SETHI, S., WRONA, C., GRANT, B. J. B. & MURPHY, T. F. 2004. Strain-specific immune
response to Haemophilus influenzae in chronic obstructive pulmonary disease.
American Journal of Respiratory and Critical Care Medicine, 169, 448-453.
SHARKEY, D. J., SCALICE, E. R., CHRISTY, K. G., JR., ATWOOD, S. M. & DAISS, J.
L. 1994. Antibodies as thermolabile switches: High temperature triggering for the
polymerase chain reaction. Biotechnology, 12, 506-509.
SHEFFIELD, V. C., COX, D. R., LERMAN, L. S. & MYERS, R. M. 1989. Attachment of a
40-base-pair G+C-rich sequence (GC-clamp) to genomic DNA fragments by the
polymerase chain reaction results in improved detection of single-base changes.
Proceedings of the National Academy of Sciences of the United States of America, 86,
232-236.
179
SIBLEY, C. D., PARKINS, M. D., RABIN, H. R., DUAN, K., NORGAARD, J. C. &
SURETTE, M. G. 2008. A polymicrobial perspective of pulmonary infections
exposes an enigmatic pathogen in cystic fibrosis patients. Proceedings of the National
Academy of Sciences of the United States of America, 105, 15070-15075.
SIBLEY, C. D., RABIN, H. & SURETTE, M. G. 2006. Cystic fibrosis: A polymicrobial
infectious disease. Future Microbiology, 1, 53-61.
SLIFKA, M. K., HOMANN, D., TISHON, A., PAGARIGAN, R. & OLDSTONE, M. B.
2003. Measles virus infection results in suppression of both innate and adaptive
immune responses to secondary bacterial infection. The Journal of Clinical
Investigation, 111, 805-810.
SOGIN, M. L., MORRISON, H., HUBER, J., WELCH, D. F., HUSE, S., NEAL, P.,
ARRIETA, J. & HERNDL, G. 2006. Microbial diversity in the deep sea and the
underexplored "rare biosphere". Proceedings of the National Academy of Sciences of
the United States of America, 103, 12115-12120.
SOKOL, P. A., LUAN, M. Z., STOREY, D. G. & THIRUKKUMARAN, P. 1994. Genetic
rearrangement associated with in vivo mucoid conversion of Pseudomonas
aeruginosa PAO is due to insertion elements. Journal of Bacteriology, 176, 553-562.
SOLER, N., EWIG, S., TORRES, A., FILELLA, X., GONZALEZ, J. & ZAUBET, A. 1999.
Airway inflammation and bronchial microbial patterns in patients with stable chronic
obstructive pulmonary disease. European Respiratory Journal, 14, 1015-1022.
SOLER, N., TORRES, A., EWIG, S., GONZALEZ, J., CELIS, R., EL-EBIARY, M.,
HERNANDEZ, C. & RODRIGUEZ-ROISIN, R. 1998. Bronchial microbial patterns
in severe exacerbations of chronic obstructive pulmonary disease (COPD) requiring
mechanical ventilation. American Journal of Respiratory and Critical Care Medicine,
157, 1498-1505.
SPENCER, M. D., HAMP, T. J., REID, R. W., FISCHER, L. M., ZEISEL, S. H. & FODOR,
A. A. 2011. Association between composition of the human gastrointestinal
microbiome and development of fatty liver with choline deficiency.
Gastroenterology, 140, 976-986.
STAINER, R. Y. & VAN NIEL, C. B. 1962. The concept of a bacterium. Archive für
Mikrobiologie, 42, 17-35.
STALEY, J. T. & KONOPKA, A. 1985. Measurement of in situ activities of
nonphotosynthetic microorganisms in aquatic and terrestrial habitats. Annual Review
of Microbiology, 39, 321-346.
STANLEY, P. J., WILSON, R., GREENSTONE, M. A., MACWILLIAM, L. & COLE, P. J.
1986. Effect of cigarette smoking on nasal mucociliary clearance and ciliary beat
frequency. Thorax, 41, 519-523.
STEITZ, T. A. 1999. DNA polymerases: Structural diversity and common mechanisms. The
Journal of Biological Chemistry, 274, 17395-17398.
180
STEITZ, T. A., SMERDON, S. J., JAGER, J. & JOYCE, C. M. 1994. A unified polymerase
mechanism for non-homologous DNA and RNA polymerases. Science, 266, 2022-
2025.
STICKLER, D. 1999. Biofilms. Current Opinion in Microbiology, 2, 270-275.
STOCKLEY, R. A. 1998. Role of bacteria in the pathogenesis and progression of acute and
chronic lung infection. Thorax, 53, 58-62.
STOCKLEY, R. A., MANNINO, D. & BARNES, P. J. 2009. Burden and pathogenesis of
chronic obstructive pulomonary disease. Proceedings of the American Thoracic
Society, 6, 524-526.
STRAUSBAUGH, S. D. & DAVIS, P. B. 2007. Cystic fibrosis: A review of epidemiology
and pathobiology. Clinics in Chest Medicine, 28, 279-288.
SUAU, A., BONNET, R., SUTREN, M., GODON, J. J., GIBSON, G. R., COLLINS, M. D.
& DORÉ, J. 1999. Direct analysis of genes encoding 16S rRNA from complex
microbial communities reveals many more novel molecular species within the human
gut. Applied and Environmental Microbiology, 65, 4799-4807.
SZE, M. A., DIMITRIU, P. A., HAYASHI, S., ELLIOTT, W. M., MCDONOUGH, J. E.,
GOSSELINK, J. V., COOPER, J., SIN, D. D., MOHN, W. W. & HOGG, J. C. 2012.
The lung tissue microbiome in chronic obstructive pulmonary disease. American
Journal of Respiratory and Critical Care Medicine, 185, 1073-1080.
TABETA, K., GEORGEL, P., JANSSEN, E., DU, X., HOEBE, K., CROZAT, K., MUDD,
S., SHAMEL, L., SOVATH, S., GOODE, J. & ET AL 2004. Toll-like receptors 9 and
3 as essential components of innate immune defence against mouse cytomegalovirus
infection. Proceedings of the National Academy of Sciences of the United States of
America, 101, 3516-3521.
TAGER, I. & SPEIZER, F. E. 1975. Role of infection in chronic bronchitis. The New
England Journal of Medicine, 292, 563-571.
TAKAGI, M., NISHIOKA, M., KAKIHARA, H., KITABAYASHI, M., INOUE, H.,
KAWAKAMI, B., OKA, M. & IMANAKA, T. 1997. Characterisation of DNA
polymerase from Pyrococcus sp. strain KOD1 and its application to PCR. Applied and
Environmental Microbiology, 63, 4504-4510.
TER BRAAK, C. J. F. & ŠMILAUER, P. 2002. CANOCO Reference Manual and CanoDraw
for Windows User's Guide: Software for Canonical Community Ordination (version
4.5), Ithaca, New York, U.S.A., Microcomputer Power.
THOMAS, D. N. & DIECKMANN, G. S. 2002. Antarctic sea ice ― a habitat for
extremophiles. Science, 295, 641-644.
TIZZANO, E. F. & BUCHWALD, M. 1995. CFTR expression and organ damage in cystic
fibrosis. Annals of Internal Medicine, 123, 305-308.
181
TORVISK, V., DAAE, F. L., SANDAA, R. A. & ØREÄS, L. 1998. Novel techniques for
analysing microbial diversity in natural and perturbed environments. Journal of
Biotechnology, 64, 53-62.
TORVISK, V., ØVREÄS, L. & THINGSTAD, T. F. 2002. Prokaryotic diversity ―
magnitude, dynamics, and controlling factors. Science, 296, 1064-1066.
TOURLOMOUSIS, P., KEMSLEY, E. K., RIDGWAY, K. P., TOSCANO, M. J.,
HUMPHREY, T. J. & NARBAD, A. 2010. PCR-denaturing gradient gel
electrophoresis of complex microbial communities: A two-step approach to address
the effect of gel-to-gel variation and allow valid comparisons across a large dataset.
Microbial Ecology, 59, 776-786.
TSAI, Y. L. & OLSEN, B. H. 1992a. Detection of low numbers of bacterial cells in soils and
sediments by polymerase chain reaction. Applied and Environmental Microbiology,
58, 754-757.
TSAI, Y. L. & OLSEN, B. H. 1992b. Rapid method for separation of bacterial DNA from
humic substances in sediments for polymerase chain reaction. Applied and
Environmental Microbiology, 58, 2292-2295.
TULLOCH, D. L., FINCH, L. R., HILLIER, A. J. & DAVIDSON, B. E. 1991. Physical map
of the chromosome of Lactococcus lactis subsp. lactis DL11 and localisation of six
putative rRNA operons. Journal of Bacteriology, 173, 2768-2775.
TUNNEY, M. M., FIELD, T. R., MORIARTY, T. F., PATRICK, S., DOERING, G.,
MUHLEBACH, M. S., WOLFGANG, M. C., BOUCHER, R. C., GILPIN, D. F.,
MCDOWELL, A. & ELBORN, J. S. 2008. Detection of anaerobic bacteria in high
numbers in sputum from patients with cystic fibrosis. American Journal of
Respiratory and Critical Care Medicine, 177, 995-1001.
TUNNEY, M. M., KLEM, E. R., FODOR, A. A., GILPIN, D. F., MORIARTY, T. F.,
MCGRATH, S. J., MUHLEBACH, M. S., BOUCHER, R. C., CARDWELL, C.,
DOERING, G., ELBORN, J. S. & WOLFGANG, M. C. 2011. Use of culture and
molecular analysis to determine the effect of antibiotic treatment on microbial
community diversity and abundance during exacerbation in patients with cystic
fibrosis. Thorax, 66, 579-584.
TURNBAUGH, P. J., HAMADY, M., YATSUNENKO, T., CANTAREL, B. L., DUNCAN,
A., LEY, R. E., SOGIN, M. L., JONES, W. J., ROE, B. A., AFFOURTIT, J. P.,
EGHOLM, M., HENRISSAT, B., HEATH, A. C., KNIGHT, R. & GORDON, J. I.
2009. A core gut microbiome in obese and lean twins. Nature, 547, 480-484.
TURNBAUGH, P. J., LEY, R. E., HAMADY, M., FRASER-LIGGETT, C. M., KNIGHT, R.
& GORDON, J. I. 2007. The human microbiome project. Nature, 449, 804-810.
TWISS, J., STEWART, A. W. & BYRNES, C. A. 2006. Longitudinal pulmonary function of
childhood bronchiectasis and comparison with cystic fibrosis. Thorax, 61, 414-418.
182
VALDIVIA-ARENAS, M. A., AMER, A., HENNING, L. N., WEWERS, M. D. &
SCHLESINGER, L. S. 2007. Lung infections and innate host defense. Drug
Discovery Today: Disease Mechanisms, 4, 73-81.
VAN BELKUM, A., RENDERS, N. H. M., SMITH, S., OVERBEEK, S. E. & VERBURGH,
H. A. 2000. Comparison of conventional and molecular methods for the detection of
bacterial pathogens in sputum samples from cystic fibrosis patients. FEMS
Immunology and Medical Microbiology, 27, 51-57.
VAN DE PEER, Y., NICOLAÏ, S., RIJK, P. D. & WACHTER, R. D. 1996. Database on the
structure of small ribosomal subunit RNA. Nucleic Acids Research, 24, 86-91.
VAN DE WIELE, T., BOON, N., POSSEMIERS, S., JACOBS, H. & VERSTRAETE, W.
2004. Prebiotic effects of chicory inulin in the simulator of the human intestinal
microbial ecosystem. FEMS Microbiology Ecology, 51, 143-153.
VAN DER GAST, C. J., JEFFERSON, B., REID, E., ROBINSON, T., BAILEY, M. J.,
JUDD, S. J. & THOMPSON, I. P. 2008. Bacterial diversity is determined by volume
in membrane bioreactors. Environmental Microbiology, 8, 1048-1055.
VAN DER GAST, C. J., WALKER, A. W., STRESSMAN, F. A., ROGERS, G. B., SCOTT,
P., DANIELS, T. W., CARROLL, M. P., PARKHILL, J. & BRUCE, K. D. 2011.
Partitioning core and satellite taxa from within cystic fibrosis lung bacterial
communities. ISME, 5, 780-791.
VASTAG, E., MATTHYS, H., KOHLER, D., GRONBECK, L. & DAIKELER, G. 1985.
Mucociliary clearance and airways obstruction in smokers, ex-smokers, and normal
subjects who never smoked. European journal of respiratory diseases. Supplement,
139, 93-100.
VEERAMACHANENI, S. B. & SETHI, S. 2006. Pathogenesis of bacterial exacerbations of
COPD. COPD: Journal of Chronic Obstructive Pulmonary Disease, 3, 109-115.
VERRA, F., ESCUDIER, E., LEBARGY, F., BERNAUDIM, J. F., DE CREMOUX, H. &
BIGNON, J. 1995. Ciliary abnormalities in bronchial epithelium of smokers, ex-
smokers, and non-smokers. American Journal of Respiratory and Critical Care
Medicine, 151, 630-634.
VITALI, B., PUGLIESE, C., BIAGI, E., CANDELA, M., TURRONI, S., BELLEN, G.,
DONDERS, G. G. G. & BRIGIDI, P. 2007. Dynamics of vaginal bacterial
communities in women developing bacterial vaginosis, candidasis, or no infection,
analysed by PCR-denaturing gradient gel electrophoresis and real-time PCR. Applied
and Environmental Microbiology, 73, 5731-5741.
VON WINTZINGERODE, F., GÖBEL, U. B. & STACKEBRANDT, E. 1997.
Determination of microbial diversity in environmental samples: Pitfalls of PCR-based
rRNA analysis. FEMS Microbiology Reviews, 21, 213-229.
WAUTERS, G., CHARLIER, J., JANSSENS, M. & DELMEE, M. 2000. Identification of
Arthrobacter oxydans, Arthrobacter lutelous sp. nov. and Athrobacter albus sp. nov.
183
isolated from human clinical specimens. Journal of Clinical Microbiology, 38, 2412-
2415.
WEDZICHA, J. A. 2004. Role of viruses in exacerbations of chronic obstructive pulmonary
disease. Proceedings of the American Thoracic Society, 1, 115-120.
WEDZICHA, J. A. & WILKINSON, T. 2006. Impact of chronic obstructive pulmonary
disease exacerbations on patients and payers. Proceedings of the American Thoracic
Society, 3, 218-221.
WEILAND, C. W., KNAPP, S., FLORQUIN, S., DE VOS, A. F., TAKEDA, K., AKIRA, S.,
GOLENBOCK, D. T., VERBON, A. & VAN DER POLL, T. 2004. Non-mannose-
capped lipoarabinomannan induces lung inflammation via Toll-like receptor 2.
American Journal of Respiratory and Critical Care Medicine, 170, 1367-1374.
WEINRICH, U. M. & KORSGAARD, J. 2008. Bacterial colonisation of lower airways in
health and chronic lung disease. The Clinical Respiratory Journal, 2, 116-122.
WELLS, A. U., DESAI, S., WHETTON, C., WILSON, R. & COLE, P. J. 1993. The isolation
of Pseudomonas aeruginosa from sputum in idiopathic bronchiectasis: An association
with extensive disease and severe airflow obstruction. American Review of
Respiratory Disease, 147, A645.
WESTFALL, B., SITARAMAN, K., LEE, J. E., BORMAN, J. & RASHTCHIAN, A. 1999.
Platinum Pfx DNA polymerase for high-fidelity PCR. Focus, 21, 46-48.
WEYCKER, D., EDELSBERG, J., OSTER, G. & TINO, G. 2005. Prevalence and economic
burden of bronchiectasis. Clinical Pulmonary Medicine, 12, 205-209.
WHITE, A. J., GOMPERTZ, S. & STOCKLEY, R. A. 2003. Chronic obstructive pulmonary
disease: The aetiology of exacerbations of chronic obstructive pulmonary disease.
Thorax, 58, 73-80.
WHITMAN, W. B., COLEMAN, D. C. & WIEBE, W. J. 1998. Prokaryotes: The unseen
majority. Proceedings of the National Academy of Sciences of the United States of
America, 95, 6578-6583.
WHITTAKER, R. H. 1969. New concepts of kingdoms of organisms. Science, 163, 150-160.
WHITTAKER, R. H. 1972. Evolution and measurement of species diversity. Taxon, 21, 213-
251.
WHITWELL, F. 1952. A study of the pathology and pathogenesis of bronchiectasis. Thorax,
7, 213-219.
WIDMER, F., SCHAFFER, B. T., PORTEOUS, L. A. & SEIDLER, R. J. 1999. Analysis of
nifH gene pool complexity in soil and litter at a Douglas fir forest site in the Oregon
Cascade Mountain Range. Applied and Environmental Microbiology, 65, 374-380.

184
WILKINSON, T. M. A., HURST, J. R., PERERA, M. W., DONALDSON, G. C. &
WEDZICHA, J. A. 2006. Effect of interactions between lower airway bacterial and
rhinoviral infection in exacerbations of COPD. Chest, 129, 317-324.
WILKINSON, T. M. A., PATEL, I. S., WILKS, M., DONALDSON, G. C. & WEDZICHA,
J. A. 2003. Airway bacterial load and FEV1 decline in patients with chronic
obstructive pulmonary disease. American Journal of Respiratory and Critical Care
Medicine, 167, 1090-1095.
WILLNER, D., FURLAN, M., HAYNES, M., SCHMIEDER, R., ANGLY, F. E., SILVA, J.,
TAMMADONI, S., NOSRAT, B., CONRAD, D. & ROHWER, F. 2009.
Metagenomic analysis of respiratory tract DNA viral communities in cystic fibrosis
and non-cystic fibrosis individuals. PLoS One, 4, e7370.
WILLNER, D., HAYNES, M. R., FURAN, M., SCHMIEDER, R., LIM, Y. W., RAINEY, P.
B., ROHWER, F. & CONRAD, D. 2012. Spatial distribution of microbial
communities in the cystic fibrosis lung. ISME, 6, 471-474.
WILSON, C. B., JOMNES, P. W., O'LEARY, C. J., HANSELL, D. M., COLE, P. J. &
WILSON, R. 1997. Effect of sputum bacteriology on the quality of life of patients
with bronchiectasis. European Respiratory Journal, 10, 1754-1760.
WILSON, R. & BOYTON, R. 2006. Bronchiectasis. In: LAURENT, G. J. & SHAPIRO, S.
D. (eds.) Encyclopedia of Respiratory Medicine. Oxford, U.K.: Elsevier Science &
Technology Books.
WILSON, R., DOWLING, R. B. & JACKSON, A. D. 1996. The biology of bacterial
colonization and invasion of the respiratory tract mucosa. European Respiratory
Journal, 9, 1523-1530.
WIMBERLY, B. T., BRODERSEN, D. E., CLEMONS, W. M., MORGAN-WARREN, R. J.,
CARTER, A. J., VONRHEIN, C., HARTSCH, T. & RAMAKRISHNAN, V. 2000.
The structure of the 30S ribosomal subunit. Nature, 407, 327-339.
WOESE, C. R. 1987. Bacterial evolution. Microbiological Reviews, 51, 221-271.
WOESE, C. R. & FOX, G. E. 1977. Phylogenetic structure of the prokaryotic domain: The
primary kingdoms. Proceedings of the National Academy of Sciences of the United
States of America, 74, 5088-5090.
WOESE, C. R., KANDLER, O. & WHEELIS, M. L. 1990. Towards a natural system of
organisms: Proposals for the domains Archaea, Bacteria, and Eucarya. Proceedings of
the National Academy of Sciences of the United States of America, 87, 4576-4579.
WOESE, C. R., STACKERBRANDT, E., MACKE, T. J. & FOX, G. E. 1985. A
phylogenetic definition of the major eubacterial taxa. Systematic and Applied
Microbiology, 6, 143-151.
WORLD HEALTH ORGANIZATION 2002. The molecular and genetic epidemiology of
cystic fibrosis.
185
YEAGER, C. M., NORTHUP, D. E., GROW, C. C., BARNS, S. M. & KUSKE, C. R. 2005.
Changes in nitrogen-fixing and ammonia-oxidising bacterial communities in soil of a
mixed conifer forest after wildfire. Applied and Environmental Microbiology, 71,
2713-2722.
YU, T. W., BAI, L., CLADE, D., HOFFMAN, D., TOELZER, S., TRINH, K. Q., XU, J.,
MOSS, S. J., LEISTNER, E. & FLOSS, H. G. 2002. The biosynthetic gene cluster of
the maytansinoid antitumour agent ansamitocin from Actinosynnemapretiosum.
Proceedings of the National Academy of Sciences of the United States of America, 99,
7968-7973.
YU, Z. & MORRISON, M. 2004. Comparisons of different hypervariable regions of rrs
genes for use in fingerprinting of microbial communities by PCR-denaturing gradient
gel electrophoresis. Applied and Environmental Microbiology, 70, 4800-4806.
ZASS, A. K. & SCHWARTZ, D. A. 2005. Innate immunity and the lung: Defense at the
interface between the host and environment. Trends in Cardiovascular Medicine, 15,
195-202.
ZHOU, X., BROWN, C. J., ABDO, Z., DAVIS, C. C., HANSMANN, M. A., JOYCE, P.,
FOSTER, J. A. & FORNEY, L. J. 2007. Differences in the composition of vaginal
microbial communities found in healthy Caucasian and black women. ISME, 1, 121-
133.
ZOETENDAL, E. G., AKKERMANS, A. D. & DE VOS, W. M. 1998. Temperature gradient
gel electrophoresis analysis of 16S rRNA from human feacal samples reveals stable
and host-specific communities of active bacteria. Applied and Environmental
Microbiology, 64, 3854-3859.

186
Appendix 1: Chemicals and media
A1.1 1 % (w/v) agarose gel
1. 0.3 gm of agarose (MELFORD) was added to 30 mL of of 1× TAE buffer solution
and boiled until fully dissolved.
2. Five µL of SYBR® Safe DNA gel stain (10 000× concentrate in dimethyl sulphoxide
(DMSO)) (Invitrogen™) was then added to the molten agarose, and mixed before
being poured into the gel casting chamber.
3. The gel was then left to set in order for the rest of the electrophoresis experiment to
continue.
A1.2 Molecular biology dyes
A1.2.1 10 mL 6× bromophenol blue loading dye
1. 0.025 g of bromophenol blue (SIGMA®) was added to 4 g of sucrose (SIGMA®) in
an empty 25 mL plastic universal tube.
2. These two chemicals were then made up to 10 mL with dH2O.
A1.2.2 10 mL DCode™ dye solution reagent
1. 0.05 g of bromophenol blue (SIGMA®) was added to an empty 25 mL plastic
universal tube.
2. 0.05 g of xylene cyanol FF (SIGMA®) was then added to the universal tube.
3. The contents of which were then made up to 10 mL with 1× TAE buffer solution.
A1.2.3 10 mL 2× DCode™ gel loading dye
1. 0.25 mL of a 2 % bromophenol blue solution (0.02 g of bromophenol blue
(SIGMA®) made up to 1 mL with dH2O) was added to an empty 25 mL plastic
universal tube.
2. 0.25 mL of a 2 % xylene cyanol solution (0.02 g of xylene cyanol FF (SIGMA®)
made up to 1 mL with dH2O) was then added to the universal tube.
3. 7 mL of a 100 % glycerol solution (Fisher Scientific) was then added.
4. This solution was then made up to 10 mL by the addition of 2.5 mL of dH2O.

187
A1.3 Denaturing solutions for DGGE experiments
A range of denaturing solutions were utilised for DGGE analysis in a variety of different
sample types. The reagent composition and amounts used in each denaturing solution are
summarised below:
100 mL denaturing solution (%age denaturant)
Reagent 32.5 % 35 % 40 % 60 %
40 % (v/v) 37.5:1
acrylamide:bis-acrylamide
(SIGMA® Life Sciences)
30 mL 30 mL 30 mL 30 mL
50× TAE 2 mL 2 mL 2 mL 2 mL
Deionised formamide
(SIGMA® Life Sciences)
13 mL 14 mL 16 mL 24 mL
Urea (electrophoresis
grade) (MELFORD)
13.65 g 14.7 g 16.8 g 25.5 g
dH2O To 100 mL To 100 mL To 100 mL To 100 mL
A1.4 10 % (w/v) ammonium persulphate (APS)
1. 1 g of ammonium persulphate (SIGMA®) was weighed out and then decanted into an
empty 25 mL plastic universal tube.
2. This was then made to 10 mL using dH2O, before being aliquoted into 500 µL
amounts in 1.5 mL microfuge tubes.
3. These aliquots were then stored at -20 °C until further requirement.
188
A1.5 Running buffers for gel-based experiments
A1.5.1 2 L 50× TAE solution
1. 200 mL of a 0.5 M EDTA solution pH 8.0 was made up first (37.22 g EDTA made up
to 200 mL of dH2O at pH 8.0 (this must be at pH 8.0 otherwise all of the EDTA will
not entirely dissolve into solution)).
2. 200 mL of the EDTA (0.5 M, ph 8.0) solution was then decanted into a 2 L
DURAN® glass bottle before 484 gm of Tris-HCl (MELFORD) was added.
3. Following this, 114.2 mL of glacial acetic acid (Fisher Scientific) was added.
4. Then, the resulting solution was made up to 2 L using dH2O.
A1.5.2 1 L 1× TAE solution
1. 20 mL of 50× TAE solution was decanted into a 1 L DURAN® glass bottle.
2. This was then made up to 1 L using dH2O.
A1.6 Bacteriology and mycology media
A1.6.1 Basic recipe for 1 L Luria-Bertani (LB) media and broth
10 g of tryptone (OXOID);
5 g of yeast (OXOID);
5 g of sodium chloride (NaCl) (SIGMA®);
15 g of agar bacteriological (agar no. 1) (OXOID); (omit this step from the recipe
when making LB broth);
Made up to 1 L in an appropriate conical flask using dH2O;
Adjust the pH to 7.0 with NaOH;
Autoclave at 121 °C for 45 min, cool to 50 ° C and then pour 20 mL into each Petri
dish.

189
A1.6.2 NADsens agar and broth
This particular agar and broth was previously prepared at the Freeman Hospital,
Microbiology Department, as a requirement of their routine media consortia by an
appropriate member of staff. The agar and broth function as an isosensitest, used in antibiotic
disk diffusion assays. Briefly, these components are all added together in the following order:
hydrolysed casein, peptones, glucose, NaCl, starch, disodium hydrogen phosphate, sodium
acetate, magnesium glycerophosphate, calcium gluconate, cobaltous sulphate, cupric
sulphate, zinc sulphate, ferrous sulphate, manganous chloride, menadione, cyanocobalamin,
L-cysteine hydrochloride, L-typtophan, pyridoxine, pantothenate, nicotinamide, biotin,
thiamine, adenine, guanine, xanthine, uracil, and finally agar. These nutrients are all
autoclaved at 121 °C for 60 min before cooling down to 50 °C and supplemented with 5 %
whole horse blood and 20 mg/L NAD (nicotinamide dinucleotide). In making NADsens
broth, as in LB broth, agar is omitted.
A1.6.3 Basic recipe for 100 mL Sabourad broth
1. 100 mL of Sabourad broth was implemented for each fungal strain.
2. 3 g of Sabourad liquid medium (OXOID) was decanted into an appropriate conical
flask before being made up to 100 mL with dH2O.
3. Once Sabourad liquid medium was in solution, this was autoclaved at 120 °C for 45
min.
4. Once sterilised, these broths were now ready for inoculation by the fungal strains
already described.
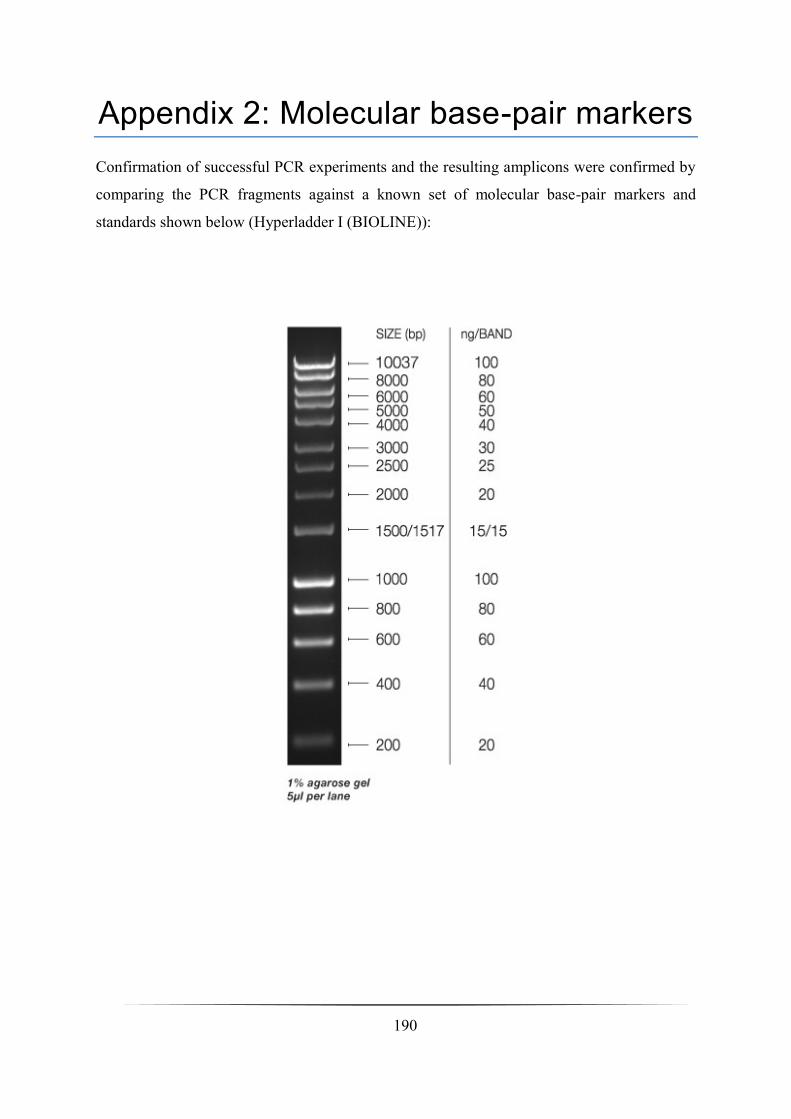
190
Appendix 2: Molecular base-pair markers
Confirmation of successful PCR experiments and the resulting amplicons were confirmed by
comparing the PCR fragments against a known set of molecular base-pair markers and
standards shown below (Hyperladder I (BIOLINE)):
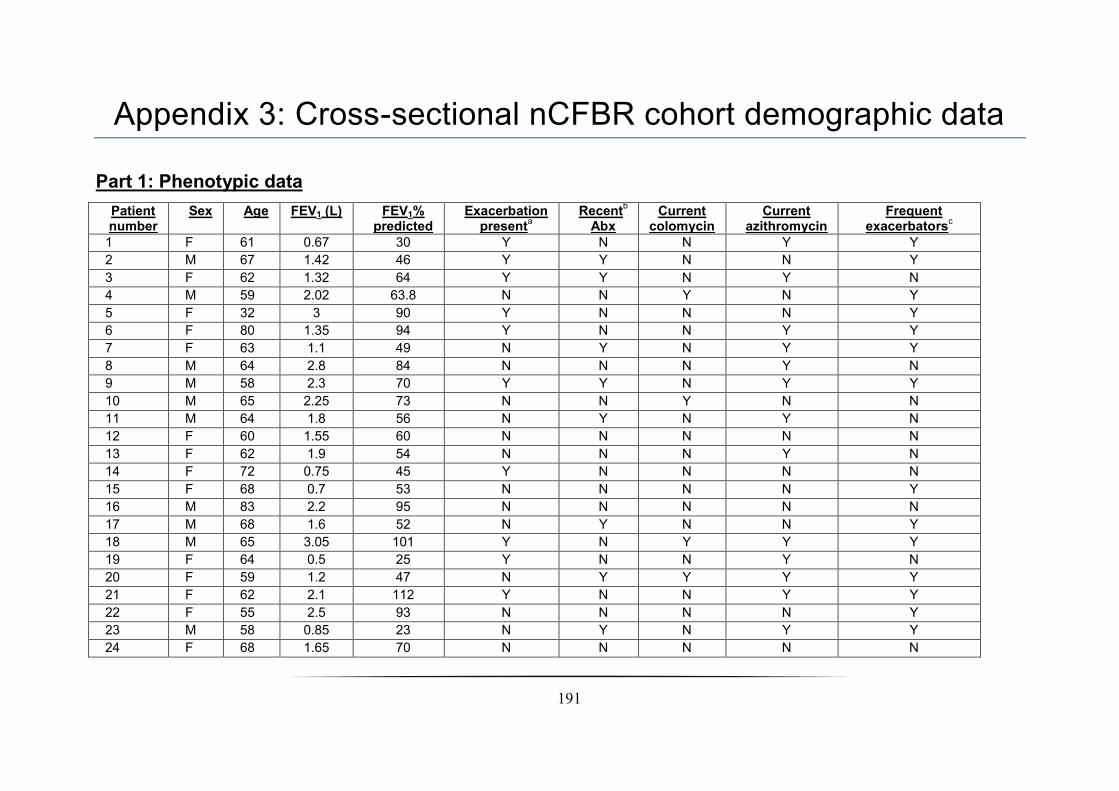
191
Appendix 3: Cross-sectional nCFBR cohort demographic data
Part 1: Phenotypic data
Patient number
Sex Age FEV1 (L) FEV1% predicted
Exacerbation present
a Recent
b
Abx
Current colomycin
Current azithromycin
Frequent exacerbators
c
1 F 61 0.67 30 Y N N Y Y
2 M 67 1.42 46 Y Y N N Y
3 F 62 1.32 64 Y Y N Y N
4 M 59 2.02 63.8 N N Y N Y
5 F 32 3 90 Y N N N Y
6 F 80 1.35 94 Y N N Y Y
7 F 63 1.1 49 N Y N Y Y
8 M 64 2.8 84 N N N Y N
9 M 58 2.3 70 Y Y N Y Y
10 M 65 2.25 73 N N Y N N
11 M 64 1.8 56 N Y N Y N
12 F 60 1.55 60 N N N N N
13 F 62 1.9 54 N N N Y N
14 F 72 0.75 45 Y N N N N
15 F 68 0.7 53 N N N N Y
16 M 83 2.2 95 N N N N N
17 M 68 1.6 52 N Y N N Y
18 M 65 3.05 101 Y N Y Y Y
19 F 64 0.5 25 Y N N Y N
20 F 59 1.2 47 N Y Y Y Y
21 F 62 2.1 112 Y N N Y Y
22 F 55 2.5 93 N N N N Y
23 M 58 0.85 23 N Y N Y Y
24 F 68 1.65 70 N N N N N
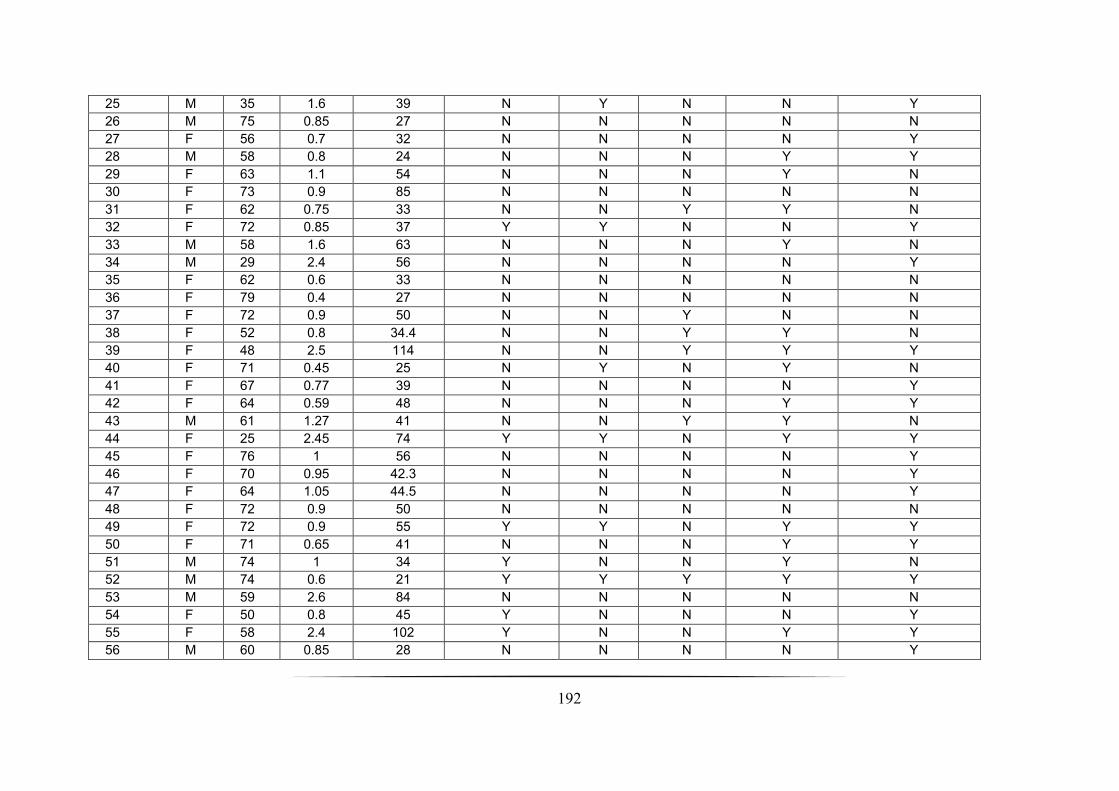
192
25 M 35 1.6 39 N Y N N Y
26 M 75 0.85 27 N N N N N
27 F 56 0.7 32 N N N N Y
28 M 58 0.8 24 N N N Y Y
29 F 63 1.1 54 N N N Y N
30 F 73 0.9 85 N N N N N
31 F 62 0.75 33 N N Y Y N
32 F 72 0.85 37 Y Y N N Y
33 M 58 1.6 63 N N N Y N
34 M 29 2.4 56 N N N N Y
35 F 62 0.6 33 N N N N N
36 F 79 0.4 27 N N N N N
37 F 72 0.9 50 N N Y N N
38 F 52 0.8 34.4 N N Y Y N
39 F 48 2.5 114 N N Y Y Y
40 F 71 0.45 25 N Y N Y N
41 F 67 0.77 39 N N N N Y
42 F 64 0.59 48 N N N Y Y
43 M 61 1.27 41 N N Y Y N
44 F 25 2.45 74 Y Y N Y Y
45 F 76 1 56 N N N N Y
46 F 70 0.95 42.3 N N N N Y
47 F 64 1.05 44.5 N N N N Y
48 F 72 0.9 50 N N N N N
49 F 72 0.9 55 Y Y N Y Y
50 F 71 0.65 41 N N N Y Y
51 M 74 1 34 Y N N Y N
52 M 74 0.6 21 Y Y Y Y Y
53 M 59 2.6 84 N N N N N
54 F 50 0.8 45 Y N N N Y
55 F 58 2.4 102 Y N N Y Y
56 M 60 0.85 28 N N N N Y
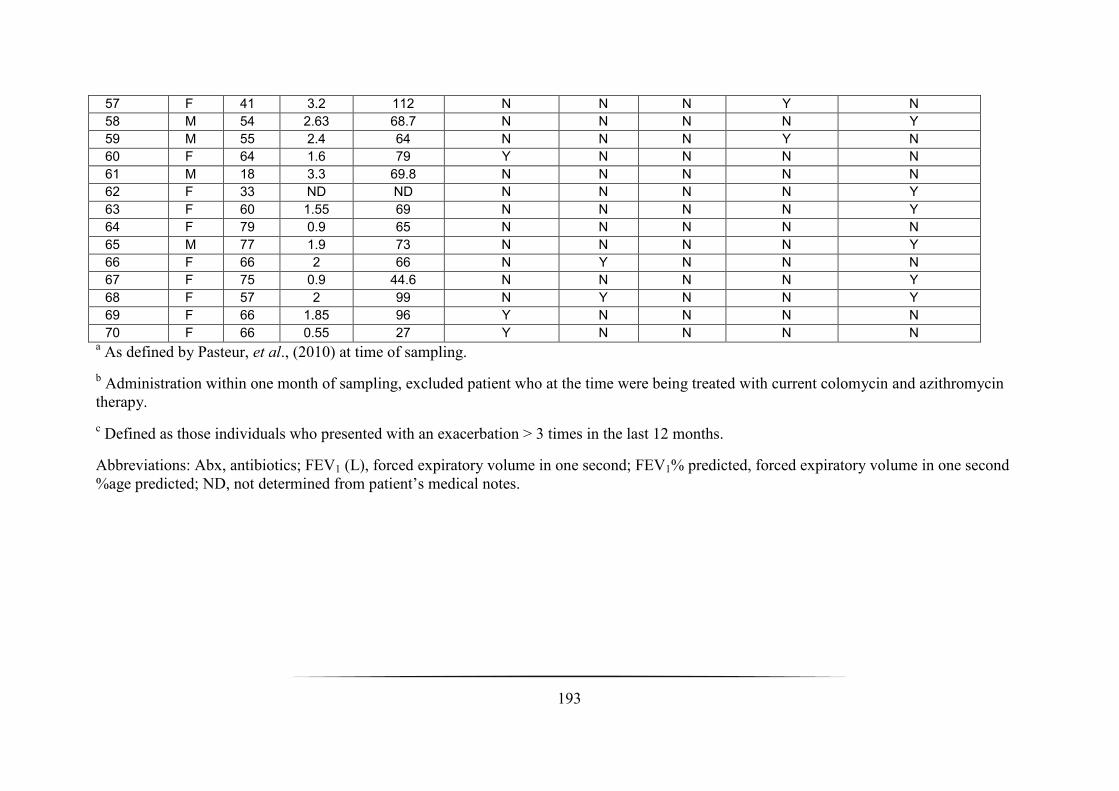
193
57 F 41 3.2 112 N N N Y N
58 M 54 2.63 68.7 N N N N Y
59 M 55 2.4 64 N N N Y N
60 F 64 1.6 79 Y N N N N
61 M 18 3.3 69.8 N N N N N
62 F 33 ND ND N N N N Y
63 F 60 1.55 69 N N N N Y
64 F 79 0.9 65 N N N N N
65 M 77 1.9 73 N N N N Y
66 F 66 2 66 N Y N N N
67 F 75 0.9 44.6 N N N N Y
68 F 57 2 99 N Y N N Y
69 F 66 1.85 96 Y N N N N
70 F 66 0.55 27 Y N N N N a As defined by Pasteur, et al., (2010) at time of sampling.
b Administration within one month of sampling, excluded patient who at the time were being treated with current colomycin and azithromycin
therapy.
c Defined as those individuals who presented with an exacerbation > 3 times in the last 12 months.
Abbreviations: Abx, antibiotics; FEV1 (L), forced expiratory volume in one second; FEV1% predicted, forced expiratory volume in one second
%age predicted; ND, not determined from patient’s medical notes.
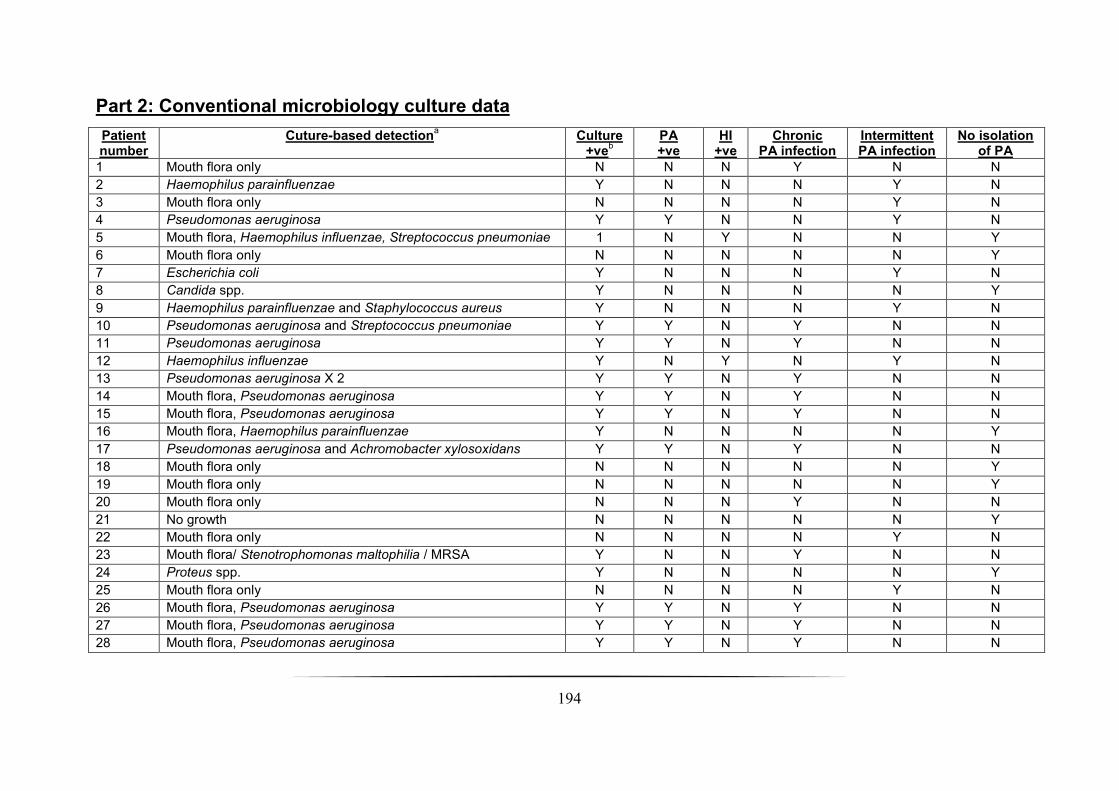
194
Part 2: Conventional microbiology culture data
Patient number
Cuture-based detectiona
Culture +ve
b
PA +ve
HI +ve
Chronic PA infection
Intermittent PA infection
No isolation of PA
1 Mouth flora only N N N Y N N
2 Haemophilus parainfluenzae Y N N N Y N
3 Mouth flora only N N N N Y N
4 Pseudomonas aeruginosa Y Y N N Y N
5 Mouth flora, Haemophilus influenzae, Streptococcus pneumoniae 1 N Y N N Y
6 Mouth flora only N N N N N Y
7 Escherichia coli Y N N N Y N
8 Candida spp. Y N N N N Y
9 Haemophilus parainfluenzae and Staphylococcus aureus Y N N N Y N
10 Pseudomonas aeruginosa and Streptococcus pneumoniae Y Y N Y N N
11 Pseudomonas aeruginosa Y Y N Y N N
12 Haemophilus influenzae Y N Y N Y N
13 Pseudomonas aeruginosa X 2 Y Y N Y N N
14 Mouth flora, Pseudomonas aeruginosa Y Y N Y N N
15 Mouth flora, Pseudomonas aeruginosa Y Y N Y N N
16 Mouth flora, Haemophilus parainfluenzae Y N N N N Y
17 Pseudomonas aeruginosa and Achromobacter xylosoxidans Y Y N Y N N
18 Mouth flora only N N N N N Y
19 Mouth flora only N N N N N Y
20 Mouth flora only N N N Y N N
21 No growth N N N N N Y
22 Mouth flora only N N N N Y N
23 Mouth flora/ Stenotrophomonas maltophilia / MRSA Y N N Y N N
24 Proteus spp. Y N N N N Y
25 Mouth flora only N N N N Y N
26 Mouth flora, Pseudomonas aeruginosa Y Y N Y N N
27 Mouth flora, Pseudomonas aeruginosa Y Y N Y N N
28 Mouth flora, Pseudomonas aeruginosa Y Y N Y N N

195
29 Mouth flora, Serratia spp. Y N N N N Y
30 Mouth flora, Pseudomonas aeruginosa, Klebsiella pneumoniae Y Y N Y N N
31 Mouth flora, Haemophilus influenzae Y N Y N N Y
32 Mouth flora / Aspergillus fumigatus Y N N N Y N
33 Mouth flora, Haemophilus influenzae Y N Y N Y N
34 Mouth flora, Haemophilus influenzae Y N Y N N Y
35 Haemophilus influenzae Y N Y N Y N
36 Pseudomonas aeruginosa Y Y N Y N N
37 Pseudomonas aeruginosa and Staphylococcus aureus Y Y N Y N N
38 Pseudomonas aeruginosa X 2 Y Y N Y N N
39 Mouth flora only N N N N N Y
40 Mouth flora only N N N Y N N
41 Pseudomonas aeruginosa Y Y N Y N N
42 Mouth flora, Pseudomonas aeruginosa Y Y N Y N N
43 Mouth flora, Pseudomonas species Y Y N Y N N
44 Mouth flora, Haemophilus influenzae/Candida spp. Y N Y N N Y
45 Escherichia coli Y N N N N Y
46 Escherichia coli and Moraxella catarrhalis Y N N N N Y
47 Pseudomonas aeruginosa X 2 Y Y N Y N N
48 Mouth flora only N N N N N Y
49 Mouth flora only N N N N Y N
50 Mouth flora, Pseudomonas aeruginosa X 2 Y Y N Y N N
51 Mouth flora, Pseudomonas aeruginosa Y Y N Y N N
52 Mouth flora, Pseudomonas aeruginosa Y Y N Y N N
53 Mouth flora and Staphylococcus aureus Y N N N Y N
54 Mouth flora, Haemophilus influenzae Y N Y N N Y
55 Mouth flora, Stenotrophomonas maltophilia Y N N N Y N
56 Mouth flora only N N N N Y N
57 Mouth flora only N N N N Y N
58 Haemophilus influenzae Y N Y N N Y
59 Morganella morganii Y N N N Y N
60 Mouth flora, Haemophilus influenzae Y N Y N N Y

196
61 Mouth flora only N N N N N Y
62 Mouth flora, Pseudomonas aeruginosa Y Y N Y N N
63 Pseudomonas aeruginosa Y Y N N N Y
64 Haemophilus influenzae Y N Y N N Y
65 Mouth flora, Serratia liquefaciens Y N N N N Y
66 Mouth flora only N N N N N Y
67 Mouth flora only N N N N N Y
68 Mouth flora and Staphylococcus aureus Y N N N N Y
69 Mouth flora and Haemophilus influenzae Y N Y N N Y
70 Mouth flora only N N N N N Y a Performed by Health & Care Professions Council registered Biomedical Scientists at the Freeman Hospital, Microbiology Department,
Newcastle upon Tyne.
b The culture of mouth flora in this study was defined as culture-negative.
Abbreviations: HI, Haemophilus influenzae; PA, Pseudomonas aeruginosa.

197
Appendix 4: Microbiology Department at the Freeman Hospital SOP: Sputum and related samples
Contained in the following appendix is the official SOP documentation relating to the
processing of respiratory tract specimens carried out by the Freeman Hospital; This
SOP was generously donated to the author by Prof. John Perry and Audrey Perry.
Note that this document has been re-formatted and edited slightly from the original
copy to ensure that it meets the requirements of thesis submission.
Newcastle upon Tyne Hospitals NHS Trust: MIFSOP003
Microbiology Department: Edition 6.0 26/06/2012
Newcastle upon Tyne Hospitals NHS Trust: MICRAF009
Microbiology Department: Edition 3.0 30/01/2012
Location of SOP documentation: Room 102 FH

198
Purpose and scope, applications
Sputum samples and other samples such as Pleural fluid, Tissue, NPS BAL and cough swabs may be sent for examination. Samples are inoculated onto culture media and incubated in an appropriate atmosphere and temperature to allow the growth of micro-organisms. General guidance is presented in line with National SOPs. Specific requirements for specimen types are given in checklists.
COSHH,
Health and safety
Before handling samples the following must be read and understood:
COSHH assessments FH: F003, F007, F010, F017, F022, F032, F038, F042, F043.
The following Risk Assessments must also be read :- FH : F001, F002, F012 also those specific to location : F009, R003. All respiratory samples must be processed in a Class 1 safety cabinet wearing appropriate gloves conforming to EN 166.
The following documents should also be read before proceeding:
Containment level 3 protocols MICH&SF010
Category 3 room fumigation MICH&SF011
Fumigation of Class 1 safety cabinet MICH&SF012
Personnel All grades of BMS staff and Trainee staff under supervision may perform these procedures.

199
Introduction
This document describes the isolation of organisms known to cause respiratory infection from associated specimens. Recovery and recognition of organisms responsible for pneumonia depends on
• The adequacy of the lower respiratory tract specimen
• Avoidance of contamination by upper respiratory tract flora
• The use of microscopic techniques and culture methods. If these are suitable, fastidious organisms will grow
• Current and recent antimicrobial treatment
Distinction between tracheobronchial colonisation and true pulmonary infection can prove difficult. Ventilator associated pneumonia carries a high mortality but is difficult to diagnose clinically and microbiologically. The criteria which should be used for diagnosis remain controversial. The poor sensitivity and specificity of sputum culture in the diagnosis of pneumonia in hospitalised ventilated patients has led to the development of a variety of techniques for obtaining lower respiratory tract specimens either with or without the use of fibreoptic bronchoscopy. Specimens which may be received include bronchoalveolar lavage and protected brush specimens collected bronchoscopically, ‘blind’ protected brush specimens and non directed bronchoalveolar lavage. A pure bacterial count of greater than 103 cfu/ml in a brush specimen obtained bronchoscopically has been found to correlate with a histological diagnosis of pneumonia. Brush specimen results and bronchoalveolar lavage results are comparable if a cut off of 104 cfu/ml is used for the bronchoalveolar lavage although this is not recommended in this SOP because optional methodology, interpretation and clinical significance remain controversial. Non directed techniques have been found to give results comparable to bronchscopic methods.
Types of specimen
Bronchial aspirate
These are collected by direct aspiration of material from the large airways of the respiratory tract by means of a flexible bronchoscope.
Bronchial brushing
This uses a protected brush catheter in the bronchoscope (a brush within two catheters sealed at the end with a polyethylene glycol plug) to tease material from the airways.
200
Bronchial washings
Bronchial washings are collected in a similar fashion to bronchial aspirates, but the procedure involves the aspiration of small amounts of instilled saline from the large airways of the respiratory tract.
Pleural fluid
Pleural fluid is the accumulation of fluid between the inner and outer (visceral and parietal) layers of the pleura.
Tracheal aspirate
Tracheal aspirates are collected via the endotracheal tube. They are subject to the same limitations as sputum specimens.
Transthoracic aspirate
These samples are obtained through the chest wall, via a needle passed between the ribs. This procedure may be undertaken to sample, for instance, an aspergilloma, abscess or any focal lung lesion which is accessible. It is rarely used because of the risk of complications.
Transtracheal aspiration
Transtracheal aspiration is also a procedure which carries clinical risks and is therefore rarely performed in the UK. Its clinical usefulness in defining the aetiology of acute bacterial pneumonia has been described. The technique entails the insertion of a large bore needle containing a catheter through the cricothyroid space and into the trachea. The needle is then removed leaving the catheter in place. A syringe attached to the catheter is used to aspirate the secretions. If no material is obtained, 2-3 ml of sterile saline (without antibacterial additives) is injected and aspiration attempted again.
Clinical associations
Empyema
Empyema is the collection of pus in the pleural cavity. It most often occurs as a complication of bacterial infection of the pulmonary parenchyma, either pneumonia or lung abscess.
Any organism can be isolated from pleural fluid, in particular organisms associated with lower respiratory tract infection and organisms acquired by aspiration of the oropharyngeal flora, including oral streptococci and anaerobes. Unusual organisms such as L. monocytogenes have been reported.
Organisms particularly associated with empyema in patients with acquired immune deficiency syndrome (AIDS) include:

201
• Cryptococcus neoformans
• Mycobacterium avium-intracellulare
• M. tuberculosis
• Nocardia asteroides
Other organisms which may cause infection in this group of patients include Pneumocystis carinii and Rhodococcus equi.
Lower respiratory tract infection
Lower respiratory tract infection (LRTI) is a major cause of morbidity and mortality. In the UK, about 50,000 people are admitted to hospital annually, of whom 10% die. The expression LRTI includes pneumonia, where there is inflammation of the lung parenchyma, and infections such as bronchiolitis, which affect the small airways. Lung abscess, where the lung parenchyma is replaced by pus filled cavities, and empyema, where pus occupies the pleural space, are less common manifestations of LRTI.
Pneumonia can be classified according to whether it is community acquired or nosocomial (often defined as being acquired more than 48 hours after hospitalisation). It may be primary, occurring in a person without previously identified risk factors, or secondary. Many conditions are associated with an increased risk of pneumonia. Common risk factors include chronic lung diseases such as chronic obstructive pulmonary disease, diabetes mellitus, cardiac or renal failure and immunosuppression (either congenital or acquired). Reduced level of consciousness and weakness of the gag and cough reflexes are risk factors for aspiration pneumonia. Recent infection with respiratory viruses, particularly influenza, is also a risk factor. There are clinical signs and laboratory indices which can be used to assess the severity of pneumonia in an individual patient, some of which are predictive of an increased risk of death if present.
Pleurisy
Pleurisy is inflammation of the pleura, the serous membranes which cover the lungs and the inner aspect of the thoracic cavity.
Pleural effusion is the accumulation of fluid between the inner and outer (visceral and parietal) layers of the pleura. It may arise as the result of pneumonia or of chronic heart failure or uraemia (when cultures will be negative), or by direct spread of infection, such as a primary tuberculous focus rupturing into the pleural cavity. Carcinomatous involvement of the visceral pleura is one of the more common causes of sterile pleural effusions.
Effusion occurs early in the course of pneumonia representing the pleural response to an inflammatory reaction in the adjacent lung. Bacteria reach the pleural space by various routes:

202
• spread from an adjacent area of pneumonia
• thoracic surgery or drainage
• bacteraemia
• chest trauma
• trans-diaphragmatic spread from intra-abdominal infection
Tuberculous pleural effusion usually arises as an extension of infection from a sub pleural focus. Only small numbers of bacilli are found in the effusion, as a result microscopy is rarely positive. Pleural biopsy is the specimen of choice.
Pneumonia
The aetiology of pneumonia varies according to whether it has been acquired in the community or in hospital and the risk factors present. Many of the bacteria found as colonisers of the upper respiratory tract have been implicated in pneumonia. Antibiotic treatment and hospitalisation affect the colonising flora, leading to an increase in numbers of aerobic Gram-negative bacilli. These factors affect the sensitivity and specificity of sputum culture as a diagnostic test and results must always be interpreted in the light of the clinical information. Many patients do not have a productive cough and are frequently unable to produce sputum. Sputum culture results are often unreliable and sensitivity of culture is poor for many pathogens.
Community acquired pneumonia
The commonest cause overall is Streptococcus pneumoniae, which is responsible for up to 60% of cases in community based surveys. It can affect individuals of any age, including those without known risk factors. Other bacterial pathogens tend to cause pneumonia in the presence of specific risk factors. Patients with COPD are additionally at risk of pneumonia caused by Haemophilus influenzae and Moraxella catarrhalis. Staphylococcus aureus pneumonia occurs either in the context of recent influenza infection or, less commonly, as a result of bloodborne spread from a distant focus, COPD or aspiration. Aerobic Gram-negative rods are rare causes of community acquired pneumonia. Occasionally, Klebsiella pneumoniae causes a severe necrotizing pneumonia, typically in patients with a history of alcohol abuse and homelessness (“Friedlanders” pneumonia).

203
Mycoplasma pneumoniae causes up to 20% of community acquired pneumonia, second only to Streptococcus pneumoniae. It tends to occur in epidemics every 4-5 years and affects younger age groups. Chlamydia pneumoniae is an exclusively human pathogen, but pneumonia caused by Chlamydia psittaci and Coxiella burnetii occurs in individuals with the relevant exposure history (birds and farm animals). These agents are responsible for a minority of cases. Legionella pneumophila is a rare cause of outbreaks of community acquired pneumonia and about 50% of cases seen in the UK give a recent history of travel. Respiratory viruses, such as RSV, influenza and adenoviruses may occasionally cause primary viral pneumonia. Other rare causes of community acquired pneumonia include Pasteurella species and Neisseria meningitidis.
Hospital acquired pneumonia
This is the second commonest type of nosocomial infection. Risk is increased by the presence of underlying disease and by various interventions and procedures. Mechanical ventilation is a major risk factor. Aerobic Gram-negative bacilli, including members of the Enterobacteriaceae (such as Klebsiella and Enterobacter species) and Pseudomonas aeruginosa are implicated in up to 60% of cases.
Pneumonia in special situations and patient groups
Aspiration pneumonia:
This occurs when oropharyngeal contents are introduced into the lower respiratory tract. Reduced level of consciousness, for instance following head injury or drug overdose is a risk factor, as are weak gag and cough reflexes which can follow a stroke or other neurological disease. True aspiration pneumonia usually has an insidious onset. Anaerobes such as Porphyromonas species, Fusobacterium, Prevotella and anaerobic streptococci are implicated and may be part of a mixed infection with aerobic bacteria. Lung abscess formation and empyema are common complications.
Lung abscess:
This may be secondary to aspiration pneumonia, in which case the right middle zone is most frequently affected. Other organisms may give rise to multifocal abscess formation and the presence of multiple small abscesses (<2cm diameter) is sometimes referred to as necrotising pneumonia. Pneumonia caused by S. aureus and K. pneumoniae may show this picture. Nocardiosis, almost always occurring in a setting of immunosuppression, may present as pulmonary abscesses. Abscesses as a result of blood borne spread of infection from a distant focus may occur in conditions such as infective endocarditis. Burkholderia pseudomallei may cause lung abscesses or necrotising pneumonia in those who have visited endemic areas (mainly south East Asia and northern Australia).
204
Lemierre's syndrome or necrobacillosis originates as an acute oropharyngeal infection. Infective thrombophlebitis of the internal jugular vein leads to septic embolisation and metastatic infection. The lung is most frequently involved and multifocal abscesses may develop. Fusobacterium necrophorum is the most common pathogen isolated from blood cultures in patients with this syndrome.
Cystic fibrosis
The major cause of morbidity and mortality in cystic fibrosis patients is progressive pulmonary disease associated with pulmonary infection. The major pathogens are S. aureus, H. influenzae, S. pneumoniae and pseudomonads, particularly mucoid P. aeruginosa strains. Strains of P. aeruginosa with differing antibiotic susceptibilities may be isolated from a single sample. Anaerobes may also be present.
Resistance to antibiotics, particularly in Burkholderia cepacia, Stenotrophomonas maltophilia (both previously in genus Pseudomonas) and P. aeruginosa, limits the options for treatment. Transmission of B. cepacia between patients may occur and some patients succumb to "B. cepacia syndrome" which is a rapidly fulminating pneumonia sometimes accompanied by septicaemia. Nosocomial transmission of Burkholderia gladioli has also been reported. Fungi, particularly Candida and Aspergillus species have also been implicated in infections in cystic fibrosis patients.
Fungal infections
Exposure to environmental fungi is universal and the outcome of exposure is a function of the immune status of the individual and the intrinsic pathogenic potential of the fungus involved. Candida species are normal human commensals. Aspergillus species and Pneumocystis carinii have a worldwide distribution. Cryptococcus neoformans is also ubiquitous, but certain serotypes (C. neoformans var gattii) are restricted to tropical and subtropical
areas.
205
Candida species are extremely rare causes of LRTI. Occasionally infection occurs as a result of haematogenous seeding. Diagnosis is difficult given that the airways may become heavily colonised in compromised patients. Aspergillus fumigatus is the commonest Aspergillus species to infect humans. Pulmonary manifestations in hosts without major impairment of cellular or humoral immunity include allergic bronchopulmonary aspergillosis in patients with asthma or cystic fibrosis and aspergilloma, which occurs when the organism colonises a pre-existing lung cavity or cyst. Invasive pulmonary aspergillosis may have an acute and rapid course in heavily immunosuppressed patients (e.g. allogeneic bone marrow transplant recipients) or a more chronic indolent progression in less compromised patients (e.g. chronic granulomatous disease, HIV infection). Pneumonia caused by P. carinii occurs in the setting of impaired cell-mediated immunity such as advanced HIV infection and solid organ or bone marrow transplantation.
Cryptococcal pulmonary infection is unusual in the absence of immune dysfunction and may coexist with extrapulmonary cryptococcosis. Pneumonia may be severe and rapidly progressive in patients with advanced HIV infection but those with better immune function may have a more indolent and variable course. Several other fungi have been reported to cause pulmonary infection in immunocompromised patients, often as part of multisystem disseminated disease. Penicillium marneffei infection typically occurs in HIV-infected patients in areas of South East Asia where it is endemic. Pseudallescheria boydii, Fusarium, Alternaria and zygomycetes have been implicated in infections in patients being treated for haematological malignancy and in bone marrow transplant recipients.
Some unusual fungal causes of LRTI are endemic to defined geographical areas. Although many infections are sub clinical, clinically apparent infections are occasionally imported into the UK. They occur in persons with normal immunity but tend to be more severe in the immunocompromised. The diagnosis should be considered in travellers returning from endemic areas who present with respiratory illness or pneumonia, particularly if they fail to respond to standard therapy. These infections include: histoplasmosis, caused by Histoplasma capsulatum (south east USA, Central America); coccidiodomycosis, caused by Coccidiodes immitis (south west USA, Central and South America) and blastomycosis caused by Blastomyces dermatidis (eastern USA, Africa). Although these infections have distinguishing characteristics, it is often difficult to differentiate them clinically from other causes of respiratory infection, particularly in their early stages. Paracoccidioidomycosis caused by Paracoccidioides brasiliensis (Central and South America) usually causes asymptomatic primary pulmonary infection, which may reactivate if immune function declines.

206
Immunosuppression
Patients with congenital or acquired immune defects are susceptible to infection with unusual organisms which do not cause problems in the normal host. The range of organisms to which an individual is susceptible varies according to the nature of the immune defect. In addition, these patients remain at risk of infection with the common pathogens. Environmental bacteria such as Nocardia species, Rhodococcus equi, Legionella species and environmental mycobacteria may be implicated. Fungal pathogens such as Pneumocystis carinii and Aspergillus species are also important as are herpesviruses, particularly cytomegalovirus. Patients with advanced HIV disease and transplant recipients are susceptible to P. carinii pneumonia and mycobacterial infection. CMV infection often manifests itself as pneumonitis in heart, lung and heart/lung transplant recipients (but HIV infected individuals only rarely get CMV pulmonary disease). Invasive pulmonary aspergillosis is seen especially in patients who have had prolonged periods of granulocytopenia.
Mycobacterial disease
Primary pulmonary infection with Mycobacterium tuberculosis may lead to the formation of the ‘primary complex’, particularly in childhood. The pulmonary focus may be relatively small, but the draining hilar lymph nodes become greatly enlarged and may rupture, spreading infectious material into other areas of the lung. It is at this stage that miliary spread to other organs may occur via blood and lymphatics. Adolescents and adults may have asymptomatic primary infection, a typical primary complex or infection which progresses to typical chronic cavitating tuberculosis. Chronic cavitating disease is usually seen in reactivated primary infection and the lung apices are most commonly involved. The cough which accompanies this process produces aerosols of infectious particles which are the route by which other persons may become infected.
Nocardia and Actinomyces infections
Nocardiosis and actinomycosis are rare conditions which may affect other systems apart from the lungs. Nocardia is most often seen in the lung where it may cause acute, often necrotising, pneumonia. This is commonly associated with cavitation. It may produce a slowly enlarging pulmonary nodule and pneumonia which is often associated with empyema. Immune defects ranging from alcoholism to organ transplantation and HIV infection are present in the majority (60% plus) of patients presenting with nocardiosis. Actinomyces species cause a thoracic infection which may involve the lungs, pleura, mediastinum or chest wall. Cases often go unrecognised until empyema or a chest wall fistula develops. Aspiration of oral contents is a risk factor for the development of thoracic actinomycosis, thus predisposing conditions include alcoholism, cerebral infarction, drug overdose, general anaesthesia, seizure,

207
diabetic coma or shock. The appropriate specimens for investigation of both these organisms are pus, tissue and biopsy specimens.
Parasitic infections
Several helminth infections may give rise to a syndrome characterised by patchy pulmonary infiltrates and eosinophilia accompanied by symptoms of cough, fever and weight loss. These signs and symptoms are associated with passage of larval forms through the lungs and include Ascaris lumbricoides, hookworms and Strongyloides stercoralis. The lung fluke, Paragonimus westermanii has a wide distribution and is particularly prevalent in the far East, Indian subcontinent and West Africa. Human infection is acquired by consumption of uncooked freshwater crabs or crayfish, which harbour encysted metacercariae. Although infection may be asymptomatic, heavy infestations are manifested by pulmonary infiltrates as above which may progress to chronic productive cough with pleuritic chest pain. Ova of P. westermanii are demonstrable in sputum. Refer to parasite SOP for processing of samples for parasite examination.

208
Specimen processing
SAMPLES SHOULD BE GRADED AS FOLLOWS:
100% pus - Purulent
The sample is stuck to the container and does not move when it is inverted.
75% pus / 25% saliva - Mucopurulent
50% pus / 50% saliva - Mucopurulent
25% pus / 75% saliva - Mucopurulent
100% saliva - Mucoid
The sample may be discarded as unsuitable using the Apex code MUCOID, unless it is from an ICU/HDU, cystic fibrosis or immunocompromised patient.
209
Preparation of Sputasol
Carefully using forceps peel the metal foil from a fresh vial of Sputasol (Refrigerator Category 3 suite) and discard the foil into a Sharps box.
Using a medical flat containing 100 ml of sterile de-ionised water pour in the vial of Sputasol and mix until dissolved. Using a sterile pipette place the contents of the vial into the remainder of the de-ionised water, tighten cap, mix and label with the current date. Sputasol must not be used if more than 48 hours old.
Store in the Blood Culture refrigerator. Discard the Sputasol glass vial into the Sharps box.
Sputum Culture Protocol
Before culture is commenced check the sample details match those on the request form and proceed to number the appropriate plates according to the tables at the back of the SOP, or the quick guide at the front of the SOP (MIFSOP 033).
Carry the plates and samples into the Category 3 suite in carrier racks and place into the safety cabinet. Switch on the safety cabinet and ensure the air-flow readings are within range before commencing. If not inform a Senior member of staff – DO NOT PROCEED UNTIL RECTIFIED.
Put on relevant P.P.E (Disposable gloves and safety gown)
Using a sterile pipette, add an equal volume of Sputasol to the samples, discard the pipette to waste. Tighten the lids securely and vortex until the sample is fully homogenised.
Using a 10 μl loop place a level loopful of sample into 5 ml of sterile de-ionised water, and vortex to homogenise. Discard loop to waste jar.
Using a separate sterile 10 µl loop, inoculate the appropriate plates and spread for single colonies. Discard the loop into the discard jar.
Incubate the plates in appropriate atmospheric conditions for 24 hours, and examine for typical bacterial pathogens as contained in the tables. Re-incubate as required according to the tables.
Store samples in the cold room when finished.
Wipe down the safety cabinet with Terminex after culturing a batch of samples, discard gloves into clinical waste bags and remove gown.

210
Pleural Fluids Culture Protocol
Upon arrival in the laboratory check that the sample details match those on the request form. In the category 3 suite, place the sample into the sealed centrifuge buckets and balance ready for centrifugation. Spin the sample for 10 minutes at 3000 r.p.m. Turn on the safety cabinet and check readings are acceptable before proceeding.
Pour off the sample supernatant into a labelled sterile universal. Number up the plates as per protocol and place 5 drops of spun deposit onto a vial of sterile saponin (Blood Culture Refrigerator) using a sterile Pasteur pipette. Vortex to mix. Using a 10 µl loop apply 10 µl to the culture plates and spread for single colonies. Discard loop and pipette into discard waste. Incubate the plates under the appropriate atmospheric conditions overnight before reading. See tables for list of appropriate pathogens. Re-incubate as required.
Tissues and Biopsies Culture Protocol
Upon arrival in the laboratory check that the sample details match those on the request form. Label the plates as appropriate and transfer to the safety cabinet. Pour Terminex into autoclavable container and place into the cabinet. Switch on the safety cabinet and ensure the air-flow readings are within range before commencing. If not inform a Senior member of staff – DO NOT PROCEED UNTIL RECTIFIED.
Put on relevant P.P.E (Disposable gloves and safety gown)
Place the sample into a tissue grinder, add 3 drops of sterile de-ionised water, and grind the sample ideally until a smooth homogenous suspension is achieved. Occasionally the sample may be difficult to grind, in such cases grind the sample for at least 10 minutes. Using a 10 µl loop place a loopful of the ground tissue suspension onto each plate and spread for single colonies. Discard loop into discard waste. Upon completion of all cultures and enrichments place the grinder into the disinfectant and using a pipette ensure the grinder is filled. Leave to stand overnight before autoclaving.
Incubate the plates under the appropriate atmospheric conditions overnight before reading. See tables for list of appropriate pathogens. Re-incubate as required.
Respiratory Swab Culture Protocol
Occasionally swabs of respiratory samples are sent. These are often from CF patients, lung Tx donors or from anastomosis sites. These are cultured according to the quick guide. The sample is checked to ensure the details match those on the request form. Number the plates as appropriate and inoculate the swab onto the plates and spread for single colonies. Place swab into appropriate rack in cold room upon completion. Incubate the plates under the appropriate atmospheric conditions overnight before reading. See tables for list of appropriate pathogens.

211
BAL Samples
Introduction
It is possible to recover bacteria, viruses, protozoa and fungi responsible for pulmonary infection from BAL specimens. Although isolation of Aspergillus species from BAL is of value in patients with invasive disease, it is only 30% sensitive. BAL specimens are particularly useful in the diagnosis of Pneumocystis carinii pneumonia, pneumonia caused by Legionella pneumophila and for the detection of Mycobacterium tuberculosis presenting as pneumonia.
Bronchoalveolar lavage (BAL)
A segment of lung is `washed' with sterile saline after insertion of a flexible bronchoscope, thus allowing recovery of both cellular and non-cellular components of the epithelial surface of the lower respiratory tract. It is a reliable method for making a definitive aetiological diagnosis of pneumonia and other pulmonary infections.
Non directed bronchoalveolar lavage (NBL)
A suction catheter, preferably a protected BAL catheter to minimise contamination, is passed down the endotracheal tube until resistance is met. An aliquot of sterile saline is injected and then aspirated. This method provides a lower respiratory tract sample without the need for bronchoscopy and without the attendant risks of transtracheal aspiration.
Culture of BAL samples
Before culture is commenced check the sample details match those on the request form and proceed to number the appropriate plates according to the tables at the back of the SOP, or the quick guide at the front of the SOP (MIFSOP 030).
Carry the plates and samples into the Category 3 suite in carrier racks and place into the safety cabinet. Switch on the safety cabinet and ensure the air-flow readings are within range before commencing. If not inform a Senior member of staff – DO NOT PROCEED UNTIL RECTIFIED.
Put on relevant P.P.E (Disposable gloves and safety gown).
Place the sample into the sealed centrifuge buckets and balance ready for centrifugation. Spin the sample for 10 minutes at 3000 r.p.m. In the safety cabinet transfer the supernatant into a labelled plastic universal. Add 20 ml of sterile de-ionised water to the deposit and vortex. Centrifuge the sample again and discard the supernatant to another labelled plastic universal. Vortex. The sample is now ready for culture.
Lavages from patients are cultured as neat onto the appropriate plates by placing 10 µl of sample onto the plates and spreading for single colonies.

212
Lavages from patients with cystic fibrosis and bronchiectasis may also be diluted by placing a 10 µl loopful into 5 ml of sterile de-ionised water and inoculating this diluted sample onto a chocolate plate only. Discard loops into discard waste.
Incubate the plates under the appropriate atmospheric conditions overnight before reading. See tables for list of appropriate pathogens. Re-incubate as required.
Interpretation guidelines
This applies to all routine samples from FRH, RVI, Clinics, Outpatients and GP’s. It excludes samples from both Critical Care sites, CF patients and bronchiectasis.
Sensitivities are performed on Pseudomonas spp, Coliforms and S. aureus when:
- Heavy and pure from a purulent sample - Or accompanied by good clinical details
Sensitivities are suppressed. The medical staff may add a further comment if necessary.
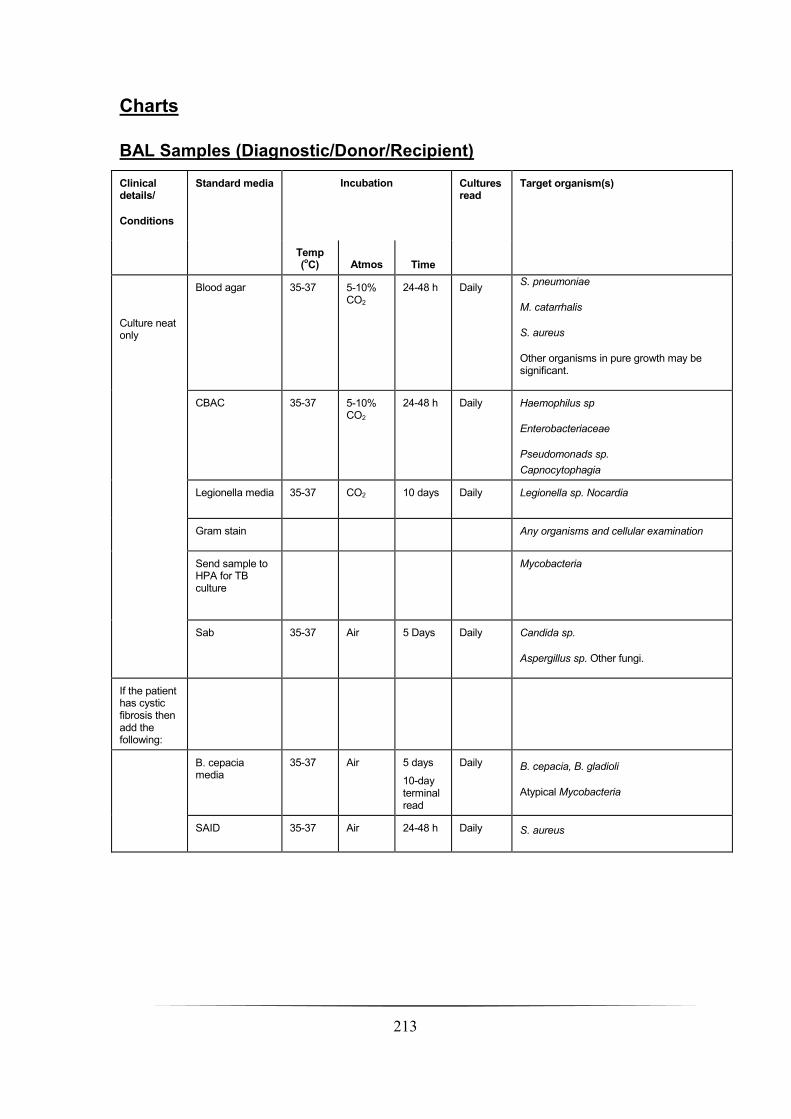
213
Charts
BAL Samples (Diagnostic/Donor/Recipient)
Clinical details/
Conditions
Standard media Incubation Cultures read
Target organism(s)
Temp (oC) Atmos Time
Culture neat only
Blood agar
35-37 5-10% CO2
24-48 h Daily S. pneumoniae
M. catarrhalis
S. aureus
Other organisms in pure growth may be significant.
CBAC 35-37 5-10% CO2
24-48 h Daily Haemophilus sp
Enterobacteriaceae
Pseudomonads sp.
Capnocytophagia
Legionella media 35-37 CO2 10 days Daily Legionella sp. Nocardia
Gram stain Any organisms and cellular examination
Send sample to HPA for TB culture
Mycobacteria
Sab 35-37 Air 5 Days Daily Candida sp.
Aspergillus sp. Other fungi.
If the patient has cystic fibrosis then add the following:
B. cepacia media
35-37 Air 5 days
10-day terminal read
Daily B. cepacia, B. gladioli
Atypical Mycobacteria
SAID 35-37 Air 24-48 h Daily S. aureus

214
Sputum
General guidance on Culture media, conditions and organisms
Clinical details/conditions
Standard media
Incubation Cultures read
Target organism(s)
Temp (oC) Atmos Time
Routine sputum samples,
NB, dilute 10 μl of sample into 5 ml water
NP and ET secretions
Blood agar
35-37 5-10% CO2
24-48 h
Routine GP samples 24 h
Daily S. pneumoniae
M. catarrhalis
S. aureus
Other organisms in pure growth may be significant.
CBAC 35-37 5-10% CO2
24-48 h Daily Haemophilus sp
Enterobacteriaceae
Pseudomonads sp.
Capnocytophagia
Culture all samples even if mucoid from all FH, RVI Critical Care and CF patients.

215
Bronchiectasis sputum
Clinical details/conditions
Supplementary media
Incubation Cultures read
Target organism(s)
Temp (oC) Atmos Time
Dilution Chocolate agar 35-37 CO2 24-48 h Daily S. pneumoniae
M. catarrhalis
S. aureus
Pseudomonas sp
Neat culture Blood agar 35-37 CO2 24-48 h Daily
S. pneumoniae
M. catarrhalis
S. aureus
Other organisms in pure growth may be significant.
CBAC 35-37 CO2 24-48 h Daily
Haemophilus sp
Enterobacteriaceae
Pseudomonads sp.
Capnocytophagia
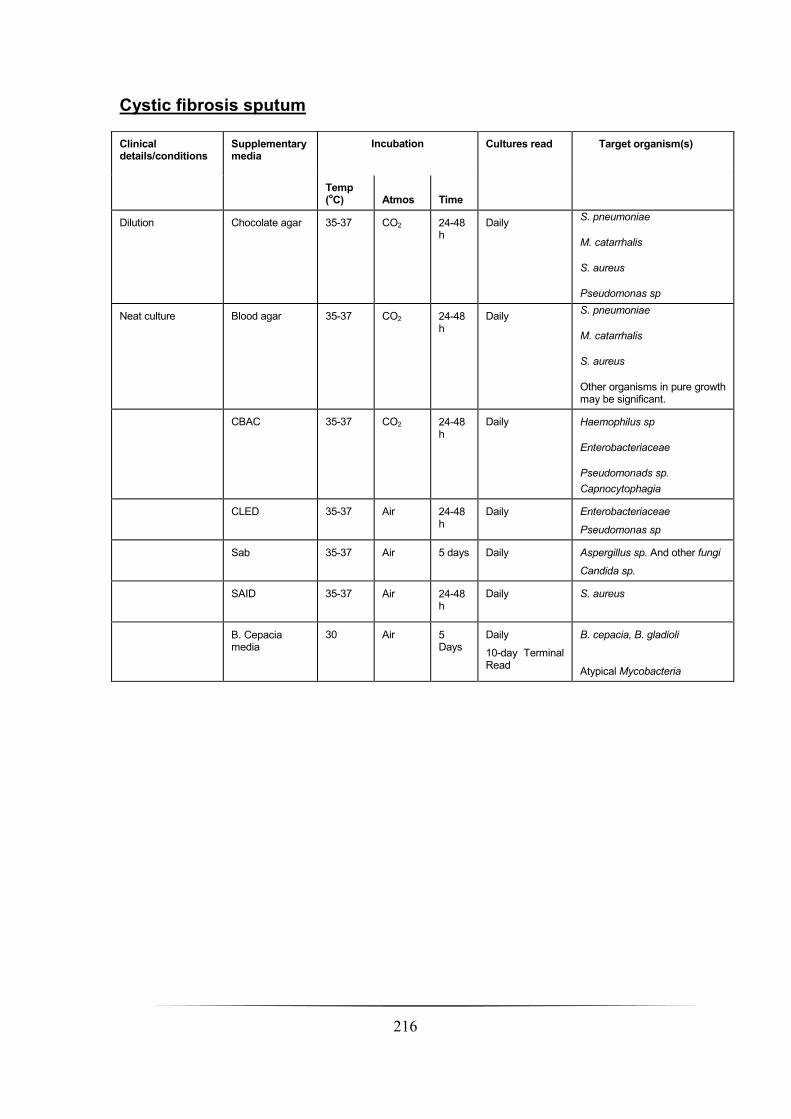
216
Cystic fibrosis sputum
Clinical details/conditions
Supplementary media
Incubation Cultures read Target organism(s)
Temp (oC) Atmos Time
Dilution Chocolate agar 35-37 CO2 24-48 h
Daily S. pneumoniae
M. catarrhalis
S. aureus
Pseudomonas sp
Neat culture Blood agar
35-37 CO2 24-48 h
Daily
S. pneumoniae
M. catarrhalis
S. aureus
Other organisms in pure growth may be significant.
CBAC
35-37 CO2 24-48 h
Daily
Haemophilus sp
Enterobacteriaceae
Pseudomonads sp.
Capnocytophagia
CLED 35-37 Air 24-48 h
Daily
Enterobacteriaceae
Pseudomonas sp
Sab 35-37 Air 5 days Daily Aspergillus sp. And other fungi
Candida sp.
SAID 35-37 Air 24-48 h
Daily
S. aureus
B. Cepacia media
30 Air 5 Days
Daily
10-day Terminal Read
B. cepacia, B. gladioli
Atypical Mycobacteria

217
Cough swabs
Clinical details/conditions
Standard media
Incubation Cultures read
Target organism(s)
Temp (oC) Atmos Time
Cough swab
Not cystic fibrosis
Blood agar
35-37 5-10% CO2
24- 48 h Daily S. pneumoniae
M. catarrhalis
S. aureus
Other organisms in pure growth may be significant
CBAC
35-37 CO2 24-48 h Daily Haemophilus sp
Enterobacteriaceae
Capnocytophagia
Pseudomonas sp.
Cystic fibrosis Cepacia media
30 Air 5 days
10 day terminal read
Daily B. cepacia
B .gladioli
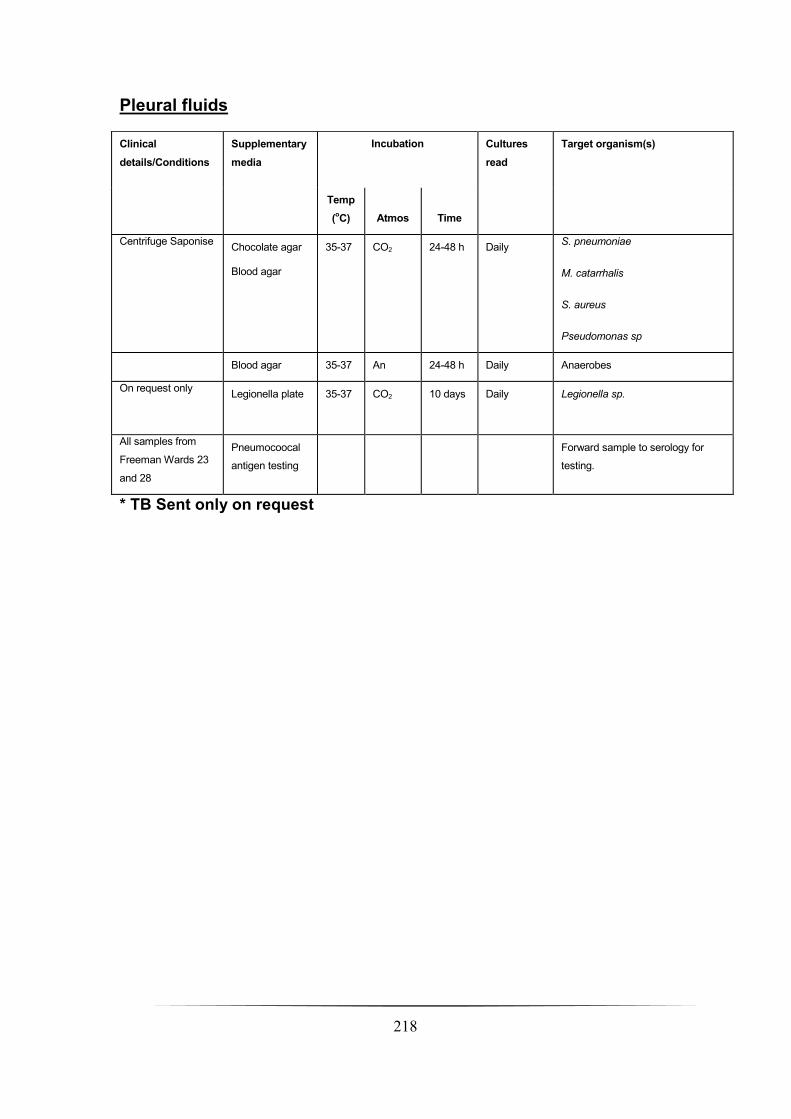
218
Pleural fluids
* TB Sent only on request
Clinical
details/Conditions
Supplementary
media
Incubation Cultures
read
Target organism(s)
Temp
(oC) Atmos Time
Centrifuge Saponise Chocolate agar
Blood agar
35-37 CO2 24-48 h Daily S. pneumoniae
M. catarrhalis
S. aureus
Pseudomonas sp
Blood agar 35-37 An 24-48 h Daily Anaerobes
On request only Legionella plate 35-37 CO2 10 days Daily
Legionella sp.
All samples from
Freeman Wards 23
and 28
Pneumocoocal
antigen testing
Forward sample to serology for
testing.
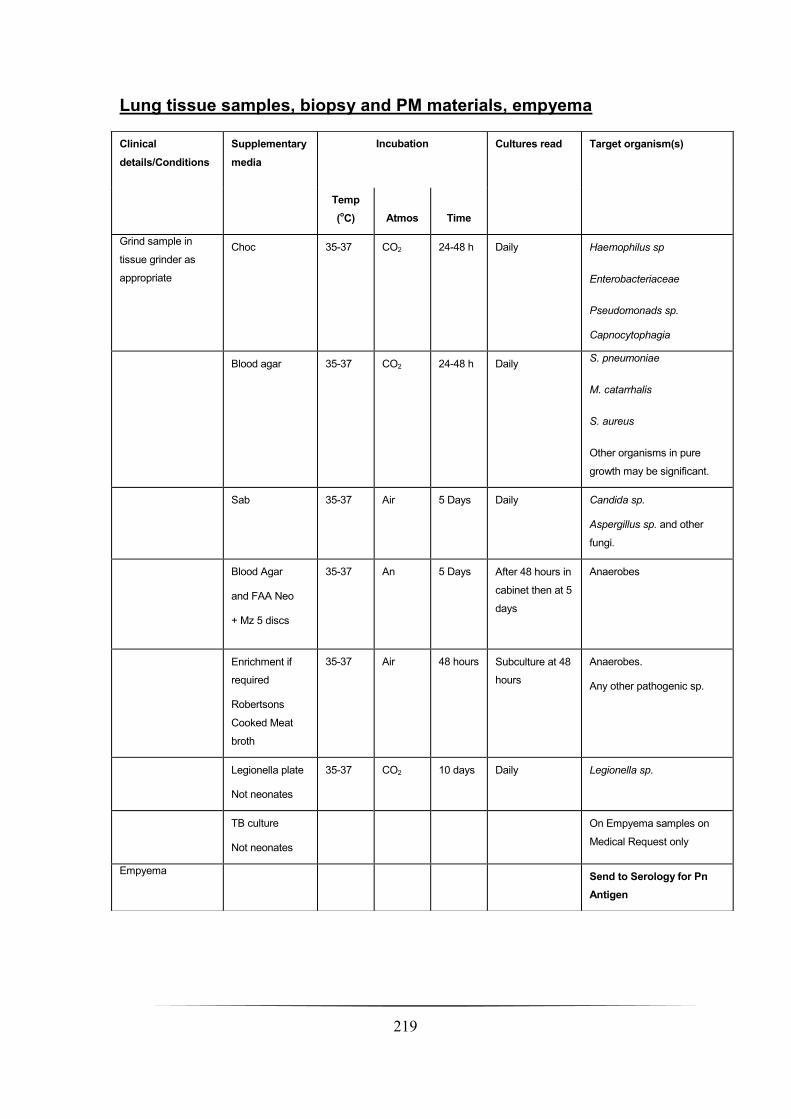
219
Lung tissue samples, biopsy and PM materials, empyema
Clinical
details/Conditions
Supplementary
media
Incubation Cultures read Target organism(s)
Temp
(oC) Atmos Time
Grind sample in
tissue grinder as
appropriate
Choc 35-37 CO2 24-48 h Daily Haemophilus sp
Enterobacteriaceae
Pseudomonads sp.
Capnocytophagia
Blood agar
35-37 CO2 24-48 h Daily
S. pneumoniae
M. catarrhalis
S. aureus
Other organisms in pure
growth may be significant.
Sab 35-37 Air 5 Days Daily
Candida sp.
Aspergillus sp. and other
fungi.
Blood Agar
and FAA Neo
+ Mz 5 discs
35-37 An 5 Days After 48 hours in
cabinet then at 5
days
Anaerobes
Enrichment if
required
Robertsons
Cooked Meat
broth
35-37 Air 48 hours Subculture at 48
hours
Anaerobes.
Any other pathogenic sp.
Legionella plate
Not neonates
35-37 CO2 10 days Daily Legionella sp.
TB culture
Not neonates
On Empyema samples on
Medical Request only
Empyema Send to Serology for Pn
Antigen
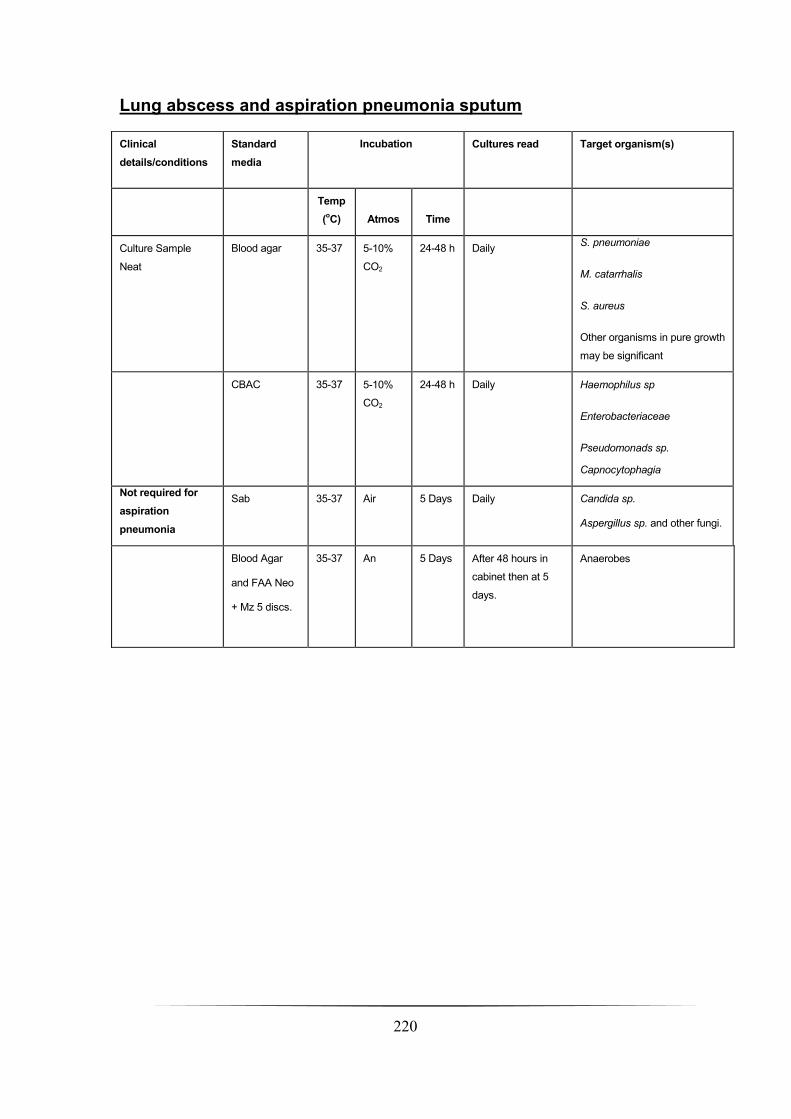
220
Lung abscess and aspiration pneumonia sputum
Clinical
details/conditions
Standard
media
Incubation Cultures read Target organism(s)
Temp
(oC) Atmos Time
Culture Sample
Neat
Blood agar
35-37 5-10%
CO2
24-48 h Daily S. pneumoniae
M. catarrhalis
S. aureus
Other organisms in pure growth
may be significant
CBAC 35-37 5-10%
CO2
24-48 h Daily Haemophilus sp
Enterobacteriaceae
Pseudomonads sp.
Capnocytophagia
Not required for
aspiration
pneumonia
Sab 35-37 Air 5 Days Daily Candida sp.
Aspergillus sp. and other fungi.
Blood Agar
and FAA Neo
+ Mz 5 discs.
35-37 An 5 Days After 48 hours in
cabinet then at 5
days.
Anaerobes

221
Transplant assessment and post lung transplant sputum
Clinical
details/Conditions
Supplementary
media
Incubation Cultures
read
Target organism(s)
Temp
(oC) Atmos Time
Culture Neat CBAC 35-37 CO2 24-48 h Daily Haemophilus sp
Enterobacteriaceae
Pseudomonads sp.
Capnocytophagia
Blood agar 35-37 CO2 24-48 h Daily
S. pneumoniae
M. catarrhalis
S. aureus
Other organisms in pure growth
may be significant
CLED 35-37 Air 24-48 h Daily
Use on CF only.
Sab agar 35-37 Air 5 Days Daily Aspergillus sp and other fungi
Culture dilute onto Chocolate agar 35-37 CO2 24-48 h Daily H. influenzae, S. pneumoniae
If CF patient add in
the following: B. cepacia
Medium
35-37 Air 5 days
10-Day
Terminal
read
Daily B. cepacia, B. gladioli
Atypical Mycobacteria
SAID 35-37 Air 24-48 Daily S.aureus
If cystic fibrosis
Tx Assessment
TB culture Forward to HPA Newcastle
If cystic fibrosis
TX assessment
B. cepacia broth 35-37 Air Plate after
48 hrs onto
B. cep.
media
Read after
72 hrs
B. cepacia
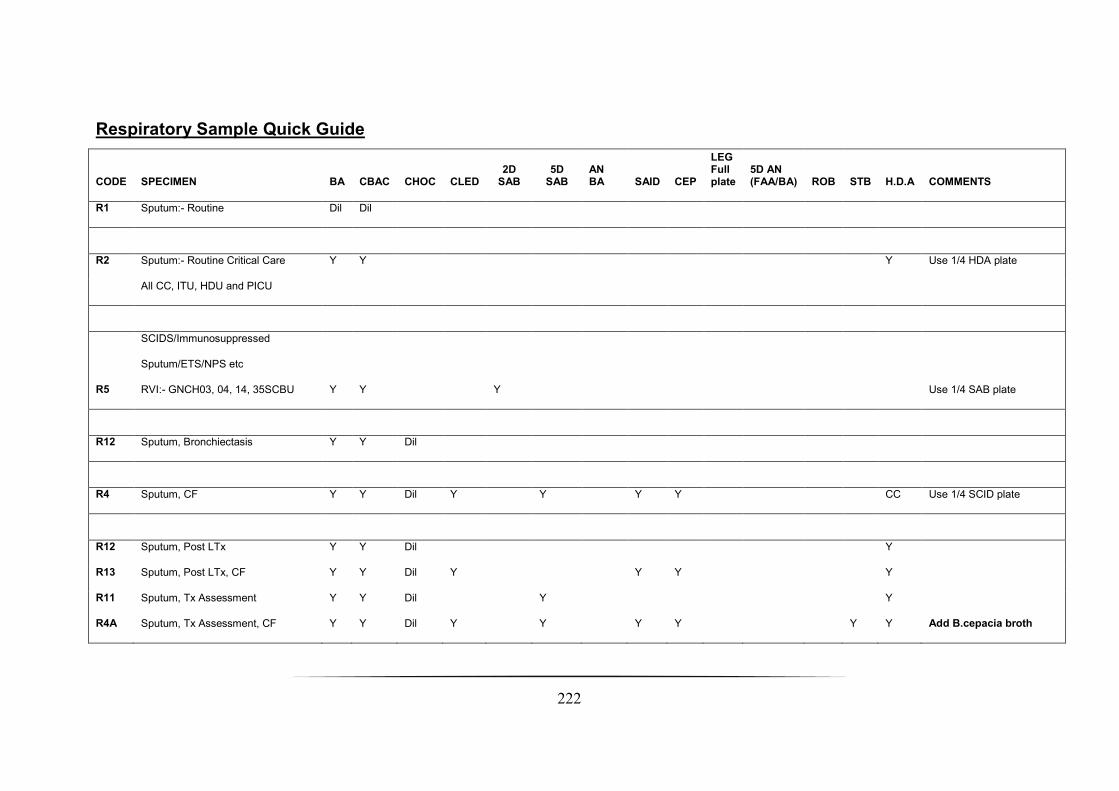
222
Respiratory Sample Quick Guide
CODE SPECIMEN BA CBAC CHOC CLED 2D
SAB 5D
SAB AN BA SAID CEP
LEG Full plate
5D AN (FAA/BA) ROB STB H.D.A COMMENTS
R1 Sputum:- Routine Dil Dil
R2 Sputum:- Routine Critical Care Y Y Y Use 1/4 HDA plate
All CC, ITU, HDU and PICU
R5
SCIDS/Immunosuppressed
Sputum/ETS/NPS etc
RVI:- GNCH03, 04, 14, 35SCBU Y Y Y Use 1/4 SAB plate
R12 Sputum, Bronchiectasis Y Y Dil
R4 Sputum, CF Y Y Dil Y Y Y Y CC Use 1/4 SCID plate
R12 Sputum, Post LTx Y Y Dil Y
R13 Sputum, Post LTx, CF Y Y Dil Y Y Y Y
R11 Sputum, Tx Assessment Y Y Dil Y Y
R4A Sputum, Tx Assessment, CF Y Y Dil Y Y Y Y Y Y Add B.cepacia broth

223
R9 Sputum, asp.pneumonia/lung abscess Y Y Y Y CC
R2 ETS/NPS Y Y CC
R2 Cough Swab Y Y Includes bronchiectasis
R6 CF Cough swabs Y Y Y Use 1/4 CEP plate for C/S
R7 Pleural Fluid Y Y Y CC < 18-John P.
R10 Pleural Fluid, Empyema Y Y Y Y Y Y Y CC All get Pn Ag < 18-John P.
R14 BAL* Y Y Y Y Y CC Gram: Donor/Recip Tx**
R17 BAL*, CF Y Y Y Y Y Y Y Y CC Gram: Donor/Recip Tx**
R8 Lung biopsy/tissue Y Y Y Y Y Y Y CC 10 day AN (Nali/BA)
R18 Neonatal death tissue Y Y Y Y
R16 Anastomosis specimens/wash Y Y Y CC
R2 Airways/bronchus swab Y Y CC
224
* BALS from the same lung can be pooled, but BALs from different lungs must be processed separately.
** Label hospital number as GDON + hospital No. and names as DONOR + surname of recipient. Inform Prof. Gould/Crit Care cover with
Gram-stain result direct sens may be required.

225
Appendix 5: COPD cohort demographic data
Phenotypic and conventional microbiology culture data
Sample number Sex Age Height (m) FEV1% predicted
GOLD stage
Ex-smoker Current smoker
BAL microbiology dataa
CS#1 M 71 1.58 43 III Y N Streptococcus pneumoniae
CS#3 M 67 1.61 49 III Y N Candida spp., & Haemophilus influenzae
CS#4 M 52 1.64 68 II Y N No pathogens isolated
CS#5 M 63 1.73 39 III N Y No pathogens isolated
CS#6 M 64 1.83 49 III Y N Chryseobacterium indologenes
CS#7 M 63 1.83 60 II Y N No pathogens isolated
CS#8 M 69 1.67 43 III N Y Moraxella catarrhalis & Haemophilus influenzae
CS#9 F 73 1.22 65 II Y N No pathogens isolated
CS#10 M 61 1.74 43 III N Y Moraxella catarrhalis
CS#11 M 62 1.73 36 III Y N No pathogens isolated
CS#12 F 70 1.61 57 II Y N No pathogens isolated a CS#11 culture data was based on a bronchial secretion sample as patient was unable to produce BAL sample.
Abbreviations: BAL, bronchoalveolar lavage; CS#X, COPD subject number; FEV1% predicted, forced expiratory volume in one second
percentage predicted; GOLD, Global Initiative for Chronic Obstructive Lung Disease.

226