download the technical guide - measuring up 2008 - national
TRANSCRIPT
TECHNICAL GUIDE FOR MEASURING UP 2008
Documenting Methodology, Indicators, and Data Sources
December 2008
The National Center for Public Policy and Higher Education

National Center Report #08-5 © 2008 by The National Center for Public Policy and Higher Education
iii
Contents
Foreword ......................................................................................................................................... v
1 Introduction ............................................................................................................................... 1 1.1 Changes Made to Measuring Up 2008 .............................................................................. 1
1.1.1 Preparation .............................................................................................................. 2 1.1.2 Participation ............................................................................................................ 2 1.1.3 Affordability ............................................................................................................ 2 1.1.4 Completion .............................................................................................................. 3 1.1.5 Benefits ................................................................................................................... 3
1.2 Scoring and Grading State Performance ............................................................................ 3 1.2.1 General Methods for Scoring and Grading ............................................................. 3 1.2.2 Measuring Change Over Time ................................................................................ 4 1.2.3 Currency of Data ..................................................................................................... 5 1.2.4 Missing Data ........................................................................................................... 5 1.2.5 Migration ................................................................................................................. 6
1.3 Graded Performance Categories ........................................................................................ 7
2 Preparation ................................................................................................................................. 8 2.1 High School Completion .................................................................................................... 9 2.2 K–12 Course Taking ........................................................................................................ 10 2.3 K–12 Student Achievement ............................................................................................. 12 2.4 Teacher Quality ................................................................................................................ 17
3 Participation ............................................................................................................................. 20 3.1 Young Adults ................................................................................................................... 20 3.2 Working-Age Adults ........................................................................................................ 22
4 Affordability ............................................................................................................................ 24 4.1 Family Ability to Pay ....................................................................................................... 25 4.2 Components of Net College Cost ..................................................................................... 28
4.2.1 Tuition and Fees .................................................................................................... 28 4.2.2 Room and Board ................................................................................................... 28 4.2.3 Federal, State/Local, and Institutional Grant Aid ................................................. 28 4.2.4 Average Financial Aid by Family Income ............................................................ 29
iv
4.2.5 Net College Cost in Each Sector ........................................................................... 29 4.2.6 The Role of Family Income .................................................................................. 29
4.3 Strategies for Affordability .............................................................................................. 31 4.4 Reliance on Loans ............................................................................................................ 34
5 Completion .............................................................................................................................. 35 5.1 Persistence ........................................................................................................................ 35 5.2 Completion ....................................................................................................................... 38
6 Benefits .................................................................................................................................... 42 6.1 Educational Achievement ................................................................................................ 43 6.2 Economic Benefits ........................................................................................................... 44 6.3 Civic Benefits ................................................................................................................... 47
7 Student Learning ..................................................................................................................... 50 7.1 Creating Learning Index Scores for Measuring Up 2008 ................................................ 50
7.1.1 Measures Used ...................................................................................................... 50 7.2 Creating Index Scores ...................................................................................................... 52
7.2.1 Literacy Measures (Proxy for Abilities of College-Educated Population) ........... 52 7.2.2 Licensure and Admissions Examinations (Proxy for College and University
Contributions to Educational Capital) ................................................................... 52 7.2.3 CLA and WorkKeys Data (Proxy for Performance of College Graduates) .......... 54
8 Non-Graded Data .................................................................................................................... 56 8.1 Other Key Facts (Reported with Graded Categories) ...................................................... 56
8.1.1 Performance Gaps by Race/Ethnicity ................................................................... 56 8.1.2 Students Enrolling in College Out-of-State (2006) ............................................... 60 8.1.3 Net Revenue Loss (2006) ...................................................................................... 61
8.2 International Comparisons ............................................................................................... 62 8.3 Additional Information (Included in State Report Cards) ............................................... 65
8.3.1 State Context ......................................................................................................... 65 8.3.2 Leading Indicators ................................................................................................. 65 8.3.3 Facts and Figures .................................................................................................. 67
About the National Center for Public Policy and Higher Education .............................................69
v
Foreword
This technical report provides complete information on the indicators presented in Measuring Up 2008, the national and state report cards on higher education. These report cards, as well as additional comparative data, are available at www.highereducation.org.
The Technical Guide describes the graded and non-graded indicators in Measuring Up 2008, explains the methodology used to calculate these indicators, and lists the sources of data. Any changes made to data and methodology for this year’s report card are also explained in detail.
Patrick Kelly, senior associate of the National Center for Higher Education Management Systems (NCHEMS), led the Measuring Up 2008 analytical team. This Technical Guide was prepared by John Clark, data analyst for NCHEMS, and Patrick Kelly. William Doyle, assistant professor of higher education at Vanderbilt University, served as a reviewer of this guide.
The National Center welcomes the comments of readers.
Joni Finney Vice President
The National Center for Public Policy and Higher Education Practice Professor, University of Pennsylvania
1
1 Introduction
This Technical Guide for Measuring Up 2008 describes the methodology and concepts used to measure and grade the performance of the 50 states in higher education.
Section 1 provides general information about the changes made since the last edition of Measuring Up in 2006, presents the methodology for grading states and measuring Change Over Time, and provides information on data collection and reporting. Sections 2 to 7 explain the indicators that comprise each of the graded categories. Specifically, these sections detail the construction of each indicator—its scope, source, and computations. Section 8 provides data sources for non-graded information—that is, those measures that are not taken into account in the final grade but are important to understanding state performance. This non-graded information includes demographic, economic, and educational characteristics of states, as well as international comparisons.
Data for all graded and non-graded indicators in Measuring Up 2008 can be downloaded from the National Center’s Web site at www.highereducation.org.
The term “higher education” is used consistently throughout the Measuring Up reports to refer to the education and training beyond high school offered by accredited degree-granting colleges and universities that are eligible for Title IV federal financial aid. Private for-profit institutions run by employers to provide specific job-related training are not included. Unless otherwise noted, the indicators used in Measuring Up refer to postsecondary education and training through the bachelor’s degree.
1.1 CHANGES MADE TO MEASURING UP 2008
Due to the availability of improved data and information, changes have been made in every Measuring Up report since its first release in 2000. For the same reasons, there are several changes and a few additions to Measuring Up 2008. The major graded categories and subcategories remain unchanged. But several indicators have been revised to improve the measurement of state performance, two measures have been added to improve categories, and two have been eliminated because recent data for them are no longer available.
The most substantial data improvements made in Measuring Up 2008 come as a result of the expansion of the U.S. Census Bureau’s American Community Survey (ACS). Since 2005, the ACS has grown to an annual sample size of three million households for the United States,

2
compared to roughly 150,000 annually for the Current Population Survey (CPS)—the source for several of the measures in previous report cards. The much larger sample size of the ACS substantially reduces the statistical error at the state level. Many of the graded measures which previously utilized the CPS are now calculated using the ACS. The more robust sample size of the ACS also has provided the capability to produce more detailed information on states for Measuring Up 2008.
Detailed descriptions of the revisions to various measures are provided in Sections 2 to 7. General descriptions within each graded category are as follows.
1.1.1 Preparation
• 18- to 24-year-olds with a high school credential. Measuring Up 2008 uses the ACS instead of the CPS.
• 12th graders taking at least one upper-level math course. This measure was eliminated due to the lack of recent data. The Council of Chief State School Officers (the source of these data) did not collect this information as they have in the past.
• 7th to 12th graders taught by teachers with a major in their subject. The 2004–05 Schools and Staffing Survey (SASS), conducted by the National Center for Education Statistics (NCES), altered the questions used for this measure from previous surveys. The measure is still provided but the results for 2008 are not comparable with those reported in 2006.
1.1.2 Participation
• 18- to 24-year-olds enrolled in college. Measuring Up 2008 uses data for enrollment by age provided by NCES (as the numerator) and the U.S. Census Bureau’s population estimates (as the denominator). The CPS was used in previous report cards.
• 25- to 49-year-olds enrolled in any type of postsecondary education with no bachelor’s degree or higher. Instead of using the CPS, Measuring Up 2008 uses data for enrollment by age provided by NCES (as the numerator) and the U.S. Census Bureau’s population estimates (as the denominator). The new measure also includes nontraditional-age students enrolled full-time. The denominator has also been changed from all 25- to 49-year-olds to 25- to 49-year-olds with no bachelor’s degrees or higher.
1.1.3 Affordability
• Percent of income (average of all income groups) needed to pay for college expenses, by sector (community colleges, public four-year institutions, and private four-year institutions). Measuring Up 2008 uses financial aid data for first-time, full-
3
time freshmen from NCES’ Integrated Postsecondary Education Data System (IPEDS), from the Student Financial Aid Survey. The ACS was used instead of the CPS to calculate family income quintiles.
1.1.4 Completion
• Certificates, degrees, diplomas at all colleges and universities per 1,000 adults with no college degree. This measure was added to gauge how well state systems of higher education are producing certificates and degrees relative to the population in need—those who have not already earned college degrees.
1.1.5 Benefits
• Adults (ages 25 to 64) with a bachelor’s degree or higher. For this measure, Measuring Up 2008 used the ACS instead of the CPS.
• Adults (ages 25 to 64) with an associate’s degree or higher. This measure was added to capture associate’s degree attainment.
• Increase in total personal income as a result of the percentage of the population with some college (including an associate’s degree), but not a bachelor’s degree. For this measure, Measuring Up 2008 used the ACS instead of the CPS.
• Increase in total personal income as a result of the percentage of the population holding a bachelor’s degree. For this measure, Measuring Up 2008 used the ACS instead of the CPS.
• Adult skill levels: literacy skills. These measures were eliminated due to the lack of recent data and information.
1.2 SCORING AND GRADING STATE PERFORMANCE
1.2.1 General Methods for Scoring and Grading
Each of the graded categories contains a number of relevant indicators. These indicators, based on nationally comparable data, represent variables that explain state performance in each category.
In every category, the performance of each state is compared to that of a benchmark state. The benchmark state is always the median among the top five states—that is, the third-highest-performing state on the indicator. Each state’s raw score is divided into the benchmark score to obtain an index score. The index for every indicator ranges from 0 (very low performance) to 100 (the score of the benchmark state). The top two states will always have scores exceeding 100.

4
Once indexed, each state score is multiplied by a predetermined “weight” that accounts for the indicator’s relative importance in predicting category performance. The value of each weight was determined by existing research documenting the significance of these variables as a measure of category performance. Although some indicators are weighted more heavily than others in a category, the sum of all assigned weights equals 100%. The specific weights assigned to each indicator are displayed in the introduction of each performance category in sections 2 to 6 of this Technical Guide.
Once the value of each indexed indicator is multiplied by the appropriate weight, the weighted indexed values are totaled. From these totaled scores, the single best performer in the category is identified. The best performer’s overall score in the category is then set to 100 and the overall scores of all other states are indexed to this. (The exception to this process occurs when the best performer’s score is more than 100. In that case, the best score is set to 100 and all other states are indexed to 100.) The result is the category index score, to which alphabetic grades are assigned for each state. The following grade scale is used (see Table 1).
Table 1. Grading Scale
Score Grade Score Grade Score Grade 93 and above A 80–82 B– 67–69 D+
90–92 A– 77–79 C+ 63–66 D
87–89 B+ 73–76 C 60–62 D–
83–86 B 70–72 C– Below 60 F
1.2.2 Measuring Change Over Time
As in previous editions, the Change Over Time arrows in Measuring Up 2008 compare each state’s current performance with its own previous performance in the 1990s. This year, however, a state’s Change Over Time is determined by its improvement or decline in performance on a key indicator in each performance category. The key indicators were selected because they are broad gauges for understanding state success in the performance areas. An “up” arrow indicates that the state has increased or remained stable on the key indicator in the category over the time period measured; a “down” arrow indicates that the state has declined on the key indicator over the time period. For most indicators, the earliest time period is the early 1990s. The National Center does not establish benchmarks for improvement or declines. However, the Change Over Time performance of the top states is depicted graphically on the second page of each state’s summary report card. Many states, but not all, have improved on these key indicators. (Affordability is different from the other categories in that lower percentages indicate higher performance.)
Below are the key indicators for each performance category and the time period used for determining the direction of the Change Over Time arrows:
5
• Preparation: 18- to 24-year-olds with a high school credential.
o Time Period: 1990 to 2006.
• Participation: 18- to 24-year-olds enrolled in college.
o Time Period: 1991 to 2007.
• Affordability: Percent of family income (average of all income groups) needed to pay for college expenses at public two- and four-year institutions.
o Time Period 1999 to 2007.
• Completion: Certificates, degrees, diplomas at all colleges and universities per 100 students enrolled.
o Time Period: 1990 to 2006.
• Benefits: Adults (ages 25 to 64) with a bachelor’s degree or higher.
o Time Period: 1990 to 2006.
In addition to the Change Over Time arrows, Measuring Up 2008 provides a more detailed graphical depiction of each state’s Change Over Time on page two of the state report card summaries. Also, historical comparison data (usually 1992) are provided in the state reports for most other indicators.
1.2.3 Currency of Data
Measuring Up uses the most recent data available. Unfortunately, collecting agencies often require months to analyze and disseminate reports to the public. In some cases, data are not systematically collected each year. It is also possible that studies do not receive authorization or funding for ongoing data collection. For one or more of these reasons, state results on the report card’s indicators may lag behind recent changes or may incompletely capture the most recent initiatives that state policymakers have implemented.
1.2.4 Missing Data
Missing data present a number of challenges to a statewide assessment such as a report card. Measuring Up 2008 continues to measure state performance using reliable and comparable state-by-state data. Despite the scientific survey methods used to collect these data, information cannot always be reported reliably for every state. This can be attributed to the fact that many surveys do not intentionally oversample populations from each of the 50 states. Thus, estimates of behaviors, characteristics, or educational performance of the populations in small states are unlikely to be captured adequately by nationally drawn random samples. In cases of nationally administered surveys such as the National Assessment of Educational Progress (NAEP) or the
6
National Assessment of Adult Literacy (NAAL), states are given the option to participate in a state oversample and may decline to take part.
To a certain extent, missing data are problematic for some categories. Nevertheless, indicators are included to gauge state performance in the report card despite cases in which data are missing for more than one state. Such indicators were retained because they capture salient policy issues and signal the necessity to expand data collection to all 50 states.
Data Imputation
To adjust for missing data, several strategies were considered and discarded. Choosing to assign a zero value to states that did not report data on specific indicators would presume the lowest possible performance. Alternatively, relying on the mean value of all states’ performance presumes similarity among states that are in fact quite distinct. Calculating a grade using only available data distorts the weighting method applied because indicators with data become more important than those without data in the calculation of the overall grade, regardless of their overall influence in determining category performance.
Consequently, where no comparable data exist to gauge a state’s performance on an individual indicator, a technique known as imputation is applied. This strategy: (1) calculates the weighted mean value of the state’s performance on the indicators within a given category for which data are available for the state and (2) applies that value where data are otherwise missing. This technique is applied to every state with missing data, using the weighted mean score of the state’s own performance. Imputing in this way presumes the state does neither better nor worse on an indicator for which it is missing data than it does on highly correlated indicators within the same category.
Latest Data Available
In cases where a state did not participate in the most recent survey but did participate previously, the report card applies the principle of using the latest data available. This means that the state’s raw scores on each indicator are derived from the most recent survey that the state participated in, not necessarily the most recently administered survey. Therefore, for several states, Measuring Up 2008 uses the scores from the previous report. In sections 2 through 6, this Technical Guide describes data availability for each indicator and identifies states for which previous data are used.
1.2.5 Migration
Interstate migration is a critical component of state performance in many of the performance categories, and its importance cannot be overstated. In the Participation and Benefits categories, for example, it would be appropriate to adjust performance measures for migration. However, this type of detailed analysis is simply not possible at the state level, given current practices of data collection. Although interstate migration is generally not accounted for in this report card
7
due to data limitations, one Participation indicator (chance for college) is able to take into account student migration across states.
1.3 GRADED PERFORMANCE CATEGORIES
Measuring Up uses six categories to gauge state performance in higher education: Preparation, Participation, Affordability, Completion, Benefits, and Learning. As with previous editions of Measuring Up, states in 2008 receive an “Incomplete” in Learning due to the lack of reported information.
The following pages detail each of the performance categories, describing each of the indicators and the weights used to determine state grades. A comprehensive catalogue of data sources, indicating collecting agency and the reference year of data, is also presented.

8
2 Preparation
The Preparation category identifies several factors that contribute to the academic preparation of students for college-level education and training. A total of 12 indicators in Preparation are grouped into four subcategories (see Table 2). All of these indicators have been updated for the 2008 report card, except for the NAEP science indicator, for which the data from the 2006 edition remain the most current.
Table 2. Preparation: Indicators and Weights
Indicator Weight
High School Completion 25%
18- to 24-year-olds with a high school credential 25%
K–12 Course Taking 30%
9th to 12th graders taking at least one upper-level math course 8.57%
9th to 12th graders taking at least one upper-level science course 12.86%
8th grade students taking algebra 8.57%
K–12 Student Achievement 35%
8th graders scoring at or above “proficient” on the national assessment exam in math 3.5%
8th graders scoring at or above “proficient” on the national assessment exam in reading 3.5%
8th graders scoring at or above “proficient” on the national assessment exam in science 3.5%
8th graders scoring at or above “proficient” on the national assessment exam in writing 3.5%
Low-income 8th graders scoring at or above “proficient” on the national assessment exam in math 3.5%
Number of scores in the top 20% nationally on SAT/ACT college entrance exam per 1,000 high school graduates
8.75%
Number of scores that are 3 or higher on an Advanced Placement subject test per 1,000 high school juniors and seniors
8.75%
Teacher Quality 10%
7th to 12th graders taught by teachers with a major in their subject 10%

9
2.1 HIGH SCHOOL COMPLETION
18- to 24-year-olds with a high school credential
Sources
Data for 2006. U.S. Bureau of the Census. 2006 American Community Survey (Public Use Microdata Samples). Calculations were done by the National Center for Higher Education Management Systems (NCHEMS).
Data for 1992. U.S. Bureau of the Census. Current Population Survey. October 1990, 1991, and 1992 Supplements. Washington, D.C. Data were provided by Pinkerton Computer Consultants, 2004.
Description
This measure uses the following calculation:
Numerator: Number of 18- to 24-year-olds in the population holding a high school credential.1
Denominator: Total population ages 18 to 24, excluding those still enrolled in high school or currently pursuing alternative certification.
Notes
For Measuring Up 2008, the Public Use Microdata Samples (PUMS) from the American Community Survey (ACS) were used instead of the Current Population Survey (CPS), which was used in previous Measuring Up reports. Beginning in 2005, the annual sample size for the ACS expanded to three million households, which is approximately 20 times larger than the sample size for the CPS. Because of the large sample size for the ACS, the 2008 edition of Measuring Up uses one year of data instead of combining three years—as was done in previous years using the CPS.
This indicator measures the extent to which the traditional-college-age young adult population in the state is minimally qualified to participate in postsecondary education. Other publicly available state-level figures (the Census, for instance) tend to be lower than the results on this indicator. This is because our denominator excludes those currently enrolled in high school, while others use the entire population ages 18 to 24 as denominator.
This indicator is not a calculation of cohort survival rate (such as the percentage of ninth graders graduating from high school in four years). Given the drop-out
1 High school credential includes a high school diploma or alternative certification such as a General Educational Development (GED) diploma.

10
and re-entry patterns of many students, a simple calculation of the high school graduation rate would fail to capture their eventual completion.
Data Availability
Data are available for all 50 states.
2.2 K–12 COURSE TAKING
9th to 12th graders taking at least one upper-level math course
Sources
Rolf K. Blank. State Indicators of Science and Mathematics Education 2005: State-by-State Trends and New Indicators from the 2005–06 School Year. Washington, D.C.: Council of Chief State School Officers, 2005.
The data for the early 1990s are from Rolf K. Blank and Doreen Gruebel. State Indicators of Science and Mathematics Education 1993: State and National Trends—New Indicators from the 1991–92 School Year. Washington, D.C.: Council of Chief School Officers, 1993, p. 18.
Description
This indicator measures the percentage of public high school students in the state in grades 9 to 12 who took one or more math courses at levels 2 through 5 during the 2005–06 school year. These math courses include geometry, algebra 2, trigonometry, pre-calculus, and calculus.
Notes
Louisiana’s data from the early 1990s are for the 1989–90 school year.
Although high school humanities subject course taking is also important to students’ preparation, neither the Council of Chief State School Officers (CCSSO) nor any other organization collects these types of data comparably from the states.
Data Availability
Data are available for 29 states, including Florida, Nebraska, and Nevada, for which the latest data available method was applied: That is, because these states had participated previously (in 2003–04) but did not participate in the most recent survey, their data from earlier Measuring Up reports were used. Data prior to 2003–04 were not used.

11
The 21 states for which data are unavailable are: Alabama, Alaska, Arizona, Colorado, Connecticut, Delaware, Georgia, Illinois, Kansas, Kentucky, Maine, Maryland, Massachusetts, Montana, New Hampshire, New Jersey, Oregon, Rhode Island, Vermont, Virginia, and Washington.
9th to 12th graders taking at least one upper-level science course
Sources
Rolf K. Blank. State Indicators of Science and Mathematics Education 2005: State-by-State Trends and New Indicators from the 2003–04 School Year. Washington, D.C.: Council of Chief State School Officers, 2005.
The data for the early 1990s are from Rolf K. Blank and Doreen Gruebel. State Indicators of Science and Mathematics Education 1993: State and National Trends—New Indicators from the 1991–92 School Year. Washington, D.C.: Council of Chief School Officers, 1993, p. 22.
Description
A separate but similar indicator to math course taking, science course taking measures the extent to which high school students in the state were enrolled in one or more of the following science courses during the 2003–04 school year: chemistry or physics, second-year biology, AP biology, second-year earth science, or other advanced science courses.
Note
Although high school humanities subject course taking is also important to students’ preparation, neither the CCSSO nor any other organization collects these types of data comparably from the states.
Data Availability
Data are available for 29 states, including Florida, Nebraska, and Nevada, for which the latest data available method was applied: That is, because these states had participated previously (in 2003–04) but did not participate in the most recent survey, their data from earlier Measuring Up reports were used. Data prior to 2003–04 were not used.
The 21 states for which data are unavailable are: Alabama, Alaska, Arizona, Colorado, Connecticut, Delaware, Georgia, Illinois, Kansas, Kentucky, Maine, Maryland, Massachusetts, Montana, New Hampshire, New Jersey, Oregon, Rhode Island, Vermont, Virginia, and Washington.

12
8th grade students taking algebra
Sources
State Indicators of Science and Mathematics Education 2007.Washington, D.C.: Council of Chief State School Officers (CCSSO), 2007. Based on data from NCES, National Assessment of Educational Progress (NAEP) 2003, 2005 Mathematics Assessments.
Description
This indicator measures the percentage of public school eighth grade students in the state who took algebra 1 during the 2004–05 school year.
Data Availability
Data are available from 49 states. Alaska is the only state that did not report data for this measure. Data from Measuring Up 2008 are not comparable to previous Measuring Up reports due to a change in data sources. In previous reports, CCSSO collected and provided the data. However, CCSSO currently relies on NAEP for its data.
2.3 K–12 STUDENT ACHIEVEMENT
8th graders scoring at or above “proficient” on the national assessment exam in math
Sources
National Assessment of Educational Progress. The Nation’s Report Card, Mathematics 2007 and 1992. Washington, D.C.: U.S. Department of Education. http://nces.ed.gov/nationsreportcard/.
Description
This math proficiency rate is measured as the percentage of public school eighth graders whose performance on the National Assessment of Educational Progress (NAEP) in math was “proficient” or “advanced.”
Note
Academic proficiency levels are determined by the National Assessment Governing Board, based on judgments about what students should know and be able to do.
13
Data Availability
All 50 states are reported for 2007. In measuring improvement over time, data from the 1990 assessments were used for Illinois, Montana, and Oregon.
8th graders scoring at or above “proficient” on the national assessment exam in reading
Sources
National Assessment of Educational Progress. The Nation’s Report Card, Reading 2007 and 1998. Washington, D.C.: U.S. Department of Education. http://nces.ed.gov/nationsreportcard/.
Description
These proficiency rates measure the percentage of eighth graders enrolled in public school whose performance on the National Assessment of Educational Progress (NAEP) in reading was “proficient” or “advanced.”
Notes
Academic proficiency levels are determined by the National Assessment Governing Board, based on judgments about what students should know and be able to do. The reading assessment at the state level began in 1998 and thus data from 1998 to 2007 were used to measure improvement over time.
Data Availability
All 50 states are reported for 2007.
8th graders scoring at or above “proficient” on the national assessment exam in science
Sources
National Assessment of Educational Progress. The Nation’s Report Card, Science 2005 and 1996. Washington, D.C.: U.S. Department of Education. http://nces.ed.gov/nationsreportcard/.
Description
This indicator measures the percentage of public school eighth graders whose performance on the National Assessment of Educational Progress (NAEP) in science was “proficient” or “advanced.”

14
Notes
This exam has not been administered since 2005. Therefore, the same data that were used in Measuring Up 2006 are used in Measuring Up 2008.
Academic proficiency levels are determined by the National Assessment Governing Board, based on judgments about what students should know and be able to do. NAEP science assessments began in 1996 and thus data from 1996 to 2005 were used to measure improvement over time.
Data Availability
Data are available for 48 states. Data are missing for Kansas and Pennsylvania.
8th graders scoring at or above “proficient” on the national assessment exam in writing
Sources
National Assessment of Educational Progress. The Nation’s Report Card, Writing 2007 and 1998. Washington, D.C.: U.S. Department of Education. http://nces.ed.gov/nationsreportcard/.
Description
This measure indicates the percentage of eighth graders enrolled in public school whose performance on the National Assessment of Educational Progress (NAEP) in writing was “proficient” or “advanced.”
Notes
Academic proficiency levels are determined by the National Assessment Governing Board, based on judgments about what students should know and be able to do. Data for 1998 and 2007 were used to measure improvement over time.
Data Availability
Data are available for 48 states. Data are missing for Alaska and South Dakota.
Low-income 8th graders scoring at or above “proficient” on the national assessment exam in math
Sources
National Assessment of Educational Progress. The Nation’s Report Card, Mathematics 2007 and 1996. Washington, D.C.: U.S. Department of Education. http://nces.ed.gov/nationsreportcard/.
15
Description
This indicator measures the percentage of public school eighth graders who are eligible for free or reduced-price lunch and whose performance on the National Assessment of Educational Progress (NAEP) in math was “proficient” or “advanced.”
Notes
Academic proficiency levels are determined by the National Assessment Governing Board, based on judgments about what students should know and be able to do. Improvement over time was measured from 1996 to 2007.
Data Availability
All 50 states participated in the 2007 assessment.
Number of scores in the top 20% nationally on SAT/ACT college entrance exam per 1,000 high school graduates
Sources
The College Board. “College-Bound Senior Data Sets—SAT Composite Scores,” 2007 and 1993. Unpublished data obtained from the College Board.
ACT. Frequency and percentage of students who had ACT composite scores at or above 25 in 2007. http://www.act.org/news/data/07/statemenu.html. The data from 1993 are unpublished data obtained from the ACT.
Public and private high school graduates, 2006–07 and 1992–93. Western Interstate Commission for Higher Education. Knocking at the College Door: Projections of High School Graduates by State, Income and Race/Ethnicity. Boulder, CO: 2008.
Description
This indicator reflects the prevalence of college entrance exam-taking throughout the state as well as the achievement level of the students who took these tests. The high achievement level on the college entrance exams demonstrated by recent high school graduates is calculated using the following formula:
Numerator: (Number of scores at or above 1780 on SAT II [verbal, math, and writing] test) + (Number of scores at or above 25 on ACT test).
Denominator: Number of public and private high school graduates in a given year.

16
Notes
The SAT data for 2007 include the new writing exam. The 80th percentile nationally was 1780. In previous years, a score of 1200 (verbal and math only) was used as the 80th percentile.
The 80th percentile for ACT Composite scores dropped to 25 (from 26 in previous years). This is due to several states mandating the administration of the ACT to all high school students (e.g. Illinois and Colorado). As a result, more students in these states will score at or above the 80th percentile—yielding fairly dramatic improvements over previous years.
Data Availability
Data are available for all 50 states.
Number of scores that are 3 or higher on an Advanced Placement subject test per 1,000 high school juniors and seniors
Sources
The College Board. 2007 State and National Annual Summary Reports. New York. www.collegeboard.com/student/testing/ap/exgrd_sum/2007.html. “The number of scores of 3 or above, 1993, by state,” unpublished data obtained from the College Board.
Description
This indicator measures the number of Advanced Placement subject tests taken by 11th and 12th grade students with scores of 3 or higher per 1,000 11th and 12th grade students enrolled in public and private schools. The measure uses the following calculation:
Numerator: Number of 11th and 12th graders’ Advanced Placement subject test scores of 3, 4, or 5.
Denominator: Total number of 11th and 12th graders enrolled in public and private schools.2
Notes
This ratio does not provide information on the number of students in each state who take an advanced placement test. Instead, the numerator measures the total
2 The number of 11th and 12th graders enrolled in public and private schools was computed by multiplying the public enrollment by a private-enrollment adjustment factor developed by a data contractor working with the College Board. The majority of AP test-takers are enrolled in these grades.

17
number of scores at or above 3. Constructed this way, the measure accounts for individual students who perform proficiently on more than one AP subject test. Scores at or above 3 are generally recognized for college credit.
Opportunities other than AP exist for high school students to take college-level courses, including the International Baccalaureate (IB) program and college concurrent enrollment programs. The Advanced Placement program offered by the College Board is the most prevalent in U.S. high schools and the most widely recognized for credit by policymakers and colleges and universities.
Data Availability
Data are available for all 50 states.
2.4 TEACHER QUALITY
7th to 12th graders taught by teachers with a major in their subject
Sources
National Center for Education Statistics. Schools and Staffing Survey (SASS), 2003–2004. Washington D.C.: U.S. Department of Education. Thomas M. Smith (Associate Professor of Public Policy and Education, Vanderbilt University) assisted in designing the indicator and provided state-level analysis and data.
Description
This indicator measures the percentage of secondary school students taught by teachers who have an undergraduate or graduate major in the subject of the course taught during the 2003–04 school year. Adequately qualified teachers, especially at the secondary education level and in the core academic fields, ought to be knowledgeable about the subject that they teach. The completion of a college degree in the subject field is indicative of possessing minimum subject knowledge required to be a qualified teacher.
Notes
The measure looks at public school students enrolled in core academic fields—mathematics, English, social studies, and science. Only departmentalized teachers are included; teachers who teach multiple subjects to the same class all day, as common in elementary schools, are excluded. In addition, this indicator does not cover students taught by two or more teachers who are jointly responsible for teaching a single group of students in the same class at the same time (that is, team teaching). Data on courses taught, number of students enrolled, and degree major are based on teachers’ self reports.
18
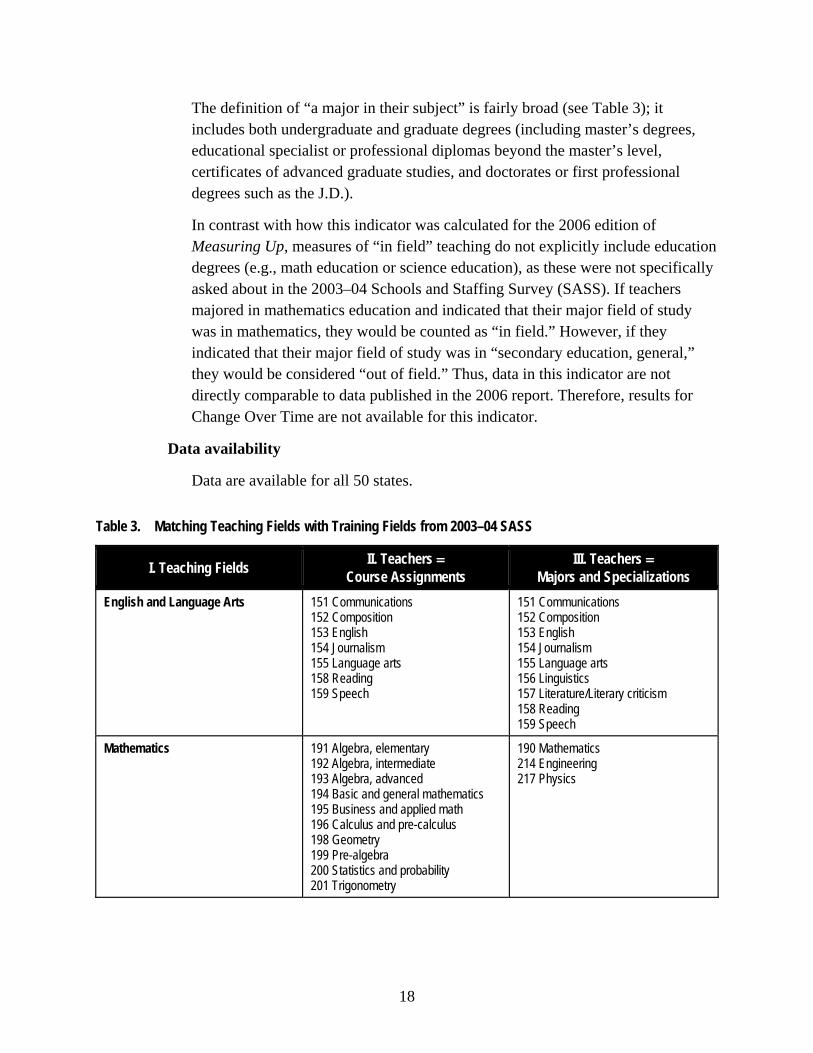
The definition of “a major in their subject” is fairly broad (see Table 3); it includes both undergraduate and graduate degrees (including master’s degrees, educational specialist or professional diplomas beyond the master’s level, certificates of advanced graduate studies, and doctorates or first professional degrees such as the J.D.).
In contrast with how this indicator was calculated for the 2006 edition of Measuring Up, measures of “in field” teaching do not explicitly include education degrees (e.g., math education or science education), as these were not specifically asked about in the 2003–04 Schools and Staffing Survey (SASS). If teachers majored in mathematics education and indicated that their major field of study was in mathematics, they would be counted as “in field.” However, if they indicated that their major field of study was in “secondary education, general,” they would be considered “out of field.” Thus, data in this indicator are not directly comparable to data published in the 2006 report. Therefore, results for Change Over Time are not available for this indicator.
Data availability
Data are available for all 50 states.
Table 3. Matching Teaching Fields with Training Fields from 2003–04 SASS
I. Teaching Fields II. Teachers =
Course Assignments III. Teachers =
Majors and Specializations
English and Language Arts 151 Communications 152 Composition 153 English 154 Journalism 155 Language arts 158 Reading 159 Speech
151 Communications 152 Composition 153 English 154 Journalism 155 Language arts 156 Linguistics 157 Literature/Literary criticism 158 Reading 159 Speech
Mathematics 191 Algebra, elementary 192 Algebra, intermediate 193 Algebra, advanced 194 Basic and general mathematics 195 Business and applied math 196 Calculus and pre-calculus 198 Geometry 199 Pre-algebra 200 Statistics and probability 201 Trigonometry
190 Mathematics 214 Engineering 217 Physics

19
I. Teaching Fields II. Teachers =
Course Assignments III. Teachers =
Majors and Specializations
Social Studies 220 Social studies, general 221 Anthropology 225 Economics 226 Geography 227 Government/Civics 228 History 231 Native American studies 233 Psychology 234 Sociology
221 Anthropology 222 Area/Ethnic studies (excluding Native American studies) 223 Criminal justice 224 Cultural studies 225 Economics 226 Geography 227 Government/Civics 228 History 229 International studies 230 Law 231 Native American studies 232 Political Science 233 Psychology 234 Sociology 235 Other social sciences
Science 210 Science, general 211 Biology/Life sciences 212 Chemistry 213 Earth sciences 215 Integrated science 216 Physical science 217 Physics
211 Biology/Life sciences 212 Chemistry 213 Earth sciences 216 Physical science 217 Physics 218 Other natural sciences

20
3 Participation
The Participation category assesses the opportunities in each state for residents to enroll in postsecondary education.
To broadly assess state performance in this category, various enrollment patterns and institution types are considered. These include full- and part-time enrollment at both two- and four-year institutions, and public and private colleges. Due to the lack of nationally comparable data, however, participation in non-accredited institutions, corporate, or employer-sponsored education or training programs is not included.
The three indicators in Participation are divided into two subcategories: participation of young adults and working-age adults (see Table 4).
Table 4. Participation: Indicators and Weights
Indicator Weight
Young Adults 66.67%
Chance for college by age 19 33.33%
18- to 24-year-olds enrolled in college 33.33%
Working-Age Adults 33.33%
25- to 49-year-olds enrolled in any type of postsecondary education with no bachelor’s degree or higher
33.33%
Note: The three indicators in this category have equal weight.
3.1 YOUNG ADULTS
Chance for college by age 19
Sources
Thomas Mortenson. “Chance for College by Age 19 by State in 2006” and “Chance for College by Age 19 by State in 1992.” Postsecondary Education Opportunity Web site accessible to subscribers, http://www.postsecondary.org/.

21
Description
This indicator measures the probability that ninth grade students will finish high school within four years and go on to college immediately after high school (when most students are approximately age 19). To calculate this measure, the high school completion rate is multiplied by the college continuation rate. The following formulas describe the components of this calculation.
High School Completion Rate:3
Numerator: Number of public high school graduates in 2006.
Denominator: Number of public school ninth graders in 1999.
College Continuation Rate:3
Numerator: Number of college freshmen in fall 2006.
Denominator: Number of public high school graduates in 2006.
This indicator adjusts for interstate migration by using the NCES residence and migration survey, which follows high school graduates to the institutions they choose to attend. Since many students pursue their college education out-of-state, the calculation relates college freshmen (by state of residency) to the state data on high school graduates.
Notes
This is a synthetic cohort statistic that cannot adjust for students’ out-of-state migration during the high school years. No nationally comparable longitudinal data exist that precisely measure the college-going rate of ninth grade students in each state.
Data Availability
Data are available for all 50 states.
18- to 24-year-olds enrolled in college
Sources
Data for 2007. National Center for Education Statistics. Integrated Postsecondary Education Data System (IPEDS) 2007 Fall Enrollment Survey. U.S. Bureau of the Census, Population Estimates, July 2007.
3 Data for all components are from National Center for Education Statistics, Washington, D.C.: U.S. Department of Education.
22
Data for 1991. National Center for Education Statistics. Integrated Postsecondary Education Data System (IPEDS) 1991 Fall Enrollment Survey. U.S. Bureau of the Census, 1990 Decennial Census (Public Use Microdata Samples).
Description
This indicator reports the percentage of 18- to 24-year-old adults who are currently enrolled in education or training programs at Title IV degree-granting colleges and universities (including both full- and part-time enrollment) as a percentage of all 18- to 24-year-olds. The indicator is calculated using the following formula:
Numerator: Number of adults ages 18 to 24 currently enrolled in postsecondary education (Title IV degree-granting institutions).
Denominator: Total number of adults ages 18 to 24.
Notes
For Measuring Up 2008, data from NCES (numbers of 18- to 24-year-olds enrolled) and the U.S. Census Bureau (total numbers of 18- to-24-year-olds) were used instead of the Current Population Survey (CPS), which was the source used in previous Measuring Up reports. The new sources were used because of their larger sample size.
Data Availability
Data are available for all 50 states.
3.2 WORKING-AGE ADULTS
25- to 49-year-olds enrolled in any type of postsecondary education with no bachelor’s degree or higher
Sources
Data for 2007. National Center for Education Statistics. Integrated Postsecondary Education Data System (IPEDS) 2007 Fall Enrollment Survey. U.S. Bureau of the Census. 2006 American Community Survey (Public Use Microdata Samples).
Data for 1991. National Center for Education Statistics. Integrated Postsecondary Education Data System (IPEDS) 1991 Fall Enrollment Survey. U.S. Bureau of the Census, 1990 Decennial Census (Public Use Microdata Samples).
23
Description
This indicator reports the percentage of 25- to 49-year-old adults who are currently enrolled in education or training programs at Title IV degree-granting colleges and universities (including both full- and part-time enrollment) as a percentage of 25- to 49-year-olds without a bachelor’s degree or higher. The indicator is calculated using the following formula:
Numerator: Number of adults ages 25 to 49 currently enrolled in postsecondary education (Title IV degree-granting institutions).
Denominator: Number of adults ages 25 to 49 without a bachelor’s degree or higher.
Notes
This measure was revised to incorporate more reliable data and an improved metric for participation of the nontraditional-age student population. For Measuring Up 2008, data from NCES (numbers of 25- to 49-year-olds enrolled) and the U.S. Census Bureau (25- to 49-year-olds without a bachelor’s degree) were used instead of the Current Population Survey (CPS), which was the source used in previous Measuring Up reports. The new sources were used to help minimize the standard error associated with the CPS. For these older adults, the new data provide the ability to remove highly educated adults (that is, those with a bachelor’s degree or higher) from the denominator, since highly educated adults would not be expected to be enrolled in postsecondary education. The result is a more appropriate measure of participation relative to the population in need.
Data Availability
Data are available for all 50 states.
24
4 Affordability
Affordability is based on three concepts (see Table 5):
• Students’ and families’ ability to pay for college, given the type of institution they attend, the financial aid they receive, and their income;
• The amount of need-based grant assistance they receive to offset institutional costs (tuition, fees, and room and board); and
• The loan burden associated with institutional costs.
The six indicators included in this category combine data from a variety of sources. Together, they calculate a reasonable estimate of the net costs that students and families in a state pay for higher education, as well as the extent to which each state employs policies to make college education more affordable for students and families in the state.
Currently, there are no comprehensive, student-level, comparable state data sources that capture net institutional cost for higher education. As a result, the Affordability category uses best estimates to assess the extent to which college is affordable for residents of varying income levels in each state.
As with the 2006 edition, the Affordability category in Measuring Up 2008 benchmarks state performance against the best performance in 1992, with the exception of the family ability-to-pay indicators, which are now benchmarked against 1999 performance. Using a historical benchmark enables us to measure states on a more stable and reliable standard, and thus, grades better reflect actual performance and improvement or decline over time.
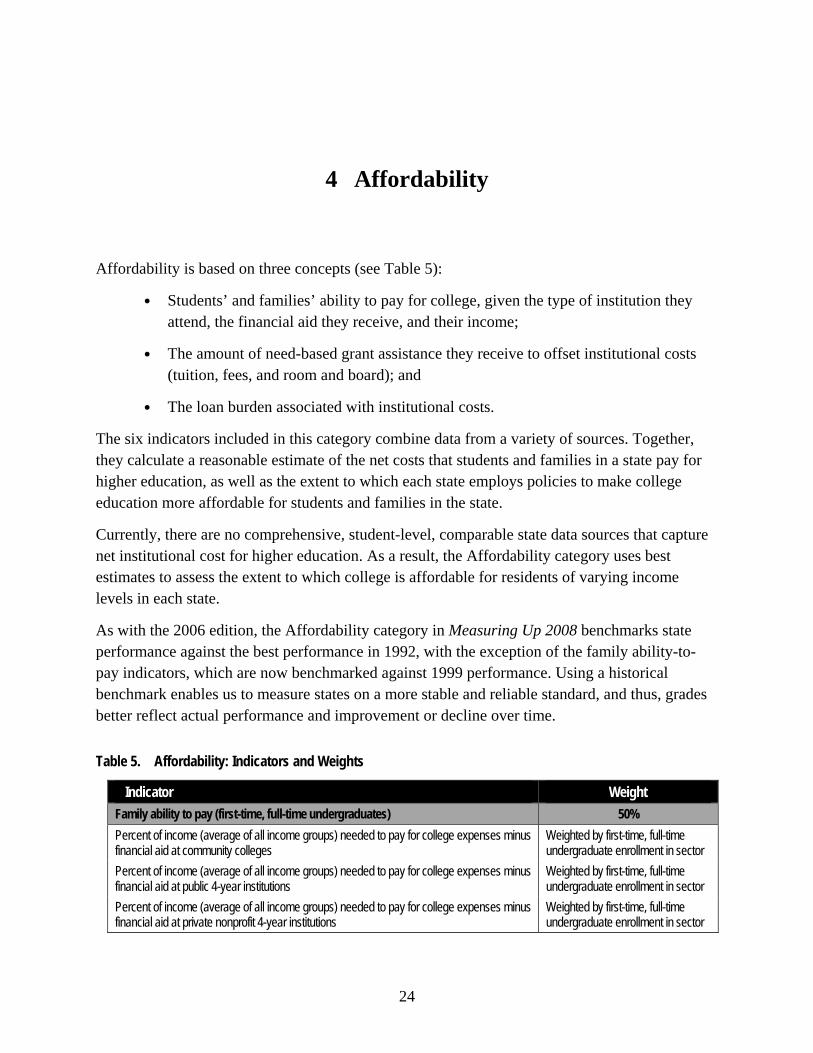
Table 5. Affordability: Indicators and Weights
Indicator Weight
Family ability to pay (first-time, full-time undergraduates) 50%
Percent of income (average of all income groups) needed to pay for college expenses minus financial aid at community colleges
Weighted by first-time, full-time undergraduate enrollment in sector
Percent of income (average of all income groups) needed to pay for college expenses minus financial aid at public 4-year institutions
Weighted by first-time, full-time undergraduate enrollment in sector
Percent of income (average of all income groups) needed to pay for college expenses minus financial aid at private nonprofit 4-year institutions
Weighted by first-time, full-time undergraduate enrollment in sector
25
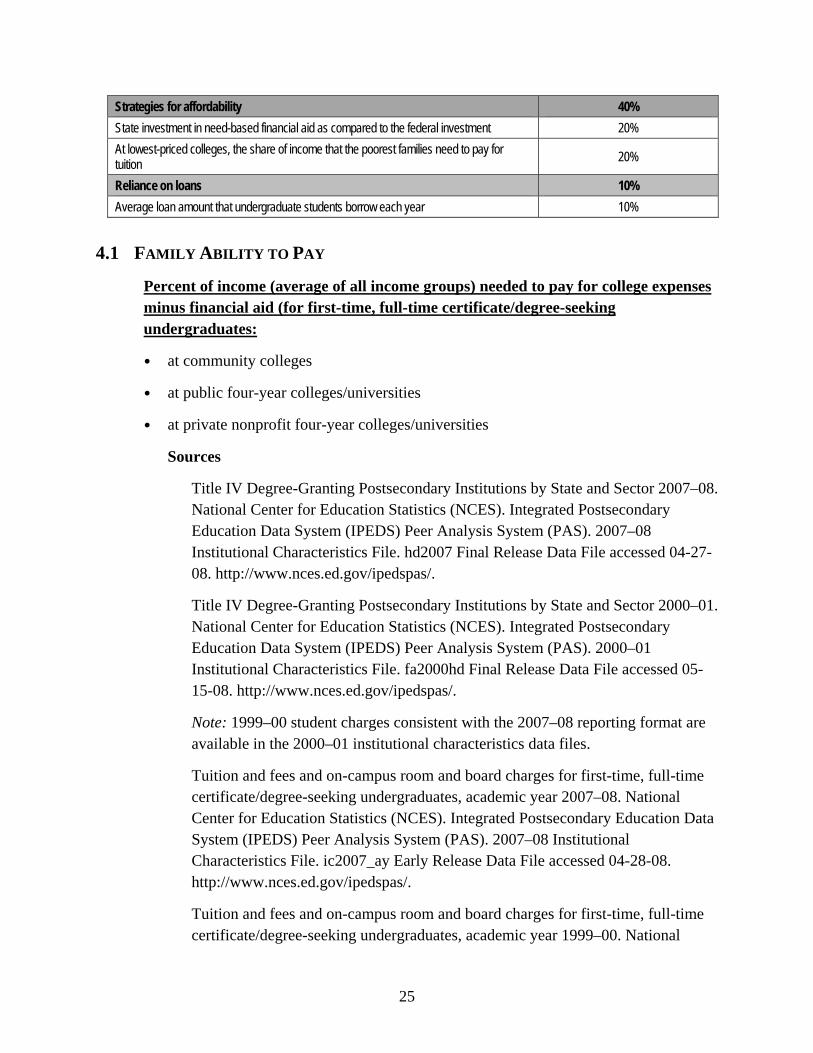
Strategies for affordability 40%
State investment in need-based financial aid as compared to the federal investment 20%
At lowest-priced colleges, the share of income that the poorest families need to pay for tuition
20%
Reliance on loans 10%
Average loan amount that undergraduate students borrow each year 10%
4.1 FAMILY ABILITY TO PAY
Percent of income (average of all income groups) needed to pay for college expenses minus financial aid (for first-time, full-time certificate/degree-seeking undergraduates:
• at community colleges
• at public four-year colleges/universities
• at private nonprofit four-year colleges/universities
Sources
Title IV Degree-Granting Postsecondary Institutions by State and Sector 2007–08. National Center for Education Statistics (NCES). Integrated Postsecondary Education Data System (IPEDS) Peer Analysis System (PAS). 2007–08 Institutional Characteristics File. hd2007 Final Release Data File accessed 04-27-08. http://www.nces.ed.gov/ipedspas/.
Title IV Degree-Granting Postsecondary Institutions by State and Sector 2000–01. National Center for Education Statistics (NCES). Integrated Postsecondary Education Data System (IPEDS) Peer Analysis System (PAS). 2000–01 Institutional Characteristics File. fa2000hd Final Release Data File accessed 05-15-08. http://www.nces.ed.gov/ipedspas/.
Note: 1999–00 student charges consistent with the 2007–08 reporting format are available in the 2000–01 institutional characteristics data files.
Tuition and fees and on-campus room and board charges for first-time, full-time certificate/degree-seeking undergraduates, academic year 2007–08. National Center for Education Statistics (NCES). Integrated Postsecondary Education Data System (IPEDS) Peer Analysis System (PAS). 2007–08 Institutional Characteristics File. ic2007_ay Early Release Data File accessed 04-28-08. http://www.nces.ed.gov/ipedspas/.
Tuition and fees and on-campus room and board charges for first-time, full-time certificate/degree-seeking undergraduates, academic year 1999–00. National
26
Center for Education Statistics (NCES). Integrated Postsecondary Education Data System (IPEDS) Peer Analysis System (PAS). 2000–01 Institutional Characteristics File. ic2000_ay Final Release Data File accessed 05-15-08. http://www.nces.ed.gov/ipedspas/.
Note: Student charges for academic year 1999–00 are included in the 2000–01 institutional characteristics data files.
Fall 2006 first-time, full-time certificate/degree-seeking enrollments by institution were used for calculating:
(1) weighted averages of state- and sector-level tuition and fees, and on-campus room and board charges for academic year 2007–08.
(2) final sector-weighted ability-to-pay scores for academic year 2007–08.
National Center for Education Statistics (NCES). Integrated Postsecondary Education Data System (IPEDS) Peer Analysis System (PAS). Fall 2006 Enrollment File. ef2006a Early Release Enrollment File accessed 12-21-07. http://www.nces.ed.gov/ipedspas/.
Note: Fall 2007 enrollments were not available in time for use in the 2007–08 cost analysis.
Fall 1999 first-time, full-time certificate/degree-seeking enrollments by institution were used for calculating:
(1) weighted averages of state- and sector-level tuition and fees, and on-campus room and board charges for academic year 1999–00.
(2) final sector-weighted ability-to-pay scores for academic year 1999–00.
National Center for Education Statistics (NCES). Integrated Postsecondary Education Data System (IPEDS) Peer Analysis System (PAS). Fall 1999 Enrollment File. ef99_anr Final Release Enrollment File accessed 05-16-08. http://www.nces.ed.gov/ipedspas/.
Federal, state/local, and institutional grant aid awarded to first-time, full-time certificate/degree-seeking undergraduates, academic year 2006–07. National Center for Education Statistics (NCES). Integrated Postsecondary Education Data System (IPEDS) Peer Analysis System (PAS). Academic Year 2006–07 Student Financial Aid File. sfa0607 Early Release Student Financial Aid File accessed 07-22-08. http://www.nces.ed.gov/ipedspas/.
Note: Student financial aid data for academic year 2007–08 were not available in time for use in the 2007–08 cost analysis.
27
Federal, state/local, and institutional grant aid awarded to first-time, full-time certificate/degree-seeking undergraduates, academic year 1999–00. National Center for Education Statistics (NCES). Integrated Postsecondary Education Data System (IPEDS) Peer Analysis System (PAS). Academic Year 1999–00 Student Financial Aid File. sfa9900s Final Release Student Financial Aid File accessed 05-15-08. http://www.nces.ed.gov/ipedspas/.
Federal, state, and institutional grant aid distribution for dependent first-time, full-time undergraduates by sector and income quintile, 2003–04. U.S. Department of Education, National Center for Education Statistics, 2003–04 National Postsecondary Student Aid Study (NPSAS:04). Computation by DAS-T Online Version 5.0 on 5/1/2008 by Brian Prescott at the Western Interstate Commission for Higher Education (WICHE).
Median family income by income quintile, 2006. Steven Ruggles, Matthew Sobek, Trent Alexander, Catherine A. Fitch, Ronald Goeken, Patricia Kelly Hall, Miriam King, and Chad Ronnander. Integrated Public Use Microdata Series: Version 4.0 [Machine-readable database]. Minneapolis, MN: Minnesota Population Center [producer and distributor], 2008. http://usa.ipums.org/usa/. Data based on the U.S. Census Bureau’s 2006 American Community Survey (Public Use Microdata Sample).
Description
College affordability is based on institutional cost, student grant aid awarded, and students’ personal or family income. The ability-to-pay indicator examines these important factors given: (1) the variation in the percentage of personal income that families of different means must pay to meet college costs, and (2) the variations in price across the public/private and two- and four-year sectors.
To assess state performance reliably and comparably, this indicator is based on a series of calculations that use a combination of national- and state-level data. The first set of calculations determines the approximate net cost of college attendance (defined as tuition, fees, and room and board minus federal, state/local, and institutional grant aid). The second set of calculations relates this net cost to families’ annual income and takes into account the share of total enrollment at each of the major sectors in higher education in the state: community colleges, public four-year colleges and universities, and private nonprofit four-year colleges and universities.
28
4.2 COMPONENTS OF NET COLLEGE COST
4.2.1 Tuition and Fees
The average tuition and fees for in-state residents (in-district for public two-year colleges) are calculated by state for each of the major sectors in higher education: community colleges, public four-year colleges and universities, and private nonprofit four-year colleges and universities. This calculation assumes average tuition and fees for each sector charged to first-time, full-time undergraduates.
4.2.2 Room and Board
The federal government adds the cost of housing, food, and other necessary living expenses to tuition and fees when determining a student’s cost of attendance at a particular institution. This indicator calculates average room and board fees for first-time, full-time undergraduates by state and sector of institution. On-campus room and board charges are reported for public four-year and private nonprofit four-year institutions in the Integrated Postsecondary Education Data System (IPEDS), but are not available (or applicable) for most public two-year institutions. Thus, this calculation assumes that the average cost-of-living at public four-year colleges in the state are the same as those incurred by students attending the state’s public two-year community colleges. This assumption is made in part to account for living expenses that must be paid by all students, whether they live on campus or not.
4.2.3 Federal, State/Local, and Institutional Grant Aid
Total federal, state/local, and institutional grant aid disbursed to first-time, full-time undergraduates by institution are calculated from the Integrated Postsecondary Education Data System (IPEDS). Average aid by state and sector is calculated by dividing the total aid disbursed by each state and sector by the number of applicable first-time, full-time undergraduates.
Federal grant aid includes Title IV Pell Grants, Supplemental Educational Opportunity Grants (SEOG), and need-based and merit-based educational assistance funds and training vouchers provided through federal agencies and/or federally sponsored educational benefits programs.
State/local grant aid includes Leveraging Educational Assistance Partnerships Grants (LEAP, formerly State Student Incentives Grants), merit scholarships provided by the state, tuition and fee waivers reimbursed by state agencies, and local grants, scholarships, or gift aid awarded by local governments directly to students.
Institutional grant aid includes scholarships and fellowships awarded by institutions and/or individual departments within an institution, and tuition and fee waivers granted by institutions (not reimbursed through another source), including athletic scholarships. Institutional grant aid does not include College Work Study.
29
4.2.4 Average Financial Aid by Family Income
Average financial aid awards mask the deliberateness of state policies to target aid to specific student populations. Without student unit records available at the state level to provide precise amounts of financial aid received, estimates must be calculated.
Two sources of student financial aid can together be used to estimate student financial aid by income quintile. Data on grant aid awarded to first-time, full-time certificate/degree-seeking undergraduates by institution and aid source (federal, state/local, and institutional) are available for nearly all Title IV institutions from the Integrated Postsecondary Education Data System (IPEDS). From these data, average grant aid awarded by state, sector, and aid source can be determined. However, these data cannot be disaggregated by levels of student or family income.
The distribution of student grant aid by levels of income is available for the nation from the National Postsecondary Student Aid Study (NPSAS). Because the NPSAS represents a sample of students across the country, reliable estimates by state are not possible.
Given the data that are available, the national distribution of student aid awarded to first-time, full-time students by income level, sector, and aid source (from NPSAS) were applied to the available state-level average aid (from IPEDS) to estimate aid amounts by income quintile. The assumption is that students receive the same percentage of aid in every state by income level, but the amount of financial aid for students in each income quintile will vary by state because the size of the average award varies by sector and by state.
(See Figure 1 for a description of the ability-to-pay calculations).
4.2.5 Net College Cost in Each Sector
Average net cost of attendance in each sector of higher education is calculated by subtracting total average financial aid received (federal + state/local + institutional aid) from average expenses (tuition + fees + room + board). While students and their families incur the same expenses in a given sector regardless of income, they receive different amounts of financial aid depending on their income level. Therefore, net college costs differ for each family income quintile in the state.
4.2.6 The Role of Family Income
A student’s or family’s ability to pay for college is based both on the net cost and the resources available to pay the cost. By state, net cost at each of the major sectors is calculated as a percentage of median family income in each quintile. The results of these calculations are estimates of the amount of family income required by low-income, middle-income, and high-income families to attend college in each of the state’s major sectors.
30
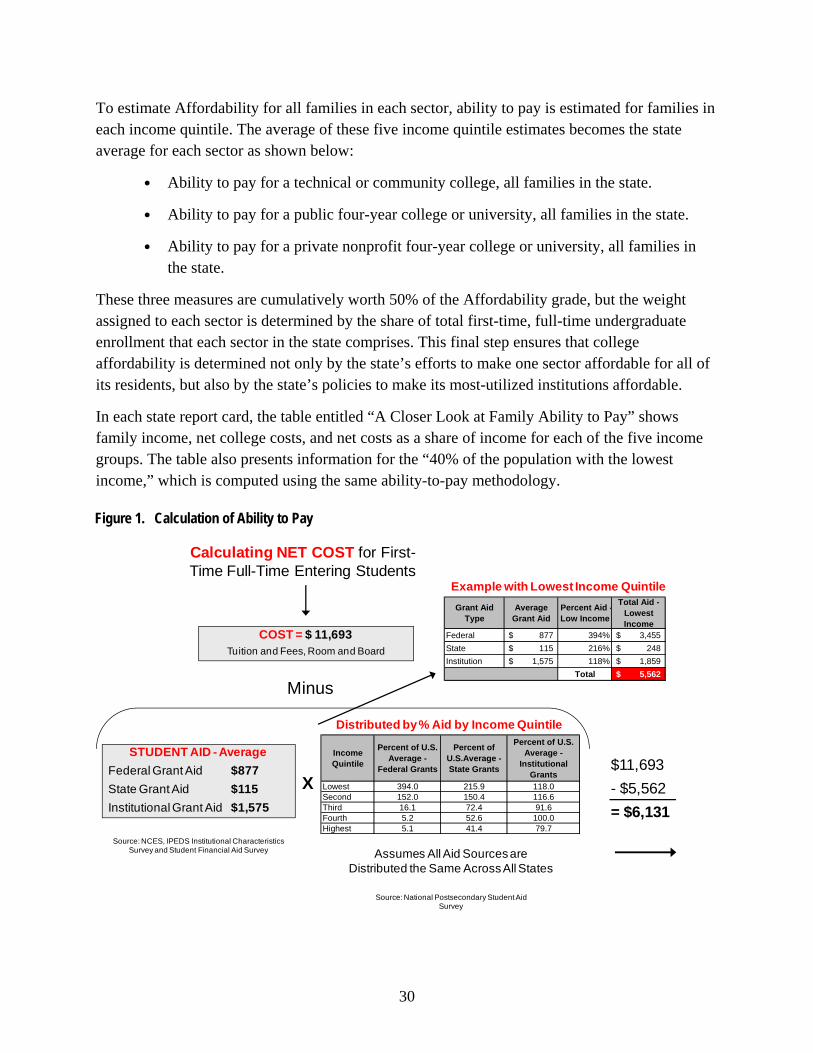
To estimate Affordability for all families in each sector, ability to pay is estimated for families in each income quintile. The average of these five income quintile estimates becomes the state average for each sector as shown below:
• Ability to pay for a technical or community college, all families in the state.
• Ability to pay for a public four-year college or university, all families in the state.
• Ability to pay for a private nonprofit four-year college or university, all families in the state.
These three measures are cumulatively worth 50% of the Affordability grade, but the weight assigned to each sector is determined by the share of total first-time, full-time undergraduate enrollment that each sector in the state comprises. This final step ensures that college affordability is determined not only by the state’s efforts to make one sector affordable for all of its residents, but also by the state’s policies to make its most-utilized institutions affordable.
In each state report card, the table entitled “A Closer Look at Family Ability to Pay” shows family income, net college costs, and net costs as a share of income for each of the five income groups. The table also presents information for the “40% of the population with the lowest income,” which is computed using the same ability-to-pay methodology.
Figure 1. Calculation of Ability to Pay
STUDENT AID - Average
Federal Grant Aid $877
State Grant Aid $115
Institutional Grant Aid $1,575
Minus
Source: NCES, IPEDS Institutional Characteristics Survey and Student Financial Aid Survey
COST = $ 11,693Tuition and Fees, Room and Board
Calculating NET COST for First-Time Full-Time Entering Students
Distributed by % Aid by Income Quintile
Assumes All Aid Sources are Distributed the Same Across All States
Income Quintile
Percent of U.S. Average -
Federal Grants
Percent of U.S.Average - State Grants
Percent of U.S. Average -
Institutional Grants
Lowest 394.0 215.9 118.0Second 152.0 150.4 116.6Third 16.1 72.4 91.6Fourth 5.2 52.6 100.0Highest 5.1 41.4 79.7
Source: National Postsecondary Student Aid Survey
X$11,693
- $5,562
= $6,131
Grant Aid Type
Average Grant Aid
Percent Aid -Low Income
Total Aid - Lowest Income
Federal 877$ 394% 3,455$
State 115$ 216% 248$
Institution 1,575$ 118% 1,859$
Total 5,562$
Example with Lowest Income Quintile
31
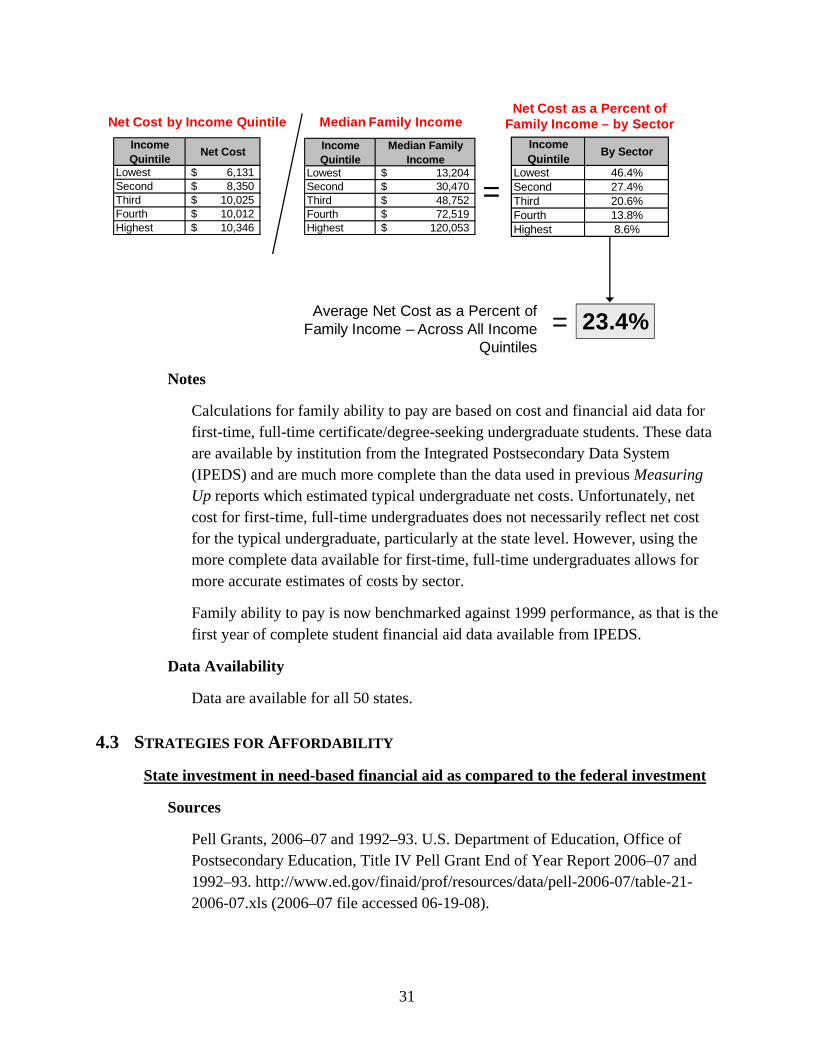
Income Quintile
Net Cost
Lowest 6,131$ Second 8,350$ Third 10,025$ Fourth 10,012$ Highest 10,346$
Net Cost by Income Quintile Median Family Income
Income Quintile
Median Family Income
Lowest 13,204$ Second 30,470$ Third 48,752$ Fourth 72,519$ Highest 120,053$
Income Quintile
By Sector
Lowest 46.4%Second 27.4%Third 20.6%Fourth 13.8%Highest 8.6%
Net Cost as a Percent of Family Income – by Sector
=
Average Net Cost as a Percent of Family Income – Across All Income
Quintiles
= 23.4%
Notes
Calculations for family ability to pay are based on cost and financial aid data for first-time, full-time certificate/degree-seeking undergraduate students. These data are available by institution from the Integrated Postsecondary Data System (IPEDS) and are much more complete than the data used in previous Measuring Up reports which estimated typical undergraduate net costs. Unfortunately, net cost for first-time, full-time undergraduates does not necessarily reflect net cost for the typical undergraduate, particularly at the state level. However, using the more complete data available for first-time, full-time undergraduates allows for more accurate estimates of costs by sector.
Family ability to pay is now benchmarked against 1999 performance, as that is the first year of complete student financial aid data available from IPEDS.
Data Availability
Data are available for all 50 states.
4.3 STRATEGIES FOR AFFORDABILITY
State investment in need-based financial aid as compared to the federal investment
Sources
Pell Grants, 2006–07 and 1992–93. U.S. Department of Education, Office of Postsecondary Education, Title IV Pell Grant End of Year Report 2006–07 and 1992–93. http://www.ed.gov/finaid/prof/resources/data/pell-2006-07/table-21-2006-07.xls (2006–07 file accessed 06-19-08).
32
State grants (need-based and non-need-based) 2007–08. National Center for Higher Education Management Systems. Annual Survey of State Grant Aid Programs, Academic Year 2007–08 (final revision 06-27-08).
State grants (need-based and non-need-based) 1992–93. State Student Grant and Aid Programs. Annual Survey, 1992–93 Academic Year. Albany, NY: National Association of State Student Grant and Aid Programs, 1994.
Description
This indicator measures states’ commitment to provide aid for low-income students as compared to the federal contribution. The indicator is calculated using the following formula:
Numerator: Total amount of state need-based aid awarded to undergraduate students.
Denominator: Distribution of federal Pell Grant Aid by state.
This indicator is a measure for how much state aid is made available to students who have some form of financial need.
Notes
Data for state grant aid reflect the past year, while the most current data on Pell Grants is two years old. Although the state and Pell Grant data do not refer to the same year, the indicator is measured with the most up-to-date information available.
New York: State grant aid reflects TAP expenditures for 2006–07 and part-time student aid appropriations for 2007–08.
Tennessee did not report state data for 2007–08. Thus, the most recent data available (2005–06) were used in the calculation.
Data Availability
Data are available for all 50 states.
At lowest-priced colleges, the share of income that the poorest families need to pay for tuition
Sources
Public two-year average full-time undergraduate in-district tuition and fees, 2007–08. National Center for Education Statistics (NCES). Integrated Postsecondary Education Data System (IPEDS) Peer Analysis System (PAS). 2007–08

33
Institutional Characteristics File. ic2007_ay Early Release Data File accessed 04-28-08. http://www.nces.ed.gov/ipedspas/.
Public two-year average full-time undergraduate in-district tuition and fees, 1992–93. National Center for Education Statistics. Digest of Education Statistics 1994. Washington, D.C.: U.S. Department of Education, 1995.
Median family income for the lowest quintile by state, 2006. Steven Ruggles, Mathew Sobek, Trent Alexander, Catherine A. Fitch, Ronald Goeken, Patricia Kelly Hall, Miriam King, and Chad Ronnander. Integrated Public Use Microdata Series: Version 4.0 [Machine-readable database]. Minneapolis, MN: Minnesota Population Center [producer and distributor], 2008. (http://usa.ipums.org/usa). Data based on U.S. Bureau of the Census, 2006 American Community Survey (Public Use Microdata Sample). Washington, DC: Census Bureau. (Data accessed and aggregated on 05-08-08).
Median family income for the lowest quintile by state, 1991–93. U.S. Bureau of the Census. Current Population Survey, 1991, 1992, and 1993 March Supplements. Data provided by Pinkerton Computer Consultants, 2004.
Description
Tuition levels have been shown to affect whether low-income students choose to go to college. Decisions about overall tuition levels are an important part of the concept of affordability. Creating and preserving low-priced options for college is an important state strategy to ensure access for low-income students and families who would otherwise be priced out of higher education. This indicator measures this aspect of affordability with the following formula:
Numerator: Average listed in-district tuition and fees for full-time undergraduates at public two-year institutions in the state.
Denominator: The median family income in the lowest-income quintile in the state.
Notes
The lowest-priced colleges normally are the community colleges. Median family income is now extracted from the Census Bureau’s American Community Survey rather than using three years of data from the much smaller Current Population Survey, which was done in previous editions of Measuring Up.
Data Availability
Data are available for all 50 states.
34
4.4 RELIANCE ON LOANS
Average loan amount that undergraduate students borrow each year
Sources
Federal Family Education Loan Program (FFELP) loans and direct loans for academic year 2006–07. National Student Loan Data System, Fiscal Year 2009, President’s Budget Loan Volumes. U.S. Department of Education Special Analysis (Unpublished Data), received by NCHEMS on 06-02-08.
FFELP loans for academic year 1994–95. Office of Postsecondary Education. FFELP Report, Academic Year 1994–95: Total Loan Guarantees for Undergraduates Only. Washington, D.C.: U.S. Department of Education.
Direct loans for academic year 1994–95. Office of Postsecondary Education. Direct Loans to Undergraduates, Academic Year 1994–95: Total Loan Guarantees for Undergraduates Only. Washington, D.C.: U.S. Department of Education.
Description
Federal loans comprise more than 90% of the funds students borrow to attend college. Thus, this indicator serves as a proxy for annual student loan burden. The following formula is used to calculate the average loan amount that undergraduate students receive from the federal government:
Numerator: Total dollars in FFEL Stafford subsidized, unsubsidized, and PLUS loans made to parents in FY 2007 + Total dollars in William D. Ford Stafford subsidized, unsubsidized, and PLUS loans made to students in FY 2007.
Denominator: Total number of loans from both FFEL and DL programs.
Notes
An unduplicated count of the borrowers is not available by state. For this reason, the denominator used may report individual students who take out more than one loan, understating the total average loan amount.
Data Availability
Data are available for all 50 states.
35
5 Completion
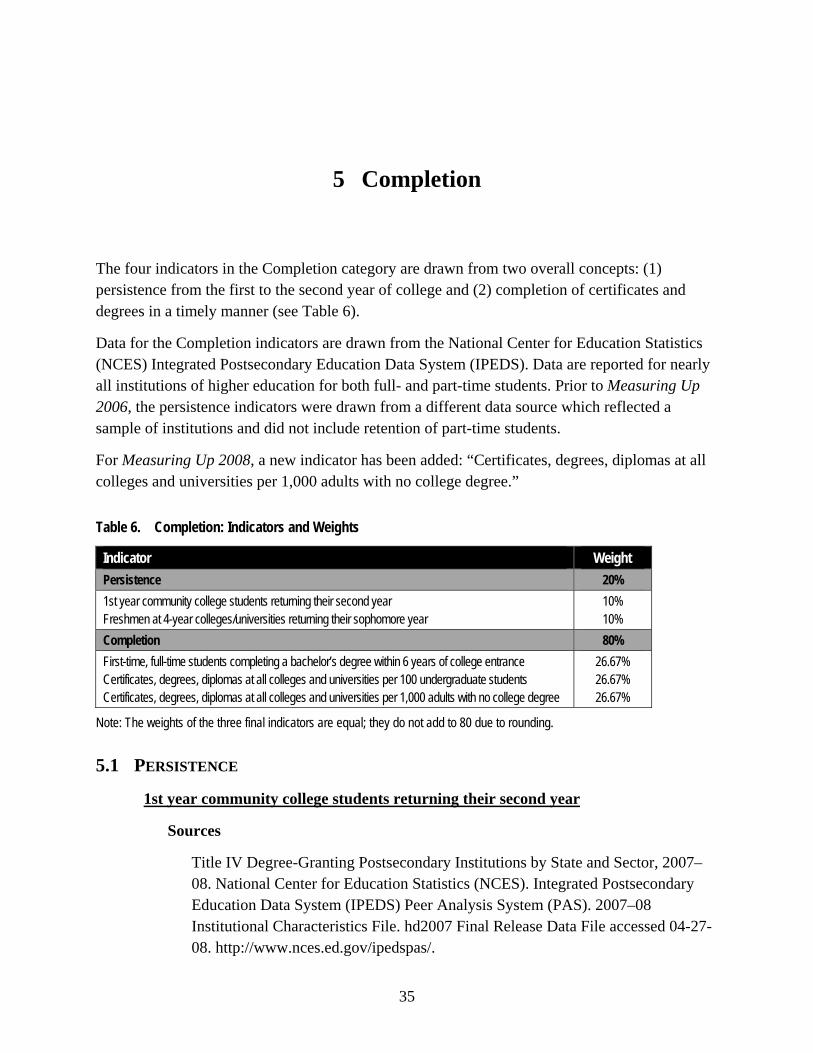
The four indicators in the Completion category are drawn from two overall concepts: (1) persistence from the first to the second year of college and (2) completion of certificates and degrees in a timely manner (see Table 6).
Data for the Completion indicators are drawn from the National Center for Education Statistics (NCES) Integrated Postsecondary Education Data System (IPEDS). Data are reported for nearly all institutions of higher education for both full- and part-time students. Prior to Measuring Up 2006, the persistence indicators were drawn from a different data source which reflected a sample of institutions and did not include retention of part-time students.
For Measuring Up 2008, a new indicator has been added: “Certificates, degrees, diplomas at all colleges and universities per 1,000 adults with no college degree.”
Table 6. Completion: Indicators and Weights
Indicator Weight
Persistence 20%
1st year community college students returning their second year Freshmen at 4-year colleges/universities returning their sophomore year
10% 10%
Completion 80%
First-time, full-time students completing a bachelor’s degree within 6 years of college entrance Certificates, degrees, diplomas at all colleges and universities per 100 undergraduate students Certificates, degrees, diplomas at all colleges and universities per 1,000 adults with no college degree
26.67% 26.67% 26.67%
Note: The weights of the three final indicators are equal; they do not add to 80 due to rounding.
5.1 PERSISTENCE
1st year community college students returning their second year
Sources
Title IV Degree-Granting Postsecondary Institutions by State and Sector, 2007–08. National Center for Education Statistics (NCES). Integrated Postsecondary Education Data System (IPEDS) Peer Analysis System (PAS). 2007–08 Institutional Characteristics File. hd2007 Final Release Data File accessed 04-27-08. http://www.nces.ed.gov/ipedspas/.
36
First-to-Second Year Retention Rates by Institution, Fall 2007. National Center for Education Statistics (NCES). Integrated Postsecondary Education Data System (IPEDS) Peer Analysis System (PAS). Fall 2007 Enrollment Retention File. ef2007d Early Release Retention Rate File accessed 07-17-08; http://www.nces.ed.gov/ipedspas/.
First-to-Second Year Retention Rates by State (years prior to IPEDS availability). ACT. “Institutional Data Questionnaire,” unpublished analysis by ACT, Iowa City, Iowa.
Description
This indicator measures the first-to-second-year persistence rate for first-time students on two-year campuses. Prior to Measuring Up 2006, the indicator only reported first-time, full-time students due to data limitations. IPEDS data capture retention rates for both first-time, full-time and first-time, part-time students.
The persistence rate for 2007 is reported by 1,650 Title IV degree-granting two-year institutions (with a 98.3% response rate). The rate represents the 2006 fall cohort (all first-time certificate/degree-seeking undergraduates less exclusions) who returned in fall 2007 as either full- or part-time students. State-level full-time and part-time persistence rates are calculated as a weighted average (weighted by cohort size) of full-time and part-time persistence rates reported by all two-year institutions in the state. The overall retention rate is calculated as a weighted average (weighted by cohort size) of the state’s calculated full-time and part-time retention rates. All institutions included in the analysis are Title IV degree-granting two-year institutions. Institutions that did not report their retention rate and/or cohort size were not included in the analysis.
Notes
Indicator results between the previous report cards and the 2006 and 2008 report cards may not be entirely comparable due to the shift in data sources. However, the National Center staff found that the replacement of the data source has no impact on states’ trends in performance when improvement over time is assessed for the Completion category.
Data Availability
Data are available for all 50 states.
37
Freshmen at 4-year colleges and universities returning their sophomore year
Sources
Title IV Degree-Granting Postsecondary Institutions by State and Sector, 2007–08. National Center for Education Statistics (NCES). Integrated Postsecondary Education Data System (IPEDS) Peer Analysis System (PAS). 2007–08 Institutional Characteristics File. hd2007 Final Release Data File accessed 04-27-08; http://www.nces.ed.gov/ipedspas/.
First-to-Second Year Retention Rates by Institution, Fall 2007. National Center for Education Statistics (NCES). Integrated Postsecondary Education Data System (IPEDS) Peer Analysis System (PAS). Fall 2007 Enrollment Retention File. ef2007d Early Release Retention Rate File accessed 07-17-08; http://www.nces.ed.gov/ipedspas/.
First-to-Second Year Retention Rates by State (years prior to IPEDS availability). ACT. “Institutional Data Questionnaire,” unpublished analysis by ACT, Iowa City, Iowa.
Description
This indicator measures the first-to-second-year persistence rate for first-time students on four-year campuses. Prior to Measuring Up 2006, the indicator only reported first-time, full-time students due to data limitations. IPEDS data capture retention rates for both first-time, full-time and first-time, part-time students.
The persistence rate for 2007 is reported by 2,249 Title IV degree-granting four-year institutions (with an 83.9% response rate). The rate represents the 2006 fall cohort (all first-time certificate/degree-seeking undergraduates less exclusions) who returned in fall 2007 as either full- or part-time students. State-level full-time and part-time persistence rates are calculated as a weighted average (weighted by cohort size) of full-time and part-time persistence rates reported by all four-year institutions in the state. The overall retention rate is calculated as a weighted average (weighted by cohort size) of the state’s calculated full-time and part-time retention rates. All institutions included in the analysis are Title IV degree-granting four-year institutions. Institutions that did not report their retention rate and/or cohort size were not included in the analysis.
Notes
Indicator results between the previous report cards and the 2006 and 2008 report cards may not be entirely comparable due to the shift in data sources. However, the National Center staff found that the replacement of the data source has no
38
impact on states’ trends in performance when improvement over time is assessed for the Completion category.
Data Availability
Data are available for all 50 states.
5.2 COMPLETION
First-time, full-time students completing a bachelor’s degree within 6 years of college entrance
Source
Graduation Rates at Title IV Degree-Granting Four-Year Institutions. National Center for Education Statistics (NCES). Integrated Postsecondary Education Data System (IPEDS) Peer Analysis System (PAS). 2006–07 Graduation Rate File. gr2007 Early Release Data File accessed 07-17-08. http://www.nces.ed.gov/ipedspas/.
Description
Older and full-time working adults constitute a larger proportion of the college student body today, and more students now take longer to complete the baccalaureate degree. By looking at a prolonged time period within which students progress toward the bachelor’s degree, this measure is designed to capture the educational progress of a broader student population.
Using preliminary data from the 2007 NCES Graduation Rate Survey (GRS), this indicator measures the percentage of first-time, full-time degree-seeking students enrolled in a public or private four-year institution who obtain a bachelor’s degree at the institution they entered within six years of enrolling.
Part-time students, returning students, and students who transfer to another campus are not captured in this measure. The completion rate may be underestimated for the states where such students are a large percentage of the student body.
Data Availability
Data are available for all 50 states.
39
Certificates, degrees, diplomas at all colleges and universities per 100 undergraduate students
Sources
Total Undergraduate Awards 2006–07. National Center for Education Statistics (NCES). Integrated Postsecondary Education Data System (IPEDS) Peer Analysis System (PAS). 2006–07 Completions File. c2007_a Early Release Data File accessed 04-28-08. http://www.nces.ed.gov/ipedspas/.
Total Undergraduate Awards 1991–92. National Center for Education Statistics (NCES). Integrated Postsecondary Education Data System (IPEDS) 1991–92 Completions Survey. Data for 1991–92 were provided by Pinkerton Computer Consultants, 2004.
Undergraduate Enrollments, Fall 2006. National Center for Education Statistics (NCES). Integrated Postsecondary Education Data System (IPEDS) Peer Analysis System (PAS). Fall 2006 Enrollment File. ef2006a Early Release Data File accessed 12-21-07. http://www.nces.ed.gov/ipedspas/.
Undergraduate Enrollments, Fall 1991. National Center for Education Statistics (NCES). Integrated Postsecondary Education Data System (IPEDS) Fall 1991 Enrollment File. Data for Fall 1991 provided by Pinkerton Computer Consultants, 2004.
Description
This indicator uses the following calculation:
Numerator: Total number of certificates, diplomas, associate’s degrees, and baccalaureate degrees awarded throughout the 2006–07 academic year (or 1991–92).
Denominator: Full-time and part-time undergraduate enrollment in fall 2006 (or fall 1991).
Notes
This measure is not a cohort statistic. However, since both the associate’s and bachelor’s degrees are totaled, this indicator does capture the degree completion of students who transferred from one institution to another.
Data Availability
Data are available for all 50 states.
40
Certificates, degrees, diplomas at all colleges and universities per 1,000 adults with no college degree
Sources
Total Undergraduate Awards 2006–07. National Center for Education Statistics (NCES). Integrated Postsecondary Education Data System (IPEDS) Peer Analysis System (PAS). 2006–07 Completions File. c2007_a Early Release Data File accessed 04-28-08. http://www.nces.ed.gov/ipedspas/.
Total Undergraduate Awards 1990–91 and 2000–01. National Center for Education Statistics (NCES). Integrated Postsecondary Education Data System (IPEDS) Peer Analysis System (PAS). 1990–91 and 2000–01 Completions Files. C1991_CIP and C2001_A Final Release Data Files accessed 07-21-08. http://www.nces.ed.gov/ipedspas/.
18- to 49-Year-Olds with No College Degree, 2006. U.S. Census Bureau. 2006 American Community Survey (Public Use Microdata Sample). Washington, D.C.
18- to 49-Year-Olds with No College Degree, 1990 and 2000. Steven Ruggles, Matthew Sobek, Trent Alexander, Catherine A. Fitch, Ronald Goeken, Patricia Kelly Hall, Miriam King, and Chad Ronnander. Integrated Public Use Microdata Series: Version 4.0 [Machine-readable database]. Minneapolis, MN: Minnesota Population Center [producer and distributor], 2008. http://usa.ipums.org/usa/. Data based on the U.S. Census Bureau’s 1990 and 2000 Decennial Census’ 5% Public Use Microdata Sample (PUMS) Files. Data aggregated by the National Center for Higher Education Management Systems (NCHEMS).
Description
This indicator uses the following calculation:
Numerator: Total number of certificates, diplomas, associate’s degrees, and baccalaureate degrees awarded throughout the 2006–07 academic year (or 1990–91, 2000–01).
Denominator: Population ages 18 to 49 with no college degree, 2006 (or 1990, 2000).
Notes
This measure gauges how well states award credentials and degrees relative to the state’s population in need (that is, those with no college degree). States can have productive institutions but may not produce enough to address the state’s need.

41
Data Availability
Data are available for all 50 states.

42
6 Benefits
In return for its investment in higher education, each state expects to have a more productive workforce, a more informed electorate, and a more literate citizenry. In addition to these public benefits, the state can expect that more highly educated residents reap private benefits such as higher lifetime earnings. Specifically, this category consists of three main areas that demonstrate economic and civic benefits received by the states as a result of having a highly educated population (see Table 7). The three areas are:
• Educational achievement,
• Economic benefits, and
• Civic benefits.
Due to data limitations, interstate migrations are not accounted for in this category. States receive credit for having an educated population in the state, since states reap the economic and societal rewards whether or not residents received their education in that state.
Table 7. Benefits: Indicators and Weights4
Indicator Weight
Educational Achievement 37.5%
Adults (ages 25 to 64) with an associate’s degree or higher Adults (ages 25 to 64) with a bachelor’s degree or higher
18.75% 18.75%
Economic Benefits 31.25%
Increase in total personal income as a result of the percentage of the population with some college (including an associate’s degree), but not a bachelor’s degree
18.75%
Increase in total personal income as a result of the percentage of the population holding a bachelor’s degree 12.50%
Civic Benefits 31.25%
Residents voting in national elections 10.50%
Of those who itemize on federal income taxes, the percentage declaring charitable gifts 10.375%
Increase in volunteering as a result of college education 10.375%
4 This year, the indicators for adult skill levels were not used to calculate grades. These measures were eliminated due to the lack of recent data and information.

43
6.1 EDUCATIONAL ACHIEVEMENT
Adults (ages 25 to 64) with an associate’s degree or higher
Sources
U.S. Bureau of the Census. 2006 American Community Survey. State-level data for 1990 and 2000 are from the U.S. Bureau of the Census’ Decennial Census.
Description
This measure assesses the educational attainment of the working-age population in the state, using the following calculation:
Numerator: Number of adults ages 25 to 64 with an associate’s degree or higher.
Denominator: Number of adults ages 25 to 64 in the state.
Data Availability
Data are available for all 50 states.
Adults (ages 25 to 64) with a bachelor’s degree or higher
Sources
U.S. Bureau of the Census. 2006 American Community Survey. State-level data for 1990 and 2000 are from the U.S. Bureau of the Census’ Decennial Census.
Description
This measure assesses the educational attainment of the working-age population in the state, using the following calculation:
Numerator: Number of adults ages 25 to 64 with a baccalaureate degree or higher.
Denominator: Number of adults ages 25 to 64 in the state.
Data Availability
Data are available for all 50 states.

44
6.2 ECONOMIC BENEFITS
Increase in total personal income as a result of the percentage of the population with some college (including an associate’s degree), but not a bachelor’s degree
Sources
Median earnings
Data for 2006. U.S. Bureau of the Census. 2006 American Community Survey (Public Use Microdata Samples). Median earnings data were calculated by NCHEMS.
Data for 1990–92. U.S. Bureau of the Census. Current Population Survey. March 1990, 1991, and 1992 Supplements. Washington, D.C. Data for 1990–92 were provided by Pinkerton Computer Consultants, 2004.
Adult population with some college or an associate’s degree
Data for 2006. U.S. Bureau of the Census. 2006 American Community Survey.
Data for 1990–92. U.S. Bureau of the Census. Current Population Survey. October 1990, 1991, and 1992 Supplements. Washington, D.C. Data for 1990–92 were provided by Pinkerton Computer Consultants, 2004.
Total personal income
Bureau of Economic Analysis. State Personal Income, Annual and Quarterly, for All States and Regions, 2006 and 1992. Washington, D.C.: U.S. Department of Commerce. www.bea.doc.gov/bea/regional/spi/drill.cfm.
Description
Statewide economic benefits reflect the average net contribution of having some college (but not a bachelor’s degree) relative to total personal income. This indicator is measured with a three-step mathematical formula. First, this measure calculates the difference in the median earnings between adults whose highest level of education is a high school credential and adults with some college or an associate’s degree. This earnings differential is then multiplied by the number of adults in the state with some college or an associate’s degree. The third step divides this result by total personal income in the state. The following formula is used:
Numerator: Median earnings of the population ages 25 to 64 with some college or an associate’s degree, minus median earnings of the population ages 25 to 64

45
whose highest education is a high school credential, multiplied by the number of adults ages 25 to 64 with some college or an associate’s degree.
Denominator: Total personal income in the state.
Notes
For Measuring Up 2008, the American Community Survey (ACS) was used instead of the Current Population Survey (CPS), which was used in previous Measuring Up reports. Beginning in 2005, the annual sample size for the ACS expanded to three million households, which is approximately 20 times larger than the sample size for the CPS. Because of the large sample size for the ACS, Measuring Up 2008 uses one year of data instead of combining three years—as was done in previous years using the CPS.
Personal income is the sum of net earnings adjusted by place of residence, rental income of persons, personal dividend income, personal interest income, and transfer payments. It is measured before the deduction of personal income taxes and other personal taxes and is reported in current dollars (no adjustment is made for price changes). Total personal income is the personal income received by all residents of a state from participation in production, government, and business transfer payments, and accumulated government interest.
Data Availability
Data are available for each of the 50 states.
Increase in total personal income as a result of the percentage of the population holding a bachelor’s degree
Sources
Median earnings
Data for 2006. U.S. Bureau of the Census. 2006 American Community Survey (Public Use Microdata Samples). The median earnings data were calculated by NCHEMS.
Data for 1990–92. U.S. Bureau of the Census. Current Population Survey. March 1990, 1991, and 1992 Supplements. Washington, D.C. Data for 1990–92 were provided by Pinkerton Computer Consultants, 2004.
Adult population with bachelor’s degree or higher
Data for 2006. U.S. Bureau of the Census. 2006 American Community Survey.

46
Data for 1990–92. U.S. Bureau of the Census. Current Population Survey, October 1990, 1991, and 1992 Supplements. Washington, D.C. Data for 1990–92 were provided by Pinkerton Computer Consultants, 2004.
Total personal income
Bureau of Economic Analysis. State Personal Income, Annual and Quarterly, for All States and Regions, 2006 and 1992. Washington, D.C.: U.S. Department of Commerce. www.bea.doc.gov/bea/regional/spi/drill.cfm.
Description
Statewide economic benefits reflect the average net contribution of baccalaureate degree holders relative to total personal income. This indicator is measured with a three-step mathematical formula. First, this measure calculates the difference in the median earnings between adults whose highest level of education is a high school credential and adults with at least a baccalaureate degree. This earnings differential is then multiplied by the number of adults in the state with a baccalaureate degree. The third step divides this result by total personal income in the state. The following formula is used:
Numerator: Median earnings of population ages 25 to 64 with at least a baccalaureate degree, minus median earnings of population ages 25 to 64 whose highest education is a high school credential, multiplied by the number of adults ages 25 to 64 with at least a baccalaureate degree.
Denominator: Total personal income in the state.
Notes
For Measuring Up 2008, the American Community Survey (ACS) was used instead of the Current Population Survey (CPS), which was used in previous Measuring Up reports. Beginning in 2005, the annual sample size for the ACS expanded to three million households, which is approximately 20 times larger than the sample size for the CPS. Because of the large sample size for the ACS, Measuring Up 2008 uses one year of data instead of combining three years—as was done in previous years using the CPS.
Personal income is the sum of net earnings adjusted by place of residence, rental income of persons, personal dividend income, personal interest income, and transfer payments. It is measured before the deduction of personal income taxes and other personal taxes and is reported in current dollars (no adjustment is made for price changes). Total personal income is the personal income received by all residents of a state from participation in production, government, and business transfer payments, and accumulated government interest.
47
Data Availability
Data are available for each of the 50 states.
6.3 CIVIC BENEFITS
Residents voting in national elections
Sources
U.S. Bureau of the Census. Current Population Survey. November Voting and Registration, 2004 and 2006. Washington, D.C. State-level data tabulated by NCHEMS using the Census Web site data tool, http://dataferrett.census.gov.
Description
This indicator uses the following calculation:
Numerator: (Number of voters in November 2004 election) + (Number of voters in 2006 election).
Denominator: (Voting population5 in 2004) + (Voting population in 2006)
Notes
Votes cast in local, state, and federal races are included. Due to data limitations, this indicator does not disaggregate the voting rates of residents by level of educational attainment. National studies have shown that voting rates increase with higher levels of educational attainment. This measure is included as a proxy for the civic returns a state enjoys as a result of its more highly educated population.
Data Availability
Data are available for all 50 states.
Of those who itemize on federal income taxes, the percentage declaring charitable gifts
Sources
Internal Revenue Service. Statistics of Income for Tax Year 2005 and 1992. Annual State Tax Reports. Washington, D.C.: U.S. Department of the Treasury. The 2005 data were obtained from www.irs.gov. The 1992 data were provided by IRS staff, 2004.
5 Voting population indicates state residents ages 18 or above.
48
Description
The charitable giving rate is the number of charitable contributions made by all those tax filers who itemized their tax returns during the 2005 (or 1992) tax year. This indicator uses the following calculation:
Numerator: Number of tax filers itemizing charitable contributions on their 2005 federal tax return.
Denominator: Number of state residents filing an itemized federal tax return in 2005.
Notes
By monitoring the number of donors, rather than the dollar amount donated, this indicator captures the prevalence of philanthropy among income earners and tax filers in the state. The number of donors in the state serves as a proxy for the residents’ local and regional dollar commitments to public welfare.
Due to data limitations, this indicator does not disaggregate the charitable giving rates of residents by level of educational attainment. Annual analyses by the Washington, D.C.-based Independent Sector correlate income to volunteering and describe a direct relationship between educational attainment and charitable giving. The indicator may favor states with wealthier populations, because only those donations large enough to meet tax-deductible criteria are reported.
Data Availability
Data are available for all 50 states.
Increase in volunteering as a result of college education
Sources
U.S. Bureau of the Census. Current Population Survey. September 2005, 2006, and 2007 Supplements. Washington, D.C. State-level data tabulated by NCHEMS using the Census Web site data tool, http://dataferrett.census.gov.
Description
This indicator addresses the state’s civic benefits resulting from a highly educated population as measured in the area of volunteering. Nationally, the volunteering rate increases with the level of education. According to the Census, 15% of high school graduates volunteer nationally, while 30% of those with at least some college do so. Similarly, those with some college volunteer at a higher rate than high school graduates. Given differences in volunteering rates by education, this indicator examines the value added of college education in volunteering rates.
49
Volunteering rates vary among states even at the same educational level, and the extent to which the volunteering rates increase with educational attainment also varies from state to state. The larger the increases by education, the higher the state scores on this indicator. The indicator is measured as the difference in volunteering rates between high school graduates and those with some college. Volunteering rates of each education group are calculated using the following formula.
Volunteering rate for high school graduates:
Numerator: Number of people, ages 18 and above, whose highest education attained is high school and who participated in volunteering activities.
Denominator: Total state population, ages 18 and above, whose highest education attained is high school.
Volunteering rate for all college-educated adults:
Numerator: Number of people, ages 18 and above, whose highest education attained is higher than high school and who participated in volunteering activities.
Denominator: Total state population, ages 18 and above, whose highest education attained is higher than high school.
Notes
Due to data limitations, the extent of volunteering is not accounted for in this measure (for example, the number of hours devoted to volunteering throughout the year). Regardless of frequency or regularity of volunteering, only the total numbers of volunteers are counted. This indicator averages three years of the most current data, 2005 to 2007, to account for aberrations in any single year of data.
Data Availability
Data are available for all 50 states.

50
7 Student Learning
7.1 CREATING LEARNING INDEX SCORES FOR MEASURING UP 2008
In Measuring Up 2008, all states receive an “Incomplete” in Learning because there are not sufficient data to allow meaningful state-by-state comparisons. However, the National Center for Higher Education Management Systems (NCHEMS) developed index scores on Learning for those areas where states do have comparable data (see online state reports for Measuring Up 2008 at www.highereducation.org, and Table 8 in this Technical Guide). This section, which provides technical notes on how NCHEMS developed the index scores on Learning, has two subsections. The first provides an overview of the measures used to create each score. The second section describes how these data were converted into the index scores displayed in Measuring Up 2008 and presented in Table 8 of this Technical Guide.
7.1.1 Measures Used
As with other performance categories in Measuring Up, the Learning category consists of several weighted subcategories, each of which is designed to reflect a particular dimension of performance. State performance in each subcategory can ultimately be combined to yield an overall score, once comparable state-by-state data are available. The Learning category contains the following three subcategories (with weights included in parentheses):
Abilities of the college-educated population (25%). In this subcategory, state performance is assessed as a function of the proportion of college-educated residents who achieve high levels of literacy. It thus directly addresses a key question that was originally posed in Measuring Up 2000: “What are the abilities of the college-educated population?”
For Measuring Up 2008, the data used are drawn from five states that participated in a state-level over-sample of the National Assessment of Adult Literacy (NAAL) in 2003 for college-educated residents ages 25 to 64. The five states are Kentucky, Maryland, Massachusetts, Missouri, and New York. The NAAL assessment poses real-world tasks or problems that require respondents to: read and interpret texts (“prose literacy”); obtain or act on information contained in tabular or graphic displays (“document literacy”); and understand numbers or graphs and perform calculations (“quantitative literacy”).
College and university contributions to educational capital (25%). This subcategory is intended to reflect the contributions to a given state’s stock of educational capital by examining
51
the proportion of the state’s college graduates (from two- and four-year institutions) who are ready for advanced practice in the form of professional licensure or graduate study. It thus addresses Measuring Up 2000’s original policy question: “To what extent do the state’s public and private colleges and universities educate students to be capable of contributing to the state’s workforce and democratic processes?”
For Measuring Up 2008, the measures used are based on available data from 14 existing licensure and graduate admissions examinations for students within each state. The indices were computed by first defining a particular level of performance on each test that could be used as a benchmark, above which a particular test-taker could be deemed “ready for advanced practice.” In the case of licensure examinations with established national standards, this level was defined as passing the examination and being licensed. In the case of graduate admissions examinations, a criterion score was set at a level generally accepted as “competitive” with respect to gaining admission to a graduate program. The number of individuals achieving this level or higher was then counted. The resulting total number of “graduates ready for advanced practice” from all available licensure and graduate admissions examinations was then divided by the total number of applicable degrees (bachelor’s or associate’s) associated with the credential, and separately reported for nine licensure examinations and five graduate admissions tests. Fields included in the licensures list were nursing, clinical pathology, physical therapy, respiratory therapy, radiology, and physician’s assistant. Admissions examinations included the Graduate Record Examination (GRE), the Graduate Management Admissions Test (GMAT), the Medical College Admissions Test (MCAT), the Law School Admissions Test (LSAT), and the Pharmacy College Admissions Test (PCAT). All test scores were obtained directly from national sources.
Highly varied data on teacher licensure are available for most states through published Title II reports. But comparing performances across states is problematic for teacher education because of differing standards in each state, as well as the use of different test batteries. In addition, each state has its own standards for what constitutes a “passing” performance, even if they use the same or similar tests. These difficulties led to the decision to display teacher preparation data separately, instead of aggregating teacher licensure test results together with results for other professional licensing examinations. The “educational capital” measure for teacher education included in Measuring Up 2008 is the number of individuals passing licensure examinations in the state (which was obtained from Title II reports), divided by the number of applicable degrees (which was obtained from the Integrated Postsecondary Educational Data System).
Performance of college graduates (50%). This category is intended to reflect how well the graduates of the state’s two- and four-year institutions can perform complex tasks related to both academic and real-world problem-solving situations. It thus addresses the all-important question of the quality of the state’s higher education product.
Results in this area were reported in Measuring Up 2004 and Measuring Up 2006, based on a five-state demonstration project conducted by the National Forum on College-Level Learning,

52
but are not provided in Measuring Up 2008 because new data have not been collected. The measures reported in 2004 and 2006 consisted of two sets of assessments, the Collegiate Learning Assessment (CLA) for students from four-year institutions and the ACT WorkKeys assessment for students at two-year colleges. The methodology used to collect and report these direct measures of student learning is described in the Technical Guide for Measuring Up 2006.
7.2 CREATING INDEX SCORES
As with the five graded areas in Measuring Up, the indicators included in the Learning category were converted into index scores in order to allow them to be aggregated and compared. The procedure was very similar to that used in the five graded areas and involved three steps. First, the measures themselves were aggregated or otherwise adjusted (for example, weights were applied to test scores to correct known sample biases, or multiple measures were aggregated across existing testing data, as described below). Second, all measures were converted to a common index around a benchmark level set at 100. The national average (or in some cases the five-state average) was used instead of the best-performing state to set the benchmark. Finally, differences between each measure and the established benchmark (positive or negative) were calculated and displayed for each state.
Each type of measure, however, required a distinct set of calculations to be performed in order to accomplish the first step in this process, as defined below:
7.2.1 Literacy Measures (Proxy for Abilities of College-Educated Population)
Over-sample results from the National Assessment of Adult Literacy (NAAL), administered in 2003, were available for five states: Kentucky, Maryland, Massachusetts, Missouri, and New York. Reports from each of these states and the nation prepared by the National Center for Education Statistics (NCES) provided the percentage of those taking the assessment who scored in the top performance category (“proficient”), disaggregated by level of education. These proportions were combined for three categories that were reported: those earning an associate’s degree, a bachelor’s degree, and a graduate degree. The resulting proportions were then divided by the total number of residents of equivalent age and degree attainment in each state and the nation as reported by the Current Population Survey (CPS).
7.2.2 Licensure and Admissions Examinations (Proxy for College and University Contributions to Educational Capital)
Data on professional licensure test-score performance were available for Measuring Up 2008 for nine tests in six fields and for five commonly used graduate admissions examinations. These scores were available from national sources for all 50 states and the nation. Results for teacher licensing examinations were also available and usable for all but four states (Alabama, Iowa, Montana, and Nebraska). Before using these data to construct index scores, a number of initial calculations were required to make them comparable:

53
• Subscore aggregation: For tests with multiple subscores, but no total score, subscores were aggregated to create a single indicator of performance weighting each subscore equally. The same procedure was used to average the number of individuals passing or scoring at or above a particular level where multiple subscores were present.
• Standardizing scores: To adjust for differences in test-score scaling, summary test score performance data were indexed to a standardized 0–1 value range depending upon the top score possible on a given test (for example, a GRE score of 450 with a maximum of 800 yields a standardized score of 0.5625).
• Time period aggregation: Up to three years of the most recent data were used in these calculations to create an “average year.” This approach allowed more data to be used in cases where the number of test-takers in a given state was small. In cases where three years of data were available, data from all three were aggregated and divided by three. In cases where two years were available, these two were combined and divided by two. Where only one year was available, only this most recent year was used.
After these initial adjustments, the resulting data consisted of comparable summary performance statistics for each test, including number of test-takers, mean and median scores, standard deviation, and number passing or achieving at or above a designated score. From these data, the three “graduates ready for advanced practice” indicators (for licensing, admissions, and teachers) were calculated. The following steps were used to create these indicators:
Determine the number of individuals ready for advanced practice in each of the three areas. For licensure tests, this is the number of individuals passing the examination. For admissions examinations, it is the number of individuals achieving at or above a given “nationally competitive” score (Verbal GRE=573, Quantitative GRE=617, GMAT=600, LSAT=155, MCAT=10, PCAT=215).
Using IPEDS data, determine the appropriate number of graduates associated with each potential test-taking population. In most cases, these are baccalaureate degrees, but in some cases they are associate’s degrees—and in some cases, both. For teacher examinations, the denominator was the total number of baccalaureate degrees in education plus all other fields of study listed as providing a “qualified” teacher in the teacher quality measure used in the Preparation category. If multiple testing years were present, degree data were aggregated by year to create an “average year.”
Create a ratio between these two numbers. This is the “fraction of educational capital” contribution represented by this particular test.
Sum the resulting fractional contributions to educational capital for each state and the nation in each of the three areas: licensing, admissions, and teacher preparation.
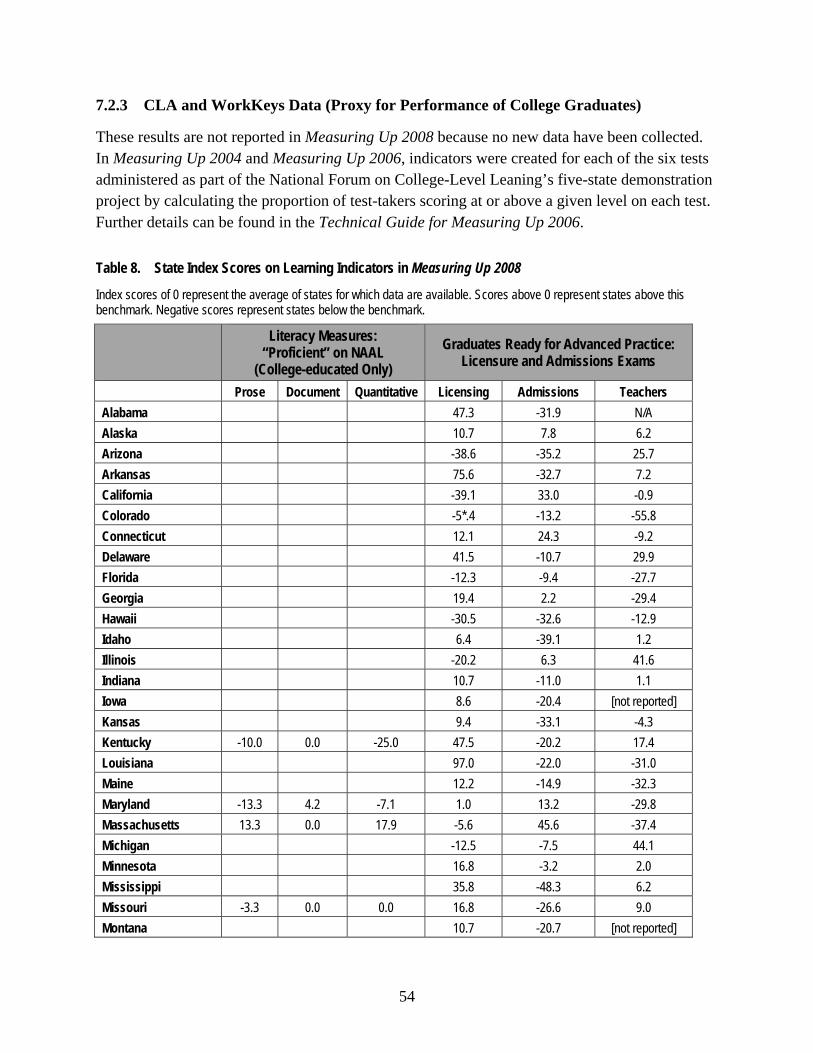
54
7.2.3 CLA and WorkKeys Data (Proxy for Performance of College Graduates)
These results are not reported in Measuring Up 2008 because no new data have been collected. In Measuring Up 2004 and Measuring Up 2006, indicators were created for each of the six tests administered as part of the National Forum on College-Level Leaning’s five-state demonstration project by calculating the proportion of test-takers scoring at or above a given level on each test. Further details can be found in the Technical Guide for Measuring Up 2006.
Table 8. State Index Scores on Learning Indicators in Measuring Up 2008
Index scores of 0 represent the average of states for which data are available. Scores above 0 represent states above this benchmark. Negative scores represent states below the benchmark.
Literacy Measures: “Proficient” on NAAL
(College-educated Only)
Graduates Ready for Advanced Practice: Licensure and Admissions Exams
Prose Document Quantitative Licensing Admissions Teachers
Alabama 47.3 -31.9 N/A
Alaska 10.7 7.8 6.2
Arizona -38.6 -35.2 25.7
Arkansas 75.6 -32.7 7.2
California -39.1 33.0 -0.9
Colorado -5*.4 -13.2 -55.8
Connecticut 12.1 24.3 -9.2
Delaware 41.5 -10.7 29.9
Florida -12.3 -9.4 -27.7
Georgia 19.4 2.2 -29.4
Hawaii -30.5 -32.6 -12.9
Idaho 6.4 -39.1 1.2
Illinois -20.2 6.3 41.6
Indiana 10.7 -11.0 1.1
Iowa 8.6 -20.4 [not reported]
Kansas 9.4 -33.1 -4.3
Kentucky -10.0 0.0 -25.0 47.5 -20.2 17.4
Louisiana 97.0 -22.0 -31.0
Maine 12.2 -14.9 -32.3
Maryland -13.3 4.2 -7.1 1.0 13.2 -29.8
Massachusetts 13.3 0.0 17.9 -5.6 45.6 -37.4
Michigan -12.5 -7.5 44.1
Minnesota 16.8 -3.2 2.0
Mississippi 35.8 -48.3 6.2
Missouri -3.3 0.0 0.0 16.8 -26.6 9.0
Montana 10.7 -20.7 [not reported]
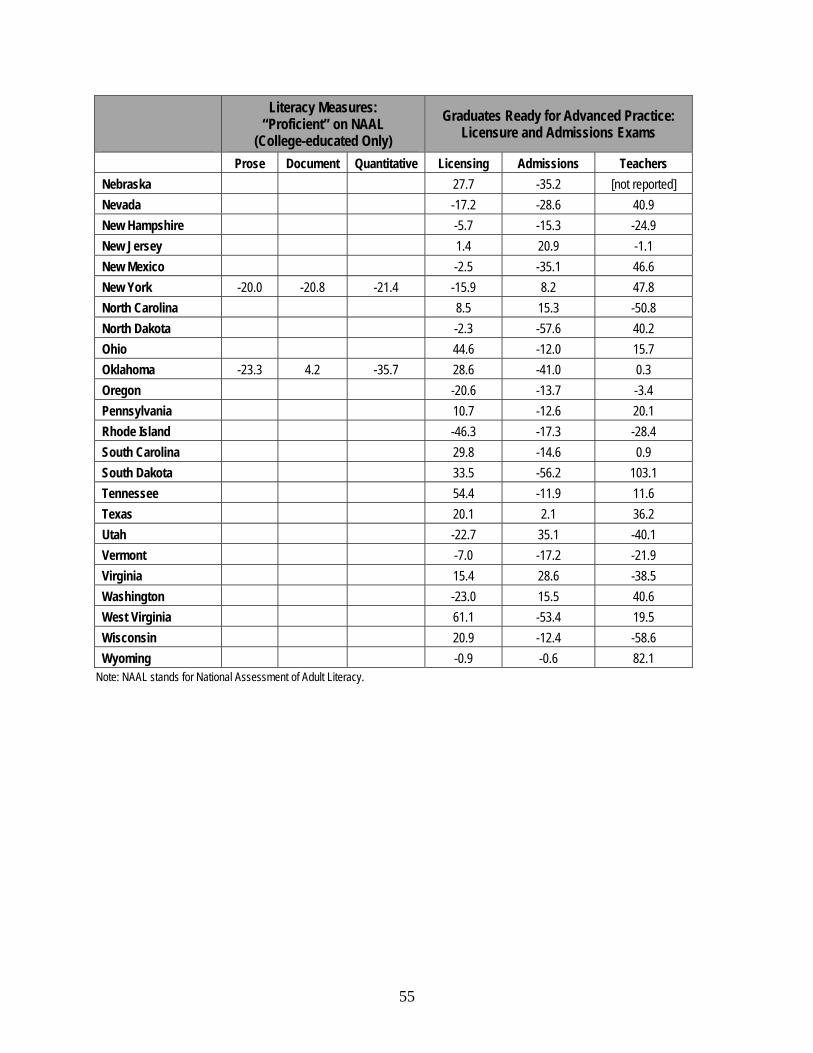
55
Literacy Measures: “Proficient” on NAAL
(College-educated Only)
Graduates Ready for Advanced Practice: Licensure and Admissions Exams
Prose Document Quantitative Licensing Admissions Teachers
Nebraska 27.7 -35.2 [not reported]
Nevada -17.2 -28.6 40.9
New Hampshire -5.7 -15.3 -24.9
New Jersey 1.4 20.9 -1.1
New Mexico -2.5 -35.1 46.6
New York -20.0 -20.8 -21.4 -15.9 8.2 47.8
North Carolina 8.5 15.3 -50.8
North Dakota -2.3 -57.6 40.2
Ohio 44.6 -12.0 15.7
Oklahoma -23.3 4.2 -35.7 28.6 -41.0 0.3
Oregon -20.6 -13.7 -3.4
Pennsylvania 10.7 -12.6 20.1
Rhode Island -46.3 -17.3 -28.4
South Carolina 29.8 -14.6 0.9
South Dakota 33.5 -56.2 103.1
Tennessee 54.4 -11.9 11.6
Texas 20.1 2.1 36.2
Utah -22.7 35.1 -40.1
Vermont -7.0 -17.2 -21.9
Virginia 15.4 28.6 -38.5
Washington -23.0 15.5 40.6
West Virginia 61.1 -53.4 19.5
Wisconsin 20.9 -12.4 -58.6
Wyoming -0.9 -0.6 82.1 Note: NAAL stands for National Assessment of Adult Literacy.
56
8 Non-Graded Data
8.1 OTHER KEY FACTS (REPORTED WITH GRADED CATEGORIES)
8.1.1 Performance Gaps by Race/Ethnicity
Background
Performance gap measures identify disparities by racial/ethnic groups within each state for the indicators presented in Measuring Up 2008. State performance gaps that are substantial are reported with the graded categories in the state report cards (but are not graded).
Race/ethnic indicators in previous Measuring Up reports that were calculated using the Current Population Survey (CPS) are now derived from the Census Bureau’s 2006 American Community Survey (ACS) Public Use Microdata Sample (PUMS) File. The new ACS is a much larger survey and is a more appropriate source for these calculations. Thus, it is now possible to derive more reliable state-level statistics for specific race/ethnic groups. However, there are still many cases where sample sizes are too small to derive accurate estimates. No specific decision rules are provided by the Census Bureau to specify when a statistic is unacceptable to use. However, the Census Bureau provides a 90% margin of error with their published ACS statistics to help assess their accuracy. In this section, calculated percentages using ACS PUMS data are considered unusable and not reported when the 90% margin of error is greater than 10 percentage points and/or the calculated population base is less than 10,000 persons.
Performance gaps by race/ethnicity for Measuring Up 2006 included the Preparation indicators “9th to 12th graders taking at least one upper-level math course” and “9th to 12th graders taking at least one upper-level science course.” Data for these two indicators are provided by the Council of Chief State School Officers and are reported by state in the graded section. Unfortunately, no update by race/ethnicity can be provided for these two indicators, so performance gaps regarding these two indicators are omitted in Measuring Up 2008.

57
A new addition to performance gaps in 2008 derives from the indicator in the Completion category: “first-time, full-time students completing a bachelor’s degree within 6 years of college entrance.” These data are derived from the Integrated Postsecondary Education Data System (IPEDS) and are available for nearly every Title IV institution in the nation by race/ethnicity.
Preparation: 18- to 24-year-olds with a high school credential, by race/ethnicity
Source
U.S. Census Bureau. 2006 American Community Survey (Public Use Microdata Sample).
Description
This indicator measures the percentage of 18- to 24-year-olds who possess a high school credential by state and race/ethnicity. Calculations exclude persons currently enrolled in any grade level who are still seeking a high school diploma. Calculations are provided for white non-Hispanic, minority, black non-Hispanic, Hispanic, American Indian/Alaska native, Asian/Pacific Islander, and other non-Hispanic groups. This indicator is calculated for each state and race/ethnic group using the following formula:
Numerator: 18- to 24-year-olds who possess at least a high school diploma.
Denominator: Total 18- to 24-year-old population (excluding those still seeking a high school diploma).
Notes
This indicator is now calculated using data from the 2006 American Community Survey (Public Use Microdata Sample). Results for Measuring Up 2006 were calculated using three combined years (2002, 2003, and 2004) of the Current Population Survey and were provided by Research Triangle Institute.
Participation: 18- to 24-year-olds enrolled in college, by race/ethnicity
Source
U.S. Census Bureau. 2006 American Community Survey (Public Use Microdata Sample).
Description
This indicator measures the percentage of 18- to 24-year-olds who are enrolled in undergraduate education by race/ethnicity. Calculations are provided for white non-Hispanic, minority, black non-Hispanic, Hispanic, American Indian/Alaska
58
native, Asian/Pacific Islander, and other non-Hispanic groups. This indicator is calculated for each state and race/ethnic group using the following formula:
Numerator: 18- to 24-year-olds enrolled in undergraduate education.
Denominator: Total 18- to 24-year-old population.
Notes
This indicator is now calculated using data from the 2006 American Community Survey (Public Use Microdata Sample). Results for Measuring Up 2006 were calculated using three combined years (2002, 2003, and 2004) of the Current Population Survey and were provided by Research Triangle Institute.
Completion: Certificates, degrees, diplomas at all colleges and universities per 100 undergraduate students, by race/ethnicity
Sources
Total Undergraduate Awards 2006–07. National Center for Education Statistics (NCES). Integrated Postsecondary Education Data System (IPEDS) Peer Analysis System (PAS). 2006–07 Completions File. c2007_a Early Release Data File accessed 04-28-08. http://www.nces.ed.gov/ipedspas/.
Undergraduate Enrollments, Fall 2006. National Center for Education Statistics (NCES). Integrated Postsecondary Education Data System (IPEDS) Peer Analysis System (PAS). Fall 2006 Enrollment File. ef2006a Early Release Data File accessed 12-21-07. http://www.nces.ed.gov/ipedspas/.
Description
This indicator measures total undergraduate awards relative to total undergraduate enrollment by race/ethnicity. Calculations are provided for white non-Hispanic, minority, black non-Hispanic, Hispanic, American Indian/Alaska Native, and Asian/Pacific Islander groups. This indicator is calculated for each state and race/ethnic group using the following formula:
Numerator: Total undergraduate awards (certificates, degrees, and diplomas).
Denominator: Total undergraduate enrollment.
The resulting ratio is then multiplied by 100.
Notes
There are no changes to this indicator for this edition. Data for Measuring Up 2006 were provided by Research Triangle Institute.

59
Completion: First-time, full-time students completing a bachelor’s degree within 6 years of college entrance, by race/ethnicity
Source
Graduation Rates at Title IV Degree-Granting Four-Year Institutions. National Center for Education Statistics (NCES). Integrated Postsecondary Education Data System (IPEDS) Peer Analysis System (PAS). 2006–07 Graduation Rate File. gr2007 Early Release Data File accessed 07-17-08. http://www.nces.ed.gov/ipedspas/.
Description
This indicator measures the percentage of first-time, full-time degree-seeking undergraduates enrolled in a public or private four-year institution who obtain a bachelor’s degree at the institution they entered within six years of enrolling, by race/ethnicity. Calculations are provided for white non-Hispanic, minority, black non-Hispanic, Hispanic, American Indian/Alaska native, and Asian/Pacific Islander groups. This indicator is calculated for each state and race/ethnic group using the following formula:
Numerator: Fall 2001 first-time, full-time degree-seeking cohort.
Denominator: Number of fall 2001 first-time, full-time cohort who received a bachelor’s degree within six years.
Notes
This Completion indicator is a new addition to the performance gaps section. Data are available for nearly every Title IV institution from the Integrated Postsecondary Education Data System (IPEDS).
It should be noted that for Arizona, New Hampshire, and Massachusetts, the overall graduation rate is less than both the white non-Hispanic and overall minority rates, and for Rhode Island, the overall graduation rate is greater than both the white non-Hispanic and overall minority rates. This can happen when the race/ethnicity unknown and/or nonresident alien groups (reflected in the overall rate) are sizeable and have a higher/lower graduation rate relative to the white non-Hispanic and overall minority groups.
Benefits: Adults (ages 25 to 64) with a bachelor’s degree or higher, by race/ethnicity
Source
U.S. Census Bureau. 2006 American Community Survey (Public Use Microdata Sample).
60
Description
This indicator measures the percentage of the population ages 25 to 64 that possess at least a baccalaureate degree by race/ethnicity. Calculations are provided for white non-Hispanic, minority, black non-Hispanic, Hispanic, American Indian/Alaska native, Asian/Pacific Islander, and other non-Hispanic groups. This indicator is calculated for each state and race/ethnic group using the following formula:
Numerator: Population ages 25 to 64 possessing at least a bachelor’s degree.
Denominator: Total population ages 25 to 64.
Notes
This indicator is now calculated using data from the 2006 American Community Survey (Public Use Microdata Sample). Results for Measuring Up 2006 were calculated using three combined years (2002, 2003, and 2004) of the Current Population Survey and were provided by Research Triangle Institute.
8.1.2 Students Enrolling in College Out-of-State (2006)
Source
National Center for Education Statistics (NCES). Integrated Postsecondary Education Data System (IPEDS) Peer Analysis System (PAS). Fall 2006 Residence and Migration of First-Time Freshman File. EF2006C Final Release Data File accessed 12-21-07. http://www.nces.ed.gov/ipedspas/.
Description
This indicator, which is reported in the state report cards in the Participation category, measures the percentage of first-time undergraduates who enroll in an out-of-state institution. The indicator is calculated for each state using the following formula:
Numerator: Number of first-time undergraduates enrolling out-of-state.
Denominator: Number of first-time undergraduates enrolling in-state or out-of-state.
Notes
Data for Measuring Up 2006 were extracted from the 2005 Digest of Education Statistics (Table 202) and reflected migration of first-time undergraduates for fall 2004. For Measuring Up 2008, these data were replicated and updated using the
61
IPEDS fall 2006 Residence and Migration enrollment file, as no update was available from the Digest of Education Statistics.
8.1.3 Net Revenue Loss (2006)
Sources
Total population and total wage income by state, by race/ethnicity, and by educational attainment. U.S. Census Bureau. 2005 and 2006 American Community Survey (Public Use Microdata Sample). Washington, D.C.
Total personal income by state, 2006. Regional Economic Information System. Bureau of Economic Analysis. U.S. Department of Commerce. http://www.bea.gov/regional/spi/.
Description
This indicator, which is reported in the state report cards in the Benefits category, measures the potential loss in total annual wages due to earnings and education gaps between white non-Hispanic and minority working-age population groups (ages 16 and over). Potential additional earnings are calculated based on the assignment of white non-Hispanic income and educational level distributions to minority groups where income and educational levels do not match or exceed those of white non-Hispanics. Calculations are based on five minority groups (Hispanic, black non-Hispanic, Native American/Alaska native, Asian/native Hawaiian/other Pacific Islander, and other non-Hispanic) across six education levels (less than high school, high school, some college but no degree, associate’s degree, bachelor’s degree, and graduate/professional degree). Total potential additional earnings are the sum of the potential additional earnings calculated for each minority group and are measured as a share of state total personal income in order to highlight the loss to the state as a whole. All earnings values presented in the data are in 2006 dollars.
Notes
For Measuring Up 2008, income and education distributions were extracted from the Census Bureau’s 2005 and 2006 American Community Survey (Public Use Microdata Sample). These two surveys were combined to help minimize statistical error and maximize analytical detail within the analysis. Calculations for Measuring Up 2006 were based on three years of data (2003, 2004, and 2005) from the much smaller Current Population Survey (CPS).
Calculations for Measuring Up 2008 reflect potential additional earnings generated by working-age (ages 16 and over) minority groups as a whole. In
62
contrast, calculations for Measuring Up 2006 restrict potential additional earnings to employed civilians (ages 16 and over) within each group. Also, calculations for Measuring Up 2008 split minorities into five separate groups across six different education levels, whereas calculations for Measuring Up 2006 split minorities into three separate groups across two education levels. Thus, the methodology for Measuring Up 2008 maximizes net revenue loss and is a less conservative calculation than was used for Measuring Up 2006.
8.2 INTERNATIONAL COMPARISONS
Measuring Up 2008 includes international comparisons for all 50 states and for the nation as a whole. This information provides a perspective about how well the nation and the states are developing the knowledge and skills essential for the global economy. Comparisons are made with the member countries of the Organisation for Co-operation and Economic Development (OECD). Although the Organisation currently has 30 member countries, the availability of data to compare performance on international indicators varies by country.
International comparisons at the state level are provided for three indicators, which are closely aligned with the Measuring Up indicators. As with other data in Measuring Up, the international measures are based on the most current data available. In general, the data for the United States, each of the 50 states, and the other countries are from 2006. The following list details the international indicators and the data sources.
Participation: Percent of young adults (ages 18 to 24) enrolled in college
Sources
For the United States and the 50 states
National Center for Education Statistics. Integrated Postsecondary Education Data System (IPEDS). 2007 Fall Enrollment Survey. U.S. Bureau of the Census. Population Estimates July 2007.
For other countries
Data provided by Alan Wagner (State University of New York at Albany), based on the Organisation for Economic Co-operation and Development (OECD) database available at www.oecd.org. Data are for 2006.
Description
This OECD indicator is closely aligned with the similar indicator in the graded Participation category in Measuring Up. It measures the proportion of traditional college-age youth, ages 18 to 24, who are currently enrolled in undergraduate
63
education and training programs, including both full- and part-time enrollment. The formula used is:
Numerator: Number of adults, ages 18 to 24, enrolled in undergraduate programs.
Denominator: Total number of population, ages 18 to 24.
Data Availability
Data are available for 26 countries, including the United States, and the 50 states.
Completion: Number of certificates and degrees awarded per 100 students enrolled
Sources
For the United States and the 50 states
Total Undergraduate Awards 2006–07. National Center for Education Statistics (NCES). Integrated Postsecondary Education Data System (IPEDS) Peer Analysis System (PAS). 2006–07 Completions File. c2007_a Early Release Data File accessed 04-28-08. http://www.nces.ed.gov/ipedspas/.
Undergraduate Enrollments, Fall 2006: National Center for Education Statistics (NCES), Integrated Postsecondary Education Data System (IPEDS) Peer Analysis System (PAS). Fall 2006 Enrollment File; ef2006a Early Release Data File accessed 12-21-07; http://www.nces.ed.gov/ipedspas/
For other countries
Data provided by Alan Wagner (State University of New York at Albany), based on the Organisation for Economic Co-operation and Development (OECD) database available at www.oecd.org. Data are for 2006.
Description
This measure, which is calculated the same way as the similar indicator in the graded Completion category, assesses the total number of undergraduate certificates and degrees completed relative to the total number of undergraduates enrolled. It uses the following calculation:
Numerator: Total number of certificates and associate’s and bachelor’s degrees awarded throughout the 2006–07 academic year.
Denominator: Total headcount undergraduate enrollment (both full-time and part-time students) in fall 2007.

64
Notes
The data from other countries account for the types of awards that are roughly equivalent to undergraduate certificates and degrees in the U.S. system. In the OECD classification, these awards are classified as tertiary type A (‘first degrees’ only) and type B programs. The enrollment figures do not account for the programs of less than two-year duration. For the U.S. and states, data represent all Title IV participating higher education institutions.
Data Availability
Data are available for 29 countries, including the United States, and the 50 states.
Benefits (Educational Level of Adult Population): Percent of adults (ages 25 to 34) holding an associate’s degree or higher
Benefits (Educational Level of Adult Population): Percent of adults (ages 35 to 64) holding an associate’s degree or higher
Sources
For the 50 states
U.S. Bureau of the Census. 2006 American Community Survey.
For the United States and other countries
Data provided by Alan Wagner (State University of New York at Albany), based on the Organisation for Economic Co-operation and Development (OECD) database available at www.oecd.org. Data are for 2006.
Description
These measures examine the educational attainment level of the working-age population. A similar indicator is included in the graded Benefits category in Measuring Up, which focuses on the entire working-age adult population (25- to 64-year-olds). In contrast, a comparison of these two measures highlights the education progress over time by tracing the attainment gaps between two age groups, using the following calculation.
Younger Adults:
Numerator: Number of adults, ages 25 to 34, holding an associate’s degree or higher.
Denominator: Number of adults, ages 25 to 34.

65
Older Adults:
Numerator: Number of adults, ages 35 to 64, holding an associate’s degree or higher.
Denominator: Number of adults, ages 35 to 64.
Notes
The OECD data for other countries report all tertiary degrees, which are equivalent to associate’s degrees, bachelor’s degrees, and postgraduate degrees in the U.S. system.
Data Availability
Data are available for 30 countries, including the United States, and the 50 states.
8.3 ADDITIONAL INFORMATION (INCLUDED IN STATE REPORT CARDS)
8.3.1 State Context
State population (2007)
Source
U.S. Census Bureau. Population Estimates Program. July 1, 2007 Population Estimates for the Nation and States. American FactFinder Downloadable Tables. www.factfinder.census.gov. Data accessed 08-11-08.
Gross state product (2007)
Source
Bureau of Economic Analysis. U.S. Department of Commerce. Gross Domestic Product in Current Dollars (2007, in millions). http://www.bea.gov/regional/gsp/. Data accessed 07-09-08.
8.3.2 Leading Indicators
Projected percentage change in population (2005–2025)
Source
U.S. Census Bureau. Population Division. Interim State Population Projections, 2005. Table 6: Interim Projections: Total Population for Regions, Divisions, and States. 2000 to 2030. http://www.census.gov/population/www/projections/projectionsagesex.html. Internet Release Date: April 21, 2005.
66
Projected percentage change in number of all high school graduates (2005–2022)
Source
Western Interstate Commission for Higher Education (WICHE). Knocking at the College Door: Projections of High School Graduates by State, Income, and Race/Ethnicity, 1992–2022. Boulder, CO: 2007.
Projected budget surplus/shortfall (2005 to 2013)
Source
Dennis Jones. “State Shortfalls Projected to Continue Despite Economic Gains.” Policy Alert, February 2006. San Jose, CA: The National Center for Public Policy and Higher Education: 2006.
Average income of the poorest 20% of population (2006)
Source
Steven Ruggles, Matthew Sobek, Trent Alexander, Catherine A. Fitch, Ronald Goeken, Patricia Kelly Hall, Miriam King, and Chad Ronnander. Integrated Public Use Microdata Series: Version 4.0 [Machine-readable database]. Minneapolis, MN: Minnesota Population Center [producer and distributor], 2008. http://usa.ipums.org/usa/. Data based on the U.S. Census Bureau’s 2006 American Community Survey (Public Use Microdata Sample).
Notes
This indicator is now calculated using data from the 2006 American Community Survey (Public Use Microdata Sample). Results for Measuring Up 2006 were calculated using three combined years (2003, 2004, and 2005) of the Current Population Survey and were provided by Research Triangle Institute.
Children in poverty (2006)
Source
U.S. Census Bureau. 2006 American Community Survey. Table B17006: Poverty status in the past 12 months of related children under 18 years by family type by age of related children under 18 years. American FactFinder Downloadable Tables. www.factfinder.census.gov. Data accessed 08-12-08.

67
Percent of adult population with less than a high school diploma or equivalent (2006)
Source
U.S. Census Bureau. 2006 American Community Survey. Table B15002: Sex by educational attainment for the population 25 years and over. American FactFinder Downloadable Tables. www.factfinder.census.gov. Data accessed 07-17-08.
New economy index (2007)
Source
Kauffman Foundation. The 2007 State New Economy Index: Benchmarking Economic Transformation in the States. http://www.kauffman.org/pdf/2007_State_Index.pdf. Publication accessed 07-09-08.
8.3.3 Facts and Figures
Institutions of postsecondary education (2007–08)
Source
National Center for Education Statistics (NCES). Integrated Postsecondary Education Data System (IPEDS). Peer Analysis System (PAS). 2007–08 Institutional Characteristics File. hd2007 Final Release Data File accessed 04-27-08. http://www.nces.ed.gov/ipedspas/.
Students (undergraduate) enrolled by institution type (fall 2006)
Students enrolled by level (fall 2006)
Enrollment status of students, full- and part-time (fall 2006)
Source
National Center for Education Statistics (NCES). Integrated Postsecondary Education Data System (IPEDS) Peer Analysis System (PAS). Fall 2006 Enrollment File. ef2006a Early Release Enrollment File accessed 12-21-07. http://www.nces.ed.gov/ipedspas/.
Note
Fall 2007 enrollments were not available in time for inclusion.
68
Net migration of students (fall 2006)
Source
National Center for Education Statistics (NCES). Integrated Postsecondary Education Data System (IPEDS) Peer Analysis System (PAS). Fall 2006 Residence and Migration of First-Time Freshman File. EF2006C Final Release Data File accessed 12-21-07. http://www.nces.ed.gov/ipedspas/.
Note
Institutions are not required to report migration data for fall 2007 (odd years optional).
Average tuition and fees (2007–08)
Sources
Tuition and fee charges, 2007–08. National Center for Education Statistics (NCES), Integrated Postsecondary Education Data System (IPEDS) Peer Analysis System (PAS). 2007–08 Institutional Characteristics File. ic2007_ay Early Release Data File accessed 04-28-08. http://www.nces.ed.gov/ipedspas/.
Note: Data reflect tuition and fee charges for first-time, full-time certificate/degree-seeking undergraduates.
First-time, full-time certificate/degree-seeking undergraduate enrollment, fall 2006. National Center for Education Statistics (NCES). Integrated Postsecondary Education Data System (IPEDS) Peer Analysis System (PAS). Fall 2006 Enrollment File. ef2006a Early Release Enrollment File accessed 12-21-07. http://www.nces.ed.gov/ipedspas/.
Notes: Fall 2007 enrollments were not available in time for use in the 2007–08 cost analysis. Also, state figures are weighted averages (by first-time, full-time certificate/degree-seeking enrollment) of reported institution-level tuition and fee charges.
State and local appropriations for higher education (FY 2006)
Source
Center for the Study of Higher Education. Illinois State University 2008. Grapevine: An Annual Compilation of Data on State Tax Appropriations for the General Operation of Higher Education. http://www.grapevine.ilstu.edu/tables/index.htm. Table 5 downloaded 06-24-08.

69
THE NATIONAL CENTER FOR PUBLIC POLICY AND HIGHER EDUCATION
The National Center for Public Policy and Higher Education promotes public policies that enhance Americans’ opportunities to pursue and achieve high-quality education and training beyond high school. As an independent, nonprofit, nonpartisan organization, the National Center prepares action-oriented analyses of pressing policy issues facing the states and the nation regarding opportunity and achievement in higher education—including two- and four-year, public and private, for-profit and nonprofit institutions. The National Center communicates performance results and key findings to the public, to civic, business, and higher education leaders, and to state and federal leaders who are in positions to improve higher education policy.
Established in 1998, the National Center is not affiliated with any institution of higher education, with any political party, or with any government agency.
152 North Third Street, Suite 705, San Jose, California 95112 Telephone: 408-271-2699 FAX: 408-271-2697
www.highereducation.org
NATIONAL CENTER PUBLICATIONS
The National Center publishes:
• Reports and analyses commissioned by the National Center,
• Reports and analyses written by National Center staff,
• National Center Policy Reports that are approved by the National Center’s Board of Directors, and
• National CrossTalk, a quarterly publication.
The following National Center publications—as well as a host of other information and links—are available at www.highereducation.org. Single copies of most of these reports are also available from the National Center. Please FAX requests to 408-271-2697 and ask for the report by publication number.
Measuring Up 2008: The National Report Card on Higher Education. Measuring Up 2008 consists of a national report card for higher education (November 2008, #08-4) and 50 state report cards (#08-3). The purpose of Measuring Up is to provide the public and policymakers with information to assess and improve postsecondary education in each state. Measuring Up 2008 finds that despite modest improvements nationally, large disparities in higher education performance persist, and the nation’s global competitiveness is eroding. Visit www.highereducation.org to download Measuring Up 2008 or to make your own comparisons of state performance in higher education.
70
Technical Guide for Measuring Up 2008: Documenting Methodology, Indicators, and Data Sources (November 2008, #08-5).
The Iron Triangle: College Presidents Talk About Costs, Access, and Quality (October 2008, #08-2). This report by Public Agenda explores how college and university presidents view higher education today. Researchers surveyed the presidents on topics including cost, access, and quality, and found a disconnect between the presidents’ perspectives on higher education and that of the general public.
Partnerships for Public Purposes: Engaging Higher Education in Societal Challenges of the 21st Century (April 2008, #08-1). This report summarizes the discussion from an invitational roundtable that engaged 15 leaders in higher education. The essay finds that colleges and universities have become preoccupied with advancing their prestige instead of achieving publicly defined purposes, and calls for the restoration of a greater sense of public purpose to learning in ways that directly meet the country’s educational needs for the 21st century.
Good Policy, Good Practice: Improving Outcomes and Productivity in Higher Education: A Guide for Policymakers, by Patrick M. Callan, Peter T. Ewell, Joni E. Finney, and Dennis P. Jones (November 2007, #07-4). This report describes a wide range of successful strategies that states can draw from to increase the educational attainment of their residents while holding down higher education costs. The report also identifies five policy levers that state leaders can use to achieve their overall goals for higher education and, more specifically, to implement the strategies for increasing educational attainment levels.
Investigating the Alignment of High School and Community College Assessments in California, by Richard S. Brown and David N. Niemi (May 2007, #07-3). This study, in examining the math and English expectations for high school students entering California’s community colleges, reveals the degree of alignment between what students master in high school versus what is expected for college-level work.
Squeeze Play: How Parents and the Public Look at Higher Education Today, by John Immerwahr and Jean Johnson (May 2007, #07-4). This report by Public Agenda explores how the American public views higher education. Funding for the research was provided by Lumina Foundation for Education as part of its Making Opportunity Affordable initiative.
“Informed Self-Placement” at American River College: A Case Study, by Jonathan E. Felder, Joni E. Finney, and Michael W. Kirst (May 2007, #07-2). This case study of American River College in Sacramento, California, examines replacing the traditional mathematics class placement test with “informed self-placement.”
California Community Colleges: Making Them Stronger and More Affordable, by William Zumeta and Deborah Frankle (March 2007, #07-1). This report examines the effectiveness of statewide policies in assisting the California Community Colleges in meeting their mandate for affordability, and makes recommendations in light of today’s public needs.
Measuring Up Internationally: Developing Skills and Knowledge for the Global Knowledge Economy, by Alan Wagner (September 2006, #06-7). In comparing the performance of the United States in higher education with that of advanced, market-economy countries across the globe, this report finds that the United States’ leadership position has eroded.
Measuring Up 2006: The National Report Card on Higher Education (September 2006). Measuring Up 2006 consists of a national report card for higher education (report #06-5) and 50 state report cards (#06-
71
4). The purpose of Measuring Up 2006 is to provide the public and policymakers with information to assess and improve postsecondary education in each state. For the first time, this edition offers international comparisons with states and the nation as a whole. Visit www.highereducation.org to download Measuring Up 2006 or to make your own comparisons of state performance in higher education.
Technical Guide for Measuring Up 2006: Documenting Methodology, Indicators, and Data Sources (2006, #06-6).
Checks and Balances at Work: The Restructuring of Virginia’s Public Higher Education System, by Lara K. Couturier (June 2006, #06-3). This case study of Virginia’s 2005 Restructured Higher Education Financial and Administrative Operations Act examines the restructured relationship between the commonwealth and its public colleges and universities. The act gives more autonomy to the public colleges but checks it with new accountability targeted directly to the needs of the state.
American Higher Education: How Does It Measure Up for the 21st Century? by James B. Hunt Jr. and Thomas J. Tierney with a foreword by Garrey Carruthers (May 2006, #06-2). These essays by former Governor James B. Hunt Jr. and business leader Thomas J. Tierney lay out in succinct fashion the requirements of both our nation and our states for new and higher levels of performance from America’s colleges and universities.
Claiming Common Ground: State Policymaking for Improving College Readiness and Success, by Patrick M. Callan, Joni E. Finney, Michael W. Kirst, Michael D. Usdan, and Andrea Venezia (March 2006, #06-1). To improve college readiness and success, states can develop policies that better connect their K–12 and postsecondary education systems. However, state action in each of the following policy areas is needed to create college-readiness reform: alignment of coursework and assessments; state finance; statewide data systems; and accountability.
Measuring Up on College-Level Learning, by Margaret A. Miller and Peter T. Ewell (October 2005, #05-8). In this report, the National Forum on College-Level Learning proposes a model for evaluating and comparing college-level learning on a state-by-state basis, including assessing educational capital. As well as releasing the results for five participating states, the authors also explore the implications of their findings in terms of performance gaps by race/ethnicity and educating future teachers.
The Governance Divide: A Report on a Four-State Study on Improving College Readiness and Success, by Andrea Venezia, Patrick M. Callan, Joni E. Finney, Michael W. Kirst, and Michael D. Usdan (September 2005, #05-3). This report, supported by case studies in Florida, Georgia, New York, and Oregon, identifies and examines policy options available to states that are interested in creating sustained K–16 reform.
The Governance Divide: The Case Study for Florida, by Andrea Venezia and Joni E. Finney (2006, #05-4).
The Governance Divide: The Case Study for Georgia, by Andrea Venezia, Patrick M. Callan, Michael W. Kirst, and Michael D. Usdan (2006, #05-5).
The Governance Divide: The Case Study for New York, by Andrea Venezia, Michael W. Kirst, and Michael D. Usdan (2006, #05-6).

72
The Governance Divide: The Case Study for Oregon, by Andrea Venezia and Michael W. Kirst (2006, #05-7).
Borrowers Who Drop Out: A Neglected Aspect of the College Student Loan Trend, by Lawrence Gladieux and Laura Perna (May 2005, #05-2). This report examines the experiences of students who borrow to finance their educations, but do not complete their postsecondary programs. Using the latest comprehensive data, this report compares borrowers who drop out with other groups of students, and provides recommendations on policies and programs that would better prepare, support, and guide students—especially low-income students—in completing their degrees.
Case Study of Utah Higher Education, by Kathy Reeves Bracco and Mario Martinez (April 2005, #05-1). This report examines state policies and performance in the areas of enrollment and affordability. Compared with other states, Utah has been able to maintain a system of higher education that is more affordable for students, while enrollments have almost doubled over the past 20 years.
Measuring Up 2004: The National Report Card on Higher Education (September 2004). Measuring Up 2004 consists of a national report card for higher education (report #04-5) and 50 state report cards (#04-4). The purpose of Measuring Up 2004 is to provide the public and policymakers with information to assess and improve postsecondary education in each state. For the first time, this edition provides information about each state’s improvement over the past decade. Visit www.highereducation.org to download Measuring Up 2004 or to make your own comparisons of state performance in higher education.
Technical Guide Documenting Methodology, Indicators, and Data Sources for Measuring Up 2004 (November 2004, #04-6).
Ensuring Access with Quality to California’s Community Colleges, by Gerald C. Hayward, Dennis P. Jones, Aims C. McGuinness, Jr., and Allene Timar, with a postscript by Nancy Shulock (May 2004, #04-3). This report finds that enrollment growth pressures, fee increases, and recent budget cuts in the California Community Colleges are having significant detrimental effects on student access and program quality. The report also provides recommendations for creating improvements that build from the state policy context and from existing promising practices within the community colleges.
Public Attitudes on Higher Education: A Trend Analysis, 1993 to 2003, by John Immerwahr (February 2004, #04-2). This public opinion survey, prepared by Public Agenda for the National Center, reveals that public attitudes about the importance of higher education have remained stable during the recent economic downturn. The survey also finds that there are some growing public concerns about the costs of higher education, especially for those groups most affected, including parents of high school students, African-Americans, and Hispanics.
Responding to the Crisis in College Opportunity (January 2004, #04-1). This policy statement, developed by education policy experts at Lansdowne, Virginia, proposes short-term emergency measures and long-term priorities for governors and legislators to consider for funding higher education during the current lean budget years. Responding to the Crisis suggests that in 2004, the highest priority for state higher education budgets should be to protect college access and affordability for students and families.
With Diploma in Hand: Hispanic High School Seniors Talk About Their Future, by John Immerwahr (June 2003, #03-2). This report by Public Agenda explores some of the primary obstacles that many
73
Hispanic students face in seeking higher education—barriers that suggest opportunities for creative public policy to improve college attendance and completion rates among Hispanics.
Purposes, Policies, Performance: Higher Education and the Fulfillment of a State’s Public Agenda (February 2003, #03-1). This essay is drawn from discussions of higher education leaders and policy officials at a roundtable convened in June 2002 at New Jersey City University on the relationship between public purposes, policies, and performance of American higher education.
Measuring Up 2002: The State-by-State Report Card for Higher Education (October 2002, #02-7). This report card, which updates the inaugural edition released in 2000, grades each state on its performance in five key areas of higher education. Measuring Up 2002 also evaluates each state’s progress in relation to its own results from 2000.
Technical Guide Documenting Methodology, Indicators, and Data Sources for Measuring Up 2002 (October 2002, #02-8).
State Policy and Community College-Baccalaureate Transfer, by Jane V. Wellman (July 2002, #02-6). This report recommends state policies to energize and improve higher education performance regarding transfers from community colleges to four-year institutions.
Fund for the Improvement of Postsecondary Education: The Early Years (June 2002, #02-5). The Fund for the Improvement of Postsecondary Education (FIPSE) attained remarkable success in funding innovative and enduring projects during its early years. This report, prepared by FIPSE’s early program officers, describes how those results were achieved.
Losing Ground: A National Status Report on the Affordability of American Higher Education (May 2002, #02-3). This national status report documents the declining affordability of higher education for American families, and highlights public policies that support affordable higher education. It provides state-by-state summaries as well as national findings.
The Affordability of Higher Education: A Review of Recent Survey Research, by John Immerwahr (May 2002, #02-4). This review of recent surveys by Public Agenda confirms that Americans feel that rising college costs threaten to make higher education inaccessible for many people.
Coping with Recession: Public Policy, Economic Downturns, and Higher Education, by Patrick M. Callan (February 2002, #02-2). This report outlines the major policy considerations that states and institutions of higher education face during economic downturns.
Competition and Collaboration in California Higher Education, by Kathy Reeves Bracco and Patrick M. Callan (January 2002, #02-1). This report argues that the structure of California’s state higher education system limits the system’s capacity for collaboration.
Measuring Up 2000: The State-by-State Report Card for Higher Education (November 2000, #00-3). This first-of-its-kind report card grades each state on its performance in higher education. The report card also provides comprehensive profiles of each state and brief states-at-a-glance comparisons.
Beneath the Surface: A Statistical Analysis of the Major Variables Associated with State Grades in Measuring Up 2000, by Alisa F. Cunningham and Jane V. Wellman (November 2001, #01-4). Using statistical analysis, this report explores the “drivers” that predict overall performance in Measuring Up 2000.

74
Supplementary Analysis for Measuring Up 2000: An Exploratory Report, by Mario Martinez (November 2001, #01-3). This supplement explores the relationships within and among the performance categories in Measuring Up 2000.
Some Next Steps for States: A Follow-up to Measuring Up 2000, by Dennis Jones and Karen Paulson (June 2001, #01-2). This report suggests a range of actions that states can take to bridge the gap between state performance identified in Measuring Up 2000 and the formulation of effective policy to improve performance in higher education.
A Review of Tests Performed on the Data in Measuring Up 2000, by Peter Ewell (June 2001, #01-1). This review describes the statistical testing performed on the data in Measuring Up 2000 by the National Center for Higher Education Management Systems.
Recent State Policy Initiatives in Education: A Supplement to Measuring Up 2000, by Aims C. McGuinness, Jr. (December 2000, #00-6). This supplement highlights education initiatives that states have adopted since 1997–1998.
Assessing Student Learning Outcomes: A Supplement to Measuring Up 2000, by Peter Ewell and Paula Ries (December 2000, #00-5). This report is a national survey of state efforts to assess student-learning outcomes in higher education.
Technical Guide Documenting Methodology, Indicators, and Data Sources for Measuring Up 2000 (November 2000, #00-4).
A State-by-State Report Card on Higher Education: Prospectus (March 2000, #00-1). This document summarizes the goals of the National Center’s report-card project.
Great Expectations: How the Public and Parents—White, African-American, and Hispanic—View Higher Education, by John Immerwahr with Tony Foleno (May 2000, #00-2). This report by Public Agenda finds that Americans overwhelmingly see higher education as essential for success. Survey results are also available for the following states:
Great Expectations: How Pennsylvanians View Higher Education (May 2000, #00-2b). Great Expectations: How Floridians View Higher Education (August 2000, #00-2c). Great Expectations: How Coloradans View Higher Education (August 2000, #00-2d). Great Expectations: How Californians View Higher Education (August 2000, #00-2e). Great Expectations: How New Yorkers View Higher Education (October 2000, #00-2f). Great Expectations: How Illinois Residents View Higher Education (October 2000, #00-2h).
State Spending for Higher Education in the Next Decade: The Battle to Sustain Current Support, by Harold A. Hovey (July 1999, #99-3). This fiscal forecast of state and local spending patterns finds that the vast majority of states will face significant fiscal deficits over the next eight years, which will in turn lead to increased scrutiny of higher education in almost all states, and to curtailed spending for public higher education in many states.
South Dakota: Developing Policy-Driven Change in Higher Education, by Mario Martinez (June 1999, #99-2). This report describes the processes for change in higher education that government, business, and higher education leaders are creating and implementing in South Dakota.

75
Taking Responsibility: Leaders’ Expectations of Higher Education, by John Immerwahr (January 1999, #99-1). This paper reports the views of those most involved with decision-making about higher education, based on focus groups and a survey conducted by Public Agenda.
The Challenges and Opportunities Facing Higher Education: An Agenda for Policy Research, by Dennis Jones, Peter Ewell, and Aims McGuinness, Jr. (December 1998, #98-8). This report argues that due to substantial changes in the landscape of postsecondary education, new state-level policy frameworks must be developed and implemented.
Higher Education Governance: Balancing Institutional and Market Influences, by Richard C. Richardson, Jr., Kathy Reeves Bracco, Patrick M. Callan, and Joni E. Finney (November 1998, #98-7). This publication describes the structural relationships that affect institutional effectiveness in higher education, and argues that state policy should strive for a balance between institutional and market forces.
Federal Tuition Tax Credits and State Higher Education Policy: A Guide for State Policy Makers, by Kristin D. Conklin (December 1998, #98-6). This report examines the implications of the federal income tax provisions for students and their families, and makes recommendations for state higher education policy.
The Challenges Facing California Higher Education: A Memorandum to the Next Governor of California, by David W. Breneman (September 1998, #98-5). This memorandum argues that California should develop a new Master Plan for Higher Education.
Tidal Wave II Revisited: A Review of Earlier Enrollment Projections for California Higher Education, by Gerald C. Hayward, David W. Breneman, and Leobardo F. Estrada (September 1998, #98-4). This review finds that earlier forecasts of a surge in higher education enrollments were accurate.
Organizing for Learning: The View from the Governor’s Office, by James B. Hunt Jr., chair of the National Center for Public Policy and Higher Education, and former governor of North Carolina (June 1998, #98-3). This publication is an address to the American Association for Higher Education concerning opportunity in higher education.
The Price of Admission: The Growing Importance of Higher Education, by John Immerwahr (Spring 1998, #98-2). This report is a national survey of Americans’ views on higher education, conducted and reported by Public Agenda.
Concept Paper: A National Center to Address Higher Education Policy, by Patrick M. Callan (March 1998, #98-1). This concept paper describes the purposes of the National Center for Public Policy and Higher Education.
www.highereducation.org