
SEBIBULLETIN
February 2012 VOL. 10 NuMber 2
^maVr¶ à{V^y{V Am¡a {d{Z‘¶ ~moS>©Securities And Exchange Board Of India

eDITOrIaL COMMITTee
• Mr.AnantaBarua
• Mr.J.Ranganayakulu
• Mr.NagenderParakh
• Dr.AnilKumarSharma
The Securities and Exchange Board of India Bulletin is issued by the Department of Economic and Policy Analysis, Securities and Exchange Board of India under the direction of an Editorial Committee. SEBI is not responsible for accuracy of data/information/ interpretations and opinions expressed in the case of signed articles/speeches as authors are responsible for their personal views. SEBI has no objection to the material published herein being reproduced, provided an acknowledgement of the same is made. This monthly Bulletin is normally published in the third week of the succeeding month. The soft copy of SEBI Bulletin is available free of cost to the subscribers/readers, who register at [email protected] along with their complete address. A readable version of SEBI Bulletin is available at http://www.sebi.gov.in. Any comments and suggestions on any of the features/ sections may be sent to [email protected].

Contents
Page
CAPITALMARKETREVIEW 93
PRESSRELEASES 106
A. General 106
1. Toll-free Helpline Service for Investors 106
2. SEBI Board Meeting Held on 3rd January 2012 106
i. Manner of Increasing Minimum Public Shareholding to 106 Comply with Securities Contracts Regulation (Rules), 1957
ii. Amendment to SEBI (Buyback of Securities) Regulations, 1998 107
3. Rejection of Request for Exemption of M/s. Futuristics Garments 108 Private Limited (Acquirer) for the Proposed Acquisition of Shares of M/s. Surya Pharmaceuticals Limited (Target Company)
4. Grant of Exemption to Mr. Bijay Kumar Garodia , Mr. Ramesh Kumar 108 Sarawagi and Mr. Shankar Lall Ajitsaria (Acquirers) for the Proposed Acquisition of Shares of M/s. Kharikatia Tea & Industries Limited (Target Company)
5. Grant of Exemption to Mr. Vinod Kumar Agrawal, Mr. Subash Chand 109 Agrawal, M/s. R N Commotrade Private Limited and M/s. Singhal General Traders Private Limited (Acquirers) for the Proposed Acquisition of Shares of M/s. MSD Properties Limited (Target Company)
6. First Meeting of SEBI’s International Advisory Board 109
7. SEBI Board Meeting Held on 28th January 2012 111
i. Reservation to Holders of Convertible Debt Securities in 111 Rights/Bonus Issues
ii. Waiver of Certain Requirements Relating to Preferential Allotment 111 to Insurance Companies and Mutual Funds
iii. Amendment to SEBI (Mutual Fund) Regulations, 1996 111
iv. Amendment to SEBI (Portfolio Managers) Regulations, 1993 112

B. Order
1. Order in the Matter of M/s. Sound craft Industries Ltd., M/s. Kolar Biotech Ltd. 112 and M/s. Adam Comsof Ltd.
2. Order in the Matter of M/s. Empower Industries India Ltd. 1133. Order in Respect of M/s. Khandwala Securities Limited in the Matter of M/s. Kopran Limited 1134. Order in Respect of M/s. Jayantilal Khandwala & Sons Private Limited in the Matter of 113
M/s. Kopran Limited5. Order in Respect of M/s. VSB Investments P. Ltd. in the Matter of Trading by 113
Connected Entities6. Order in Respect of M/s. Neptune Securities Pvt. Ltd. in the Matter of 113
M/s. Priyans Saree Industries Ltd.7. Order in Respect of M/s. Sanchay Fincom Limited in the Matter of 113
M/s. T. Spiritual World Limited8. Order in Respect of Sh. Adolf Pinto in the Matter of M/s. T. Spiritual World Limited 113
CIrCuLar
1. Changes In Re-Investment Period of FII Debt Limit 1142. Disclosure of Track Record of the Public Issues Managed by Merchant Bankers 1153. Investment by Qualified Foreign Investors (QFI) in Indian Equity Shares. 1164. Call Auction in Pre-open session for Initial Public Offering (IPO) and Other Category of Scrips 1245. Trade Controls in Normal Trading Session for Initial Public Offering (IPO) and Other
Category of Scrips. 1266. Investor Grievance Redressal Mechanism at Stock Exchanges 1287. Composition of Arbitration Committee 1298. Eligibility criteria for Qualified Depository Participant 130
ORDERPASSEDBYADJUDICATINGOFFICERANDCHAIRMAN/MEMBERS 131
HIGHLIGHTSOFDEVELOPMENTSININTERNATIONALSECURITIESMARKET 138
aNNeX 141
PUBLICATIONS 200
93
FEBRUARY SEBI BULLETIN 2012
1. TrendsinPrimaryMarket
A. EquityandDebtIssue
During January 2012, an aggregate amount of ` 6,300 crore was mobilised through one public debt issue compared to three debt issues worth ` 10,759.3 crore in December 2011. January 2012, like the last three months, did not see a single equity issue made in the primary market. The
CAPITALMARKETREVIEW
cumulative amount mobilised for the financial year 2011-12, so far, stands at ` 34,463.4 crore through 52 issues as against ` 54,097.9 crore raised through 70 issues during the corresponding period in 2010-11.
Table1:PrimaryMarketTrends
ItemsJan-12 Dec-11 2011-12$ 2010-11$
No. of Issues
Amount(`crore)
No. of Issues
Amount(`crore)
No. of Issues
Amount(`crore)
No. of Issues
Amount(`crore)
1 2 3 4 5 6 7 8 9a) Public Issues (i) +(ii) 1 6,300.0 3 10,759.3 42 32,375.8 56 50,046.9i) Public issue (Equity) 0 0.0 0 0.0 30 9,559.0 52 47,801.9 of which IPOs 0 0.0 0 0.0 29 4,980.8 47 34,706.9 FPOs 0 0.0 0 0.0 1 4,578.2 5 13,095.1ii) Public Issue (Debt)* 1 6,300.0 3 10,759.3 12 22,816.8 4 2,245.0b) Rights Issues 0 0.0 0 0.0 10 2,087.6 14 4,051.0Total Equity Issues (i+b) 0 0.0 0 0.0 40 11,646.6 66 51,852.9Total(a+b) 1 6,300.0 3 10,759.3 52 34,463.4 70 54,097.9IPOsimplyInitialPublicOffers,FPOsimplyFollowonPublicOffers.NCDimpliesNonConvertibleDebenture.*IndicatesthefiguresforthemonthofDecember2011andJanuary2012areprovisional.$AsonlasttradingdayofJanuary.
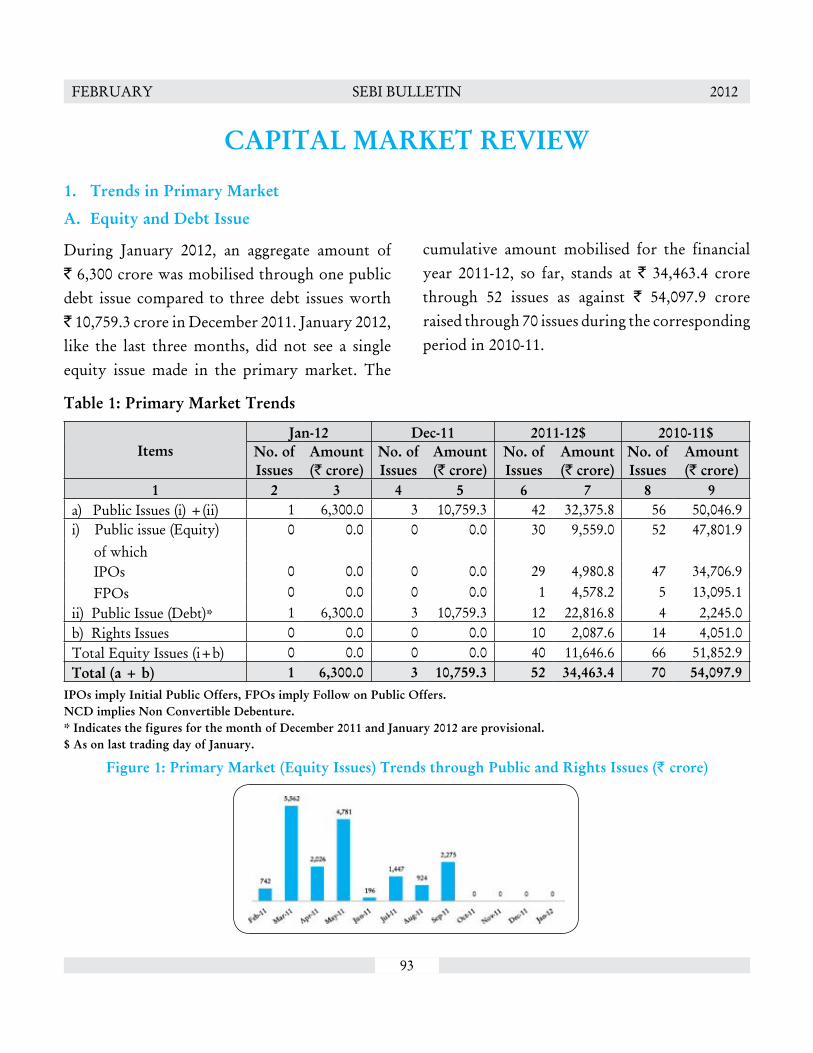
Figure1:PrimaryMarket(EquityIssues)TrendsthroughPublicandRightsIssues(` crore)

94
FEBRUARY SEBI BULLETIN 2012
B. QIPsListedatBSEandNSE
mobilised amount for the financial year 2011-12, so far, stood at ` 1,043 crore through eight issues (of which seven are listed at both BSE and NSE) (DetailsinAnnex–Table9).
C. PreferentialAllotmentsListedatBSEandNSE
There were 34 preferential allotments (` 738 crore) listed at BSE and NSE during January 2012 as compared to 19 preferential allotments (` 517 crore) in December 2011. The cumulative mobilised amount for the financial year 2011-
12, so far, stood at ` 21,777 crore through 268 preferential allotments (of which 79 allotments amounting ` 15,642 crore were listed at both BSE and NSE) (DetailsinAnnex–Table10).
D. PrivatePlacementofCorporateDebtReportedtoBSEandNSE
In the corporate debt market, ` 25,414 crore was raised through 158 issues by way of private placement listed at BSE and NSE during January 2012 compared to ` 31,896 crore raised through 232 issues in December 2011. The cumulative privately placed amount for the financial year
2011-12, so far, stood at ` 2,13,945 crore through 1,562 issues (of which 919 issues of ` 1,55,582 crore reported to only NSE, 630 issues of ` 46,993 crore reported to only BSE and 13 issues of ` 11,370 crore reported to both BSE and NSE) (DetailsinAnnex–Table11).
E. ResourceMobilisationbyMutualFunds
During January 2012, Mutual Funds mobilised ` 23,553 crore (of which ` 18,075 crore was mobilised by private sector mutual funds and ` 5,478 crore by public sector mutual funds) as compared to ` 63,420 crore liquidated (of which ` 57,291 crore was liquidated from private sector mutual funds and ` 6,129 crore from public sector mutual funds) during December 2011.
During the financial year 2011-12, so far, mutual funds mobilised ` 60,471 crore as compared to ` 52,289 crore mobilised during the corresponding period in 2010-11. The market value of assets under management stood at ` 6,59,153 crore as on January 31, 2012 as compared to ` 6,11,402 crore as on December 30, 2011, indicating an increase of 7.8 percent (DetailsinAnnex-Table45).
II.TrendsIntheSecondaryMarket
During January 2012, one listed company raised capital of ` 3 crore from Primary Market through QIP channel compared to ̀ 68 crore raised through one issue in December 2011. The cumulative
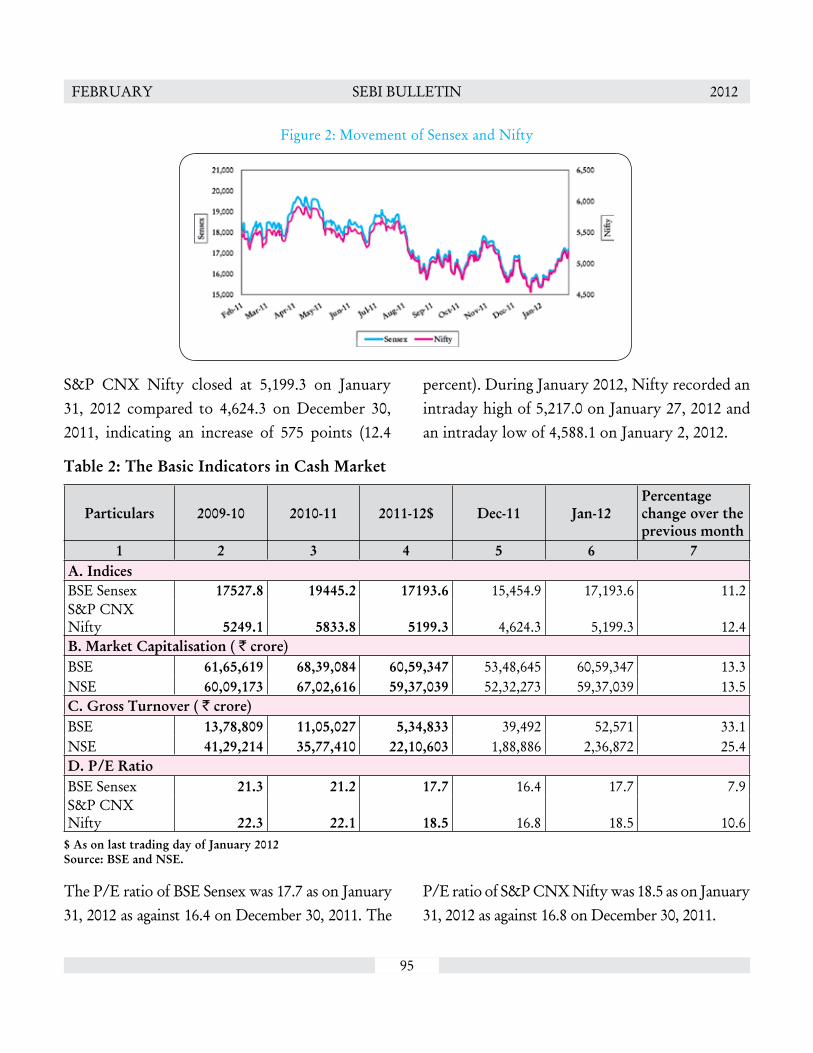
BSE Sensex closed at 17,193.6 on January 31, 2012, as against 15,454.9 on December 30, 2011, registering an increase of 1738.7 points (11.2 percent). During
January 2012, Sensex recorded an intraday high of 17,259.0 on January 27, 2012 and an intraday low of 15,358.0 on January 2, 2012.
95
FEBRUARY SEBI BULLETIN 2012
Figure 2: Movement of Sensex and Nifty
Table2:TheBasicIndicatorsinCashMarket
Particulars 2009-10 2010-11 2011-12$ Dec-11 Jan-12Percentagechangeoverthepreviousmonth
1 2 3 4 5 6 7A.IndicesBSE Sensex 17527.8 19445.2 17193.6 15,454.9 17,193.6 11.2S&P CNX Nifty 5249.1 5833.8 5199.3 4,624.3 5,199.3 12.4B.MarketCapitalisation(`crore)BSE 61,65,619 68,39,084 60,59,347 53,48,645 60,59,347 13.3NSE 60,09,173 67,02,616 59,37,039 52,32,273 59,37,039 13.5C.GrossTurnover(`crore)BSE 13,78,809 11,05,027 5,34,833 39,492 52,571 33.1NSE 41,29,214 35,77,410 22,10,603 1,88,886 2,36,872 25.4D.P/ERatioBSE Sensex 21.3 21.2 17.7 16.4 17.7 7.9S&P CNX Nifty 22.3 22.1 18.5 16.8 18.5 10.6$AsonlasttradingdayofJanuary2012Source:BSEandNSE.
S&P CNX Nifty closed at 5,199.3 on January 31, 2012 compared to 4,624.3 on December 30, 2011, indicating an increase of 575 points (12.4
percent). During January 2012, Nifty recorded an intraday high of 5,217.0 on January 27, 2012 and an intraday low of 4,588.1 on January 2, 2012.
The P/E ratio of BSE Sensex was 17.7 as on January 31, 2012 as against 16.4 on December 30, 2011. The
P/E ratio of S&P CNX Nifty was 18.5 as on January 31, 2012 as against 16.8 on December 30, 2011.

96
FEBRUARY SEBI BULLETIN 2012
Figure3:MonthlyAverageofBSETurnoverandSensex
The market capitalisation of BSE increased by 13.3 percent from ` 53,48,645 crore as on December 30, 2011 to ` 60,59,347 crore as on January 31, 2012. Further, the market capitalisation of NSE,
stood at ` 59,37,039 crore on January 31, 2012 compared to ` 52,32,273 crore as on December 30, 2011, an increase of 13.5 percent.
Figure4:MonthlyAverageofNSETurnoverandNifty
The monthly turnover of BSE (cash segment) increased by 33.1 percent from ` 39,492 crore in December 2011 to ` 52,571 crore in January 2012. Further, the monthly turnover of NSE
(cash segment) increased by 25.4 percent from ` 1,88,886 crore in December 2011 to ` 2,36,872 crore in January 2012.
97
FEBRUARY SEBI BULLETIN 2012
Table3:PerformanceofIndicesatBSEandNSEduringJanuary2012(Percent)
BSE NSE
Index ChangeoverPreviousmonth Volatility Index Changeover
Previousmonth Volatility
1 2 3 4 5 6BSE Sensex 11.2 1.1 S&P CNX Nifty 12.4 1.1BSE 100 13.1 1.1 CNX Nifty Junior 17.8 1.2BSE 200 13.3 1.1 S&P CNX 500 13.5 1.1BSE 500 13.3 1.1 CNX Mid-cap 16.2 1.1BSE Small Cap 16.5 1.0 CNX 100 13.2 1.1BSE FMCG 1.0 0.8 S&P CNX Defty 21.4 1.4BSE Consumer Durables 11.8 1.1 CNX IT 0.9 1.8BSE Capital Goods 22.3 2.2 Bank Nifty 24.5 1.7BSE Bankex 24.4 1.7 Nifty Mid-cap 50 20.3 1.4BSE Teck 2.9 1.6BSE Oil & Gas 12.9 1.6BSE Metal 23.7 2.0BSE Auto 13.5 1.3BSE PSU 15.6 1.2BSE Healthcare 7.9 0.6Source:BSEandNSE.
500 Index (13.5 percent), CNX 100 Index (13.2 percent), S&P CNX Nifty Index (12.4 percent), CNX IT Index (0.9 percent).During January 2012, among BSE indices, the daily volatility of BSE Capital Goods Index was highest at 2.2 percent followed by BSE Metal Index (2 percent), BSE Bankex Index (1.7 percent), BSE Oil & Gas Index (1.6 percent), BSE Teck Index (1.6 percent), BSE Auto Index (1.3 percent), BSE PSU Index (1.2 percent), BSE Consumer Durables Index (1.1 percent), BSE 100 Index (1.1 percent), BSE Sensex Index (1.1 percent), BSE 200 Index (1.1 percent), BSE 500 Index (1.1 percent), BSE Small Cap Index (1 percent), BSE FMCG Index (0.8 percent), BSE Healthcare Index (0.6 percent).At NSE, among all the indices, daily volatility of CNX IT Index was highest at 1.8 percent followed by Bank Nifty Index (1.7 percent), Nifty Mid-cap 50 Index (1.4 percent), S&P CNX Defty Index (1.4 percent), CNX Nifty Junior Index (1.2 percent), CNX Mid-cap Index (1.1 percent), S&P CNX Nifty Index (1.1 percent), CNX 100 Index (1.1 percent), S&P CNX 500 Index (1.1 percent).
At the end of January 2012, all BSE indices closed positive compared to the end of the previous month. Among BSE indices, BSE Bankex Index rose highest by 24.4 percent over its previous month’s closing value followed by BSE Metal Index (23.7 percent), BSE Capital Goods Index (22.3 percent), BSE Small Cap Index (16.5 percent), BSE PSU Index (15.6 percent), BSE Auto Index (13.5 percent), BSE 200 Index (13.3 percent), BSE 500 Index (13.3 percent), BSE 100 Index (13.1 percent), BSE Oil & Gas Index (12.9 percent), BSE Consumer Durables Index (11.8 percent), BSE Sensex Index (11.2 percent), BSE Healthcare Index (7.9 percent), BSE Teck Index (2.9 percent), BSE FMCG Index (1 percent).At NSE too, all NSE indices closed positive in January 2012, compared to the end of the previous month. Among them, Bank Nifty Index rose highest by 24.5 percent over its previous month’s closing value followed by S&P CNX Defty Index (21.4 percent), Nifty Mid-cap 50 Index (20.3 percent), CNX Nifty Junior Index (17.8 percent), CNX Mid-cap Index (16.2 percent), S&P CNX

98
FEBRUARY SEBI BULLETIN 2012
III.TrendsinDepositoryAccounts
The total number of investor accounts was 119.1 lakh at NSDL and 78.6 lakh at CDSL at the end of January 2012. The number of investor accounts in January 2012 increased by 0.5 percent at NSDL and 0.2 percent at CDSL over the previous month.
A comparison with corresponding period of previous year shows, there was an increase in the number of investor accounts to the extent of 4.3 percent at NSDL and 6 percent at CDSL (DetailsinAnnex–Table51).
IV.TrendsinDerivativesSegment
A.EquityDerivativesatNSEThe monthly total turnover in equity derivative market at NSE decreased by 18.7 percent from ` 27,68,863 crore in December 2011 to ` 22,51,487 crore in January 2012. The monthly turnover of index futures also decreased by 18.4 percent from ` 3,07,198 crore in December 2011 to ̀ 2,50,738 crore in January 2012. However, the monthly turnover of stock futures increased by 25.3 percent from ` 2,79,921 crore in December 2011 to ` 3,50,848 crore in January 2012.Further, the monthly turnover of put options on index decreased by 19.8 percent from ` 9,76,324 crore in December 2011 to ` 7,83,058 crore in January 2012. The monthly turnover of call options on index also decreased by 32.9 percent from ` 11,32,427 crore in December 2011 to ` 7,59,484 crore in January 2012. The monthly turnover of put options on stock increased by 39.6
percent from `26,188 crore in December 2011 to ` 36,554 crore in January 2012. The monthly turnover of call options on stock also increased by 51.3 percent from ` 46,806 crore in December 2011 to ` 70,805 crore in January 2012.
The open interest in value terms in equity derivative segment increased by 34.8 percent from ` 79,867 crore as on December 30, 2011 to ` 1,07,672 crore as on January 31, 2012. The open interest in value terms in equity derivative segment for Index Futures, Stock Futures, Put Options on Index, Call Options on Index, Put Options on Stock and Call Options on Stock at the end of January 2012 stood at ` 16,220 crore, ` 28,671 crore, ` 32,801 crore, ` 25,479 crore, ` 1,700 crore and ` 2,801 crore respectively, with a corresponding growth rates of 34.4 percent, 24.8 percent, 49.7 percent, 23.9 percent, 100 percent and 85.6 percent as compared to December 30, 2011.
Figure 5: Trends of Equity Derivatives Segment at NSE (` crore)

99
FEBRUARY SEBI BULLETIN 2012
Table4:TrendsinEquityDerivativesMarket
Particular Jan-12 Dec-11 PercentageChangeOverMonth
1 2 3 4A.Turnover(` crore)(i) Index Futures 2,50,738 3,07,198 -18.4(ii) Options on Index Put 7,83,058 9,76,324 -19.8 Call 7,59,484 11,32,427 -32.9(iii) Stock Futures 3,50,848 2,79,921 25.3(iv) Options on Stock Put 36,554 26,188 39.6 Call 70,805 46,806 51.3Total 22,51,487 27,68,863 -18.7B.No.ofContracts(i) Index Futures 1,08,56,475 1,38,86,601 -21.8(ii) Options on Index Put 3,26,19,699 4,16,06,078 -21.6 Call 2,98,04,342 4,52,73,935 -34.2(iii) Stock Futures 1,39,58,030 1,27,55,993 9.4(iv) Options on Stock Put 14,79,438 11,93,943 23.9 Call 26,78,358 20,31,464 31.8Total 9,13,96,342 11,67,48,014 -21.7C.OpenInterestintermsofValue(`crore)(i) Index Futures 16,220 12,067 34.4(ii) Options on Index Put 32,801 21,909 49.7 Call 25,479 20,559 23.9(iii) Stock Futures 28,671 22,972 24.8(iv) Options on Stock Put 1,700 850 100.0 Call 2,801 1,509 85.6Total 1,07,672 79,867 34.8D.OpenInterestintermsofNoofContracts(i) Index Futures 6,59,119 5,59,818 17.7(ii) Options on Index Put 12,63,181 9,49,074 33.1 Call 9,80,757 8,90,113 10.2(iii) Stock Futures 10,54,809 10,29,721 2.4(iv) Options on Stock Put 62,888 37,262 68.8 Call 1,03,401 65,996 56.7Total 41,24,155 35,31,984 16.8
Source:NSE.

100
FEBRUARY SEBI BULLETIN 2012
B.CurrencyDerivativesatNSE,MCX-SXandUSE
During January 2012, the monthly turnover of currency derivatives at NSE increased by 8.3 percent to ` 3,59,481 crore as compared to ` 3,31,805 crore in December 2011. However, at MCX-SX, the monthly turnover of currency futures decreased by 7.1 percent to ̀ 2,45,250 crore
in January 2012 from ̀ 2,64,005 crore in December 2011. At the end of January 2012, the turnover of currency derivatives at USE stood at ` 6,609 crore as compared to ` 12,580 crore in December 2011, indicating a decrease of 47.5 percent. (DetailsinAnnex–Table32,33and34).
Figure6:TrendsofCurrencyDerivativesatNSE,MCX-SXandUSE(` crore)
Trading in Interest Rate Futures (IRF) contracts on 91 Day GOI T-Bill was introduced at NSE on July 4, 2011. January 2012, like last two
months, did not see any trading activity in IRFs on currency derivative segment of NSE (DetailsinAnnex-Table39).
C.InterestRateDerivativesatNSE
Figure7:TrendsintheInterestRatesFuturesatNSE(` crore)
101
FEBRUARY SEBI BULLETIN 2012
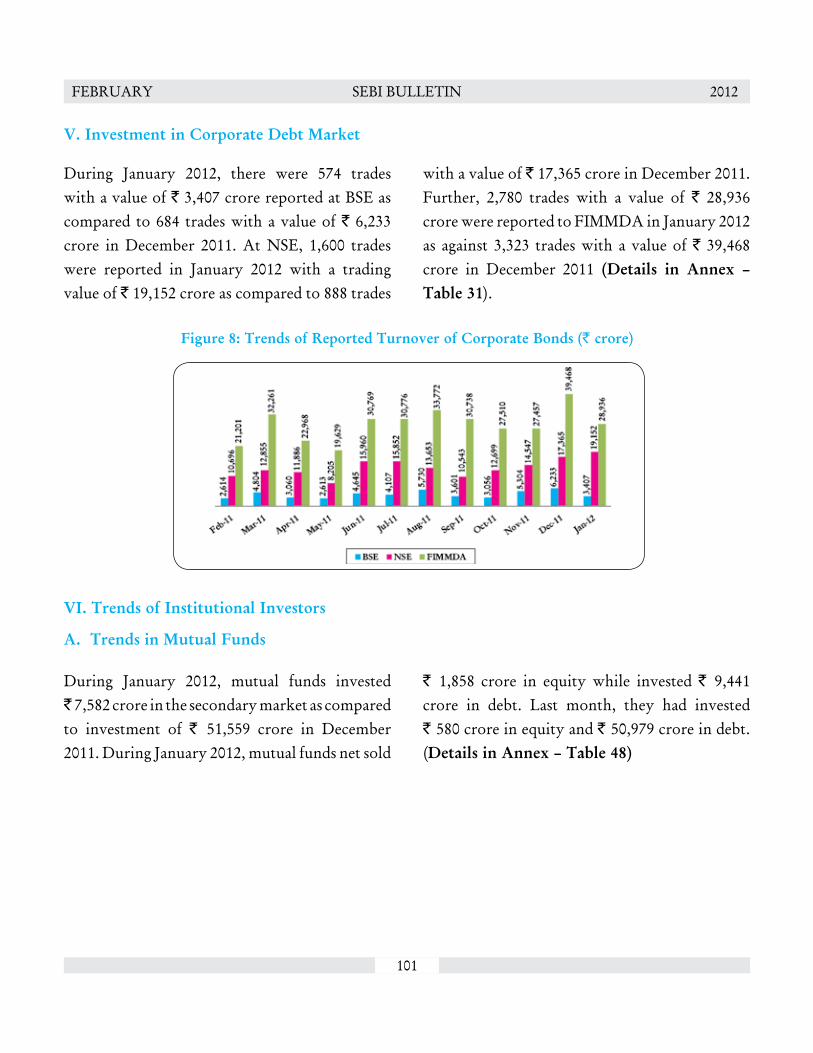
During January 2012, there were 574 trades with a value of ` 3,407 crore reported at BSE as compared to 684 trades with a value of ` 6,233 crore in December 2011. At NSE, 1,600 trades were reported in January 2012 with a trading value of ` 19,152 crore as compared to 888 trades
with a value of ` 17,365 crore in December 2011. Further, 2,780 trades with a value of ` 28,936 crore were reported to FIMMDA in January 2012 as against 3,323 trades with a value of ` 39,468 crore in December 2011 (Details in Annex –Table31).
V.InvestmentinCorporateDebtMarket
Figure8:TrendsofReportedTurnoverofCorporateBonds(` crore)
VI.TrendsofInstitutionalInvestors
A. TrendsinMutualFunds
During January 2012, mutual funds invested ` 7,582 crore in the secondary market as compared to investment of ` 51,559 crore in December 2011. During January 2012, mutual funds net sold
` 1,858 crore in equity while invested ` 9,441 crore in debt. Last month, they had invested ` 580 crore in equity and ` 50,979 crore in debt. (DetailsinAnnex–Table48)

102
FEBRUARY SEBI BULLETIN 2012
Figure 9: Trends in Mutual Funds Investment (` crore)
B. TrendsinForeignInstitutionalInvestors
There was a net inflow of ̀ 26,329 crore in January 2012 by Foreign Institutional Investors (FIIs) compared to ` 21,873 crore inflow in December 2011. FIIs invested ` 10,358 crore in equity in January 2012 as compared to ` 98 crore invested in December 2011. In addition, FIIs invested ` 15,971 crore in debt market in January 2012 as compared
to ` 21,775 crore invested in December 2011.
The asset under custody of FIIs at the end of January 2012 stands at ` 10,43,130 crore, out of which the value of participatory notes including PNs on derivatives is ` 1,14,092 crore, constituting 15.1 percent of the total asset under custody of FIIs. (DetailsinAnnex–Table42&Table44)
Figure10:TrendsinFIIsInvestment(` crore)

103
FEBRUARY SEBI BULLETIN 2012
VII.TrendsinPortfolioManagementServices
Total AUM of Portfolio Management Services industry, excluding the AUM under advisory services, has increased by 16.4 percent from ` 3,34,248 crore in December 2011 to ` 3,88,934 crore in January 2012. Within Asset Under Management of Portfolio Management Services, AUM under discretionary services constitutes the highest share in the AUM with ` 3,72,220 crore in January 2012 compared to ` 3,18,433 crore in
December 2011. AUM under non-discretionary services stands at ` 16,714 crore in January 2012 against ` 15,815 crore in December 2011.
In terms of number of clients, discretionary services category ranks first with total of 68,543 clients, out of 82,708 clients in PMS industry, followed by advisory services with 9,255 clients and non-discretionary category with 4,910 clients (DetailsinAnnex–Table49).
VIII.TrendsinSubstantialAcquisitionofSharesandTakeovers
In January 2012, 5 public offers with total value of ` 401 crore were made to public as against the same number of public offers totaling ` 23 crore in the last month. Out of those five public offers, three public offers worth ` 182 crore were made to take over the control of management, while two others worth ` 219 crore were made to
consolidate promoters holding in the company.
Further, during January 2012 total of 7 issues amounting to ̀ 109 crore received an “Automatic Exemption” from open offer under SEBI takeover regulations, against 23 issues amounting to ` 9 crore in December 2011 (DetailsinAnnex–Table50).

104
FEBRUARY SEBI BULLETIN 2012
IX.InternationalMarketsComparison
Table 5:AverageDailyReturn,Volatility andMonthEndPERatio of International IndicesduringJanuary2012
Country Index Return Volatility PERatio1 2 3 4 5
DevelopedMarketsAustralia All Ordinaries 0.3 0.8 14.8France CAC 40 0.2 1.2 9.7Germany Dax 0.4 1.1 10.7Hong Kong Hang Seng 0.6 1.2 9.2Japan Nikkei 225 0.2 0.9 26.0Singapore Straits Times 0.5 1.0 8.4UK FTSE 100 0.1 0.9 10.3USA Dow Jones Indus. Avg. 0.2 0.5 13.0USA Nasdaq Composite 0.4 0.6 22.6EmergingMarketsIndia Sensex 30 0.5 1.1 17.7India S&P CNX Nifty 0.5 1.1 18.5Argentina Indice Bolsa General 0.4 1.4 14.7Brazil Bovespa 0.5 0.9 10.3Chile Stock Market Select 0.1 0.4 20.8China Shanghai SE Composite 0.3 1.8 12.0Colombia IGBC General 0.4 0.9 16.2Egypt Hermes 1.0 1.5 16.3Hungary Budapest Stock Exchange 0.5 1.8 8.8Indonesia Jakatra Composite 0.2 0.8 17.5Malaysia FTSE Bursa Malaysia KLCI 0.0 0.5 16.7Mexico Bolsa 0.0 0.9 18.6Pakistan Karachi 30 0.4 1.2 6.4Russia Russian Traded 0.7 1.6 5.3South Korea Kospi Index 0.4 1.1 21.4South Africa FTSE/JSE Africa All Share 0.3 0.8 12.2Taiwan Taiwan Taiex 0.4 1.1 17.3Thailand Stock Exchange of Thai 0.3 0.7 14.1Turkey ISE National 100 0.5 1.5 12.2
Source:Bloomberg.

105
FEBRUARY SEBI BULLETIN 2012
During January 2012, the daily volatility for China’s Shanghai SE Composite Index (1.8 percent ) and Hungary’s Budapest Stock Exchange Index (1.8 percent) was the highest among the countries under review followed by Russia’s Russian Traded Index (1.6 percent), Turkey’s ISE National 100 Index (1.5 percent), Egypt’s Hermes Index (1.5 percent), Argentina’s Indice Bolsa General Index (1.4 percent), Hong Kong’s Hang Seng Index (1.2 percent), France’s CAC 40 Index (1.2 percent), Pakistan’s Karachi 30 Index (1.2 percent), India’s S&P CNX Nifty Index (1.1 percent), Germany’s Dax Index (1.1 percent), India’s Sensex 30 Index (1.1 percent), Taiwan’s Taiwan Taiex Index (1.1 percent), South Korea’s Kospi Index Index (1.1 percent), Singapore’s Straits Times Index (1 percent), Colombia’s IGBC
General Index (0.9 percent), Brazil’s Bovespa Index (0.9 percent), Mexico’s Bolsa Index (0.9 percent), Japan’s Nikkei 225 Index (0.9 percent), UK’s FTSE 100 Index (0.9 percent), Australia’s All Ordinaries Index (0.8 percent), Indonesia’s Jakatra Composite Index (0.8 percent), South Africa’s FTSE/JSE Africa All Share Index (0.8 percent), Thailand’s Stock Exchange of Thai Index (0.7 percent), USA’s Nasdaq Composite Index (0.6 percent), USA’s Dow Jones Indus. Avg. Index (0.5 percent), Malaysia’s FTSE Bursa Malaysia KLCI Index (0.5 percent), Chile’s Stock Market Select Index showed the lowest volatility at 0.4 percent during the same period
The Average daily return and PE Ratio for January 2012 are given in Table5.

106
FEBRUARY SEBI BULLETIN 2012
a. GeNeraL
1. Toll-freeHelplineServiceforInvestors
Securities and Exchange Board of India (SEBI) has launched a toll free helpline service number 1800 22 7575 for investors on December 30, 2011. The service will be available to investors from all over India and will be in 14 languages. At present the available languages are English, Hindi, Marathi, Gujarati, Tamil, Bengali, Malayalam, Telugu, Urdu, Oriya and Punjabi. The service in Kannada, Assamese and Kashmiri will be commenced shortly. The toll free helpline service will be available on all working days during Monday to Friday from 9:30 a.m. to 5:30 p.m.
In the initial phase, the following services will be available to the investors –
Guidancepertainingto–
• Statusofcompanies–whetherunlisted,sick,delisted, liquidated /wound up etc.
• Matterspertaining tootherRegulators thatare not under SEBI purview
• Howtolodgeacomplaint
• Againstwhomtolodgeacomplaint
• Complaintstatus
• Howtoopenademat/clientaccountetc.
Assistanceindifferentproceduresviz.,
• Transfer
• Transmissionofshares
• IPOetc
The helpline service does not offer any legal opinion or investment advice to the investors.Ref:PRNo.1/2012datedJanuary02,2012.
2. SEBIBoardMeeting
The SEBI Board met on 3rd January and took the following decisions:
1. Manner of increasing minimum publicshareholding to comply with SecuritiesContractsRegulation(Rules),1957
The following additional methods viz. Institutional Placement Programme (IPP) and Offer for Sale of Shares through the stock exchange for the purpose of compliance with SCRR requirements are being introduced. The broad features of the same are as under:
A. InstitutionalPlacementProgramme(IPP):
i. This method can be used only for the purpose of complying with minimum public shareholding requirements under SCRR, either by way of fresh issue of capital or dilution by the promoters through an offer for sale. Using this method, public shareholding can be increased by 10% or such lesser percentage as is required to comply with the minimum public shareholding requirement.
ii. There would be simultaneous filing of red herring prospectus / prospectus with SEBI,
PRESSRELEASES
107
FEBRUARY SEBI BULLETIN 2012
Registrar of Companies and Stock Exchanges.
iii. Offer would be made only to Qualified Institutional Buyers (QIBs). There would be a reservation of minimum 25% to mutual funds and insurance companies.
iv. Issuer shall announce an indicative floor price or price band atleast one day prior to the opening of the offer.
v. The aggregate demand schedule shall be displayed by stock exchanges.
vi. Issuers shall endeavor to maximize the number of allottees in order to ensure wider distribution of shares. There shall be atleast 10 allottees in every IPP issuance. No single investor shall receive allotment for more than 25% of the offer size.
vii. The allotment of shares may be made on price priority, proportionate or on pre – specified criteria which has to be disclosed in advance in the prospectus and cannot be changed subsequently.
B Offer for sale of shares through stockexchanges:
i. The stock exchange would offer a separate window for the purpose of such sales. The duration of this window would co – exist with the normal trading hours.
ii. The offer shall be for atleast 1% of the paid-up capital of the company, subject to a minimum of Rs. 25 crores.
iii. Only the promoter/ promoter group of companies which are active /eligible for trading would be permitted to offer their shares for sale. Promoter/ promoter group of the company would not be permitted to bid for the shares.
iv. Every bid/buy order would be required to be backed by 100% upfront cash margin. The settlement shall be through exchange clearing mechanism.
v. Allotment would be done either on price priority or clearing price basis proportionately and would be overseen by the exchanges.
Apart from use for compliance with minimum shareholding requirements, this method can be used by promoters of top 100 companies (based on average market capitalization) for sale of their stake.
2. Amendment to SEBI (Buyback ofSecurities)Regulations,1998
As a part of constant endeavor to align regulatory requirements with the principle of equitable treatment to all shareholders as well as to enhance efficiency of the buyback process, the following changes in the tender offer method of buyback are being made:
i) Procedure for acceptance of shares inbuybackthroughtenderoffer
The company shall announce ratio of buyback as is done in the case of rights issues and fix a record date for determination of entitlements
108
FEBRUARY SEBI BULLETIN 2012
as per shareholding on record date. While the shareholders are free to tender over and above their entitlement, acceptance of shares shall first be based on entitlement of each shareholder and if any shares are still left to be bought back, acceptance of additional shares tendered over and above the entitlement shall be in proportion to the excess shares tendered by the shareholder.
ii) “RecordDATe”inlieuofspecifieddate
The company shall fix “record date” for the purpose of deciding entitlement for buyback, as per the practice followed for other corporate actions as laid down in listing agreement.
iii) ReviewofrequirementofissuingPublicNoticeandPublicAnnouncement
The Public Announcement shall be published within two working days from the date of Board or Shareholders resolution, as the case may be.
iv) Rationalization of timelines in buybackthroughtenderoffer
The timelines for various activities involved in the buyback process have been revised which shall result in substantial reduction of time taken for completion of buyback.Ref:PRNo.2/2012datedJanuary03,2012.
3. Rejection of Request for Exemption ofM/s. Futuristics Garments Private Limited(Acquirer) for the Proposed Acquisition ofSharesofM/s.SuryaPharmaceuticalsLimited(TargetCompany)
SEBI has passed an order dated January 9, 2012, rejecting the request for exemption to the acquirer from the applicability of Regulation 10, 11, 12 of SEBI (Substantial Acquisition of Shares and Takeover) Regulations, 1997, in respect of the proposed increase in shareholding of the promoters from 38.11% to 45.50%, pursuant to the conversion of 27,50,000 warrants issued on preferential basis.
The application seeking exemption was forwarded by SEBI to the Takeover Panel. The Panel did not consider grant of exemption in the interest of public shareholders.Ref:PRNo.5/2012datedJanuary12,2012.
4. GrantofExemptiontoMr.BijayKumarGarodia ,Mr.RameshKumar Sarawagi andMr. Shankar Lall Ajitsaria (Acquirers) forthe Proposed Acquisition of Shares of M/s.KharikatiaTea&IndustriesLimited (TargetCompany)
SEBI has passed an order dated January 19, 2012, granting exemption to the acquirers from making a public announcement as required under regulation 13, 14 and 15 and from the obligation to file the letter of offer under regulation 16 of SEBI (Substantial Acquisition of Shares and Takeover) Regulations, 2011, in respect of the proposed increase in shareholding of the promoters from nil to 74.31%, pursuant to the acquisition from the existing promoters of the Target Company.Ref:PRNo.9/2012datedJanuary23,2012.

109
FEBRUARY SEBI BULLETIN 2012
5. GrantofExemptiontoMr.VinodKumarAgrawal, Mr. Subash Chand Agrawal, M/s.RNCommotradePrivateLimited andM/s.Singhal General Traders Private Limited(Acquirers) for the Proposed Acquisitionof Shares of M/s. MSD Properties Limited(TargetCompany)
SEBI has passed an order dated January 19, 2012, granting exemption to the acquirers from making a public announcement as required under regulation 3(1) read with regulations 13, 14 and 15 and from the obligation to file the letter of offer under regulation 16(1) of SEBI (Substantial Acquisition of Shares and Takeover) Regulations, 2011, in respect of the proposed increase in shareholding of the promoters from 18.94% to 52.78%, pursuant to the acquisition from public shareholders.Ref:PRNo.10/2012datedJanuary23,2012.
6. First Meeting of SEBI’s InternationalAdvisoryBoard
Securities and Exchange Board of India (SEBI)’s International Advisory Board (IAB) held its first meeting in New Delhi on 27th January.
SEBI constituted the IAB in September, 2011. The role of the IAB will be to guide SEBI and, in doing so, bring in the global experiences and emerging developments and challenges. The IAB will meet twice in a year.
At its first meeting, the IAB deliberated on several important issues which are currently relevant for the Indian securities market:
i. The IAB took note of the initiatives taken by SEBI for enhancing the retail participation and for increasing penetration beyond top-10 cities and discussed the issues and challenges faced by SEBI in this regard. The IAB observed that there is a need to widen the reach of the mutual fund industry in the country, both horizontally and vertically. The IAB emphasized that in order to enhance the participation of households, the mutual fund industry has to educate the investors of the attractiveness of mutual funds in terms of returns and cost effectiveness, compared to other financial products. The IAB stressed the need for the mutual funds to offer life cycle products along with plain vanilla products. The IAB underscored the need to have in place an effective framework for regulation of distributors. The IAB also suggested that SEBI may consider encouraging competition in the industry while insisting on transparency and reducing the dependence on the existing channels of distribution by enhancing the distribution of mutual fund products through alternative channels, like internet.
ii. The IAB was apprised of the situation prevailing in the Indian primary market. The IAB emphasized the need to have a listing and trading platform for smaller companies, to address the conflicts of interests at the level of the market intermediaries and to make the enforcement actions more effective. The IAB advised SEBI to explore the provision of green shoe option for price stabilization and independent research coverage of listed companies for a few years post listing through a common agency.

110
FEBRUARY SEBI BULLETIN 2012
iii. The IAB appreciated the initiatives of SEBI to have uniform KYC norms in the Indian securities market. After taking note of the practices in some of the Financial Action Task Force (FATF) compliant countries, the IAB advised SEBI to explore risk-based customer due diligence processes without granting any sort of exemptions to any category of investors.
iv. The IAB took note of the risk management mechanisms in place in the equity and equity derivative segments in India. The IAB advised SEBI on the need to strengthen the legal framework to strengthen and better protect the collaterals of the clients posted with the brokers. The IAB also deliberated on the global developments related to algorithmic / high frequency trades and co-location and the resultant challenges to risk management. The IAB advised SEBI to have consistently high regulatory standards to cope with the increasing technological advancements and to strengthen the pre-trade risk management mechanism. As a step towards inter-operability of central counterparties, the IAB advised SEBI to prescribe common standards/ protocol for market participants.
v. The IAB also looked into the means to canalize the domestic savings into the securities markets so as to help meet the growth objectives. Among the measures recommended by the IAB are the development of a vibrant corporate bonds market and exploring the introduction of securitized debt instruments and real estate investment trusts, with appropriate risk management.
The current Members of the IAB, in addition to the Chairman, SEBI are Prof. Viral Acharya, Ms. Jane Diplock, Prof. Mark Maletz, Prof. Maureen O’Hara, Prof. Arvind Panagariya and Dr. Andrew Sheng (Arranged alphabetically by the surnames).
Prof. Acharya is the C.V. Starr Professor of Economics in the Department of Finance at New York University Stern School of Business and a Member of Advisory Scientific Committee of European Systemic Risk Board. Ms. Diplock, presently an Independent Director of Singapore Exchange Limited, is the former Chairman of both the Executive Committee of the International Organization of Securities Commissions (IOSCO) and of the New Zealand Securities Commission.
Prof. Maletz is a Senior Fellow at Harvard Business School and an internationally recognized thought leader in the areas of leadership development and organization transformation. Prof. O’Hara, the Robert W. Purcell Professor of Finance at the Johnson Graduate School of Management, Cornell University, is the Chairman of the Economic Advisory Board of the FINRA and a Member of the CFTC-SEC Task Force investigating the ‘flash crash’.
Prof. Panagariya is the Jagdish Bhagwati Professor of Indian Political Economy at Columbia University and the former Chief Economist of the Asian Development Bank. Dr. Sheng, the former Chairman of the Securities and Futures Commission of Hong Kong, is presently the

111
FEBRUARY SEBI BULLETIN 2012
Chief Advisor to the China Banking Regulatory Commission and a Board Member of the Qatar Financial Centre Regulatory Authority.
Mr. Prashant Saran, Mr. Rajeev Kumar Agarwal, Whole Time Members of the SEBI Board, Mr. V K Jairath, Member of the SEBI Board, and all the Executive Directors of SEBI participated in the First Meeting of the IAB.
During the intermediate breaks, the Members of the IAB interacted with Mr. D K Mittal, Secretary, Department of Financial Services, Ministry of Finance and Dr. Kaushik Basu, Chief Economic Advisor, Department of Economic Affairs, Ministry of Finance.Ref:PRNo.14/2012datedJanuary27,2012.
7. SEBIBoardMeeting
The SEBI Board met in New Delhi on 28th January and took the following decisions:
i. Reservation to Holders of ConvertibleDebtSecuritiesinRights/BonusIssues
On the issue of reservation to convertible debt holders in rights/bonus issues, it has been decided to clarify that reservation shall be available only to compulsorily convertible debt holders, since conversion in such cases is not at the option of the holders of these instruments.
ii. WaiverofCertainRequirementsRelatingto Preferential Allotment to InsuranceCompaniesandMutualFunds
It has been decided to exempt Insurance Companies
and Mutual Funds which are broad based investment vehicles representing the interests of the public at large from the provisions of SEBI (Issue of Capital and Disclosure Requirements) Regulations relating to sale and lock-in of their pre-preferential shareholding in the issuer company. Presently, SEBI (ICDR) Regulations preclude companies from issuing preferential allotment to entities who have sold any of their holdings during the six month period prior to relevant date. Further, allottees in preferential allotment are required to lock-in their entire pre-preferential holdings for a period of six months from date of preferential allotment. The lock-in on shares allotted in preferential issue per se, however, would remain unchanged.
iii. Amendment to SEBI (Mutual Fund)Regulations,1996
a. Amendment relating to Advertisement Code
• In order to provide flexibility to Asset Management Companies (AMCs) in issuing true and fair advertisements with meaningful disclosure to investors, the Sixth Schedule of SEBI (Mutual Fund) Regulations, 1996 and various circulars issued from time to time on Advertisement Code shall be amended and made principle based as far as possible.
• AMCs shall be responsible for the accuracy, truthfulness, fairness of the advertisement.
• The definition of advertisement shall be broadened to include all forms of

112
FEBRUARY SEBI BULLETIN 2012
communication that may influence investment decisions of any investor.
b. Amendment relating to Investment Valuation Norms
In order to provide for fair valuation of securities/assets of Mutual Fund schemes, the following proposed changes in the SEBI (Mutual Fund) Regulations, 1996 are approved by the Board:
• AMC shall ensure fair treatment to all investors i.e. to existing investors as well as to investors seeking to purchase or redeem units of Mutual Funds at all point of time in all schemes.
• In case debt and money market securities are not traded on a particular valuation day then valuation through amortization basis shall be restricted to securities having residual maturity of upto 60 days (currently 91 days), provided such valuation shall be reflective of the realizable value/ fair value of the securities.
iv. AmendmenttoSEBI(PortfolioManagers)Regulations,1993
The Board decided to amend the SEBI (Portfolio Managers) Regulations, 1993 to give effect, inter alia, to the following:
• To enhance the minimum investment amount per client from Rs.5 lakh to Rs.25 lakh
• To ensure segregation of holdings in individual demat accounts in respect of unlisted securities also
The proposed amendment would be applicable on prospective basis for new clients and for fresh investments by existing clients.Ref:PRNo.15/2012datedJanuary28,2012.
b. OrDer
1. Order intheMatterofM/s.SoundcraftIndustriesLtd.,M/s.KolarBiotechLtd.andM/s.AdamComsofLtd.
SEBI has passed an order dated January 02, 2012 in the matter of M/s. Soundcraft Industries Ltd., M/s. Kolar Biotech Ltd. and M/s. Adam Comsof Ltd. revoking the interim directions issued vide ad interim ex-parte order dated September 30, 2004 and confirmatory order dated February 18, 2005 against M/s. Reshma Plastics Pvt. Ltd., M/s. RVSK Information Technology Ltd., M/s. Glorious Investrade P. Ltd., Sh. Pradeep Rathi, Sh. Indramal S. Jain, Sh. Nazir N. Desai, Sh. Maqbool A.G. Matwankar, Sh. Kiran Bansal, M/s. Steel Traders P Ltd., M/s. Shree Satyanand Investments (Shyam Sunder Jhunjhunwala), M/s. Subhlaxmi (Ramkishore Jhujhunwala), M/s. Suvik Finvest & Cons P. Ltd., Sh. Pushpa Mahadik, Sh. Prithvijit Debnath, Sh. Anil Bhaskar Tambe, Sh. Jayendra Pragji Thakkar, Sh Nirmal N Kotecha and M/s. Manorama Trading Ltd.
The order further states that the restrictions imposed by SEBI vide its orders dated September 30, 2004 and February 18, 2005 against the other entities covered therein, shall continue.Ref:PRNo.3/2012datedJanuary10,2012.

113
FEBRUARY SEBI BULLETIN 2012
2. Order in the Matter of M/s. EmpowerIndustriesIndiaLtd.
SEBI has passed an order dated January 06, 2012 restraining M/s. Empower Industries India Ltd. from accessing the securities market and prohibiting it from buying, selling or otherwise dealing in securities, directly or indirectly, for a period of 6 monthsRef:PRNo.4/2012datedJanuary10,2012.
3. Order in Respect of M/s. KhandwalaSecurities Limited in the Matter of M/s.KopranLimited
SEBI has passed an order dated January 13, 2012 suspending the certificate of registration of the stock broker, M/s. Khandwala Securities Limited for a period of one month.Ref:PRNo.6/2012datedJanuary20,2012.
4. Order in Respect of M/s. JayantilalKhandwala & Sons Private Limited in theMatterofM/s.KopranLimited
SEBI has passed an order dated January 13, 2012 suspending the certificate of registration of the stock broker, M/s. Jayantilal Khandwala & Sons Private Limited for a period of one month.Ref:PRNo.7/2012datedJanuary20,2012.
5. OrderinRespectofM/s.VSBInvestmentsP.Ltd.intheMatterofTradingbyConnectedEntities
SEBI has passed an order dated January 18, 2012 in the matter of trading by connected entities, revoking interim directions issued vide ad interim ex-parte order dated June 04, 2009 and confirmatory order
dated January 25, 2010 against VSB Investments P. Ltd. and also disposing of the show cause notice without any further directions.Ref:PRNo.8/2012datedJanuary20,2012.
6. Order in Respect of M/s. NeptuneSecurities Pvt. Ltd. in the Matter of M/s.PriyansSareeIndustriesLtd.
SEBI has passed an order dated January 17, 2012, in the matter of M/s. Priyans Saree Industries Ltd., warning the stock broker M/s. Neptune Securities Pvt. Ltd. to be more careful and cautious in the conduct of its business and to adhere to and comply with all the statutory provisions while carrying out its activities in the securities market.Ref:PRNo.11/2012datedJanuary27,2012.
7. OrderinRespectofM/s.SanchayFincomLimited in the Matter of M/s. T. SpiritualWorldLimited
SEBI has passed an order dated January 18, 2012, in the matter of M/s. T. Spiritual World Limited prohibiting M/s. Sanchay Fincom Limited, member, Bombay Stock Exchange from taking up new clients for a period of one month.Ref:PRNo.12/2012datedJanuary27,2012.
8. OrderinRespectofSh.AdolfPintointheMatterofM/s.T.SpiritualWorldLimited
SEBI has passed an order dated January 18, 2012, in the matter of M/s. T. Spiritual World Limited prohibiting Sh. Adolf Pinto, member, Bombay Stock Exchange from taking up new clients for a period of one month.Ref:PRNo.13/2012datedJanuary27,2012.

114
FEBRUARY SEBI BULLETIN 2012
I. Changes InRe-InvestmentPeriod of FIIDebtLimit
1. In reference to para 2 of SEBI circular Cir No. IMD/FII&C/30/2008 dated July 04, 2008 and para 6 of circular CIR/IMD/FIIC/18/2010 dated November 26, 2010, relating to facility provided for FIIs for re-investment period for debt investments.
WithdrawaloftheFacilityofRe-Investment
2. It has been decided that henceforth re-investment period shall not be allowed for all new allocations of debt limit to FIIs/sub-accounts. Thus, limits acquired in the bidding sessions henceforth shall expire/lapse on either sale or redemption at maturity of the debt investments. These limits then shall again be allocated in subsequent bidding processes.
Treatment for Entities that currently HoldLimits/Investments
3. As on the date of the issuance of this circular those FIIs and sub-accounts that already have acquired limits and /or invested in debt, these existing limits shall expire in the following manner:-
a. Facility of re-investment shall continue until any one of the following thresholds is breached
i. Total sales made from the existing debt portfolio (current debt investment and
the un-utilized limit currently with the entity, if any) is twice the size of its debt portfolio as on the date of this circular
or
ii. expiry of two years from the date of this circular i.e. January 02, 2014
b. Re-investment period for the above purposes shall continue to be as per para 6 of circular CIR/IMD/FIIC/18 /2010 dated November 26, 2010.
4. After the threshold as mentioned above is breached, in case of any sale or redemption of the investments, the limit shall expire/lapse. These limits then shall again be allocated in subsequent bidding processes.
5. It is clarified here that the FII/sub-account is not required to sell its investments in debt instrument after it reaches the threshold mentioned above, and thus it can continue to retain the debt investments beyond the threshold, however, the sale or redemption thereon will not be eligible for re-investment beyond the thresholds above.
Investments in Long Term Infra DebtCategory
NewAllocations
6. For all new allocations of debt limit under this category, if a FII decides to sell their holdings during lock-in period to another
CIrCuLar

115
FEBRUARY SEBI BULLETIN 2012
FII; the limit will automatically transfer to purchasing entity. However, if a FII decides to sell/redeem their holdings after lock-in period; same limit shall expire/lapse. These limits then shall again be allocated in subsequent bidding processes.
Treatment for Entities currently holdingInvestments:
7. Similar facility as provided in para 3 & 4 above shall also be applicable for all investments made in the long term infra debt category (with one year lock in and one year residual maturity clause) where lock in provisions are in force.
a. During the lock-in period, if a FII/sub-account decides to sells its investments in the special trading window as provided by the exchanges in terms of SEBI circular dated March 31, 2011, selling FII/ sub-account may exercise its option to sell its investments along with the limits or may choose to sell only the investments and retain the limits.
b. In case the selling entity chooses to retain the limit, then it shall be subject to para 3 of this circular.
c. If selling entity chooses to transfer the limit, then the purchasing entity shall be subject to the para 3 of this circular.
8. Entities can avail of the benefit of Para 7 (a) if it is sells the investments to another FII/sub-accounts after lock-in period; however this benefit can be availed only upto January 02, 2014.
9. Upto January 02, 2014, if the FII/Subaccount redeems the investments at the maturity of the instrument, or sells to a domestic participant after the lock-in period, it can avail benefit of para 3 of this circular.
10. FIIs are advised to evolve suitable mechanism in consultation with their custodian to give effect to the provisions of this circular.
Source: SEBI/IMD/FIIC/1/2012 dated January 3, 2012.
II. DisclosureofTrackRecordofthePublicIssuesManagedbyMerchantBankers
1. SEBI regulations require that the offer document shall contain adequate disclosures so as to enable investors to take well informed investment decisions. Further, a merchant banker is required to exercise due diligence and satisfy himself about all the aspects of the issue including the veracity and adequacy of disclosures in the offer documents.
2. Therefore, it is necessary for investors to evaluate the post-issue performance of the issuer in terms of disclosures made in the offer documents. This will also enable them to understand the level of due diligence exercised by the merchant bankers.
3. In view of the above, it has now been decided in consultation with the merchant bankers that they shall disclose the track record of the performance of the public issues managed by them. The track record shall be disclosed for a period of three financial years from the
116
FEBRUARY SEBI BULLETIN 2012
date of listing for each public issue managed by the merchant banker. The format for disclosure of track record is given in the Annex to this circular.
4. The track record shall be disclosed on the website of the merchant banker and a reference to this effect shall be made in the offer documents of public issues managed in the future. In case more than one merchant banker is associated with a public issue, all merchant bankers who have signed the due diligence certificate, as disclosed in the offer document, shall disclose the track record.
5. The circular shall be applicable for the public issues listed from the date of this circular, with immediate effect. However, in case of past public issues managed during the last three years, the track record as specified in Clause 3 above shall be disclosed latest by March 31, 2012.
Source: SEBI /MIRSD/1/2012 dated January 10, 2012.
III. Investment by Qualified ForeignInvestors(QFI)inIndianEquityShares.
1. The Central Government, vide press release dated January 1, 2012 has announced its decision to allow QFIs to directly invest in Indian equity market in order to widen the class of investors, attract more foreign funds, reduce market volatility and to deepen the Indian capital market.
2. In order to facilitate the above and in consultation with the Government and RBI,
it has been decided that foreign investors (termed as Qualified Foreign Investors/ QFI) who meet prescribed Know Your Customer (KYC) requirements may invest in equity shares listed on the recognized stock exchanges and in equity shares offered to public in India. In order to enable this they will hold equity shares in a demat account opened with a SEBI registered qualified Depository Participant.
3. The QFI for the purpose shall have the same meaning as that provided in para 3.1 of SEBI circular Cir/IMD/DF/14/2011 dated August 09, 20111.
4. To become a qualified Depository Participant (hereinafter referred to as “DP”), a SEBI registered DP shall fulfill the following:4.1. DP shall have paid up capital of Rs. 50
crore or more;4.2. DP shall be either a clearing bank or
clearing member of any of the clearing corporations;
4.3. DP shall have appropriate arrangements for receipt and remittance of money with a designated Authorised Dealer (AD) Category – I bank;
4.4. DP shall demonstrate that it has systems and procedures to comply with the FATF Standards, Prevention of Money Laundering (PML) Act, Rules and SEBI circulars issued from time to time; and
4.5. DP shall obtain prior approval of SEBI before commencing the activities relating to opening of accounts of QFI.

117
FEBRUARY SEBI BULLETIN 2012
5. All DPs who have obtained approval of SEBI for undertaking activities relating to accepting investments by QFI in Mutual Fund schemes need not obtain separate approval from SEBI for commencing the activities relating to investments by QFI in equity shares.
6. Eligible transactions for QFI
6.1. The DP shall ensure that transactions of QFI are limited only to the following:
6.1.1. Purchase of equity shares in public issues, to be listed on recognised stock exchange(s).
6.1.2. Purchase of listed equity shares through SEBI registered stock brokers, on recognized stock exchanges in India.
6.1.3. Sale of equity shares which are held in their demat account through SEBI registered stock brokers.
6.1.4. Purchase of equity shares against rights issues.
6.1.5. Receipt of bonus shares or receipt of shares on stock split/ consolidation.
6.1.6. Receipt of equity shares due to amalgamation, demerger or such other corporate actions, subject to the investment limits.
6.1.7. Receipt of dividends.
6.1.8. Tender equity shares in open offer in accordance with SEBI (Substantial Acquisition of Shares and Takeovers) Regulations, 2011.
6.1.9. Tender equity shares in open offer in accordance with SEBI (Delisting of Equity Shares) Regulations, 2009.
6.1.10. Tender equity shares in case of buy-back by listed companies in accordance with SEBI (Buyback of Securities) Regulations, 1998.
7. Account opening and manner of operation by QFI
7.1. A QFI can open only one demat account with any one of the DPs and shall make purchase and sale of equity shares through that DP only. In case of jointly held demat accounts, each of the joint holders shall meet the requirements specified for QFI and each shall be deemed to be holding a demat account as a QFI. Depositories/ DP shall have adequate systems to ensure the compliance of the same and perform KYC due diligence for each of the joint holders. The DP shall carry necessary due diligence and obtain appropriate declarations and undertakings from QFI to ensure that no other demat account is held by any of the QFI as a QFI or in any other capacity such as NRI, before opening a demat account.
7.2. The DP shall ensure that the same set of ultimate/ end beneficial owner(s) are not allowed to open more than one demat account as QFI. For this purpose,

118
FEBRUARY SEBI BULLETIN 2012
the DP shall carry out necessary due diligence and obtain appropriate declarations and undertakings from QFI.
7.3. A QFI can open trading accounts with one or more SEBI registered stock brokers
7.4. The DP shall ensure that only QFI who meet the conditions stipulated in para 3.1 of SEBI circular Cir/IMD/DF/14/2011 dated August 9, 2011 are allowed to invest in equity shares. Additionally, the DP shall ensure that only those entities are allowed to open demat account as QFI whose ultimate/ end beneficial ownership is not resident in India. The DP shall carry out necessary due diligence for the same at the time of account opening. An express undertaking to this effect shall be obtained by DP from the QFI.
7.5. The entities having opaque structure(s) such that the details of ultimate/ end beneficiary are not accessible or where the beneficial owners are ring fenced from each other or where the beneficial owners are ring fenced with regard to enforcement shall not be allowed to open demat account as QFI. The DP shall perform appropriate due diligence at the time of account opening and ensure that such entities are not allowed to open demat account. An
express undertaking to this effect shall be obtained by DP from the QFI
7.6. In case of any direct/ indirect change in structure or beneficial ownership of the QFI, it shall bring the same to the notice of its DP, forthwith. The DP shall assess the eligibility of that QFI afresh, before allowing it to undertake any further transactions.
7.7. The QFI shall, as and when required by the Government, SEBI or any other regulatory agency in India, submit to that agency, as the case may be, any information, record or documents in relation to his activities as QFI. An express undertaking to this effect shall be obtained by DP from the QFI.
7.8. The QFI shall, in relation to his activities as QFI, at all the times, subject themselves to the extant Indian laws, rules, regulations, circulars etc. from time to time, An express undertaking to this effect shall be obtained by DP from the QFI.
7.9. The DP shall open a separate single rupee pool bank account with a designated AD Category-1 Bank, exclusively for the purpose of investments by QFI in equity shares in India.
7.10. The DP shall ensure that funds of each and every QFI in the rupee pool account are clearly segregated from each other at all times. Further, the

119
FEBRUARY SEBI BULLETIN 2012
DP shall maintain appropriate records including audit trails on an ongoing basis regarding such segregation.
7.11. The DP shall open a demat account for the QFI only after ensuring compliance with all the requirements as per PML Act, rules and regulations, FATF standards and SEBI circulars issued in this regard, from time to time and shall also ensure that QFI comply with all these requirements on an ongoing basis.
7.12. The DP shall ensure that every QFI transacts only through one designated overseas bank account and such overseas bank account which QFI has designated for the purpose is based in a country which is compliant with FATF standards and is a signatory to MMOU of IOSCO.
7.13. The DP shall capture, the details of the overseas bank account designated by the QFI and shall ensure that all inward bound investments are received from that overseas account and repatriation/ remittances of proceeds are also transferred into the same overseas account.
7.14. The DP shall require QFI to submit necessary information for the purpose of obtaining PAN. The DP may use the combined PAN cum KYC form as notified by CBDT for this purpose.
Each QFI shall obtain a separate and distinct PAN. The DP may take any additional information/ documents from QFI other than those mentioned in the common PAN cum KYC form to ensure compliance with PML rules and regulations, FATF standards and SEBI circulars issued from time to time.
7.15. The DP shall ensure that all the investor related documents/ records of QFI are available with the DP.
7.16. The DP shall ensure that equity shares held by QFI are free from all encumbrances including pledge or lien etc. at all times.
7.17. The DP shall, at all times, ensure compliance with laws, rules and regulations of the jurisdictions where the QFI are based.
7.18. The DP shall ensure that the interests of other clients of DP are not adversely affected in any manner due to transactions done on behalf of QFI.
7.19. In case of any penalty, pending litigations or proceedings, findings of inspections or investigations for which action may have been taken or is in the process of being taken by an overseas regulator against DP/ QFI, the DP shall notify such information forthwith, to the attention of SEBI, depositories and stock exchanges. The DP shall mandate the QFI to furnish the details of any
120
FEBRUARY SEBI BULLETIN 2012
such penalty, pending litigations or proceedings, findings of inspections or investigations to it on an ongoing basis.
7.20. The DP shall be responsible for the deduction of applicable tax at source on account of profits or gains or dividends or any other income accruing to or received by QFI before making any reinvestment/ repurchase or repatriation/ remittance to QFI, and remit and report the same to the relevant tax authorities.
7.21. In case a QFI desires to change the DP with whom he holds the demat account, he shall be allowed to operate a new demat account with another DP only after closure of the earlier demat account. At the time of opening a new demat account with a different DP, the QFI shall furnish the details regarding the existing demat account with the earlier DP and the details of the shareholdings in the earlier demat account. Simultaneously, the QFI shall issue transfer instructions to the earlier DP with a copy to the new DP. With regard to the funds of the QFI lying in the rupee pool account of the earlier DP, the same shall be remitted back to the designated overseas bank account of the concerned QFI. At any point of time, a QFI shall operate through only one demat account with a DP.
8. Investment restrictions and monitoring of investment limits for QFI:
8.1. The QFI shall transact in Indian equity shares only on the basis of taking and giving delivery of shares purchased or sold.
8.2. Each transaction by QFI shall be cleared and settled on gross basis.
8.3. QFI shall not issue offshore derivatives instruments/ participatory notes. A declaration and undertaking to this effect shall be obtained by DP from the QFI.
8.4. The DP shall provide on a daily basis, QFI wise, ISIN wise and company wise buy/ sell information and any other transaction or any related information to their respective depositories on the same day i.e the day on which the transaction was carried out, before the time stipulated by the depositories.
8.5. The stock exchanges shall provide the details of paid up equity capital of all the listed companies, ISIN wise, to the depositories once in six months, periodically and also provide information regarding change in paid up equity capital in any listed company, immediately.
8.6. The QFI and DP shall ensure that the total shareholding held by a QFI shall not exceed five percent of paid up equity capital of the company at any point of time. This investment limit shall be

121
FEBRUARY SEBI BULLETIN 2012
applicable to each class of equity shares having separate and distinct ISIN.
8.7. The depositories shall put in place appropriate systems and procedures to monitor the above limit by using PAN and/ or other unique identity number of the QFI.
8.8. The depositories shall administer and monitor, so as to ensure, that aggregate shareholding of all QFIs shall not exceed ten percent of the paid up equity capital of the company at any point of time, in respect of each equity share class having separate and distinct ISIN.
8.9. The depositories shall jointly publish/ disseminate the ISIN wise and company wise aggregate shareholding of QFIs to public, on daily basis.
8.10. The information regarding ISIN wise and company wise aggregate QFI shareholding shall also be provided by the depositories to the RBI in a manner and format as stipulated by the Reserve Bank of India from time to time.
8.11. When the aggregate shareholding of all the QFIs in a company reaches 8% of the equity paid up capital, the company’s name along with ISIN shall be published in caution list by the depositories and no fresh purchases shall be allowed without prior approval of the depositories. The same shall be informed by the depositories to the DPs
and recognized stock exchanges having nationwide terminals. The depositories shall also inform the DPs and such stock exchanges when any company is removed from the caution list.
8.12. For fresh purchases by QFI in equity shares of companies in the caution list, prior approval of the depositories shall be obtained. The QFI shall make such request for prior approval to the concerned depository through the DP specifying therein the name of the QFI, PAN and other unique identification number relating to that QFI, number of shares to be purchased and the ISIN, by way of any mode of communication as specified by the depositories in consultation with each other. The concerned depository shall provide the details of prior approval requests received by it to the other depository.
8.13. After market hours, the depository shall give prior approval to request for purchase of equity shares of companies in the caution list on a first-come-first-served basis in co-ordination with the other depository, based on time of receipt of the prior approval requests by the depositories,. The validity of the approval shall be for the next trading day only.
8.14. In case the aggregate shareholding of the QFI exceeds the limit of ten percent

122
FEBRUARY SEBI BULLETIN 2012
in respect of any ISIN, the depositories shall jointly notify the respective DPs regarding the breach along with the names of the QFI due to whom the limits have been breached. For this purpose, the stock exchanges shall provide the required information so as to enable the depositories to identify the transaction details of the QFI including the name of QFI, PAN and/ or other unique identification number relating to that QFI, purchase quantity and time or any other information as may be required by the depositories.
8.15. In case the aggregate shareholding of the QFIs exceeds the limit of ten percent for whatsoever reason, the QFI due to whom the limit is breached shall mandatorily divest excess holdings within three working days of such breach being notified by depositories to the DP. The DP shall obtain necessary authorization from the QFI at the time of account opening for such divestment of excess holdings.
8.16. The stock exchanges shall amend Clause 35 of the listing agreement on or before June 30, 2012, so as to incorporate another class of investor to disseminate QFI shareholding in equity shares.
8.17. The stock exchanges shall develop a separate segment for intra QFI transactions in the equity shares of
companies in the caution list, if they wish to buy without the prior approval of depositories. However, QFI who have obtained prior approval of the depositories as referred in para 8.11 and 8.12 above, may purchase equity shares in the normal segment of recognized stock exchanges.
8.18. The stock exchanges/ depositories/ DPs shall not levy any charges towards services relating to monitoring and administering of investment limits of QFI.
9. Processflow
9.1. Purchase9.1.1. The QFI shall place a purchase order
with the DP mentioning the name of the company and ISIN, number of equity shares, name of the stock broker and remit foreign inward remittances from the designated overseas bank account of QFI through normal banking channel in any permitted currency (freely convertible) directly to the single rupee pool bank account of the DP maintained with a designated AD category – I bank.
9.1.2. The DP in turn shall forward the purchase order to the SEBI registered stock broker with whom QFI has opened trading account and remits the money to the brokers account after receipt of funds from QFI and as per the instructions of QFI.

123
FEBRUARY SEBI BULLETIN 2012
9.1.3. If for any reasons, the QFI is not able to purchase equity shares within five working days of the inward remittance (including the date of receipt of foreign inward remittance through normal banking channels from the designated overseas bank account of the QFI into the single rupee pool bank account), the DP shall immediately remit the money back to the designated overseas bank account of the QFI.
9.1.4. The DP shall ensure that equity shares purchased on behalf of QFI are credited into the demat account of that QFI on the pay-out date.
9.1.5. In case of QFI’ participation in public issues, the QFI shall provide instruction to the DP to make application for public issue. The DP, after obtaining necessary instructions from the QFI and subject to availability of funds on account of that QFI in the rupee pool account, shall make application on behalf of such QFI and remit money to the issuer company.
9.2. Sale
9.2.1. On receipt of instruction from QFI containing name of the company and / or ISIN, number of equity shares and name of the stock broker, the DP shall place order for sale of equity shares only after verifying availability of such equity shares in demat account of that
QFI. Upon receipt of sale proceeds on account of sale of equity shares made on behalf of QFI, the same shall be retained in single rupee pool bank account of the DP for a period of maximum five working days.
9.2.2. The QFI can instruct the DP to make fresh purchase of equity shares out of sale proceeds on account of sale of equity shares provided that such purchase is made within five working days (including the date of receipt of the sale proceeds in the single rupee pooled bank account) of receipt of money in the pooled bank account. In case no purchase is made within said period, the money shall be remitted by the DPs to the designated bank overseas account of the QFI within five working days from the date of receipt of money in the pooled bank account.
9.3. Dividendandothercorporateactions
9.3.1. In case of dividend received on account of QFI, the DP shall remit the same to the designated bank overseas account of the QFI within five working days (including the date of credit to the single rupee pool account) from the date of receipt of money in the DP’s rupee pooled bank account, unless any fresh purchase of equity shares is made out of such dividend receipts

124
FEBRUARY SEBI BULLETIN 2012
9.3.2. In case of QFI participation in corporate actions such as buy back, delisting etc. wherein the pool account maintained with DP is credited with funds, such funds shall be remitted back to the designated bank overseas account of the QFI within five days of receipt of same, unless any fresh purchase of equity shares is made out of such funds.
10. The transactions of QFIs, for all purposes, shall be treated at par with that of Indian non institutional investors with regard to margins, voting rights, public issues etc.
11. The investment by the QFI in listed equity shares as mentioned herein above shall also be subject to the relevant and extant FEMA regulations and guidelines issued by the Reserve Bank of India under FEMA, 1999 from time to time.
Source: SEBI / IMD/FII&C/3/2012 dated January 13, 2012.
IV. Call Auction in Pre-open session forInitialPublicOffering(IPO)andOther
CategoryofScrips
1. SEBI, vide circular no. CIR/MRD/DP/21/2010 dated July 15, 2010 introduced Call Auction in Pre-open session (hereinafter referred to as “pre-open session”) for the scrips forming part of Sensex and Nifty. Further, SEBI, vide circular no. CIR/MRD/DP/32/2010 dated September 17, 2010 and vide letter dated September 17, 2010 provided
clarification with regard to order matching and order level risk management.
2. In continuation to the above, it has been decided to extend Call Auction mechanism to IPOs and scrips as defined under para 1(c) of SEBI circular no. SEBI/Cir/ISD/1/2010 dated September 2, 2010 (hereinafter referred to as Re-listed Scrips), on the first day of trading/ re-commencement of trading in the manner prescribed as follows –
3. Duration of Session
The session shall be for a duration of 60 minutes i.e. from 9:00 a.m. to 10:00 a.m., out of which 45 minutes shall be allowed for order entry, order modification and order cancellation, 10 minutes for order matching and trade confirmation and the remaining 5 minutes shall be the buffer period to facilitate the transition from preopen session to the normal trading session.
The session shall close randomly during last one minute of order entry i.e. anytime ebetween 44th and 45th minute of the order entry. Such random closure shall be system driven.
4. Eligible Scrips
I. IPO scrips on the first day of trading
a. Price Bands There shall be no price bands in the pre-
open session.
b. Market Orders Market orders shall not be accepted in
pre-open session.

125
FEBRUARY SEBI BULLETIN 2012
c. Matched Orders For matched orders the provisions of
SEBI circulars and letter mentioned at para above shall apply.
d. Un-matched orders All outstanding orders will be moved to
the normal trading session at their Limit price.
II. Re-listed Scrips
a. Price Bands There shall be no price bands for re-listed
scrips during pre-open session.
b. Market Orders Market orders shall not be accepted in
the pre-open session.
c. Matched Orders For matched orders the provisions of
SEBI circulars and letter mentioned at para 1 above shall apply.
d. Un-matched orders i. In case equilibrium price is discovered,
all outstanding orders shall be moved to the normal trading session at their limit price.
ii. In case equilibrium price is not discovered, all orders shall be cancelled and the scrip shall continue to trade in call auction mechanism until price is determined.
5. Risk Management – For IPO scrips with an issue size greater than ` 250 cr the risk management provisions as prescribed vide
SEBI circular dated July 15, 2010 and letter dated September 17, 2010 shall remain applicable for pre-open session. For IPO scrips with issue size upto ` 250 cr and Re-listed scrips it is advised that margins shall be checked and blocked for 100% of the order value at the order level itself before considering the order eligible for inclusion in pre-open session.
6. All other provisions of the circular No. CIR/MRD/DP/21/2010 dated July 15, 2010 and circular No. CIR/MRD/DP/32/2010 dated September 17, 2010 and letter dated September 17, 2010 shall remain applicable.
7. The above provisions shall be implemented within four weeks from the date of issuance of this circular. The date of commencement of pre-open session for all eligible scrips shall be uniform between both the stock exchanges.
8. SEBI vide circular no CIR/MRD/DP/02/2012 dated January 20, 2012 has prescribed the Trade Controls applicable to trading of IPO and Re-listed scrips in the normal trading session.
9. Stock Exchanges are advised to: a. take necessary steps and put in place
necessary systems for implementation of the above.
b. make necessary amendments to the relevant bye-laws, rules and regulations for the implementation of the above decision.

126
FEBRUARY SEBI BULLETIN 2012
c. bring the provisions of this circular to the notice of the member of the stock exchange and also to disseminate the same on the website.
d. communicate to SEBI, the status of implementation of the provisions of this circular in the Monthly Development Report.
Source : SEBI / MRD/DP/ 01/2012 dated January 20, 2012.
V. Trade Controls in Normal TradingSessionforInitialPublicOffering(IPO)andOtherCategoryofScrips.
1. SEBI vide circular no. SMD/SED/RCG/271/96 dated January 19, 1996, inter-alia, prescribed no price bands for scrips on the first day of trading pursuant to IPO.
Further SEBI vide circular no SEBI/Cir/ISD/1/2010 dated September 2, 2010, interalia, prescribed no price bands on the first day of re-commencement of trading for scrips specified under para 1(c) (hereinafter referred to as Re-listed scrips) of the said circular.
2. In light of high volatility and price movement observed on first day of trading, it has been decided to put in place a framework of trade controls for IPO and Re-listed scrips applicable to the normal trading session in the following manner –
Trade Timing
The normal trading session for IPO and Re-listed scrips on their first day of trading shall commence only subsequent to conclusion of the Call Auction session for such scrip on BSE and NSE. The duration of the Call Auction session is prescribed vide SEBI circular no CIR/MRD/DP/01/2012 dated January 20, 2012.
Eligible scrip
I. IPO scrips
Price Bands
a For issue size up to ` 250 cr, the applicable price bands for the first day shall be –
i. In case equilibrium price is discovered in the Call Auction, the price band in the normal trading session shall be 5% of the equilibrium price.
ii. In case equilibrium price is not discovered in the Call Auction, the price band in the normal trading session shall be 5% of the issue price.
iii. On Stock exchanges, not eligible to offer Call Auction, the reference price for price bands for the first day shall be –
A. in case equilibrium price is discovered in the Call Auction at BSE/NSE, the price band in the normal trading session shall be 5% discovered equilibrium price. In case of multiple equilibrium prices, the discovered equilibrium price closer to the issue price shall be taken as the reference

127
FEBRUARY SEBI BULLETIN 2012
price for price band on the first day. B. in case equilibrium price is not
discovered in the Call Auction, the price in the normal trading session band shall be 5% of the issue price.
Additionally, the trading shall takeplacein TFT segment for first 10 days fromcommencementoftrading.
b. For issue size greater than ` 250 cr, the applicable price bands for the first day shall be –
i. In case equilibrium price is discovered in the Call Auction, the price band in the normal trading session shall be 20% of the equilibrium price.
ii. In case equilibrium price is not discovered in the Call Auction, the price band in the normal trading session shall be 20% of the issue price.
iii. On Stock exchanges, not eligible to offer Call Auction, the reference price for price bands for the first day shall be –
A. in case equilibrium price is discovered in the Call Auction at BSE/NSE, the price band in the normal trading session shall be 20% discovered equilibrium price. In case of multiple equilibrium prices, the discovered equilibrium price closer to the issue price shall be taken as the reference price for price band on the first day
B. in case equilibrium price is not discovered in the Call Auction, the
price band in the normal trading session shall be 20% of the issue price.
II. Re-listed scrips
Price Bands
Trading shall take place in the TFT segment for the first 10 days with applicable price bands, wherein for the first day – i Incase equilibrium price is discovered in
the Call Auction, the price band in the normal trading session shall be 5 % of the discovered price.
ii Incase equilibrium price is not discovered in the Call Auction, the scrip shall continue to trade in call auction sessions until price is determined.
3. All other relevant provisions of the circular no. SMD/SED/RCG/271/96 dated January 19, 1996 and circular no. SEBI/Cir/ISD/1/2010 dated September 2, 2010 as amended from time to time, shall remain applicable.
4. Stock Exchanges are advised to: a. take necessary steps and put in place
necessary systems for implementation of the above.
b. make necessary amendments to the relevant bye-laws, rules and regulations for the implementation of the above decision.
c. bring the provisions of this circular to the notice of the member of the stock exchange and also to disseminate the same on the website.

128
FEBRUARY SEBI BULLETIN 2012
d. communicate to SEBI, the status of implementation of the provisions of this circular in the Monthly Development Report.
Source : SEBI / MRD/DP/ 02/2012dated January 20, 2012.
VI. InvestorGrievanceRedressalMechanismatStockExchanges
1. SEBI, vide circular Ref. No. SMD/POLICY/CIR-32/97 dated December 03,1997 had mandated all stock exchanges to open/maintain at least one investor service centre for the benefit of the public/Investors. Such centres are required to inter alia provide counseling service to the investors. It is also noted that some stock exchanges have constituted Investor Grievance Redressal Committees (IGRC) for redressal of investor grievances.
2. In light of the concerns expressed by investors and to facilitate early redressal of investor grievances, it has been decided to mandate that stock exchanges having nationwide terminals (such as NSE, BSE, MCX-SX and USEIL), functional stock exchanges having trading volumes, stock exchanges entering into MOUs with other exchanges and stock exchanges intending to recommence trading operations shall constitute IGRC at every investor service centre.
3. The composition of the IGRC shall be as follows:-
a. The IGRC shall comprise of a single person for claims upto ` 25 Lakh, whereas, for claims above ` 25 Lakh, the IGRC shall comprise of three persons.
b. The IGRC shall comprise of independent persons with qualifications in the area of law, finance, accounts, economics, management or administration and experience in financial services, including securities market.
c. Further, the three member Committee shall comprise of atleast one technical expert for handling complaints related to technology issues (such as internet based trading, algorithmic trading, etc).
d. The members of IGRC shall not be associated with a trading member in any manner.
e. The disclosures and code of conduct prescribed under para 3.4 and 4 of SEBI circular Ref. No CIR/MRD/DSA/24/2010 dated August 11, 2010, shall be applicable, as far as may be, to members of IGRC also.
4. It is, further, advised that apart from the investor services centres that are currently operating in four metro cities (viz., New Delhi, Mumbai, Chennai and Kolkata), stock exchanges having nationwide terminals shall open investor services centres in other large cities in a time bound manner. A list of places where such centres are proposed to be opened is to be submitted to SEBI immediately and

129
FEBRUARY SEBI BULLETIN 2012
the progress of implementation should be reported to SEBI on a monthly basis in the respective monthly development reports (MDRs).
Source : SEBI / MRD/ DSA/03/2012 dated January 20, 2012.
VII. CompositionofArbitrationCommittee
1. SEBI, vide its various communications has mandated all stock exchanges that not be more than twenty percent of the members of the arbitration committee shall be trading members.
2. It has now been decided to do away with the representation of trading members on arbitration committee/panel of all stock exchanges. It is, henceforth, stipulated that the arbitration committee/panel shall not comprise of any trading members.
3. The stock exchanges are advised to:-
a. make necessary amendments to the relevant bye-laws, rules and regulations for the implementation of the above decision immediately;
b. bring the provisions of this circular to the notice of the members of the stock exchange and also to disseminate the same through their website; and
c. communicate to SEBI, the status of implementation of the provisions of this circular in the Monthly Development Reports to SEBI.
Source : SEBI / MRD/ DSA/04/2012dated January 20, 2012.
VIII. Eligibility criteria for qualifieddepositoryparticipant
1. Vide SEBI circulars Cir/IMD/DF/14/2011 and Cir/IMD/FII&C/3/2012 dated August 09, 2011 and January 13, 2012 respectively, Qualified Foreign Investors (QFI) were allowed to invest in schemes of Indian mutual funds and Indian equity shares subject to terms and conditions mentioned therein, including opening a demat account with qualified Depository Participant. The eligibility criteria for a SEBI registered Depository Participant (DP) to act as qualified Depository Participant were provided in the aforementioned circulars.
2. On a review, it has been decided to amend the eligibility criteria for a SEBI registered DP to act as a qualified Depository Participant. The revised eligibility criteria to act as qualified Depository Participants are as follows:
To become a qualified Depository Participant, a SEBI registered DP shall fulfill the following:
2.1. DP shall have net worth of Rs. 50 crore or more;
2.2. DP shall be either a clearing bank or clearing member of any of the clearing corporations;
2.3. DP shall have appropriate arrangements for receipt and remittance of money with a designated Authorised Dealer (AD) Category – I bank;

130
FEBRUARY SEBI BULLETIN 2012
2.4. DP shall demonstrate that it has systems and procedures to comply with the FATF Standards, Prevention of Money Laundering (PML) Act, Rules and SEBI circulars issued from time to time; and
2.5. DP shall obtain prior approval of SEBI before commencing the activities relating to opening of accounts of QFI.
The eligibility criteria for qualified Depository Participant as contained in SEBI circulars dated August 9, 2011 and January 13, 2012 stands amended as above.
3. In order to maintain consistency in the maximum retention period of QFI’s fund in the single rupee pool bank account for investments/ re-investment out of redemption or dividend in schemes of Indian mutual funds vis-à-vis equity shares, it has been decided to amend clause(s) 4.7.5 and 4.7.7 of circular Cir/IMD/DF/14/2011 dated August 9, 2011.
4. Accordingly, the maximum retention period of QFI’s funds in the single rupee pooled account with the qualified depository participant as envisaged in clause(s) 4.7.5 and 4.7.7 of circular dated August 9, 2011 stands
revised to fiveworkingdays (including the date of receipt of foreign inward remittance through normal banking channels from the designated overseas bank account of the QFI into the single rupee pool bank account) for both investment as well as re-investment out of redemption proceeds in schemes of Indian mutual funds.
5. Further, in partial amendment to clause 4.7.8, it has been decided to allow credit of dividend payments to QFIs on account of investment in schemes of Indian mutual funds held by them to the single rupee pool bank account subject to the condition that in case dividend payments are credited to the single rupee pool bank account, they shall be remitted to the designated overseas bank accounts of the QFIs within five working days (including the day of credit of such funds to the single rupee pool bank account). Within these five working days, the dividend payments can be also utilized for fresh purchases in schemes of Indian mutual funds, if so instructed by the QFI.
Source: SEBI /IMD/ FII&C/ 4/ 2012 dated January 25, 2012

131
FEBRUARY SEBI BULLETIN 2012
• SEBI imposed a penalty of ` 50,00,000/– (Rupees Fifty Lakh only) on Shri V K Kaul in the matter of M/s Orchid Chemicals Pharmaceuticals Ltd. in terms of the provisions of Section 15G (i) of the SEBI Act, 1992 for the violation of Sections 12A (d) and (e) of the SEBI Act, 1992.
• SEBI imposed a penalty of ` 10,00,000/– (Rupees Ten Lakhs Only) on Smt. Bala Kaul in the matter of M/s Orchid Chemicals Pharmaceuticals Ltd. in terms of the provisions of Section 15G(i) of SEBI Act,1992 for the violation of Sections 12A (d) and (e) of the SEBI Act, 1992.
• SEBI imposed a penalty of ` 4,00,000/– (Rupees Four Lakhs Only) on Shri Pratik Rameshchandra Shah in the matter of M/s Platinum Corporation Limited in terms of the provisions of Section 15A(b) of SEBI Act,1992 for not making necessary disclosures under Regulation 13(1), 13(3) and 13(4) of PIT Regulations, 1992 and Regulation 7(1) of SAST Regulations,1997.
• SEBI imposed a penalty of : ` 10,00,000/– (Rupees Ten Lakhs Only) on
Mr. Manoj Gaur (Noticee-1) under section 15G of SEBI Act for violation of regulation 3(ii) of PIT Regulations, 1992.
` 10,00,000/– (Rupees Ten Lakhs Only) on Ms. Urvashi Gaur (Noticee-2) under section 15G of SEBI Act for violation of regulation 3(i), 3(ii) & 4 of PIT Regulations, 1992.
` 10,00,000/ – (Rupees Ten Lakhs Only) on Mr. Sameer Gaur (Noticee-3) under section 15G of SEBI Act for violation of regulation 3(i), 3(ii) & 4 of PIT Regulations, 1992.
In the matter of M/s. Jaiprakash Associates Ltd.
• SEBI imposed a penalty of ` 10,00,000/– (Rupees Ten Lakhs Only) on Mr Harish K Vaid in the matter of M/s. Jaiprakash Associates Ltd. in terms of the provisions of Section 15G of SEBI Act,1992 for violation of regulations 3(ii) & 4 of PIT Regulations, 1992.
• SEBI imposed a penalty of ` 10,00,000/– (Rupees Ten Lakhs Only) on Shri S.D.Nailwal in the matter of M/s. Jaiprakash Associates Ltd. in terms of the provisions of Section 15G of SEBI Act,1992 for violation of regulations 3(i) & 4 of PIT Regulations, 1992 and `10,00,000/ – (Rupees Ten Lakhs only) under section 15HB of SEBI Act, {i.e. a total penalty of ` 20,00,000/– (Rupees Twenty Lakhs only) for violation of regulation 12(1) read with Clause 3.2-2 & 3.2-5 of code of conduct as specified under Part A of Schedule I of the PIT Regulations,1992.
ORDERPASSEDBYADJUDICATINGOFFICERANDCHAIRMAN/MEMBERS

132
FEBRUARY SEBI BULLETIN 2012
• SEBI imposed a penalty of ` 2,00,000/– (Rupees Two Lakhs only) on Shri Manish Ashokbhai in the matter of M/s. Platinum Corporation Ltd. under Section 15HA of SEBI Act, 1992 and Rule 5(1) of the Adjudication Rules for violation of provisions of section 12A (a), (b) and (c) of the Act and Regulations 3 (a),(b),(c),(d), 4(1), 4(2)(e) of PFUTP Regulations,2003.
• SEBI imposed a penalty of ` 10,00,000/– (Rupees Ten Lakhs Only) on Ms. Ashaben Ambani, Mr. Manish Ashokbhai Ambani and Ms. Meena Ashokbhai Ambani in terms of provisions of Section 15H(ii) of SEBI Act, 1992 and Rule 5(1) of the Adjudication Rules, for violating provisions of Regulation 10 of SAST Regulations, 1997 and shall be jointly and severally liable to pay the said monetary penalty in the matter of M/s. Platinum Corporation Ltd.
• SEBI imposed a penalty of ` 10,00,000/– (Rupees Ten Lakhs Only) on Mr. Bipin Ratilal Shah, Ms. Meeta B. Shah, Mr. Bharat Kumar Ratilal Shah and Ms. Preeti Bharat Kumar Shahin terms of provisions of Section 15H(ii) of SEBI Act, 1992 and Rule 5(1) of the Adjudication Rules, for violating provisions of Regulation 10 of SAST Regulations, 1997 and shall be jointly and severally liable to pay the said monetary penalty in the matter of M/s. Platinum Corporation Ltd.
• SEBI imposed a penalty of ` 2,00,000/– (Rupees Two Lakh only) on Ms. Ashaben
Ambani in the matter of M/ s. Platinum Corporation Ltd. under Section 15HA of SEBI Act, 1992 and Rule 5(1) of the Adjudication Rules, for violation of the provisions of section 12A (a), (b) and (c) of the Act and Regulations 3 (a),(b),(c),(d), 4(1), 4(2)(e) of PFUTP Regulations, 2003.
• SEBI imposed a penalty of ` 2,00,000/ – (Rupees Two Lakh only) on Ms. Meena Ashokbhai Ambani in the matter of M/ s. Platinum Corporation Ltd. under Section 15HA of SEBI Act, 1992 and Rule 5(1) of the Adjudication Rules, for violation of the provisions of section 12A (a), (b) and (c) of the Act and Regulations 3 (a),(b),(c),(d), 4(1), 4(2)(e) of PFUTP Regulations, 2003.
• SEBI imposed a penalty of ` 10,00,000/– (Rupees Ten Lakh only) on Shri Saumil A. Bhavnagari in the matter of M/s. Adani Exports Ltd. under Section 15HA of SEBI Act, 1992, for violation of the provisions of Regulations 4 (1) and 4 (2) (a), (b), (e) & (g) of the PFUTP Regulations, 2003.
• SEBI imposed a penalty of ` 2,00,000/– (Rupees Two Lakh only) on M/s. Girish Metals Pvt. Ltd. in the matter of M/s. Platinum Corporation Ltd. under Section 15HA of SEBI Act, 1992 and Rule 5(1) of the Adjudication Rules, for violation of the provisions of section 12A (a), (b) and (c) of the Act and Regulations 3 (a),(b),(c),(d), 4(1), 4(2)(e) of PFUTP Regulations, 2003.

133
FEBRUARY SEBI BULLETIN 2012
• SEBI imposed a penalty of ` 2,00,000/– (Rupees Two Lakh only) on Shri Manoj R Shah in the matter of M/s. Platinum Corporation Ltd. under Section 15HA of SEBI Act, 1992 and Rule 5(1) of the Adjudication Rules, for violation of the provisions of section 12A (a), (b) and (c) of the Act and Regulations 3 (a),(b),(c),(d), 4(1), 4(2)(e) of PFUTP Regulations, 2003.
• SEBI imposed a penalty of ` 1,00,000/– (Rupees One Lakh only) each on Mr. Homiyar Firoze Mistry, Ms. Urmila Lakhotia, Mr. Uday Chandar Mohite in the matter of M/s. Fact Enterprises Ltd under Section 15 A(b) of SEBI Act, 1992 for violation of the provisions of Regulations 7(1) read with 7(2) of SAST Regulations, 1997.
• SEBI imposed a penalty of ̀ 5,00,000 (Rupees Five lakh only) under section 15HB on M/s. India Infoline Securities Limited in the matter of M/s. Asian Star Company Limited for violating the provisions of Regulation 7 read with Clauses A(1) & A(2) of Code of Conduct for Stock Brokers as specified in Schedule II of the Broker Regulations, 1992.
• SEBI imposed a penalty of ` 2,00,000/– (Rupees Two Lakh only) on Ms. Preeti Bharatkumar Shah in the matter of M/s. Platinum Corporation Ltd. under Section 15HA of SEBI Act, 1992 and Rule 5(1) of the Adjudication Rules, for violation of the provisions of section 12A (a), (b) and (c) of
the Act and Regulations 3 (a),(b),(c),(d), 4(1), 4(2)(e) of PFUTP Regulations, 2003.
• SEBI imposed a penalty of ` 2,00,000/– (Rupees Two Lakh only) on M/s. Sonika Granites Pvt. Ltd. in the matter of M/s. Platinum Corporation Ltd. under Section 15HA of SEBI Act, 1992 and Rule 5(1) of the Adjudication Rules, for violation of the provisions of section 12A (a), (b) and (c) of the Act and Regulations 3 (a),(b),(c),(d), 4(1), 4(2)(e) of PFUTP Regulations, 2003.
• SEBI imposed a penalty of ` 2,00,000/– (Rupees Two Lakh only) on M/s. Shanti Tradelink Pvt. Ltd. in the matter of M/s. Platinum Corporation Ltd. under Section 15HA of SEBI Act, 1992 and Rule 5(1) of the Adjudication Rules, for violation of the provisions of section 12A (a), (b) and (c) of the Act and Regulations 3 (a),(b),(c),(d), 4(1), 4(2)(e) of PFUTP Regulations, 2003.
• SEBI imposed a penalty of ` 20,00,000/– (Rupees Twenty Lakh only) in the matter of M/s. Platinum Corporation Ltd. under Section 15H(ii) of SEBI Act, 1992 and Rule 5(1) of the Adjudication Rules,on Mr. Pratik R Shah; Mr. Dhrumal Vaidya; Mr. Anindo A Banerjee; Ms. Nikita B Dave; M/s. Vashi Constructions Pvt. Ltd.;Mr. Rajesh C Shah, Director of M/s. Vashi Constructions Pvt. Ltd.; Ms. Bhavana R Shah, Director of M/s. Vashi Constructions Pvt. Ltd.; M/s. Rudra Securities and Capital Ltd.; Mr. Nileshkumar

134
FEBRUARY SEBI BULLETIN 2012
T Kava, Director of M/s. Rudra Securities and Capital Ltd.; Mr. Ketan D Sorathiya, Director of M/s. Rudra Securities and Capital Ltd.; Mr. Vipul S Trivedi, Director of M/s. Rudra Securities and Capital Ltd.; M/s. Dhanlaxmi Lease Finance Ltd.; Mr. Bipin R Shah, Director of M/s. Dhanlaxmi Lease Finance Ltd.; Mr. Bharat R Shah, Director of M/s. Dhanlaxmi Lease Finance Ltd. and Mr. Girish G Doshi, Director of M/s. Dhanlaxmi Lease Finance Ltd. and shall be jointly and severally liable to pay the said monetary penalty for failing to make necessary public announcement to acquire the shares of the Company in accordance with SAST Regulations,1997.
Since no violation has been established against Ashok H Shah and Neha R Shethwala, Ashok H Shah and Neha R Shethwala are not liable for any monetary penalty under Section 15H (ii) of the SEBI Act, 1992.
• SEBI imposed a penalty of ` 2,00,000/– (Rupees Two Lakh only) on M/s. Lakshya Securities & Credit Holdings in the matter of M/s. Platinum Corporation Ltd. under Section 15HA of SEBI Act, 1992 and Rule 5(1) of the Adjudication Rules for violation of provisions of section 12A (a), (b) and (c) of the Act and Regulations 3 (a),(b),(c),(d), 4(1), 4(2)(e) of PFUTP Regulations, 2003.
• SEBI imposed a penalty of ` 2,00,000/– (Rupees Two Lakh only) on Shri Shankarlal M. Patel in the matter of M/s. Platinum
Corporation Ltd. under Section 15HA of SEBI Act, 1992 and Rule 5(1) of the Adjudication Rules for violation of provisions of section 12A (a), (b) and (c) of the Act and Regulations 3 (a),(b),(c),(d), 4(1), 4(2)(e) of PFUTP Regulations, 2003.
• SEBI directed Mr. Shailesh S. Jhaveri and Ms. Harsha M. Shah to pay a total amount of `2,72,06,222 (Rupees Two Crore Seventy Two Lakh Six Thousand Two Hundred Twenty Two only) in lieu of the disgorgement of the unlawful gain of ̀ 60,72,000 each in the matter of M/s. Ojas Technochem Products Limited for employing fraudulent and unfair trade practices to get the shares and made unlawful gains by selling the shares so cornered, pursuant to the proceedings after the SEBI order dated November 13, 2007 against the notices in violation of the provisions of Regulation 4(b) and (d) of the SEBI (Prohibition of Fraudulent and Unfair Trade Practices Relating to Securities Market) Regulations, 1995 . In addition, they shall also pay `75,31,111 each, being the simple interest at the rate of 12% per annum on the unlawful gain of `60,72,000, for the period of January, 2000 to May, 2010.
• SEBI imposed a penalty of ` 2,00,000/– (Rupees Two lakh only) under Section 15 HB of SEBI Act, 1992 on M/s. MTL Shares & Stock Brokers Ltd in the matter of M/s. Rich Capital & Financial Services Ltd for violating the provisions of Regulation 7 read with Clauses

135
FEBRUARY SEBI BULLETIN 2012
A (2) of Code Of Conduct for stock brokers specified under Schedule II of SEBI (Stock Brokers & sub Brokers) Regulation, 1992.
• SEBI imposed a penalty of ` 50,000/– (Rupees Fifty Thousand only) under Section 15 A(b) of the SEBI Act, 1992 on M/s Sahil Electronics Limited in the matter of M/s. A.V. Cottex Limited for the violation of Regulation 13(3) read with Regulation 13(5) of PIT Regulations, 1992.
• SEBI imposed a penalty of ` 50,000/– (Rupees Fifty Thousand only) under Section 15 A(b) of the SEBI Act, 1992 on M/s Watta Finance & Investment Company Limited in the matter of M/s. A.V. Cottex Limited for the violation of Regulation 13(1)of PIT Regulations, 1992.
• SEBI imposed a penalty of ` 1,00,000/– (Rupees One Lakh only) under Section 15 HA of the SEBI Act, 1992 on Mr. Dhirajlal Patel in the matter of M/s Kewal Kiran Clothing Limited for the violation of provisions of Regulations 3, 4(1), 4(2)(a) and 4(2)(g) of PFUTP Regulations,2003.
• SEBI imposed a penalty of ` 10,00,000/– (Rupees Ten Lakh only) on Shri Ashok Purushottam Patel in the matter of M/s Platinum Corporation Limited in terms of the provisions of Section 15HA of the SEBI Act, 1992 and Rule 5(1) of the Adjudication Rules for violation of provisions of Section 12A (a), (b) and (c) of the Act and Regulations
3 (a),(b),(c),(d), 4(1), 4(2)(e) of PFUTP Regulations,2003.
• SEBI imposed a penalty of ` 10,00,000/– (Rupees Ten Lakh only) on Ms. Gitaben Chandulal Parmar in the matter of M/s Platinum Corporation Limited in terms of the provisions of Section 15HA of the SEBI Act, 1992 and Rule 5(1) of the Adjudication Rules for violation of provisions of Section 12A (a), (b) and (c) of the Act and Regulations 3 (a),(b),(c),(d), 4(1), 4(2)(e) of PFUTP Regulations,2003.
• SEBI imposed a penalty of ` 10,00,000/– (Rupees Ten Lakh only) on Shri Divyesh Jayantibhai Parmar in the matter of M/s Platinum Corporation Limited in terms of the provisions of Section 15HA of the SEBI Act, 1992 and Rule 5(1) of the Adjudication Rules for violation of provisions of Section 12A (a), (b) and (c) of the Act and Regulations 3 (a),(b),(c),(d), 4(1), 4(2)(e) of PFUTP Regulations,2003.
• SEBI imposed a penalty of ` 10,00,000/– (Rupees Ten Lakh only) on Shri Balchandra K. Patel in the matter of M/s Platinum Corporation Limited in terms of the provisions of Section 15HA of the SEBI Act, 1992 and Rule 5(1) of the Adjudication Rules for violation of provisions of Section 12A (a), (b) and (c) of the Act and Regulations 3 (a),(b),(c),(d), 4(1), 4(2)(e) of PFUTP Regulations, 2003.

136
FEBRUARY SEBI BULLETIN 2012
• SEBI imposed a penalty of ` 10,00,000/– (Rupees Ten Lakh only) on Shri Kalpesh Ramanbhai Patel in the matter of M/s Platinum Corporation Limited in terms of the provisions of Section 15HA of the SEBI Act, 1992 and Rule 5(1) of the Adjudication Rules for violation of provisions of Section 12A (a), (b) and (c) of the Act and Regulations 3 (a),(b),(c),(d), 4(1), 4(2)(e) of PFUTP Regulations,2003.
• SEBI imposed a penalty of ` 3,00,000/– (Rupees Three Lakh only) on Shri Balasaheb J Kamble in the matter of M/s Flawless Diamond (India) Limited in terms of the provisions of Section 15HA of the SEBI Act, 1992 for violation of provisions of Regulations 4(1), 4(2)(a), 4(2)(b)and 4(2)(g)of PFUTP Regulations, 2003.
• SEBI imposed a penalty of ̀ 2,00,000/– (Rupees Two Lakh only) on Shri Vijay K Bohra in the matter of M/s Flawless Diamond (India) Limited in terms of the provisions of Section 15HA of the SEBI Act, 1992 for violation of provisions of Regulations 4(1), 4(2)(a), 4(2)(b)and 4(2)(g)of PFUTP Regulations, 2003.
• SEBI imposed a penalty of ` 1,00,000/– (Rupees One Lakh only) on Shri Dinesh K Pandey in the matter of M/s Flawless Diamond (India) Limited in terms of the provisions of Section 15HA of the SEBI Act, 1992 for violation of provisions of Regulations 4(1), 4(2)(a), 4(2)(b)and 4(2)(g)of PFUTP Regulations, 2003.
• SEBI imposed a penalty of ` 10,00,000/– (Rupees Ten Lakh only) on Shri Mahendra Kashiram Patel in the matter of M/s Platinum Corporation Limited in terms of the provisions of Section 15HA of the SEBI Act, 1992 and Rule 5(1) of the Adjudication Rules for violation of provisions of Section 12A (a), (b) and (c) of the Act and Regulations 3 (a),(b),(c),(d), 4(1), 4(2)(e) of PFUTP Regulations,2003.
• SEBI imposed a penalty of ` 10,00,000/– (Rupees Ten Lakh only) on Shri Mukesh Chimanlal Bhayani in the matter of M/s Platinum Corporation Limited in terms of the provisions of Section 15HA of the SEBI Act, 1992 and Rule 5(1) of the Adjudication Rules for violation of provisions of Section 12A (a), (b) and (c) of the Act and Regulations 3 (a),(b),(c),(d), 4(1), 4(2)(e) of PFUTP Regulations,2003.
• SEBI imposed a penalty of ` 10,00,000/– (Rupees Ten Lakh only) on M/s Keynote Corporate Services Ltd. in the matter of M/s Edserv Softsystems Limited in terms of the provisions of Section 15HB of the SEBI Act, 1992 for its failure to comply with the Clauses 5.1 (5.1.1. and 5.1.2), 5.3.3.2 (ii) under Chapter V of SEBI (DIP) Guidelines, 2000 read with Regulation 111 of SEBI (ICDR) Regulations, 2009.
• SEBI imposed a penalty of ` 15,00,000/- (Rupees Fifteen Lakhs only) on Smt. Roopal Nareshbhai Panchal and a penalty of
137
FEBRUARY SEBI BULLETIN 2012
` 1,00,000 (Rupees One Lakh only) on Shri Arjav Nareshbhai Panchal in the matter of IPO irregularities in terms of the provisions of Section 15HA of the SEBI Act, 1992 for violation of the provisions of Section 12A (a), (b) and (c) of the Act and Regulations 3 (a), (b), (c) and (d) and Regulation 4(1) of PFUTP Regulations, 2003.
• SEBI imposed a penalty of ` 10,00,000/– (Rupees Ten Lakh only) on Shri Narendra Kashiram Patel in the matter of M/s Platinum Corporation Limited in terms of the provisions of Section 15HA of the SEBI Act, 1992 and Rule 5(1) of the Adjudication Rules for violation of provisions of Section 12A (a), (b) and (c) of the Act and Regulations 3 (a),(b),(c),(d), 4(1), 4(2)(e) of PFUTP Regulations,2003.
• SEBI imposed a penalty of ` 10,00,000/– (Rupees Ten Lakh only) on Shri Pravinbhai Kashiram Patel in the matter of M/s Platinum Corporation Limited in terms of the provisions of Section 15HA of the SEBI Act, 1992 and Rule 5(1) of the Adjudication Rules for violation of provisions of Section 12A (a), (b) and (c) of the Act and Regulations 3 (a),(b),(c),(d), 4(1), 4(2)(e) of PFUTP Regulations,2003.
• SEBI imposed a penalty of ` 10,00,000/ – (Rupees Ten Lakh only) on Shri Sanjay S. Patel in the matter of M/s Platinum Corporation Limited in terms of the provisions of Section 15HA of the SEBI Act, 1992 and Rule 5(1)
of the Adjudication Rules for violation of provisions of Section 12A (a), (b) and (c) of the Act and Regulations 3 (a),(b),(c),(d), 4(1), 4(2)(e) of PFUTP Regulations,2003.
• SEBI imposed a penalty of ` 6,00,000/– (Rupees Six Lakh only) on M/s J H P Securities Private Limited in the matter of M/s Gemstone Investments Limited in terms of the provisions of Section 15 HA of the Act for the violation of the provisions of Regulations 4(1), 4(2)(a) and 4(2)(e) of PFUTP Regulations, 2003 and ` 2,00,000/– (Rupees two lakh only) in terms of the provisions of Section 15HB of the Act for the violation of the provisions of clauses A(1) to (5) of the Code of Conduct for Stock Brokers as specified under Schedule II read with Regulation 7 of the Brokers Regulations, 1992 (i.e. a total amount of Rupees Eight Lakh only).
• SEBI imposed a penalty of ` 1.87 crore (Rupees One Crore and eighty seven lakh only) on M/s. Hanumesh Realtors Private Limited in tbe matter of M/s. S. Kumars.Com Ltd. (presently known as S Kumars Online Ltd.) in terms of the provisions of Section 15H (ii) of the SEBI Act, 1992 for the violation/contravention of the provisions of Regulation 11 (1) read with Regulation 14(1) of the SAST Regulations, 1997.
Note:Aboveinformationareindicativeonly.Fordetails,pleaselogontohttp://www.sebi.gov.in/sebiweb/home/list/2/9/0/1/Orders

138
FEBRUARY SEBI BULLETIN 2012
1. Treasury Releases Semi-Annual Report toCongressonInternationalExchangeRatePolicies
The Treasury Department released the Semi-Annual Report to Congress on International Economic and Exchange Rate Policies that covers international economic and foreign exchange developments in the first half of 2011. The Report highlights the need for greater exchange rate flexibility, most notably by China, but also in other major economies. Based on the ongoing appreciation of the RMB against the dollar since June 2010, the decline in China’s current account surplus, and China’s official commitments at the G-20, APEC, and the U.S.-China Strategic and Economic Dialogue (S&ED) that it will move more rapidly toward exchange-rate flexibility, China was not named as a currency manipulator. Treasury will closely monitor the pace of RMB appreciation and press for policy changes that yield greater exchange-rate flexibility, a level playing field, and a sustained shift to domestic demand-led growth.Source: http://www.treasury.gov/resource-center/international/exchange-rate-policies/Pages/index.aspx
2. Federal Reserve Issues White Paper onU.S.HousingMarket
The Federal Reserve published a white paper on the current conditions and policy considerations with regard the U.S. housing market. The report provides a framework for thinking about directions policymakers might take to help the housing market and offers background on current housing conditions. It then discusses proposals
aimed at foreclosed properties that are owned by financial institutions, such as the government-sponsored enterprises (GSEs) or banks, examines proposals aimed at homeowners at risk of default or foreclosure, and discusses ideas for improving mortgage servicing practices. It cautions that although policy action in these areas could facilitate the recovery of the housing market, economic losses will remain, and these losses must ultimately be allocated among homeowners, lenders, guarantors, investors, and taxpayers.Source:http://www.federalreserve.gov/publications/other-reports/files/housing-white-paper-20120104.pdf
3. MEPSCallforRoadmapTowardEurobondsAs the working group drafting the “international agreement on a reinforced economic union” reconvened this week, Members of the European Parliament (MEPs) voiced their support for a roadmap with a view to introducing Eurobonds. The group, led by Elmar Brok (EPP, DE), Roberto Gualtieri (S&D, IT) and Guy Verhofstadt (ALDE, BE), called on Member States to establish a national debt-reduction fund and to adopt a roadmap creating the conditions that will allow them to issue part of their sovereign debt in common, with joint and several liabilities. The MEPs added that a “sustainable framework” is needed for the possible introduction of stability bonds, with the aim of enhancing economic governance and economic growth in the euro area.Source: http://www.europarl.europa.eu/news/en/pressroom/content/20120105IPR34873/html/Reinforced-economic-union-MEPs-call-for-roadmap-towards-eurobonds
HIGHLIGHTSOFDEVELOPMENTSININTERNATIONALSECURITIESMARKETS

139
FEBRUARY SEBI BULLETIN 2012
4. SIFMAReleasesEconomicSurvey
SIFMA’s Economic Advisory Roundtable released its outlook for the full year 2011 and 2012, forecasting that the economy will grow at a rate of 2.2 percent in 2012. “While our Roundtable has forecast continued economic growth through 2012, those predictions have been revised downward since our midyear survey,” said Kyle Brandon, managing director, director research at SIFMA. “Concerns over the European debt crisis, along with domestic politics, fiscal policies and regulatory uncertainty remain significant risks to the downside for the economy going forward.”Source:http://www.sifma.org/econoutlook20112h/
5. IMFPublishesWorkingPaperonForeignBanksandFinancialStability
The International Monetary Fund (IMF) published a working paper that analyzes the trends, impact and financial stability of foreign banks. It notes that while the entry of foreign banks is generally thought to have favorable effects on the development of host banking systems, including through increased credit extension, some studies find more ambiguous results. The paper also points out that the recent financial crisis highlighted that, while foreign banks play important roles in the global financial system and affect domestic financial systems, access to financial services, and consequent economic performance, many aspects are not yet well understood, in part due to lack of data.
Further, it concludes that foreign banks generally have higher capital adequacy and better liquidity positions. They also engage relatively less in
traditional lending businesses. In terms of performance, maybe surprising, foreign banks underperform domestic banks in emerging markets and developing countries, but do not perform differently in high-income countries, it notes.Source: http://www.imf.org/external/pubs/ft/wp/2012/wp1210.pdf
6. IMF Announces Countries UndergoingFSAPsin2012
The IMF released a list of countries under Financial Sector Assessment Programs during 2012 that will focus on potential risks in large, interconnected financial sectors in France, Spain, Japan, Brazil, and Australia, among others. The IMF’s Financial Sector Assessment Program assesses three key components in all countries: the soundness of banks and other financial institutions, including through stress tests; the quality of bank, insurance, and financial market supervision; and the ability of supervisors, policymakers, and financial safety nets to respond effectively in case of a crisis. The IMF notes that crisis management arrangements are “also under the microscope,” along with how countries can prepare for a crisis.Source: http://www.imf.org/external/pubs/ft/survey/so/2012/POL011312A.htm
7. MAS Introduces Regulatory FrameworkforCRAs
The Monetary Authority of Singapore (MAS) introduced a regulatory framework for credit rating agencies (CRAs) that takes effect immediately. Under the new CRA regulatory framework, the provision of credit rating services
140
FEBRUARY SEBI BULLETIN 2012
will be regulated under the Securities and Futures Act (SFA). CRAs will consequently have to be licensed under the Capital Markets Services (CMS) licensing regime under the SFA and be subject to licensing obligations. Existing CRAs will be given a transition period of 6 months to apply for the required licence.Source: http://www.mas.gov.sg/news_room/press_releases/2012/MAS_introduces_regulatory_framework_for_CRA.html
8. EC Proposes Comprehensive Reform ofDataProtectionRules
The European Commission (EC) proposed a comprehensive reform of the EU’s 1995 data protection rules that includes a regulation setting out a general EU framework for data protection and a directive on protecting personal data processed for the purposes of prevention, detection, investigation or prosecution of criminal offences and related judicial activities. The proposals include a single set of rules on data protection, valid across the EU and the stipulation that if personal data is handled abroad by companies that are active in the EU market and offer their services to EU citizens. The Commission’s proposals will now be passed on to the European Parliament and EU Member States (meeting in the Council of Ministers) for discussion. They will take effect two years after they have been adopted.Source: http://europa.eu/rapid/pressReleasesAction.do?reference=IP/12/46&format=HTML&aged=0&language=EN&guiLanguage=en
9. HouseAgricultureCommitteePassesSixBillsonDerivatives
The U.S. House Agriculture Committee passed six bills that amend the Dodd-Frank Act by a voice vote. Some of the issues covered by the bills include: the use of derivatives by end users to manage business risks without being subject to costly margin requirements; clarification that inter-affiliate transactions are not to be regulated as swaps; and clarification to prohibit regulators from requiring a minimum number of participants to receive or respond to quote requests.Source: http://agriculture.house.gov/press/PRArticle.aspx?NewsID=1517
10. IOSCO Publishes Follow-On AnalysistoTradingofOTCDerivativesReport
The International Organization of Securities Commissions (IOSCO) published a follow-on analysis to its report on Trading of OTC derivatives that describes the different types of trading platforms currently available for the execution of OTC derivatives transactions in IOSCO member jurisdictions. Where possible, it also notes the differences relating to participant, product and geographic coverage. It notes that there are a number of different types of trading platforms currently available for the execution of OTC derivatives transactions in IOSCO member jurisdictions that fall into two broad categories: those with multiple liquidity providers (multi-dealer platforms) and those with a single liquidity provider (single-dealer platforms). The report also offers an overview of regulatory approaches by the United States, European Union and other global jurisdictions.Source:http://iosco.org/library/pubdocs/pdf/IOSCOPD368.pdf

141
FEBRUARY SEBI BULLETIN 2012
ANNEXAnnex
1 Company-Wise Capital Raised through Public and Rights Issues during January 2012
2 Preferential Allotments Listed at BSE and NSE
3 Rating Assigned to IPOs during January 2012
4 Open Offers under SEBI Takeover Code closed during January 2012
5 Private Placement of Corporate Debt Reported to BSE and NSE
6 SEBI Registered Market Intermediaries/Institutions
7 Capital Raised from the Primary market through though Public and Rights Issues
8 Capital Raised from the Primary Market through Qualified Institutions' Placement (QIP)
9 Industry-wise Classification of Capital Raised through Public and Rights Issues
10 Sector-wise and Region-wise Distribution of Capital Mobilised through Public and Rights Issues
11 Size-wise Classification of Capital Raised through Public and Rights Issues
12 Distribution of Turnover on Cash Segments of Exchanges
13 Cash Segment of BSE
14 Cash Segment of NSE
15 Trends in Cash Segment of BSE during January 2012
16 Trends in Cash Segment of NSE during January 2012
17 Turnover and Market Capitalisation at BSE and NSE during January 2012
18 Component Stocks: BSE Sensex during January 2012
19 Component Stocks: S&P CNX Nifty index during January 2012
20 Volatility of Major Indices
21 City-wise Distribution of Turnover on Cash Segments of BSE and NSE
22 Advances/Declines in Cash Segment of BSE and NSE (No. of Securities)
23 Trading Frequency in Cash Segment of BSE and NSE
24 Percentage Share of Top ‘N’ Securities/Members in Turnover of Cash Segment
25 Settlement Statistics for Cash Segment of BSE
26 Settlement Statistics for Cash Segment of NSE
27 Equity Derivatives Segment at BSE
28 Equity Derivatives Segment at NSE
29 Equity Derivatives Trading at NSE during January 2012
30 Settlement Statistics in Equity Derivatives Segment at BSE and NSE

142
FEBRUARY SEBI BULLETIN 2012
31 Trends in Trading in the Corporate Debt Market
32 Trading Statistics of Currency Derivatives Segment at NSE
33 Trading Statistics of Currency Derivatives Segment at MCX_SX
34 Trading Statistics of Currency Derivatives Segment at USE
35 Daily Trends of Currency Derivatives Trading at NSE during January 2012
36 Daily Trends of Currency Derivatives Trading at MCX_SX during January 2012
37 Daily Trends of Currency Derivatives Trading at USE during January 2012
38 Settlement Statistics of Currency Derivatives Segment
39 Trading Statistics of Interest Rate Futures Segment
40 Interest Rate Futures trading at NSE during January 2012
41 Settlement Statistics in Interest Rate Futures Segment
42 Trends in Foreign Institutional Investment
43 Daily Trends in Foreign Institutional Investment during January 2012
44 Notional Value of Participatory Notes (PNs) Vs Assets Under Management of FIIs (in Rs. Crores)
45 Trends in Resource Mobilization by Mutual Funds
46 Type-wise Resource Mobilisation by Mutual Funds: Open-ended and Close-ended
47 Scheme-wise Resource Mobilisation by Mutual Funds
48 Trends in Transactions on Stock Exchanges by Mutual Funds
49 Asset Under Management by Portfolio Manager
50 Substantial Acquisition of Shares and Takeovers
51 Progress Report of NSDL & CDSl as on January 31, 2012(Listed Companies)
52 Progress of Dematerialisation at NSDL and CDSL
53 Assets under the Custody of Custodians
54 Ratings Assigned for Long-term Corporate Debt Securities (Maturity ≥ 1 year)
55 Review of Accepted Ratings of Corporate Debt Securities (Maturity ≥ 1 year)
56 Macro Economic Indicators
57 Daily Return and Volatility: Select World Stock Indices
N.B.: 1. NA = Not Applicable/Available. 2. 1 crore = 10 million = 100 lakh. 3. The total provided in the Annex and Statistical Tables may not always match with the sum total of the break-ups due to decimal
differences. 4. The data for the current month is provisional.
✦ ✦ ✦

143
FEBRUARY SEBI BULLETIN 2012
Table 1: SEBI Registered Market Intermediaries/Institutions
Market Intermediaries 2008-09 2009-10 2010-11 2011-12$1 2 3 4 5
Stock Exchanges (Cash Market) 19 19 19 19Stock Exchanges (Derivatives Market) 2 2 2 2Stock Exchanges (Currency Derivatives) 3 4 4 4Brokers (Cash Segment)* 9,628 9,772 10,203 10,277Corporate Brokers (Cash Segment) 4,079 4,197 4,774 4,872Brokers (Derivative) 1,587 1,705 2,111 2,315Brokers (Currency Derivatives) 1,154 1,459 2,008 2,148Sub-brokers (Cash Segment) 62,471 75,378 83,808 78,045
Foreign Institutional Investors 1,635 1,713 1,722 1,775Sub-accounts 4,967 5,378 5,686 6,318Custodians 16 17 17 19Depositories 2 2 2 2Depository Participants 714 758 805 851Merchant Bankers 134 164 192 199Bankers to an Issue 51 48 55 57Underwriters 19 5 3 3Debenture Trustees 30 30 29 31Credit Rating Agencies 5 5 6 6Venture Capital Funds 132 158 184 201Foreign Venture Capital Investors 129 143 153 168Registrars to an Issue & Share Transfer Agents 71 74 73 74Portfolio Managers 232 243 267 248Mutual Funds 44 47 51 49Collective Investment Schemes 1 1 1 1Approved Intermediaries (Stock Lending Schemes) 2 2 2 2STP (Centralised Hub) 1 1 1 1STP Service Providers 2 2 2 2
$ indicates as on last trading day of Jan. 2012.*including brokers on Mangalore SE (58), HSE (303), Magadh SE (197), SKSE (404). Source : SEBI

144
FEBRUARY SEBI BULLETIN 2012
Table 2: Company-Wise Capital Raised through Public and Rights Issues (Equity) during January 2012
SL. No.
Name of the Issuer/Company
Date of Opening
Type of Issue
Type of Instrument
No. of Shares/BondsIssued
Face Value
(`)
Premium Value
(`)
Issue price ( ` )
Size of Issue
(` crore)
1 2 3 4 5 6 7 8 9 10
NIL
Note: All the Issues are compiled from the Prospectus’ of Issuer Companies filed with SEBI.Source: SEBI.

145
FEBRUARY SEBI BULLETIN 2012
Table 3 : Rating Assigned to IPOs during January 2012
Sr. No. Name of the Company Credit Rating Agencies
Rating Assigned
1 2 3 4
1 Multi Commodity Exchange of India Limited CRISIL IPO GRADE 5
2 Modern Tube Industries Ltd. CARE IPO GRADE 2
Note : a) IPO grading is the grade assigned by a Credit Rating Agency (CRA) registered with SEBI.
b) The IPO grading is assigned on a five point scale from 1 to 5 with an “IPO Grade 5” indicating,strong fundamentals..and an “IPO Grade 1” indicating poor fundamentals.
Source: Credit Rating Agencies.

146
FEBRUARY SEBI BULLETIN 2012
Table 4: Open Offers under SEBI Takeover Code closed during January 2012
Sl. No.
Target Company Acquirer Offer Opening
Date
Offer Closing
Date
Offer Size Offer Price (`) per share
No. of Shares
Percent of Equity Capital
1 2 3 4 5 6 7 8
1 YASH TRADING AND FINANCE LIMITED
MR. PRADEEP KUMAR SETHY
14-Dec-11 2-Jan-12 49,000 20.0 157.0
2 MPS LIMITED ADI BPO SERVICES PVT LIMITED
14-Dec-11 2-Jan-12 33,64,534 20.0 37.0
3 SWARAJ AUTOMOTIVES LIMITED
MAHINDRA & MAHINDRA LTD
27-Dec-11 10-Jan-12 6,47,382 27.0 90.0
4 CROITRE INDUSTRIES LTD(SAI WIRES INDIA LTD)
MR GIRDHAR S. BANSAL
28-Dec-11 16-Jan-12 12,61,278 35.7 1.8
5 MEDIA MATRIX WORLDWIDE LIMITED
DIGIVISION HOLDINGS PVT LTD
28-Dec-11 16-Jan-12 2,10,24,900 26.0 1.9
6 WAVERLEY INVESTMENTS LIMITED
FRANKTEX ENTERPRISES LTD &GOODFAITH COMMERCIAL LTD
28-Dec-11 16-Jan-12 1,00,000 20.0 45.0
7 MOLIND ENGINEERING LIMITED
ROYAL BEVERAGES PRIVATE LIMITED
6-Jan-12 25-Jan-12 5,07,000 20.0 45.0
8 RABHA PLASTICS LIMITED
MR.KAMLESH BHANUSHALI, MR.ANAND GURNANI, MR.SANKOOLA.SHAH
9-Jan-12 28-Jan-12 10,90,760 20.1 14.3
Source : SEBI.

147
FEBRUARY SEBI BULLETIN 2012T
able
5: C
apit
al R
aise
d fr
om t
he P
rim
ary
Mar
ket
thro
ugh
Publ
ic a
nd R
ight
s Is
sues
Year
/M
onth
Tota
l C
ateg
ory-
wise
Issue
r-typ
e (Eq
uity
)In
strum
ent-w
ise
Publ
ic Ri
ghts
Liste
dIP
Os
Equi
ties
CCPS
/FCD
sD
ebt
At P
arAt
Pre
miu
m
No.
of
iss
ue
Amou
nt
(` cr
ore)
No.
of
issue
Amou
nt
(` cr
ore)
No.
of
issue
Amou
nt
(` cr
ore)
No.
of
iss
ue
Amou
nt
(` cr
ore)
No.
of
iss
ue
Amou
nt
(` cr
ore)
No.
of
issue
Amou
nt
(` cr
ore)
No.
of
issue
Amou
nt
(` cr
ore)
No.
of
iss
ue
Amou
nt
(` cr
ore)
No.
of
iss
ue
Amou
nt
(` cr
ore)
12
34
56
78
910
1112
1314
1516
1718
19
2008
-0947
16,2
2022
3,58
225
12,6
3725
12,6
3721
2,08
25
9640
14,1
761
448
11,
500
2009
-1076
57,5
5547
49,2
3629
8,31
934
30,3
5939
24,6
961
971
54,8
661
180
32,
500
2010
-1191
67,6
0968
58,1
0523
9,50
328
22,5
9953
35,5
592
5078
57,6
171
490
109,
451
2011
-12$
5234
,463
4232
,375
102,
088
116,
666
294,
981
399
3711
,548
00
1222
,817
Apr
-11
62,
023
62,
023
00
00
62,
023
00
62,
023
00
00
May
-11
54,
781
54,
781
00
14,
578
420
30
05
4,78
10
00
0
Jun-
117
1,19
64
1,14
13
553
553
141
286
411
00
01
1,00
0
Jul-1
15
1,44
73
1,38
22
652
653
1,38
21
134
1,43
40
00
0
Aug
-11
113,
866
83,
547
331
93
319
460
50
07
924
00
42,
942
Sep-
1112
3,02
910
1,38
12
1,64
92
1,64
99
627
00
112,
275
00
175
4
Oct
-11
00
00
00
00
00
00
00
00
00
Nov
-11
21,
062
21,
061
00
00
00
00
00
00
21,
062
Dec
-11
310
,759
310
,759
00
00
00
00
00
00
310
,759
Jan-
121
6,30
01
6,30
00
00
00
00
00
00
01
6,30
0
$ in
dica
tes
as o
n la
st t
radi
ng d
ay o
f Jan
. 201
2.T
he fi
gure
s fo
r th
e m
onth
of J
anua
ry 2
012
are
prov
isio
nal
FCD
: Ful
ly C
onve
rtib
le D
eben
ture
; CC
PS: C
umul
ativ
e C
onve
rtib
le P
refe
renc
e Sh
are.
The
tot
al in
clud
es e
ithe
r Pu
blic
plu
s R
ight
s or
Equ
ity
plus
Deb
t or
Equ
itie
s pl
us C
CPs
/FC
Ds
and
Deb
t.A
ll th
e Is
sues
are
com
pile
d fr
om t
he P
rosp
ectu
s’ of
Iss
uer
Com
pani
es fi
led
wit
h SE
BI.
Sour
ce :
SEB
I.
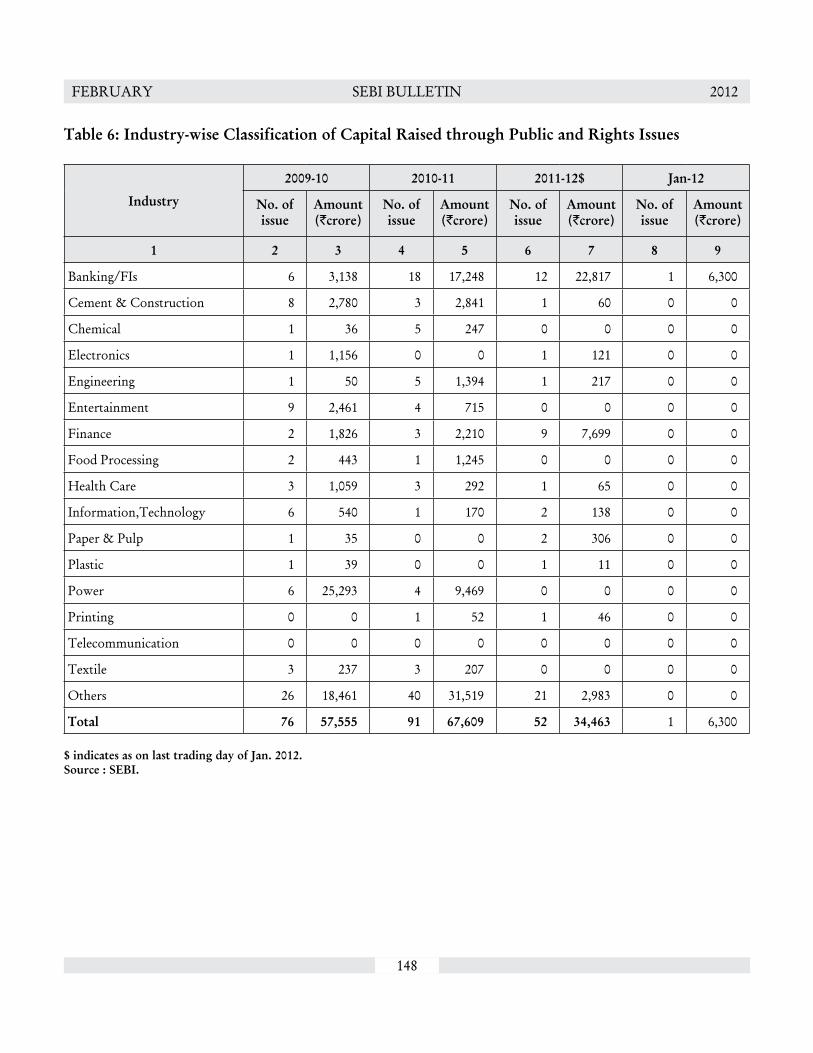
148
FEBRUARY SEBI BULLETIN 2012
Table 6: Industry-wise Classification of Capital Raised through Public and Rights Issues
Industry
2009-10 2010-11 2011-12$ Jan-12
No. of issue
Amount (`crore)
No. of issue
Amount (`crore)
No. of issue
Amount (`crore)
No. of issue
Amount (`crore)
1 2 3 4 5 6 7 8 9
Banking/FIs 6 3,138 18 17,248 12 22,817 1 6,300
Cement & Construction 8 2,780 3 2,841 1 60 0 0
Chemical 1 36 5 247 0 0 0 0
Electronics 1 1,156 0 0 1 121 0 0
Engineering 1 50 5 1,394 1 217 0 0
Entertainment 9 2,461 4 715 0 0 0 0
Finance 2 1,826 3 2,210 9 7,699 0 0
Food Processing 2 443 1 1,245 0 0 0 0
Health Care 3 1,059 3 292 1 65 0 0
Information,Technology 6 540 1 170 2 138 0 0
Paper & Pulp 1 35 0 0 2 306 0 0
Plastic 1 39 0 0 1 11 0 0
Power 6 25,293 4 9,469 0 0 0 0
Printing 0 0 1 52 1 46 0 0
Telecommunication 0 0 0 0 0 0 0 0
Textile 3 237 3 207 0 0 0 0
Others 26 18,461 40 31,519 21 2,983 0 0
Total 76 57,555 91 67,609 52 34,463 1 6,300
$ indicates as on last trading day of Jan. 2012.Source : SEBI.

149
FEBRUARY SEBI BULLETIN 2012T
able
7: S
ecto
r-w
ise
and
Reg
ion-
wis
e D
istr
ibut
ion
of C
apit
al M
obili
sed
thro
ugh
Publ
ic a
nd R
ight
s Is
sues
Yea
r/M
onth
Tot
alSe
ctor
-wis
eR
egio
n-w
ise
Pri
vate
Pub
lic N
orth
ern
Eas
tern
Wes
tern
Sout
hern
Fore
ign
No.
of
is
sue
Am
ount
(`
cror
e)N
o.
of
issu
e
Am
ount
(`
cror
e)N
o.
of
issu
e
Am
ount
(`
cror
e)N
o.
of
issu
e
Am
ount
(`
cror
e)N
o.
of
issu
e
Am
ount
(`
cror
e)N
o.
of
issu
e
Am
ount
(`
cror
e)N
o.
of
issu
e
Am
ount
(`
cror
e)N
o.
of
issu
e
Am
ount
(`
cror
e)
12
34
56
78
910
1112
1314
1516
17
2008
-09
4716
,220
4716
,220
00
62,
902
531
521
11,2
0215
1,80
00
0
2009
-10
7657
,555
7026
,438
631
,117
1724
,714
104,
175
3615
,796
1312
,870
00
2010
-11
9167
,609
7729
,385
1438
,223
2016
,356
817
,190
3521
,479
2710
,097
12,
487
2011
-12$
5234
,463
4611
,372
511
,632
1022
,844
550
123
5,53
614
5,58
30
0
Apr
-11
62,
023
62,
023
00
00
149
31,
013
296
10
0
May
-11
54,
781
420
31
4,57
81
4,57
80
04
203
00
00
Jun-
117
1,19
66
196
11,
000
121
00
417
02
1,00
50
0
Jul-1
15
1,44
75
1,44
70
01
550
02
1,32
72
650
0
Aug
-11
113,
866
113,
866
00
31,
016
111
235
85
2,48
00
0
Sep-
1112
3,02
911
2,27
51
754
287
42
140
71,
932
183
00
Oct
-11
00
00
00
00
00
00
00
00
Nov
-11
21,
062
21,
062
00
00
00
153
31
529
00
Dec
-11
310
,759
130
02
5,30
01
10,0
001
300
00
145
90
0
Jan-
121
6,30
00
00
01
6,30
00
00
00
00
0
The
tot
al is
eit
her
a to
tal o
f Sec
tor-
wis
e cl
assi
fica
tion
or
Reg
ion-
wis
e cl
assi
fica
tion
.$
indi
cate
s as
on
last
tra
ding
day
of J
an. 2
012.
Sour
ce :
SEB
I.
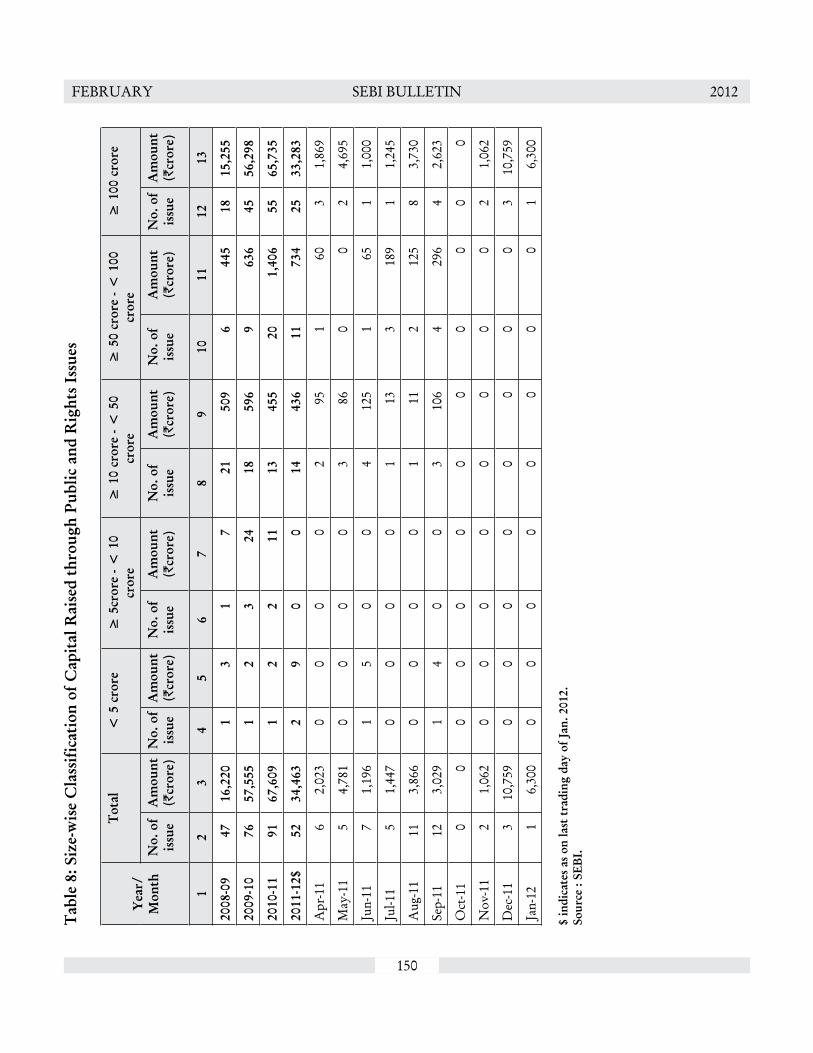
150
FEBRUARY SEBI BULLETIN 2012T
able
8: S
ize-
wis
e C
lass
ific
atio
n of
Cap
ital
Rai
sed
thro
ugh
Publ
ic a
nd R
ight
s Is
sues
Yea
r/M
onth
Tot
al<
5 c
rore
≥ 5
cror
e - <
10
cror
e≥
10
cror
e - <
50
cror
e≥
50
cror
e - <
100
cr
ore
≥ 1
00 c
rore
No.
of
issu
eA
mou
nt
(`cr
ore)
No.
of
issu
eA
mou
nt
(`cr
ore)
No.
of
issu
eA
mou
nt
(`cr
ore)
No.
of
issu
eA
mou
nt
(`cr
ore)
No.
of
issu
eA
mou
nt
(`cr
ore)
No.
of
issu
eA
mou
nt
(`cr
ore)
12
34
56
78
910
1112
13
2008
-09
4716
,220
13
17
2150
96
445
1815
,255
2009
-10
7657
,555
12
324
1859
69
636
4556
,298
2010
-11
9167
,609
12
211
1345
520
1,40
655
65,7
35
2011
-12$
5234
,463
29
00
1443
611
734
2533
,283
Apr
-11
62,
023
00
00
295
160
31,
869
May
-11
54,
781
00
00
386
00
24,
695
Jun-
117
1,19
61
50
04
125
165
11,
000
Jul-1
15
1,44
70
00
01
133
189
11,
245
Aug
-11
113,
866
00
00
111
212
58
3,73
0
Sep-
1112
3,02
91
40
03
106
429
64
2,62
3
Oct
-11
00
00
00
00
00
00
Nov
-11
21,
062
00
00
00
00
21,
062
Dec
-11
310
,759
00
00
00
00
310
,759
Jan-
121
6,30
00
00
00
00
01
6,30
0
$ in
dica
tes
as o
n la
st t
radi
ng d
ay o
f Jan
. 201
2.So
urce
: SE
BI.

151
FEBRUARY SEBI BULLETIN 2012
Table 9 : Capital Raised by Listed Companies from the Primary Market through QIPs
Year/MonthNSE BSE Total
No. of issues Amount (` crore)
No. of issues Amount (` crore)
No. of issues Amount (` crore)
1 2 3 4 5 6 7
2008-09 2 189 1 75 2 189
2009-10 61 42,484 62 42,729 62 42,729
2010-11 46 22,987 50 25,860 50 25,861
2011-12$ 7 1,035 8 1,043 8 1,043
Apr-11 0 0 0 0 0 0
May-11 1 55 1 55 1 55
Jun-11 1 513 1 513 1 513
Jul-11 2 356 2 356 2 356
Aug-11 0 0 1 8 1 8
Sep-11 0 0 0 0 0 0
Oct-11 1 40 1 40 1 40
Nov-11 0 0 0 0 0 0
Dec-11 1 68 1 68 1 68
Jan-12 1 3 1 3 1 3
$ indicates as on last trading day of Jan. 2012.Source : BSE and NSE.

152
FEBRUARY SEBI BULLETIN 2012
Table 10 : Preferential Allotments Listed at BSE and NSE
Year/ Month
BSE@ NSE@ Common# Total
No.of issues
Amount(` crore)
No.ofissues
Amount(` crore)
No.of issues
Amount (` crore)
No.of issues
Amount (` crore)
1 2 3 4 5 6 7 8 9
2010-11 83 1,393 156 12,072 134 17,046 373 30,511
2011-12$ 115 2,582 74 3,554 79 15,642 268 21,777
Apr-11 11 134 9 748 10 7,893 30 8,776
May-11 4 38 6 1,134 15 4,759 25 5,931
Jun-11 9 1,164 5 183 9 348 23 1,695
Jul-11 15 129 8 168 15 1,989 38 2,287
Aug-11 12 127 12 496 5 65 29 688
Sep-11 12 180 10 195 3 123 25 499
Oct-11 14 342 6 61 4 75 24 478
Nov-11 15 76 3 35 3 58 21 169
Dec-11 8 264 8 148 3 106 19 517
Jan-12 15 129 7 386 12 224 34 738
$ indicates as on last trading day of Jan. 2012.@ The issues are only listed at respective exchange.# The issues listed both BSE and NSE.Source: BSE and NSE.

153
FEBRUARY SEBI BULLETIN 2012
Table 11: Private Placement of Corporate Debt Reported to BSE and NSE
MonthNSE@ BSE@ Common# Total
No. of Issues
Amount(` crore)
No. of Issues
Amount(` crore)
No. of Issues
Amount (` crore)
No. of Issues
Amount (` crore)
1 2 3 4 5 6 7 8 9
2007-08 580 90,718 120 11,711 44 16,056 744 1,18,485
2008-09 699 1,24,810 285 17,045 57 31,426 1,041 1,73,281
2009-10 647 1,43,286 597 49,739 34 19,610 1,278 2,12,635
2010-11 774 1,53,370 591 52,591 39 12,825 1,404 2,18,785
2011-12$ 919 1,55,582 630 46,993 13 11,370 1,562 2,13,945
Apr-11 88 10,322 67 8,316 0 0 155 18,639
May-11 51 7,405 61 1,543 2 4,650 114 13,598
Jun-11 74 17,508 45 1,514 0 0 119 19,022
Jul-11 84 15,127 60 7,557 1 100 145 22,785
Aug-11 78 16,690 47 3,779 1 1,500 126 21,969
Sep-11 106 15,725 60 4,054 2 584 168 20,363
Oct-11 92 12,223 57 6,992 0 0 149 19,215
Nov-11 99 15,949 96 5,055 1 40 196 21,044
Dec-11 137 22,639 91 5,611 4 3,646 232 31,896
Jan-12 110 21,992 46 2,572 2 850 158 25,414
$ indicates as on last trading day of Jan. 2012.@ The issues are only listed at respective exchange.# The issues listed both BSE and NSE.Source: BSE and NSE.
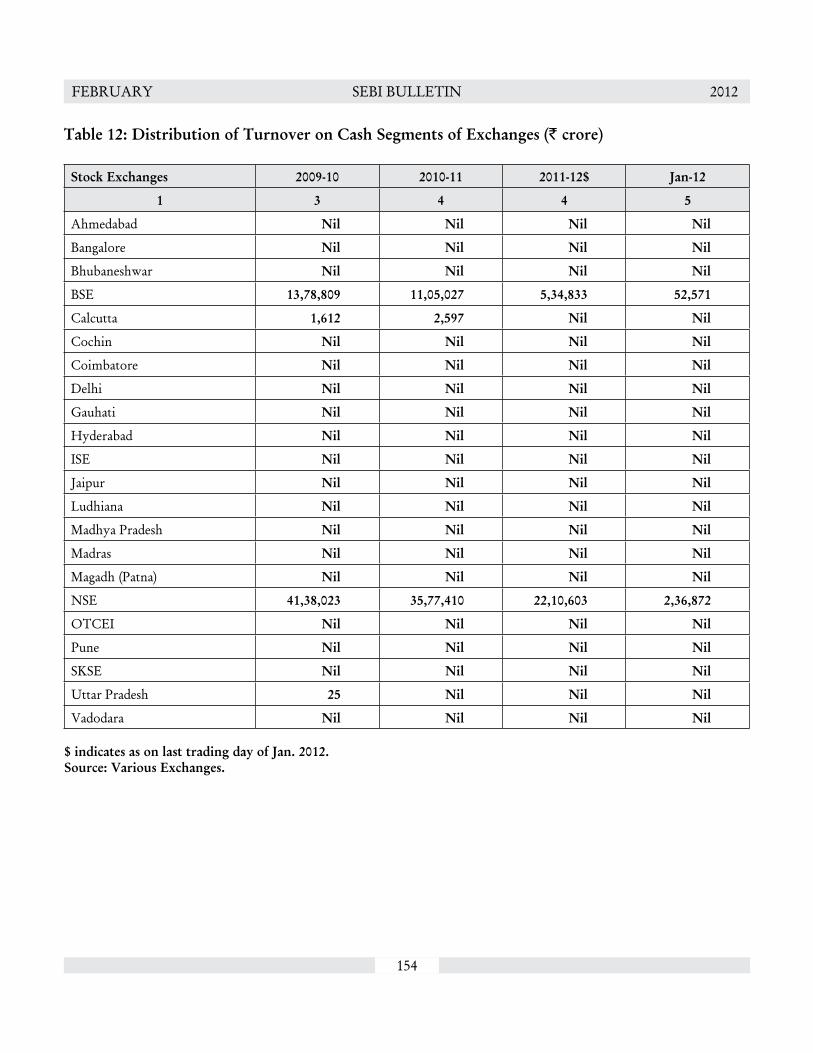
154
FEBRUARY SEBI BULLETIN 2012
Table 12: Distribution of Turnover on Cash Segments of Exchanges (` crore)
Stock Exchanges 2009-10 2010-11 2011-12$ Jan-12
1 3 4 4 5
Ahmedabad Nil Nil Nil Nil
Bangalore Nil Nil Nil Nil
Bhubaneshwar Nil Nil Nil Nil
BSE 13,78,809 11,05,027 5,34,833 52,571
Calcutta 1,612 2,597 Nil Nil
Cochin Nil Nil Nil Nil
Coimbatore Nil Nil Nil Nil
Delhi Nil Nil Nil Nil
Gauhati Nil Nil Nil Nil
Hyderabad Nil Nil Nil Nil
ISE Nil Nil Nil Nil
Jaipur Nil Nil Nil Nil
Ludhiana Nil Nil Nil Nil
Madhya Pradesh Nil Nil Nil Nil
Madras Nil Nil Nil Nil
Magadh (Patna) Nil Nil Nil Nil
NSE 41,38,023 35,77,410 22,10,603 2,36,872
OTCEI Nil Nil Nil Nil
Pune Nil Nil Nil Nil
SKSE Nil Nil Nil Nil
Uttar Pradesh 25 Nil Nil Nil
Vadodara Nil Nil Nil Nil
$ indicates as on last trading day of Jan. 2012.Source: Various Exchanges.

155
FEBRUARY SEBI BULLETIN 2012T
able
13:
Cas
h Se
gmen
t of
BSE
Mon
th/
Year
No.
of
Com
pani
es
Liste
d
No.
of
Com
pani
es
Perm
itted
No.
of
com
pani
es
trad
ed
No.
of
Trad
ing
Day
s
No.
of
Trad
es
(Lak
h)
Trad
ed
Qua
ntity
(L
akh)
Turn
over
(`
cror
e)Av
erag
e D
aily
Turn
over
(`
cror
e)
Aver
age
Trad
e Si
ze (`
)
Dem
at
Secu
rities
Tr
aded
(L
akh)
Dem
at
Turn
over
(` cr
ore)
Mar
ket
Capi
talis
atio
n (`
cror
e)
BSE
Sens
ex
Hig
hLo
wCl
ose
1 2
3 4
5 6
7 8
9 10
11
12
13
14
15
16
2008
-094,9
2966
3,194
243
5,408
7,39,6
0011
,00,07
44,5
2720
,342
7,39,2
8710
,99,87
130
,86,07
517
735.7
7697
.497
08.5
2009
-10
4,975
863,2
9724
46,0
5611
,36,51
313
,78,80
95,6
5122
,768
11,35
,750
13,78
,529
61,65
,619
1779
3.095
46.3
1752
7.8
2010
-115,0
6791
2,933
255
5,285
9,90,7
7711
,05,02
74,3
3320
,910
9,89,9
9911
,03,97
868
,39,08
421
108.6
1596
0.219
445.2
2011
-12$
5,115
942,9
3120
73,1
955,2
3,460
5,34,8
332,5
8416
,739
5,23,0
875,3
4,322
60,59
,347
1981
1.115
135.9
1719
3.6
Apr-1
15,0
6991
2,977
1832
762
,262
69,33
63,8
5221
,206
62,21
769
,284
69,08
,090
1981
1.118
976.2
1913
6.0
May
-115,0
7891
2,922
2233
653
,874
59,49
42,7
0417
,692
53,85
359
,459
67,31
,869
1925
3.917
786.1
1850
3.3
Jun-
115,0
8592
2,968
2233
557
,094
59,33
72,6
9717
,713
57,13
859
,300
67,30
,947
1887
3.417
314.4
1884
5.9
Jul-1
15,0
9692
2,976
2133
762
,968
59,55
52,8
3617
,668
62,98
759
,503
66,17
,273
1913
1.718
131.9
1819
7.2
Aug-1
15,0
8692
2,921
2133
156
,342
53,30
12,5
3816
,090
56,28
253
,261
60,61
,626
1844
0.115
765.5
1667
6.8
Sep-1
15,0
9292
2,851
2133
451
,750
54,36
02,5
8916
,295
51,65
054
,320
59,53
,887
1721
1.815
801.0
1645
3.8
Oct-
115,1
0293
2,934
1927
937
,421
43,51
52,2
9015
,611
37,38
443
,461
62,40
,155
1790
8.115
745.4
1770
5.0
Nov
-115,1
0594
2,832
2029
546
,388
43,87
22,1
9414
,861
46,37
143
,828
56,72
,255
1770
2.315
478.7
1612
3.5
Dec-1
15,1
1294
2,896
2126
940
,714
39,49
21,8
8114
,672
40,62
239
,396
53,48
,645
1770
3.115
135.9
1545
4.9
Jan-12
5,115
942,9
3122
352
54,64
852
,571
2,390
14,94
154
,584
52,50
960
,59,34
717
259.0
1535
8.017
193.6
$ in
dica
tes
as o
n la
st t
radi
ng d
ay o
f Jan
. 201
2.So
urce
: BSE
.

156
FEBRUARY SEBI BULLETIN 2012T
able
14:
Cas
h Se
gmen
t of
NSE
Mon
th/
Year
No.
of
Com
pani
es
List
ed
No.
of
Com
pani
es
Perm
itted
No.
of
Com
pani
es
Trad
ed
No.
of
Trad
ing
Day
s
No.
of
Trad
es
(Lak
h)
Trad
ed
Qua
ntity
(L
akh)
Turn
over
(`
cror
e)A
vera
ge
Dai
ly
Turn
over
(`
cror
e)
Ave
rage
Tr
ade
Size
(`)
Dem
at
Secu
ritie
s Tr
aded
(L
akh)
Dem
at
Turn
over
(`
cror
e)
Mar
ket
Cap
itali-
satio
n(`
cror
e)
S&P
CN
X N
ifty
Inde
x
Hig
hLo
wC
lose
1 2
3 4
5 6
7 8
9 10
11
12
13
14
15
16
2008
-09
1,43
237
1,29
124
313
,650
14,2
6,35
527
,52,
023
11,3
2520
,161
14,2
6,35
527
,52,
023
28,9
6,19
452
98.9
2252
.830
21.0
2009
-10
1,47
037
1,35
924
416
,816
22,1
5,53
041
,38,
023
16,9
5924
,608
22,1
5,53
041
,38,
023
60,0
9,17
353
29.6
2965
.752
49.1
2010
-11
1,57
461
1,45
025
515
,507
18,2
4,51
535
,77,
410
14,0
2923
,070
18,2
4,51
535
,77,
410
67,0
2,61
663
38.5
4786
.558
33.8
2011
-12$
1,64
171
1,52
020
711
,513
12,4
4,00
922
,10,
603
10,6
7919
,201
12,4
4,00
922
,10,
603
59,3
7,03
959
44.5
4531
.251
99.3
Apr
-11
1,57
861
1,45
318
1,07
31,
29,4
292,
28,3
4812
,686
21,2
731,
29,4
292,
28,3
4867
,53,
614
5944
.556
93.3
5749
.5
May
-11
1,58
561
1,46
322
1,15
11,
15,8
572,
33,8
7610
,631
20,3
211,
15,8
572,
33,8
7665
,69,
743
5775
.353
28.7
5560
.2
Jun-
111,
599
611,
474
221,
159
1,22
,299
2,22
,457
10,1
1219
,188
1,22
,299
2,22
,457
65,7
4,74
356
57.9
5195
.956
47.4
Jul-1
11,
606
601,
478
211,
158
1,22
,590
2,30
,003
10,9
5319
,865
1,22
,590
2,30
,003
64,6
2,23
857
40.4
5454
.054
82.0
Aug
-11
1,61
560
1,48
921
1,23
61,
33,1
102,
35,2
5311
,203
19,0
361,
33,1
102,
35,2
5359
,21,
684
5551
.947
20.0
5001
.0
Sep-
111,
622
601,
495
211,
226
1,32
,298
2,35
,270
11,2
0319
,191
1,32
,298
2,35
,270
58,2
0,33
451
69.3
4758
.949
43.3
Oct
-11
1,63
166
1,51
019
1,00
81,
01,2
051,
93,2
9310
,173
19,1
851,
01,2
051,
93,2
9361
,01,
891
5399
.747
28.3
5326
.3
Nov
-11
1,63
366
1,51
220
1,11
41,
23,8
042,
06,3
4410
,317
18,5
221,
23,8
042,
06,3
4455
,47,
723
5326
.546
39.1
4832
.1
Dec
-11
1,64
071
1,52
021
1,07
61,
15,1
151,
88,8
868,
995
17,5
621,
15,1
151,
88,8
8652
,32,
273
5099
.345
31.2
4624
.3
Jan-
121,
641
711,
520
221,
312
1,48
,303
2,36
,872
10,7
6718
,050
1,48
,303
2,36
,872
59,3
7,03
952
17.0
4588
.151
99.3
$ in
dica
tes
as o
n la
st t
radi
ng d
ay o
f Jan
. 201
2.So
urce
: NSE
.

157
FEBRUARY SEBI BULLETIN 2012T
able
15:
Tre
nds
in C
ash
Segm
ent
of B
SE d
urin
g Ja
nuar
y 20
12
Dat
e
No.
of
Com
pani
es
Tra
ded
No.
of
Tra
des
(Lak
h)
Tra
ded
Qua
ntit
y (L
akh)
Tur
nove
r (`
cro
re)
Ave
rage
T
rade
Si
ze (`
)
Dem
at
Secu
riti
es
Tra
ded
(Lak
h)
Dem
at
Tur
nove
r (`
cro
re)
Mar
ket
Cap
ital
i-sa
tion
(`
cro
re)
SEN
SEX
B
SE-1
00 I
ndex
Hig
hLo
wC
lose
Hig
hLo
wC
lose
1 2
3 4
5 6
7 8
9 10
11
12
13
14
15
2-Ja
n-12
2,77
610
.65
1,57
41,
367
12,8
391,
572
1,36
653
,51,
880
1554
2.9
1535
8.0
1551
7.9
7966
.478
63.2
7942
.8
3-Ja
n-12
2,84
614
.08
1,85
51,
850
13,1
421,
852
1,84
855
,03,
948
1597
0.3
1564
0.6
1593
9.4
8176
.979
93.9
8163
.3
4-Ja
n-12
2,82
816
.56
2,65
72,
184
13,1
872,
655
2,18
255
,14,
003
1600
4.7
1582
2.3
1588
2.6
8198
.381
12.7
8143
.2
5-Ja
n-12
2,82
214
.12
1,88
31,
949
13,8
001,
881
1,94
755
,11,
761
1598
0.2
1580
9.3
1585
7.1
8192
.981
12.0
8140
.5
6-Ja
n-12
2,83
014
.21
1,77
61,
968
13,8
511,
776
1,96
755
,06,
388
1600
1.3
1566
4.9
1586
7.7
8203
.380
38.7
8141
.6
7-Ja
n-12
2,29
82.
9646
436
612
,377
463
366
55,3
0,75
415
900.
315
835.
315
848.
881
55.6
8134
.081
38.8
9-Ja
n-12
2,80
815
.54
2,05
81,
986
12,7
822,
053
1,98
455
,44,
162
1587
1.5
1567
8.3
1581
4.7
8160
.780
59.3
8135
.6
10-Ja
n-12
2,90
618
.06
2,69
32,
555
14,1
502,
691
2,55
456
,55,
044
1618
1.0
1589
8.3
1616
5.1
8329
.681
69.9
8321
.1
11-Ja
n-12
2,91
719
.72,
875
2,62
113
,302
2,86
92,
618
56,8
1,38
016
244.
716
127.
816
175.
983
77.9
8313
.983
52.1
12-Ja
n-12
2,85
218
.41
2,37
82,
596
14,1
022,
377
2,59
456
,79,
898
1617
8.6
1596
2.6
1603
7.5
8384
.682
77.2
8321
.3
13-Ja
n-12
2,88
318
.92
2,97
72,
742
14,4
952,
977
2,74
057
,40,
194
1625
7.3
1604
9.8
1615
4.6
8437
.283
35.8
8384
.4
16-Ja
n-12
2,84
015
.57
3,17
02,
093
13,4
403,
170
2,09
157
,42,
419
1621
4.4
1603
7.6
1618
9.4
8409
.283
19.0
8400
.4
17-Ja
n-12
2,96
517
.62
2,84
12,
684
15,2
352,
841
2,68
358
,37,
842
1650
1.4
1627
0.9
1646
6.1
8570
.184
36.6
8551
.4
18-Ja
n-12
2,89
216
.72
2,82
82,
485
14,8
602,
824
2,48
257
,94,
831
1651
8.0
1638
4.5
1645
1.5
8581
.284
93.7
8523
.8
19-Ja
n-12
2,90
317
.04
2,41
62,
509
14,7
252,
413
2,50
658
,72,
875
1666
2.1
1657
2.1
1664
3.7
8648
.185
78.1
8641
.5
20-Ja
n-12
2,94
018
.42
2,75
52,
948
16,0
052,
755
2,94
658
,91,
508
1678
8.5
1661
1.7
1673
9.0
8721
.286
28.1
8698
.1
23-Ja
n-12
2,89
614
.62
2,22
22,
160
14,7
742,
221
2,15
958
,89,
992
1678
4.0
1665
9.3
1675
1.7
8733
.486
69.7
8700
.2
24-Ja
n-12
2,92
118
.63,
705
4,67
325
,124
3,70
34,
671
59,6
2,10
017
050.
316
770.
016
995.
888
65.3
8708
.788
41.0
25-Ja
n-12
2,95
418
.27
3,02
12,
795
15,2
983,
012
2,78
860
,16,
469
1713
0.2
1701
6.7
1707
7.2
8924
.288
58.3
8903
.4
27-Ja
n-12
2,98
517
.78
3,20
62,
757
15,5
053,
199
2,75
160
,69,
343
1725
9.0
1710
6.6
1723
4.0
8991
.589
18.4
8982
.1
30-Ja
n-12
2,90
916
.82
2,66
62,
475
14,7
152,
658
2,46
959
,56,
695
1713
8.0
1682
8.3
1686
3.3
8942
.787
66.4
8785
.2
31-Ja
n-12
2,93
117
.19
2,62
82,
807
16,3
262,
622
2,79
96,
059,
347
17,2
39.0
1696
5.6
1719
3.6
8991
.488
27.7
8970
.1
Sour
ce :
BSE
.

158
FEBRUARY SEBI BULLETIN 2012T
able
16:
Tre
nds
in C
ash
Segm
ent
of N
SE d
urin
g Ja
nuar
y 20
12
Dat
e
No.
of
Com
pani
es
Tra
ded
No.
of
Tra
des
(Lak
h)
Tra
ded
Qua
ntit
y (L
akh)
Tur
nove
r (`
cro
re)
Ave
rage
T
rade
Si
ze (`
)
Dem
at
Secu
riti
es
Tra
ded
(Lak
h)
Dem
at
Tur
nove
r (`
cro
re)
Mar
ket
Cap
ital
i- sa
tion
(`
cro
re)
S&P
CN
X N
ifty
Ind
ex
CN
X N
ifty
Jun
ior
Inde
x
Hig
hLo
wC
lose
Hig
hLo
wC
lose
1 2
3 4
5 6
7 8
9 10
11
12
13
14
15
2-Ja
n-12
1,49
537
4,22
45,
821
15,6
044,
224
5,82
152
,33,
643
4645
.95
4588
.05
4636
.75
8376
.30
8224
.15
8312
.10
3-Ja
n-12
1,50
952
5,22
18,
210
15,8
385,
221
8,21
053
,86,
252
4773
.10
4675
.80
4765
.30
8575
.30
8313
.35
8564
.55
4-Ja
n-12
1,48
859
5,69
79,
716
16,5
505,
697
9,71
653
,95,
911
4782
.85
4728
.85
4749
.65
8634
.15
8537
.05
8589
.15
5-Ja
n-12
1,49
854
5,23
99,
440
17,6
005,
239
9,44
053
,92,
716
4779
.80
4730
.15
4749
.95
8641
.35
8570
.40
8607
.80
6-Ja
n-12
1,49
155
5,44
18,
938
16,3
725,
441
8,93
853
,83,
615
4794
.90
4686
.85
4754
.10
8606
.90
8488
.70
8560
.50
7-Ja
n-12
1,33
88
905
1,09
513
,594
905
1,09
554
,06,
964
4759
.40
4743
.05
4746
.90
8600
.40
8560
.20
8593
.45
9-Ja
n-12
1,49
954
5,82
58,
376
15,3
915,
825
8,37
654
,21,
414
4758
.70
4695
.45
4742
.80
8641
.00
8523
.70
8626
.85
10-Ja
n-12
1,52
162
7,22
611
,011
17,8
327,
226
11,0
1155
,32,
206
4855
.90
4768
.25
4849
.55
8867
.00
8627
.70
8848
.15
11-Ja
n-12
1,52
668
7,98
311
,716
17,1
477,
983
11,7
1655
,59,
305
4877
.20
4841
.60
4860
.95
8969
.20
8848
.60
8947
.55
12-Ja
n-12
1,51
466
7,17
912
,347
18,7
327,
179
12,3
4755
,57,
120
4869
.20
4803
.90
4831
.25
9052
.35
8912
.80
9030
.55
13-Ja
n-12
1,53
167
8,36
312
,075
17,9
568,
363
12,0
7556
,15,
310
4898
.85
4834
.20
4866
.00
9141
.10
9030
.95
9101
.50
16-Ja
n-12
1,52
856
6,31
69,
499
16,9
416,
316
9,49
956
,17,
170
4880
.80
4827
.05
4873
.90
9143
.70
9023
.70
9138
.20
17-Ja
n-12
1,52
767
7,55
112
,180
18,3
137,
551
12,1
8057
,15,
946
4975
.55
4904
.00
4967
.30
9302
.50
9139
.25
9262
.10
18-Ja
n-12
1,52
067
7,62
912
,187
18,3
017,
629
12,1
8756
,72,
992
4980
.65
4931
.05
4955
.80
9319
.75
9164
.35
9192
.30
19-Ja
n-12
1,53
168
7,24
811
,634
17,1
567,
248
11,6
3457
,47,
970
5023
.80
4991
.40
5018
.40
9353
.05
9197
.30
9342
.70
20-Ja
n-12
1,51
673
8,23
913
,694
18,7
698,
239
13,6
9457
,69,
416
5064
.15
5004
.30
5048
.60
9454
.10
9336
.05
9414
.35
23-Ja
n-12
1,51
654
6,29
110
,155
18,9
656,
291
10,1
5557
,64,
375
5059
.55
5021
.35
5046
.25
9511
.30
9390
.60
9407
.70
24-Ja
n-12
1,53
367
8,74
914
,226
21,2
008,
749
14,2
2658
,37,
403
5141
.05
5049
.80
5127
.35
9636
.85
9408
.60
9610
.55
25-Ja
n-12
1,52
970
9,45
215
,295
21,7
739,
452
15,2
9558
,92,
988
5174
.15
5130
.25
5158
.30
9768
.75
9610
.70
9751
.00
27-Ja
n-12
1,52
774
8,37
613
,777
18,5
568,
376
13,7
7759
,44,
707
5217
.00
5162
.40
5204
.70
9848
.65
9718
.20
9811
.10
30-Ja
n-12
1,53
068
7,58
011
,784
17,2
837,
580
11,7
8458
,29,
390
5166
.15
5076
.70
5087
.30
9810
.05
9571
.35
9591
.75
31-Ja
n-12
1,52
267
7,56
913
,696
20,3
657,
569
13,6
9659
,37,
039
5215
.40
5120
.15
5199
.25
9828
.85
9592
.80
9812
.55
Sour
ce :
NSE
.

159
FEBRUARY SEBI BULLETIN 2012T
able
17:
Tur
nove
r an
d M
arke
t C
apit
alis
atio
n at
BSE
and
NSE
dur
ing
Janu
ary
2012
Dat
e
Turn
over
Mar
ket C
apita
lisat
ion
BSE
NSE
BSE
NSE
BSE
Sens
ex
BSE
100
Tota
lA#
B#S&
P CN
X N
ifty
CNX
Nift
y Ju
nior
Tota
lC#
D#
BSE
Sens
exBS
E 10
0 To
tal
E#F#
S&P
CNX
Nift
y
CNX
Nift
y Ju
nior
Tota
lG
#H
#
1 2
3 4
5 6
7 8
9 10
11
12
13
14
15
16
17
18
19
20
21
2-J
an-12
563
844
1367
.441
.262
3,591
911
5,821
61.7
15.7
12,71
,802
17,67
,705
53,51
,880
23.8
33.0
1,408
,848
246,9
07
5,233
,643
26.92
4.72
3-Jan
-1268
51,0
2118
50.5
37.0
555,0
211,1
248,2
1061
.213
.713
,06,34
218
,16,78
155
,03,94
823
.733
.01,4
47,89
4 25
4,405
5,3
86,25
226
.884.7
24-J
an-12
691
1,092
2183
.731
.650
5,661
1,293
9,716
58.3
13.3
13,01
,693
18,12
,315
55,14
,003
23.6
32.9
1,443
,140
255,1
37
5,395
,911
26.75
4.73
5-Jan
-1274
71,1
0719
48.5
38.3
575,8
741,1
339,4
4062
.212
.012
,99,59
818
,11,69
955
,11,76
123
.632
.91,4
43,23
2 25
5,691
5,3
92,71
626
.764.7
46-J
an-12
615
1,032
1968
.331
.352
5,235
1,279
8,938
58.6
14.3
13,00
,471
18,11
,954
55,06
,388
23.6
32.9
1,444
,498
254,2
85
5,383
,615
26.83
4.72
7-Jan
-1264
115
366.4
17.5
3141
592
1,095
37.9
8.412
,98,91
918
,11,32
755
,30,75
423
.532
.81,4
42,31
6 25
5,265
5,4
06,96
426
.684.7
29-J
an-12
483
778
1986
.324
.339
4,548
925
8,376
54.3
11.0
13,09
,676
18,19
,063
55,44
,162
23.6
32.8
1,441
,282
256,2
63
5,421
,414
26.58
4.73
10-Ja
n-12
718
1,190
2555
.428
.147
6,222
1,383
11,01
156
.512
.613
,38,69
218
,60,53
956
,55,04
423
.732
.91,4
73,71
2 26
2,836
5,5
32,20
626
.644.7
511
-Jan-
1267
31,1
9826
20.6
25.7
466,3
641,7
3311
,716
54.3
14.8
13,39
,583
18,67
,465
56,81
,380
23.6
32.9
1,477
,184
265,7
90
5,559
,305
26.57
4.78
12-Ja
n-12
850
1,345
2596
.232
.752
7,271
1,584
12,34
758
.912
.813
,28,12
618
,60,58
756
,79,89
823
.432
.81,4
68,16
3 26
8,255
5,5
57,12
026
.424.8
313
-Jan-
1286
51,5
3327
42.5
31.5
567,1
181,6
5312
,075
58.9
13.7
13,37
,825
18,74
,684
57,40
,194
23.3
32.7
1,478
,717
270,3
62
5,615
,310
26.33
4.81
16-Ja
n-12
606
1,023
2092
.628
.949
5,298
1,217
9,499
55.8
12.8
13,40
,702
18,78
,273
57,42
,419
23.3
32.7
1,481
,116
271,4
52
5,617
,170
26.37
4.83
17-Ja
n-12
793
1,323
2684
.429
.549
7,171
1,574
12,18
058
.912
.913
,63,61
519
,12,03
258
,37,84
223
.432
.81,5
09,50
4 27
5,132
5,7
15,94
626
.414.8
118
-Jan-
1282
61,3
2124
84.5
33.3
537,4
251,4
1012
,187
60.9
11.6
13,62
,408
19,05
,857
57,94
,831
23.5
32.9
1,506
,008
273,0
60
5,672
,992
26.55
4.81
19-Ja
n-12
710
1,289
2509
.128
.351
6,634
1,635
11,63
457
.014
.113
,78,33
019
,32,18
058
,72,87
523
.532
.91,5
25,02
6 27
7,527
5,7
47,97
026
.534.8
320
-Jan-
1287
21,6
1929
48.2
29.6
558,1
201,9
7913
,694
59.3
14.5
13,86
,220
19,44
,840
58,91
,508
23.5
33.0
1,534
,206
279,6
55
5,769
,416
26.59
4.85
23-Ja
n-12
779
1,275
2159
.936
.159
5,934
1,500
10,15
558
.414
.813
,87,27
319
,45,29
458
,89,99
223
.633
.01,5
33,48
9 27
9,458
5,7
64,37
526
.604.8
524
-Jan-
121,0
531,8
2946
73.1
22.5
398,1
722,4
1014
,226
57.4
16.9
14,07
,483
19,76
,787
59,62
,100
23.6
33.2
1,558
,134
285,4
84
5,837
,403
26.69
4.89
25-Ja
n-12
687
1,522
2795
.024
.654
8,156
2,726
15,29
553
.317
.814
,14,22
519
,90,73
760
,16,46
923
.533
.11,5
67,54
2 28
9,656
5,8
92,98
826
.604.9
227
-Jan-
1278
11,5
3327
56.9
28.3
567,8
812,1
3613
,777
57.2
15.5
14,27
,210
20,08
,339
60,69
,343
23.5
33.1
1,581
,648
291,4
41
5,944
,707
26.61
4.90
30-Ja
n-12
611
1,246
2475
.024
.750
6,181
2,063
11,78
452
.517
.513
,96,51
219
,64,29
759
,56,69
523
.433
.01,5
45,96
2 28
4,926
5,8
29,39
026
.524.8
931
-Jan-
1289
11,5
6928
06.5
31.8
568,0
761,9
4713
,696
59.0
14.2
14,23
,862
20,05
,645
60,59
,347
23.5
33.1
1,579
,993
291,4
84
5,937
,039
26.61
4.91
Not
e: B
SE S
ense
x, B
SE 1
00, S
&P
CN
X N
ifty
& C
NX
Nif
ty J
unio
r ha
ve fr
ee fl
oat
mar
ket
capi
tlis
atio
n.A
# =
per
cent
age
shar
e of
Sen
sex
secu
riti
es in
tot
al B
SE t
urno
ver.
B#
= p
erce
ntag
e sh
are
of B
SE-1
00 I
ndex
sec
urit
ies
in t
otal
BSE
tur
nove
r.C
# =
per
cent
age
shar
e of
S&
P C
NX
Nif
ty s
ecur
itie
s in
tot
al N
SE t
urno
ver.
D#
= p
erce
ntag
e sh
are
of C
NX
Nif
ty J
unio
r se
curi
ties
in t
otal
NSE
tur
nove
r .
E# =
per
cent
age
shar
e of
Sen
sex
secu
riri
ties
in t
otal
BSE
Mar
ket
Cap
ital
isat
ion.
F# =
per
cent
age
shar
e of
BSE
-100
Ind
ex s
ecur
itie
s in
tot
al B
SE M
arke
t C
apit
alis
atio
n.G
# =
per
cent
age
shar
e of
S&
P C
NX
Nif
ty s
ecur
itie
s in
tot
al N
SE M
arke
t C
apit
alis
atio
n.H
# =
per
cent
age
shar
e of
CN
X N
ifty
Jun
ior
secu
riti
es in
tot
al N
SE M
arke
t C
apit
alis
atio
n.So
urce
: BSE
and
NSE
.

160
FEBRUARY SEBI BULLETIN 2012
Table 18: City-wise Distribution of Turnover on Cash Segments of BSE and NSE(Percentage share in Turnover)
Sl. No City
BSE NSE2008-09 2009-10 2010-11 Jan-12 2008-09 2009-10 2010-11 Jan-12
1 2 3 4 5 6 7 8 9 10
1 Ahmedabad 7.3 9.9 9.4 9.2 5.3 5.6 6.2 6.0
2 Bangalore 0.3 0.4 0.4 0.3 0.6 0.6 0.6 0.5
3 Baroda 2.4 2.1 2.1 0.0 0.7 0.6 0.5 0.4
4 Bhubaneshwar 0.0 0.0 0.0 0.0 0.0 0.0 0.0 0.0
5 Chennai 0.4 0.3 0.4 0.3 2.0 1.6 1.6 8.7
6 Cochin 0.0 0.0 0.0 0.0 0.8 1.7 1.7 1.4
7 Coimbatore 0.1 0.0 0.0 0.1 0.3 0.3 0.3 1.8
8 Delhi 11.4 12.8 12.8 10.1 15.0 12.9 10.8 0.2
9 Guwahati 0.0 0.0 0.0 0.0 0.0 0.0 0.0 8.0
10 Hyderabad 0.5 0.5 0.5 0.3 1.7 1.8 1.6 0.0
11 Indore 0.5 0.5 0.6 0.4 0.5 0.6 0.6 1.4
12 Jaipur 1.1 1.1 1.0 1.0 0.6 0.5 0.5 0.5
13 Kanpur 0.4 0.6 0.7 0.7 0.1 0.1 0.1 0.3
14 Kolkata 1.7 1.6 2.0 6.2 9.2 7.0 7.5 0.1
15 Ludhiana 0.2 0.3 0.2 0.1 0.2 0.1 0.1 0.1
16 Mangalore 0.0 0.0 0.0 0.0 0.0 0.0 0.0 0.0
17 Mumbai 38.6 36.0 36.3 36.3 55.9 57.5 58.6 60.0
18 Patna 0.1 0.1 0.1 0.1 0.0 0.0 0.2 0.0
19 Pune 0.6 0.7 0.7 0.6 0.2 0.2 0.0 0.2
20 Rajkot 4.8 5.1 4.8 5.4 1.3 1.4 1.6 1.2
21 Others 29.7 27.9 28.0 28.9 5.7 7.4 7.5 9.0
Total 100.0 100.0 100.0 100.0 100.0 100.0 100.0 100.0
Source: BSE and NSE.
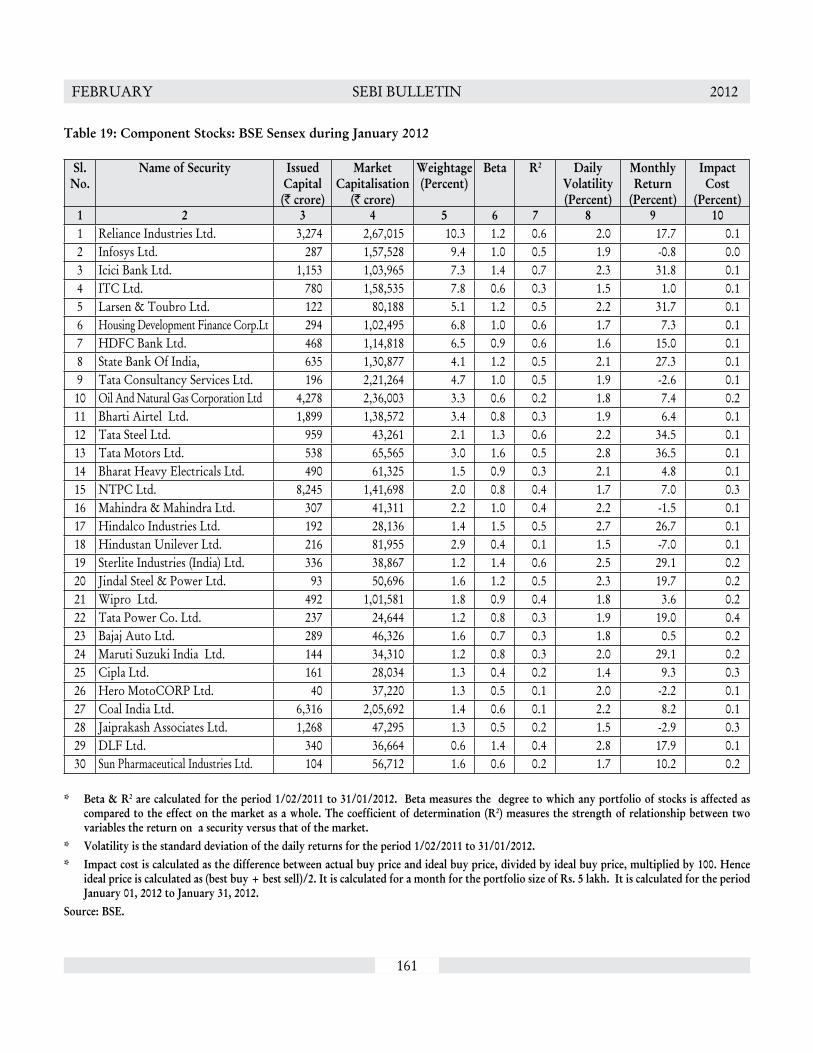
161
FEBRUARY SEBI BULLETIN 2012
Table 19: Component Stocks: BSE Sensex during January 2012
Sl. No.
Name of Security Issued Capital (` crore)
Market Capitalisation
(` crore)
Weightage (Percent)
Beta R2 Daily Volatility (Percent)
Monthly Return
(Percent)
Impact Cost
(Percent) 1 2 3 4 5 6 7 8 9 10 1 Reliance Industries Ltd. 3,274 2,67,015 10.3 1.2 0.6 2.0 17.7 0.12 Infosys Ltd. 287 1,57,528 9.4 1.0 0.5 1.9 -0.8 0.03 Icici Bank Ltd. 1,153 1,03,965 7.3 1.4 0.7 2.3 31.8 0.14 ITC Ltd. 780 1,58,535 7.8 0.6 0.3 1.5 1.0 0.15 Larsen & Toubro Ltd. 122 80,188 5.1 1.2 0.5 2.2 31.7 0.16 Housing Development Finance Corp.Lt 294 1,02,495 6.8 1.0 0.6 1.7 7.3 0.17 HDFC Bank Ltd. 468 1,14,818 6.5 0.9 0.6 1.6 15.0 0.18 State Bank Of India, 635 1,30,877 4.1 1.2 0.5 2.1 27.3 0.19 Tata Consultancy Services Ltd. 196 2,21,264 4.7 1.0 0.5 1.9 -2.6 0.110 Oil And Natural Gas Corporation Ltd 4,278 2,36,003 3.3 0.6 0.2 1.8 7.4 0.211 Bharti Airtel Ltd. 1,899 1,38,572 3.4 0.8 0.3 1.9 6.4 0.112 Tata Steel Ltd. 959 43,261 2.1 1.3 0.6 2.2 34.5 0.113 Tata Motors Ltd. 538 65,565 3.0 1.6 0.5 2.8 36.5 0.114 Bharat Heavy Electricals Ltd. 490 61,325 1.5 0.9 0.3 2.1 4.8 0.115 NTPC Ltd. 8,245 1,41,698 2.0 0.8 0.4 1.7 7.0 0.316 Mahindra & Mahindra Ltd. 307 41,311 2.2 1.0 0.4 2.2 -1.5 0.117 Hindalco Industries Ltd. 192 28,136 1.4 1.5 0.5 2.7 26.7 0.118 Hindustan Unilever Ltd. 216 81,955 2.9 0.4 0.1 1.5 -7.0 0.119 Sterlite Industries (India) Ltd. 336 38,867 1.2 1.4 0.6 2.5 29.1 0.220 Jindal Steel & Power Ltd. 93 50,696 1.6 1.2 0.5 2.3 19.7 0.221 Wipro Ltd. 492 1,01,581 1.8 0.9 0.4 1.8 3.6 0.222 Tata Power Co. Ltd. 237 24,644 1.2 0.8 0.3 1.9 19.0 0.423 Bajaj Auto Ltd. 289 46,326 1.6 0.7 0.3 1.8 0.5 0.224 Maruti Suzuki India Ltd. 144 34,310 1.2 0.8 0.3 2.0 29.1 0.225 Cipla Ltd. 161 28,034 1.3 0.4 0.2 1.4 9.3 0.326 Hero MotoCORP Ltd. 40 37,220 1.3 0.5 0.1 2.0 -2.2 0.127 Coal India Ltd. 6,316 2,05,692 1.4 0.6 0.1 2.2 8.2 0.128 Jaiprakash Associates Ltd. 1,268 47,295 1.3 0.5 0.2 1.5 -2.9 0.329 DLF Ltd. 340 36,664 0.6 1.4 0.4 2.8 17.9 0.130 Sun Pharmaceutical Industries Ltd. 104 56,712 1.6 0.6 0.2 1.7 10.2 0.2
* Beta & R2 are calculated for the period 1/02/2011 to 31/01/2012. Beta measures the degree to which any portfolio of stocks is affected as compared to the effect on the market as a whole. The coefficient of determination (R2) measures the strength of relationship between two variables the return on a security versus that of the market.
* Volatility is the standard deviation of the daily returns for the period 1/02/2011 to 31/01/2012.* Impact cost is calculated as the difference between actual buy price and ideal buy price, divided by ideal buy price, multiplied by 100. Hence
ideal price is calculated as (best buy + best sell)/2. It is calculated for a month for the portfolio size of Rs. 5 lakh. It is calculated for the period January 01, 2012 to January 31, 2012.
Source: BSE.
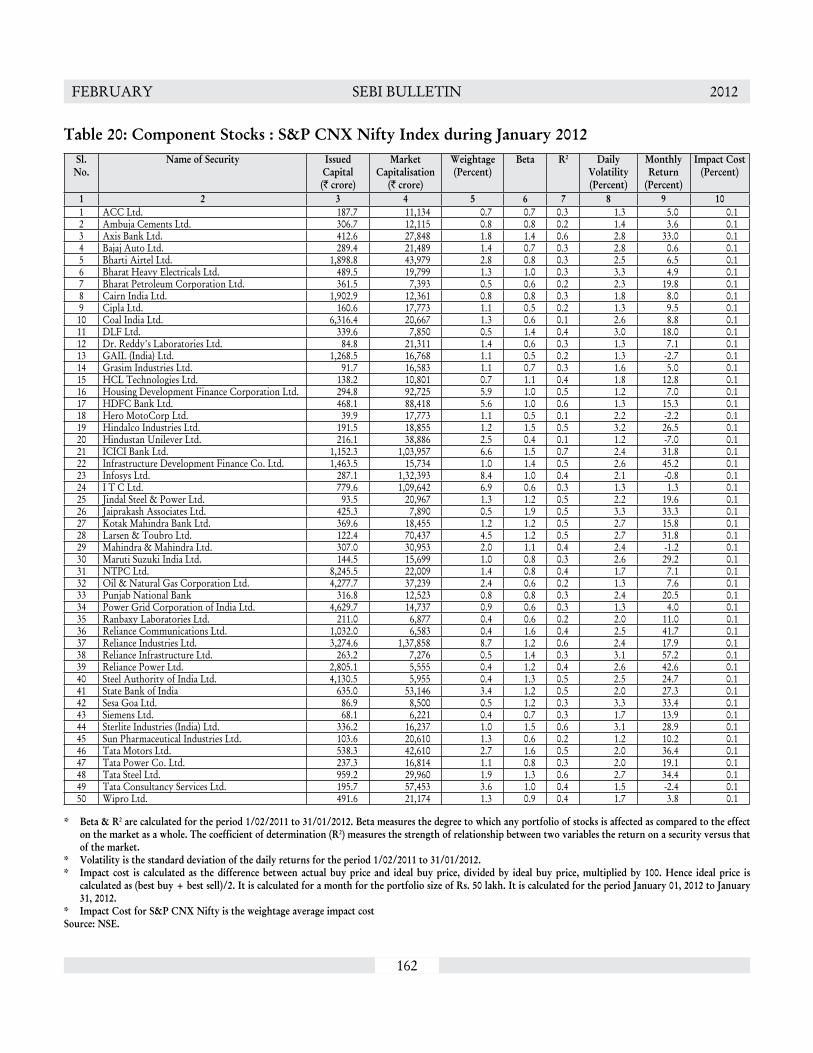
162
FEBRUARY SEBI BULLETIN 2012
Table 20: Component Stocks : S&P CNX Nifty Index during January 2012Sl.
No.Name of Security Issued
Capital (` crore)
Market Capitalisation
(` crore)
Weightage (Percent)
Beta R2 Daily Volatility (Percent)
Monthly Return
(Percent)
Impact Cost (Percent)
1 2 3 4 5 6 7 8 9 10 1 ACC Ltd. 187.7 11,134 0.7 0.7 0.3 1.3 5.0 0.1 2 Ambuja Cements Ltd. 306.7 12,115 0.8 0.8 0.2 1.4 3.6 0.1 3 Axis Bank Ltd. 412.6 27,848 1.8 1.4 0.6 2.8 33.0 0.1 4 Bajaj Auto Ltd. 289.4 21,489 1.4 0.7 0.3 2.8 0.6 0.1 5 Bharti Airtel Ltd. 1,898.8 43,979 2.8 0.8 0.3 2.5 6.5 0.1 6 Bharat Heavy Electricals Ltd. 489.5 19,799 1.3 1.0 0.3 3.3 4.9 0.1 7 Bharat Petroleum Corporation Ltd. 361.5 7,393 0.5 0.6 0.2 2.3 19.8 0.1 8 Cairn India Ltd. 1,902.9 12,361 0.8 0.8 0.3 1.8 8.0 0.1 9 Cipla Ltd. 160.6 17,773 1.1 0.5 0.2 1.3 9.5 0.1 10 Coal India Ltd. 6,316.4 20,667 1.3 0.6 0.1 2.6 8.8 0.1 11 DLF Ltd. 339.6 7,850 0.5 1.4 0.4 3.0 18.0 0.1 12 Dr. Reddy's Laboratories Ltd. 84.8 21,311 1.4 0.6 0.3 1.3 7.1 0.1 13 GAIL (India) Ltd. 1,268.5 16,768 1.1 0.5 0.2 1.3 -2.7 0.1 14 Grasim Industries Ltd. 91.7 16,583 1.1 0.7 0.3 1.6 5.0 0.1 15 HCL Technologies Ltd. 138.2 10,801 0.7 1.1 0.4 1.8 12.8 0.1 16 Housing Development Finance Corporation Ltd. 294.8 92,725 5.9 1.0 0.5 1.2 7.0 0.1 17 HDFC Bank Ltd. 468.1 88,418 5.6 1.0 0.6 1.3 15.3 0.1 18 Hero MotoCorp Ltd. 39.9 17,773 1.1 0.5 0.1 2.2 -2.2 0.1 19 Hindalco Industries Ltd. 191.5 18,855 1.2 1.5 0.5 3.2 26.5 0.1 20 Hindustan Unilever Ltd. 216.1 38,886 2.5 0.4 0.1 1.2 -7.0 0.1 21 ICICI Bank Ltd. 1,152.3 1,03,957 6.6 1.5 0.7 2.4 31.8 0.1 22 Infrastructure Development Finance Co. Ltd. 1,463.5 15,734 1.0 1.4 0.5 2.6 45.2 0.1 23 Infosys Ltd. 287.1 1,32,393 8.4 1.0 0.4 2.1 -0.8 0.1 24 I T C Ltd. 779.6 1,09,642 6.9 0.6 0.3 1.3 1.3 0.1 25 Jindal Steel & Power Ltd. 93.5 20,967 1.3 1.2 0.5 2.2 19.6 0.1 26 Jaiprakash Associates Ltd. 425.3 7,890 0.5 1.9 0.5 3.3 33.3 0.1 27 Kotak Mahindra Bank Ltd. 369.6 18,455 1.2 1.2 0.5 2.7 15.8 0.1 28 Larsen & Toubro Ltd. 122.4 70,437 4.5 1.2 0.5 2.7 31.8 0.1 29 Mahindra & Mahindra Ltd. 307.0 30,953 2.0 1.1 0.4 2.4 -1.2 0.1 30 Maruti Suzuki India Ltd. 144.5 15,699 1.0 0.8 0.3 2.6 29.2 0.1 31 NTPC Ltd. 8,245.5 22,009 1.4 0.8 0.4 1.7 7.1 0.1 32 Oil & Natural Gas Corporation Ltd. 4,277.7 37,239 2.4 0.6 0.2 1.3 7.6 0.1 33 Punjab National Bank 316.8 12,523 0.8 0.8 0.3 2.4 20.5 0.1 34 Power Grid Corporation of India Ltd. 4,629.7 14,737 0.9 0.6 0.3 1.3 4.0 0.1 35 Ranbaxy Laboratories Ltd. 211.0 6,877 0.4 0.6 0.2 2.0 11.0 0.1 36 Reliance Communications Ltd. 1,032.0 6,583 0.4 1.6 0.4 2.5 41.7 0.1 37 Reliance Industries Ltd. 3,274.6 1,37,858 8.7 1.2 0.6 2.4 17.9 0.1 38 Reliance Infrastructure Ltd. 263.2 7,276 0.5 1.4 0.3 3.1 57.2 0.1 39 Reliance Power Ltd. 2,805.1 5,555 0.4 1.2 0.4 2.6 42.6 0.1 40 Steel Authority of India Ltd. 4,130.5 5,955 0.4 1.3 0.5 2.5 24.7 0.1 41 State Bank of India 635.0 53,146 3.4 1.2 0.5 2.0 27.3 0.1 42 Sesa Goa Ltd. 86.9 8,500 0.5 1.2 0.3 3.3 33.4 0.1 43 Siemens Ltd. 68.1 6,221 0.4 0.7 0.3 1.7 13.9 0.1 44 Sterlite Industries (India) Ltd. 336.2 16,237 1.0 1.5 0.6 3.1 28.9 0.1 45 Sun Pharmaceutical Industries Ltd. 103.6 20,610 1.3 0.6 0.2 1.2 10.2 0.1 46 Tata Motors Ltd. 538.3 42,610 2.7 1.6 0.5 2.0 36.4 0.1 47 Tata Power Co. Ltd. 237.3 16,814 1.1 0.8 0.3 2.0 19.1 0.1 48 Tata Steel Ltd. 959.2 29,960 1.9 1.3 0.6 2.7 34.4 0.1 49 Tata Consultancy Services Ltd. 195.7 57,453 3.6 1.0 0.4 1.5 -2.4 0.1 50 Wipro Ltd. 491.6 21,174 1.3 0.9 0.4 1.7 3.8 0.1
* Beta & R2 are calculated for the period 1/02/2011 to 31/01/2012. Beta measures the degree to which any portfolio of stocks is affected as compared to the effect on the market as a whole. The coefficient of determination (R2) measures the strength of relationship between two variables the return on a security versus that of the market.
* Volatility is the standard deviation of the daily returns for the period 1/02/2011 to 31/01/2012.* Impact cost is calculated as the difference between actual buy price and ideal buy price, divided by ideal buy price, multiplied by 100. Hence ideal price is
calculated as (best buy + best sell)/2. It is calculated for a month for the portfolio size of Rs. 50 lakh. It is calculated for the period January 01, 2012 to January 31, 2012.
* Impact Cost for S&P CNX Nifty is the weightage average impact costSource: NSE.

163
FEBRUARY SEBI BULLETIN 2012
Table 21: Advances/Declines in Cash Segment of BSE and NSE (No. of Securities)
Month/DateBSE NSE
Advances Declines Advance / Decline Ratio
Advances Declines Advance / Decline Ratio
1 2 3 4 5 6 7
Aug-10 1,838 1,391 1.3 802 593 1.4
Sep-10 1,918 1,314 1.5 937 478 2.0
Oct-10 1,778 1,452 1.2 846 574 1.5
Nov-10 1,252 2,018 0.6 483 962 0.5
Dec-10 442 2,836 0.2 143 1,304 0.1
Jan-11 946 2,323 0.4 347 1,115 0.3
Feb-11 420 2,844 0.1 96 1,371 0.1
Mar-11 1,168 2,097 0.6 547 927 0.6
Apr-11 2,671 613 4.4 1,355 129 10.5
May-11 811 2,475 0.3 242 1,245 0.2
Jun-11 1,313 1,975 0.7 550 946 0.6
Jul-11 1,775 1,524 1.2 872 637 1.4
Aug-11 610 2,699 0.2 175 1,339 0.1
Sep-11 1,265 2,042 0.6 544 980 0.6
Oct-11 975 2,332 0.4 405 1,125 0.4
Nov-11 937 2,385 0.4 390 1,152 0.3
Dec-11 522 2,802 0.2 140 1,405 0.1
Jan-12 2,301 1,021 2.3 1,195 359 3.3
Note: Advance/Decline is calculated based on the average price methodology.Source: BSE and NSE.

164
FEBRUARY SEBI BULLETIN 2012
Table 22: Trading Frequency in Cash Segment of BSE and NSE
Month/ Year
BSE NSENo. of
Companies Listed
No. of companies
Traded
Percent of Traded to
Listed
No. of Companies
Listed
No. of companies
Traded
Percent of Traded to
Listed1 2 3 4 5 6 7
Aug-10 4,996 3,010 60.2 1,504 1,389 92.4
Sep-10 4,997 3,055 61.1 1,512 1,395 92.3
Oct-10 5,019 3,076 61.3 1,530 1,415 92.5
Nov-10 5,022 2,992 59.6 1,440 1,419 98.5
Dec-10 5,034 3,048 60.5 1,456 1,432 98.4
Jan-11 5,047 2,984 59.1 1,462 1,440 98.5
Feb-11 5,054 2,913 57.6 1,470 1,444 98.2
Mar-11 5,067 2,933 57.9 1,484 1,450 97.7
Apr-11 5,069 2,977 58.7 1,578 1,453 92.1
May-11 5,078 2,924 57.6 1,585 1,463 92.3
Jun-11 5,085 2,968 58.4 1,599 1,474 92.2
Jul-11 5,096 2,976 58.4 1,606 1,478 92.0
Aug-11 5,086 2,921 57.4 1,615 1,489 92.2
Sep-11 5,092 2,851 56.0 1,622 1,495 92.2
Oct-11 5,102 2,934 57.5 1,631 1,510 92.6
Nov-11 5,105 2,832 55.5 1,633 1,512 92.6
Dec-11 5,112 2,896 56.7 1,557 1,520 97.6
Jan-12 5,115 2,931 57.3 1,557 1,520 97.6
Source: BSE and NSE.

165
FEBRUARY SEBI BULLETIN 2012
Table 23: Volatility* of Major Indices (Percent)
Month/Year BSE Sensex BSE 100 Index BSE 500 S&P CNX Nifty
CNX Nifty Junior
S&P CNX 500
1 2 3 4 5 6 7
2007-08 1.9 2.0 2.0 2.0 2.4 2.0
2008-09 2.8 2.7 2.6 2.7 2.8 2.5
2009-10 1.9 1.8 1.8 1.9 2.0 1.8
2010-11 1.1 1.1 1.1 1.1 1.1 1.0
2011-12$ 1.3 1.2 1.2 1.3 1.2 1.2
Apr-11 1.1 1.0 1.0 1.0 0.9 0.9
May-11 1.1 1.1 1.0 1.1 1.1 1.1
Jun-11 1.0 0.9 0.9 1.0 0.9 0.9
Jul-11 1.0 0.9 0.9 1.0 1.0 0.9
Aug-11 1.5 1.5 1.4 1.2 1.0 1.1
Sep-11 1.6 1.5 1.4 1.6 1.4 1.4
Oct-11 1.6 1.5 1.3 1.6 1.2 1.4
Nov-11 1.3 1.3 1.2 1.3 1.2 1.2
Jan-12 1.1 1.1 1.1 1.1 1.2 1.1
$ indicates as on last trading day of Jan. 2012.* Volatility is calculated as the standard deviation of the natural log of daily returns in indices for the respective period.Source: BSE and NSE.

166
FEBRUARY SEBI BULLETIN 2012
Table 24: Percentage Share of Top ‘N’ Securities/Members in Turnover in Cash Segment(Percent)
Month/Year BSE NSETop 5 10 25 50 100 5 10 25 50 100
1 2 3 4 5 6 7 8 9 10 11 Securities
2008-09 18.5 29.6 49.0 66.0 79.6 20.5 32.6 56.4 74.7 87.7
2009-10 15.3 22.2 35.3 47.8 62.4 13.7 23.0 41.0 58.5 74.4
2010-11 10.2 15.1 25.9 37.3 51.5 15.3 23.0 38.7 53.6 68.9
2011-12$ 14.9 25.0 40.8 55.4 69.6 17.9 29.4 47.7 64.5 80.6
Apr-11 22.5 27.9 39.9 52.2 67.0 17.4 25.6 42.5 57.6 73.2
May-11 14.1 22.0 35.9 50.9 66.3 18.3 27.6 45.0 60.8 76.9
Jun-11 13.9 23.2 37.4 51.1 66.2 15.6 25.3 43.5 59.2 75.7
Jul-11 20.3 28.3 41.9 55.3 71.3 13.3 21.9 39.5 55.9 73.6
Aug-11 14.8 23.0 37.6 51.7 66.8 16.4 27.2 46.0 62.1 78.2
Sep-11 16.1 24.3 40.9 56.0 70.5 18.5 28.2 46.9 63.3 79.5
Oct-11 17.1 26.5 42.9 57.3 72.2 20.0 31.4 50.5 65.6 81.1
Nov-11 17.5 25.6 39.7 54.2 69.7 20.4 31.6 49.4 65.4 81.2
Dec-11 19.6 32.4 48.7 62.7 75.5 21.6 33.3 51.6 67.6 83.0
Jan-12 14.9 25.0 40.8 55.4 69.6 17.9 29.4 47.7 64.5 80.6
Members2008-09 14.3 21.7 38.2 55.8 73.3 13.6 23.6 43.6 61.2 75.4
2009-10 13.3 21.1 37.3 53.3 71.5 14.9 24.0 41.8 57.8 72.6
2010-11 13.3 21.6 36.6 51.9 70.2 14.3 23.8 42.9 58.6 73.0
2011-12$ 18.5 27.5 42.4 57.6 74.4 15.6 26.2 46.8 63.6 78.3
Apr-11 25.5 33.7 47.0 60.2 75.3 14.6 24.5 44.8 60.9 75.7
May-11 15.3 24.0 39.0 54.8 72.4 13.7 24.8 45.9 61.5 76.5
Jun-11 16.0 24.4 40.5 55.7 72.7 14.2 24.9 45.2 61.2 76.1
Jul-11 16.0 23.6 39.2 54.4 72.0 14.8 24.7 44.6 60.5 75.6
Aug-11 15.1 22.9 38.8 54.7 72.0 15.2 26.1 46.8 63.3 77.8
Sep-11 15.4 25.6 40.2 55.3 72.6 14.2 24.5 45.7 62.6 77.5
Oct-11 16.3 24.9 39.9 55.5 72.8 14.4 25.5 46.5 62.4 77.4
Nov-11 16.9 25.1 40.7 56.5 72.5 15.4 26.6 48.0 63.8 78.3
Dec-11 17.5 26.5 42.5 57.5 73.7 16.7 27.6 48.3 64.3 78.8
Jan-12 18.5 27.5 42.4 57.6 74.4 15.6 26.2 46.8 63.6 78.3
$ indicates as on last trading day of Jan. 2012.Source: BSE and NSE.
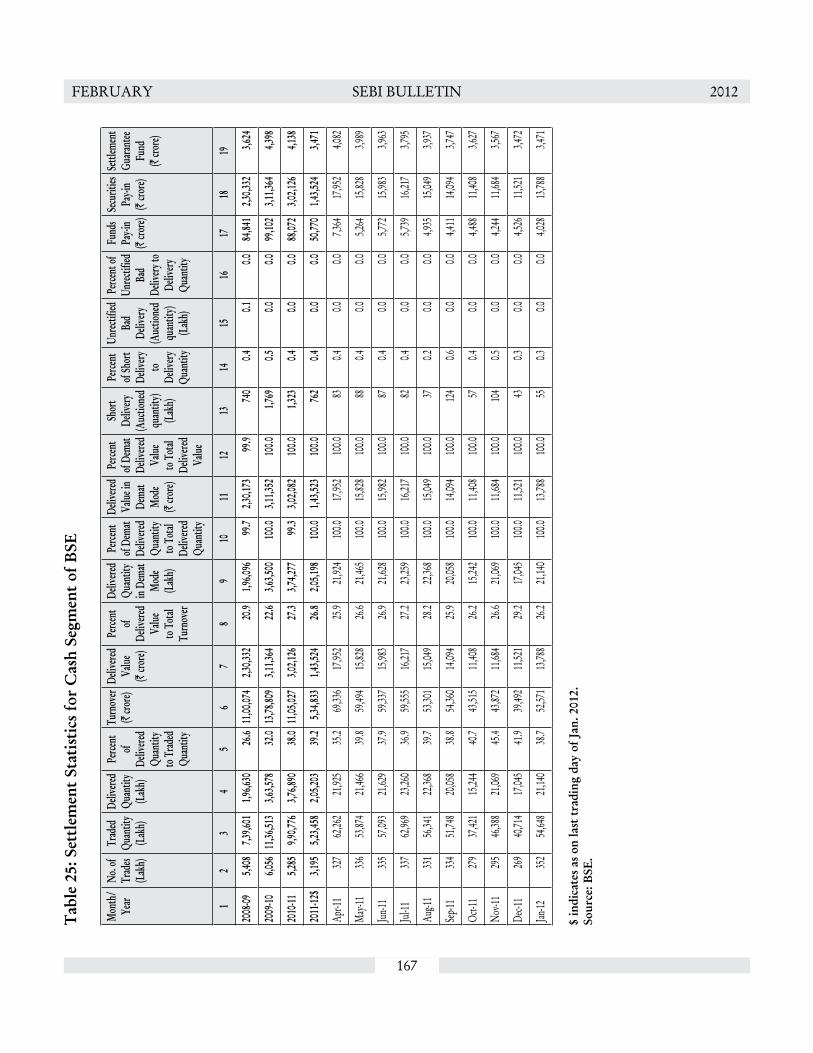
167
FEBRUARY SEBI BULLETIN 2012T
able
25:
Set
tlem
ent
Stat
isti
cs fo
r C
ash
Segm
ent
of B
SE
Mon
th/
Year
No. o
f Tr
ades
(Lak
h)
Trad
ed
Quan
tity
(Lak
h)
Deliv
ered
Quan
tity
(Lak
h)
Perce
nt
of De
livere
d Qu
antit
y to
Trad
ed
Quan
tity
Turn
over
(` cro
re)De
livere
d Va
lue
(` cro
re)
Perce
nt
of De
livere
d Va
lue
to T
otal
Turn
over
Deliv
ered
Quan
tity
in De
mat
Mod
e (L
akh)
Perce
nt
of De
mat
Deliv
ered
Quan
tity
to T
otal
Deliv
ered
Quan
tity
Deliv
ered
Value
in
Dema
t M
ode
(` cro
re)
Perce
nt
of De
mat
Deliv
ered
Value
to
Tota
l De
livere
d Va
lue
Shor
t De
livery
(A
uctio
ned
quan
tity)
(Lak
h)
Perce
nt
of Sh
ort
Deliv
ery
to
Deliv
ery
Quan
tity
Unrec
tified
Ba
d De
livery
(A
uctio
ned
quan
tity)
(Lak
h)
Perce
nt of
Un
rectif
ied
Bad
Deliv
ery to
De
livery
Qu
antit
y
Fund
s Pa
y-in
(` cro
re)
Secu
rities
Pa
y-in
(` cro
re)
Settl
emen
t Gu
arant
ee Fu
nd
(` cro
re)
12
34
56
78
910
1112
1314
1516
1718
19
2008
-095,4
087,3
9,601
1,96,6
3026
.611
,00,07
42,3
0,332
20.9
1,96,0
9699
.72,3
0,173
99.9
740
0.40.1
0.084
,841
2,30,3
323,6
24
2009
-10
6,056
11,36
,513
3,63,5
7832
.013
,78,80
93,1
1,364
22.6
3,63,5
0010
0.03,1
1,352
100.0
1,769
0.50.0
0.099
,102
3,11,3
644,3
98
2010
-115,2
859,9
0,776
3,76,8
9038
.011
,05,02
73,0
2,126
27.3
3,74,2
7799
.33,0
2,082
100.0
1,323
0.40.0
0.088
,072
3,02,1
264,1
38
2011
-12$
3,195
5,23,4
582,0
5,203
39.2
5,34,8
331,4
3,524
26.8
2,05,1
9810
0.01,4
3,523
100.0
762
0.40.0
0.050
,770
1,43,5
243,4
71
Apr-1
132
762
,262
21,92
535
.269
,336
17,95
225
.921
,924
100.0
17,95
210
0.083
0.40.0
0.07,3
6417
,952
4,082
May-1
133
653
,874
21,46
639
.859
,494
15,82
826
.621
,465
100.0
15,82
810
0.088
0.40.0
0.05,2
6415
,828
3,989
Jun-11
335
57,09
321
,629
37.9
59,33
715
,983
26.9
21,62
810
0.015
,982
100.0
870.4
0.00.0
5,772
15,98
33,9
63
Jul-11
337
62,96
923
,260
36.9
59,55
516
,217
27.2
23,25
910
0.016
,217
100.0
820.4
0.00.0
5,739
16,21
73,7
95
Aug-1
133
156
,341
22,36
839
.753
,301
15,04
928
.222
,368
100.0
15,04
910
0.037
0.20.0
0.04,9
3515
,049
3,937
Sep-11
334
51,74
820
,058
38.8
54,36
014
,094
25.9
20,05
810
0.014
,094
100.0
124
0.60.0
0.04,4
1114
,094
3,747
Oct-1
127
937
,421
15,24
440
.743
,515
11,40
826
.215
,242
100.0
11,40
810
0.057
0.40.0
0.04,4
8811
,408
3,627
Nov-1
129
546
,388
21,06
945
.443
,872
11,68
426
.621
,069
100.0
11,68
410
0.010
40.5
0.00.0
4,244
11,68
43,5
67
Dec-1
126
940
,714
17,04
541
.939
,492
11,52
129
.217
,045
100.0
11,52
110
0.043
0.30.0
0.04,5
2611
,521
3,472
Jan-12
352
54,64
821
,140
38.7
52,57
113
,788
26.2
21,14
010
0.013
,788
100.0
550.3
0.00.0
4,028
13,78
83,4
71
$ in
dica
tes
as o
n la
st t
radi
ng d
ay o
f Jan
. 201
2.So
urce
: BSE
.

168
FEBRUARY SEBI BULLETIN 2012T
able
26:
Set
tlem
ent
Stat
isti
cs fo
r C
ash
Segm
ent
of N
SE
M
onth
/ Ye
arNo
. of
Trad
es (L
akh)
Trad
ed
Qua
ntity
(L
akh)
Deliv
ered
Qua
ntity
(L
akh)
Perce
nt
of
Deliv
ered
Qua
ntity
to
Tra
ded
Qua
ntity
Turn
over
(`
crore)
Deliv
ered
Valu
e (`
crore)
Perce
nt of
De
livere
d Va
lue
to T
otal
Turn
over
Deliv
ered
Qua
ntity
in
Dem
at M
ode
(Lak
h)
Perce
nt
of D
emat
Deliv
ered
Qua
ntity
to
Tot
al De
livere
d Q
uant
ity
Deliv
ered
Valu
e in
Dem
at M
ode
(` cro
re)
Perce
nt
of D
emat
Deliv
ered
Valu
e to
Tot
al De
livere
d Va
lue
Shor
t De
livery
(A
uctio
ned
quan
tity)
(Lak
h)
Perce
nt
of Sh
ort
Deliv
ery
to
Deliv
ery
Unrec
tified
Ba
d De
livery
(A
uctio
ned
quan
tity)
(Lak
h)
Perce
nt of
Un
rectif
ied
Bad
Deliv
ery to
De
livery
Fund
s Pa
y-in
(` cro
re)
Secu
rities
Pa
y-in
(` cro
re)
Settl
emen
t Gu
aran
tee
Fund
(`
crore)
12
34
56
78
910
1112
1314
1516
1718
19
2008
-0913
,639
14,18
,928
3,03,2
9921
.427
,49,45
06,1
0,498
22.2
3,03,2
9910
0.06,1
0,498
100.0
625
0.20.0
0.02,2
0,704
6,10,4
984,8
44
2009
-1016
,788
22,05
,878
4,73,9
5221
.541
,29,21
49,1
6,460
22.2
4,73,9
5210
0.09,1
6,460
100.0
862
0.20.0
0.02,7
8,387
9,16,4
605,5
47
2010
-1115
,480
18,10
,910
4,97,3
6727
.535
,65,19
59,7
8,015
27.4
4,97,3
6710
0.09,7
8,015
100.0
903
0.20.0
0.02,9
3,357
9,79,2
695,1
00
2011
-12$
11,49
412
,36,13
33,5
0,372
28.3
22,09
,089
6,21,4
8428
.13,5
0,372
100.0
6,21,4
8410
0.061
30.2
0.00.0
1,98,3
076,2
2,219
4,632
Apr-1
11,0
721,2
9,530
38,19
429
.52,3
0,464
65,79
028
.538
,194
100.0
65,79
010
0.010
90.3
0.00.0
20,35
865
,874
5,186
May
-111,1
581,1
8,678
34,84
529
.42,3
7,410
68,67
128
.934
,845
100.0
68,67
110
0.011
30.3
--
20,52
668
,823
4,946
Jun-1
11,1
561,1
9,392
32,85
627
.52,2
0,179
62,50
428
.432
,856
100.0
62,50
410
0.043
0.1-
-18
,508
62,57
54,9
00
Jul-1
11,1
471,1
9,103
34,82
729
.22,2
6,774
66,03
129
.134
,827
100.0
66,03
110
0.047
0.1-
-19
,660
66,10
54,8
06
Aug-1
11,2
521,3
5,926
39,96
829
.42,4
1,215
69,61
328
.939
,968
100.0
69,61
310
0.048
0.1-
-22
,199
69,67
44,7
32
Sep-1
11,1
601,2
5,396
32,84
726
.22,2
0,544
58,74
126
.632
,847
100.0
58,74
110
0.044
0.1-
-22
,571
58,80
64,7
91
Oct-1
11,0
601,0
5,178
30,60
029
.12,0
2,460
56,84
928
.130
,600
100.0
56,84
910
0.052
0.2-
-19
,270
56,90
64,6
77
Nov-1
11,1
171,2
2,468
35,98
929
.42,0
4,909
58,43
228
.535
,989
100.0
58,43
210
0.055
0.2-
-18
,643
58,48
64,5
13
Dec-1
11,1
051,1
6,298
32,48
827
.91,9
8,607
54,24
127
.332
,488
100.0
54,24
110
0.039
0.1-
-18
,070
54,28
34,3
63
Jan-12
1,267
1,44,1
6437
,757
26.2
2,26,5
2660
,612
26.8
37,75
710
0.060
,612
100.0
630.2
--
18,50
260
,687
4,632
$ in
dica
tes a
s on
last
trad
ing
day
of Ja
n. 2
012.
Sour
ce: N
SE.

169
FEBRUARY SEBI BULLETIN 2012T
able
27:
Equ
ity
Der
ivat
ives
Seg
men
t at
BSE
(Tur
nove
r in
Not
iona
l Val
ue)
Mon
th/
Year
No.
of
Trad
ing
Days
Inde
x Fut
ures
Stoc
k Fut
ures
Inde
x Opt
ions
Stoc
k Opt
ions
Total
Ope
n In
terest
at
the e
nd of
Ca
llPu
tCa
llPu
t
No. of
Cont
racts
Turn
over
(`
cror
e)
No. of
Cont
racts
Turn
over
(`
cror
e)N
o. of
Co
ntra
cts Tu
rnov
er(`
cror
e)
No. of
Cont
racts
Turn
over
(`
cror
e)N
o. of
Co
ntra
cts Tu
rnov
er
(` cr
ore)
No.
of
Cont
racts
Turn
over
(`
cror
e)
No. of
Cont
racts
Turn
over
(`
cror
e)
No. of
Cont
racts
Valu
e(`
cror
e)
1 2
3 4
5 6
7 8
9 10
11
12
13
14
15
16
17
18
2008
-0924
34,9
5,830
11,75
729
99
251
612
23
00
00
4,96,5
0211
,775
220
2009
-1024
43,7
4496
60
5,276
138
00
00
00
9,026
234
00
2010
-1125
45,6
1315
40
00
010
00
00
05,6
2315
44
0
2011
-12$
207
4,369
,942
106,6
9622
7,515
6,997
825,9
9220
,838
395,6
389,6
2235
,071
1,143
1,573
445,8
55,73
114
5,339
34,04
01,0
84
Apr-1
118
353
1082
33,3
4899
00
1,142
360
04,9
2514
81
0
May
-1122
391
00
00
00
9,015
282
00
9,054
283
10
Jun-
1122
487
132
00
00
01,9
2958
00
2,418
7238
1
Jul-1
121
706
2053
216
301
00
00
00
1,268
3618
0
Aug-1
121
428
111,7
3647
00
00
00
00
2,164
583
0
Sep-1
121
19,30
347
47,7
5924
14,5
4112
086
291
22
031
,782
840
633
16
Oct-
1119
1,07,4
172,7
3046
,749
1,378
13,66
335
67,9
0720
011
,735
365
1,031
321,8
8,502
5,061
2,629
71
Nov
-1120
7,72,1
9019
,253
33,04
81,2
2248
,197
1,161
33,13
61,0
2611
,157
400
540
128,9
8,268
23,07
221
,553
521
Dec-1
121
15,69
,569
37,54
573
,314
2,152
2,17,8
095,4
4563
,791
1,473
20
00
19,24
,485
46,61
545
,176
1,218
Jan-12
2218
,99,45
046
,639
64,29
31,9
405,3
8,404
13,65
729
0,718
6,920
00
00
27,92
,865
69,15
534
,040
1,084
$ in
dica
tes a
s on
last
trad
ing
day
of Ja
n. 2
012.
Not
iona
l Tur
nove
r = (S
trik
e Pr
ice
+ P
rem
ium
) * Q
uant
ity.
Sour
ce: B
SE.

170
FEBRUARY SEBI BULLETIN 2012T
able
28:
Equ
ity
Der
ivat
ives
Seg
men
t at
NSE
(Tur
nove
r in
Not
iona
l Val
ue)
Mon
th/
Year
No.
of Tr
ading
Da
ys
Inde
x Fut
ures
Stoc
k Fut
ures
Inde
x Opt
ions
Stoc
k Opt
ions
Total
Open
Inter
est at
th
e end
ofCa
llPu
tCa
llPu
t
No. o
f Co
ntrac
ts Tu
rnov
er (`
crore)
No. o
f Co
ntrac
ts Tu
rnov
er (`
crore)
No. o
f Co
ntrac
ts Tu
rnov
er (`
crore)
No. o
f Co
ntrac
ts Tu
rnov
er (`
crore)
No. o
f Co
ntrac
ts Tu
rnov
er (`
crore)
No. o
f Co
ntrac
ts Tu
rnov
er (`
crore)
No. o
f Co
ntrac
ts Tu
rnov
er (`
crore)
No. o
f Co
ntrac
ts Va
lue
(` cro
re)
1 2
3 4
5 6
7 8
9 10
11
12
13
14
15
16
17
18
2008
-0924
321
,04,28
,103
35,70
,1112
2,15,7
7,980
34,79
,642
11,04
,31,97
420
,02,54
410,1
6,56,4
7017
,28,95
797
,62,96
81,7
1,843
35,33
,002
57,38
465
,73,90
,497
1,10,1
0,482
32,27
,759
57,70
5
2009
-1024
417
,83,06
,889
39,34
,3891
4,55,9
1,240
51,95
,247
16,76
,83,92
840
,49,26
617,3
6,95,5
9539
,78,69
91,0
6,14,1
473,8
9,158
34,02
,123
1,16,9
0767
,92,93
,922
1,76,6
3,665
34,89
,790
97,97
8
2010
-1125
416
,50,23
,653
43,56
,7551
8,60,4
1,459
54,95
,757
31,45
,33,24
490
,90,70
233,6
1,05,3
1392
,74,66
42,4
2,73,5
607,7
7,109
82,34
,833
2,53,2
3510
3,42,1
2,062
2,92,4
8,221
36,90
,373
1,01,8
16
2011
-12$
207
12,14
,07,24
229
,48,88
812,9
7,75,8
0732
,38,67
535
,84,85
,293
96,20
,9863
5,97,4
3,689
91,64
,989
1,96,7
8,289
5,19,6
7594
,52,57
92,3
5,509
99,85
,42,89
92,5
7,28,7
2341
,24,15
51,0
7,672
Apr-1
118
1,02,7
1,439
2,82,3
031,2
8,80,7
053,5
3,159
2,82,1
2,015
8,43,8
352,7
8,19,3
388,0
2,046
17,55
,056
52,78
56,0
1,461
17,17
38,1
5,40,0
1423
,51,30
040
,07,51
61,0
9,326
May
-1122
1,18,8
8,838
3,05,7
451,3
4,74,4
553,3
6,689
3,62,8
0,374
10,27
,313
3,17,5
4,162
8,65,5
8418
,73,59
550
,101
7,70,4
0119
,707
9,60,4
1,825
26,05
,138
42,40
,222
1,12,1
12
Jun-1
122
1,03,1
3,335
2,65,1
781,2
9,93,3
513,2
2,695
3,31,3
0,753
9,28,5
333,1
7,02,5
728,5
6,038
18,65
,161
47,52
07,3
9,167
18,21
49,0
7,44,3
3924
,38,17
732
,77,32
491
,467
Jul-1
121
1,00,4
8,859
2,65,6
411,2
2,60,0
203,4
9,891
3,33,9
5,753
9,57,6
473,2
8,72,6
849,1
0,079
19,51
,542
57,73
48,4
8,888
23,97
49,1
3,77,7
4625
,64,96
537
,78,04
01,0
2,002
Aug-1
121
1,45,8
5,694
3,47,1
771,3
3,66,5
373,3
3,791
4,19,7
4,923
11,07
,825
4,41,6
6,928
11,01
,698
19,42
,086
51,80
18,4
9,593
21,45
711
,68,85
,761
29,63
,749
44,46
,681
1,09,0
23
Sep-1
121
1,47,9
6,435
3,46,8
261,3
3,29,9
263,2
6,290
3,93,0
8,648
10,17
,491
4,38,1
3,388
10,68
,239
20,17
,590
51,57
510
,39,65
824
,843
11,43
,05,64
528
,35,26
438
,68,96
593
,359
Oct-1
119
1,12,8
9,988
2,65,9
451,1
3,58,6
252,7
9,971
3,02,0
5,915
7,91,2
133,3
7,44,6
888,2
9,905
16,36
,032
43,37
29,0
5,536
22,81
48,9
1,40,7
8422
,33,22
143
,72,20
71,1
3,207
Nov-1
120
1,34,6
9,578
3,12,1
391,3
3,98,1
653,0
5,421
4,08,9
8,635
10,55
,219
3,96,4
4,152
9,72,0
1719
,27,40
547
,176
10,24
,494
24,58
611
,03,62
,429
27,16
,559
44,95
,500
1,04,1
96
Dec-1
121
1,38,8
6,601
3,07,1
981,2
7,55,9
932,7
9,921
4,52,7
3,935
11,32
,427
4,16,0
6,078
9,76,3
2420
,31,46
446
,806
11,93
,943
26,18
811
,67,48
,014
27,68
,863
35,31
,984
79,86
7
Jan-12
221,0
8,56,4
752,5
0,738
1,39,5
8,030
3,50,8
482,9
8,04,3
427,5
9,484
3,26,1
9,699
7,83,0
5826
,78,35
870
,805
14,79
,438
36,55
49,1
3,96,3
4222
,51,48
741
,24,15
51,0
7,672
$ in
dica
tes a
s on
last
trad
ing
day
of Ja
n. 2
012.
Not
iona
l Tur
nove
r = (S
trik
e Pr
ice
+ P
rem
ium
) * Q
uant
ity.
Sour
ce: N
SE.

171
FEBRUARY SEBI BULLETIN 2012T
able
29:
Equ
ity
Der
ivat
ives
Tra
ding
at
NSE
dur
ing
Janu
ary
2012
(Tur
nove
r in
Not
iona
l Val
ue)
Dat
e
Inde
x Fu
ture
s S
tock
Fut
ures
Inde
x O
ptio
nsSt
ock
Opt
ions
Tota
l Tur
nove
rO
pen
Inte
rest
at
the e
nd o
f the
day
C
alls
P
uts
C
alls
P
uts
No.
of
Cont
ract
s Tu
rnov
er
(` cr
ore)
No.
of
Cont
ract
s Tu
rnov
er
(` cr
ore)
No.
of
Cont
ract
sTurn
over
(`
cror
e)N
o. o
f Co
ntra
ctsTu
rnov
er
(` cr
ore)
No.
of
Cont
ract
sTurn
over
(`
cror
e)N
o. o
f Co
ntra
ctsTu
rnov
er
(` cr
ore)
No.
of
Cont
ract
s Turn
over
(`
cror
e)N
o. o
f co
ntra
cts
Valu
e (`
cror
e)
1 2
3 4
5 6
7 8
9 10
11
12
13
14
15
16
17
2-Jan
-124,0
6,993
8,576
3,66,3
638,1
2510
,20,83
225
,051
8,94,9
3320
,298
65,50
31,5
4537
,770
814
27,92
,394
64,40
937
,09,53
184
,152
3-Jan
-125,1
8,784
11,28
44,4
5,577
10,37
013
,43,52
833
,452
12,55
,352
28,69
293
,278
2,291
44,08
61,0
1937
,00,60
587
,109
38,81
,219
90,90
3
4-Jan
-125,1
2,984
11,24
84,5
5,235
10,77
112
,68,71
831
,641
12,92
,420
29,73
078
,924
1,992
41,65
71,0
0336
,49,93
886
,385
39,44
,459
92,31
3
5-Jan
-124,0
2,452
8,869
4,23,0
0210
,127
9,66,5
8224
,153
10,70
,236
24,59
279
,746
1,983
42,60
01,0
0829
,84,61
870
,733
41,19
,205
96,50
0
6-Jan
-126,4
7,878
14,07
05,1
2,150
11,82
116
,32,30
040
,519
16,86
,102
38,77
594
,807
2,319
51,15
11,2
0446
,24,38
81,0
8,709
42,23
,085
99,01
8
7-Jan
-1249
,528
1,136
53,04
41,1
601,3
4,875
3,399
1,18,0
152,7
5015
,003
337
4,554
100
3,75,0
198,8
8342
,50,32
099
,573
9-Jan
-124,6
7,660
10,19
74,0
9,968
9,297
13,69
,973
34,03
411
,77,54
827
,208
84,83
92,0
5738
,394
913
35,48
,382
83,70
543
,60,68
01,0
2,197
10-Ja
n-12
5,49,0
1512
,343
5,25,8
2712
,423
16,23
,441
40,77
516
,50,53
238
,396
1,11,3
082,7
1352
,124
1,213
45,12
,247
1,07,8
6345
,85,62
01,1
0,075
11-Ja
n-12
3,99,6
469,0
275,6
6,850
13,49
511
,97,88
930
,236
11,95
,553
28,00
21,4
1,675
3,655
70,60
91,7
8835
,72,22
286
,203
47,21
,127
1,14,1
50
12-Ja
n-12
5,73,9
6613
,024
6,26,5
6315
,742
15,19
,283
38,13
914
,68,62
234
,723
1,80,0
345,2
2199
,143
2,696
44,67
,611
1,09,5
4647
,85,78
51,1
5,591
13-Ja
n-12
5,48,9
6812
,453
6,79,2
7916
,884
15,74
,191
39,62
816
,66,16
839
,440
1,56,5
144,2
5693
,173
2,277
47,18
,293
1,14,9
3849
,19,78
41,1
9,839
16-Ja
n-12
4,00,1
099,0
835,2
0,202
12,84
412
,27,92
230
,920
12,30
,262
29,19
91,2
1,289
3,216
70,48
71,7
3635
,70,27
186
,999
49,92
,754
1,21,8
14
17-Ja
n-12
4,55,5
2110
,641
6,67,9
1016
,921
16,17
,680
41,10
919
,71,34
247
,165
1,70,8
654,5
541,0
1,390
2,527
49,84
,708
1,22,9
1652
,07,87
41,2
9,369
18-Ja
n-12
4,35,6
6910
,141
7,23,8
1718
,010
13,61
,136
34,62
716
,32,18
339
,286
1,69,1
094,4
4198
,642
2,426
44,20
,556
1,08,9
3052
,25,38
01,2
9,345
19-Ja
n-12
4,68,2
8811
,121
7,57,3
8419
,179
13,71
,799
35,11
617
,80,01
843
,026
1,44,2
553,7
4285
,583
2,046
46,07
,327
1,14,2
3053
,17,46
61,3
3,444
20-Ja
n-12
6,93,5
0116
,704
10,47
,586
27,23
717
,20,35
344
,197
21,16
,940
51,92
61,6
8,850
4,397
1,03,0
262,4
8258
,50,25
61,4
6,944
55,26
,499
1,39,5
77
23-Ja
n-12
4,48,8
1410
,887
9,73,8
6025
,382
12,01
,841
30,99
115
,57,86
738
,250
1,44,9
153,8
8996
,457
2,428
44,23
,754
1,11,8
2856
,70,50
11,4
3,247
24-Ja
n-12
8,58,1
0420
,851
13,27
,062
34,50
724
,24,48
062
,893
31,98
,122
79,36
01,8
3,305
4,907
1,12,5
982,7
8881
,03,67
12,0
5,306
56,89
,369
1,46,2
13
25-Ja
n-12
7,20,4
1217
,663
12,26
,773
32,53
725
,44,44
566
,420
27,12
,775
68,58
61,6
2,321
4,527
78,68
92,0
4474
,45,41
51,9
1,777
34,92
,689
90,42
627
-Jan-
123,6
8,269
8,987
5,12,1
1013
,861
7,24,0
0019
,542
9,50,7
9023
,694
96,79
42,7
4844
,020
1,128
26,95
,983
69,95
938
,01,64
299
,240
30-Ja
n-12
4,39,1
1010
,540
5,24,5
4013
,866
8,87,9
0823
,792
9,95,9
5724
,883
93,68
32,6
1451
,648
1,343
29,92
,846
77,03
838
,96,63
099
,462
31-Ja
n-12
4,90,8
0411
,895
6,12,9
2816
,288
10,71
,166
28,85
19,9
7,962
25,07
71,2
1,341
3,399
61,63
71,5
7033
,55,83
887
,079
41,24
,155
1,07,6
72
N
otio
nal V
alue
of O
utst
andi
ng C
ontr
acts
for O
PTID
X -
Ope
n In
tere
st *
Clo
se p
rice
S&
P C
NX
Nift
y.N
otio
nal T
urno
ver =
(Str
ike
Pric
e +
Pre
miu
m) *
Qua
ntity
.In
dex
Futu
res,
Inde
x O
ptio
ns, S
tock
Opt
ions
and
Sto
ck F
utur
es w
ere
intr
oduc
ed in
Sep
tem
ber 2
000,
Sep
tem
ber 2
001,
Sep
tem
ber 2
001
and
Nov
embe
r 200
1, re
spec
tivel
y.O
pen
inte
rest
val
ue is
com
pute
d as
Und
erly
ing
clos
e pr
ice*
Qua
ntity
.So
urce
: N
SE.

172
FEBRUARY SEBI BULLETIN 2012T
able
30:
Set
tlem
ent
Stat
isti
cs in
Equ
ity
Der
ivat
ives
Seg
men
t at
BSE
and
NSE
(` c
rore
)
Mon
th/
Ye
ar
BSE
NSE
Inde
x/St
ock
Futu
res
Inde
x/St
ock
Opt
ions
Tot
alSe
ttle
men
t G
uran
tee
Fund
Inde
x/St
ock
Futu
res
Inde
x/St
ock
Opt
ions
Tot
alSe
ttle
men
t G
uran
tee
Fund
MTM
Se
ttle
men
tFi
nal
Sett
lem
ent
Prem
ium
Se
ttle
men
tEx
erci
se
Sett
lem
ent
MTM
Se
ttle
men
tFi
nal
Sett
lem
ent
Prem
ium
Se
ttle
men
tEx
erci
se
Sett
lem
ent
1 2
3 4
5 6
7 8
9 10
11
12
13
2008
-09
110.
42.
70.
10.
011
3.2
81.5
75,1
941,
498
10,9
604,
188
91,8
4023
,656
2009
-10
0.5
0.0
0.1
0.0
0.6
72.2
60,6
561,
395
11,0
113,
881
76,9
4331
,572
2010
-11
1.2
0.0
0.0
0.0
1.2
70.7
67,2
881,
591
12,7
032,
119
83,7
0129
,759
2011
-12$
46.4
10.7
10.2
28.9
96.2
213.
146
,879
1,09
810
,409
1,31
459
,700
25,3
73
Apr
-11
0.1
0.0
0.4
0.0
0.5
70.4
3,50
410
487
356
4,53
629
,601
May
-11
0.0
0.0
0.1
0.0
0.1
69.1
5,45
012
693
277
6,58
528
,534
Jun-
110.
10.
00.
00.
00.
166
.83,
870
701,
010
149
5,09
929
,223
Jul-1
10.
20.
00.
00.
00.
267
.04,
008
152
882
615,
104
28,5
28
Aug
-11
0.2
0.0
0.0
0.0
0.2
70.0
7,54
410
21,
480
234
9,35
929
,264
Sep-
110.
60.
00.
10.
00.
798
.35,
536
151
1,12
211
76,
926
28,7
67
Oct
-11
5.4
10.1
0.6
0.3
16.4
130.
64,
104
101
897
935,
194
28,1
52
Nov
-11
30.8
0.0
6.0
0.0
36.8
195.
04,
606
108
1,09
610
65,
917
27,2
01
Dec
-11
5.7
0.0
1.0
0.0
6.7
195.
84,
563
105
1,17
525
76,
100
25,2
34
Jan-
123.
40.
61.
828
.634
.421
3.1
3,69
580
941
164
4,88
025
,373
$
indi
cate
s as o
n la
st tr
adin
g da
y of
Jan.
201
2.
So
urce
: BSE
and
NSE
.

173
FEBRUARY SEBI BULLETIN 2012
Table 31: Trading in the Corporate Debt Market
Month/Year
BSE NSE FIMMDA
No. of Trades Traded Value (` crore)
No. of Trades Traded Value (` crore)
No. of Trades Traded Value (` crore)
1 2 3 4 5 6 7
2008-09 8,327 37,320 4,902 49,505 9,501 61,535
2009-10 7,408 53,323 12,522 1,51,920 18,300 1,95,955
2010-11 4,465 39,581 8,006 1,55,951 31,589 4,09,742
2011-12$ 5,460 41,757 7,919 1,39,862 28,195 2,92,023
Apr-11 339 3,060 499 11,886 2,327 22,968
May-11 378 2,613 370 8,205 2,264 19,629
Jun-11 714 4,645 719 15,960 2,997 30,769
Jul-11 665 4,107 915 15,852 2,959 30,776
Aug-11 737 5,730 717 13,653 3,035 33,772
Sep-11 535 3,601 710 10,543 3,618 30,738
Oct-11 350 3,056 913 12,699 2,444 27,510
Nov-11 484 5,304 588 14,547 2,448 27,457
Dec-11 684 6,233 888 17,365 3,323 39,468
Jan-12 574 3,407 1,600 19,152 2,780 28,936 $ indicates as on last trading day of Jan. 2012. Source: BSE, NSE and FIMMDA.

174
FEBRUARY SEBI BULLETIN 2012T
able
32
: Tra
ding
Sta
tist
ics
of C
urre
ncy
Der
ivat
ives
Seg
men
t at
NSE
Mon
th/
Yea
r
No.
of
Trad
ing
Day
s
Cur
renc
y Fu
ture
sC
urre
ncy
Opt
ions
Tota
lO
pen
Inte
rest
at
the
end
of
No.
of
Con
trac
ts
Turn
over
(`
cro
re)
Cal
lPu
tN
o. o
f C
ontr
acts
Tu
rnov
er
(`cr
ore)
No.
of
Con
trac
ts
Turn
over
(`
cro
re)
No.
of
Con
trac
ts
Turn
over
(`
cro
re)
No.
of
Con
trac
ts
Trad
ed
Val
ue(`
cro
re)
12
34
56
78
910
1112
2008
-09
139
3,27
,38,
566
1,62
,563
--
--
3,27
,38,
566
1,62
,563
2,57
,554
1,31
3
2009
-10
240
37,8
6,06
,983
17,8
2,60
8-
--
-37
,86,
06,9
8317
,82,
608
4,27
,873
1,96
4
2010
-11
249
71,2
1,81
,928
32,7
9,00
22,
32,9
7,30
61,
06,5
061,
41,2
2,84
164
,280
74,9
6,02
,075
34,4
9,78
830
,20,
562
13,6
90
2011
-12$
201
61,1
0,81
,116
29,2
3,69
813
,61,
06,5
966,
45,4
0210
,45,
02,4
804,
92,7
7085
,16,
90,1
9240
,61,
869
30,9
3,92
115
,513
Apr
-11
165,
55,6
4,07
22,
51,1
591,
39,9
7,22
462
,850
76,9
2,25
034
,458
7,72
,53,
546
3,48
,467
32,4
3,55
014
,673
May
-11
217,
18,7
4,85
43,
29,7
921,
28,3
7,81
158
,427
98,3
0,04
744
,283
9,45
,42,
712
4,32
,502
33,7
4,67
615
,437
Jun-
1122
7,16
,92,
233
3,29
,896
1,55
,93,
859
70,8
1393
,36,
323
42,1
699,
66,2
2,41
54,
42,8
7742
,98,
647
19,5
05
Jul-1
121
8,53
,83,
927
3,89
,734
2,36
,93,
577
1,06
,481
1,31
,94,
701
59,0
6712
,22,
72,2
055,
55,2
8260
,55,
316
27,0
81
Aug
-11
208,
79,4
0,09
04,
06,8
391,
94,1
1,62
388
,623
1,98
,88,
142
89,6
6112
,72,
39,8
555,
85,1
2343
,68,
210
20,4
65
Sep-
1120
5,94
,02,
945
2,88
,848
1,20
,99,
974
58,3
041,
36,3
9,88
464
,401
8,51
,42,
803
4,11
,553
36,8
1,04
918
,213
Oct
-11
194,
02,8
6,28
62,
01,4
1283
,69,
448
41,8
5960
,49,
710
29,8
445,
47,0
5,44
42,
73,1
1436
,95,
468
18,2
47
Nov
-11
204,
37,5
9,11
32,
26,3
9896
,39,
713
49,9
8488
,97,
214
45,2
846,
22,9
6,04
03,
21,6
6636
,63,
965
19,3
39
Dec
-11
214,
46,6
6,23
52,
38,6
6993
,47,
785
50,1
0081
,44,
859
43,0
356,
21,5
8,87
93,
31,8
0523
,87,
654
12,8
86
Jan-
1221
5,05
,11,
361
2,60
,951
1,11
,15,
582
57,9
6278
,29,
350
40,5
696,
94,5
6,29
33,
59,4
8130
,93,
921
15,5
13
Not
e: C
urre
ncy
Futu
res
trad
ing
stat
red
at N
SE o
n A
ugus
t 29
, 200
8.C
urre
ncy
Opt
ions
wer
e in
trod
ucde
d at
NSE
w.e
.f O
ctob
er 2
9, 2
010.
Tra
ding
Val
ue :-
For
Fut
ures
, Val
ue o
f con
trac
t =
Tra
ded
Qty
*Tra
ded
Pric
e.Fo
r O
ptio
ns, V
alue
of c
ontr
act
= T
rade
d Q
ty*(
Stri
ke P
rice
+T
rade
d Pr
emiu
m)
$ in
dica
tes
as o
n la
st t
radi
ng d
ay o
f Jan
. 201
2.So
urce
: NSE
.

175
FEBRUARY SEBI BULLETIN 2012
Table 33: Trading Statistics of Currency Derivatives Segment at MCX-SX
Month/ YearNo. of
Trading Days
Currency Futures Total Open Interest at the end of
No. of Contracts
Turnover (` crore)
No. of Contracts
Turnover (` crore)
No. of Contracts
Value (` crore)
1 2 3 4 5 6 7 8
2009-10 240 40,81,66,278 19,44,654 40,81,66,278 19,44,654 4,23,314 1,951
2010-11 249 90,31,85,639 41,94,017 90,31,85,639 41,94,017 7,94,788 3,706
2011-12$ 201 67,39,54,219 32,44,426 67,39,54,219 32,44,426 10,10,958 5,132
Apr-11 16 5,96,20,093 2,70,381 5,96,20,093 2,70,381 8,11,777 3,844
May-11 21 7,76,11,606 3,57,484 7,76,11,606 3,57,484 7,20,828 3,519
Jun-11 22 7,91,93,828 3,67,456 7,91,93,828 3,67,456 10,61,923 5,075
Jul-11 21 8,83,88,424 4,08,314 8,83,88,424 4,08,314 15,71,147 7,218
Aug-11 20 9,67,04,293 4,50,762 9,67,04,293 4,50,762 12,19,239 5,943
Sep-11 20 7,60,98,239 3,71,558 7,60,98,239 3,71,558 9,58,613 4,836
Oct-11 19 4,65,31,165 2,33,541 4,65,31,165 2,33,541 10,86,575 5,484
Nov-11 20 5,32,01,472 2,75,674 5,32,01,472 2,75,674 11,78,910 6,326
Dec-11 21 4,93,36,944 2,64,005 4,93,36,944 2,64,005 9,61,299 5,269
Jan-12 21 4,72,68,155 2,45,250 4,72,68,155 2,45,250 10,10,958 5,132
Note: Currency Futures trading statred at MCX-SX on October 07, 2008. $ indicates as on last trading day of Jan. 2012. NA: Not Applicable.Source: MCX-SX.

176
FEBRUARY SEBI BULLETIN 2012T
able
34:
Tra
ding
Sta
tist
ics
of C
urre
ncy
Der
ivat
ives
Seg
men
t at
USE
Mon
th/
Yea
r
No.
of
Tra
ding
D
ays
Cur
renc
y Fu
ture
sC
urre
ncy
Opt
ions
Tot
alO
pen
Inte
rest
at
the
end
of
Cal
lPu
t
No.
of
Con
trac
ts
Tur
nove
r (`
cro
re)
No.
of
Con
trac
ts T
urno
ver
(` c
rore
)N
o. o
f C
ontr
acts
Tur
nove
r (`
cro
re)
No.
of
Con
trac
ts
Tur
nove
r (`
cro
re)
No.
of
Con
trac
ts
Val
ue
(` c
rore
)
1 2
3 4
5 6
7 8
9 10
11
12
2011
-12$
201
30,3
9,80
,009
14,4
3,74
146
,77,
280
21,3
7925
,75,
639
11,7
7631
,10,
35,0
8414
,75,
902
20,6
4410
4
Apr
-11
162,
17,2
1,80
199
,691
6,11
,531
2,73
12,
25,3
991,
005
2,25
,58,
731
1,03
,427
48,1
7221
9
May
-11
214,
15,0
2,46
81,
94,3
5418
,21,
489
8,25
617
,56,
668
7,90
24,
50,8
0,62
52,
10,5
1254
,896
251
Jun-
1122
4,91
,59,
434
2,25
,879
5,55
,512
2,52
161
,026
277
4,97
,75,
972
2,28
,677
1,96
,865
886
Jul-1
121
6,06
,85,
198
2,76
,907
5,59
,333
2,50
266
,843
301
6,13
,11,
374
2,79
,711
3,27
,770
1,50
4
Aug
-11
207,
00,8
4,39
23,
27,1
284,
98,5
852,
278
38,2
5417
67,
06,2
1,23
13,
29,5
822,
21,2
781,
083
Sep-
1120
3,65
,57,
897
1,92
,533
3,27
,369
1,56
61,
49,4
9272
03,
70,3
4,75
81,
94,8
201,
35,8
0666
6
Oct
-11
191,
34,0
9,12
369
,515
1,76
,712
880
1,50
,483
751
1,37
,36,
318
71,1
451,
07,5
0452
9
Nov
-11
2075
,29,
516
38,8
4094
,464
476
1,03
,380
518
75,2
9,51
638
,840
59,8
3331
3
Dec
-11
2122
,50,
700
12,5
593,
901
210
022
,54,
601
12,5
8031
,370
168
Jan-
1221
10,7
9,48
06,
335
28,3
8414
824
,094
126
11,3
1,95
86,
609
20,6
4410
4
Not
e: C
urre
ncy
Futu
res
trad
ing
star
ted
at U
SE o
n Se
ptem
ber
20, 2
010.
Cur
renc
y O
ptio
ns w
ere
intr
oduc
ded
at U
SE w
.e.f
Oct
ober
29,
201
0.$
indi
cate
s as
on
last
tra
ding
day
of
Jan.
201
2.So
urce
: USE
.

177
FEBRUARY SEBI BULLETIN 2012T
able
35:
Dai
ly T
rend
s of
Cur
renc
y D
eriv
ativ
es t
radi
ng a
t N
SE d
urin
g Ja
nuar
y 20
12
Dat
e
Cur
renc
y Fu
ture
sC
urre
ncy
Opt
ion
Tot
al T
urno
ver
Ope
n In
tere
st a
tth
e en
d of
C
alls
Puts
No.
of
Con
trac
ts
Tra
ded
Val
ue
(` c
rore
)
No.
of
Con
trac
ts
Tra
ded
Val
ue
(` c
rore
)
No.
of
Con
trac
ts
Tra
ded
Val
ue
(` c
rore
)
No.
of
Con
trac
ts
Tra
ded
Val
ue
(` c
rore
)
No.
of
Con
trac
ts
Tra
ded
Val
ue
(` c
rore
)
12
34
56
78
910
11
2-Ja
n-12
8,14
,892
4,40
31,
32,9
0672
11,
67,9
4590
011
,15,
743
6,02
424
,35,
412
13,1
62
3-Ja
n-12
13,1
3,51
57,
117
1,78
,080
967
1,88
,701
1,01
216
,80,
296
9,09
726
,56,
792
14,3
51
4-Ja
n-12
16,8
4,35
69,
077
2,60
,603
1,41
21,
92,5
771,
032
21,3
7,53
611
,521
27,9
7,56
615
,039
5-Ja
n-12
21,2
2,40
611
,365
6,37
,097
3,44
13,
91,7
212,
090
31,5
1,22
416
,896
30,8
5,45
916
,504
6-Ja
n-12
16,5
9,12
48,
877
3,43
,110
1,84
83,
05,7
321,
633
23,0
7,96
612
,358
34,5
9,47
518
,432
9-Ja
n-12
20,7
6,01
011
,052
3,89
,953
2,09
23,
42,0
601,
821
28,0
8,02
314
,965
35,9
2,87
319
,097
10-Ja
n-12
33,3
8,91
517
,578
10,1
5,09
65,
407
6,08
,606
3,21
649
,62,
617
26,2
0037
,29,
093
19,5
64
11-Ja
n-12
27,7
6,73
214
,510
5,45
,107
2,87
74,
90,5
752,
566
38,1
2,41
419
,953
38,7
8,45
220
,287
12-Ja
n-12
21,8
2,57
711
,423
2,78
,000
1,47
52,
07,0
291,
082
26,6
7,60
613
,980
37,6
5,05
319
,670
13-Ja
n-12
22,5
5,62
411
,734
6,15
,508
3,22
64,
38,0
222,
275
33,0
9,15
417
,234
39,7
8,39
720
,675
16-Ja
n-12
21,1
1,23
511
,030
4,71
,764
2,48
03,
36,4
461,
765
29,1
9,44
515
,275
38,5
8,46
620
,075
17-Ja
n-12
37,0
0,20
519
,038
7,24
,606
3,76
66,
34,1
183,
302
50,5
8,92
926
,105
43,0
4,62
122
,129
18-Ja
n-12
34,8
7,13
917
,836
10,8
2,84
65,
601
5,90
,027
3,03
451
,60,
012
26,4
7145
,13,
355
23,0
08
19-Ja
n-12
29,0
5,36
514
,742
7,66
,785
3,95
14,
94,8
732,
525
41,6
7,02
321
,218
45,9
9,58
023
,321
20-Ja
n-12
19,8
2,27
310
,102
3,56
,495
1,82
22,
95,3
861,
501
26,3
4,15
413
,424
46,9
3,70
323
,819
23-Ja
n-12
22,2
1,98
611
,258
7,11
,946
3,63
73,
17,6
321,
615
32,5
1,56
416
,510
48,9
6,67
124
,761
24-Ja
n-12
30,2
2,03
315
,226
6,05
,381
3,07
74,
07,3
292,
074
40,3
4,74
320
,377
49,9
4,58
825
,169
25-Ja
n-12
22,8
3,64
711
,542
4,47
,580
2,26
72,
98,5
191,
507
30,2
9,74
615
,315
48,9
1,43
524
,697
27-Ja
n-12
38,5
2,21
519
,328
6,64
,037
3,37
24,
84,4
192,
441
50,0
0,67
125
,141
26,0
3,23
113
,040
30-Ja
n-12
21,5
2,03
610
,815
4,18
,247
2,13
72,
98,2
421,
486
28,6
8,52
514
,439
28,6
7,71
114
,428
31-Ja
n-12
25,6
9,07
612
,899
4,70
,435
2,38
73,
39,3
911,
692
33,7
8,90
216
,978
30,9
3,92
115
,513
Sour
ce:N
SE.

178
FEBRUARY SEBI BULLETIN 2012
Table 36: Daily Trends of Currency Derivatives trading at MCX-SX during January 2012
Date
Currency Futures Total TurnoverOpen Interest at the
end of the day
No. of Contracts
Turnover(` crore)
No. of Contracts
Turnover (` crore)
No. of contracts
Value (` crore)
1 2 3 4 5 6 7
2-Jan-12 7,15,643 3,892 7,15,643 3,892 9,67,055 5,307
3-Jan-12 15,40,985 8,397 15,40,985 8,397 11,15,367 6,133
4-Jan-12 18,45,144 9,995 18,45,144 9,995 10,74,366 5,871
5-Jan-12 21,74,779 11,705 21,74,779 11,705 10,54,451 5,746
6-Jan-12 14,41,615 7,754 14,41,615 7,754 10,71,880 5,800
9-Jan-12 18,23,635 9,755 18,23,635 9,755 10,80,090 5,826
10-Jan-12 28,87,350 15,269 28,87,350 15,269 10,40,214 5,532
11-Jan-12 24,62,979 12,902 24,62,979 12,902 9,87,748 5,263
12-Jan-12 22,04,446 11,550 22,04,446 11,550 9,90,595 5,262
13-Jan-12 22,30,819 11,645 22,30,819 11,645 9,80,947 5,196
16-Jan-12 21,33,266 11,162 21,33,266 11,162 9,51,002 5,030
17-Jan-12 34,67,138 17,852 34,67,138 17,852 10,38,483 5,420
18-Jan-12 28,49,859 14,626 28,49,859 14,626 10,73,930 5,562
19-Jan-12 27,34,563 13,898 27,34,563 13,898 11,02,086 5,680
20-Jan-12 21,23,227 10,836 21,23,227 10,836 12,07,802 6,224
23-Jan-12 21,32,439 10,842 21,32,439 10,842 11,60,156 5,957
24-Jan-12 26,53,373 13,416 26,53,373 13,416 11,56,004 5,923
25-Jan-12 20,63,240 10,532 20,63,240 10,532 11,56,750 5,946
27-Jan-12 34,03,585 17,133 34,03,585 17,133 14,22,397 7,178
30-Jan-12 22,20,532 11,202 22,20,532 11,202 9,50,155 4,859
31-Jan-12 21,59,538 10,887 21,59,538 10,887 10,10,958 5,132
Source: MCX-SX.

179
FEBRUARY SEBI BULLETIN 2012T
able
37:
Dai
ly T
rend
s of
Cur
renc
y D
eriv
ativ
es t
radi
ng a
t U
SE d
urin
g Ja
nuar
y 20
12
Dat
e
Cur
renc
y Fu
ture
sC
urre
ncy
Opt
ions
Tot
al T
urno
ver
Ope
n In
tere
st a
t th
e en
d of
the
day
C
alls
P
uts
No.
of
Con
trac
ts
Tur
nove
r (`
cro
re)
No.
of
Con
trac
tsT
urno
ver
(` c
rore
)N
o. o
f C
ontr
acts
Tur
nove
r (`
cro
re)
No.
of
Con
trac
ts
Tur
nove
r (`
cro
re)
No.
of
cont
ract
sV
alue
(` c
rore
)
1 2
3 6
7 8
9 10
11
12
13
2-Ja
n-12
45,5
4328
90
00
045
,543
289
32,1
7517
3
3-Ja
n-12
44,6
5927
80
00
044
,659
278
32,2
0117
3
4-Ja
n-12
64,9
2342
10
00
064
,923
421
30,9
6616
6
5-Ja
n-12
62,6
9237
30
00
062
,692
373
33,5
2917
8
6-Ja
n-12
65,0
5142
60
00
065
,051
426
32,3
9817
2
9-Ja
n-12
63,1
4039
80
00
063
,140
398
32,6
9017
4
10-Ja
n-12
77,3
4748
275
04
00
78,0
9748
633
,793
174
11-Ja
n-12
42,3
2225
890
05
00
43,2
2226
334
,130
174
12-Ja
n-12
60,6
4438
59,
920
525,
180
2775
,744
464
35,4
2618
1
13-Ja
n-12
64,4
6838
23,
720
197,
578
4075
,766
442
36,0
6418
3
16-Ja
n-12
68,3
8941
49,
494
506,
438
3484
,321
497
34,0
6017
7
17-Ja
n-12
65,8
1836
20
02,
398
1268
,216
374
35,5
9118
1
18-Ja
n-12
33,5
0917
040
02
400
234
,309
174
35,8
1818
1
19-Ja
n-12
35,2
2517
840
02
00
35,6
2518
035
,011
177
20-Ja
n-12
34,9
8017
70
00
034
,980
177
34,8
5617
7
23-Ja
n-12
38,3
3920
00
00
038
,339
200
34,9
6817
7
24-Ja
n-12
76,6
6940
70
00
076
,669
407
41,7
7121
0
25-Ja
n-12
45,4
6823
91,
000
50
046
,468
244
44,6
0322
0
27-Ja
n-12
43,9
3124
490
05
1,00
05
26,1
6625
426
,166
116
30-Ja
n-12
28,2
4415
650
03
1,10
06
29,8
4416
422
,316
110
31-Ja
n-12
18,1
1996
400
20
018
,519
9820
,644
104
Sour
ce :
USE
.

180
FEBRUARY SEBI BULLETIN 2012T
able
38:
Set
tlem
ent
Stat
isti
cs o
f Cur
renc
y D
eriv
ativ
es S
egm
ent
(` c
rore
)
Mon
th/
Yea
r
NSE
Tota
l
MC
X-S
X
Tota
l
USE
Tota
lC
urre
ncy
Futu
res
Cur
renc
y O
ptio
nsC
urre
ncy
Futu
res
Cur
renc
y Fu
ture
sC
urre
ncy
Opt
ions
MTM
Se
ttle
men
tFi
nal
Sett
lem
ent
Prem
ium
Se
ttle
men
tEx
erci
se
Sett
lem
ent
MTM
Se
ttle
men
tFi
nal
Sett
lem
ent
MTM
Se
ttle
men
tFi
nal
Sett
lem
ent
Prem
ium
Se
ttle
men
tEx
erci
se
Sett
lem
ent
12
34
56
78
910
1112
1314
2010
-11
2,41
190
246
642,
811
2,03
057
2,08
7N
A
2011
-12$
4,92
314
11,
227
827
7,11
82,
431
702,
502
388
161
140
7
Apr
-11
187
887
2330
697
510
214
00
015
May
-11
256
784
2236
912
04
124
161
00
17
Jun-
1120
92
9212
315
972
9916
10
017
Jul-1
137
225
117
6858
215
313
166
435
00
48
Aug
-11
456
215
216
577
626
82
270
700
00
71
Sep-
1166
528
179
179
1,05
139
111
402
995
01
105
Oct
-11
599
1495
6777
626
87
275
612
00
63
Nov
-11
685
2317
210
298
236
29
371
331
00
35
Dec
-11
775
612
083
984
406
340
925
00
025
Jan-
1272
026
128
104
978
269
1528
411
10
012
NA
: Not
App
licab
le.
$ in
dica
tes
as o
n la
st t
radi
ng d
ay o
f Jan
. 201
2.So
urce
: NSE
, MC
X-S
X a
nd U
SE.
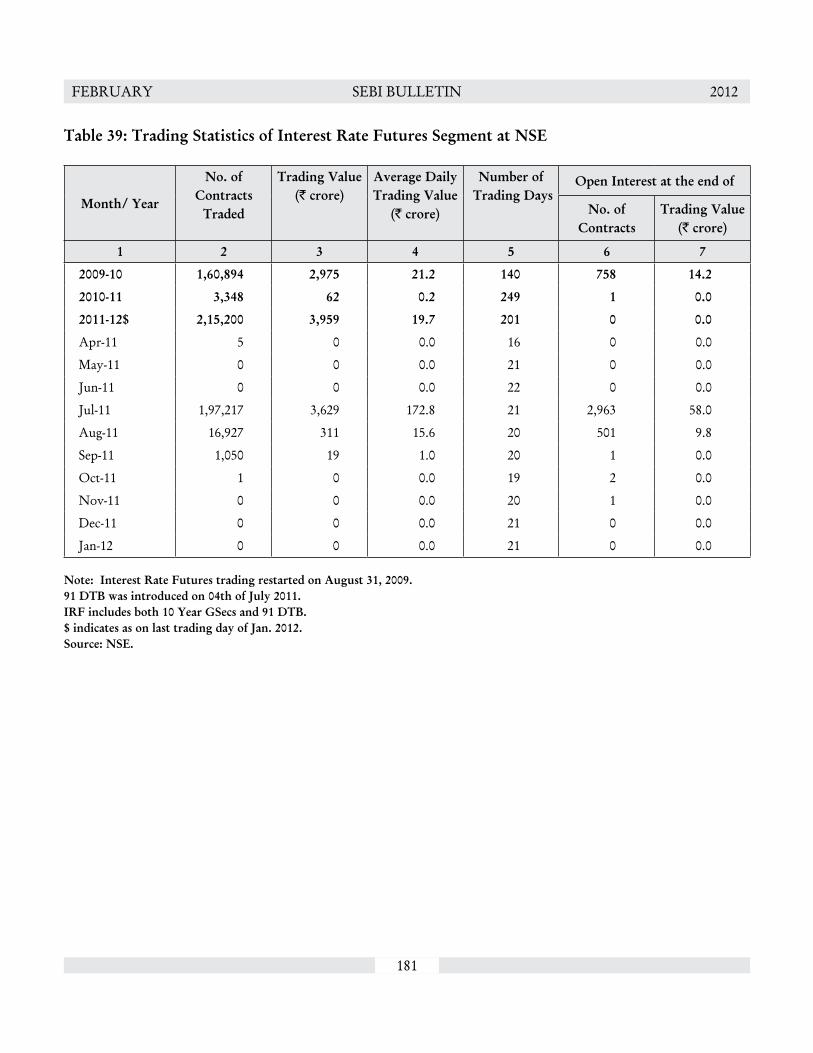
181
FEBRUARY SEBI BULLETIN 2012
Table 39: Trading Statistics of Interest Rate Futures Segment at NSE
Month/ Year
No. of Contracts
Traded
Trading Value(` crore)
Average Daily Trading Value
(` crore)
Number of Trading Days
Open Interest at the end of
No. of Contracts
Trading Value(` crore)
1 2 3 4 5 6 7
2009-10 1,60,894 2,975 21.2 140 758 14.2
2010-11 3,348 62 0.2 249 1 0.0
2011-12$ 2,15,200 3,959 19.7 201 0 0.0
Apr-11 5 0 0.0 16 0 0.0
May-11 0 0 0.0 21 0 0.0
Jun-11 0 0 0.0 22 0 0.0
Jul-11 1,97,217 3,629 172.8 21 2,963 58.0
Aug-11 16,927 311 15.6 20 501 9.8
Sep-11 1,050 19 1.0 20 1 0.0
Oct-11 1 0 0.0 19 2 0.0
Nov-11 0 0 0.0 20 1 0.0
Dec-11 0 0 0.0 21 0 0.0
Jan-12 0 0 0.0 21 0 0.0
Note: Interest Rate Futures trading restarted on August 31, 2009.91 DTB was introduced on 04th of July 2011.IRF includes both 10 Year GSecs and 91 DTB.$ indicates as on last trading day of Jan. 2012.Source: NSE.

182
FEBRUARY SEBI BULLETIN 2012
Table 40: Interest Rate Futures trading at NSE during January 2012
Date No. of Contracts Traded
Trading Value(` crore)
Open Interest
No. of contracts Value(` crore)
1 2 3 4 5
2-Jan-12 0 0.0 0 0.0
3-Jan-12 0 0.0 0 0.0
4-Jan-12 0 0.0 0 0.0
5-Jan-12 0 0.0 0 0.0
6-Jan-12 0 0.0 0 0.0
9-Jan-12 0 0.0 0 0.0
10-Jan-12 0 0.0 0 0.0
11-Jan-12 0 0.0 0 0.0
12-Jan-12 0 0.0 0 0.0
13-Jan-12 0 0.0 0 0.0
16-Jan-12 0 0.0 0 0.0
17-Jan-12 0 0.0 0 0.0
18-Jan-12 0 0.0 0 0.0
19-Jan-12 0 0.0 0 0.0
20-Jan-12 0 0.0 0 0.0
23-Jan-12 0 0.0 0 0.0
24-Jan-12 0 0.0 0 0.0
25-Jan-12 0 0.0 0 0.0
27-Jan-12 0 0.0 0 0.0
30-Jan-12 0 0.0 0 0.0
31-Jan-12 0 0.0 0 0.0
Source: NSE.
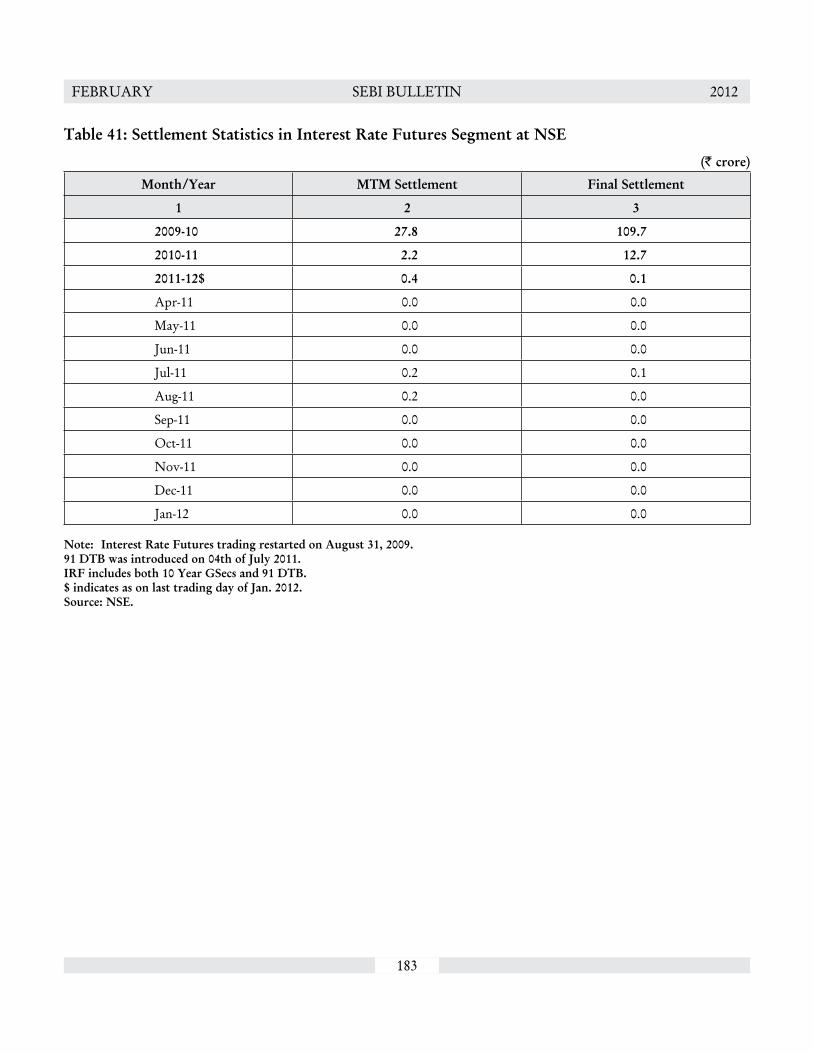
183
FEBRUARY SEBI BULLETIN 2012
Table 41: Settlement Statistics in Interest Rate Futures Segment at NSE
(` crore)
Month/Year MTM Settlement Final Settlement
1 2 3
2009-10 27.8 109.7
2010-11 2.2 12.7
2011-12$ 0.4 0.1
Apr-11 0.0 0.0
May-11 0.0 0.0
Jun-11 0.0 0.0
Jul-11 0.2 0.1
Aug-11 0.2 0.0
Sep-11 0.0 0.0
Oct-11 0.0 0.0
Nov-11 0.0 0.0
Dec-11 0.0 0.0
Jan-12 0.0 0.0
Note: Interest Rate Futures trading restarted on August 31, 2009.91 DTB was introduced on 04th of July 2011.IRF includes both 10 Year GSecs and 91 DTB.$ indicates as on last trading day of Jan. 2012.Source: NSE.
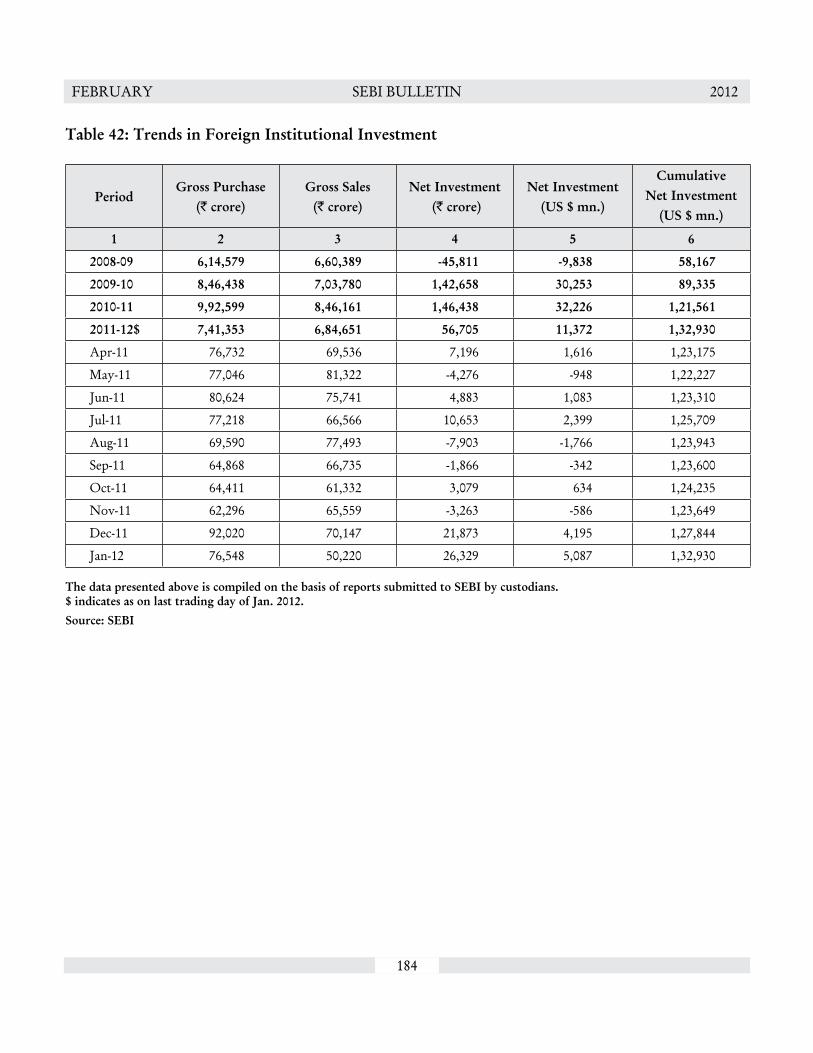
184
FEBRUARY SEBI BULLETIN 2012
Table 42: Trends in Foreign Institutional Investment
PeriodGross Purchase
(` crore)Gross Sales
(` crore)Net Investment
(` crore)Net Investment
(US $ mn.)
Cumulative Net Investment
(US $ mn.)
1 2 3 4 5 6
2008-09 6,14,579 6,60,389 -45,811 -9,838 58,167
2009-10 8,46,438 7,03,780 1,42,658 30,253 89,335
2010-11 9,92,599 8,46,161 1,46,438 32,226 1,21,561
2011-12$ 7,41,353 6,84,651 56,705 11,372 1,32,930
Apr-11 76,732 69,536 7,196 1,616 1,23,175
May-11 77,046 81,322 -4,276 -948 1,22,227
Jun-11 80,624 75,741 4,883 1,083 1,23,310
Jul-11 77,218 66,566 10,653 2,399 1,25,709
Aug-11 69,590 77,493 -7,903 -1,766 1,23,943
Sep-11 64,868 66,735 -1,866 -342 1,23,600
Oct-11 64,411 61,332 3,079 634 1,24,235
Nov-11 62,296 65,559 -3,263 -586 1,23,649
Dec-11 92,020 70,147 21,873 4,195 1,27,844
Jan-12 76,548 50,220 26,329 5,087 1,32,930
The data presented above is compiled on the basis of reports submitted to SEBI by custodians.$ indicates as on last trading day of Jan. 2012.
Source: SEBI

185
FEBRUARY SEBI BULLETIN 2012T
able
43:
Dai
ly T
rend
s in
For
eign
Ins
titu
tion
al I
nves
tmen
t du
ring
Jan
uray
201
2
Dat
e
Equi
tyD
ebt
Tot
al
Gro
ss
Purc
hase
(`
cro
re)
Gro
ss
Sa
les
(`
cro
re)
Net
In
vest
men
t(`
cro
re)
Net
In
vest
men
t (U
S $
mn.
)*
Gro
ss
Purc
hase
(`
cro
re)
Gro
ss S
ales
(`
cro
re)
Net
In
vest
men
t (`
cro
re)
Net
In
vest
men
t (U
S $
mn)
*
Gro
ss
Purc
hase
(`
cro
re)
Gro
ss S
ales
(`
cro
re)
Net
In
vest
men
t (`
cro
re)
Net
In
vest
men
t (U
S $
mn.
)*
12
34
56
78
910
1112
13
2-Ja
n-12
979
1,06
6-8
7-1
630
41,
117
-813
-153
1,28
32,
183
-900
-169
3-Ja
n-12
472
511
-39
-71,
191
105
1,08
620
41,
663
616
1,04
719
64-
Jan-
121,
357
1,03
132
661
2,19
11,
014
1,17
822
13,
548
2,04
51,
503
282
5-Ja
n-12
1,84
01,
583
257
483,
246
310
2,93
655
35,
087
1,89
33,
194
601
6-Ja
n-12
2,24
81,
699
549
104
1,33
923
81,
101
209
3,58
71,
937
1,65
031
39-
Jan-
121,
851
1,82
625
52,
271
182
2,09
039
64,
122
2,00
82,
115
401
10-Ja
n-12
1,78
91,
777
122
818
461
357
682,
607
2,23
836
970
11-Ja
n-12
2,78
32,
378
405
781,
438
860
578
111
4,22
13,
238
983
188
12-Ja
n-12
2,63
02,
132
498
962,
246
646
1,60
030
94,
876
2,77
82,
098
405
13-Ja
n-12
2,52
72,
001
525
101
3,09
229
82,
793
539
5,61
82,
300
3,31
964
016
-Jan-
122,
526
2,16
236
571
2,67
345
12,
222
432
5,19
92,
612
2,58
650
317
-Jan-
121,
991
1,54
344
787
1,17
038
478
615
23,
160
1,92
71,
234
239
18-Ja
n-12
2,97
61,
911
1,06
520
896
593
826
53,
941
2,85
01,
091
214
19-Ja
n-12
3,00
22,
041
961
190
685
873
-188
-37
3,68
82,
914
774
153
20-Ja
n-12
2,82
32,
125
698
139
480
300
180
363,
302
2,42
587
817
523
-Jan-
123,
547
2,55
099
719
889
235
858
170
4,43
92,
584
1,85
536
924
-Jan-
121,
565
1,57
8-1
3-3
1128
1-2
70-5
41,
576
1,85
9-2
83-5
625
-Jan-
122,
998
2,08
990
918
240
622
384
773,
404
2,11
11,
293
259
27-Ja
n-12
3,89
12,
718
1,17
223
414
024
9-1
10-2
24,
030
2,96
71,
063
212
30-Ja
n-12
4,09
62,
732
1,36
427
520
756
0-3
53-7
14,
303
3,29
21,
011
204
31-Ja
n-12
2,57
82,
657
-80
-16
316
787
-471
-95
2,89
33,
444
-550
-111
Tot
al50
,467
40,1
1010
,358
2,03
726
,081
10,1
1015
,971
3,04
976
,548
50,2
2026
,329
5,08
7
The
dat
a pr
esen
ted
abov
e is
com
pile
d on
the
bas
is o
f re
port
s su
bmit
ted
to S
EBI
by c
usto
dian
s on
Jan
uary
31,
201
2 an
d co
nsti
tute
s tr
ades
con
duct
ed b
y FI
Is o
n an
d up
to t
he p
revi
ous
trad
ing
day(
s).
* C
onve
rsio
n ra
te: T
he d
aily
RB
I re
fere
nce
rate
as o
n th
e tr
adin
g da
y ha
s bee
n ad
opte
d. (I
f the
trad
ing
day
is a
ban
k ho
liday
, im
med
iate
ly p
rece
ding
day
's re
fere
nce
rate
has
bee
n us
ed).
"Not
e: T
he d
ata
pert
ains
to
all t
he a
ctiv
itie
s un
dert
aken
by
FIIs
in I
ndia
n Se
curi
ties
Mar
ket,
incl
udin
g tr
ades
don
e in
sec
onda
ry m
arke
t, p
rim
ary
mar
ket
and
acti
viti
es in
volv
ed in
rig
ht/b
onus
issu
es, p
riva
te p
lace
men
t, m
erge
r &
acq
uisi
tion
, etc
."So
urce
: SEB
I.

186
FEBRUARY SEBI BULLETIN 2012
Table 44: Notional Value of Participatory Notes (PNs) Vs Assets Under Management of FIIs (in ` Crores)
Month Total value of PNs on Equity & Debt including PNs on
derivatives
Total value of PNs on Equity & Debt excluding PNs on
derivatives
Assets Under Custody of
FIIs
Total value of PNs on Equity & Debt including PNs on derivatives as %
of 4
Total value of PNs on Equity & Debt excluding PNs on
derivatives as % of 4
1 2 3 4 5 6
2011-12$ 1,57,697 1,14,092 10,43,130 15 11
Apr-11 1,66,444 1,18,230 11,06,718 15 11
May-11 2,11,199 1,61,210 10,81,996 20 15
Jun-11 1,53,291 1,07,640 10,86,388 14 10
Jul-11 1,50,414 1,02,954 10,77,096 14 10
Aug-11 1,52,288 1,00,454 9,85,893 15 10
Sep-11 1,75,291 1,15,311 9,79,164 18 12
Oct-11 1,80,002 1,16,475 10,25,530 18 11
Nov-11 1,79,035 1,17,532 9,38,098 19 13
Dec-11 1,38,711 93,563 9,17,930 15 10
Jan-12 1,57,697 1,14,092 10,43,130 15 11
$ indicates as on last trading day of Jan. 2012.Source:SEBI.

187
FEBRUARY SEBI BULLETIN 2012T
able
45:
Tre
nds
in R
esou
rce
Mob
ilisa
tion
by
Mut
ual F
unds
(`
cro
re)
Peri
od
Gro
ss M
obili
sati
onR
edem
ptio
nN
et I
nflo
w/O
utfl
owA
sset
s at
th
e E
nd o
f Pe
riod
Pvt.
Se
ctor
UT
IPu
blic
Sec
tor
Tot
al
Pvt.
Sec
tor
UT
IPu
blic
Sec
tor
Tot
al
Pvt.
Se
ctor
UT
IPu
blic
Sec
tor
Tot
al
12
34
56
78
910
1112
1314
2008
-09
42,9
2,75
14,
23,1
317,
10,4
7254
,26,
354
43,2
6,76
84,
26,7
907,
01,0
9254
,54,
650
-34,
018
-3,6
589,
380
-28,
296
4,17
,300
2009
-10
76,9
8,48
38,
81,8
5114
,38,
688
1,00
,19,
023
76,4
3,55
58,
66,1
9814
,26,
189
99,3
5,94
254
,928
15,6
5312
,499
83,0
806,
13,9
79
2010
-11
69,2
2,92
47,
83,8
5811
,52,
733
88,5
9,51
569
,42,
140
8,00
,494
11,6
6,28
889
,08,
921
-19,
215
-16,
636
-13,
555
-49,
406
5,92
,250
2011
-12$
46,8
7,70
94,
35,5
615,
11,4
8256
,34,
752
46,3
4,94
54,
28,8
375,
10,4
9955
,74,
281
52,7
646,
724
983
60,4
716,
59,1
53
Apr
-11
6,28
,601
73,6
4272
,750
7,74
,993
4,78
,539
56,2
2855
,895
5,90
,662
1,50
,062
17,4
1416
,855
1,84
,331
7,85
,374
May
-11
5,05
,533
51,2
9051
,652
6,08
,476
5,47
,245
52,8
0757
,273
6,57
,325
-41,
712
-1,5
17-1
6,85
5-4
8,85
07,
31,4
48
Jun-
114,
55,4
2542
,276
49,3
315,
47,0
324,
99,3
5052
,031
58,0
936,
09,4
74-4
3,92
5-9
,755
2,47
2-6
2,44
26,
73,1
76
Jul-1
14,
74,0
5141
,445
52,6
615,
68,1
574,
36,4
5334
,633
46,0
605,
17,1
4637
,598
6,81
26,
601
51,0
117,
28,1
87
Aug
-11
3,92
,941
32,8
7747
,172
4,72
,991
3,99
,426
38,9
2049
,242
4,87
,588
-6,4
85-6
,043
-2,0
70-1
4,59
86,
96,7
38
Sep-
114,
08,8
9246
,256
45,9
975,
01,1
454,
51,9
7948
,959
54,3
815,
55,3
18-4
3,08
7-2
,702
-8,3
84-5
4,17
36,
41,9
37
Oct
-11
4,46
,459
35,1
2648
,217
5,29
,802
4,10
,298
33,9
4544
,273
4,88
,516
36,1
611,
181
3,94
441
,287
6,95
,437
Nov
-11
4,62
,998
36,1
5445
,860
5,45
,011
4,59
,630
36,2
2045
,390
5,41
,239
3,36
8-6
647
13,
772
6,81
,655
Dec
-11
4,50
,141
35,3
9449
,704
5,35
,238
5,07
,432
37,5
9353
,633
5,98
,658
-57,
291
-2,1
99-3
,930
-63,
420
6,11
,402
Jan-
124,
62,6
6941
,103
48,1
365,
51,9
074,
44,5
9437
,502
46,2
595,
28,3
5418
,075
3,60
11,
877
23,5
536,
59,1
53
1.
Net
ass
ets
of `
388
3.24
cro
res
pert
aini
ng t
o Fu
nds
of F
unds
Sch
emes
for
Apr
'11
is n
ot in
clud
ed in
the
abo
ve d
ata.
2.
Net
ass
ets
of `
288
6.34
cro
res
pert
aini
ng t
o Fu
nds
of F
unds
Sch
emes
for
May
'11
is n
ot in
clud
ed in
the
abo
ve d
ata.
3.
Net
ass
ets
of `
426
1.96
cro
res
pert
aini
ng t
o Fu
nds
of F
unds
Sch
emes
for
Jun
e '1
1 is
not
incl
uded
in t
he a
bove
dat
a.4.
N
et a
sset
s of
` 4
503.
37 c
rore
s pe
rtai
ning
to
Fund
s of
Fun
ds S
chem
es f
or J
uly
'11
is n
ot in
clud
ed in
the
abo
ve d
ata.
5.
Net
ass
ets
of `
497
1.88
cro
res
pert
aini
ng t
o Fu
nds
of F
unds
Sch
emes
for
Aug
'11
is n
ot in
clud
ed in
the
abo
ve d
ata.
6.
Net
ass
ets
of `
549
9.56
cro
res
pert
aini
ng t
o Fu
nds
of F
unds
Sch
emes
for
Sep
'11
is n
ot in
clud
ed in
the
abo
ve d
ata.
7.
Net
ass
ets
of `
584
1.77
Cro
res
pert
aini
ng t
o Fu
nds
of F
unds
Sch
emes
for
Oct
'11
is n
ot in
clud
ed in
the
abo
ve d
ata
8.
Net
ass
ets
of `
607
6.62
cro
res
pert
aini
ng t
o Fu
nds
of F
unds
Sch
emes
for
Nov
'11
is n
ot in
clud
ed in
the
abo
ve d
ata.
9.
Net
ass
ets
of `
593
7.91
cro
res
pert
aini
ng t
o Fu
nds
of F
unds
Sch
emes
for
Dec
'11
is n
ot in
clud
ed in
the
abo
ve d
ata.
10.
Net
ass
ets
of `
617
5.24
cro
res
pert
aini
ng t
o Fu
nds
of F
unds
Sch
emes
for
Jan
'12
is n
ot in
clud
ed in
the
abo
ve d
ata.
$ in
dica
tes
as o
n la
st t
radi
ng d
ay o
f Jan
. 201
2.So
urce
: SEB
I.

188
FEBRUARY SEBI BULLETIN 2012T
able
46:
Typ
e-w
ise
Res
ourc
e M
obili
sati
on b
y M
utua
l Fun
ds :
Ope
n-en
ded
and
Clo
se-e
nded
(` c
rore
)
Sche
me
2009
-10
2010
-11
2011
-12$
Jan-
12N
et A
sset
s U
nder
M
anag
emen
t $
Sale
Purc
hase
Net
Sale
Purc
hase
Net
Sale
Purc
hase
Net
Sale
Purc
hase
Net
12
34
56
78
910
1112
1314
Ope
n-en
ded
99,7
6,36
398
,69,
736
1,06
,627
86,6
5,72
787
,88,
945
-123
,218
55,4
4,16
354
,64,
219
79,9
455,
42,5
465,
15,2
2127
,326
5,27
,869
Clo
se-
ende
d25
,551
61,6
83-3
6,13
21,
28,8
7457
,216
71,6
5880
,054
88,4
87-8
,432
8,97
312
,584
-3,6
111,
23,9
04
Inte
rval
17,1
094,
524
12,5
8564
,915
62,7
602,
154
10,5
3421
,576
-11,
042
388
550
-162
7,38
0
Tot
al1,0
0,19,0
2399
,35,
942
83,0
8088
,59,
515
89,0
8,92
1-4
9,40
656
,34,
752
55,7
4,28
160
,471
5,51
,907
5,28
,354
23,5
536,
59,1
53
1.
Net
ass
ets
of `
388
3.24
cro
res
pert
aini
ng t
o Fu
nds
of F
unds
Sch
emes
for
Apr
'11
is n
ot in
clud
ed in
the
abo
ve d
ata.
2.
Net
ass
ets
of `
288
6.34
cro
res
pert
aini
ng t
o Fu
nds
of F
unds
Sch
emes
for
May
'11
is n
ot in
clud
ed in
the
abo
ve d
ata.
3.
Net
ass
ets
of `
426
1.96
cro
res
pert
aini
ng t
o Fu
nds
of F
unds
Sch
emes
for
Jun
e '1
1 is
not
incl
uded
in t
he a
bove
dat
a.4.
N
et a
sset
s of
` 4
503.
37 c
rore
s pe
rtai
ning
to
Fund
s of
Fun
ds S
chem
es f
or J
uly
'11
is n
ot in
clud
ed in
the
abo
ve d
ata.
5.
Net
ass
ets
of `
497
1.88
cro
res
pert
aini
ng t
o Fu
nds
of F
unds
Sch
emes
for
Aug
'11
is n
ot in
clud
ed in
the
abo
ve d
ata.
6.
Net
ass
ets
of `
549
9.56
cro
res
pert
aini
ng t
o Fu
nds
of F
unds
Sch
emes
for
Sep
'11
is n
ot in
clud
ed in
the
abo
ve d
ata.
7.
Net
ass
ets
of `
584
1.77
Cro
res
pert
aini
ng t
o Fu
nds
of F
unds
Sch
emes
for
Oct
'11
is n
ot in
clud
ed in
the
abo
ve d
ata
8.
Net
ass
ets
of `
607
6.62
cro
res
pert
aini
ng t
o Fu
nds
of F
unds
Sch
emes
for
Nov
'11
is n
ot in
clud
ed in
the
abo
ve d
ata.
9.
Net
ass
ets
of `
593
7.91
cro
res
pert
aini
ng t
o Fu
nds
of F
unds
Sch
emes
for
Dec
'11
is n
ot in
clud
ed in
the
abo
ve d
ata.
10.
Net
ass
ets
of `
617
5.24
cro
res
pert
aini
ng t
o Fu
nds
of F
unds
Sch
emes
for
Jan
'12
is n
ot in
clud
ed in
the
abo
ve d
ata.
$ in
dica
tes
as o
n la
st t
radi
ng d
ay o
f Jan
. 201
2.So
urce
: SEB
I.

189
FEBRUARY SEBI BULLETIN 2012T
able
47:
Sch
eme-
wis
e R
esou
rce
Mob
ilisa
tion
by
Mut
ual F
unds
(` c
rore
)
Sche
me
2009
-10
2010
-1120
11-12
$Ja
n-12
Sale
Purc
hase
Net
Sale
Purc
hase
Net
Sale
Purc
hase
Net
Sale
Purc
hase
Net
15
67
89
108
910
1112
13A.
Inco
me/
Deb
t O
rient
ed S
chem
es
(i+
ii+iii
+iv
)99
,44,
693
98,6
3,48
581
,208
87,7
7,03
488
,17,
377
-40,
343
55,7
9,93
855
,25,
698
54,2
405,
48,2
765,
24,2
5324
,024
i. L
iquid/
Mon
ey
Mar
ket
70,4
4,81
870
,56,
891
-12,
074
65,9
9,72
466
,03,
244
-3,5
2049
,22,
777
48,6
0,20
462
,573
4,98
,102
4,71
,673
26,4
29
ii. G
ilt3,
974
7,27
1-3
,297
4,45
04,
566
-116
2,97
72,
962
1485
733
752
0 ii
i. Deb
t (ot
her t
han
assur
ed re
turn
)28
,95,
901
27,9
9,32
396
,578
21,7
2,86
022
,09,
567
-36,
707
6,54
,185
6,62
,532
-8,3
4749
,317
52,2
43-2
,925
iv.
Debt
(assu
red r
eturn
)0
00
00
00
00
00
0B.
Gro
wth/
Equi
ty
Orie
nted
Sch
emes
(i
+ii)
64,7
1462
,565
2,14
966
,592
79,7
30-1
3,13
841
,789
38,9
282,
861
3,03
03,
409
-380
i. E
LSS
3,60
02,
047
1,55
43,
450
3,18
426
61,
811
2,09
1-2
8024
516
976
ii. O
ther
s61
,114
60,5
1959
563
,142
76,5
47-1
3,40
539
,978
36,8
373,
141
2,78
53,
240
-456
C. B
alanc
ed S
chem
es4,
693
5,38
6-6
937,
490
6,14
61,
345
4,04
13,
521
520
263
364
-101
D. E
xcha
nge T
rade
d Fu
nd (i
+ii)
3,53
52,
752
783
7,70
94,
072
3,63
77,
893
5,11
52,
778
295
224
71
i. G
old E
TF99
719
480
32,
842
593
2,24
94,
856
1,52
63,
330
136
5482
ii.
Oth
er E
TFs
2,53
82,
558
-20
4,86
73,
479
1,38
83,
038
3,59
0-5
5215
917
0-1
1E.
Fun
ds o
f Fun
ds
Inve
sting
Ove
rsea
s13
8717
54-3
6768
915
96-9
071,
090
1,01
872
4310
5-6
2
Tota
l(A
+B+
C+D
+E)
1,00,1
9,023
99,3
5,94
283
,080
88,5
9,51
589
,08,
921
-49,
406
56,3
4,75
255
,74,
281
60,4
715,
51,9
075,
28,3
5423
,553
1.
Net
ass
ets
of `
388
3.24
cro
res
pert
aini
ng t
o Fu
nds
of F
unds
Sch
emes
for
Apr
'11
is n
ot in
clud
ed in
the
abo
ve d
ata.
2.
Net
ass
ets
of `
288
6.34
cro
res
pert
aini
ng t
o Fu
nds
of F
unds
Sch
emes
for
May
'11
is n
ot in
clud
ed in
the
abo
ve d
ata.
3.
Net
ass
ets
of `
426
1.96
cro
res
pert
aini
ng t
o Fu
nds
of F
unds
Sch
emes
for
Jun
e '1
1 is
not
incl
uded
in t
he a
bove
dat
a.4.
N
et a
sset
s of
` 4
503.
37 c
rore
s pe
rtai
ning
to
Fund
s of
Fun
ds S
chem
es f
or J
uly
'11
is n
ot in
clud
ed in
the
abo
ve d
ata.
5.
Net
ass
ets
of `
497
1.88
cro
res
pert
aini
ng t
o Fu
nds
of F
unds
Sch
emes
for
Aug
'11
is n
ot in
clud
ed in
the
abo
ve d
ata.
6.
Net
ass
ets
of `
549
9.56
cro
res
pert
aini
ng t
o Fu
nds
of F
unds
Sch
emes
for
Sep
'11
is n
ot in
clud
ed in
the
abo
ve d
ata.
7.
Net
ass
ets
of `
584
1.77
Cro
res
pert
aini
ng t
o Fu
nds
of F
unds
Sch
emes
for
Oct
'11
is n
ot in
clud
ed in
the
abo
ve d
ata.
8.
Net
ass
ets
of `
607
6.62
cro
res
pert
aini
ng t
o Fu
nds
of F
unds
Sch
emes
for
Nov
'11
is n
ot in
clud
ed in
the
abo
ve d
ata.
9.
Net
ass
ets
of `
593
7.91
cro
res
pert
aini
ng t
o Fu
nds
of F
unds
Sch
emes
for
Dec
'11
is n
ot in
clud
ed in
the
abo
ve d
ata.
10.
Net
ass
ets
of `
617
5.24
cro
res
pert
aini
ng t
o Fu
nds
of F
unds
Sch
emes
for
Jan
'12
is n
ot in
clud
ed in
the
abo
ve d
ata.
$ in
dica
tes
as o
n la
st t
radi
ng d
ay o
f Jan
. 201
2.So
urce
: SEB
I. S
ourc
e: S
EBI.

190
FEBRUARY SEBI BULLETIN 2012T
able
48:
Tre
nds
in T
rans
acti
ons
on S
tock
Exc
hang
es b
y M
utua
l Fun
ds(`
cro
re)
Peri
od
Equi
tyD
ebt
Tot
al
Gro
ss
Purc
hase
Gro
ss
Sale
s
Net
Pu
rcha
se/
Sale
s
Gro
ss
Purc
hase
Gro
ss
Sale
s
Net
Pu
rcha
se/
Sale
s
Gro
ss P
urch
ase
Gro
ss S
ales
Net
Pu
rcha
se/
Sale
s
12
34
56
78
910
2008
-09
1,44
,069
1,37
,085
6,98
53,
27,7
442,
45,9
4281
,803
4,71
,814
3,83
,026
88,7
87
2009
-10
1,95
,662
2,06
,173
-10,
512
6,24
,314
4,43
,728
1,80
,588
8,19
,976
6,49
,901
1,70
,076
2010
-11
1,54
,217
1,74
,018
-19,
802
7,62
,644
5,13
,493
2,49
,153
9,16
,861
6,87
,511
2,29
,352
2011
-12$
1,06
,611
1,04
,248
2,36
38,
30,1
006,
16,5
652,
13,5
359,
36,7
117,
20,8
142,
15,8
99
Apr
-11
9,63
010
,094
-464
1,01
,333
38,3
7362
,960
1,10
,963
48,4
6762
,496
May
-11
12,2
0611
,771
435
46,9
6151
,133
-4,1
7259
,167
62,9
04-3
,737
Jun-
1110
,517
9,69
382
392
,156
56,9
7335
,183
1,02
,672
66,6
6636
,006
Jul-1
111
,643
10,9
9165
266
,196
50,9
8115
,215
77,8
3961
,972
15,8
67
Aug
-11
13,6
4011
,117
2,52
459
,739
63,6
97-3
,958
73,3
8074
,814
-1,4
34
Sep-
119,
649
10,4
27-7
7786
,021
62,8
1523
,206
95,6
7073
,242
22,4
29
Oct
-11
9,30
89,
670
-362
58,0
1243
,148
14,8
6467
,320
52,8
1814
,502
Nov
-11
10,7
899,
980
810
73,2
9563
,476
9,81
984
,084
73,4
5610
,629
Dec
-11
8,80
88,
228
580
151,
983
101,
005
50,9
791,
60,7
921,
09,2
3351
,559
Jan-
1210
,421
12,2
80-1
,858
94,4
0484
,963
9,44
11,
04,8
2597
,243
7,58
2
$ in
dica
tes
as o
n la
st t
radi
ng d
ay o
f Jan
. 201
2.So
urce
: SEB
I

191
FEBRUARY SEBI BULLETIN 2012T
able
49:
Ass
et U
nder
Man
agem
ent
by P
ortf
olio
Man
ager
Yea
r/M
onth
2009
-10
2010
-11
Dec
-11
Jan-
12
Part
icul
ars
Dis
cr-
etio
nary
Non
-D
iscr
e-ti
onar
yA
dvis
ory
Dis
cre-
tion
ary
Non
-D
iscr
e-ti
onar
y
Adv
i-so
ryD
iscr
e-ti
onar
y
Non
-D
iscr
e-ti
onar
y
Adv
i-so
ryD
iscr
e-ti
onar
y
Non
-D
iscr
e-ti
onar
yA
dvis
ory
12
34
56
78
910
1112
13N
o. o
f Clie
nts
54,5
203,
771
5,73
469
,691
3,74
88,
770
68,9
324,
742
9,21
568
,543
4,91
09,
255
AU
M (`
in c
rore
)Li
sted
Equ
ity16
,358
1,35
5
-
17,2
412,
234
86,
016
*
12,8
562,
478
73,
167
*
14,9
012,
963
72,
590*
Unl
isted
Equ
ity-
-1,
286
471,
643
461,
713
46Pl
ain
Deb
t25
2,63
67,
761
255,
502
5,20
729
1,33
79,
788
342,
823
10,1
69St
ruct
ured
Deb
t-
-1,
171
888
1,61
176
51,
634
783
Equi
ty D
eriv
ativ
e-
-49
-
121
012
0M
utua
l Fun
d-
-5,
388
1,83
14,
153
2,38
04,
154
2,39
1O
ther
s4,
426
185
4,34
3 24
96,
712
358
6,98
2 36
2T
otal
273,
420
9,30
128
4,98
010
,456
318,
433
15,8
1537
2,22
016
,714
*Val
ue o
f Ass
ets
for
whi
ch A
dvis
ory
Serv
ices
are
bei
ng g
iven
.T
he a
bove
dat
a is
bas
ed o
n th
e m
onth
ly r
epor
ts r
ecei
ved
from
por
tfol
io m
anag
ers.
Sour
ce: S
EBI.

192
FEBRUARY SEBI BULLETIN 2012T
able
50:
Sub
stan
tial
Acq
uisi
tion
of S
hare
s an
d T
akeo
vers
Yea
r/M
onth
Ope
n O
ffer
sA
utom
atic
Ex
empt
ion
Obj
ecti
ves
Tot
alC
hang
e in
Con
trol
of
Man
agem
ent
Con
solid
atio
n of
Hol
ding
sSu
bsta
ntia
l A
cqui
siti
onN
o. o
f is
sue
Am
ount
(`
cro
re)
No.
of
issu
eA
mou
nt
(` c
rore
)N
o. o
f is
sue
Am
ount
(`
cro
re)
No.
of
issu
eA
mou
nt
(` c
rore
)N
o. o
f is
sue
Am
ount
(`
cro
re)
12
34
56
78
910
11
2008
-09
803,
713
1359
86
400
994,
711
227
10,5
02
2009
-10
563,
649
141,
761
644
876
5,85
820
613
,864
2010
-11
7110
,251
178,
902
1414
510
318
,748
410
28,0
42
2011
-12$
344,
384
526
13
4742
4,69
218
711
,709
Apr
-11
51,
396
00
00
51,
396
214,
520
May
-11
14
00
133
237
210
Jun-
111
30
01
82
1117
824
Jul-1
14
300
01
65
3615
5
Aug
-11
529
41
30
06
296
1118
1
Sep-
113
468
00
00
346
820
2,94
0
Oct
-11
393
32
400
05
973
481,
735
Nov
-11
41,
051
00
00
41,
051
231,
377
Dec
-11
523
00
00
523
239
Jan-
123
182
221
90
05
401
710
9
$ in
dica
tes
as o
n la
st t
radi
ng d
ay o
f Jan
. 201
2.So
urce
: SEB
I.
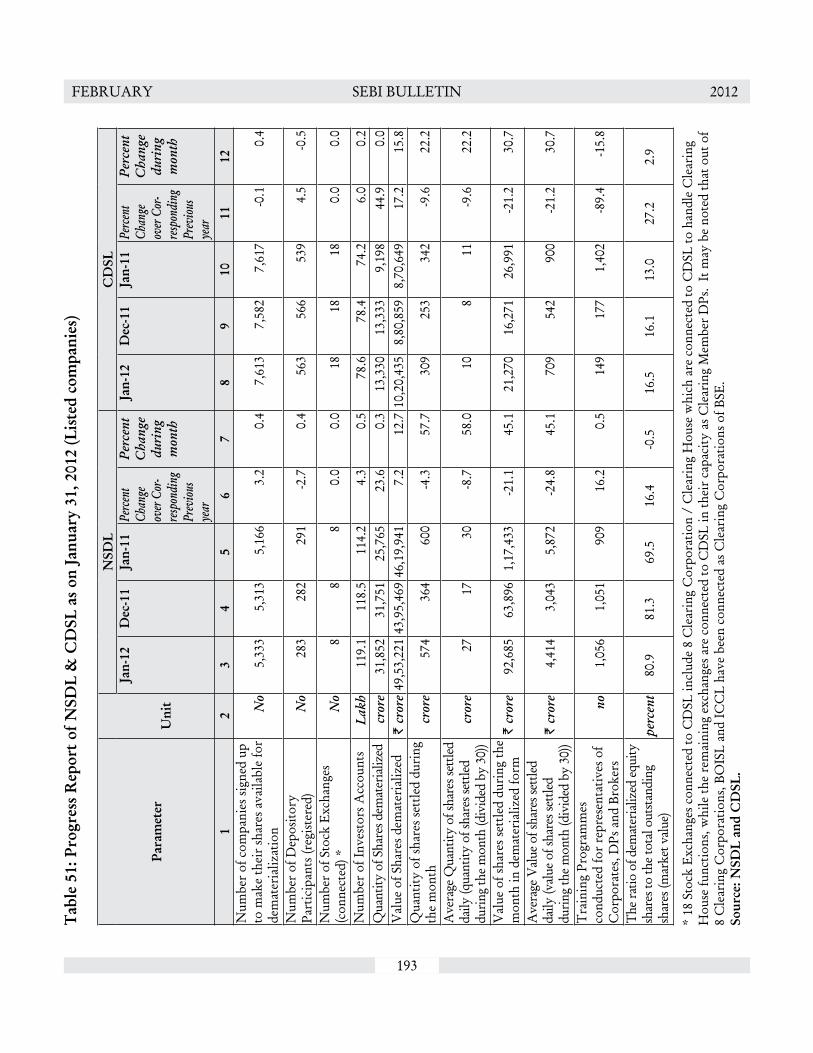
193
FEBRUARY SEBI BULLETIN 2012T
able
51:
Pro
gres
s R
epor
t of
NSD
L &
CD
SL a
s on
Jan
uary
31,
201
2 (L
iste
d co
mpa
nies
)
Para
met
erU
nit
NSD
LC
DSL
Jan-
12D
ec-1
1Ja
n-11
Perc
ent
Chan
ge
over
Cor
-re
spon
ding
Pr
eviou
s ye
ar
Perc
ent
Cha
nge
duri
ng
mon
th
Jan-
12D
ec-1
1Ja
n-11
Perc
ent
Chan
ge
over
Cor
-re
spon
ding
Pr
eviou
s ye
ar
Perc
ent
Cha
nge
duri
ng
mon
th
12
34
56
78
910
1112
Num
ber
of c
ompa
nies
sign
ed u
p to
mak
e th
eir
shar
es a
vaila
ble
for
dem
ater
ializ
atio
nN
o5,
333
5,31
35,
166
3.2
0.4
7,61
37,
582
7,61
7-0
.10.
4
Num
ber
of D
epos
itory
Pa
rtic
ipan
ts (r
egist
ered
)N
o28
328
229
1-2
.70.
456
356
653
94.
5-0
.5
Num
ber
of S
tock
Exc
hang
es
(con
nect
ed) *
No
88
80.
00.
018
1818
0.0
0.0
Num
ber
of In
vest
ors A
ccou
nts
Lakh
119.
111
8.5
114.
24.
30.
578
.678
.474
.26.
00.
2Q
uant
ity o
f Sha
res d
emat
eria
lized
cror
e31
,852
31,7
5125
,765
23.6
0.3
13,3
3013
,333
9,19
844
.90.
0V
alue
of S
hare
s dem
ater
ializ
ed`
cror
e49
,53,
221
43,9
5,46
946
,19,
941
7.2
12.7
10,2
0,43
58,
80,8
598,
70,6
4917
.215
.8Q
uant
ity o
f sha
res s
ettle
d du
ring
th
e m
onth
cror
e57
436
460
0-4
.357
.730
925
334
2-9
.622
.2
Ave
rage
Qua
ntity
of s
hare
s set
tled
daily
(qua
ntity
of s
hare
s set
tled
durin
g th
e m
onth
(div
ided
by
30))
cror
e27
1730
-8.7
58.0
108
11-9
.622
.2
Val
ue o
f sha
res s
ettle
d du
ring
the
mon
th in
dem
ater
ializ
ed fo
rm`
cror
e92
,685
63,8
961,
17,4
33-2
1.1
45.1
21,2
7016
,271
26,9
91-2
1.2
30.7
Ave
rage
Val
ue o
f sha
res s
ettle
d da
ily (v
alue
of s
hare
s set
tled
durin
g th
e m
onth
(div
ided
by
30))
` cr
ore
4,41
43,
043
5,87
2-2
4.8
45.1
709
542
900
-21.
230
.7
Tra
inin
g Pr
ogra
mm
es
cond
ucte
d fo
r re
pres
enta
tives
of
Cor
pora
tes,
DPs
and
Bro
kers
no1,
056
1,05
190
916
.20.
514
917
71,
402
-89.
4-1
5.8
The
ratio
of d
emat
eria
lized
equ
ity
shar
es to
the
tota
l out
stan
ding
sh
ares
(mar
ket v
alue
)pe
rcen
t80
.981
.369
.516
.4-0
.516
.516
.113
.027
.22.
9
* 18
Sto
ck E
xcha
nges
con
nect
ed to
CD
SL in
clud
e 8
Cle
arin
g C
orpo
ratio
n /
Cle
arin
g H
ouse
whi
ch a
re c
onne
cted
to C
DSL
to h
andl
e C
lear
ing
Hou
se fu
nctio
ns, w
hile
the
rem
aini
ng e
xcha
nges
are
con
nect
ed to
CD
SL in
thei
r ca
paci
ty a
s Cle
arin
g M
embe
r D
Ps.
It m
ay b
e no
ted
that
out
of
8 C
lear
ing
Cor
pora
tions
, BO
ISL
and
ICC
L ha
ve b
een
conn
ecte
d as
Cle
arin
g C
orpo
ratio
ns o
f BSE
.So
urce
: NSD
L an
d C
DSL
.

194
FEBRUARY SEBI BULLETIN 2012T
able
52:
Pro
gres
s of
Dem
ater
ialis
atio
n at
NSD
L an
d C
DSL
Yea
r/M
onth
NSD
LC
DSL
Com
pani
es
Live
D
Ps
Live
DPs
Loca
tion
s (N
os.)
Dem
at
Qua
ntit
y (m
illio
n sh
ares
)
Dem
at V
alue
(`
cro
re)
Com
pani
es
Live
D
Ps
Live
DPs
Loca
tion
s(N
os.)
Dem
at
Qua
ntit
y (m
illio
n sh
ares
)
Dem
at V
alue
(`
cro
re)
12
34
56
78
910
11
2008
-09
7,80
127
58,
777
2,82
,870
31,0
6,62
46,
213
461
6,93
470
,820
4,39
,703
2009
-10
8,12
428
611
,170
3,51
,138
56,1
7,84
26,
801
490
8,59
077
,950
8,38
,928
2010
-11
8,84
229
312
,767
4,71
,304
66,0
7,90
08,
030
544
10,0
521,
05,3
1010
,81,
417
2011
-12$
9,53
128
313
,916
5,64
,164
6,85
8,90
010
,849
563
10,6
751,
33,3
0010
,20,
435
Apr
-11
8,89
829
312
,898
4,74
,463
65,8
9,10
08,
265
546
10,0
961,
10,4
0011
,52,
828
May
-11
8,98
729
312
,986
4,81
,244
64,5
7,50
08,
346
550
10,1
491,
15,2
8010
,89,
116
Jun-
119,
047
295
13,1
964,
86,1
9165
,57,
900
8,46
855
39,
938
1,20
,640
10,9
6,18
7
Jul-1
19,
084
296
13,1
954,
96,2
7364
,02,
500
8,56
255
79,
861
1,22
,140
11,0
0,65
0
Aug
-11
9,15
429
713
,379
5,00
,186
60,5
8,20
08,
680
556
10,5
221,
22,1
0010
,04,
214
Sep-
119,
212
297
13,6
895,
36,0
1466
,87,
800
9,00
055
610
,639
1,30
,910
9,79
,868
Oct
-11
9,30
029
813
,752
5,43
,911
69,5
0,30
09,
178
559
10,6
661,
31,0
7010
,12,
558
Nov
-11
9,36
628
413
,832
5,48
,674
64,9
1,90
09,
273
561
10,6
651,
31,0
909,
42,0
66
Dec
-11
9,45
328
213
,866
5,59
,075
63,4
5,00
09,
412
556
10,6
681,
33,3
308,
80,8
59
Jan-
129,
531
283
13,9
165,
64,1
6468
,58,
900
10,8
4956
310
,675
1,33
,300
10,2
0,43
5
Not
e : T
he c
ount
of D
Ps in
clud
es m
ain
DPs
as
wel
l as
Bra
nch
DPs
.D
Ps L
ocat
ions
’ rep
rese
nts
the
tota
l liv
e (m
ain
DPs
and
bra
nch
DPs
as w
ell a
s no
n-liv
e (b
ack
offi
ce c
onne
cted
col
lect
ion
cent
res)
.$
indi
cate
s as
on
last
tra
ding
day
of J
an. 2
012.
Sour
ce: N
SDL
and
CD
SL.

195
FEBRUARY SEBI BULLETIN 2012T
able
53:
Ass
ets
unde
r th
e C
usto
dy o
f Cus
todi
ans
Clien
t
Perio
d
FIIS
/SAs
Fore
ign
Depo
sitor
iesFD
I In
vestm
ents
Fore
ign
Vent
ure
Capi
tal
Inve
stmen
ts
OCB
sN
RIs
Mut
ual F
unds
Corp
orate
sBa
nks
Insu
ranc
e Co
mpa
nies
Loca
l Pen
sion
Fund
sFi
nanc
ial
Insti
tutio
ns
Oth
ers
Total
No.
Amou
nt
(` cr
ore)
No.
Amou
nt
(` cr
ore)
No.
Amou
nt
(` cr
ore)
No.
Amou
nt
(` cr
ore)
No.
Amou
nt
(` cr
ore)
No.
Amou
nt(`
cror
e)N
o.Am
ount
(`
cror
e)N
o.Am
ount
(`
cror
e)N
o.Am
ount
(`
crore)
No.
Amou
nt
(` cro
re)N
o.Am
ount
(`
crore)
No.
Amou
nt
(` cr
ore)
No.
Amou
nt
(` cr
ore)
No.
Amou
nt
(` cro
re)
12
34
56
78
910
1112
1314
1516
1718
1920
2122
2324
2526
2728
29
2008
-09
3,883
3,91,9
5413
71,83
962
192
,694
7316
,579
4356
982
045
51,7
013,7
8,954
418
19,43
072
27,85
915
44,4
2,117
753,2
7420
32,00
85,3
1999
,857
13,21
215,7
7,589
2009
-106,9
989,0
0,869
701,5
6,616
919
1,45,5
5511
517
,604
391,0
111,3
761,0
711,2
095,8
4,628
1,491
29,32
873
42,59
718
97,8
0,610
9824
,266
1947
,607
10,16
61,3
1,199
22,76
228,6
2,961
2010
-117,4
7411
,06,55
077
1,85,9
311,0
481,4
6,231
144
24,00
238
1,005
979
910
1,491
5,91,9
3754
748
,723
7885
,863
218
9,08,1
1210
034
,970
3662
,600
11,02
31,5
4,242
23,25
333,5
1,076
2011
-12$
7,929
10,43
,130
771,4
2,278
1,148
2,28,1
7514
925
,980
3478
089
32,4
741,7
456,3
7,727
503
42,75
278
88,17
741
98,6
7,340
9170
,725
3560
,318
10,89
52,1
7,520
23,99
634,2
7,376
Apr-1
17,5
6511
,06,71
876
1,81,3
801,0
431,5
0,382
145
24,55
938
1,035
983
937
1,49
57,2
6,706
549
46,75
278
71,50
922
19,0
3,691
100
35,71
635
60,04
411
,007
1,54,0
7923
,335
34,63
,507
May
-117,6
5110
,81,99
676
1,72,3
801,0
591,5
0,268
147
24,69
838
976
956
930
1,534
6,81,4
1153
146
,865
7876
,614
223
8,92,4
1710
039
,662
3560
,149
10,46
11,5
3,287
22,88
933
,81,65
3
Jun-1
17,7
3010
,86,38
876
1,69,9
701,0
721,5
1,251
146
24,92
638
969
949
928
1,572
6,37,5
1152
845
,627
7776
,690
223
9,02,2
4310
141
,687
3664
,432
10,67
41,5
3,885
23,22
233
,56,50
7
Jul-1
17,6
4410
,77,09
777
1,63,0
531,0
751,5
4,319
149
24,91
737
933
943
1,833
1,592
6,95,1
3153
743
,439
7770
,896
229
8,88,2
4910
042
,725
3661
,047
10,71
41,5
5,146
23,21
033
,78,78
5
Aug-1
17,5
839,8
5,893
771,4
1,123
1,082
1,65,7
8815
025
,092
3684
894
42,5
071,5
926,5
7,605
544
46,41
277
74,24
922
98,4
6,516
9944
,148
3658
,024
10,73
61,5
4,630
23,18
532
,02,83
5
Sep-1
17,6
529,7
9,164
771,4
0,367
1,109
2,07,6
2115
025
,590
3680
694
12,4
561,6
386,1
8,064
507
44,80
377
87,54
041
08,4
6,703
9047
,169
3457
,890
10,80
11,7
1,105
23,52
232
,22,83
9
Oct-1
17,6
6610
,25,53
077
1,53,2
481,1
162,1
4,926
147
25,73
636
840
940
2,503
1,662
6,67,4
4950
645
,555
7888
,211
416
8,71,1
7891
46,56
635
61,55
810
,889
1,96,0
9623
,659
33,99
,396
Nov-1
17,6
649,3
8,098
771,3
1,885
1,090
1,31,8
8413
228
,963
3479
492
02,4
581,6
776,5
6,241
505
42,62
279
87,39
046
68,2
1,535
9221
,469
3658
,418
10,92
92,4
9,103
23,70
132
,00,26
9
Dec-1
17,8
979,1
7,930
771,2
2,056
1,146
2,10,7
7814
725
,895
3475
891
92,3
291,7
126,0
0,949
512
41,07
279
88,26
441
88,0
5,750
6424
,044
3554
,988
11,12
52,0
7,985
24,16
531
,02,79
9
Jan-12
7,929
10,43
,130
771,4
2,278
1,148
2,28,1
7514
925
,980
3478
089
32,4
741,7
456,3
7,727
503
42,75
278
88,17
741
98,6
7,340
9170
,725
3560
,318
10,89
52,1
7,520
23,99
634
,27,37
6
$ in
dica
tes
as o
n la
st t
radi
ng d
ay o
f Jan
. 201
2.So
urce
: SEB
I.

196
FEBRUARY SEBI BULLETIN 2012T
able
54:
Rat
ings
Ass
igne
d fo
r Lo
ng-t
erm
Cor
pora
te D
ebt
Secu
riti
es (M
atur
ity
≥ 1
yea
r)
Gra
de
Peri
od
Inve
stm
ent
Gra
deN
on-I
nves
tmen
t G
rade
Tot
alH
ighe
st S
afet
y (A
AA
)H
igh
Safe
ty (A
A)
Ade
quat
e Sa
fety
(A)
Mod
erat
e Sa
fety
(B
BB
)
No.
of
issu
eA
mou
nt
(` c
rore
)N
o. o
f is
sue
Am
ount
(`
cro
re)
No.
of
issu
eA
mou
nt
(` c
rore
)N
o. o
f is
sue
Am
ount
(`
cro
re)
No.
of
issu
eA
mou
nt
(` c
rore
)N
o. o
f is
sue
Am
ount
(`
cro
re)
12
34
56
78
910
1112
13
2008
-09
307
5,23
,589
349
1,38
,471
298
53,2
4052
652
,372
396
24,2
201,
876
7,91
,892
2009
-10
275
5,03
,347
321
1,41
,089
249
42,1
2169
129
,550
1,50
745
,942
3,04
37,
62,0
50
2010
-11
244
5,11
,583
267
1,82
,584
249
90,4
4557
969
,283
1,84
342
,704
3,19
99,
07,6
85
2011
-12$
158
4,66
,284
264
1,87
,467
211
69,8
1455
040
,691
2,20
842
,935
3,39
16,
97,9
40
Apr
-11
211,
22,4
547
2,05
114
27,4
0446
1,50
016
63,
118
254
1,56
,527
May
-11
191,
63,2
2832
56,5
7127
16,4
4534
1,97
716
95,
061
281
1,34
,031
Jun-
1115
34,7
5122
21,1
5416
1,70
272
1,93
420
23,
110
327
62,6
52
Jul-1
114
8,68
425
23,8
6613
5,40
846
1,31
322
63,
336
324
42,6
07
Aug
-11
731
,950
1923
,729
876
538
4,94
920
93,
838
281
65,2
32
Sep-
1123
27,0
3829
6,05
125
1,44
454
9,07
024
44,
210
375
47,8
13
Oct
-11
1121
,393
204,
448
243,
515
607,
627
233
3,85
534
840
,838
Nov
-11
725
,200
2810
,446
315,
186
583,
986
237
5,09
736
149
,915
Dec
-11
2118
,030
5426
,636
325,
174
744,
982
250
4,94
243
159
,763
Jan-
1220
13,5
5628
12,5
1621
2,77
168
3,35
427
26,
367
409
38,5
64 $
indi
cate
s as
on
last
tra
ding
day
of J
an. 2
012.
Sour
ce: C
redi
t R
atin
g A
genc
ies.
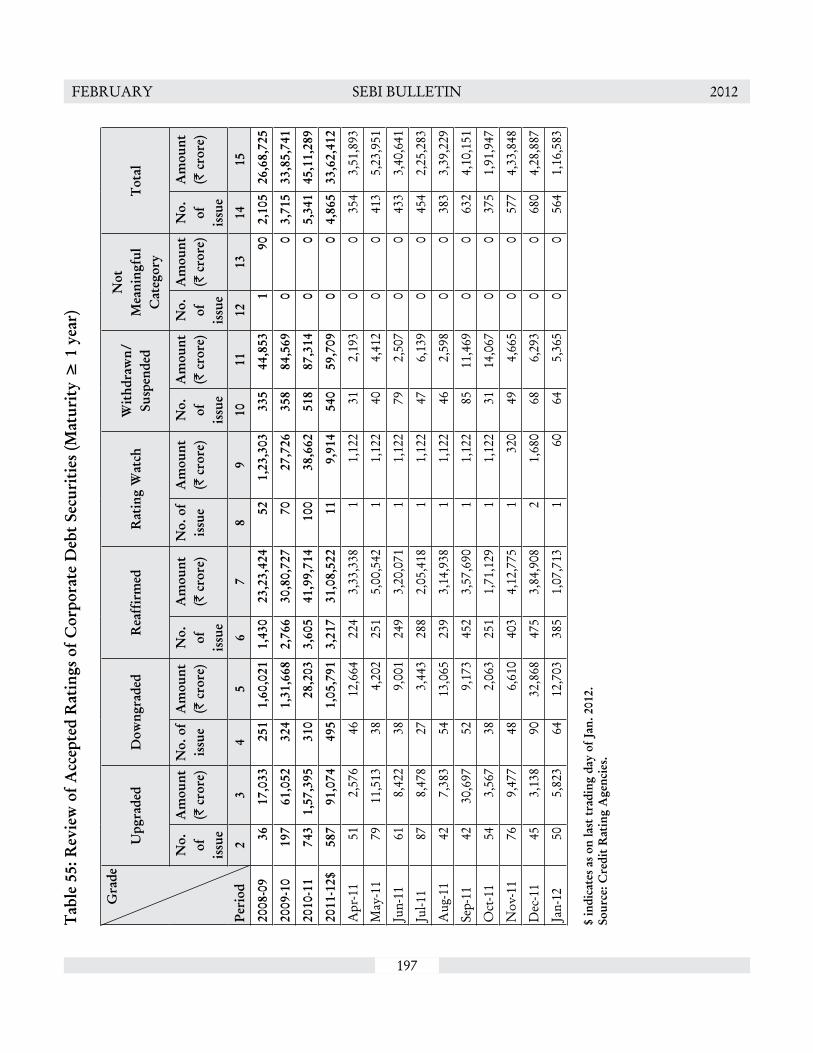
197
FEBRUARY SEBI BULLETIN 2012T
able
55:
Rev
iew
of A
ccep
ted
Rat
ings
of C
orpo
rate
Deb
t Se
curi
ties
(Mat
urit
y ≥
1 y
ear)
Gra
de
Peri
od
Upg
rade
dD
owng
rade
dR
eaff
irm
edR
atin
g W
atch
Wit
hdra
wn/
Su
spen
ded
Not
M
eani
ngfu
l C
ateg
ory
Tot
al
No.
of
is
sue
Am
ount
(`
cro
re)
No.
of
issu
eA
mou
nt
(` c
rore
)N
o.
of
issu
e
Am
ount
(`
cro
re)
No.
of
issu
eA
mou
nt
(` c
rore
)N
o.
of
issu
e
Am
ount
(`
cro
re)
No.
of
is
sue
Am
ount
(`
cro
re)
No.
of
is
sue
Am
ount
(`
cro
re)
23
45
67
89
1011
1213
1415
2008
-09
3617
,033
251
1,60
,021
1,43
023
,23,
424
521,
23,3
0333
544
,853
190
2,10
526
,68,
725
2009
-10
197
61,0
5232
41,
31,6
682,
766
30,8
0,72
770
27,7
2635
884
,569
00
3,71
533
,85,
741
2010
-11
743
1,57
,395
310
28,2
033,
605
41,9
9,71
410
038
,662
518
87,3
140
05,
341
45,1
1,28
9
2011
-12$
587
91,0
7449
51,
05,7
913,
217
31,0
8,52
211
9,91
454
059
,709
00
4,86
533
,62,
412
Apr
-11
512,
576
4612
,664
224
3,33
,338
11,
122
312,
193
00
354
3,51
,893
May
-11
7911
,513
384,
202
251
5,00
,542
11,
122
404,
412
00
413
5,23
,951
Jun-
1161
8,42
238
9,00
124
93,
20,0
711
1,12
279
2,50
70
043
33,
40,6
41
Jul-1
187
8,47
827
3,44
328
82,
05,4
181
1,12
247
6,13
90
045
42,
25,2
83
Aug
-11
427,
383
5413
,065
239
3,14
,938
11,
122
462,
598
00
383
3,39
,229
Sep-
1142
30,6
9752
9,17
345
23,
57,6
901
1,12
285
11,4
690
063
24,
10,1
51
Oct
-11
543,
567
382,
063
251
1,71
,129
11,
122
3114
,067
00
375
1,91
,947
Nov
-11
769,
477
486,
610
403
4,12
,775
132
049
4,66
50
057
74,
33,8
48
Dec
-11
453,
138
9032
,868
475
3,84
,908
21,
680
686,
293
00
680
4,28
,887
Jan-
1250
5,82
364
12,7
0338
51,
07,7
131
6064
5,36
50
056
41,
16,5
83
$ in
dica
tes
as o
n la
st t
radi
ng d
ay o
f Jan
. 201
2.So
urce
: Cre
dit
Rat
ing
Age
ncie
s.
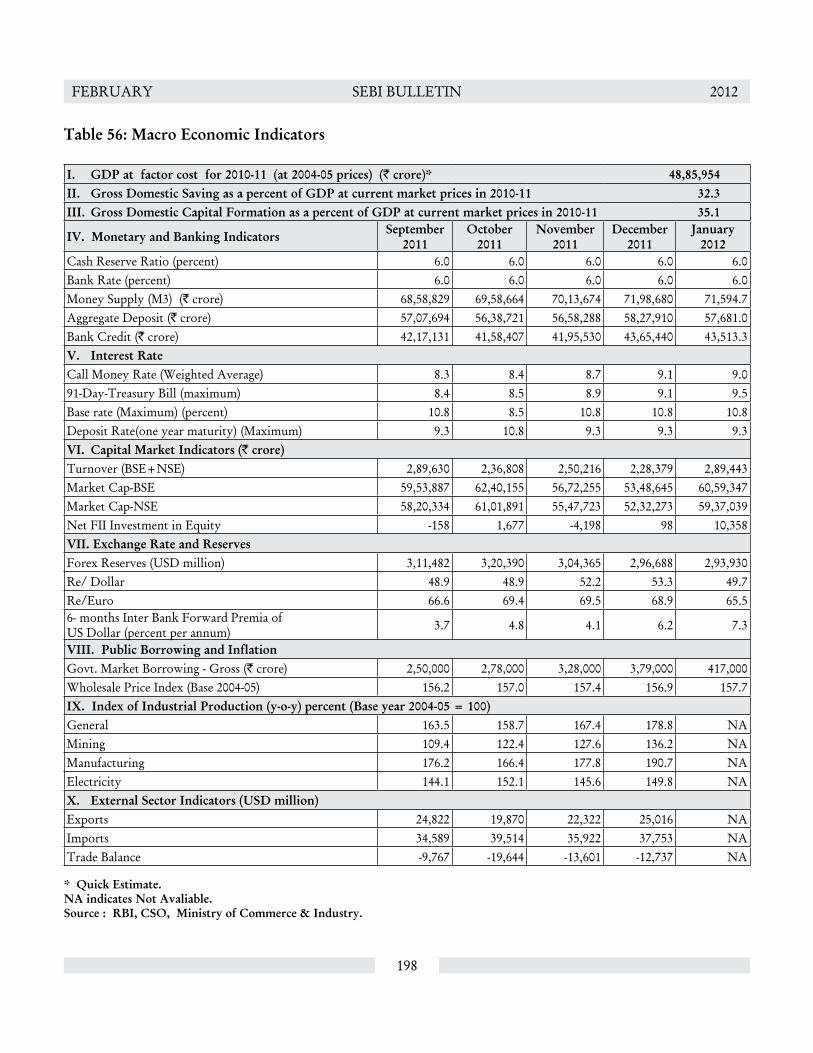
198
FEBRUARY SEBI BULLETIN 2012
Table 56: Macro Economic Indicators
I. GDP at factor cost for 2010-11 (at 2004-05 prices) (` crore)* 48,85,954II. Gross Domestic Saving as a percent of GDP at current market prices in 2010-11 32.3III. Gross Domestic Capital Formation as a percent of GDP at current market prices in 2010-11 35.1
IV. Monetary and Banking Indicators September2011
October2011
November2011
December2011
January2012
Cash Reserve Ratio (percent) 6.0 6.0 6.0 6.0 6.0Bank Rate (percent) 6.0 6.0 6.0 6.0 6.0Money Supply (M3) (` crore) 68,58,829 69,58,664 70,13,674 71,98,680 71,594.7Aggregate Deposit (` crore) 57,07,694 56,38,721 56,58,288 58,27,910 57,681.0Bank Credit (` crore) 42,17,131 41,58,407 41,95,530 43,65,440 43,513.3V. Interest Rate Call Money Rate (Weighted Average) 8.3 8.4 8.7 9.1 9.091-Day-Treasury Bill (maximum) 8.4 8.5 8.9 9.1 9.5Base rate (Maximum) (percent) 10.8 8.5 10.8 10.8 10.8Deposit Rate(one year maturity) (Maximum) 9.3 10.8 9.3 9.3 9.3VI. Capital Market Indicators (` crore)Turnover (BSE+NSE) 2,89,630 2,36,808 2,50,216 2,28,379 2,89,443Market Cap-BSE 59,53,887 62,40,155 56,72,255 53,48,645 60,59,347Market Cap-NSE 58,20,334 61,01,891 55,47,723 52,32,273 59,37,039Net FII Investment in Equity -158 1,677 -4,198 98 10,358VII. Exchange Rate and ReservesForex Reserves (USD million) 3,11,482 3,20,390 3,04,365 2,96,688 2,93,930Re/ Dollar 48.9 48.9 52.2 53.3 49.7Re/Euro 66.6 69.4 69.5 68.9 65.56- months Inter Bank Forward Premia of US Dollar (percent per annum) 3.7 4.8 4.1 6.2 7.3
VIII. Public Borrowing and InflationGovt. Market Borrowing - Gross (` crore) 2,50,000 2,78,000 3,28,000 3,79,000 417,000Wholesale Price Index (Base 2004-05) 156.2 157.0 157.4 156.9 157.7IX. Index of Industrial Production (y-o-y) percent (Base year 2004-05 = 100)General 163.5 158.7 167.4 178.8 NAMining 109.4 122.4 127.6 136.2 NAManufacturing 176.2 166.4 177.8 190.7 NAElectricity 144.1 152.1 145.6 149.8 NAX. External Sector Indicators (USD million)Exports 24,822 19,870 22,322 25,016 NAImports 34,589 39,514 35,922 37,753 NATrade Balance -9,767 -19,644 -13,601 -12,737 NA * Quick Estimate.NA indicates Not Avaliable.Source : RBI, CSO, Ministry of Commerce & Industry.

199
FEBRUARY SEBI BULLETIN 2012T
able
57:
Dai
ly R
etur
n an
d V
olat
ility
: Sel
ect
Wor
ld S
tock
Ind
ices
(Per
cent
)
Cal
enda
r
Year
USA
DO
W JO
NES
UK
FTSE
100
Fran
ce
CA
C
Aus
tral
ia
AS
30
Hon
g K
ong
HSI
Sing
apor
e
STI
Mal
aysia
KLC
I
Ret
urn
Vol
atili
tyR
etur
n V
olat
ility
Ret
urn
Vol
atili
tyR
etur
n V
olat
ility
Ret
urn
Vol
atili
tyR
etur
n V
olat
ility
Ret
urn
Vol
atili
ty
12
34
56
78
910
1112
1314
15
2007
0.02
0.92
0.15
1.10
-0.1
41.
070.
051.
040.
131.
660.
061.
360.
111.
04
2008
-0.1
82.
55-0
.15
2.40
-0.2
02.
59-0
.17
1.95
-0.2
13.
01-0
.23
2.20
-0.1
41.
12
2009
0.06
1.52
0.07
1.47
0.06
1.66
0.11
1.28
0.15
2.04
0.18
1.63
0.14
0.80
2010
0.00
1.07
-0.0
11.
12-0
.10
1.54
-0.0
61.
02-0
.03
1.14
-0.0
10.
870.
100.
56
2011
0.05
1.35
-0.0
51.
37-0
.03
1.82
-0.0
51.
19-0
.14
1.62
-0.1
51.
15-0
.03
0.73
2012
$0.
100.
41-0
.02
0.75
0.11
1.16
0.21
0.83
0.45
1.20
0.43
0.97
0.03
0.44
(Con
tinu
ed)
Tab
le 5
7: D
aily
Ret
urn
and
Vol
atili
ty: S
elec
t W
orld
Sto
ck I
ndic
es
(Con
cld.
)(P
erce
nt)
Cal
enda
r
Year
Braz
il
IBO
V
Mex
ico
MEX
BOL
Sout
h A
fric
a
JALS
H
Japa
n
NK
Y
Chi
na
SHC
OM
P
Indi
a
BSE
SEN
SEX
Indi
a
S&P
CN
X N
IFTY
Ret
urn
Vol
atili
tyR
etur
n V
olat
ility
Ret
urn
Vol
atili
tyR
etur
n V
olat
ility
Ret
urn
Vol
atili
tyR
etur
n V
olat
ility
Ret
urn
Vol
atili
ty
116
1718
1920
2122
2324
2526
2728
29
2007
0.14
1.73
0.04
1.36
0.06
1.20
-0.0
51.
170.
272.
240.
161.
540.
181.
60
2008
-0.1
63.
35-0
.18
2.35
-0.1
52.
32-0
.18
2.94
-0.4
32.
85-0
.20
2.79
-0.1
82.
66
2009
0.27
1.84
0.22
1.64
0.15
1.47
0.14
1.63
0.21
1.91
0.30
2.08
0.29
2.06
2010
-0.0
31.
310.
010.
950.
001.
12-0
.12
1.37
-0.1
21.
400.
020.
990.
031.
01
2011
-0.1
51.
58-0
.07
1.26
0.01
1.21
-0.0
71.
53-0
.03
1.16
-0.2
31.
31-0
.23
1.31
2012
$0.
430.
910.
010.
950.
150.
610.
160.
890.
391.
820.
491.
110.
551.
15
$ in
dica
tes
as o
n la
st t
radi
ng d
ay o
f Ja
n 20
12.
Sour
ce:
Blo
ombe
rg.

200
FEBRUARY SEBI BULLETIN 2012
PUBLICATIONS
1. Annual Reports : 2010-11
2. Handbook of Statistics on Indian Securities Market, 2010
Interested persons may contact the Department of Economic and Policy Analysis of SEBI to obtain a copy of Annual Report/Handbook of Statistics at the following address:
Department of Economic and Policy AnalysisSecurities and Exchange Board of IndiaPlot No. C4-A, ‘G’ Block,Bandra Kurla Complex,Bandra (E), Mumbai-400051
Tel no. +91-2226449000Fax no. +91-222669021


