
Monitoring EMC VNX Unified
Storage
eG Enterprise v6

Restricted Rights Legend
The information contained in this document is confidential and subject to change without notice. No part of this
document may be reproduced or disclosed to others without the prior permission of eG Innovations, Inc. eG
Innovations, Inc. makes no warranty of any kind with regard to the software and documentation, including, but not
limited to, the implied warranties of merchantability and fitness for a particular purpose.
Trademarks
Microsoft Windows, Windows NT, Windows 2000, Windows 2003 and Windows 2008 are either registered trademarks
or trademarks of Microsoft Corporation in United States and/or other countries.
The names of actual companies and products mentioned herein may be the trademarks of their respective owners.
Copyright
© 2015 eG Innovations, Inc. All rights reserved.
The copyright in this document belongs to eG Innovations, Inc. Complying with all applicable copyright laws is the
responsibility of the user.
Table of Contents
........................................................................................................................................ INTRODUCTION
...................................................................................................................................................................................................................... 1
1.1 How does eG Enterprise Monitor the VNX Unified Storage System? ................................................................................... 3
1.2 Pre-requisites for Monitoring EMC VNX ................................................................................................................................ 4
.................................................................................. THE VNX UNIFIED STORAGE MONITORING MODEL
...................................................................................................................................................................................................................... 5
2.1 The Hardware Layer................................................................................................................................................................... 5
2.1.1 Vnx Disk Array Enclosures Test....................................................................................................................................... 6
2.2 The Network Layer ..................................................................................................................................................................10
2.2.1 Network Traffic Test........................................................................................................................................................10
2.3 The Physical Storage Layer .....................................................................................................................................................12
2.3.1 Vnx Disks Test .................................................................................................................................................................12
2.4 The Storage Processor Layer ...................................................................................................................................................16
2.4.1 Storage Processor Cache Test .........................................................................................................................................17
2.4.2 Vnx Storage Ports Test ....................................................................................................................................................29
2.4.3 Vnx Storage Processors Test ...........................................................................................................................................32
2.4.4 Data Mover Cache Test ...................................................................................................................................................35
2.5 The Data Movers Layer ...........................................................................................................................................................37
2.5.1 DataMovers Performance Test ........................................................................................................................................37
2.5.2 Vnx Statmon Service Test ...............................................................................................................................................39
2.6 The File Access Protocols Layer .............................................................................................................................................41
2.6.1 CIFS Performance Test....................................................................................................................................................41
2.6.2 NFS Performance Test .....................................................................................................................................................44
2.7 The Logical Storage Layer ......................................................................................................................................................46
2.7.1 File System Space Usage Test ........................................................................................................................................47
2.7.2 Storage Pools Test ............................................................................................................................................................49
2.7.3 Storage Pools for Block Test ...........................................................................................................................................50
2.7.4 Vnx LUNs Test ................................................................................................................................................................52
2.7.5 Disk Volumes Test ...........................................................................................................................................................57
2.7.6 Meta Volumes Test ..........................................................................................................................................................58
............................................................................................................................................ CONCLUSION
....................................................................................................................................................................................................................61
Table of Contents
INTRODUCTION..................................................................................................................................................................................... 1
1.1 How does eG Enterprise Monitor the VNX Unified Storage System? ................................................................................... 3
1.2 Pre-requisites for Monitoring EMC VNX ................................................................................................................................ 4
THE VNX UNIFIED STORAGE MONITORING MODEL ............................................................................................................ 5
2.1 The Hardware Layer................................................................................................................................................................... 5
2.1.1 Vnx Disk Array Enclosures Test....................................................................................................................................... 6
2.2 The Network Layer ..................................................................................................................................................................10
2.2.1 Network Traffic Test........................................................................................................................................................10
2.3 The Physical Storage Layer .....................................................................................................................................................12
2.3.1 Vnx Disks Test .................................................................................................................................................................12
2.4 The Storage Processor Layer ...................................................................................................................................................16
2.4.1 Storage Processor Cache Test .........................................................................................................................................17
2.4.2 Vnx Storage Ports Test ....................................................................................................................................................29
2.4.3 Vnx Storage Processors Test ...........................................................................................................................................32
2.4.4 Data Mover Cache Test ...................................................................................................................................................35
2.5 The Data Movers Layer ...........................................................................................................................................................37
2.5.1 DataMovers Performance Test ........................................................................................................................................37
2.5.2 Vnx Statmon Service Test ...............................................................................................................................................39
2.6 The File Access Protocols Layer .............................................................................................................................................41
2.6.1 CIFS Performance Test....................................................................................................................................................41
2.6.2 NFS Performance Test .....................................................................................................................................................44
2.7 The Logical Storage Layer ......................................................................................................................................................46
2.7.1 File System Space Usage Test ........................................................................................................................................47
2.7.2 Storage Pools Test ............................................................................................................................................................49
2.7.3 Storage Pools for Block Test ...........................................................................................................................................50
2.7.4 Vnx LUNs Test ................................................................................................................................................................52
2.7.5 Disk Volumes Test ...........................................................................................................................................................57
2.7.6 Meta Volumes Test ..........................................................................................................................................................58
CONCLUSION ........................................................................................................................................................................................61
INT R OD UC T ION
1
Introduction EMC combines its Clariion and Celerra products to offer the EMC VNX Unified Storage. This is a robust platform for
consolidation of legacy block storage, file servers, and direct-attached application storage, and enables organizations
to cost-effectively manage multi-protocol file systems and multi-protocol block storage access.
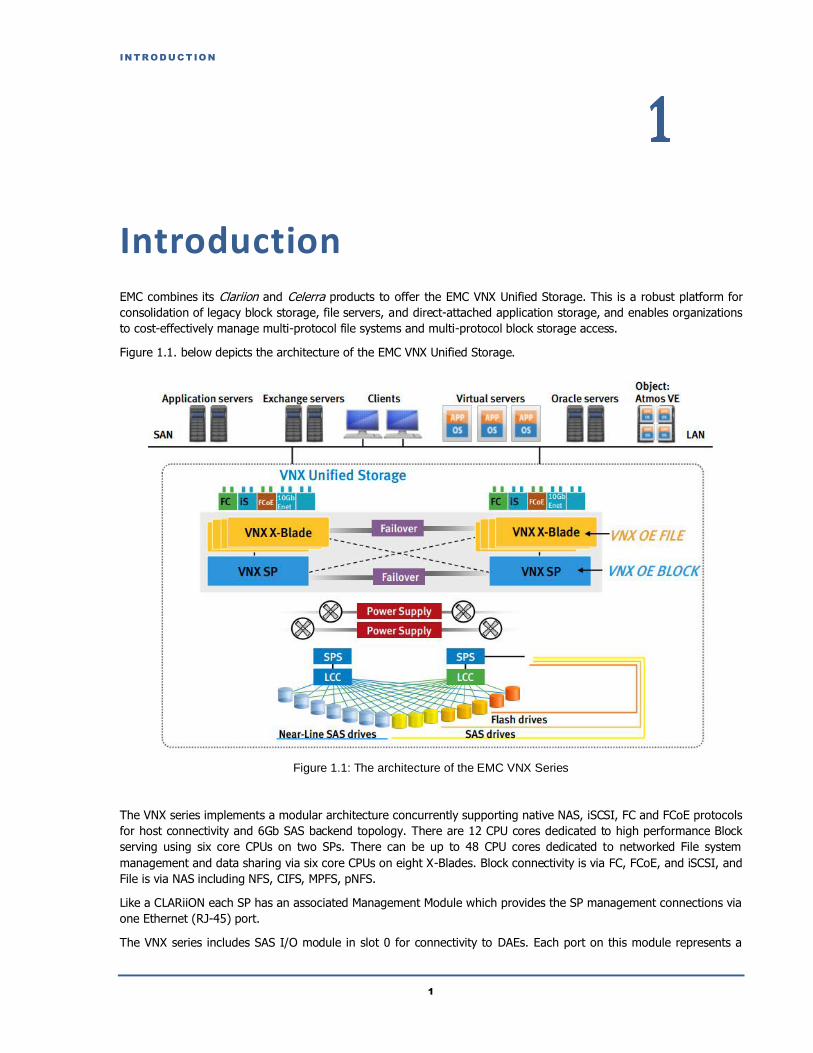
Figure 1.1. below depicts the architecture of the EMC VNX Unified Storage.
Figure 1.1: The architecture of the EMC VNX Series
The VNX series implements a modular architecture concurrently supporting native NAS, iSCSI, FC and FCoE protocols
for host connectivity and 6Gb SAS backend topology. There are 12 CPU cores dedicated to high performance Block
serving using six core CPUs on two SPs. There can be up to 48 CPU cores dedicated to networked File system
management and data sharing via six core CPUs on eight X-Blades. Block connectivity is via FC, FCoE, and iSCSI, and
File is via NAS including NFS, CIFS, MPFS, pNFS.
Like a CLARiiON each SP has an associated Management Module which provides the SP management connections via
one Ethernet (RJ-45) port.
The VNX series includes SAS I/O module in slot 0 for connectivity to DAEs. Each port on this module represents a

INT R OD UC T ION
2
backend bus. The number of ports depends on system model. An 8 Gb FC I/O Module, located in slot 4, provide
connectivity to the X-Blades (NAS head). They are factory installed in unified and file only systems. The rest of the
I/O slots are used for block server access.
VNX DPE components include redundant SPs, two Power Supply/Cooling Modules, and the first set of drives for the
VNX5500, VNX5300, and VNX5100 storage systems. The VNX DPE has the same management and service
connections as the SPE based models. There are two RS-232 DB-9 serial ports, a Power LED and Fault LED, and two
RJ-45 ports.
The VNX series comes with 2 DAE options: a 2U DAE may contain up to 25 2.5 inch, 6Gbit SAS drives and a 3U DAE
may contain up to 15 3.5 inch, 6Gb SAS drives. Both types of DAEs may be installed in the same array. Each DAE
can contain a mixture of all drive types (Flash, SAS, and NL SAS). The DAEs are connected via a 4 lane, 6Gb/s per
lane connection which results in a 24Gb/s SAS connection.
The DAE includes 15 disk drives, two Link Control Cards (LCC A and LCC B), and two Power Supply/Cooling Modules
(PS A and PS B). The LCCs and Power Supplies are locked into place using captive screws to ensure proper
connection to the midplane.
The VNX series Data Mover Enclosure can contain one or two X-Blades. The X-Blades provide File connectivity via
DART Operating System. X-Blades include a four port 8 Gb Fibre Channel I/O Module in slot 0. Two ports are for
connectivity to the Storage Processors and two are for connectivity to a backup tape device. The rest of the I/O slots
are used for File connectivity and there must be at least one network I/O Module in each X-Blade. The VNX series
storage systems also support X-Blade failover.
Owing to this ‘fail-proof’ architecture, the EMC VNX series is widely used in large physical and
virtualized server farms to provide reliable storage services. As data integrity and accessibility is key
in such environments, even the smallest of slips in the performance of this storage platform - be it a
gradual erosion of storage space in a file system, a slight increase in the I/O activity on a disk, or a
negligible dip in cache hits - will not be tolerated. To ensure the 24x7 availability and peak
performance of the EMC VNX series, administrators need to closely monitor the operations and overall
health of the storage platform, promptly detect abnormalities, and fix them before end-users notice.
eG Enterprise offers a specialized Vnx Unified Storage monitoring model that monitors each of the key indicators
of the performance of EMC VNX - such as the disks, file systems, volumes, DAEs, LUNs, etc. - and proactively alerts
administrators to potential performance bottlenecks, so that administrators can resolve the issues well before end-
users complain.
Figure 1.2: The layer model of Vnx Unified Storage
Each layer of Figure 1.2 above is mapped to a variety of tests, each of which report a wealth of performance
information related to the VNX unified storage. Using these metrics, administrators can find quick and accurate
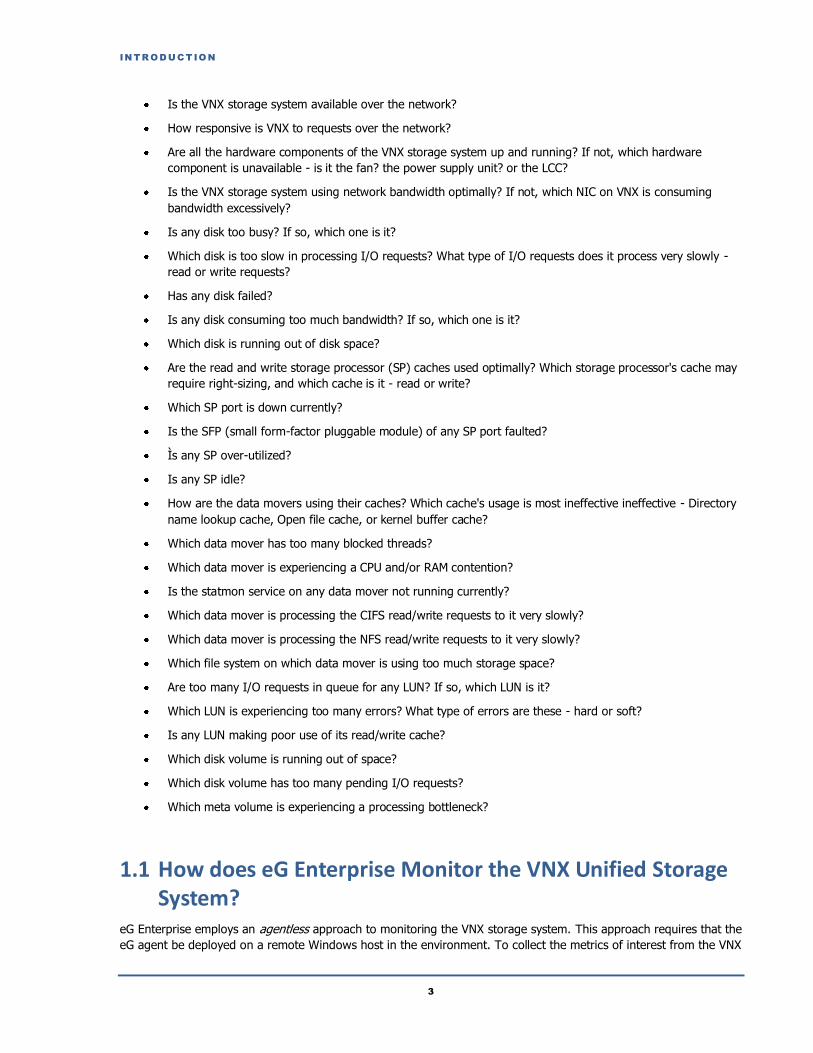
answers to the following performance queries:
INT R OD UC T ION
3
Is the VNX storage system available over the network?
How responsive is VNX to requests over the network?
Are all the hardware components of the VNX storage system up and running? If not, which hardware
component is unavailable - is it the fan? the power supply unit? or the LCC?
Is the VNX storage system using network bandwidth optimally? If not, which NIC on VNX is consuming
bandwidth excessively?
Is any disk too busy? If so, which one is it?
Which disk is too slow in processing I/O requests? What type of I/O requests does it process very slowly -
read or write requests?
Has any disk failed?
Is any disk consuming too much bandwidth? If so, which one is it?
Which disk is running out of disk space?
Are the read and write storage processor (SP) caches used optimally? Which storage processor's cache may
require right-sizing, and which cache is it - read or write?
Which SP port is down currently?
Is the SFP (small form-factor pluggable module) of any SP port faulted?
Ìs any SP over-utilized?
Is any SP idle?
How are the data movers using their caches? Which cache's usage is most ineffective ineffective - Directory
name lookup cache, Open file cache, or kernel buffer cache?
Which data mover has too many blocked threads?
Which data mover is experiencing a CPU and/or RAM contention?
Is the statmon service on any data mover not running currently?
Which data mover is processing the CIFS read/write requests to it very slowly?
Which data mover is processing the NFS read/write requests to it very slowly?
Which file system on which data mover is using too much storage space?
Are too many I/O requests in queue for any LUN? If so, which LUN is it?
Which LUN is experiencing too many errors? What type of errors are these - hard or soft?
Is any LUN making poor use of its read/write cache?
Which disk volume is running out of space?
Which disk volume has too many pending I/O requests?
Which meta volume is experiencing a processing bottleneck?
1.1 How does eG Enterprise Monitor the VNX Unified Storage System?
eG Enterprise employs an agentless approach to monitoring the VNX storage system. This approach requires that the
eG agent be deployed on a remote Windows host in the environment. To collect the metrics of interest from the VNX

INT R OD UC T ION
4
storage system, this agent uses the following command line interfaces:
The Navisphere CLI, for monitoring the block-only storage systems in the Unified storage device
The CLI on the Control station, for monitoring the file-only storage systems in the Unified storage device
The pre-requisites that need to be fulfilled to use these command line interfaces have been detailed in the next
section.
1.2 Pre-requisites for Monitoring EMC VNX To enable the eG agent to monitor the file-only storage systems in the VNX Unified storage device, the following pre-
requisites should be fulfilled:
a. The storage device should be managed in the eG Enterprise system using the IP address of the Control
station that hosts the CLI for file-only storage systems;
b. SSH communication should be enabled between the eG agent host and the Control station. To achieve this,
ensure that the SSH port (default: 22) is opened in the firewall (if any) between the eG agent and the
control station.
c. When adding the storage device for monitoring (in the eG admin interface), make sure that the credentials
of the nasadmin user are configured therein to allow the eG agent to run the CLI for file-only storage
systems and collect metrics.
To enable the eG agent to monitor the block-only storage systems in the VNX Unified storage device, the following
pre-requisites should be fulfilled:
The eG agent should be deployed on the same host on which the NaviSphere CLI (i.e., the NaviSecCLI.exe)
operates;
The NaviSphere CLI should run on a host that can communicate with the storage system
All the eG tests that monitor the block storage should be configured with the full path to the NaviSecCLI.exe
and the credentials of a user with Administrator access to the block storage.
All the eG tests that monitor the block storage should be configured with the IP address of the storage
controller.
Once the aforesaid requirements are fulfilled, the eG agent will report a plethora of useful metrics revealing the
health of the VNX storage system and present these performance statistics in the eG monitoring model using the
hierarchical layer model representation of Figure 1.2.
The chapter that follows will discuss each layer of Figure 1.2 in great detail.

T HE V NX UNIF IE D S T OR A GE MONIT OR ING MOD E L
5
The VNX Unified Storage Monitoring Model This chapter deep dives into every layer of the VNX Unified Storage monitoring model, the tests mapped to each
layer, and the measures every test reports.
2.1 The Hardware Layer The tests mapped to this layer report on the overall health of the hardware supporting the VNX storage system.
Figure 1: The tests mapped to the Hardware layer
T HE V NX UNIF IE D S T OR A GE MONIT OR ING MOD E L
6
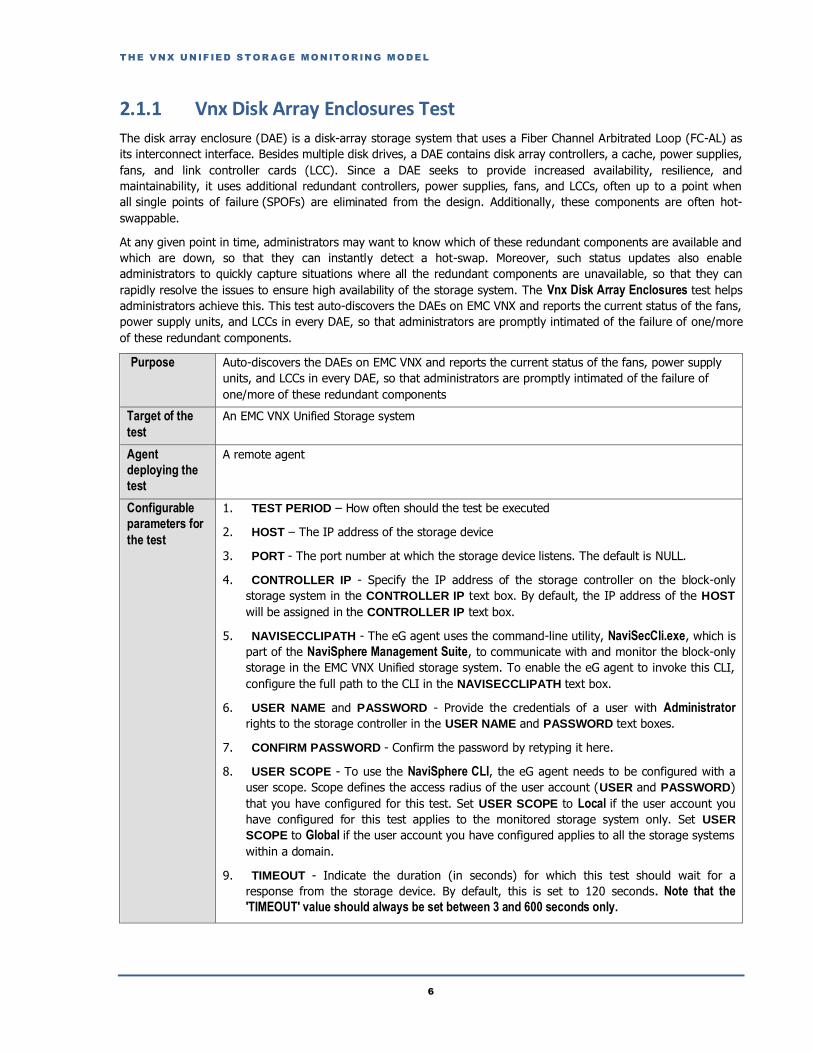
2.1.1 Vnx Disk Array Enclosures Test
The disk array enclosure (DAE) is a disk-array storage system that uses a Fiber Channel Arbitrated Loop (FC-AL) as
its interconnect interface. Besides multiple disk drives, a DAE contains disk array controllers, a cache, power supplies,
fans, and link controller cards (LCC). Since a DAE seeks to provide increased availability, resilience, and
maintainability, it uses additional redundant controllers, power supplies, fans, and LCCs, often up to a point when
all single points of failure (SPOFs) are eliminated from the design. Additionally, these components are often hot-
swappable.
At any given point in time, administrators may want to know which of these redundant components are available and
which are down, so that they can instantly detect a hot-swap. Moreover, such status updates also enable
administrators to quickly capture situations where all the redundant components are unavailable, so that they can
rapidly resolve the issues to ensure high availability of the storage system. The Vnx Disk Array Enclosures test helps
administrators achieve this. This test auto-discovers the DAEs on EMC VNX and reports the current status of the fans,
power supply units, and LCCs in every DAE, so that administrators are promptly intimated of the failure of one/more
of these redundant components.
Purpose Auto-discovers the DAEs on EMC VNX and reports the current status of the fans, power supply
units, and LCCs in every DAE, so that administrators are promptly intimated of the failure of
one/more of these redundant components
Target of the
test
An EMC VNX Unified Storage system
Agent
deploying the
test
A remote agent
Configurable
parameters for
the test
1. TEST PERIOD – How often should the test be executed
2. HOST – The IP address of the storage device
3. PORT - The port number at which the storage device listens. The default is NULL.
4. CONTROLLER IP - Specify the IP address of the storage controller on the block-only
storage system in the CONTROLLER IP text box. By default, the IP address of the HOST
will be assigned in the CONTROLLER IP text box.
5. NAVISECCLIPATH - The eG agent uses the command-line utility, NaviSecCli.exe, which is
part of the NaviSphere Management Suite, to communicate with and monitor the block-only
storage in the EMC VNX Unified storage system. To enable the eG agent to invoke this CLI,
configure the full path to the CLI in the NAVISECCLIPATH text box.
6. USER NAME and PASSWORD - Provide the credentials of a user with Administrator
rights to the storage controller in the USER NAME and PASSWORD text boxes.
7. CONFIRM PASSWORD - Confirm the password by retyping it here.
8. USER SCOPE - To use the NaviSphere CLI, the eG agent needs to be configured with a
user scope. Scope defines the access radius of the user account (USER and PASSWORD)
that you have configured for this test. Set USER SCOPE to Local if the user account you
have configured for this test applies to the monitored storage system only. Set USER
SCOPE to Global if the user account you have configured applies to all the storage systems
within a domain.
9. TIMEOUT - Indicate the duration (in seconds) for which this test should wait for a
response from the storage device. By default, this is set to 120 seconds. Note that the
'TIMEOUT' value should always be set between 3 and 600 seconds only.

T HE V NX UNIF IE D S T OR A GE MONIT OR ING MOD E L
7
Outputs of the
test
One set of results for each DAE on the EMC VNX Unified Storage system
Measurements
made by the
test
Measurement Measurement
Unit Interpretation
Fan A state:
Indicates the current state
of fan A in this DAE.
If fan A is unavailable, then this measure will
return the value N/A. On the other hand, if
fan A is available, then the value of this
measure will be Present.
The numeric values that correspond to each
of the states discussed above are as follows:
Numeric
Value
Measure
Value
1 Present
2 N/A
By default, this measure
reports the values Present or
N/A to indicate the status of
fan A. The graph of this
measure however,
represents the status of fan
A using the numeric
equivalents only - i.e., 1 or 2.
Fan B state:
Indicates the current state
of fan A in this DAE.
If fan B is unavailable, then this measure will
return the value N/A. On the other hand, if
fan B is available, then the value of this
measure will be Present.
The numeric values that correspond to each
of the states discussed above are as follows:
Numeric
Value
Measure
Value
1 Present
2 N/A
By default, this measure
reports the values Present or
N/A to indicate the status of
fan B. The graph of this
measure however,
represents the status of fan
B using the numeric
equivalents only - i.e., 1 or 2.
T HE V NX UNIF IE D S T OR A GE MONIT OR ING MOD E L
8
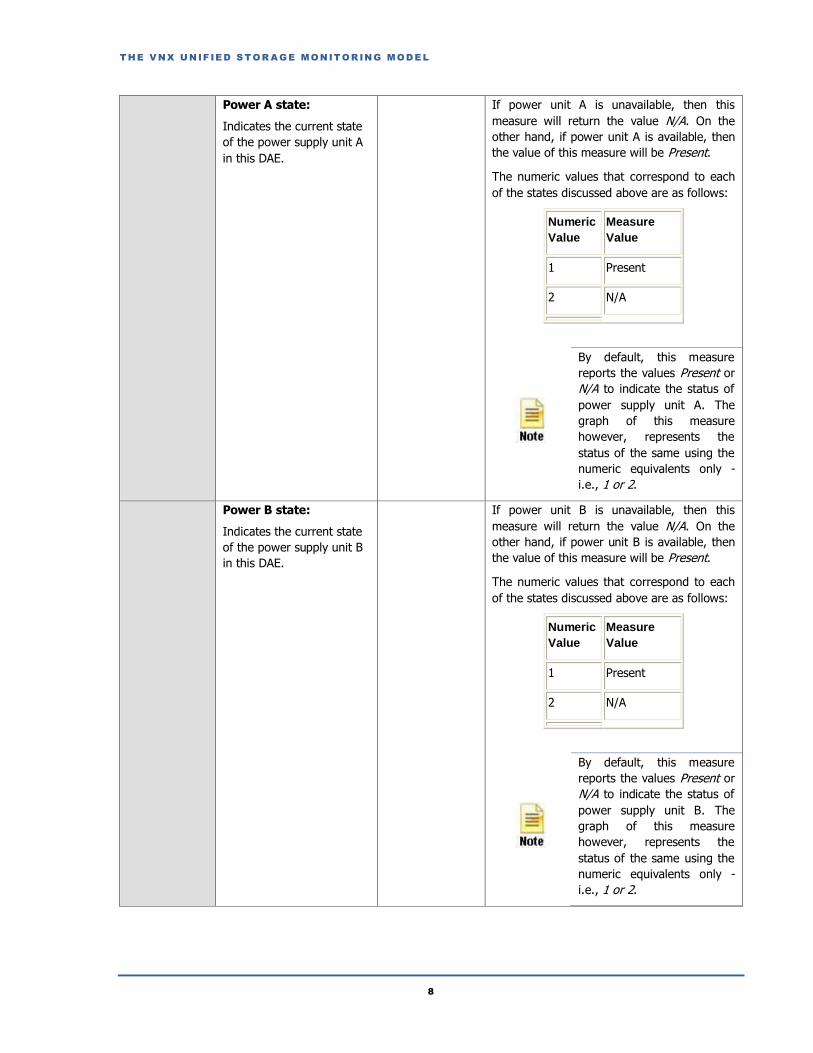
Power A state:
Indicates the current state
of the power supply unit A
in this DAE.
If power unit A is unavailable, then this
measure will return the value N/A. On the
other hand, if power unit A is available, then
the value of this measure will be Present.
The numeric values that correspond to each
of the states discussed above are as follows:
Numeric
Value
Measure
Value
1 Present
2 N/A
By default, this measure
reports the values Present or
N/A to indicate the status of
power supply unit A. The
graph of this measure
however, represents the
status of the same using the
numeric equivalents only -
i.e., 1 or 2.
Power B state:
Indicates the current state
of the power supply unit B
in this DAE.
If power unit B is unavailable, then this
measure will return the value N/A. On the
other hand, if power unit B is available, then
the value of this measure will be Present.
The numeric values that correspond to each
of the states discussed above are as follows:
Numeric
Value
Measure
Value
1 Present
2 N/A
By default, this measure
reports the values Present or
N/A to indicate the status of
power supply unit B. The
graph of this measure
however, represents the
status of the same using the
numeric equivalents only -
i.e., 1 or 2.

T HE V NX UNIF IE D S T OR A GE MONIT OR ING MOD E L
9
LCC A state:
Indicates the current state
of LCC A.
The link controller card (LCC) controls data
flow to and from the disk modules in the
enclosure and also controls data flow
between the enclosure and the outside world
(including additional linked enclosures). The
DAE comes with a standard LCC. A second
LCC is usually installed for high availability.
If LCC A is unavailable, then this measure will
return the value N/A. On the other hand, if
LCC A is available, then the value of this
measure will be Present.
The numeric values that correspond to each
of the states discussed above are as follows:
Numeric
Value
Measure
Value
1 Present
2 N/A
By default, this measure
reports the values Present or
N/A to indicate the status of
LCC A. The graph of this
measure however,
represents the status of the
same using the numeric
equivalents only - i.e., 1 or 2.

T HE V NX UNIF IE D S T OR A GE MONIT OR ING MOD E L
10
LCC B state:
Indicates the current state
of LCC B.
If LCC B is unavailable, then this measure will
return the value N/A. On the other hand, if
LCC B available, then the value of this
measure will be Present.
The numeric values that correspond to each
of the states discussed above are as follows:
Numeric
Value
Measure
Value
1 Present
2 N/A
By default, this measure
reports the values Present or
N/A to indicate the status of
LCC B. The graph of this
measure however,
represents the status of the
the busysame using the
numeric equivalents only -
i.e., 1 or 2.
2.2 The Network Layer The tests mapped to this layer periodically check the availability of the VNX system over the network, monitor the
network connections for latencies, and measure the traffic on each network interface supported by VNX to identify
the busy and bandwidth-intensive interfaces.
Figure 1.3: The tests mapped to the Network layer
2.2.1 Network Traffic Test
This test auto-discovers the network interfaces supported by the EMC VNX Storage system and reports the rate at
T HE V NX UNIF IE D S T OR A GE MONIT OR ING MOD E L
11
which network packets and data were transmitted/received over every discovered interface, and the errors
encountered by each. This way, the test sheds light on the slow, error-prone, and congested (in terms of level of
network traffic) network interfaces of the EMC VNX Storage system.
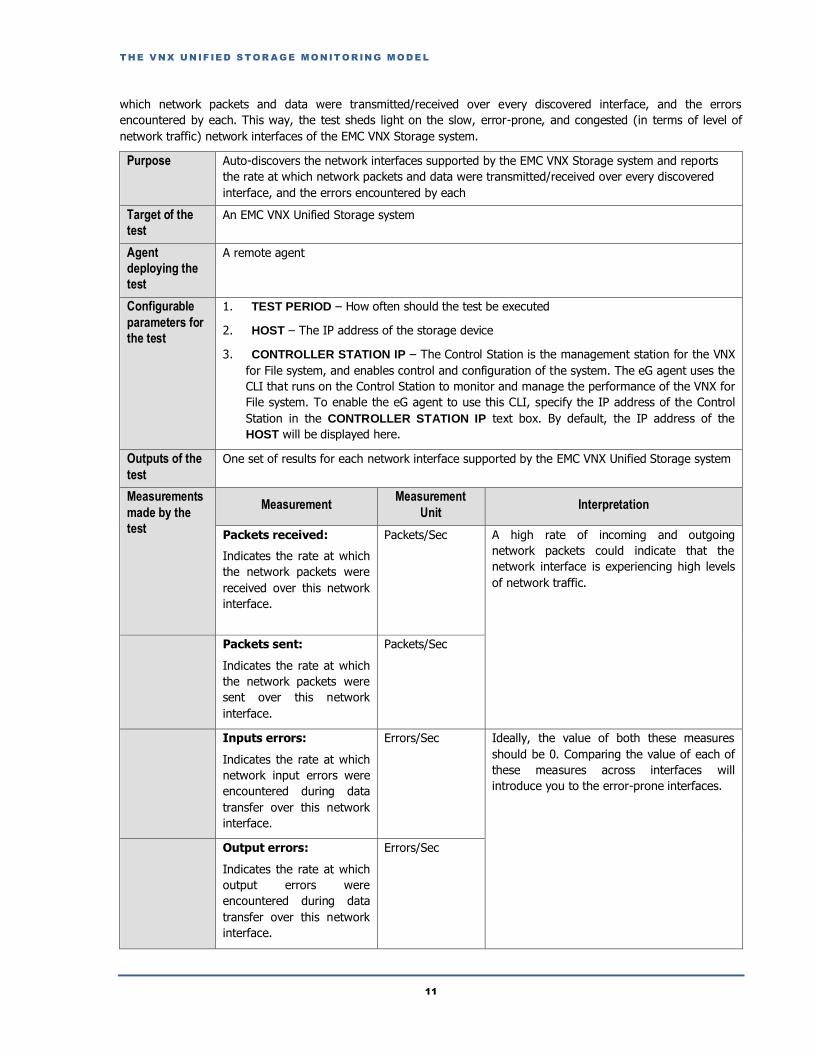
Purpose Auto-discovers the network interfaces supported by the EMC VNX Storage system and reports
the rate at which network packets and data were transmitted/received over every discovered
interface, and the errors encountered by each
Target of the
test
An EMC VNX Unified Storage system
Agent
deploying the
test
A remote agent
Configurable
parameters for
the test
1. TEST PERIOD – How often should the test be executed
2. HOST – The IP address of the storage device
3. CONTROLLER STATION IP – The Control Station is the management station for the VNX
for File system, and enables control and configuration of the system. The eG agent uses the
CLI that runs on the Control Station to monitor and manage the performance of the VNX for
File system. To enable the eG agent to use this CLI, specify the IP address of the Control
Station in the CONTROLLER STATION IP text box. By default, the IP address of the
HOST will be displayed here.
Outputs of the
test
One set of results for each network interface supported by the EMC VNX Unified Storage system
Measurements
made by the
test
Measurement Measurement
Unit Interpretation
Packets received:
Indicates the rate at which
the network packets were
received over this network
interface.
Packets/Sec A high rate of incoming and outgoing
network packets could indicate that the
network interface is experiencing high levels
of network traffic.
Packets sent:
Indicates the rate at which
the network packets were
sent over this network
interface.
Packets/Sec
Inputs errors:
Indicates the rate at which
network input errors were
encountered during data
transfer over this network
interface.
Errors/Sec Ideally, the value of both these measures
should be 0. Comparing the value of each of
these measures across interfaces will
introduce you to the error-prone interfaces.
Output errors:
Indicates the rate at which
output errors were
encountered during data
transfer over this network
interface.
Errors/Sec

T HE V NX UNIF IE D S T OR A GE MONIT OR ING MOD E L
12
Data received:
Indicates the rate at which
data was received over this
network interface.
KiB/Sec A high rate of incoming and outgoing data
could indicate that the network interface is
experiencing high levels of network traffic
and is probably consuming bandwidth
excessively. Data sent:
Indicates the rate at which
data was sent over this
network interface.
KB/Sec
2.3 The Physical Storage Layer The Vnx Disks test mapped to this layer monitors the level of activity on and space usage of each disk in the VNX
system, and sends out proactive alerts to administrators intimating them of probable disk space contentions and
abnormal I/O activity levels.
Figure 1.4: The tests mapped to the Physical Storage layer
2.3.1 Vnx Disks Test
This test monitors the current state, overall health, and the I/O activity-levels of each disk in the EMC VNX Unified
storage system. With the help of this test, administrators can not only identify failed disks, but also those that are
error-prone and may fail any time, so that they can endeavor to avert the potential disk failure. In addition, the test
also points administrators to disks that are busy processing I/O requests almost all the time. This way, the test sheds
light on irregularities in the distribution of I/O load across disks, and prompts administrators to fine-tune the load-
balancing algorithm, so as to prevent potential delays in data access. In addition, the test also proactively alerts
administrators to probable space contentions in disks and excessive bandwidth consumption by disks, thereby
enabling administrators to initiate pre-emptive actions.
Purpose Monitors the current state, overall health, and the I/O activity-levels of each disk in the EMC
VNX Unified storage system
Target of the
test
An EMC VNX Unified Storage system
Agent
deploying the
test
A remote agent
T HE V NX UNIF IE D S T OR A GE MONIT OR ING MOD E L
13
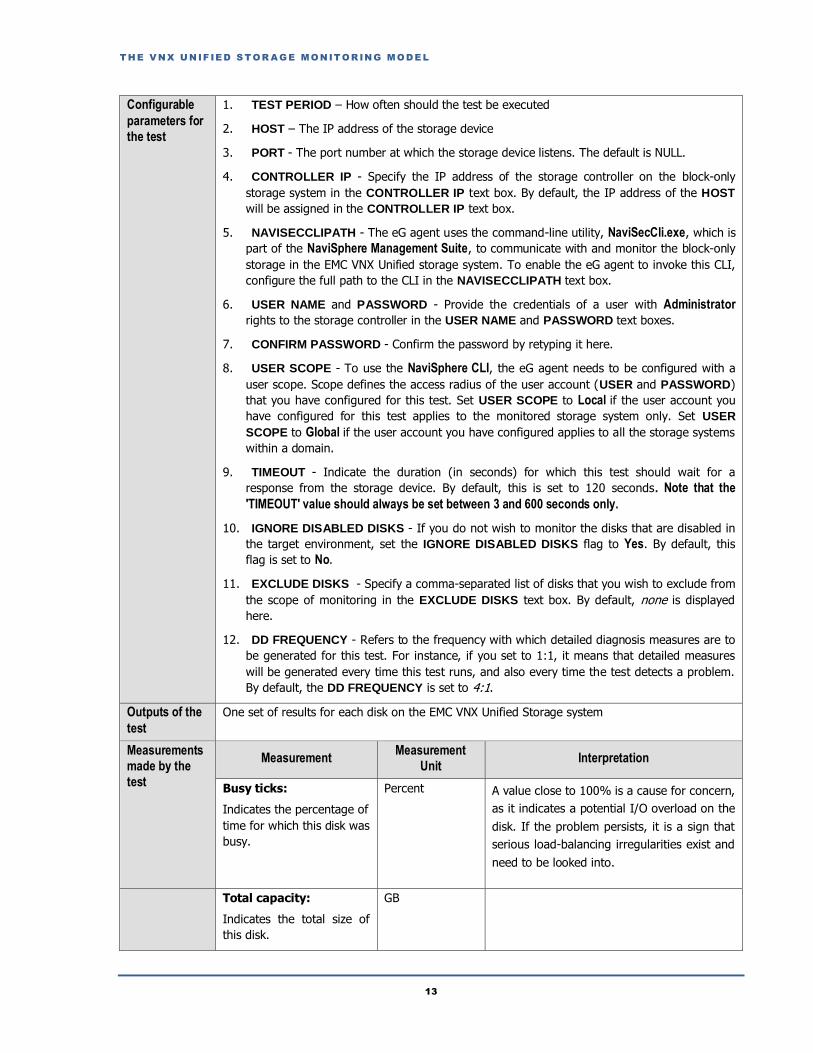
Configurable
parameters for
the test
1. TEST PERIOD – How often should the test be executed
2. HOST – The IP address of the storage device
3. PORT - The port number at which the storage device listens. The default is NULL.
4. CONTROLLER IP - Specify the IP address of the storage controller on the block-only
storage system in the CONTROLLER IP text box. By default, the IP address of the HOST
will be assigned in the CONTROLLER IP text box.
5. NAVISECCLIPATH - The eG agent uses the command-line utility, NaviSecCli.exe, which is
part of the NaviSphere Management Suite, to communicate with and monitor the block-only
storage in the EMC VNX Unified storage system. To enable the eG agent to invoke this CLI,
configure the full path to the CLI in the NAVISECCLIPATH text box.
6. USER NAME and PASSWORD - Provide the credentials of a user with Administrator
rights to the storage controller in the USER NAME and PASSWORD text boxes.
7. CONFIRM PASSWORD - Confirm the password by retyping it here.
8. USER SCOPE - To use the NaviSphere CLI, the eG agent needs to be configured with a
user scope. Scope defines the access radius of the user account (USER and PASSWORD)
that you have configured for this test. Set USER SCOPE to Local if the user account you
have configured for this test applies to the monitored storage system only. Set USER
SCOPE to Global if the user account you have configured applies to all the storage systems
within a domain.
9. TIMEOUT - Indicate the duration (in seconds) for which this test should wait for a
response from the storage device. By default, this is set to 120 seconds. Note that the
'TIMEOUT' value should always be set between 3 and 600 seconds only.
10. IGNORE DISABLED DISKS - If you do not wish to monitor the disks that are disabled in
the target environment, set the IGNORE DISABLED DISKS flag to Yes. By default, this
flag is set to No.
11. EXCLUDE DISKS - Specify a comma-separated list of disks that you wish to exclude from
the scope of monitoring in the EXCLUDE DISKS text box. By default, none is displayed
here.
12. DD FREQUENCY - Refers to the frequency with which detailed diagnosis measures are to
be generated for this test. For instance, if you set to 1:1, it means that detailed measures
will be generated every time this test runs, and also every time the test detects a problem.
By default, the DD FREQUENCY is set to 4:1.
Outputs of the
test
One set of results for each disk on the EMC VNX Unified Storage system
Measurements
made by the
test
Measurement Measurement
Unit Interpretation
Busy ticks:
Indicates the percentage of
time for which this disk was
busy.
Percent A value close to 100% is a cause for concern,
as it indicates a potential I/O overload on the
disk. If the problem persists, it is a sign that
serious load-balancing irregularities exist and
need to be looked into.
Total capacity:
Indicates the total size of
this disk.
GB

T HE V NX UNIF IE D S T OR A GE MONIT OR ING MOD E L
14
Data reads:
Indicates the rate at which
data is read from this disk.
MB/Sec Compare the value of these measures across
disks to identify the slowest disk in terms of
servicing read and write requests
(respectively). Data writes:
Indicates the rate at which
data is written to this disk.
MB/Sec
Hard read errors:
Indicates the number of
hard read errors in this
disk.
Number An increase in the value of these measures
indicates that the disk life is going to end or
fail. By comparing the value of these
measures across disks, you can identify the
disk that will potentially fail. Hard write errors:
Indicates the number of
hard write errors in this
disk.
Number
Soft read errors:
Indicates the number of
soft read errors in this disk.
Number
Soft write errors:
Indicates the number of
soft write errors in this
disk.
Number
Read requests:
Indicates the rate at which
read requests were made
to this disk.
Reqs/sec Compare the value of these measures across
disks to isolate overloaded disks. This will
also reveal irregularities in load balancing
across disks.
Write requests:
Indicates the rate at which
write requests were made
to this disk.
Reqs/sec
LUNs:
Indicates the number of
LUNs that are sharing this
disk.
Number Use the detailed diagnosis of this measure to
know which LUNs are sharing this disk.
Read retries:
Indicates the number of
times read requests to this
disk were retried.
Number A low value is desired for this measure.
Remapped sectors:
Indicates the number of
sectors on this disk that
were remapped to new
locations on the disk due to
read/write errors.
Number A low value is desired for this measure.
T HE V NX UNIF IE D S T OR A GE MONIT OR ING MOD E L
15
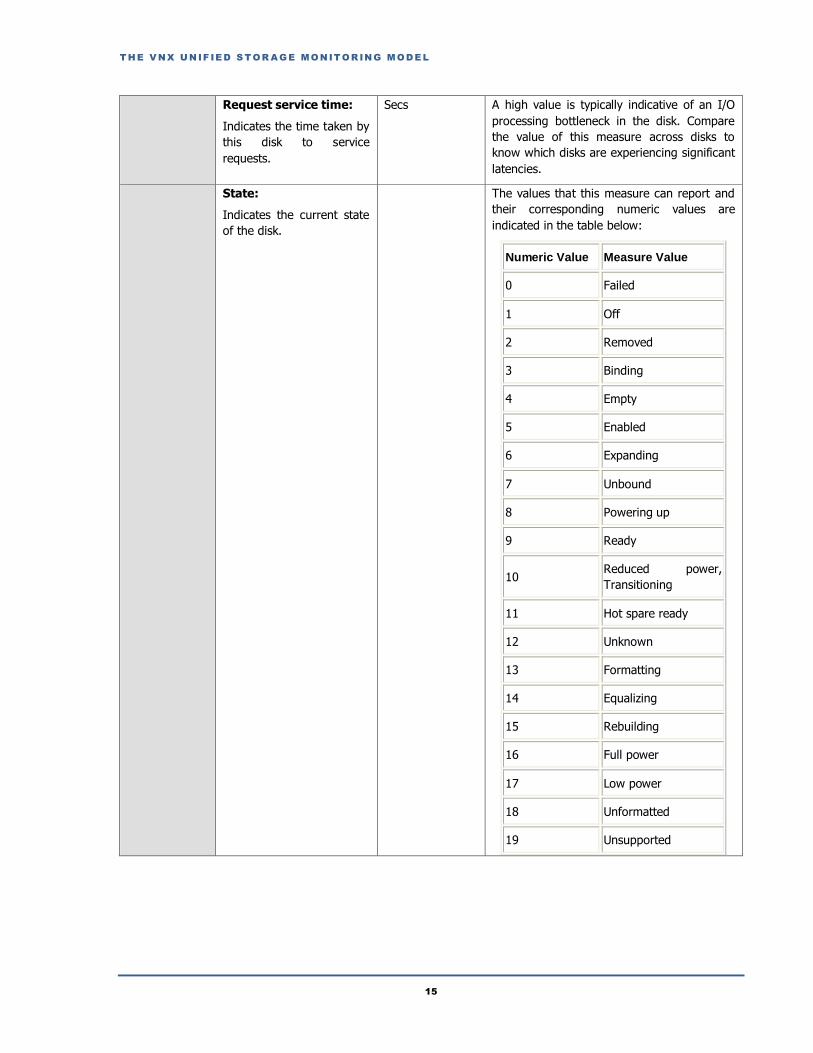
Request service time:
Indicates the time taken by
this disk to service
requests.
Secs A high value is typically indicative of an I/O
processing bottleneck in the disk. Compare
the value of this measure across disks to
know which disks are experiencing significant
latencies.
State:
Indicates the current state
of the disk.
The values that this measure can report and
their corresponding numeric values are
indicated in the table below:
Numeric Value Measure Value
0 Failed
1 Off
2 Removed
3 Binding
4 Empty
5 Enabled
6 Expanding
7 Unbound
8 Powering up
9 Ready
10 Reduced power,
Transitioning
11 Hot spare ready
12 Unknown
13 Formatting
14 Equalizing
15 Rebuilding
16 Full power
17 Low power
18 Unformatted
19 Unsupported

T HE V NX UNIF IE D S T OR A GE MONIT OR ING MOD E L
16
By default, this measure
reports any of the above-
mentioned Measure Values
while indicating the status of
the disk. However, in the
graph of this measure, the
same will be represented
using their numeric
equivalents only - i.e., 0 to
19.
Total bandwidth:
This measure indicates the
sum of data reads and data
writes to this disk.
MB/Sec Compare the value of this measure across
disks to identify the disk that is consuming
the maximum bandwidth.
Usage:
Indicates the percentage of
space in this disk that is
currently utilized.
Percent Ideally, the value of this measure should be
low. A consistent increase in this value could
indicate a gradual, but steady erosion of
space in the disk. A value close to 100%
indicates that the disk is rapidly running out
of space.
User capacity:
Indicates the amount of
space on this disk that is
assigned to bound LUNs.
GB
2.4 The Storage Processor Layer Using the tests mapped to this layer, administrators can focus on the overall operational state and operational
efficiency of their storage processors and storage ports. This way, they can quickly identify disabled storage
processors/ports, proactively detect a potential overload condition and/or an I/O processing bottleneck with storage
processors / ports, and initiate measures to resolve these issues. In addition, the layer also throws light on storage
processor cache usage and data mover cache usage to enable administrators to figure out whether a bad user
experience with the storage processor can be attributed to an improperly sized cache.

T HE V NX UNIF IE D S T OR A GE MONIT OR ING MOD E L
17
Figure 1.5: The tests mapped to the Storage Processor layer
2.4.1 Storage Processor Cache Test
EMC VNX systems have 2 storage processors - usually suffixed by “A” or “B” to denote which one it is. It is the job of
the storage processor to retrieve data from the disk when asked, and to write data to disk when asked. It also
handles all RAID operations as well as read and write caching. The read cache uses a read-ahead mechanism that
lets the storage system prefetch data from the disk. Therefore the data will be ready in the cache when the
application needs it. The write cache buffers and optimizes writes by absorbing peak loads, combining small writes,
and eliminating rewrites. The read and write caches and cache pages need to be sized adequately to achieve optimal
performance of the storage system. If not, it may result in poor cache hits, a high rate of direct disk accesses, and
significant degradation in the performance of the storage system. To avert such disasters, it would be good practice
to periodically run the Storage Processor Cache test. This test continuously monitors the current state, size, and
usage of the read and write caches of each storage processor of the EMC VNX storage system, and proactively alerts
administrators to the abnormal state, ineffective usage, and/or the insufficient size of the caches. This way,
administrators are enabled to pre-emptively initiate remedial measures, so that the problems are resolved before
storage system performance is impacted.
Purpose Continuously monitors the current state, size, and usage of the read and write caches of each
storage processor of the EMC VNX storage system, and proactively alerts administrators to the
abnormal state, ineffective usage, and/or the insufficient size of the caches
Target of the
test
An EMC VNX Unified Storage system
Agent
deploying the
test
A remote agent

T HE V NX UNIF IE D S T OR A GE MONIT OR ING MOD E L
18
Configurable
parameters for
the test
1. TEST PERIOD – How often should the test be executed
2. HOST – The IP address of the storage device
3. PORT - The port number at which the storage device listens. The default is NULL.
4. CONTROLLER IP - Specify the IP address of the storage controller on the block-only
storage system in the CONTROLLER IP text box. By default, the IP address of the HOST
will be assigned in the CONTROLLER IP text box.
5. NAVISECCLIPATH - The eG agent uses the command-line utility, NaviSecCli.exe, which is
part of the NaviSphere Management Suite, to communicate with and monitor the block-only
storage in the EMC VNX Unified storage system. To enable the eG agent to invoke this CLI,
configure the full path to the CLI in the NAVISECCLIPATH text box.
6. USER NAME and PASSWORD - Provide the credentials of a user with Administrator
rights to the storage controller in the USER NAME and PASSWORD text boxes.
7. CONFIRM PASSWORD - Confirm the password by retyping it here.
8. USER SCOPE - To use the NaviSphere CLI, the eG agent needs to be configured with a
user scope. Scope defines the access radius of the user account (USER and PASSWORD)
that you have configured for this test. Set USER SCOPE to Local if the user account you
have configured for this test applies to the monitored storage system only. Set USER
SCOPE to Global if the user account you have configured applies to all the storage systems
within a domain.
9. TIMEOUT - Indicate the duration (in seconds) for which this test should wait for a
response from the storage device. By default, this is set to 120 seconds. Note that the
'TIMEOUT' value should always be set between 3 and 600 seconds only.
Outputs of the
test
One set of results for the EMC VNX Unified Storage system
Measurements
made by the Measurement
Measurement
Unit Interpretation
T HE V NX UNIF IE D S T OR A GE MONIT OR ING MOD E L
19
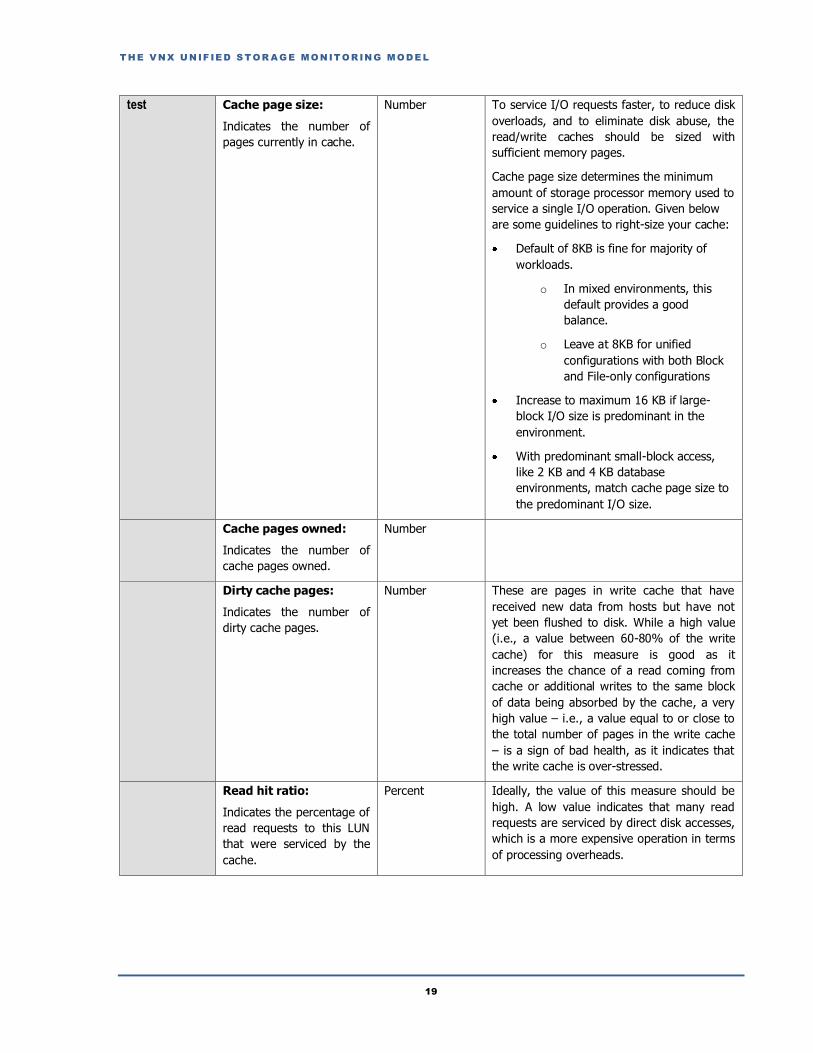
test Cache page size:
Indicates the number of
pages currently in cache.
Number To service I/O requests faster, to reduce disk
overloads, and to eliminate disk abuse, the
read/write caches should be sized with
sufficient memory pages.
Cache page size determines the minimum
amount of storage processor memory used to
service a single I/O operation. Given below
are some guidelines to right-size your cache:
Default of 8KB is fine for majority of
workloads.
o In mixed environments, this
default provides a good
balance.
o Leave at 8KB for unified
configurations with both Block
and File-only configurations
Increase to maximum 16 KB if large-
block I/O size is predominant in the
environment.
With predominant small-block access,
like 2 KB and 4 KB database
environments, match cache page size to
the predominant I/O size.
Cache pages owned:
Indicates the number of
cache pages owned.
Number
Dirty cache pages:
Indicates the number of
dirty cache pages.
Number These are pages in write cache that have
received new data from hosts but have not
yet been flushed to disk. While a high value
(i.e., a value between 60-80% of the write
cache) for this measure is good as it
increases the chance of a read coming from
cache or additional writes to the same block
of data being absorbed by the cache, a very
high value – i.e., a value equal to or close to
the total number of pages in the write cache
– is a sign of bad health, as it indicates that
the write cache is over-stressed.
Read hit ratio:
Indicates the percentage of
read requests to this LUN
that were serviced by the
cache.
Percent Ideally, the value of this measure should be
high. A low value indicates that many read
requests are serviced by direct disk accesses,
which is a more expensive operation in terms
of processing overheads.
T HE V NX UNIF IE D S T OR A GE MONIT OR ING MOD E L
20
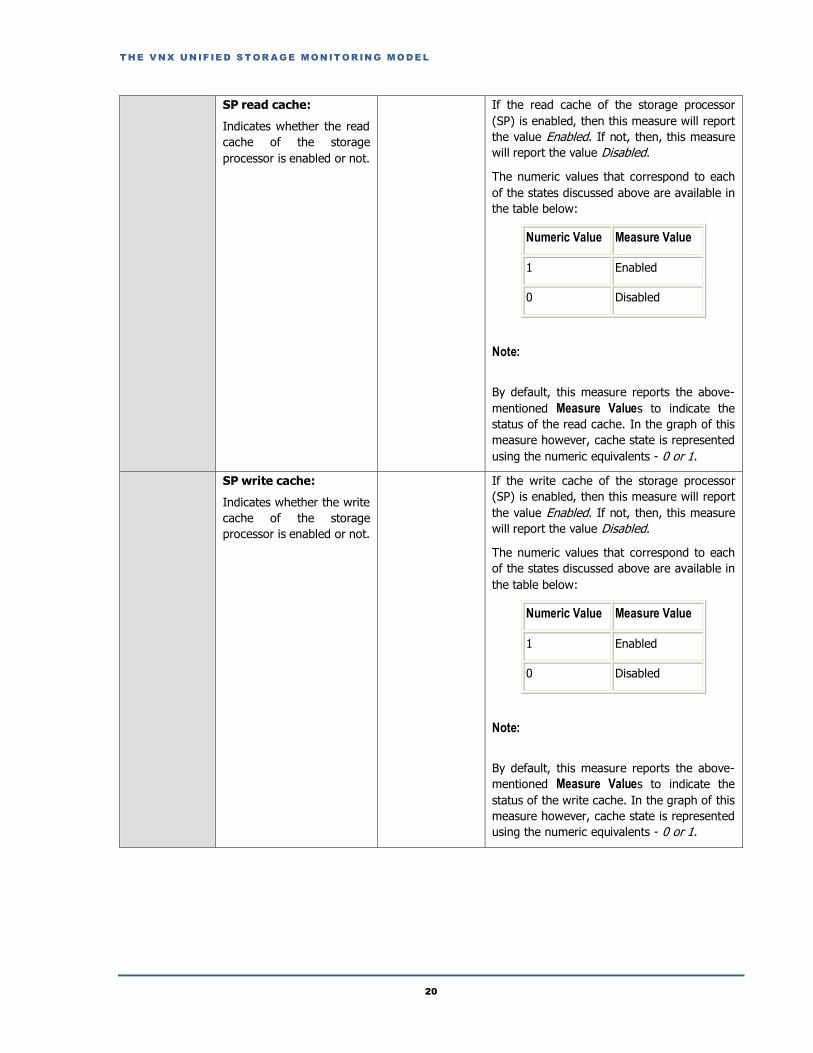
SP read cache:
Indicates whether the read
cache of the storage
processor is enabled or not.
If the read cache of the storage processor
(SP) is enabled, then this measure will report
the value Enabled. If not, then, this measure
will report the value Disabled.
The numeric values that correspond to each
of the states discussed above are available in
the table below:
Numeric Value Measure Value
1 Enabled
0 Disabled
Note:
By default, this measure reports the above-
mentioned Measure Values to indicate the
status of the read cache. In the graph of this
measure however, cache state is represented
using the numeric equivalents - 0 or 1.
SP write cache:
Indicates whether the write
cache of the storage
processor is enabled or not.
If the write cache of the storage processor
(SP) is enabled, then this measure will report
the value Enabled. If not, then, this measure
will report the value Disabled.
The numeric values that correspond to each
of the states discussed above are available in
the table below:
Numeric Value Measure Value
1 Enabled
0 Disabled
Note:
By default, this measure reports the above-
mentioned Measure Values to indicate the
status of the write cache. In the graph of this
measure however, cache state is represented
using the numeric equivalents - 0 or 1.
T HE V NX UNIF IE D S T OR A GE MONIT OR ING MOD E L
21
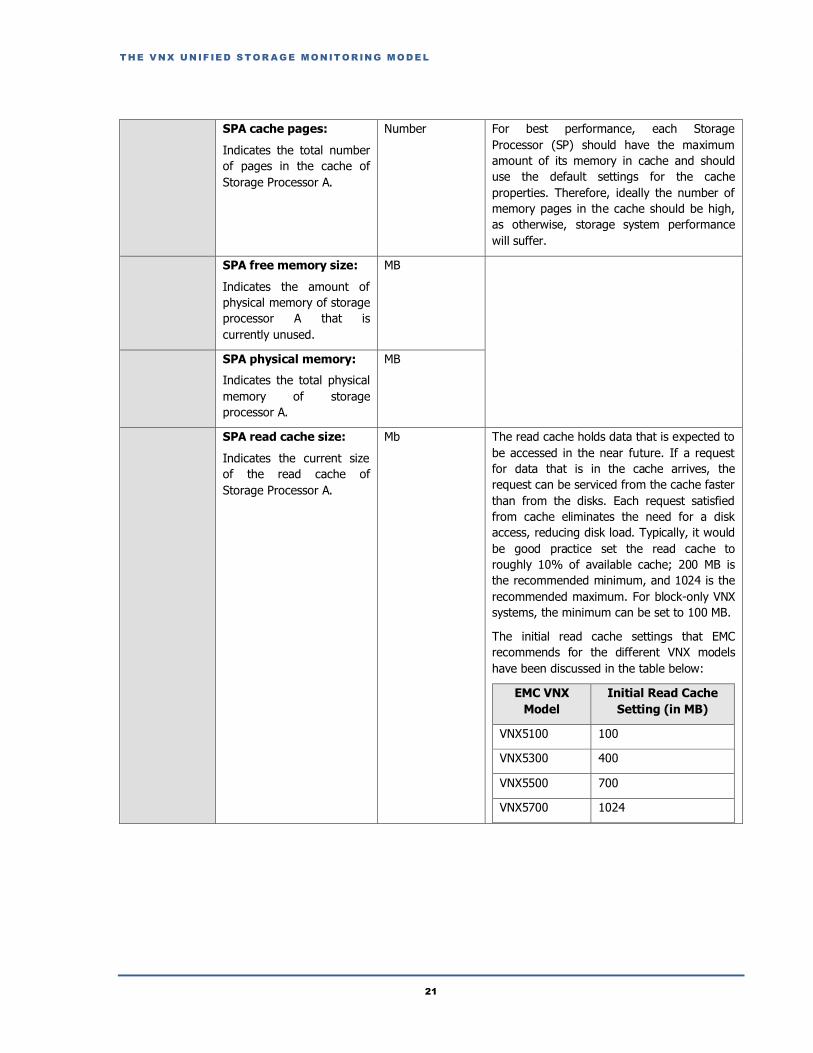
SPA cache pages:
Indicates the total number
of pages in the cache of
Storage Processor A.
Number For best performance, each Storage
Processor (SP) should have the maximum
amount of its memory in cache and should
use the default settings for the cache
properties. Therefore, ideally the number of
memory pages in the cache should be high,
as otherwise, storage system performance
will suffer.
SPA free memory size:
Indicates the amount of
physical memory of storage
processor A that is
currently unused.
MB
SPA physical memory:
Indicates the total physical
memory of storage
processor A.
MB
SPA read cache size:
Indicates the current size
of the read cache of
Storage Processor A.
Mb The read cache holds data that is expected to
be accessed in the near future. If a request
for data that is in the cache arrives, the
request can be serviced from the cache faster
than from the disks. Each request satisfied
from cache eliminates the need for a disk
access, reducing disk load. Typically, it would
be good practice set the read cache to
roughly 10% of available cache; 200 MB is
the recommended minimum, and 1024 is the
recommended maximum. For block-only VNX
systems, the minimum can be set to 100 MB.
The initial read cache settings that EMC
recommends for the different VNX models
have been discussed in the table below:
EMC VNX
Model
Initial Read Cache
Setting (in MB)
VNX5100 100
VNX5300 400
VNX5500 700
VNX5700 1024

T HE V NX UNIF IE D S T OR A GE MONIT OR ING MOD E L
22
If the workload exhibits a "locality of
reference" behavior, where a relatively small
set of data is accessed frequently and
repeatedly, the read cache can improve
performance. In read-intensive environments,
where more than 70 percent of all requests
are reads, the read cache should be large
enough to accommodate the dataset that is
most frequently accessed. For sequential
reads from a LUN, data that is expected to be
accessed by subsequent read requests is read
(prefetched) into the cache before being
requested. Therefore, for optimal
performance, the read cache should be large
enough to accommodate prefetched data for
sequential reads from each LUN. An
improperly sized read-cache can increase
direct disk reads and can hence, adversely
impact storage system performance.
SPA read cache state:
Indicates the current state
of the read cache for
Storage Processor (SP) A.
If the read cache of the storage processor
(SP) A is enabled, then this measure will
report the value Enabled. If not, then, this
measure will report the value Disabled.
The numeric values that correspond to each
of the states discussed above are available in
the table below:
Numeric Value Measure Value
1 Enabled
0 Disabled
Note:
By default, this measure reports the above-
mentioned Measure Values to indicate the
status of the read cache. In the graph of this
measure however, cache state is represented
using the numeric equivalents - 0 or 1.
SPA system buffer:
Indicates the size of the
system buffer of storage
processor A.
MB
T HE V NX UNIF IE D S T OR A GE MONIT OR ING MOD E L
23
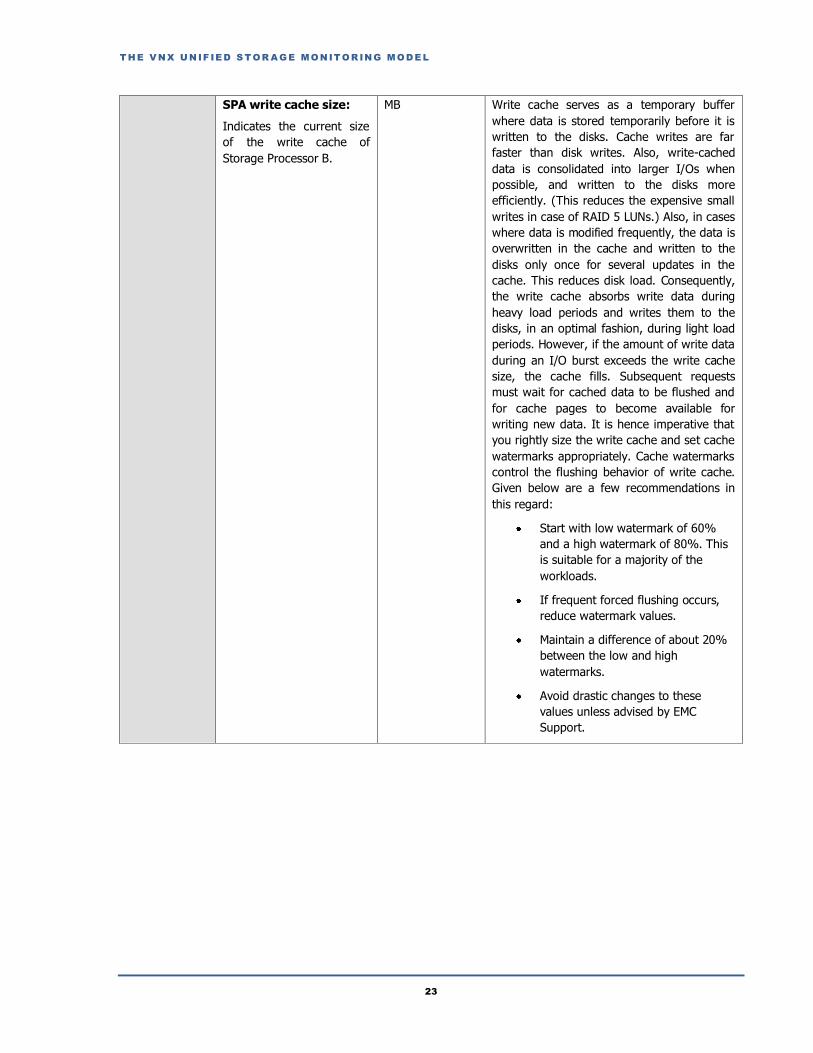
SPA write cache size:
Indicates the current size
of the write cache of
Storage Processor B.
MB Write cache serves as a temporary buffer
where data is stored temporarily before it is
written to the disks. Cache writes are far
faster than disk writes. Also, write-cached
data is consolidated into larger I/Os when
possible, and written to the disks more
efficiently. (This reduces the expensive small
writes in case of RAID 5 LUNs.) Also, in cases
where data is modified frequently, the data is
overwritten in the cache and written to the
disks only once for several updates in the
cache. This reduces disk load. Consequently,
the write cache absorbs write data during
heavy load periods and writes them to the
disks, in an optimal fashion, during light load
periods. However, if the amount of write data
during an I/O burst exceeds the write cache
size, the cache fills. Subsequent requests
must wait for cached data to be flushed and
for cache pages to become available for
writing new data. It is hence imperative that
you rightly size the write cache and set cache
watermarks appropriately. Cache watermarks
control the flushing behavior of write cache.
Given below are a few recommendations in
this regard:
Start with low watermark of 60%
and a high watermark of 80%. This
is suitable for a majority of the
workloads.
If frequent forced flushing occurs,
reduce watermark values.
Maintain a difference of about 20%
between the low and high
watermarks.
Avoid drastic changes to these
values unless advised by EMC
Support.
T HE V NX UNIF IE D S T OR A GE MONIT OR ING MOD E L
24
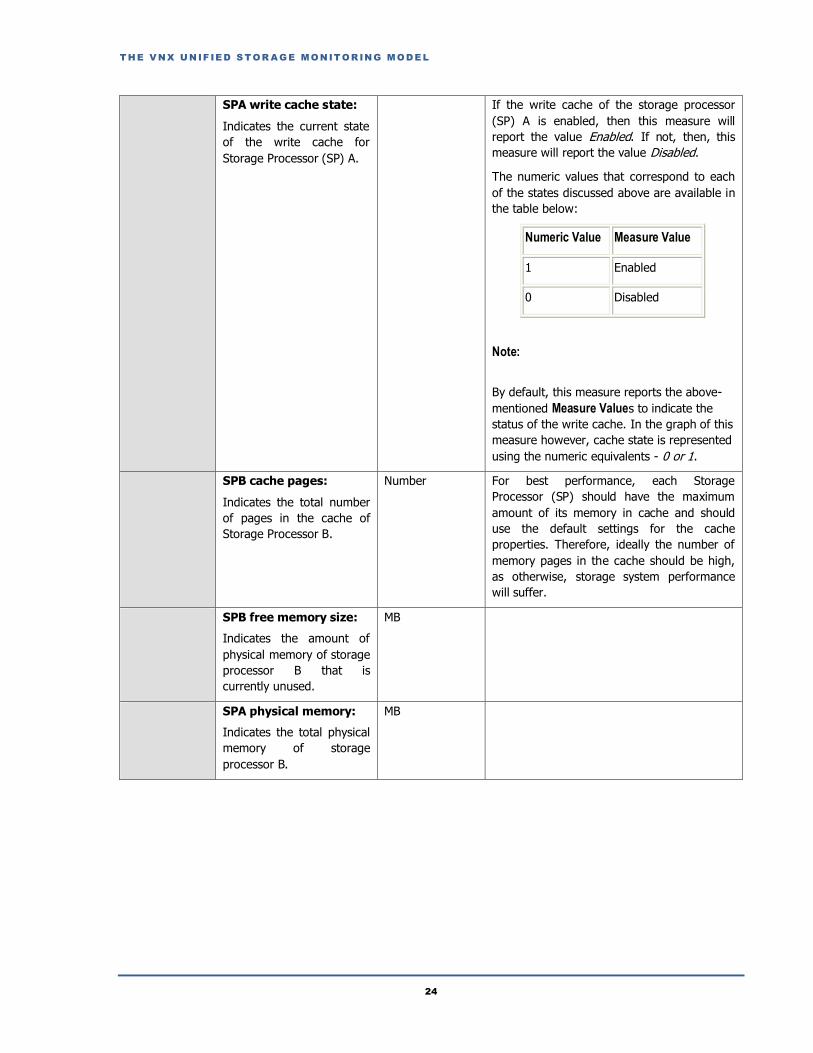
SPA write cache state:
Indicates the current state
of the write cache for
Storage Processor (SP) A.
If the write cache of the storage processor
(SP) A is enabled, then this measure will
report the value Enabled. If not, then, this
measure will report the value Disabled.
The numeric values that correspond to each
of the states discussed above are available in
the table below:
Numeric Value Measure Value
1 Enabled
0 Disabled
Note:
By default, this measure reports the above-
mentioned Measure Values to indicate the
status of the write cache. In the graph of this
measure however, cache state is represented
using the numeric equivalents - 0 or 1.
SPB cache pages:
Indicates the total number
of pages in the cache of
Storage Processor B.
Number For best performance, each Storage
Processor (SP) should have the maximum
amount of its memory in cache and should
use the default settings for the cache
properties. Therefore, ideally the number of
memory pages in the cache should be high,
as otherwise, storage system performance
will suffer.
SPB free memory size:
Indicates the amount of
physical memory of storage
processor B that is
currently unused.
MB
SPA physical memory:
Indicates the total physical
memory of storage
processor B.
MB
T HE V NX UNIF IE D S T OR A GE MONIT OR ING MOD E L
25
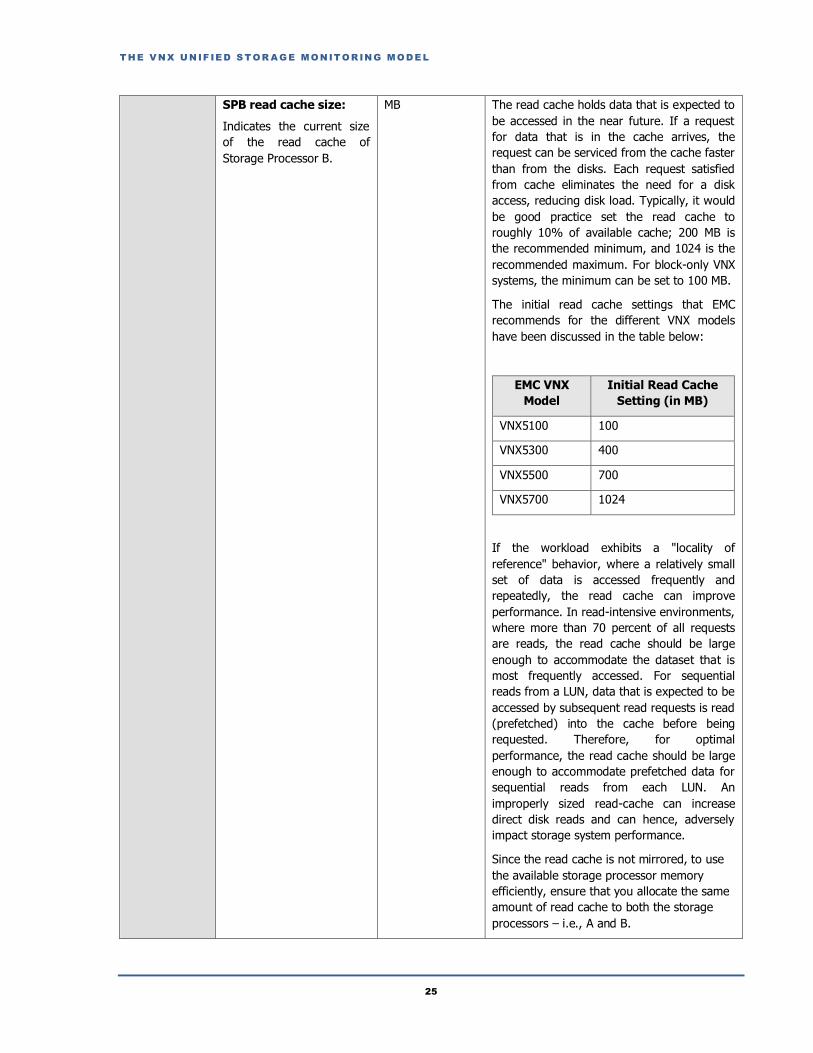
SPB read cache size:
Indicates the current size
of the read cache of
Storage Processor B.
MB The read cache holds data that is expected to
be accessed in the near future. If a request
for data that is in the cache arrives, the
request can be serviced from the cache faster
than from the disks. Each request satisfied
from cache eliminates the need for a disk
access, reducing disk load. Typically, it would
be good practice set the read cache to
roughly 10% of available cache; 200 MB is
the recommended minimum, and 1024 is the
recommended maximum. For block-only VNX
systems, the minimum can be set to 100 MB.
The initial read cache settings that EMC
recommends for the different VNX models
have been discussed in the table below:
EMC VNX
Model
Initial Read Cache
Setting (in MB)
VNX5100 100
VNX5300 400
VNX5500 700
VNX5700 1024
If the workload exhibits a "locality of
reference" behavior, where a relatively small
set of data is accessed frequently and
repeatedly, the read cache can improve
performance. In read-intensive environments,
where more than 70 percent of all requests
are reads, the read cache should be large
enough to accommodate the dataset that is
most frequently accessed. For sequential
reads from a LUN, data that is expected to be
accessed by subsequent read requests is read
(prefetched) into the cache before being
requested. Therefore, for optimal
performance, the read cache should be large
enough to accommodate prefetched data for
sequential reads from each LUN. An
improperly sized read-cache can increase
direct disk reads and can hence, adversely
impact storage system performance.
Since the read cache is not mirrored, to use
the available storage processor memory
efficiently, ensure that you allocate the same
amount of read cache to both the storage
processors – i.e., A and B.
T HE V NX UNIF IE D S T OR A GE MONIT OR ING MOD E L
26
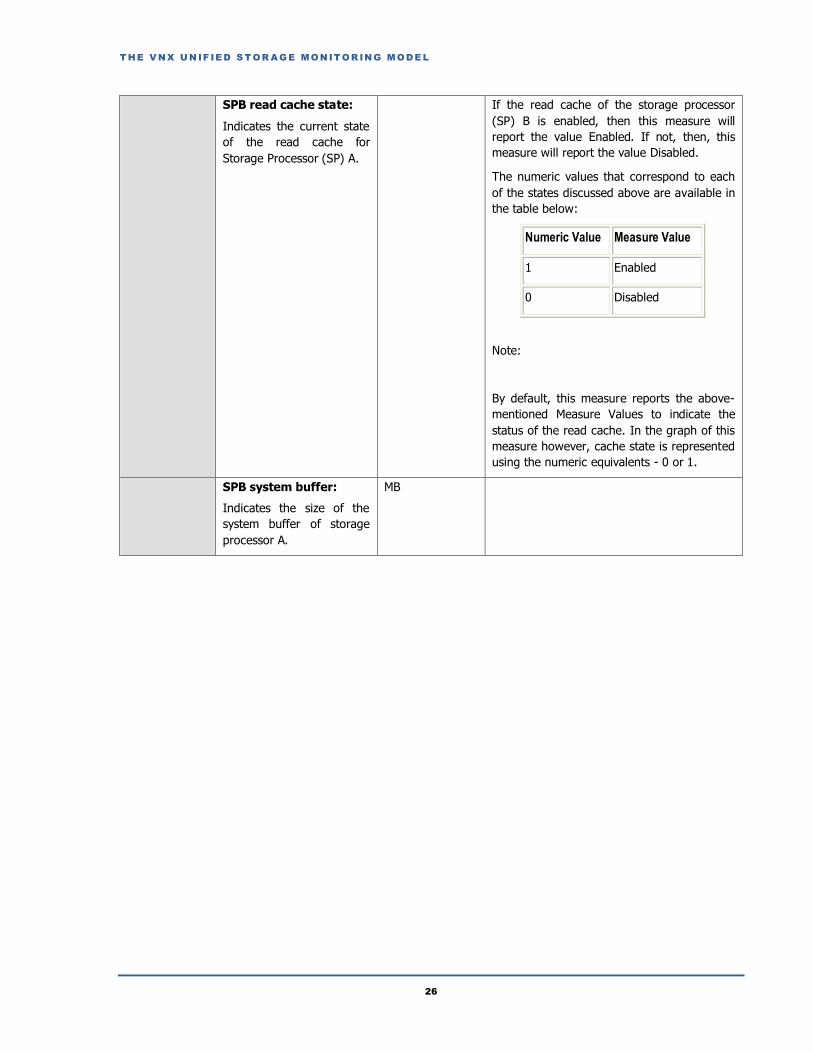
SPB read cache state:
Indicates the current state
of the read cache for
Storage Processor (SP) A.
If the read cache of the storage processor
(SP) B is enabled, then this measure will
report the value Enabled. If not, then, this
measure will report the value Disabled.
The numeric values that correspond to each
of the states discussed above are available in
the table below:
Numeric Value Measure Value
1 Enabled
0 Disabled
Note:
By default, this measure reports the above-
mentioned Measure Values to indicate the
status of the read cache. In the graph of this
measure however, cache state is represented
using the numeric equivalents - 0 or 1.
SPB system buffer:
Indicates the size of the
system buffer of storage
processor A.
MB
T HE V NX UNIF IE D S T OR A GE MONIT OR ING MOD E L
27
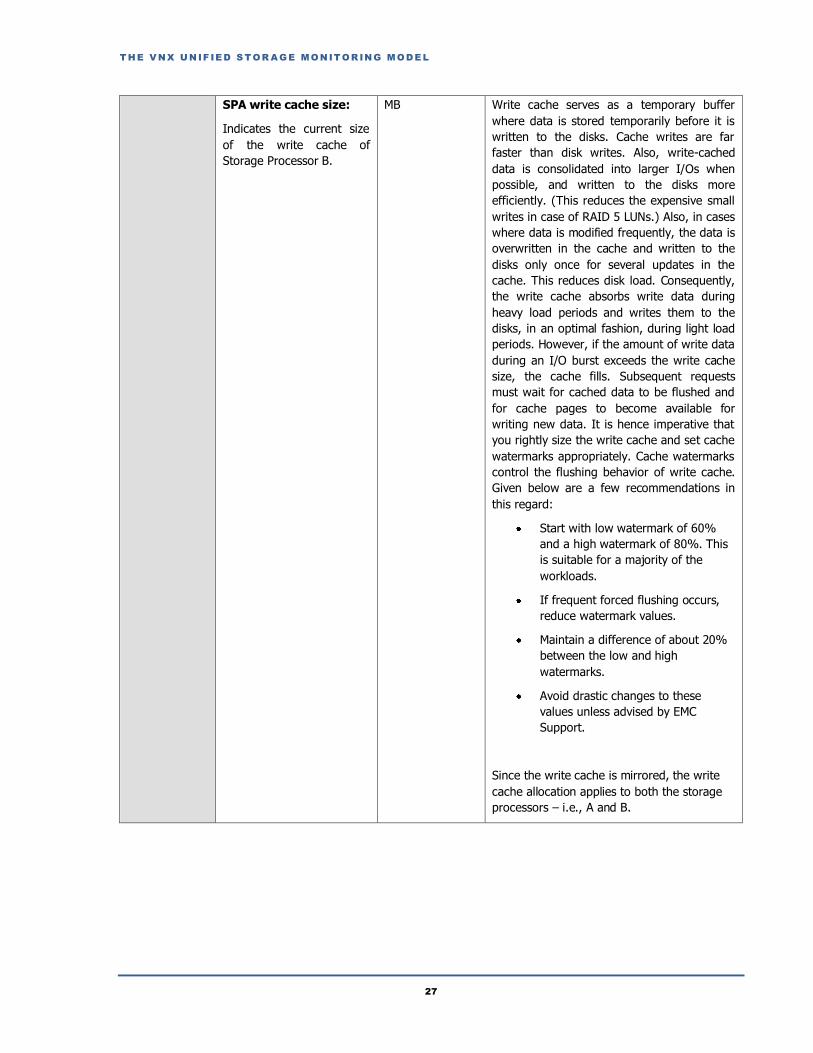
SPA write cache size:
Indicates the current size
of the write cache of
Storage Processor B.
MB Write cache serves as a temporary buffer
where data is stored temporarily before it is
written to the disks. Cache writes are far
faster than disk writes. Also, write-cached
data is consolidated into larger I/Os when
possible, and written to the disks more
efficiently. (This reduces the expensive small
writes in case of RAID 5 LUNs.) Also, in cases
where data is modified frequently, the data is
overwritten in the cache and written to the
disks only once for several updates in the
cache. This reduces disk load. Consequently,
the write cache absorbs write data during
heavy load periods and writes them to the
disks, in an optimal fashion, during light load
periods. However, if the amount of write data
during an I/O burst exceeds the write cache
size, the cache fills. Subsequent requests
must wait for cached data to be flushed and
for cache pages to become available for
writing new data. It is hence imperative that
you rightly size the write cache and set cache
watermarks appropriately. Cache watermarks
control the flushing behavior of write cache.
Given below are a few recommendations in
this regard:
Start with low watermark of 60%
and a high watermark of 80%. This
is suitable for a majority of the
workloads.
If frequent forced flushing occurs,
reduce watermark values.
Maintain a difference of about 20%
between the low and high
watermarks.
Avoid drastic changes to these
values unless advised by EMC
Support.
Since the write cache is mirrored, the write
cache allocation applies to both the storage
processors – i.e., A and B.
T HE V NX UNIF IE D S T OR A GE MONIT OR ING MOD E L
28
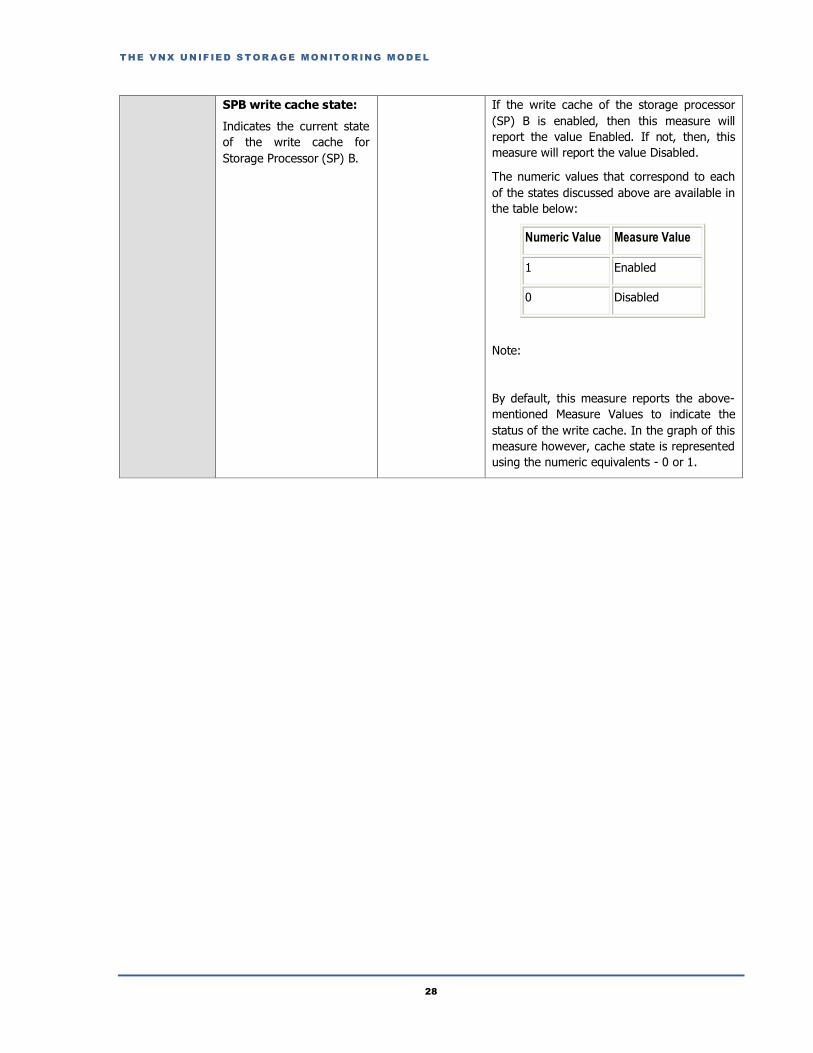
SPB write cache state:
Indicates the current state
of the write cache for
Storage Processor (SP) B.
If the write cache of the storage processor
(SP) B is enabled, then this measure will
report the value Enabled. If not, then, this
measure will report the value Disabled.
The numeric values that correspond to each
of the states discussed above are available in
the table below:
Numeric Value Measure Value
1 Enabled
0 Disabled
Note:
By default, this measure reports the above-
mentioned Measure Values to indicate the
status of the write cache. In the graph of this
measure however, cache state is represented
using the numeric equivalents - 0 or 1.

T HE V NX UNIF IE D S T OR A GE MONIT OR ING MOD E L
29
Write cache mirrored:
Indicates the write cache
mirrored status.
Each storage processor (SP) has a write
cache in its memory, which mirrors the write
cache on the other SP. Because these caches
mirror each other, they are always either
enabled or disabled, and always the same
size. On powerup, a storage system
automatically enables the write cache on
each SP if the write cache size is non-zero.
Using this measure, you can determine
whether the write cache of both SPs is
currently enabled/disabled.
If the write cache is disabled, then this
measure will report the value Enabled. If not,
the measure will report the value Disabled.
The numeric values that correspond to each
of the states discussed above are available in
the table below:
Numeric
Value
Measure
Value
1 Enabled
0 Disabled
Note:
By default, this measure reports the above-
mentioned Measure Values to indicate the
mirror status of the write cache. In the graph
of this measure however, the mirror status is
represented using the numeric equivalents -
0 or 1.
Write hit ratio:
Indicates the percentage of
write requests to this LUN
that were serviced by the
cache.
Percent Ideally, the value of this measure should be
high. A low value indicates that many write
requests are serviced by direct disk accesses,
which is a more expensive operation in terms
of processing overheads.
2.4.2 Vnx Storage Ports Test
Storage ports help the storage processors receive and process I/O requests. These ports typically take the SCSCI
IDs, 0 through 3. By periodically checking port status and measuring the I/O load on the ports, you can identify
overloaded ports, isolate the storage processor they support, and thus proactively detect potential/existing load-
balancing irregularities and/or processing bottlenecks with the storage processors. The VNX Storage Ports test
facilitates this port check. For every port configured on each of the storage processors (A and B) supported by the
VNX storage system, this test reports the port state, the I/O load on the ports, the processing ability of the ports,
T HE V NX UNIF IE D S T OR A GE MONIT OR ING MOD E L
30
and the SFP state. In the process, the test not only points administrators to overloaded ports, but also puts a finger
on ports that are slow when processing I/O requests.
Purpose For every port configured on each of the storage processors (A and B) supported by the VNX
storage system, this test reports the port state, the I/O load on the ports, the processing ability
of the ports, and the SFP state.
Target of the
test
An EMC VNX Unified Storage system
Agent
deploying the
test
A remote agent
Configurable
parameters for
the test
1. TEST PERIOD – How often should the test be executed
2. HOST – The IP address of the storage device
3. PORT - The port number at which the storage device listens. The default is NULL.
4. CONTROLLER IP - Specify the IP address of the storage controller on the block-only
storage system in the CONTROLLER IP text box. By default, the IP address of the HOST
will be assigned in the CONTROLLER IP text box.
5. NAVISECCLIPATH - The eG agent uses the command-line utility, NaviSecCli.exe, which is
part of the NaviSphere Management Suite, to communicate with and monitor the block-only
storage in the EMC VNX Unified storage system. To enable the eG agent to invoke this CLI,
configure the full path to the CLI in the NAVISECCLIPATH text box.
6. USER NAME and PASSWORD - Provide the credentials of a user with Administrator
rights to the storage controller in the USER NAME and PASSWORD text boxes.
7. CONFIRM PASSWORD - Confirm the password by retyping it here.
8. USER SCOPE - To use the NaviSphere CLI, the eG agent needs to be configured with a
user scope. Scope defines the access radius of the user account (USER and PASSWORD)
that you have configured for this test. Set USER SCOPE to Local if the user account you
have configured for this test applies to the monitored storage system only. Set USER
SCOPE to Global if the user account you have configured applies to all the storage systems
within a domain.
9. IGNORE DISABLED SPPORT - If you do not wish to monitor the Storage Processor (SP)
Ports that are disabled in the target environment, set this flag to Yes. By default, this flag is
set to No.
10. EXCLUDE SPPORTS - Specify a comma-separated list of SP Ports that you wish to
exclude from the scope of monitoring. By default, this is set to none.
11. TIMEOUT - Indicate the duration (in seconds) for which this test should wait for a
response from the storage device. By default, this is set to 120 seconds. Note that the
'TIMEOUT' value should always be set between 3 and 600 seconds only.
Outputs of the
test
One set of results for each port on each storage processor of the EMC VNX Unified Storage
system
Measurements
made by the
test
Measurement Measurement
Unit Interpretation
Data reads:
Indicates the rate at which
data is read through this
port.
Blocks/Sec These measures are good indicators of the
I/O processing ability of the ports. You can
also compare the value of these measures
across ports to identify which port is the

T HE V NX UNIF IE D S T OR A GE MONIT OR ING MOD E L
31
Data writes:
Indicates the rate at which
data is written through this
port.
Blocks/Sec slowest when handing I/O requests, and
which processor that port is configured on.
By closely tracking the value of these
measures for that port over time, you can
proactively detect potential processing
bottlenecks and also figure out when the
slowdown occurs – when reading from or
writing to the storage processor?
Link state:
Indicates the link state of
this port.
If the storage port is up and running, then
this measure will report the value Up. If not,
then, this measure will report the value
Down.
The numeric values that correspond to each
of the states discussed above are available in
the table below:
Numeric Value Measure Value
0 Down
1 Up
Note:
By default, this measure reports the above-
mentioned Measure Values to indicate the link
state of the port. The graph of this measure
however, represents the port status using the
numeric equivalents - 0 or 1.
Reads:
Indicates the number of
reads per second made on
this port.
Reads/Sec Comparing the value of these measures
across ports will clearly indicate which port is
overloaded - it could also shed light on
irregularities in load balancing across the
ports. Writes:
Indicates the number of
writes per second made on
this port.
Writes/Sec

T HE V NX UNIF IE D S T OR A GE MONIT OR ING MOD E L
32
SFP state:
Indicates the current state
of the SFP on this port.
Small form-factor pluggable (SFP) modules
are compact, hot-pluggable transceivers
inserted into the SFP or SFP+ slot of an I/O
module in a Block and File VNX5300 platform.
This transceiver module provides uplink
optical interfaces, laser send or transmit (TX)
and laser receive (RX). This measure reports
the current state of this module.
The values that this measure can report and
their corresponding numeric values are listed
in the table below:
Numeric
Value Measure Value
1 Online
2 Faulted
3 Other
0 Removed or None
Note:
By default, this measure reports the above-
mentioned Measure Values to indicate the
status of an SFP. The graph of this measure
however, represents the same using the
numeric equivalents - 0 to 3.
2.4.3 Vnx Storage Processors Test
The storage processor enables the administrator in serving the purpose of the following:
creating raid groups
binding LUNs
execute CLI commands
perform read/write operations from external server to SAN
Excessive usage of or heavy I/O load on a single storage processor can cause a marked deterioration in the overall
performance of the storage sub-system, as it is indicative of severe deficiencies in the load-balancing algorithm that
drives the storage processors. Using the Vnx Storage Processors test, administrators can easily monitor the current
state, usage, and load on each of the storage processors on the EMC VNX storage system, quickly detect an overload
condition, precisely point to the storage processor that is bearing its brunt, and promptly initiate measures to resolve
the issue, so as to ensure the optimal performance of the storage system.
Purpose Helps administrators easily monitor the current state, usage, and load on each of the storage
processors on the EMC VNX storage system, quickly detect an overload condition and the
storage processor that is bearing its brunt, and promptly initiate measures to resolve the issue,

T HE V NX UNIF IE D S T OR A GE MONIT OR ING MOD E L
33
so as to ensure the optimal performance of the storage system.
Target of the
test
An EMC VNX Unified Storage system
Agent
deploying the
test
A remote agent
Configurable
parameters for
the test
1. TEST PERIOD – How often should the test be executed
2. HOST – The IP address of the storage device
3. PORT - The port number at which the storage device listens. The default is NULL.
4. CONTROLLER IP - Specify the IP address of the storage controller on the block-only
storage system in the CONTROLLER IP text box. By default, the IP address of the HOST
will be assigned in the CONTROLLER IP text box.
5. NAVISECCLIPATH - The eG agent uses the command-line utility, NaviSecCli.exe, which is
part of the NaviSphere Management Suite, to communicate with and monitor the block-only
storage in the EMC VNX Unified storage system. To enable the eG agent to invoke this CLI,
configure the full path to the CLI in the NAVISECCLIPATH text box.
6. USER NAME and PASSWORD - Provide the credentials of a user with Administrator
rights to the storage controller in the USER NAME and PASSWORD text boxes.
7. CONFIRM PASSWORD - Confirm the password by retyping it here.
8. USER SCOPE - To use the NaviSphere CLI, the eG agent needs to be configured with a
user scope. Scope defines the access radius of the user account (USER and PASSWORD)
that you have configured for this test. Set USER SCOPE to Local if the user account you
have configured for this test applies to the monitored storage system only. Set USER
SCOPE to Global if the user account you have configured applies to all the storage systems
within a domain.
9. TIMEOUT - Indicate the duration (in seconds) for which this test should wait for a
response from the storage device. By default, this is set to 120 seconds. Note that the
'TIMEOUT' value should always be set between 3 and 600 seconds only.
Outputs of the
test
One set of results for each storage processor of the EMC VNX Unified Storage system
Measurements
made by the
test
Measurement Measurement
Unit Interpretation
Busy:
Indicates percent utilization
of this storage processor.
Percent A value close to 100 indicates that the
storage processor is being excessively
utilized. If both the processors are very busy,
then it indicates that the load on the storage
system is high, and that adequate resources
may have to be allocated to both the
processors to enable them to handle the
load. If only a single processor is found to be
extremely busy, it is a cause for concern, as
it indicates that I/O load has not been
uniformly distributed between the two
processors, thus imposing additional strain on
a particular processor.

T HE V NX UNIF IE D S T OR A GE MONIT OR ING MOD E L
34
Data reads:
Indicates the rate at which
data is read via this storage
processor.
Blocks/Sec These measures are good indicators of the
I/O processing ability of the SPs. You can
also compare the value of these measures
across SPs to identify which SP is the slowest
when handing I/O requests. By closely
tracking the value of these measures for that
SP over time, you can proactively detect
potential processing bottlenecks and also
figure out when the slowdown occurs – when
reading from or writing to the storage
processor?
Data writes:
Indicates the rate at which
data is written via this
storage processor.
Blocks/Sec
Idle:
Indicates the percentage of
time for which this storage
processor was idle.
Percent This value varies with respect to the value of
the Busy measure.
In the event of an overload/slowdown, you
may want to compare the value of the Idle
and Busy measures of an SP to figure out
whether it has been utilized optimally or
under-utilized. If the Idle measure value is
greater than the value of the Busy measure,
it is a clear indicator of under-utilization of a
storage processor, probably caused by a poor
load-balancing mechanism. You may consider
fine-tuning the load balancing algorithm in
such a case, to make sure that load is
handled more quickly and efficiently and
processing bottlenecks are cleared.
Read requests:
Indicates the rate of read
requests to this storage
processor.
Reqs/Sec Comparing the value of these measures
across storage processors will clearly indicate
which processor is overloaded - it could also
shed light on irregularities in load balancing
across the processors. Write requests:
Indicates the rate of write
requests to this storage
processor.
Reqs/Sec
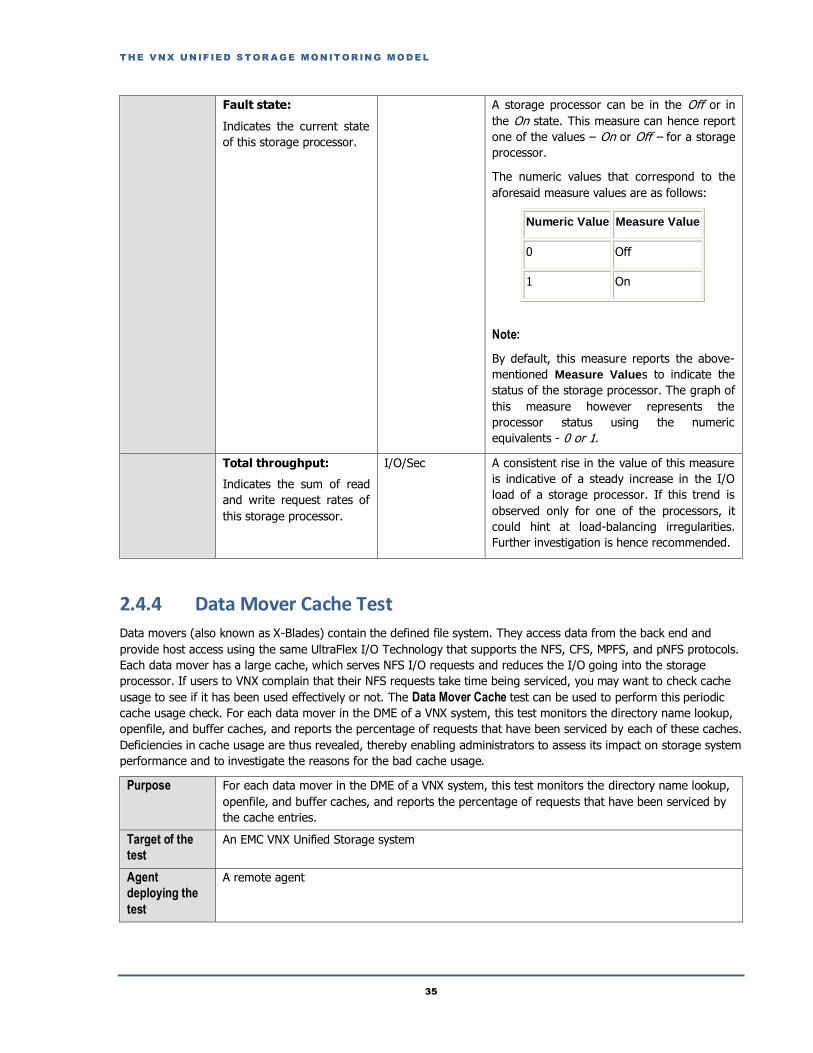
T HE V NX UNIF IE D S T OR A GE MONIT OR ING MOD E L
35
Fault state:
Indicates the current state
of this storage processor.
A storage processor can be in the Off or in
the On state. This measure can hence report
one of the values – On or Off – for a storage
processor.
The numeric values that correspond to the
aforesaid measure values are as follows:
Numeric Value Measure Value
0 Off
1 On
Note:
By default, this measure reports the above-
mentioned Measure Values to indicate the
status of the storage processor. The graph of
this measure however represents the
processor status using the numeric
equivalents - 0 or 1.
Total throughput:
Indicates the sum of read
and write request rates of
this storage processor.
I/O/Sec A consistent rise in the value of this measure
is indicative of a steady increase in the I/O
load of a storage processor. If this trend is
observed only for one of the processors, it
could hint at load-balancing irregularities.
Further investigation is hence recommended.
2.4.4 Data Mover Cache Test
Data movers (also known as X-Blades) contain the defined file system. They access data from the back end and
provide host access using the same UltraFlex I/O Technology that supports the NFS, CFS, MPFS, and pNFS protocols.
Each data mover has a large cache, which serves NFS I/O requests and reduces the I/O going into the storage
processor. If users to VNX complain that their NFS requests take time being serviced, you may want to check cache
usage to see if it has been used effectively or not. The Data Mover Cache test can be used to perform this periodic
cache usage check. For each data mover in the DME of a VNX system, this test monitors the directory name lookup,
openfile, and buffer caches, and reports the percentage of requests that have been serviced by each of these caches.
Deficiencies in cache usage are thus revealed, thereby enabling administrators to assess its impact on storage system
performance and to investigate the reasons for the bad cache usage.
Purpose For each data mover in the DME of a VNX system, this test monitors the directory name lookup,
openfile, and buffer caches, and reports the percentage of requests that have been serviced by
the cache entries.
Target of the
test
An EMC VNX Unified Storage system
Agent
deploying the
test
A remote agent

T HE V NX UNIF IE D S T OR A GE MONIT OR ING MOD E L
36
Configurable
parameters for
the test
1. TEST PERIOD – How often should the test be executed
2. HOST – The IP address of the storage device
3. CONTROLLER STATION IP – The Control Station is the management station for the VNX
for File system, and enables control and configuration of the system. The eG agent uses the
CLI that runs on the Control Station to monitor and manage the performance of the VNX for
File system. To enable the eG agent to use this CLI, specify the IP address of the Control
Station in the CONTROLLER STATION IP text box. By default, the IP address of the
HOST will be displayed here.
Outputs of the
test
One set of results for each data mover in the DME of the EMC VNX Unified Storage system
Measurements
made by the
test
Measurement Measurement
Unit Interpretation
DNLC hit ratio:
Indicates the percentage of
time the requested
directory pathname was
readily available in the
Directory Name Lookup
Cache (DNLC) without
requiring to perform disk
I/O on this data mover.
Percent A high value of this measure (close to 80%)
indicates that the Directory Name Lookup
Cache is being utilized well. A smaller value is
a cause for concern, as it not only indicates
poor cache usage, but also implies that direct
disk accesses are more. One of the key
reasons for a low value for this measure is an
improperly sized directory name lookup
cache. If this is the case, then, you may want
to increase the DNLC size to improve cache
usage and reduce the I/O going straight to
the disk.
Open file hit ratio:
Indicates the percentage of
time the requested file is
readily available in the
open file cache without
requiring to perform disk
I/O on this data mover.
Percent A high value of this measure (close to 80%)
indicates that the open file cache is being
utilized well. A smaller value is a cause for
concern, as it not only indicates poor cache
usage, but also implies that direct disk
accesses are more. One of the key reasons
for a low value for this measure is an
improperly sized open file cache. If this is the
case, then, you may want to increase the size
of this cache to improve cache usage and
reduce the I/O going straight to the disk.
Kernel buffer hit ratio:
Indicates the percentage of
requested pages that were
readily available in the
buffer memory of this data
mover without performing
disk I/O.
Percent A high value of this measure (close to 80%)
indicates that the kernel buffer cache is being
utilized well. A smaller value is a cause for
concern, as it not only indicates poor cache
usage, but also implies that direct disk
accesses are more. One of the key reasons
for a low value for this measure is an
improperly sized open file cache. If this is the
case, then, you may want to increase the size
of this cache to improve cache usage and
reduce the I/O going straight to the disk.
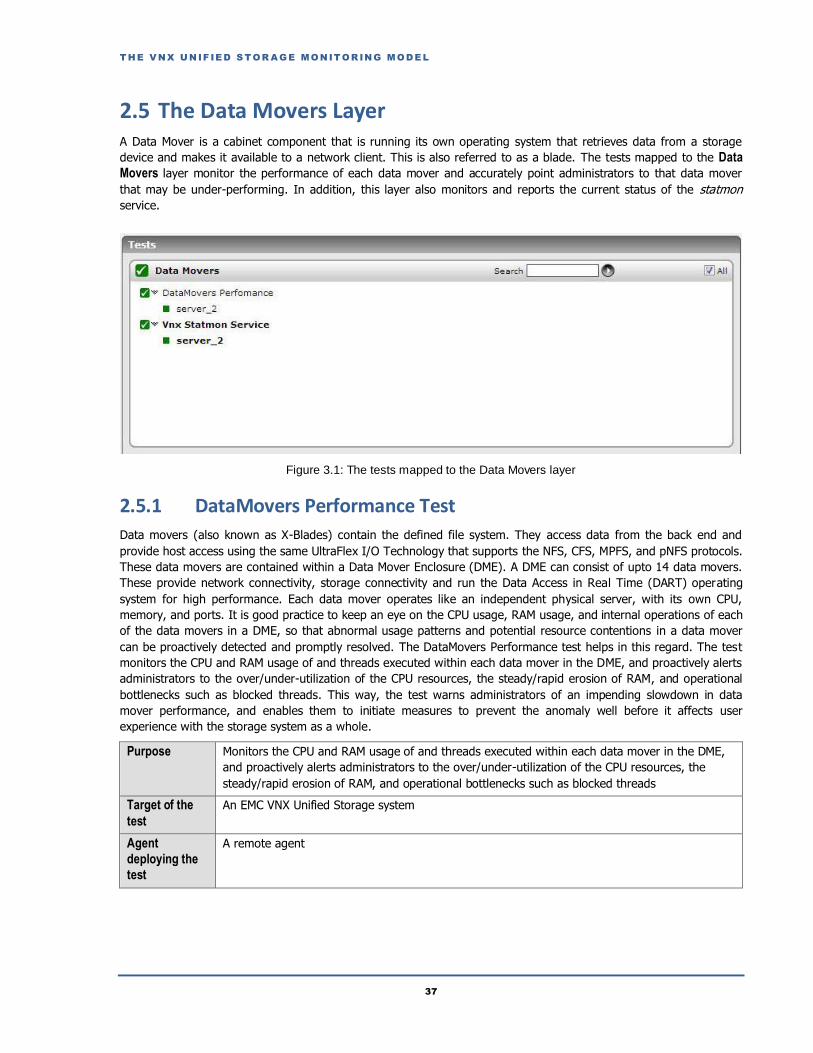
T HE V NX UNIF IE D S T OR A GE MONIT OR ING MOD E L
37
2.5 The Data Movers Layer A Data Mover is a cabinet component that is running its own operating system that retrieves data from a storage
device and makes it available to a network client. This is also referred to as a blade. The tests mapped to the Data
Movers layer monitor the performance of each data mover and accurately point administrators to that data mover
that may be under-performing. In addition, this layer also monitors and reports the current status of the statmon
service.
Figure 3.1: The tests mapped to the Data Movers layer
2.5.1 DataMovers Performance Test
Data movers (also known as X-Blades) contain the defined file system. They access data from the back end and
provide host access using the same UltraFlex I/O Technology that supports the NFS, CFS, MPFS, and pNFS protocols.
These data movers are contained within a Data Mover Enclosure (DME). A DME can consist of upto 14 data movers.
These provide network connectivity, storage connectivity and run the Data Access in Real Time (DART) operating
system for high performance. Each data mover operates like an independent physical server, with its own CPU,
memory, and ports. It is good practice to keep an eye on the CPU usage, RAM usage, and internal operations of each
of the data movers in a DME, so that abnormal usage patterns and potential resource contentions in a data mover
can be proactively detected and promptly resolved. The DataMovers Performance test helps in this regard. The test
monitors the CPU and RAM usage of and threads executed within each data mover in the DME, and proactively alerts
administrators to the over/under-utilization of the CPU resources, the steady/rapid erosion of RAM, and operational
bottlenecks such as blocked threads. This way, the test warns administrators of an impending slowdown in data
mover performance, and enables them to initiate measures to prevent the anomaly well before it affects user
experience with the storage system as a whole.
Purpose Monitors the CPU and RAM usage of and threads executed within each data mover in the DME,
and proactively alerts administrators to the over/under-utilization of the CPU resources, the
steady/rapid erosion of RAM, and operational bottlenecks such as blocked threads
Target of the
test
An EMC VNX Unified Storage system
Agent
deploying the
test
A remote agent
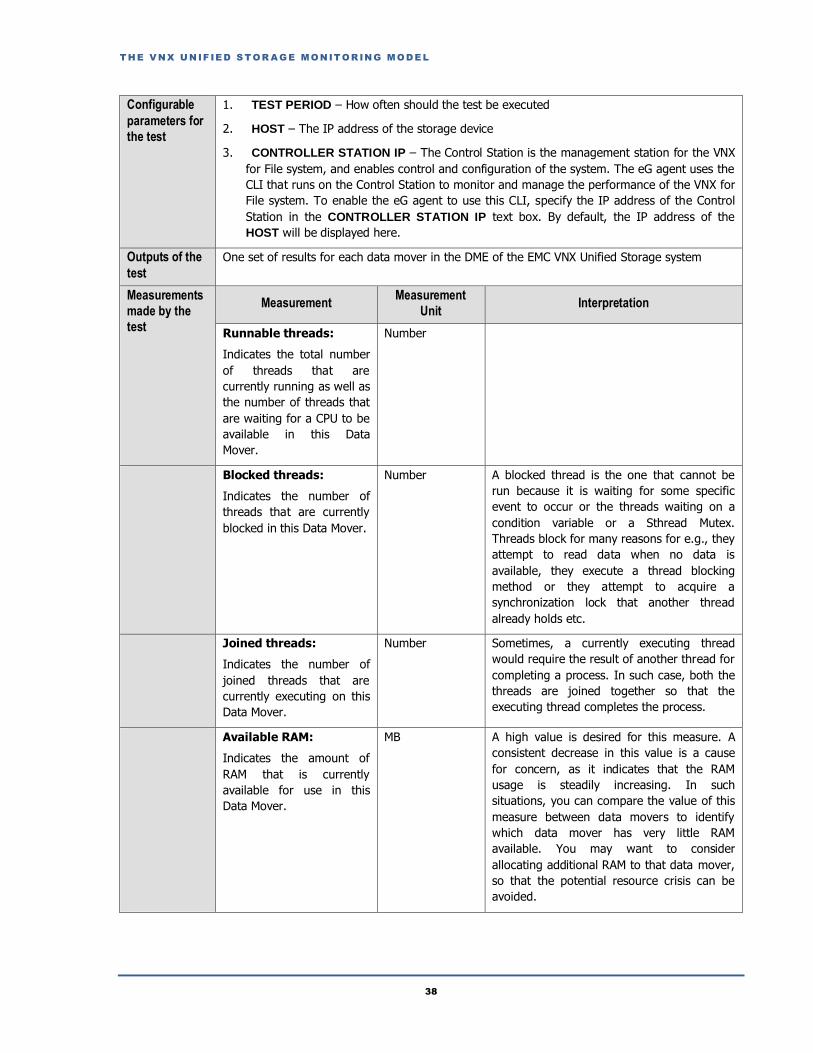
T HE V NX UNIF IE D S T OR A GE MONIT OR ING MOD E L
38
Configurable
parameters for
the test
1. TEST PERIOD – How often should the test be executed
2. HOST – The IP address of the storage device
3. CONTROLLER STATION IP – The Control Station is the management station for the VNX
for File system, and enables control and configuration of the system. The eG agent uses the
CLI that runs on the Control Station to monitor and manage the performance of the VNX for
File system. To enable the eG agent to use this CLI, specify the IP address of the Control
Station in the CONTROLLER STATION IP text box. By default, the IP address of the
HOST will be displayed here.
Outputs of the
test
One set of results for each data mover in the DME of the EMC VNX Unified Storage system
Measurements
made by the
test
Measurement Measurement
Unit Interpretation
Runnable threads:
Indicates the total number
of threads that are
currently running as well as
the number of threads that
are waiting for a CPU to be
available in this Data
Mover.
Number
Blocked threads:
Indicates the number of
threads that are currently
blocked in this Data Mover.
Number A blocked thread is the one that cannot be
run because it is waiting for some specific
event to occur or the threads waiting on a
condition variable or a Sthread Mutex.
Threads block for many reasons for e.g., they
attempt to read data when no data is
available, they execute a thread blocking
method or they attempt to acquire a
synchronization lock that another thread
already holds etc.
Joined threads:
Indicates the number of
joined threads that are
currently executing on this
Data Mover.
Number Sometimes, a currently executing thread
would require the result of another thread for
completing a process. In such case, both the
threads are joined together so that the
executing thread completes the process.
Available RAM:
Indicates the amount of
RAM that is currently
available for use in this
Data Mover.
MB A high value is desired for this measure. A
consistent decrease in this value is a cause
for concern, as it indicates that the RAM
usage is steadily increasing. In such
situations, you can compare the value of this
measure between data movers to identify
which data mover has very little RAM
available. You may want to consider
allocating additional RAM to that data mover,
so that the potential resource crisis can be
avoided.

T HE V NX UNIF IE D S T OR A GE MONIT OR ING MOD E L
39
CPU idle:
Indicates the percentage of
time the CPU of this Data
Mover was idle.
Percent Comparing the value of this measure across
all the Data Movers of the EMC VNX Storage
system will reveal which data mover is not
using its CPU effectively.
CPU busy:
Indicates the percentage of
time the CPU of this Data
Mover was busy.
Percent Comparing the value of this measure across
all the Data Movers of the EMC VNX Storage
system will reveal which data mover is
making maximum use of its CPU resources. A
value close to 100% is a cause for concern,
as it indicates excessive CPU usage, and calls
for allocation of more CPU resources to that
data mover.
2.5.2 Vnx Statmon Service Test
The statMonService, when setup and started on a data mover, listens for requests for statistics related to that data
mover from the Control Station and returns the statistics so requested. To monitor and report on data mover
performance, the eG agent relies on the statMonService running inside the data mover. Therefore, if any test
executed by the eG agent on a data mover fails or does not report measures, it would be a good idea to first check
whether the statMonService is up and running on that data mover, before proceeding to troubleshoot. The Vnx
Statmon Service test performs this status check and reports the result. This test queries every data mover in the VNX
for File system for the current status of the statMonService and reports whether the service is currently running or
not. If the service is active on a data mover, the test additionally reports the number of incoming network
connections to that data mover and the maximum number of network connections that are permitted on that data
mover. This way, the test also helps administrators figure out whether/not connection usage is optimal.
Purpose Queries every data mover in the VNX for File system for the current status of the statMonService
and reports whether the service is currently running or not. If the service is active on a data
mover, the test additionally reports the number of incoming network connections to that data
mover and the maximum number of network connections that are permitted on that data mover
Target of the
test
An EMC VNX Unified Storage system
Agent
deploying the
test
A remote agent
Configurable
parameters for
the test
1. TEST PERIOD – How often should the test be executed
2. HOST – The IP address of the storage device
3. CONTROLLER STATION IP – The Control Station is the management station for the VNX
for File system, and enables control and configuration of the system. The eG agent uses the
CLI that runs on the Control Station to monitor and manage the performance of the VNX for
File system. To enable the eG agent to use this CLI, specify the IP address of the Control
Station in the CONTROLLER STATION IP text box. By default, the IP address of the
HOST will be displayed here.
Outputs of the
test
One set of results for each data mover in the DME of the EMC VNX Unified Storage system

T HE V NX UNIF IE D S T OR A GE MONIT OR ING MOD E L
40
Measurements
made by the
test
Measurement Measurement
Unit Interpretation
Is service available?:
Indicates whether/not the
statmon service is started
on this Data Mover.
If the statmon service is started, then this
measure will report the value Yes. If the
statmon service is not started, then this
measure will report the value No.
The table below lists the numeric values that
correspond to each of the states mentioned
above:
State Numeric
Value
Yes 1
No 0
Note:
Typically, this measure will report the States
indicated in the table above as its values.
However, in the graph of this measure, the
States will be represented using their numeric
equivalents only - i.e., 0 and 1.
Maximum connections:
Indicates the maximum
number of network
connections that can be
established with this data
mover.
Number
Current connections:
Indicates the current
number of network
connections to this data
mover.
Number
Connection usage:
Indicates the percentage of
permitted connections that
are currently in use.
Percent A low value is desired for this measure. A
value close to 100% indicates that too many
connections have been established with the
data mover. Compare the value of this
measure across data movers to identify which
data mover will very shortly be rendered
inaccessible because of a lack of connections.
You may consider pre-emptively resetting the
maximum number of connections of that data
mover to avoid such an outcome.

T HE V NX UNIF IE D S T OR A GE MONIT OR ING MOD E L
41
2.6 The File Access Protocols Layer The tests mapped to this layer monitors the CIFS and NFS calls to each data mover on VNX and measures how
efficiently the data movers handle these calls.
Figure 3.2: The tests mapped to the File Access Protocols layer
2.6.1 CIFS Performance Test
EMC VNX uses Common Internet File System (CIFS) protocol as an open standard for network file service. CIFS is a
file access protocol designed for the Internet and is based on the Server Message Block (SMB) protocol that the
Microsoft Windows operating system uses for distributed file sharing. The CIFS protocol lets remote users access file
systems over the network. You can configure the CIFS protocol on a data mover to enable that data mover to allow
remote users to access the file systems that it contains via CIFS. By continuously monitoring the CIFS operations on
every data mover, you can easily identify that data mover on which CIFS is most ineffective/problematic. This is
where, the CIFS Performance test helps. This test monitors the CIFS reads and writes performed on each data mover
in the VNX system and reports the following:
The number of CIFS protocol connections to the data mover;
The number of CIFS files that are currently open on the data mover;
How well the I/O operations were performed using the CIFS protocol, and whether any delays were noticed;
The total amount of data transacted when performing CIFS reads and writes
These statistics will not only enable administrators to promptly detect current or probable latencies in I/O operations
when using CIFS, but will also help them figure out which I/O activity was most latent – i.e., whether reading or
writing – and on which data mover.
Purpose Monitors the CIFS reads and writes performed on each data mover in the VNX system and
reports the following:
The number of CIFS protocol connections to the data mover;
The number of CIFS files that are currently open on the data mover;
How well the I/O operations were performed using the CIFS protocol, and whether any
delays were noticed;
The total amount of data transacted when performing CIFS reads and writes
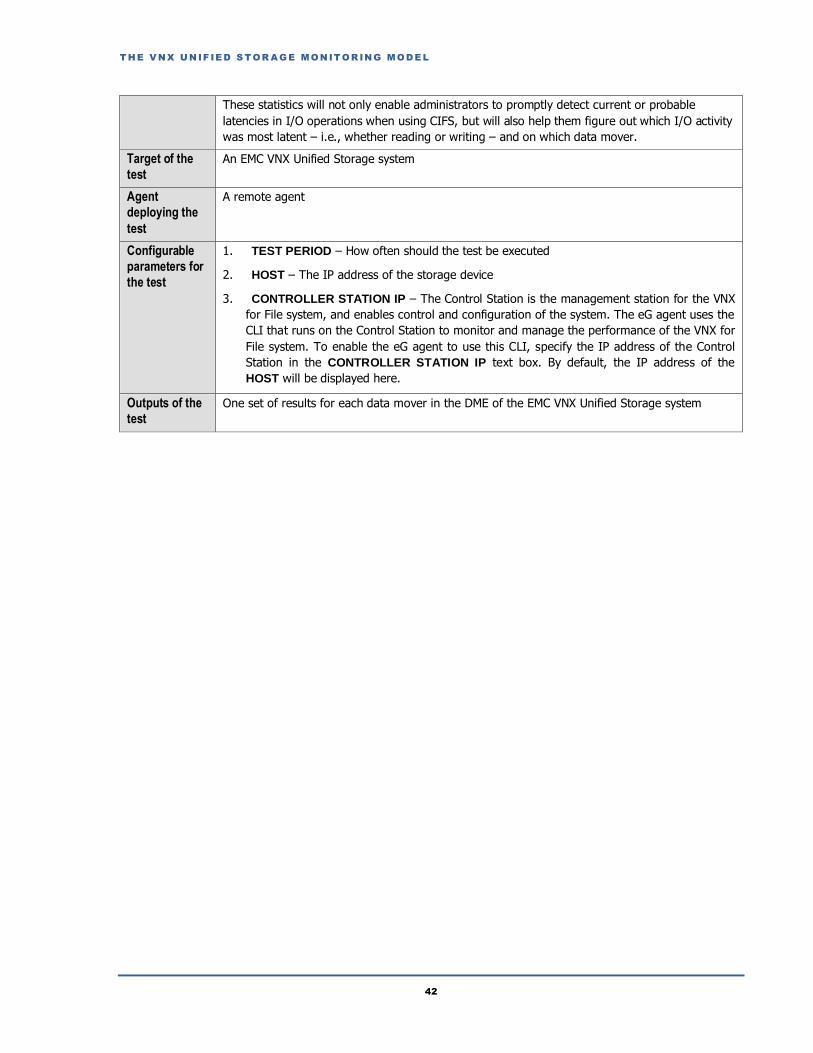
T HE V NX UNIF IE D S T OR A GE MONIT OR ING MOD E L
42
These statistics will not only enable administrators to promptly detect current or probable
latencies in I/O operations when using CIFS, but will also help them figure out which I/O activity
was most latent – i.e., whether reading or writing – and on which data mover.
Target of the
test
An EMC VNX Unified Storage system
Agent
deploying the
test
A remote agent
Configurable
parameters for
the test
1. TEST PERIOD – How often should the test be executed
2. HOST – The IP address of the storage device
3. CONTROLLER STATION IP – The Control Station is the management station for the VNX
for File system, and enables control and configuration of the system. The eG agent uses the
CLI that runs on the Control Station to monitor and manage the performance of the VNX for
File system. To enable the eG agent to use this CLI, specify the IP address of the Control
Station in the CONTROLLER STATION IP text box. By default, the IP address of the
HOST will be displayed here.
Outputs of the
test
One set of results for each data mover in the DME of the EMC VNX Unified Storage system
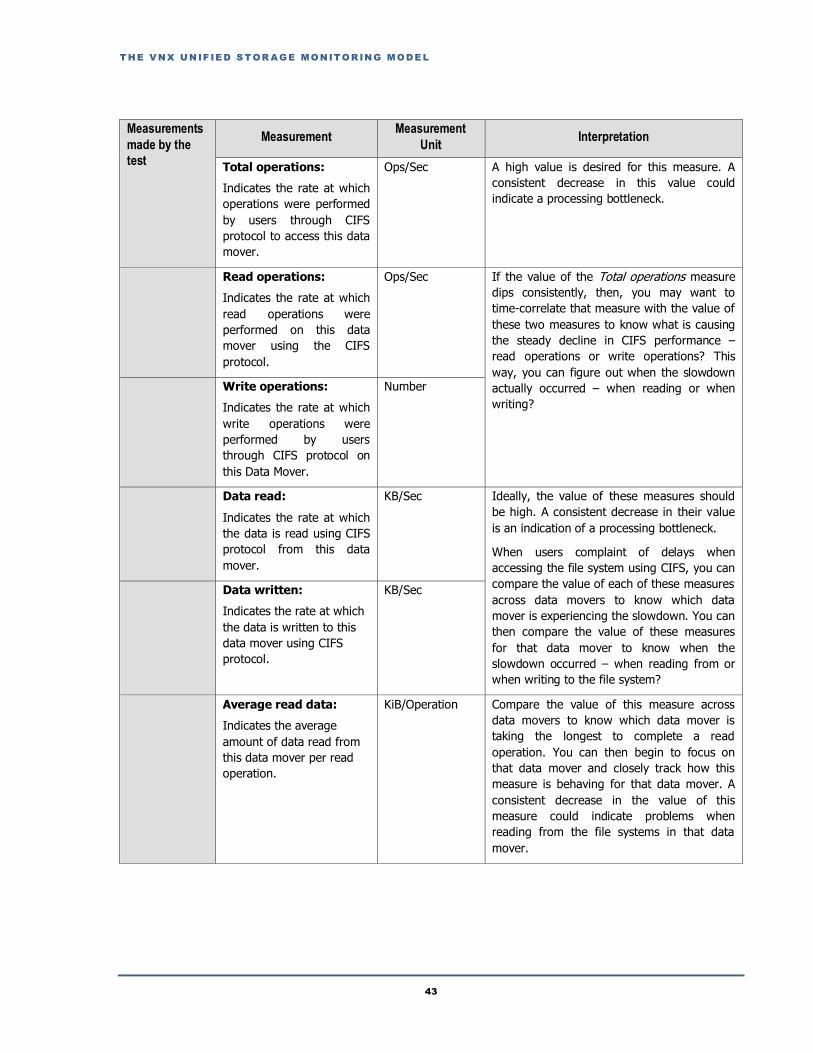
T HE V NX UNIF IE D S T OR A GE MONIT OR ING MOD E L
43
Measurements
made by the
test
Measurement Measurement
Unit Interpretation
Total operations:
Indicates the rate at which
operations were performed
by users through CIFS
protocol to access this data
mover.
Ops/Sec A high value is desired for this measure. A
consistent decrease in this value could
indicate a processing bottleneck.
Read operations:
Indicates the rate at which
read operations were
performed on this data
mover using the CIFS
protocol.
Ops/Sec If the value of the Total operations measure
dips consistently, then, you may want to
time-correlate that measure with the value of
these two measures to know what is causing
the steady decline in CIFS performance –
read operations or write operations? This
way, you can figure out when the slowdown
actually occurred – when reading or when
writing?
Write operations:
Indicates the rate at which
write operations were
performed by users
through CIFS protocol on
this Data Mover.
Number
Data read:
Indicates the rate at which
the data is read using CIFS
protocol from this data
mover.
KB/Sec Ideally, the value of these measures should
be high. A consistent decrease in their value
is an indication of a processing bottleneck.
When users complaint of delays when
accessing the file system using CIFS, you can
compare the value of each of these measures
across data movers to know which data
mover is experiencing the slowdown. You can
then compare the value of these measures
for that data mover to know when the
slowdown occurred – when reading from or
when writing to the file system?
Data written:
Indicates the rate at which
the data is written to this
data mover using CIFS
protocol.
KB/Sec
Average read data:
Indicates the average
amount of data read from
this data mover per read
operation.
KiB/Operation Compare the value of this measure across
data movers to know which data mover is
taking the longest to complete a read
operation. You can then begin to focus on
that data mover and closely track how this
measure is behaving for that data mover. A
consistent decrease in the value of this
measure could indicate problems when
reading from the file systems in that data
mover.

T HE V NX UNIF IE D S T OR A GE MONIT OR ING MOD E L
44
Average write data:
Indicates the average
amount of data written to
this data mover per write
operation.
KiB/Operation Compare the value of this measure across
data movers to know which data mover is
taking the longest to complete a write
operation. You can then begin to focus on
that data mover and closely track how this
measure is behaving for that data mover. A
consistent decrease in the value of this
measure could indicate problems when
writing into the file systems in that data
mover.
2.6.2 NFS Performance Test
NFS (Network File System) is a protocol used by Unix system to access data on the storage system. When a VNX for
File is configured as an NFS server, file systems are mounted on a Data Mover and a path to that file system is
exported. Exported file systems are then available across the network and can be mounted by remote users.
An NFS-configured Data mover does the following:
Provides access to the exported file system through an IP network.
Authenticates the user if using a secure NFS.
Performs authorization by:
o Comparing the access rights of the NFS client by requesting information with the access rights
defined for the exported file system.
o Performing user access control on the file system object.
By continuously monitoring the NFS operations on every data mover, you can easily identify that data mover on
which NFS is most ineffective/problematic. This is where, the NFS Performance test helps. This test monitors the NFS
reads and writes performed on each data mover in the VNX system and reports the following:
The number of NFS operations on the data mover;
The number of active NFS threads;
How well the I/O operations were performed using the NFS protocol, and whether any delays were noticed;
The total amount of data transacted when performing NFS reads and writes
These statistics will not only enable administrators to promptly detect current or probable latencies in I/O operations
when using NFS, but will also help them figure out which I/O activity was most latent – i.e., whether reading or
writing – and on which data mover.
Purpose
Monitors the NFS reads and writes performed on each data mover in the VNX system and
reports the following:
The number of NFS operations on the data mover;
The number of active NFS threads;
How well the I/O operations were performed using the NFS protocol, and whether any
delays were noticed;
The total amount of data transacted when performing NFS reads and writes
These statistics will not only enable administrators to promptly detect current or probable
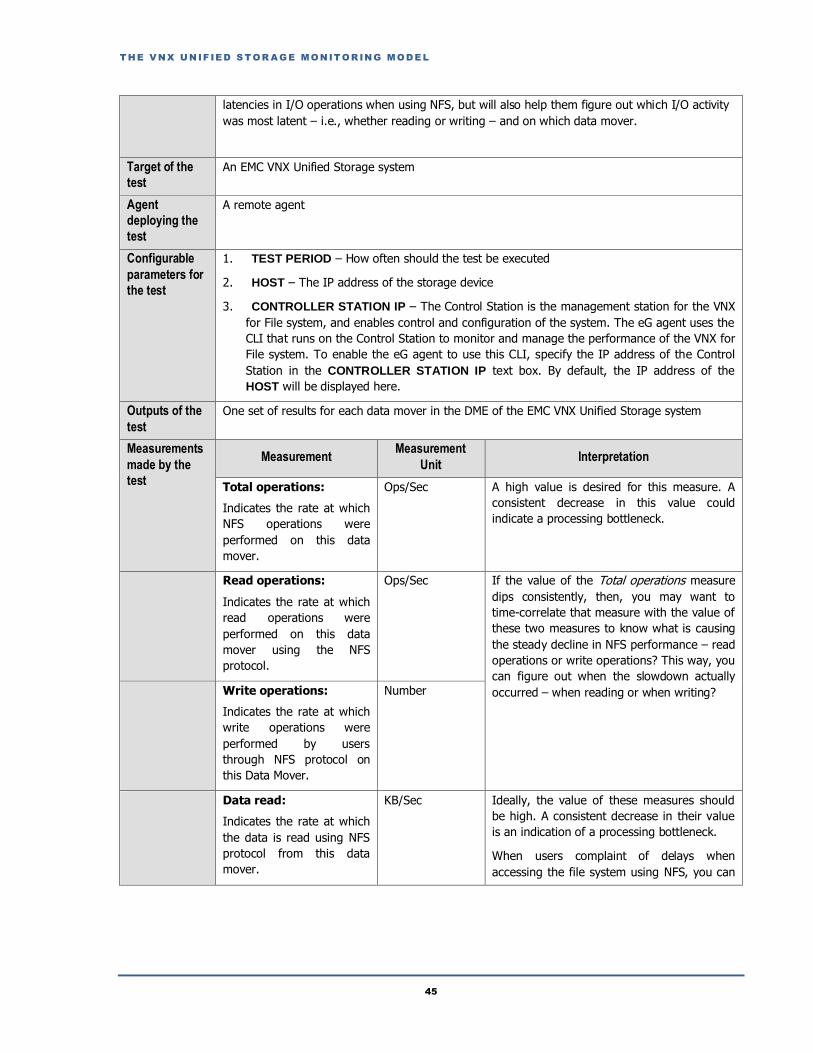
T HE V NX UNIF IE D S T OR A GE MONIT OR ING MOD E L
45
latencies in I/O operations when using NFS, but will also help them figure out which I/O activity
was most latent – i.e., whether reading or writing – and on which data mover.
Target of the
test
An EMC VNX Unified Storage system
Agent
deploying the
test
A remote agent
Configurable
parameters for
the test
1. TEST PERIOD – How often should the test be executed
2. HOST – The IP address of the storage device
3. CONTROLLER STATION IP – The Control Station is the management station for the VNX
for File system, and enables control and configuration of the system. The eG agent uses the
CLI that runs on the Control Station to monitor and manage the performance of the VNX for
File system. To enable the eG agent to use this CLI, specify the IP address of the Control
Station in the CONTROLLER STATION IP text box. By default, the IP address of the
HOST will be displayed here.
Outputs of the
test
One set of results for each data mover in the DME of the EMC VNX Unified Storage system
Measurements
made by the
test
Measurement Measurement
Unit Interpretation
Total operations:
Indicates the rate at which
NFS operations were
performed on this data
mover.
Ops/Sec A high value is desired for this measure. A
consistent decrease in this value could
indicate a processing bottleneck.
Read operations:
Indicates the rate at which
read operations were
performed on this data
mover using the NFS
protocol.
Ops/Sec If the value of the Total operations measure
dips consistently, then, you may want to
time-correlate that measure with the value of
these two measures to know what is causing
the steady decline in NFS performance – read
operations or write operations? This way, you
can figure out when the slowdown actually
occurred – when reading or when writing? Write operations:
Indicates the rate at which
write operations were
performed by users
through NFS protocol on
this Data Mover.
Number
Data read:
Indicates the rate at which
the data is read using NFS
protocol from this data
mover.
KB/Sec Ideally, the value of these measures should
be high. A consistent decrease in their value
is an indication of a processing bottleneck.
When users complaint of delays when
accessing the file system using NFS, you can
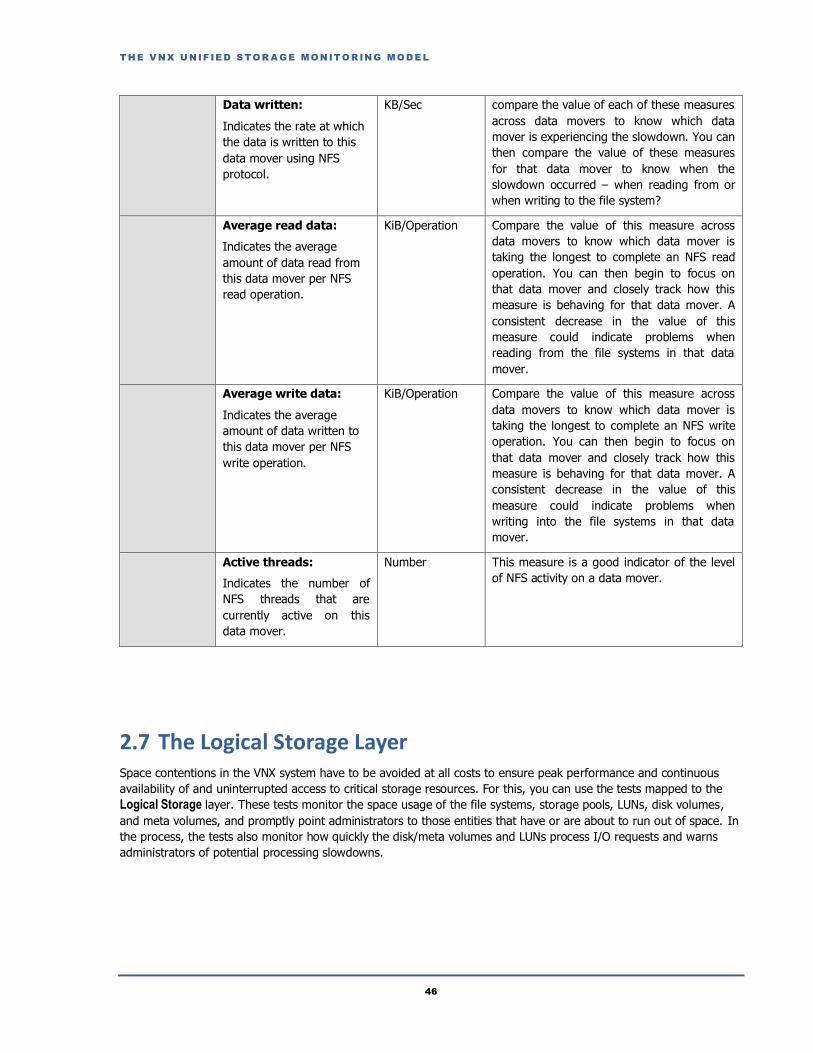
T HE V NX UNIF IE D S T OR A GE MONIT OR ING MOD E L
46
Data written:
Indicates the rate at which
the data is written to this
data mover using NFS
protocol.
KB/Sec compare the value of each of these measures
across data movers to know which data
mover is experiencing the slowdown. You can
then compare the value of these measures
for that data mover to know when the
slowdown occurred – when reading from or
when writing to the file system?
Average read data:
Indicates the average
amount of data read from
this data mover per NFS
read operation.
KiB/Operation Compare the value of this measure across
data movers to know which data mover is
taking the longest to complete an NFS read
operation. You can then begin to focus on
that data mover and closely track how this
measure is behaving for that data mover. A
consistent decrease in the value of this
measure could indicate problems when
reading from the file systems in that data
mover.
Average write data:
Indicates the average
amount of data written to
this data mover per NFS
write operation.
KiB/Operation Compare the value of this measure across
data movers to know which data mover is
taking the longest to complete an NFS write
operation. You can then begin to focus on
that data mover and closely track how this
measure is behaving for that data mover. A
consistent decrease in the value of this
measure could indicate problems when
writing into the file systems in that data
mover.
Active threads:
Indicates the number of
NFS threads that are
currently active on this
data mover.
Number This measure is a good indicator of the level
of NFS activity on a data mover.
2.7 The Logical Storage Layer Space contentions in the VNX system have to be avoided at all costs to ensure peak performance and continuous
availability of and uninterrupted access to critical storage resources. For this, you can use the tests mapped to the
Logical Storage layer. These tests monitor the space usage of the file systems, storage pools, LUNs, disk volumes,
and meta volumes, and promptly point administrators to those entities that have or are about to run out of space. In
the process, the tests also monitor how quickly the disk/meta volumes and LUNs process I/O requests and warns
administrators of potential processing slowdowns.
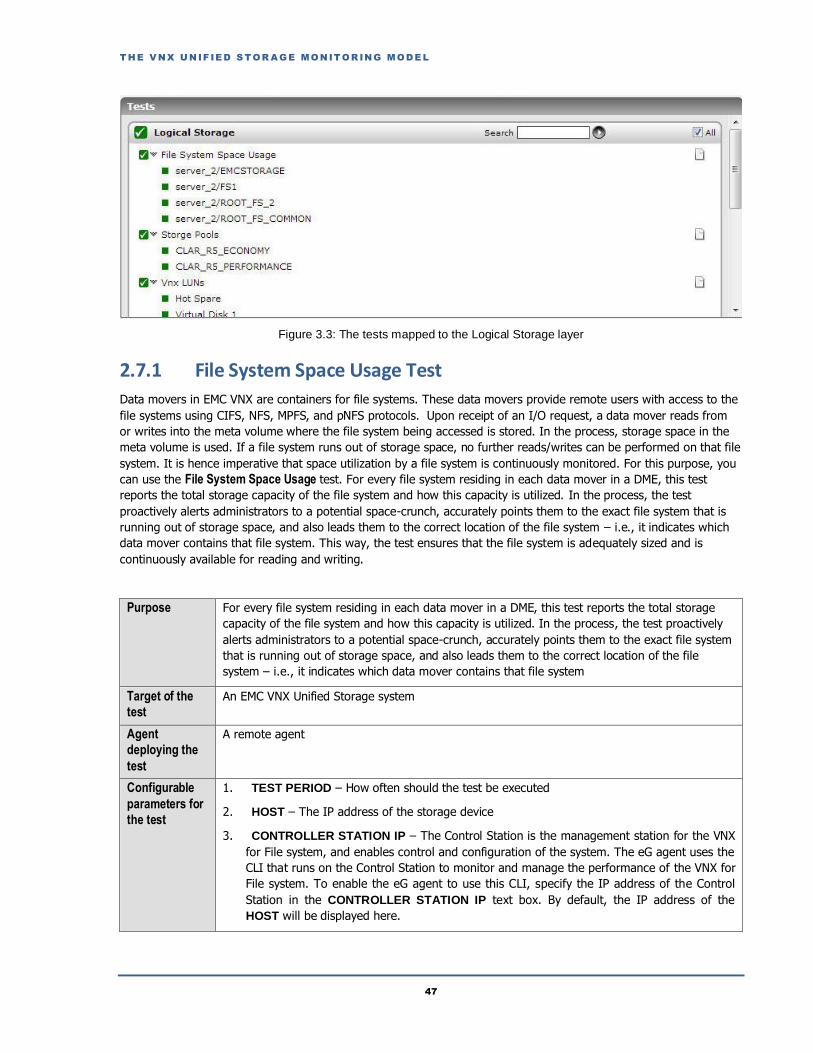
T HE V NX UNIF IE D S T OR A GE MONIT OR ING MOD E L
47
Figure 3.3: The tests mapped to the Logical Storage layer
2.7.1 File System Space Usage Test
Data movers in EMC VNX are containers for file systems. These data movers provide remote users with access to the
file systems using CIFS, NFS, MPFS, and pNFS protocols. Upon receipt of an I/O request, a data mover reads from
or writes into the meta volume where the file system being accessed is stored. In the process, storage space in the
meta volume is used. If a file system runs out of storage space, no further reads/writes can be performed on that file
system. It is hence imperative that space utilization by a file system is continuously monitored. For this purpose, you
can use the File System Space Usage test. For every file system residing in each data mover in a DME, this test
reports the total storage capacity of the file system and how this capacity is utilized. In the process, the test
proactively alerts administrators to a potential space-crunch, accurately points them to the exact file system that is
running out of storage space, and also leads them to the correct location of the file system – i.e., it indicates which
data mover contains that file system. This way, the test ensures that the file system is adequately sized and is
continuously available for reading and writing.
Purpose
For every file system residing in each data mover in a DME, this test reports the total storage
capacity of the file system and how this capacity is utilized. In the process, the test proactively
alerts administrators to a potential space-crunch, accurately points them to the exact file system
that is running out of storage space, and also leads them to the correct location of the file
system – i.e., it indicates which data mover contains that file system
Target of the
test
An EMC VNX Unified Storage system
Agent
deploying the
test
A remote agent
Configurable
parameters for
the test
1. TEST PERIOD – How often should the test be executed
2. HOST – The IP address of the storage device
3. CONTROLLER STATION IP – The Control Station is the management station for the VNX
for File system, and enables control and configuration of the system. The eG agent uses the
CLI that runs on the Control Station to monitor and manage the performance of the VNX for
File system. To enable the eG agent to use this CLI, specify the IP address of the Control
Station in the CONTROLLER STATION IP text box. By default, the IP address of the
HOST will be displayed here.

T HE V NX UNIF IE D S T OR A GE MONIT OR ING MOD E L
48
Outputs of the
test
One set of results for each file system within each data mover in the DME of the EMC VNX
Unified Storage system
Measurements
made by the
test
Measurement Measurement
Unit Interpretation
Total:
Indicates the total storage
capacity of the file system.
MB
Used:
Indicates the amount of
space that is currently used
by this file system.
MB Ideally, the value of this measure should be
low.
Available:
Indicates the amount of
space that is currently
available for use in this file
system.
MB Ideally, the value of this measure should be
high.
Percentage used:
Indicates the percentage of
space that is already
utilized in this file system.
Percent Ideally, the value of this measure should be
low. Compare the value of this measure
across file systems to identify that file system
which is utilizing too much space and may
hence experience a space contention shortly.
If that file system appears to run short of
space frequently, you may want to consider
allocating more storage space to that file
system.
Percentage available:
Indicates the percentage of
space that is currently
unused in this file system.
KB/Sec Ideally, the value of this measure should be
high. Compare the value of this measure
across file systems to identify that file system
which has very limited free space and may
hence experience a space contention shortly.
If that file system appears to run short of
space frequently, you may want to consider
allocating more storage space to that file
system.
T HE V NX UNIF IE D S T OR A GE MONIT OR ING MOD E L
49
2.7.2 Storage Pools Test
File system volumes in the EMC VNX storage system can be organized into groups called storage pools. Storage pools
are used to allocate available storage to the file systems managed by EMC VNX. Without sufficient space, file systems
cannot service I/O requests from users. This is why, the storage pool assigned to a file system has to be frequently
checked for space. The Storage Pools test enables this check. This test monitors the usage of space in every storage
pool and proactively alerts administrators if the storage space in any pool is about to be used up completely! This
way, the test prompts administrators to right-size their storage pools, so that users have no issues accessing their file
systems.
Purpose
Monitors the usage of space in every storage pool and proactively alerts administrators if the
storage space in any pool is about to be used up completely
Target of the
test
An EMC VNX Unified Storage system
Agent
deploying the
test
A remote agent
Configurable
parameters for
the test
1. TEST PERIOD – How often should the test be executed
2. HOST – The IP address of the storage device
3. CONTROLLER STATION IP – The Control Station is the management station for the VNX
for File system, and enables control and configuration of the system. The eG agent uses the
CLI that runs on the Control Station to monitor and manage the performance of the VNX for
File system. To enable the eG agent to use this CLI, specify the IP address of the Control
Station in the CONTROLLER STATION IP text box. By default, the IP address of the
HOST will be displayed here.
Outputs of the
test
One set of results for each storage pool in the EMC VNX Unified Storage system
Measurements
made by the
test
Measurement Measurement
Unit Interpretation
Used size:
Indicates the space that is
currently in use in this
storage pool.
MB Ideally, the value of this measure should be
low.
Available size:
Indicates the amount of
unused space in this
storage pool.
MB Ideally, the value of this measure should be
high. Compare the value of this measure
across storage pools to identify which storage
pool is about to run out of space. You may
want to add more space to this storage pool
by say, adding more disk volumes to the
pool.
Total size:
Indicates the total capacity
of this storage pool.
MB

T HE V NX UNIF IE D S T OR A GE MONIT OR ING MOD E L
50
Potential space:
Indicates the amount of
available space that can be
added to this storage pool.
MB EMC VNX allows both file systems and
storage pools to automatically grow as
needed based on administrator-defined high
watermarks. This feature is called auto-
extend. The auto-extend feature allows you
to define an upper limit to the amount of
space that can be allocated to a file system
or storage pool. This maximum size
represents the potential size of the file
system/storage pool.
2.7.3 Storage Pools for Block Test
A Storage Pool for Block is a group of drives for configuring pool LUNs (thick and thin). There may be zero or more
pools in a storage system. Disks can only be a member of one pool, and they cannot also be in a separate user-
defined RAID group.
It is good practice to track the state of the individual pools and the usage of pool capacity by the pool LUNs, so that
pools that are not ready for usage yet and pools that do not have adequate space to support the storage needs of
their pool LUNs can be accurately identified. This knowledge will enable administrators to right-size their storage
pools to cater to the storage requirements of the environment. The Storage Pools for Block test provides
administrators with this knowledge. This test auto-discovers the storage pools for block, and for each pool reports its
total capacity, reveals the storage configuration of the LUNs created from that pool, and points to those pools where
LUNs have over-subscribed to the pool capacity. In addition, the test measures how well the LUNs have been using
the total pool capacity, thus highlighting those pools that have been over-utilized and could hence require more
space.
Purpose
auto-discovers the storage pools for block, and for each pool reports its total capacity, reveals
the storage configuration of the LUNs created from that pool, and points to those pools where
LUNs have over-subscribed to the pool capacity. In addition, the test measures how well the
LUNs have been using the total pool capacity, thus highlighting those pools that have been over-
utilized and could hence require more space.
Target of the
test
An EMC VNX Unified Storage system
Agent
deploying the
test
A remote agent
Configurable
parameters for
the test
4. TEST PERIOD – How often should the test be executed
5. HOST – The IP address of the storage device
6. CONTROLLER STATION IP – The Control Station is the management station for the VNX
for File system, and enables control and configuration of the system. The eG agent uses the
CLI that runs on the Control Station to monitor and manage the performance of the VNX for
File system. To enable the eG agent to use this CLI, specify the IP address of the Control
Station in the CONTROLLER STATION IP text box. By default, the IP address of the
HOST will be displayed here.
Outputs of the
test
One set of results for each block storage pool in the EMC VNX Unified Storage system
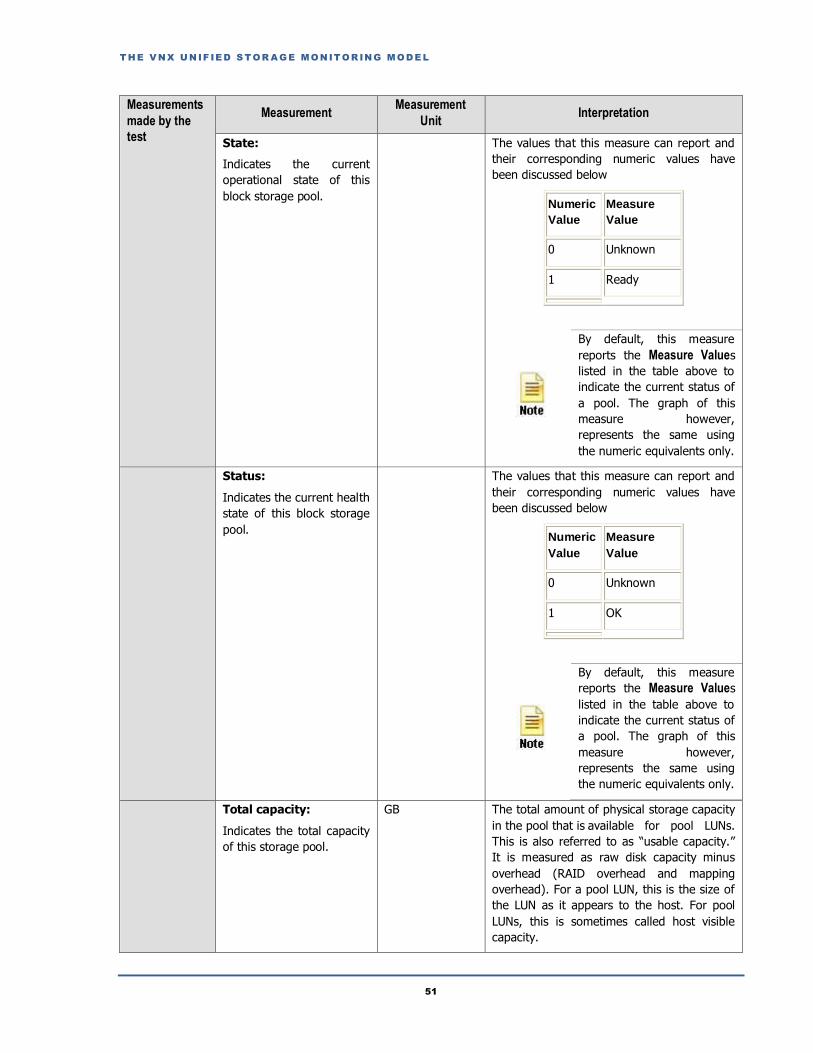
T HE V NX UNIF IE D S T OR A GE MONIT OR ING MOD E L
51
Measurements
made by the
test
Measurement Measurement
Unit Interpretation
State:
Indicates the current
operational state of this
block storage pool.
The values that this measure can report and
their corresponding numeric values have
been discussed below
Numeric
Value
Measure
Value
0 Unknown
1 Ready
By default, this measure
reports the Measure Values
listed in the table above to
indicate the current status of
a pool. The graph of this
measure however,
represents the same using
the numeric equivalents only.
Status:
Indicates the current health
state of this block storage
pool.
The values that this measure can report and
their corresponding numeric values have
been discussed below
Numeric
Value
Measure
Value
0 Unknown
1 OK
By default, this measure
reports the Measure Values
listed in the table above to
indicate the current status of
a pool. The graph of this
measure however,
represents the same using
the numeric equivalents only.
Total capacity:
Indicates the total capacity
of this storage pool.
GB The total amount of physical storage capacity
in the pool that is available for pool LUNs.
This is also referred to as “usable capacity.”
It is measured as raw disk capacity minus
overhead (RAID overhead and mapping
overhead). For a pool LUN, this is the size of
the LUN as it appears to the host. For pool
LUNs, this is sometimes called host visible
capacity.

T HE V NX UNIF IE D S T OR A GE MONIT OR ING MOD E L
52
Allocated capacity:
Indicates the amount of
space currently used by the
LUNs in this pool.
GB For a thin LUN, this is the physical space
used by the LUN. For a thick LUN, this is the
host-visible capacity used by the LUN.
Allocated capacity is slightly larger than the
capacity used by the host because metadata
exists at the pool LUN level.
Allocated:
Indicates the percentage of
total pool capacity that is
used by the LUNs in this
pool.
Percent A value close to 100% indicates that the pool
is running out of usable capacity.
2.7.4 Vnx LUNs Test
A logical unit number (LUN) is a unique identifier used to designate individual or collections of hard disk devices for
address by a protocol associated with a SCSI, iSCSI, Fibre Channel (FC) or similar interface. LUNs are central to the
management of block storage arrays shared over a storage area network (SAN). LUN errors, poor LUN cache usage,
and abnormal I/O activity on the LUNs, if not promptly detected and resolved, can hence significantly degrade the
performance of the block storage array. This is why, it is important that LUN performance is continuously monitored.
This can be achieved using the Vnx LUNS test. This test auto-discovers the LUNs in the VNX for Block system and
reports the current state of each LUN, captures LUN errors, and measures the level of I/O activity on every LUN, so
that administrators are notified of LUN-related problems well before they impact storage system performance.
Purpose Auto-discovers the LUNs in the VNX for Block system and reports the current state of each LUN,
captures LUN errors, and measures the level of I/O activity on every LUN, so that administrators
are notified of LUN-related problems well before they impact storage system performance
Target of the
test
An EMC VNX Unified Storage system
Agent
deploying the
test
A remote agent
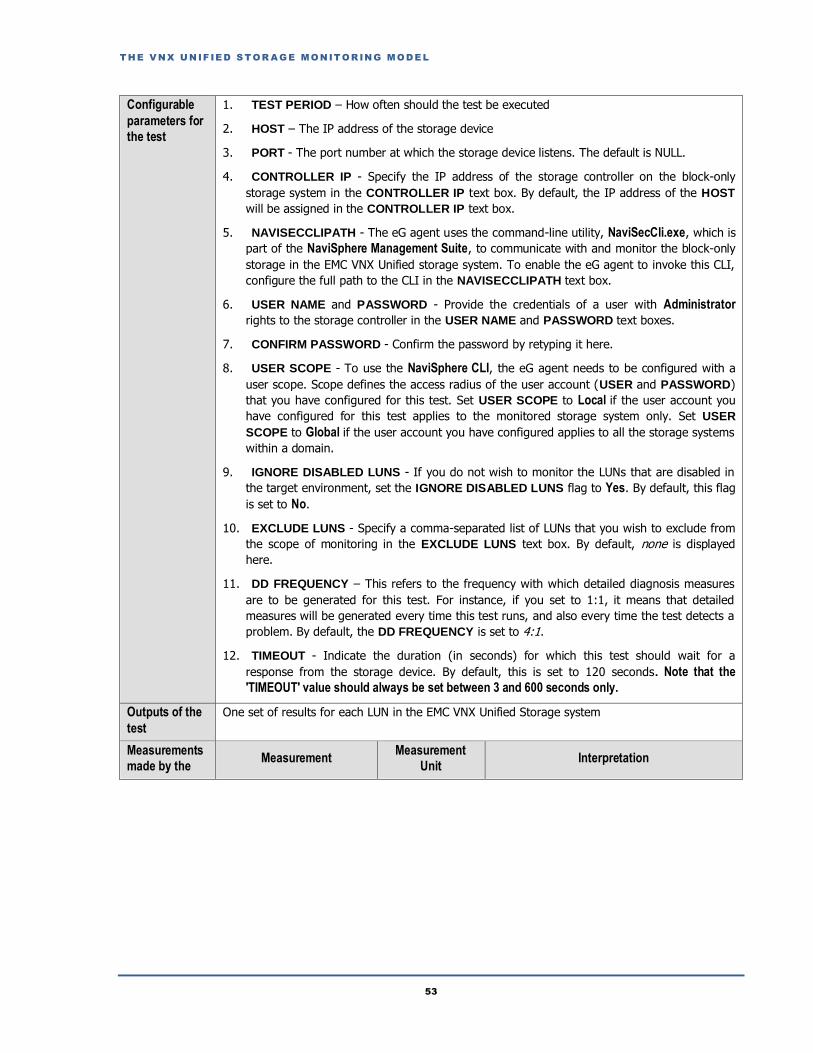
T HE V NX UNIF IE D S T OR A GE MONIT OR ING MOD E L
53
Configurable
parameters for
the test
1. TEST PERIOD – How often should the test be executed
2. HOST – The IP address of the storage device
3. PORT - The port number at which the storage device listens. The default is NULL.
4. CONTROLLER IP - Specify the IP address of the storage controller on the block-only
storage system in the CONTROLLER IP text box. By default, the IP address of the HOST
will be assigned in the CONTROLLER IP text box.
5. NAVISECCLIPATH - The eG agent uses the command-line utility, NaviSecCli.exe, which is
part of the NaviSphere Management Suite, to communicate with and monitor the block-only
storage in the EMC VNX Unified storage system. To enable the eG agent to invoke this CLI,
configure the full path to the CLI in the NAVISECCLIPATH text box.
6. USER NAME and PASSWORD - Provide the credentials of a user with Administrator
rights to the storage controller in the USER NAME and PASSWORD text boxes.
7. CONFIRM PASSWORD - Confirm the password by retyping it here.
8. USER SCOPE - To use the NaviSphere CLI, the eG agent needs to be configured with a
user scope. Scope defines the access radius of the user account (USER and PASSWORD)
that you have configured for this test. Set USER SCOPE to Local if the user account you
have configured for this test applies to the monitored storage system only. Set USER
SCOPE to Global if the user account you have configured applies to all the storage systems
within a domain.
9. IGNORE DISABLED LUNS - If you do not wish to monitor the LUNs that are disabled in
the target environment, set the IGNORE DISABLED LUNS flag to Yes. By default, this flag
is set to No.
10. EXCLUDE LUNS - Specify a comma-separated list of LUNs that you wish to exclude from
the scope of monitoring in the EXCLUDE LUNS text box. By default, none is displayed
here.
11. DD FREQUENCY – This refers to the frequency with which detailed diagnosis measures
are to be generated for this test. For instance, if you set to 1:1, it means that detailed
measures will be generated every time this test runs, and also every time the test detects a
problem. By default, the DD FREQUENCY is set to 4:1.
12. TIMEOUT - Indicate the duration (in seconds) for which this test should wait for a
response from the storage device. By default, this is set to 120 seconds. Note that the
'TIMEOUT' value should always be set between 3 and 600 seconds only.
Outputs of the
test
One set of results for each LUN in the EMC VNX Unified Storage system
Measurements
made by the Measurement
Measurement
Unit Interpretation
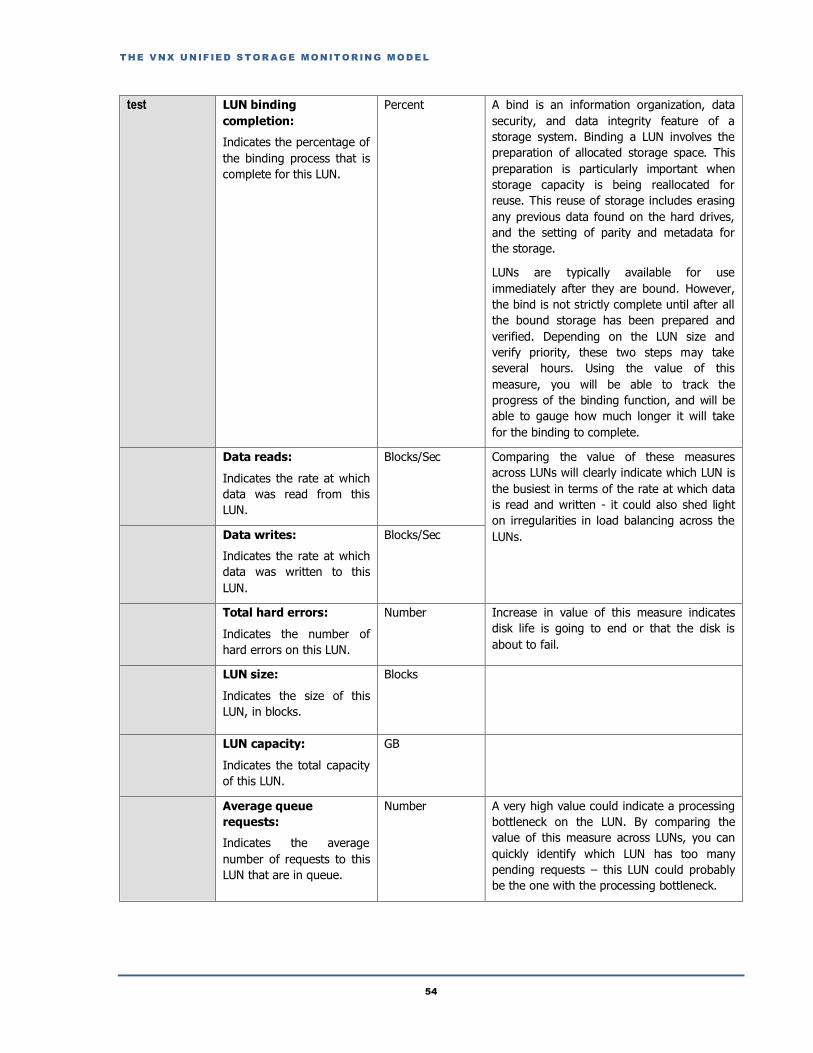
T HE V NX UNIF IE D S T OR A GE MONIT OR ING MOD E L
54
test LUN binding
completion:
Indicates the percentage of
the binding process that is
complete for this LUN.
Percent A bind is an information organization, data
security, and data integrity feature of a
storage system. Binding a LUN involves the
preparation of allocated storage space. This
preparation is particularly important when
storage capacity is being reallocated for
reuse. This reuse of storage includes erasing
any previous data found on the hard drives,
and the setting of parity and metadata for
the storage.
LUNs are typically available for use
immediately after they are bound. However,
the bind is not strictly complete until after all
the bound storage has been prepared and
verified. Depending on the LUN size and
verify priority, these two steps may take
several hours. Using the value of this
measure, you will be able to track the
progress of the binding function, and will be
able to gauge how much longer it will take
for the binding to complete.
Data reads:
Indicates the rate at which
data was read from this
LUN.
Blocks/Sec Comparing the value of these measures
across LUNs will clearly indicate which LUN is
the busiest in terms of the rate at which data
is read and written - it could also shed light
on irregularities in load balancing across the
LUNs. Data writes:
Indicates the rate at which
data was written to this
LUN.
Blocks/Sec
Total hard errors:
Indicates the number of
hard errors on this LUN.
Number Increase in value of this measure indicates
disk life is going to end or that the disk is
about to fail.
LUN size:
Indicates the size of this
LUN, in blocks.
Blocks
LUN capacity:
Indicates the total capacity
of this LUN.
GB
Average queue
requests:
Indicates the average
number of requests to this
LUN that are in queue.
Number A very high value could indicate a processing
bottleneck on the LUN. By comparing the
value of this measure across LUNs, you can
quickly identify which LUN has too many
pending requests – this LUN could probably
be the one with the processing bottleneck.
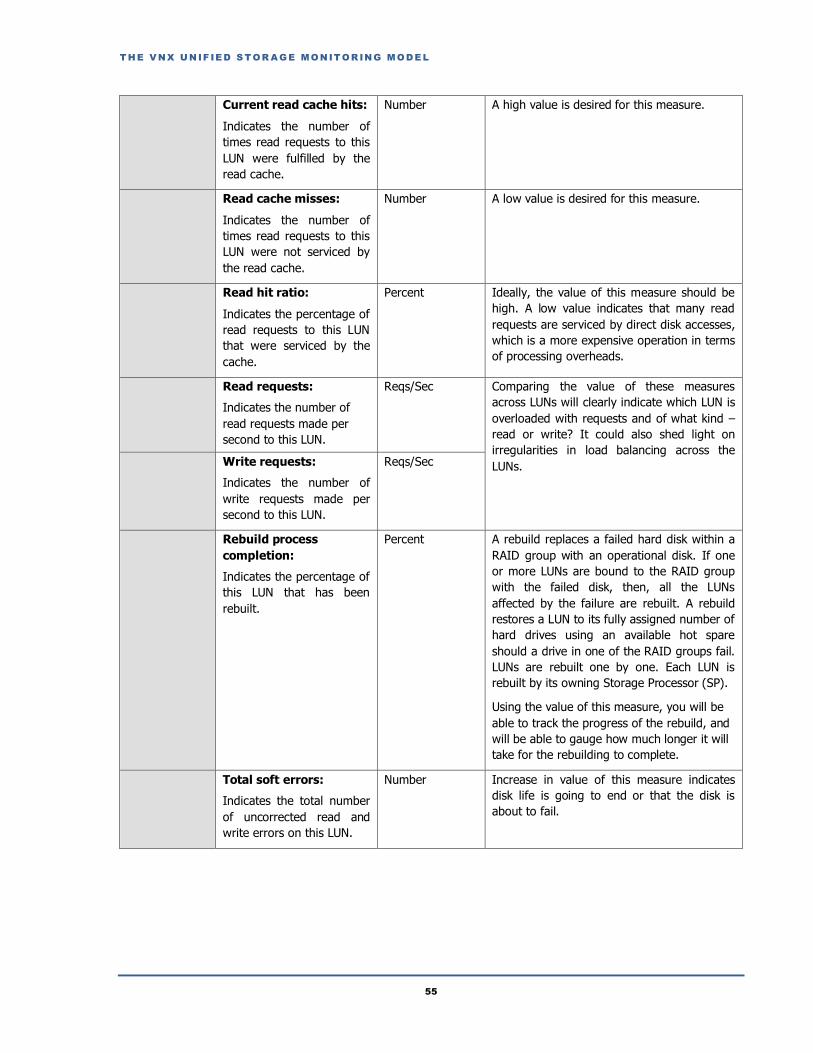
T HE V NX UNIF IE D S T OR A GE MONIT OR ING MOD E L
55
Current read cache hits:
Indicates the number of
times read requests to this
LUN were fulfilled by the
read cache.
Number A high value is desired for this measure.
Read cache misses:
Indicates the number of
times read requests to this
LUN were not serviced by
the read cache.
Number A low value is desired for this measure.
Read hit ratio:
Indicates the percentage of
read requests to this LUN
that were serviced by the
cache.
Percent Ideally, the value of this measure should be
high. A low value indicates that many read
requests are serviced by direct disk accesses,
which is a more expensive operation in terms
of processing overheads.
Read requests:
Indicates the number of
read requests made per
second to this LUN.
Reqs/Sec Comparing the value of these measures
across LUNs will clearly indicate which LUN is
overloaded with requests and of what kind –
read or write? It could also shed light on
irregularities in load balancing across the
LUNs. Write requests:
Indicates the number of
write requests made per
second to this LUN.
Reqs/Sec
Rebuild process
completion:
Indicates the percentage of
this LUN that has been
rebuilt.
Percent A rebuild replaces a failed hard disk within a
RAID group with an operational disk. If one
or more LUNs are bound to the RAID group
with the failed disk, then, all the LUNs
affected by the failure are rebuilt. A rebuild
restores a LUN to its fully assigned number of
hard drives using an available hot spare
should a drive in one of the RAID groups fail.
LUNs are rebuilt one by one. Each LUN is
rebuilt by its owning Storage Processor (SP).
Using the value of this measure, you will be
able to track the progress of the rebuild, and
will be able to gauge how much longer it will
take for the rebuilding to complete.
Total soft errors:
Indicates the total number
of uncorrected read and
write errors on this LUN.
Number Increase in value of this measure indicates
disk life is going to end or that the disk is
about to fail.
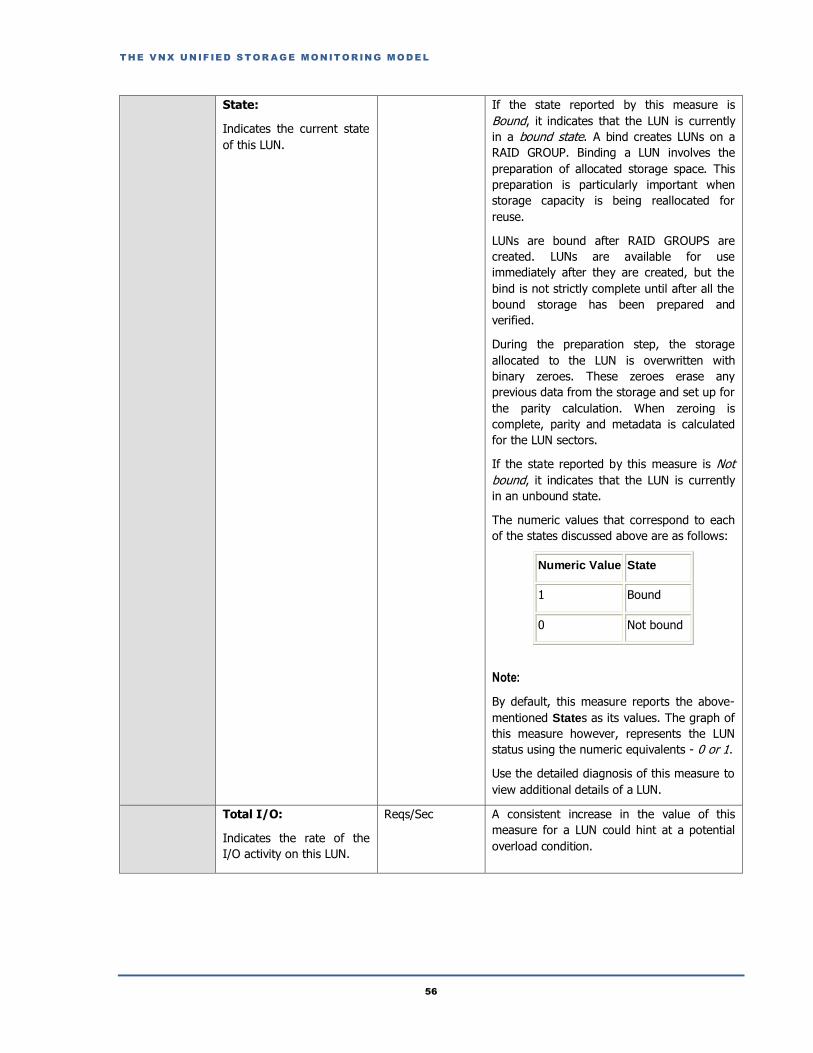
T HE V NX UNIF IE D S T OR A GE MONIT OR ING MOD E L
56
State:
Indicates the current state
of this LUN.
If the state reported by this measure is
Bound, it indicates that the LUN is currently
in a bound state. A bind creates LUNs on a
RAID GROUP. Binding a LUN involves the
preparation of allocated storage space. This
preparation is particularly important when
storage capacity is being reallocated for
reuse.
LUNs are bound after RAID GROUPS are
created. LUNs are available for use
immediately after they are created, but the
bind is not strictly complete until after all the
bound storage has been prepared and
verified.
During the preparation step, the storage
allocated to the LUN is overwritten with
binary zeroes. These zeroes erase any
previous data from the storage and set up for
the parity calculation. When zeroing is
complete, parity and metadata is calculated
for the LUN sectors.
If the state reported by this measure is Not
bound, it indicates that the LUN is currently
in an unbound state.
The numeric values that correspond to each
of the states discussed above are as follows:
Numeric Value State
1 Bound
0 Not bound
Note:
By default, this measure reports the above-
mentioned States as its values. The graph of
this measure however, represents the LUN
status using the numeric equivalents - 0 or 1.
Use the detailed diagnosis of this measure to
view additional details of a LUN.
Total I/O:
Indicates the rate of the
I/O activity on this LUN.
Reqs/Sec A consistent increase in the value of this
measure for a LUN could hint at a potential
overload condition.
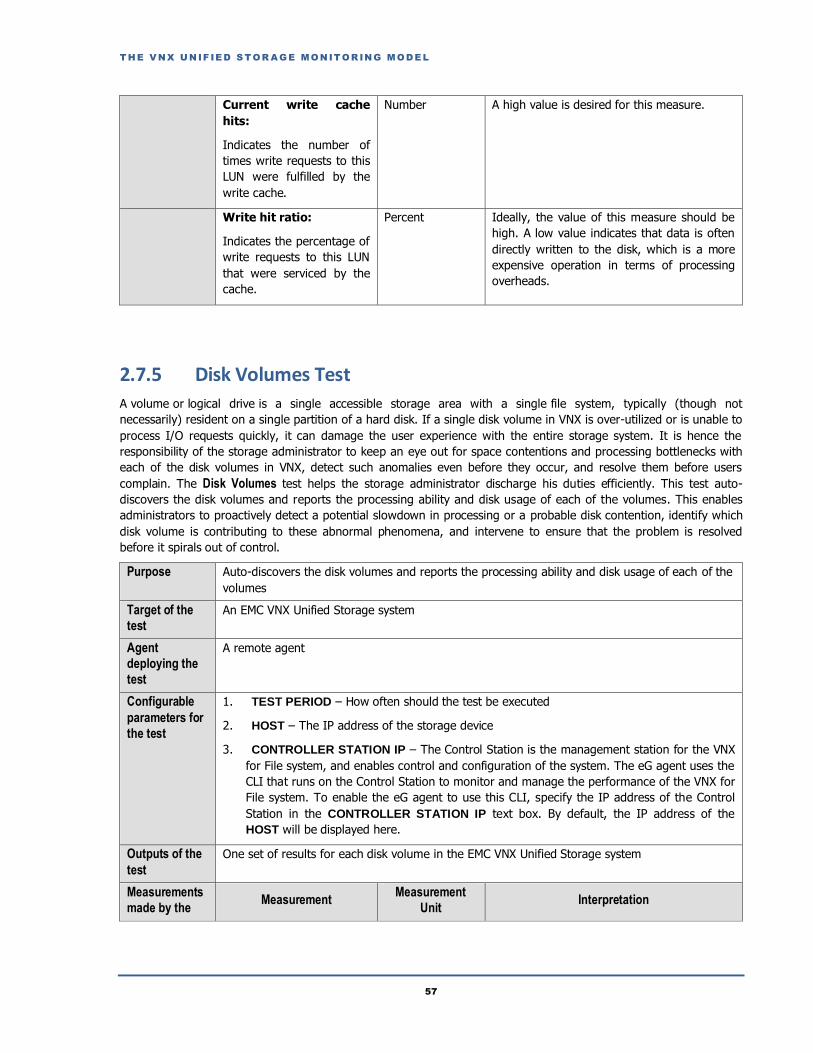
T HE V NX UNIF IE D S T OR A GE MONIT OR ING MOD E L
57
Current write cache
hits:
Indicates the number of
times write requests to this
LUN were fulfilled by the
write cache.
Number A high value is desired for this measure.
Write hit ratio:
Indicates the percentage of
write requests to this LUN
that were serviced by the
cache.
Percent Ideally, the value of this measure should be
high. A low value indicates that data is often
directly written to the disk, which is a more
expensive operation in terms of processing
overheads.
2.7.5 Disk Volumes Test
A volume or logical drive is a single accessible storage area with a single file system, typically (though not
necessarily) resident on a single partition of a hard disk. If a single disk volume in VNX is over-utilized or is unable to
process I/O requests quickly, it can damage the user experience with the entire storage system. It is hence the
responsibility of the storage administrator to keep an eye out for space contentions and processing bottlenecks with
each of the disk volumes in VNX, detect such anomalies even before they occur, and resolve them before users
complain. The Disk Volumes test helps the storage administrator discharge his duties efficiently. This test auto-
discovers the disk volumes and reports the processing ability and disk usage of each of the volumes. This enables
administrators to proactively detect a potential slowdown in processing or a probable disk contention, identify which
disk volume is contributing to these abnormal phenomena, and intervene to ensure that the problem is resolved
before it spirals out of control.
Purpose Auto-discovers the disk volumes and reports the processing ability and disk usage of each of the
volumes
Target of the
test
An EMC VNX Unified Storage system
Agent
deploying the
test
A remote agent
Configurable
parameters for
the test
1. TEST PERIOD – How often should the test be executed
2. HOST – The IP address of the storage device
3. CONTROLLER STATION IP – The Control Station is the management station for the VNX
for File system, and enables control and configuration of the system. The eG agent uses the
CLI that runs on the Control Station to monitor and manage the performance of the VNX for
File system. To enable the eG agent to use this CLI, specify the IP address of the Control
Station in the CONTROLLER STATION IP text box. By default, the IP address of the
HOST will be displayed here.
Outputs of the
test
One set of results for each disk volume in the EMC VNX Unified Storage system
Measurements
made by the Measurement
Measurement
Unit Interpretation
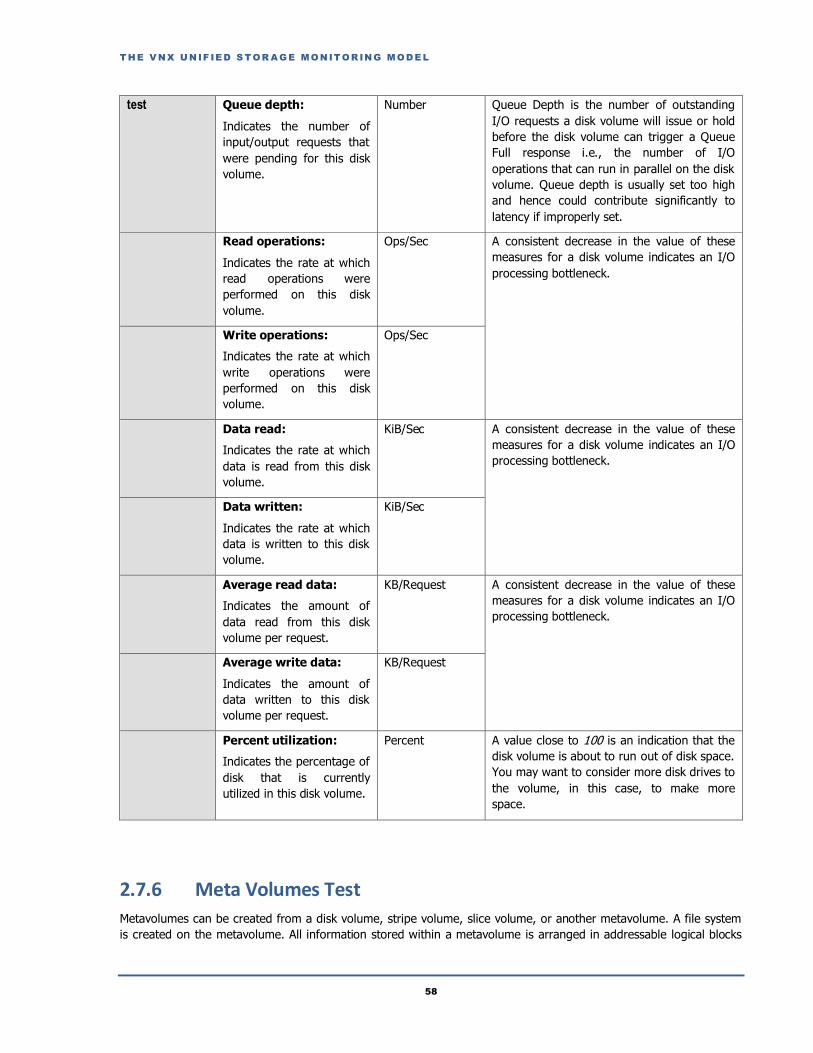
T HE V NX UNIF IE D S T OR A GE MONIT OR ING MOD E L
58
test Queue depth:
Indicates the number of
input/output requests that
were pending for this disk
volume.
Number Queue Depth is the number of outstanding
I/O requests a disk volume will issue or hold
before the disk volume can trigger a Queue
Full response i.e., the number of I/O
operations that can run in parallel on the disk
volume. Queue depth is usually set too high
and hence could contribute significantly to
latency if improperly set.
Read operations:
Indicates the rate at which
read operations were
performed on this disk
volume.
Ops/Sec A consistent decrease in the value of these
measures for a disk volume indicates an I/O
processing bottleneck.
Write operations:
Indicates the rate at which
write operations were
performed on this disk
volume.
Ops/Sec
Data read:
Indicates the rate at which
data is read from this disk
volume.
KiB/Sec A consistent decrease in the value of these
measures for a disk volume indicates an I/O
processing bottleneck.
Data written:
Indicates the rate at which
data is written to this disk
volume.
KiB/Sec
Average read data:
Indicates the amount of
data read from this disk
volume per request.
KB/Request A consistent decrease in the value of these
measures for a disk volume indicates an I/O
processing bottleneck.
Average write data:
Indicates the amount of
data written to this disk
volume per request.
KB/Request
Percent utilization:
Indicates the percentage of
disk that is currently
utilized in this disk volume.
Percent A value close to 100 is an indication that the
disk volume is about to run out of disk space.
You may want to consider more disk drives to
the volume, in this case, to make more
space.
2.7.6 Meta Volumes Test
Metavolumes can be created from a disk volume, stripe volume, slice volume, or another metavolume. A file system
is created on the metavolume. All information stored within a metavolume is arranged in addressable logical blocks

T HE V NX UNIF IE D S T OR A GE MONIT OR ING MOD E L
59
and is organized in a sequential, end-to-end fashion. A metavolume is required to create a file system because
metavolumes provide the expandable storage capacity needed to dynamically expand file systems. A metavolume
also provides a way to form a logical volume larger than a single disk.
Where metavolumes are in use, a slowdown or space-crunch experienced by a single metavolume, can ripple and
affect the overall performance of the VNX storage system. This is why, it is imperative that metavolumes are
continuously monitored for performance faults, and faults detected in the process are corrected in time to ensure
uninterrupted functioning of the storage system as a whole. For this purpose, administrators can use the Meta
Volumes test. This test auto-discovers the metavolumes configured on the EMC VNX Storage system, monitors the
processing ability of each metavolume, and reports the following:
Is I/O load uniformly balanced across all metavolumes, or is any metavolume overloaded?
Are the metavolumes able to process the I/O requests quickly? Is any metavolume experiencing processing
bottlenecks?
Purpose Auto-discovers the metavolumes configured on the EMC VNX Storage system, monitors the
processing ability of each metavolume, and reports the following:
Is I/O load uniformly balanced across all metavolumes, or is any metavolume
overloaded?
Are the metavolumes able to process the I/O requests quickly? Is any metavolume
experiencing processing bottlenecks?
Target of the
test
An EMC VNX Unified Storage system
Agent
deploying the
test
A remote agent
Configurable
parameters for
the test
1. TEST PERIOD – How often should the test be executed
2. HOST – The IP address of the storage device
3. CONTROLLER STATION IP – The Control Station is the management station for the VNX
for File system, and enables control and configuration of the system. The eG agent uses the
CLI that runs on the Control Station to monitor and manage the performance of the VNX for
File system. To enable the eG agent to use this CLI, specify the IP address of the Control
Station in the CONTROLLER STATION IP text box. By default, the IP address of the
HOST will be displayed here.
Outputs of the
test
One set of results for each meta volume in the EMC VNX Unified Storage system
Measurements
made by the
test
Measurement Measurement
Unit Interpretation
Read operations:
Indicates the rate at which
the read operations were
performed on this
metavolume.
Ops/Sec A high value is desired for this measure. A
consistent decrease in this value could
indicate a processing bottleneck.

T HE V NX UNIF IE D S T OR A GE MONIT OR ING MOD E L
60
Write operations:
Indicates the rate at which
write operations were
performed on this disk
volume.
Ops/Sec
Read request:
Indicates the rate at which
the read requests were
processed by this
metavolume.
Requests/Sec
A consistent decrease in the value of these
measures for a metavolume indicates an I/O
processing bottleneck.
Write request:
Indicates the rate at which
the write requests were
processed by this
metavolume.
Requests/Sec
Data read:
Indicates the rate at which
data is read from this
metavolume.
KiB/Sec A consistent decrease in the value of these
measures for a metavolume indicates an I/O
processing bottleneck.
Data written:
Indicates the rate at which
data is written to this
metavolume.
KiB/Sec
Average read data:
Indicates the amount of
data read from this
metavolume per request.
KB/Request A consistent decrease in the value of these
measures for a metavolume indicates an I/O
processing bottleneck.
Average write data:
Indicates the amount of
data written to this disk
volume per request.
KB/Request
Percentage of total ops
for reads:
Indicates the percentage of
total I/O operations on this
metavolume that were read
operations
Percent In the event of an overload, you can compare
the value of these measures for a
metavolume to figure out what caused the
overload – i.e., what type of operations were
too many on the metavolume – read
operations or write operations?
Percentage of total ops
for writes:
Indicates the percentage of
total I/O operations on this
metavolume that were
write operations.
Percent

C ONC L US ION
61
Conclusion This document has clearly explained how eG Enterprise monitors the EMC VNX storage system. We can thus
conclude that eG Enterprise, with its ability to provide in-depth insight into the performance of SAN storage
infrastructures, is the ideal solution for monitoring such environments. For more information on eG Enterprise, please
visit our web site at www.eginnovations.com or write to us at [email protected].


