
1
“Putting Data to Work for Student Achievement”
Whitehall-Coplay Middle SchoolMay 13, 2011
Beth Breiner & Sharon KinneyB

2
A moment for organization…
B

3
http://whitehallcoplaymsrtii.wikispaces.com/
B

4
6th Grade Overview
How do YOU think it went?
B

5
Our Goal:
To help build a community of professionals who can effectively use data to drive instruction that improves learning and student achievement.
B

6
Agenda
• What is “data”• Where it can come from• Examining types of
Assessments• Scenarios on data• Planning for May 18th
B
7
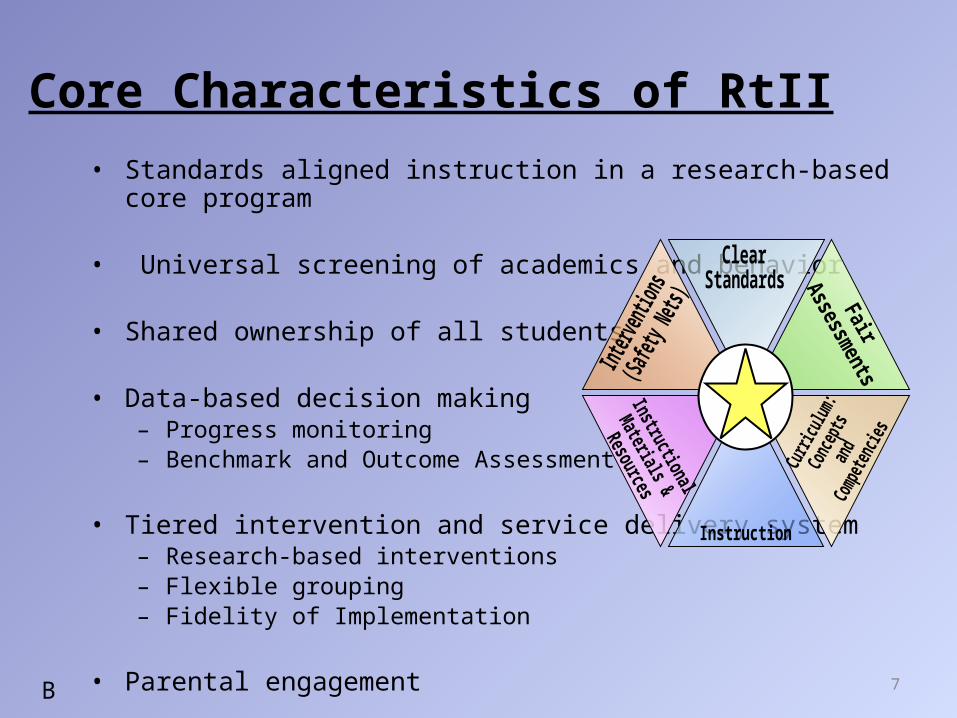
Core Characteristics of RtII• Standards aligned instruction in a research-based core program
• Universal screening of academics and behavior
• Shared ownership of all students
• Data-based decision making– Progress monitoring– Benchmark and Outcome Assessment
• Tiered intervention and service delivery system – Research-based interventions– Flexible grouping– Fidelity of Implementation
• Parental engagementB

8
Time to make a decision!!Which dog do YOU want to take home?
Dog from the pound
St. Bernard
German Shepherd
Petey
What data did you use to make that decision?
What other data do you want?S

9
Time to make a decision!!Which dog do YOU want to take home?
Dog from the pound
5 yrs. old.
St. Bernard
2 months oldGerman Shepherd
9 yrs. old
Petey
2 yrs. old
What data did you use to make that decision?
What other data do you want?S

10
Time to make a decision!!Which dog do YOU want to take home?
Dog from the pound
5 yrs. old.
Came from a broken home…
St. Bernard
2 months old
Descendent of a Champion
German Shepherd
9 yrs. old
Former police dog
Petey
2 yrs. old
Former movie star
What data did you use to make that decision?
What other data do you want?S

11
Time to make a decision!!Which dog do YOU want to take home?
Dog from the pound
5 yrs. old.
Came from a broken home…
Unknown life span
St. Bernard
2 months old
Descendent of a Champion
8-12 yr. life span
German Shepherd
9 yrs. old
Former police dog
10-13 year life span
Petey
2 yrs. old
Former movie star
Forever in our hearts
What data did you use to make that decision?
What other data do you want?S

12
Dog Data• Type/Breed• Age• History• Life Span• Picture - emotional
S

13
Until you have data as a backup, you’re just another
person with an opinion.
Dr. Perry Gluckman
B

14
Everyone is entitled to his own opinion,
but not his own facts.
Daniel MoynihanB
15
Data is a lot like humans: It is born; matures; gets married to other data; divorces; gets old. One thing that it doesn't do is die.
Arthur MillerB
16
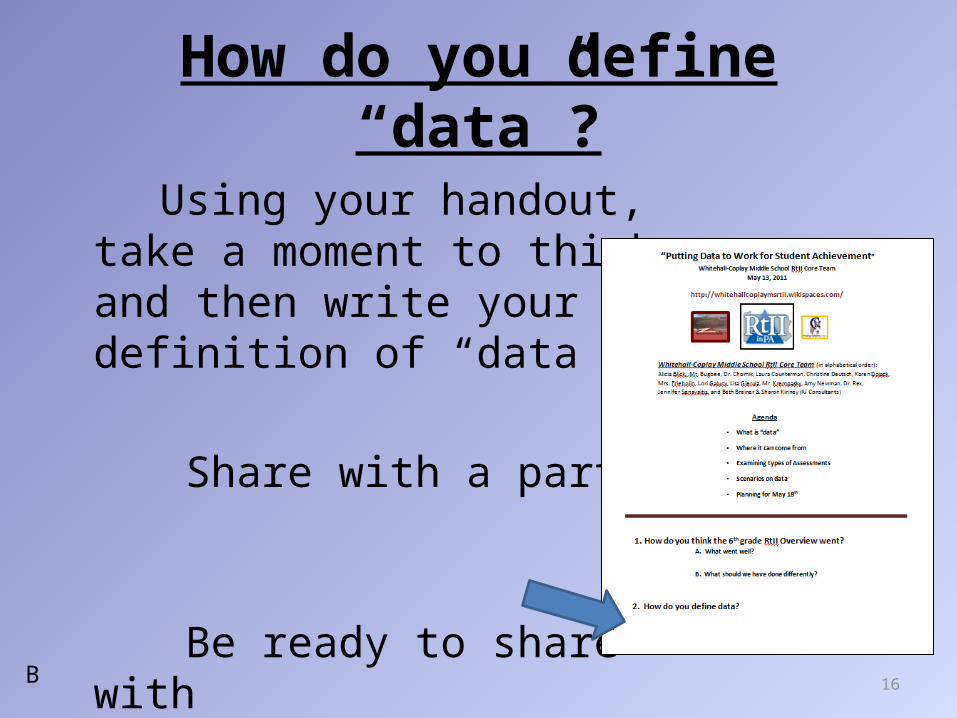
How do you define “data”?
Using your handout, take a moment to think and then write your definition of “data”.
Share with a partner.
Be ready to share with the group.
B

17
Official definition of da·ta
noun pl but singular or pl in constr, often attributive \ˈdā-tə, ˈda- also ˈdä-\
(1) : factual information (as measurements or statistics) used as a basis for reasoning, discussion, or calculation <the data is plentiful and easily available.
(2): information output by a sensing device or organ that includes both useful and irrelevant or redundant information and must be processed to be meaningful.
http://www.merriam-webster.com/dictionary/dataB

18
After reading both definitions, would one be more applicable to student achievement than the other. Why?
1. Both are equally applicable 2. Only #1 is applicable
3. Only #2 is applicable 4. Both would be applicable, but with
revisionB
19
In God we trust. The rest of you
bring your data….
S
20
Get your facts first, then you can distort them as
you please.
Mark Twain
S

21
Consistent Factors in High Performing Schools
• Teachers’ continuous reflection on student learning data to
determine instruction, practices, and objectives
– National Center for Educational Accountability
• Data based practices of setting challenging goals and provision
of effective feedback– Marzano, 2003
S

22
The Case for a Data-Informed Culture
We must acknowledge that people work more effectively, efficiently and persistently when they work collectively, gauging their efforts against results. Results goad, guide and motivate groups and individuals….
Michael Schmoker – Results; The Key to Continuous Improvement, 1999
S

23
What are Data?
• Pieces of information.• Data are meaningless by themselves and are given
meaning through the context in which they occur.• Context transforms data into information that is
useable to a decision maker.• Educational data include student learning
assessments, demographics, perceptions, school processes, and many other types.
B

24
Data Sources and the Data Provided
Using the handout, list the possible types of data that could be provided by each of the sources.
B

25
Data on Data!Now, using post it notes write no more 3 kinds of data in each category.
1.Count off
2.Go to the flip chart with the number that corresponds to your number.
3.Place the post its on the chart, along the bottom edge.
4.If there is a post it with the same type of data, i.e. test grades, put your post-it above the existing post it.
5.Our goal is to create a bar graph of types of data.
B
26
Data is NOTHING without meaning
B

27
The RtII ProcessCurriculum Alignment
Instructional Strategies Assessment
(What we DO)•PK-12 Content Area Meets•Curriculum Mapping•Curriculum Review Process
(How we MEASURE IT)•Data-Driven Decision-Making•Grading to Communicate Student Learning•DIBELS•MAP•EPAS•Common Formative Assessments•Assessment Literacy
(How we DO IT)• Differentiation
• ELL Instructional Strategies• Academic Vocabulary (6 Step Process)
• TRIBES• Instructional Technology
• Reading Across the Content Areas• Early Literacy Strategies
B

28
Different Purposes for Assessment
• Ranking of Students• Grading/Evaluation• Pass or Fail
Judgmental
• Outcome/benchmark oriented
• Screening of students• Diagnosis• Direct and improve
instruction
Reflective
S

29
Knowing what an assessment will and will not provide….
S

Pennsylvania Fair Assessments
30
Diagnostic Formative Benchmark Summative
PurposeGuide instruction specifically
targeted to meet students’ needs, including students’ strengths and weaknesses
Inform ongoing classroom instruction so that adjustments
to instruction can be made
Determine how well students are progressing toward
demonstrating proficiency on a set of designated grade-level curriculum content standards
Determine the degree to which students have mastered a
designated set of curriculum content standards
Impact on Instruction
Tools that provide alignment to units, lesson plans, and other resources based on students‘
needs.
Classroom-based activities integrated into instruction and
learning with teachers and students receiving frequent
feedback
Low-stakes assessments used to predict how students will do on
the high-stakes summative assessments
Assessments used for accountability
Intended Users of the Results
Students, parents, and educators
Students, parents, and educators
Students, parents, and educators
Educators, parents, public at large, anddistrict personnel
ExamplesClassroom Diagnostic Tools
(CDT)Teacher-created diagnostics
Teacher-selected Classroom assessments
Response cardsWhite boards
Random selection
AcuityAssess2Know
4-Sight
PSSAKeystone Exams
ACCESS for ELLsEnd of Unit/Chapter Tests
District End of Course Exams
Type of Information Provided
Provides a more complete picture of a student’s or group
of students’ strengths and weaknesses so that instruction
can be targeted directly at meeting student needs
Provides feedback related to a specific unit or lesson so that
feedback can be used to inform classroom instruction and
learning during the teaching/learning process
Provides information on the degree to which students have mastered a given concept or how students are progressing
toward demonstrating proficiency on grade-level
content standards
Provides information on students’ mastery of a given set
of content standards
S

What are the similarities and differences between….?
31S

32
Reporting Out on Assessments
Do we have two volunteers?
Dueling Scribes???S

AGREE or DISAGREE Activity:
Agree Disagree Statement
1. Classroom Diagnostic Tools are classroom-based activities integrated into instruction and learning with teachers and students receiving frequent feedback.
2. Formative Assessments provide a more complete picture of a student or group of students strengths and weaknesses so that instruction can be targeted directly at meeting student needs.
3. Results from the Diagnostic Assessment provide information on the degree to which students have mastered a given concept or how students are progressing toward demonstrating proficiency in grade-level content standards.4. Examples of a Benchmark Assessments include Keystone Exams, PSSA, and Access for ELLs.5. Results from Formative Assessments should be used for report cards.
33S

34
Let’s identify the types of assessments that will be utilized next year…
S

35
Your Assessment Activity Classify each assessment as either:
DiagnosticFormativeBenchmarkSummative
S

36
We must help educators move from using data only
for accountability to using data for continuous
improvement.
High stakes testing
On-going planning & intervention
B

37
How do we make assessment/data meaningful?
• Common language
• Access to information
• Collaborative communication skills
• Process tools
• Habits of reflection Wellman, B. & Lipton, L (2004)
B

38
SIMULATION
• Sally is not doing her homework. She’s a 6th grader in Social Studies class. When you ask her “What is a key word in a question?” She says she doesn’t know. Sally has no idea that she should go back into the section and skim for the word.
B

39
Roles:Reading Teacher:Reading Specialist:Science Teacher:Math Teacher:Social Studies:Guidance Counselor:Data Facilitator:
B

40
Why Screen??
First graders in the bottom quartile in reading have an 88% likelihood of placing in the bottom quartile in 4th grade and a 78% likelihood of remaining there through 8th grade.
Juel 1988
S

41
Choices
• Early Intervening-actively seek out students at risk of difficulty and intervene immediately prior to long term failure and the need for intensive supports.
OR• Wait for long-term failure greatly increasing
the need for intensive interventions including special education.
S

42
Frequently Used in PA• AIMSweb– www.AIMSweb.com
• 4Sight Benchmark Assessments– www.successforall.net
• Monitoring Basic Skills Progress– MBSP-www.proedinc.com
• School-wide Information Systems– SWIS-www.swis.org
S
43
Is the Data Just for Teachers…As we watch the video, look for and note on your handout…..
S
44
Is the Data Just for Teachers…
S

45
Planning for 5-18-11


