
+Sam
ple Proportions
The Sampling Distribution of
Consider the approximate sampling distributions generated by a simulation in which SRSs of Reese’s Pieces are drawn from a population whose proportion of orange candies is either 0.45 or 0.15.
What do you notice about the shape, center, and spread of each?
ˆ p
How good is the statistic ˆ p as an estimate of the parameter p? The sampling distribution of ˆ p answers this question.
+Sam
ple Proportions
The Sampling Distribution of
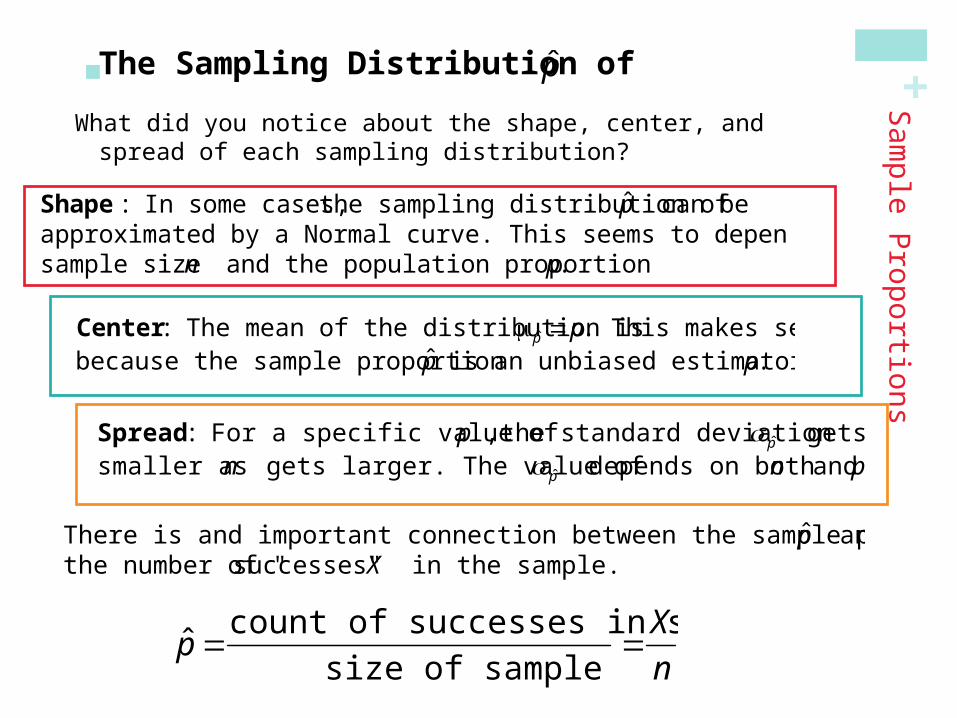
What did you notice about the shape, center, and spread of each sampling distribution?
ˆ p
Shape : In some cases, the sampling distribution of ˆ p can beapproximated by a Normal curve. This seems to depend on both thesample size n and the population proportion p.
ˆ p count of successes in sample
size of sample
X
n
There is and important connection between the sample proportion ˆ p andthe number of "successes" X in the sample.
Center : The mean of the distribution is ˆ p p. This makes sensebecause the sample proportion ˆ p is an unbiased estimator of p.
Spread : For a specific value of p , the standard deviation ˆ p getssmaller as n gets larger. The value of ˆ p depends on both n and p.
+Sam
ple Proportions
The Sampling Distribution of
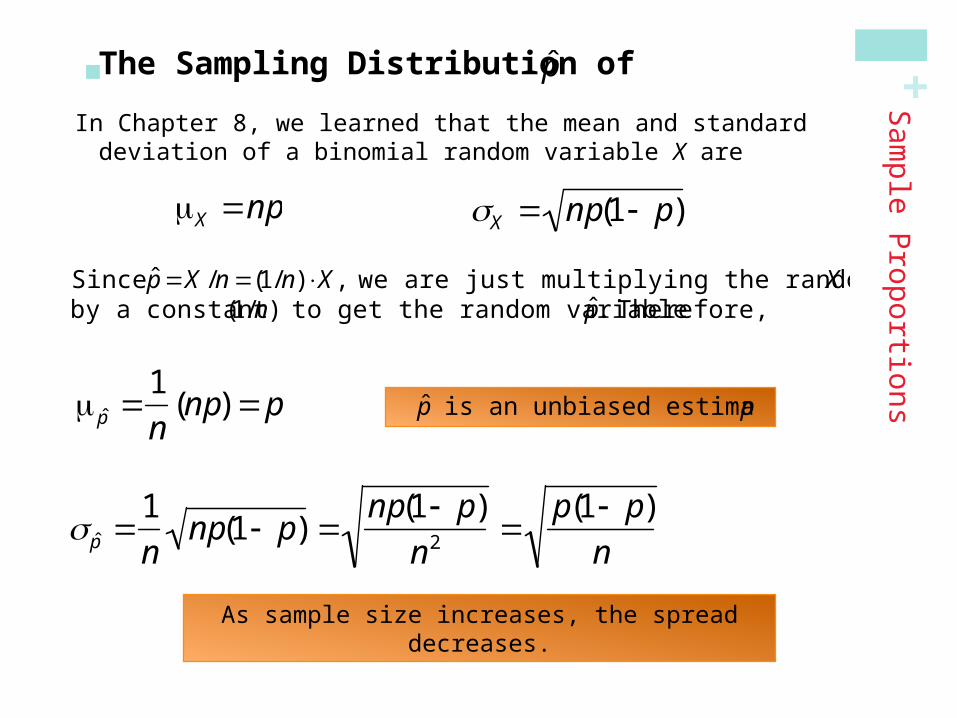
In Chapter 8, we learned that the mean and standard deviation of a binomial random variable X are
X np
X np(1 p)
ˆ p 1
nnp(1 p)
np(1 p)
n2 p(1 p)
n
ˆ p 1
n(np) p
As sample size increases, the spread decreases.
ˆ p
Since ˆ p X /n (1/n)X, we are just multiplying the random variable X by a constant (1/n) to get the random variable ˆ p . Therefore,
ˆ p is an unbiased estimator or p

+ The Sampling Distribution of
As n increases, the sampling distribution becomes approximately Normal. Before you perform Normal calculations, check that the Normal condition is satisfied: np ≥ 10 and n(1 – p) ≥ 10.
Sampling Distribution of a Sample Proportion
The mean of the sampling distribution of ̂ p is ˆ p p
Choose an SRS of size n from a population of size N with proportion p of successes. Let ̂ p be the sample proportion of successes. Then:
The standard deviation of the sampling distribution of ̂ p is
ˆ p p(1 p)
nas long as the 10% condition is satisfied: n (1/10)N .
Sam
ple Proportions
ˆ p
We can summarize the facts about the sampling distribution of ˆ p as follows:
+ Using the Normal Approximation forS
ample P
roportions
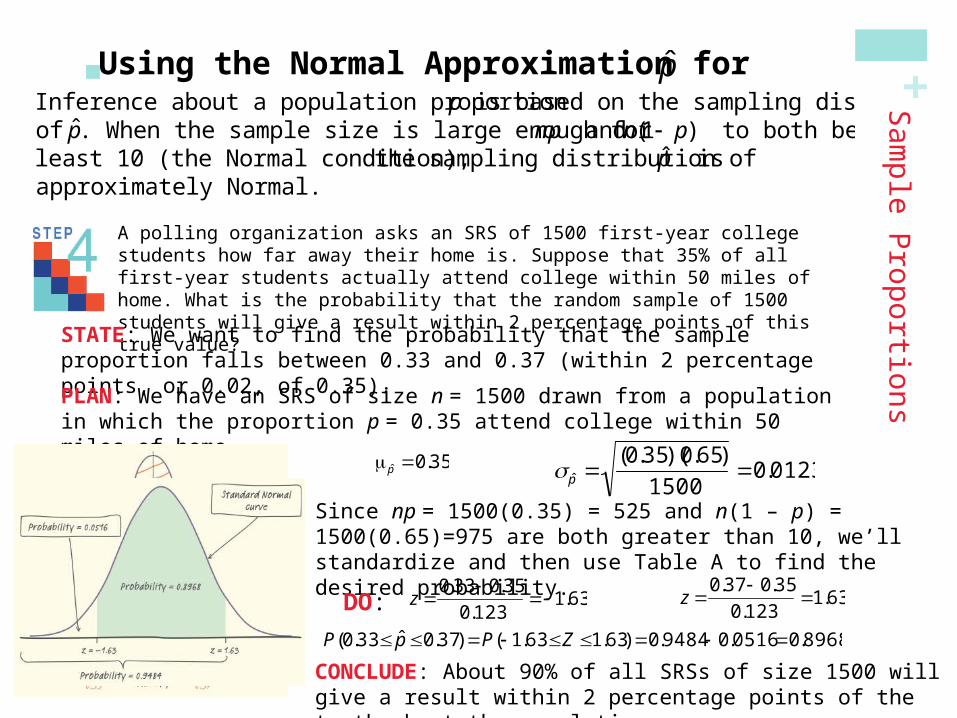
A polling organization asks an SRS of 1500 first-year college students how far away their home is. Suppose that 35% of all first-year students actually attend college within 50 miles of home. What is the probability that the random sample of 1500 students will give a result within 2 percentage points of this true value?
STATE: We want to find the probability that the sample proportion falls between 0.33 and 0.37 (within 2 percentage points, or 0.02, of 0.35).
PLAN: We have an SRS of size n = 1500 drawn from a population in which the proportion p = 0.35 attend college within 50 miles of home.
ˆ p 0.35
ˆ p (0.35)(0.65)
15000.0123
Since np = 1500(0.35) = 525 and n(1 – p) = 1500(0.65)=975 are both greater than 10, we’ll standardize and then use Table A to find the desired probability.
P(0.33 ˆ p 0.37) P( 1.63 Z 1.63) 0.9484 0.0516 0.8968
CONCLUDE: About 90% of all SRSs of size 1500 will give a result within 2 percentage points of the truth about the population.
z 0.33 0.35
0.123 1.63
z 0.37 0.35
0.1231.63
ˆ p
Inference about a population proportion p is based on the sampling distribution of ˆ p . When the sample size is large enough for np and n(1 p) to both be atleast 10 (the Normal condition), the sampling distribution of ˆ p isapproximately Normal.
DO:
+Section 7.2Sample Proportions
In this section, we learned that…
In practice, use this Normal approximation when both np ≥ 10 and n(1 - p) ≥ 10 (the Normal condition).
Summary
When we want information about the population proportion p of successes, we often take an SRS and use the sample proportion ˆ p to estimate the unknownparameter p. The sampling distribution of ˆ p describes how the statistic varies in all possible samples from the population.
The mean of the sampling distribution of ˆ p is equal to the population proportion p. That is, ˆ p is an unbiased estimator of p.
The standard deviation of the sampling distribution of ˆ p is ˆ p p(1 p)
n for
an SRS of size n. This formula can be used if the population is at least 10 times as large as the sample (the 10% condition). The standard deviation of ̂ p getssmaller as the sample size n gets larger.
When the sample size n is larger, the sampling distribution of ˆ p is close to a
Normal distribution with mean p and standard deviation ˆ p p(1 p)
n.


