
/0 :r~9A "# /,2./
: CIVIL ENGINEERING STUDIES . C4f'11 STRUCTURAL RESEARCH SERIES NO. 121
,I
.etz Bar.reno. ~oo. Un1TIr81ty of rIlino1,
JI0i HeEL 201 i. ~om1ne Street ~ ~11no1s 6~801
EFFECT OF AXIAL LOAD ON THE SHEAR STRENGTH \,
OF REINFORCED CONCRETE BEAMS
By
M. J. BARON
and
C. P. SIESS
Part 2
FINAL REPORT
to
THE OHIO RIVER DIVISION LABORATORIES
CORPS OF ENGINEERS, U. S. ARMY
Contract DA-O 17 -CIVENG-56-6
June, 1956
UNIVERSITY OF ILLINOIS
URBANA, ILLINOIS
~T OF AXIAL LOAD ON THE SHEAR STRENGTH OF REINFORCED
CONCRErE BEAMS
by
Mil J. Baron
and
c. P. Siess
A Technical Report of a Research Project
Sponsored by
THE OHIO RIVER DIVISION LABORATORIES COBPS OF ENGINEERS, U 0 S" ARMY
In cooperation with
THE DEPARrMENT OF CIVIL ENGINEERING UNIVERSITY OF ILLINOIS
Contract: !lA°33",,017-CIVENG-56-6
Urbana, lllinois June 1956

I.
II.
III.
CONTENTS
nn'RODlJCTION • 0 6 0 •• e • C) 0 0 •• It • 0 0 C) () • 0 0 0 0 0 0 0 ..... it e () 0 0 • 0 til 0
1. Object and Scope of Investigation 00 •• 000$00.
2. Acknowledgments .008800000000000000000000 •• 00
3. Not at ion • 0 0 •• 0 0 • 0 • 0 •• 0 • 0 0 0 • 0 0 0 • 8 0 0 0 •• 0 0 0 0 0 • 0
EXPERIMENTAL PRCGBAM oooC)ooooooooe.ooooooo.oCto~eooot).,.o
4.
5·
6.
7·
8.
Description of Specimens 000'0000000000000000
Materials ooe.,OOCl05.000.,eooooooooooeeooooeooo
(a)
(b)
(C)
(d)
Cement oo~ocoeooo.oo •• OOOOOOGooooe ••• oe
.AggJ:'egate 0" 0 0 0 0 0 0 0 0 0 0 • 0 0 e 0 0 0 0 0 0 " 0 • 0 • 0 0
Concrete Mix 00000000000000000.00000000
ReinforCing Steel 0000000000000.0000000
Fabrication and Curing of Specimens 0.0"" 0 0 0 0
Testing Equipment 0000000000"0000000000000000
(a)
(b)
(c)
(d)
Lateral Loading Equipment ~oooooooooooo
Axial Loading Equipment oooooo~o.oooeoo
Deflection Apparatus
Strain Measurements
0000(>00000 •• 000000
.eoooooooooeoocoooo
Testing P:rocedure • 0 0 0 0 eo 0 o. 0 0 • 0 0 0 0 0 0 0 0 000 e 0 0
TESI' REStJI.,TS & •• 0 • 0 •• ct 0 0 0 0 0 0 0 0 0 e _ () 0 0 0 0 0 (t • 8 0 eo 0 0 0 e 0' 0 0- 0 0
9·
10.
Test Data 00000000000000000000000000000000000
Behavior Under Load .0&00000000000000000000000
1
1
1
2
5
5
5
5
6
6
6
7
8
8
9
10
10
.11
13
13
15
iii

CONTENTS (Con'to)
(a) Shear-Compression Failures 000 ••• 000
(b) Diagonal Tension Failures 00.0 •••• 00
(c) Flexural Failures 0.0000000000000&00
(d) Effect of Axial Load ooooeooo.ooooo.
IV. ANALYSIS OF TEST RESULTS oooooooooooooooooooeooooo
11.
12.
130
Load-Deflection Characteristics ooooooooeo
Diagonal Tension Cracking Load 000000000.0
(a) Beams Without Axial Load 000000000.0
(b) Beams With Axial Load ooo •• oo~oooooo
Shear-Compression Failures oooooooeooooo ••
(a)
(b)
Beams Without Axial Load 000.0000000
Beams With Axial Load eooeoooooooooo
15. Comparison With Previous Test Results eooo
v. ~ .. 0.0.0~OOOOOOOO.00QOOOOOOoooooooo .. oeo.000
VI. ~::ES. 0 Q 0 0 0 a 0 • 0 0 0 0 • 0 0 0 0 0 0 & 0 0 0 0 0 0 0 0 • 0 0 0 Q 0 0 0 0 0
~
16
19
21
-21
25
25
26
26
28
30
31
33
39
43
iv

Ta.ble No.
1
2(a)
2(b)
3
4
5
6
7
8
LIm OF TABLES
Title
Properties of Beams 'OOOOOOOGOoo.cooo.ocoe~G~ 44
Properties of Concrete Mixes Beams Reinforced With Three No.4 Bars.oooeo 45
Properties of Concrete Mixes Beams Reinforced With Two Noo 9 Bars e" & 0 0.0 46
Distances to Important Points on Crack Callsing Failure 0 000 <) 0 0 0 000000 e .0000 000000" 0 47
Test Re suIts I) 0 0 0 0 0 ':l e 0 O!! 0 0 0 0 0 0 ., 0 0 o· • 0 0 • ° ° 0 0 • ., 0 48
Comparison of Measured and Computed Values of Nominal Unit Shearing stress at Diagonal Tension Crackingoooooooooooeoo.ooooooo"ooooe 49
Computed Steel stresses for Shear-Compression Failures.oooeoooooo0000000000000090000000000 50
Comparison of ~asured and Computed Values of Ultimate M:>ment for FlexuraJ.. Failures"., 0 0 0 0
Comparison With Test Results for Beams of Reference 4 0000000000000000000000000000000
51
52
v

Figure No.
1
2
3
4
5
6
7
8
9
10
11
12
13
14
15
16
17
18
vi
LISr OF FIGURES
Dimensions of Test Beams
Typical Test Setup
Axial Loading Equipment
Photographs of Axial Loading Equipment
Load-Deflection Curves for Beams With Three Noo 4 Bars
Load-~flection Curves for Beams With Two NOe 9 Bars
steel stress Distribution for Shear~ompression Failure. Beam B-ll
steel stress Distribution for Shear~ompression Failure 0 Beam B-13
steel stress Distribution for Diagonal Tension Failure 0 Beam A-15
Crack Development for Shear=Compression Failure 0,
Beam B-12
Crack Development for Diagonal Tension Failure. Beam A-14
Effect of Axial Load on Cracking Pattern for Flexural Failure
Effect of Axial Load on Shear-Compression Failure
Effect of Axial Load on M::xie of Failure
Effect of aid on Cracking and Ultima.te Shear Ca.pacity for Beams With Three Noo 4 Bars
Effect of aid on Cracking and Ultima.te Shear Capacity for Beams With Two No.. 9 Bars
Effect of Axial Load on l-bment Rotation Relationships
Diagonal Tension Cracking Without Axial Load.
Figure No.
19
20
vii
LIST OF FIGURES - CONT.
Ultimate Moment vs. Shear Span ""'Depth Ratio
Comparison With Test Results for Beams of Reference 4
.. I~ ~z Jl~J..e'f~#~i::; ,tnuv.
Univer~'1~.Y '~r"'I~i1no,10 ~,Ilt,i 'feEt' " ,"
2.8 N. ',RO~~~' Street UrbGna. Illinois 61801
" .
I. lllrRODUCTION
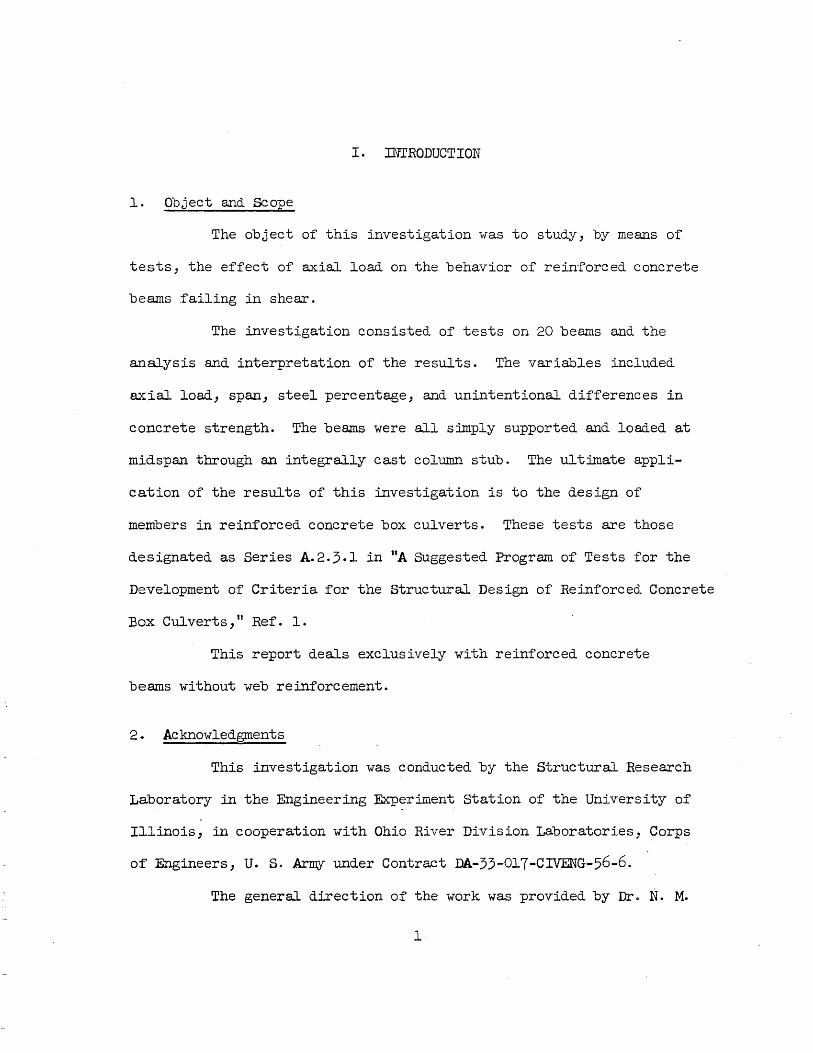
1. Object and Scope
The object of this investigation was to study, by means of
tests, the effect of axial load on the behavior of reinforced concrete
beams failing in shear.
The investigation consisted of tests on 20 beams and the
analysis and interpretation of the results. The variables included
axial load, span, steel percentage, and unintentional differences in
concrete strength. The beams were all smply supported and loaded at
midspan through an integrally cast column stUb. The ultimate appli
cation of the results of this investigation is to the design of
members in reinforced concrete box culverts. These tests are those
designated as Series A.2.3.1 in nA Suggested Program of Tests for the
Development of Criteria for the structural Design of Reinforced Concrete
Box Culverts, tt Ref. 1.
This report deals exclusively with reinforced concrete
beams without web reinforcement.
2. Acknowledgments
This investigation was conducted by the Structural Research
Laboratory in the Engineering Experiment Station of the University of
Illinois, in cooperation with Ohio River Division Laboratories, Corps
of Engineers, U. S. Army under Contract DA-33-017-CIVENG-56-6.
The general direction of the work was provided by Dr. N. M.
1

2
Ne\~ark, Research Professor of structural Engineering. The immediate
supervision of the program was provided by Dr. C. P. Siess, Research
Professor of Civil Engineering.
Appreciation is expressed to S. Ro Bernaert and R. D.
DeCossio, Research Assistants in Civil Engineering for their aid in
conducting the tests and in preparing this report. Mr. Wyck
MCKenzie, Junior Laboratory Mechanic, was very helpful in conducting
the tests and in fabricating specimens and equipment.
This report was written as a thesis under the direction of
Dr. Siess and his helpful comments are gratefully acknowledged.
3. Notation
Distances
The following notation has been used in this report:
a = length of the shear span (see Fig. 1)
b = width of beam
d = effective depth of reinforcement
h = overall height of beam
kd = depth o.f compression zone of concrete as determined by 1t straight ... line ~ theory
k d = depth of compression zone u
L = length of span between centers of supports
x. = horizontal distance from center of support to point x at which crack causing failure intersected the
reinforcement
y = midspan deflection

Forces
Moments
stresses
strains
c = total internal compressive force in concrete
N = . axial load.
p = total load on beam at diagonal tension cracking c
P ::: ultimate load (corresponding to failure of beam) u .
V = total shearing force
V c = total shearing force at diagonal tension cracking
V u = total shearing force at ultimate
Mr = theoretic al ultimate flexural moment
M = theoretical limiting shear moment s
. M = measured ultimate bending moment u=Va
u
ft = compressive strength of concrete determined from c 6 by 12~ine control cylinders
f = modulus of rupture of concrete determined from 6 r by 6 by 20-L~o control beams
fs = stress in tensile reinforcement
l' = yield strength of reinforcement y
Vc = nominal unit shearing stress at diagonal tension cracking
V = c
~bd
e = unit strain in the reinforcement s
e. = limiting strain in concrete u
3
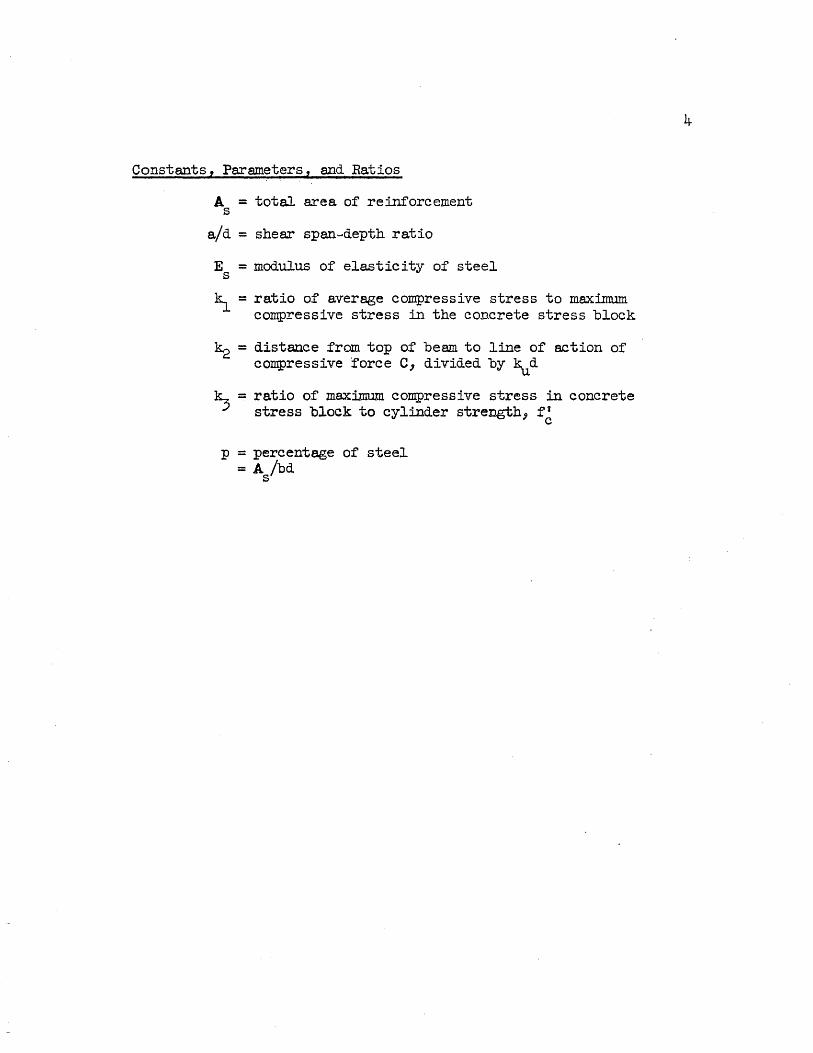
Constants t Param~t~rs , and Ratios
A = total area of reinforcement s
aid = shear span .... depth ratio
E = modulus of elasticity of steel s
kJ. = ratio of average compressive stress to maximum compressive stress in the concrete stress block
~ = distance from top of beam to line of action of compressive force C, divided by kud
~ = ratio of max~ compressive stress in concrete stress block to cylinder strength, f1
c
p = percentage of steel = A Ibd s
4

5
II. EXPERIMENTAL PROORAM
4. Description of Specimens
All the beams tested were rectangular in cross-section, and
reinforced in tension only. The properties of the beam~ are given
in Table 1.
The nominal concrete strength vras 4000 psi; however) the
actual strengths varied somewhat from this value. The other variables
were span length and percentage of reinforcement.
A typical beam is shown in Fig. 1. All beams had an un
reinforced column stub cast integrally at midspan, as shown in Fig.
1. On all beams but A-2) an external stirrup \{as placed at each end
outside the supports to prevent failure by splitting at the level of
reinforcement. The reinforcement extended to one inch from the end of
the beam.
The length of the shear span, a, varied from 20 to 60 in.
in 10 in. intervals. Four beams of each . length were tested. Beams
A-l through A-5 and beams B-1 through B-5 were all reinforced with
3 No. 4 bars. Beams A-II through A-15 and beams B-ll through B-15
were all reinforced with 2 No. 9 bars. The beams designated A were
all tested with no axial load. The beams designated B were all
tested with an axial load of 20 kipso
5 . Mater ials
(a) Cement. Two brands of cement were used. Beams B-1
through B-5 and A-II were made with Atlas Type I cement. All other
6
beams were made with Marquette Type I cement.
(b) Aggregate. Wabash River sand and gravel were used in
all beams. The maximum size of the coarse aggregate was about one
inch, with a fineness modulus of 6.5 to 7.0 and contained a rather
high percentage of fines. The fineness modulus of the sand varied
between 2.7 and 3.2. Both aggregates have passed the usual speci
~ications. The absorption was about one per cent by weight. The
aggregate was purchased from a local dealer.
(c) Concrete Mixo One basic mix was used in an attempt
to obtain the same concrete strength in all test specimens. The
actual proportions and properties of the concrete mixes are given in
Table 2.
(d) Reinforcing Steelo The reinforcing steel was purchased
in two lots. One 2-ft long coupon was cut from each bar and tested
upon arrival.
The No. 4 bars used were all high grade deformed bars 0 The
yield strength varied from 66 J 500 to 68,000 psi. The ultimate strength
averaged 121,000 psi. The average modulus of elasticity for these bars
was 27,400,000 psi.
The No. 9 bars were all intermediate grade deformed bars
with yield points from 45,500 to 57,000 psio The average ultimate
strength was 78,800 psio The average modulus of elasticity was
28,000,000 psie
The values of the average yield point strength for the bars

7
used in each beam are given in Table 1. The bars used in each beam
were matched according to their yield points~ using bars cut from the
same piece in one beam whenever possible.
6. Fabrication and Curing of Specimens
Before the reinforcement was assembled for beams with No. 9
bars, 6-inch gage lines for mechanical strain gages were marked on
one outside bar, and the gage holes punched and drilled. Corks of
1 3/8 in. diameter were wired to the bars over the gage holes in·
order to form core holes in the side of the beam to provide access to
the gage holes.
All beams were cast in a steel form with adjustable end
plates. The reinforcing steel was held in place by 2 or 3 chairs
made of 1/4 in. mild steel bars. Two or three pieces of 3/4 in. pipe,
acting as spacers, ,-rere distributed along the beam. To facilitate
handling 7 a 1/4 in. steel hook was embedded in the concrete at each
end of the beam.
All concr~te was mixed from three to eight minutes in a
non-tilting drum-type mixer of 6-cu ft capacity. A butter mix was
used prior to the mixing of the first batch. Two batches of concrete
were used for each beam. The first batch was placed in a horizontal
layer along the bottom of the beam.
Four to six 6 by l2-in. control cylinders and one 6 by 6 by
20-ino control beam were cast from each batch. The concrete was placed
in the forms. and cylinder molds with the aid of a high-frequency

8
internal vibrator.
Several hours after casting, the top surface of the be?m was
trowelled smooth, and the cylinders capped with neat cement paste.
The beams and control cylinders were removed from the forms one day
after casting and placed in a moist room for six days. They were then
stored in the laboratory until testing.
7. Testing Equipment
A typical test setup for the beams of Series A, which were
tested without axial load, is shown in Fig. 2. The beams of Series B
were tested with an axial load of 20 kips by means of the equipment
sholm in Figs. 3 and 4.
(a) Lateral Loading Equipment. The lateral. load was
applied by four Blackhawk hydraulic jacks of 10-ton capac i ty each.
The jacks reacted against a steel beam attached to a frame which
was anchored to the laboratory floor. The jacks were connected by
high pressure hose to a brass manifold, which in turn was connected
to a measuring gage and a hydraulic pump. The jacks were held with
their bases against the reaction beam by two 1 by 1 by liB-in. angles
clamped to the reaction beam.
The load was transmitted from the jack rams to the beam
through lo5-in. diameter chrome steel alloy balls. The.balls rested
in 1/8-in. depressions in the end of the ram and in the loading
block~ .
ml..._ , __ ..:I-! __ "1...' --,. ---- ::\ C.V
""uV .l..'? "1...uV " -!-J.llt::: J..Ud.U.J.l1t:S U.l..UI.;,t\. Wa.b..... U '- tI C.-.Lll.. steel plate} with
9
depressions formed on its upper surface to receive the steel loading
balls. These depressions were on the centerline in the long direction
and spaced at 3 in. as shown in Fig. 1. The support bearing blocks
were 6 by 6 by 2-in. steel plates. The loading block and the bearing
blocks were set in plaster.
The support block on one end rested on a 4-in. diameter
half round, the other on a 2-ino diameter roller. The roller and
half round both were supported by 6 by 12 by 2-in. steel plates seated
in plaster on concrete abutmentso
Two pressure measuring gages were used in the loading system,
a 5,000 psi gage for small loads and a 10,000 psi gage for large loads.
The area of each jack ram was approximately 2 sq in; thus the capac ity
of the system was 80,000 lb. Prior to their use, both gages were
calibrated with the four jacks in a testing machine; thus the total
load was read directly during testing operations. It was estimated
+ that the accuracy of the system was - 0.2 kips with the 5000 psi
gage, and ~ 005 kips with the 10,000 psi gage 0 The latter was used
only where the total load exceeded 45 kipso
(b) Axial Loading Equipment 0 The axial loading equipment
was a completely separate unitJ as seen in Figo 3. It consisted of
a hydraulic jack operating against one end of the beam, with the
reaction to the jack supplied by tension rods acting against the other
end o.r the beam. To allow the ends of the beam to rotate, a half
round rocker was included at each end 0 These rockers were welded to

10
12 by 6 by 2-in. plates which transmitted the load to the ends of the
beam through leather pads. The jack operated on one end between two
10 by 12 by 2-in. plates, which were countersunk to receive the ram and
the base of the jack. Four 7/8-m. diameter threaded steel rods were
used to connect the jack bearing plate to the plate acting on the
other end of the beam. Two rods passed on each side of the beam.
The rods were threaded so that the system could be adjusted to
accommodate beams of various lengths.
A simplex hydraulic jack of 30 ton capacity was used. It
was connected by means of a hose to a 5000 psi gage and a pump. The
gage was calibrated with the jack in a testing machine before the
eqUipment was used. It was estimated that the load was measured
within 0.2 kips"
Care was taken in assembling the e~uipment that the center
line of the jack and the half round were at midheight of the beam
before the load was applied. The equipment was supported on the beam
by friction. No difficulties were encountered in this respect.
(c) Deflection Apparatu.s 0 Deflections were measured at
midspan on all beams J and at the quarter points of the span on all
but the 52-in. beams. Dial indicators reading to 0.001 in. were used
under the beam to measure deflections. The dials were supported by
posts attached to a deflection frame as shown in Fig. 2. The frame
was a 2 1/2 by 2 1/2 by 3/4-in. angle cemented to the support blocks
with plaster of paris.
(d) Strain Measurementso Strains were measured in the

11
steel only on the beams "ri th 2 No 0 9 reinforc ing bars; that is, beams
A-ll through A-15 and B""ll through B·,15. A Berry-type mechanical gage
with a sensitivity of 0000003 in~ per in. was used on six inch gagE:
lengths. strains were measured on one side only. The locations of the
gage lines are shown on Fig. 1. The number of gage lines depended on
the length of the beam} and varied from 7 to 21.
8. Testing Procedure
Once the beams to be tested with axial load were in the
testing frame, and the axial load. applied, there was little difference
in the testing procedure .from that for beams with no axial load.. The
axial load. was checked regl;lla"":'ly d-uring the test j and maintained at
20 kips by adjusting the pressure vrhen necessary. The remainder of
the testing procedure outlined be1o~y applies to beams both with and
without axial load.
The lateraJ. load was applied in 10 to 15 approximately equal
increments up to failure. After each increment of loading, the valve
between the pump &~d the jacks was closed. Deflection readings were
then recorded, and cracks were observed ~~d marked with ink. There
was usually some drop-of.f in the load. and some increase in deflection
while the cracks were being marked. These changes were noted before
the next load L'tJ.crement vlas applied. The average length of test was
about 6 hours ~
Photographs were taken of the beams at important stages in
the crack development; and after failureQ

12
For the beams with 2 No. 9 reinforcing bars, several measure
ments of strain in the tensile steel were taken during the course of
the .test.
The location and height of the crack that led to failure
were measured.
The concrete control cylinders and flexural control beams
were tested on the same day that the beam was tested.

13
III. TEST RESULTS
9. Test Data
The results of the tests are sunrrnarized in Tables 3 and 4,
and Figs. 5 through 9 ..
Table 3 gives the location and height of the crack which led
to failure. There was some dif.ference between the values measured on
either side of the beam, probably due to non-symmetrical loading and
to lack of homogeneity in the concrete. The values given in Table 3
are average values.
Table 4 includes the diagonal tension cracking load P , the c
untimate load P j the ultimate moment M , the mode of failure J the u u
average concrete strength, and the maximum steel stress for the beams
with two No. 9 bar-so The values of loads and moments are for the
added load only; the dead load was generally less than 2 per cent of
the total and was therefore neglected.
The diagonal tension cracking load was determined by
observation. It is that load at which a definite diagonal tension
crack was first observed; that is, when it became apparent that a
particular crack was assuming major importance. The cracking load
for the longer beams was usually associated with a sudden development
of the diagonal tension crack, and thus was well defined. For the
shorter beams the crack development was much more gradual;
conseCluently, the cracking load was not so clearly defined, and in
fact involved considerable vagueness.

The ultimate load P is the maximum load that the beam u
14
carried. In aJ.most all cases P was also the load at which the beam u
collapsed. In a few cases the beam did not completely fail at P J but u
at a load slightly less; however, P is considered the failure load u
since, if it had remained on the beam for a short time, it would have
resulted in complete failure.
The ultimate moment M is the moment at the face of the u
column stub at the load P . u
Three modes of failure were observed; shear-compression,
diagonal tensionl and flexure, as indicated in Table 4 by the symbols
SJ nT, and F respectively.
A shear-compression failure is defined as failure by
destruction of. the compression zone above a diagonal tension crack
at a load greater than the cracking load..
Diagonal tension failures are defined as failures at the
cracking load.
Flexural failure .for these beams 'irlhich were under-reinforced,
is defined as failure by crushing of the concrete in the compression
zone after the reinforcement has yielded but before the development of
diagonal tension cracks.
The concrete strength given in Table 4 is the average value
of Batch 2 which was placed in the top of the beam.
The steel stresses in Table 4 are the results of the
measurements taken of the strains in the tension reinforcement. They

15
are the maximum steel stresses; obtained by extrapolating to the
ultimate load. For each beam the maximum steel stress was at or near
the colunm face section. It should be pointed out that since the values
given are extrapolated they m8¥ involve some error.
The load-deflection curves for all the beams are given in
Figs. 5 and 6.
Figures 7, 8 and 9 show typical results of the tensile steel
strain measurements. Figs. 7 and 8 show the results .for beams B-ll
and B-13, which failed by shear-compression. Figure 9 is for beam A-15,
and is representative of the results for diagonal tension failures.
10. Behavior Under Load
In the early stages of testing the beams all behaved
similarly. The behavior in the later stages depended on the extent of
diagonal tension cracking and the mode of failure.
Until the appearance of diagonal tension cracks, the beams
all behaved in the usual manner of concrete beams in flexure. The
first cracks appeared at midspan, and extended vertically, increasing
in height vith increasing load. With increased load., additional cracks
developed in the shear span in the region near the support. These
cracks were usually somewhat inclined from the beginning in agreement
with the pattern of principal stress. The deflections in the early
stages of loaCii.LJ.g were nearly proportional to the load as can be seen
in Figs. 5 and 60 As the load became larger, greater deflections were
required to develop additional resistance.

16
The steel stresses for loads below the diagonal tension
cracking load. were very nearly proportional to the moment as can be
seen from Figs. 7, 8 and 9. They were e~ual to zero at the support
and increased linearly toward midspan.
At this point it is necessary to discuss behavior according
to the mode of failure.
(a) Shear-Compression Failures. Figure 10 shovlS the crack
development for a typical shear failure. At a load of 22.0 kips the
cracks \"ere primarily flexural. Fig. 10(b) shows that at the cracking
load of 29.6 kips very extensive diagonal cracking had occurred but
the beam was still capable of carrying increased load. The beam is
shown after failure in Fig. 10( c). All of the beams which failed in
shear-compression behaved very much like Beam B-12 in Fig. 10. The
following observations m8\Y be made as being characteristic of the
shear-compression failures:
(1) Diagonal tension cracks developed before failure.
The reader is again referred to the load-deflection curves in Figs. 5
and 6. For those beams which failed in shear-compression, there are
sharp breaks in the curve. These breaks were caused by the formation
of' diagonal tension cracks, without loss of load carrying capacity.
The very shortest beams do not demonstrate these breaks because the
diagonal tension cracks developed gradually. Beam B-3 failed after
only one end had developed a diagonal tension crack, and thus was
actually a transition failure between shear-compression and diagonal

17
tension failure. BeFml .B-13 fa.iled just after t.he development of the
second diagonal tension crack) and thus Has cuso very nearly a diagonal
tension failure.
(2) The extent to vrhieh the be&..m carried increased
load after diagonal tension cracking depended on the aid ratio.
This can be seen in Figures 15 and 16 which shm-, the shear at diagonal
tension cracking and at ultimate for all beams except A-5 and B-5 "Thich
failed in flexure. It can be seen that the increased strength after
diagonal tension cracking was very large for the smallest aid ratio
but decreased rapidly with increased a/d.
(3) Final failure occurred by destruction of the
compression zone above a di~onal tension crack. The concrete did not
crush in the same manner as in flexural failures, hOHever. The failure
was usually on a plane o.r 45 0 or less to the vertical, and the break
was clean and sudden.
( 4) Considerable cracking occurred along the steel
be~ore failure, extending from the point where the diagonal tension
crack intersected the steel toward the support. At .failure the steel
was always completely separated from the concrete above it for at
least half the length of the span.
(5) Diagonal tension cracking caused a very marked
change in the steel stress distribution, as can be seen in Figs. 7
and 8. After cracking, the steel stress was almost const~~t over the
whole span. It should be noted here that the cracking load for B-ll,
as given iIl Table 4, is 37.8 kips ~ at 1ilhich load. there was aJ.ready

18
considerable stress redistribution as can be seen in Fig. 7. This
difference is because of the gradual crack development, and vas
present in all of the 52-in. beams, but not in the longer ones, since
for the latter the crack development was sudden. This is illustrated
in Fig. 8 for beam B-13. For this beam, the load increment at '\"hich
diagonal tension cracks formed on each end can easily be inferred from
the marked changes in the stress distribution 0
With such high steel stresses near the support after
diagonal tension cracking, it is obvious that the bond and horizontal
shear stresses near the support, and probably even in the overhang,
must be very great in order to develop the steel stress in a few
inches. Although external stirrups were used to prevent failure
by splitting along the steel at the support, it was never certain
how effective they were, since that part of the beam usually suffered
some damage during final collapse. It is possible that failure near
the support could have triggered the final failure in some instances 0
Beam A-2 which failed in diagonal tension did not have
external stirrups. It is likely that. it would have failed in shear-
compression if stirrups had been used. The ultimate load would not
have been mUch higher however, as indicated by the curves of Fig. 15.
(6) All the shear-compression failures occurred at
relatively small deflections. However, relatively large increments
o.f deflection were associated ,·rith diagonal tension cracking, as can
be seen in Figs. 5 and 6.

19
(b) Diagonal Tension Failures. Ten of the beams tested
failed in diagonal tension. Diagonal tension failures are failures at
the cracking load. The development of a typical diagonal tension
failure is illustrated in Fig. 11 for beam A-14. Until diagonal
tension cracking and failure, the beams developed cracks gradually as
shown in Fig. ll( a) and (b). When the load reached the diagonal
tension cracking load, a long sweeping crack developed, and the beam .
collapsed, as illustrated in Figc ll(c). The following observations
may be made about the diagonal tension failures ~
(1) Failure occurred at the diagonal tension crack-
ing load. This is by definitiono It is to be noted however that
only one diagonal tension crack occurred for these beams, while in
the case of the shear-compression failures both ends developed
diagonal tension crackso (Beam B~3 developed only one crack, but, as
has already been noted, it was a transition failure, and thus had
some characteristics of a diagonal tension failure).
(2) Final failure occurred by destruction of the
compression zone above the diagonal tension crack~ and by splitting
along the steel from the point w"here the crack started to the support.
In four of the beams, the dest~...lction of the compression zone ,-ras
s~ilar to that for the shear-compression failureso For the others,
there was no evidence of crushL~g or shearing offo For beams A-3,
A_' ~ and A-IL+, the comnression zone vIas ver'JT slender as ca..."'1 be seen ~- .... ./, -- ...
for beam A-14 in Fig. ll(c), and A-13 in Fig. l4(a)o It appeared as

though the compression zone buckled. For the beams A-15, B-l~, and
B-l5, the compression zone \vas not slender) and didntt buckle, but
broke under the stub very much like beam B~13 shown in Fig. 14(b).
20
For the last three beams at least it did not appear that the
destruction of the compression zone was caused by excessive compressive
stresses.
In all cases a hori'zontal crack developed during failure
along the steel from the point where the diagonal tension crack started
to the support. It was impossible to determine whether this crack
developed before or after the destruction of the compression zone.
In the discussion of the shear-compression failures it was noted
that there was much cracking along the steel after diagonal tension
cracking but before destruction of the compression zoneo It was noted
also that the steel stress was almost constant over the \{hole span
after diagonal tension crackingo These observations indicate that the
steel can be split from the concrete above it before the destruction
of the compression zone, and could therefore trigger the failure. For
the three beams which failed like beam B-13 in Fig. 14(b) this appeared
to be what happened 0
(3) The ultimate load was less for the longer beams
than for the shorter ones. This is illustrated in Figso 15 and 16.
The diagonal tension failures are those for which the ultimate shear
,{as equal to the cracking shear 8 The difference in strength between
short beams and long beams can be seen to be much less for diagonal
tension failures than for shear failureso Beams A-3 and A-13 fall

21
somewhat low, and beams A-2 and A-12 somewhat high. The analysis of
the next chapter indicates that except for beam A-13 these differences
are explained by the variation in the concrete strength 0
(4) The steel stress distribution up to diagonal
tension failure varied almost directly with the moment as illustrated
for beam A-15 in Figo 9.
(5) The deflections at failure were smalle
(c) Flexural Failureso Two beams, A-5 and B-5." failed in
flexure 0 They are shown after failure in Fig. 12. Although inclined
cracks developed at final failure J these two beams are classed as
flexural failures because very large deflections were observed (see
Figo 5)~ the steel had evidently yielded to permit these deflections,
and the concrete adjacent to the stub had begun to crush before the
inclined cracks developed. Until final failure, the crack development
was gradual. After the reinforcement began. to yield, at a deflection
of about 006 in. for both beams, there was very little increase in
load-carrying capac it Yo As the deformation was increased, horizontal
cracks began to develop about 1 1/2 irlo under the stub. By the time
the concrete began to crush, these cracks had developed for the fUll
length of the stub (see Figo 12). After some crushing had. occurred.9
inclined cracks developed. The final destruction of the beam was
due partly to these inclined cracks.
(d) Effect of Axial Load.. Except for small differences in

22
concrete strength, the beams tested with and without axial load "rere
identical. Any differences in behavior or load-carrying capacity
should therefore be completely attributable to the 20-kip axial load.
The axial load had the .following effects ~
(1) It changed the pattern of crack development.
Flexural cracking was suppressed and the first flexure cracks appeared
at a higher load. There was a reduction in the totaJ. nwnber of cracks,
and also in the height to which they roseo This is illustrated in Fig.
12.
In general, diagonal tens ion cracks began farther from
the support and did not rise as high for beams vrith axial load as for
those \vithout. This is ShO\ID in Figs .. 13 and 14e Examination of Table
3 shows that the diagonal tension cracks did not start farther from
the support in every case for the beams with axial load; however, the
depth of the compression zone was greater in every casee
(2) The axial losd affected the deformation character
isticso The extent of this effect was much greater for the beams with
three No. 4 bars than for the beams with two Noo 9 bars, as can be
seen in Figures 5 and 6. The axial load raised the load-deflection
curves considerably for the beams vlith the small steel percentag~, but
only very slightly for those with the high steel percentageo The
reason for t.his difference is explained in a later sectiono The axial
load tended to increase for the besms with three No 0 4 bars and had to
be adjusted.

23
(3) The axial load generally raised the diagonal tension
cracking load.. This effect can be seen in Table 4 and Figs. 15 and 16.
The effect was greater for the shorter beams and also for the beams "lith
three No. 4 bars. For beams B-14 and B-15, the diagonal tension
cracking load was not raised, but rather was slightly lower than for
A-14 and A-15 which had no axial load.
(4) The ultimate load carrying capacity was increased
for all beams except B-14 and B-15o The ultimate capacity was affected
in much the same Wa;j as the diagonal tension cracking load, that is
more for the short beams than the long ones J and more for the beams with
the low steel percentage. The reader is again referred to Table 4
and Figs 0 15 and 160 Beam B-5 which failed in flexure withstood only
slightly more load than the corresponding beam without axial load.
(5) The axial load changed the mode of failure from
diagonal tension to shear=compression for some of the beamso The shear
compression strength was increased more than the diagonal tension
strength and conse~uently the transition between shear compression and
diagonal tension failures was shifted to larger aid ratios as a result
of thE; presence of axial load 0 Beams B-2;1 B-3 ~ B-12 and B-13 failed
at loads greater than the cracking load, while the corresponding beams
without axial load. failed at the cracking loado Beams B~3 and B=13
were not true shear-compression failures however, since B~3 developed
only one crack and B~13 did not fail by destruction of the compression
zone in the manner of the other shear compression failures. These two

24
beams were transition failures.
(6) The effect of the axial load on the maximum steel
stress at failure was not consistent. For all the beams but B-12
however J the axial load ca;used the beam to develop greater steel
stresses at failure. For beam B-12 the maximum steel stress was 19.7
ksi J while for beam A-12 it \{as 20.7 ksi.

25
J!.l. ANALYSIS OF TESr RESULTS
11. Load-Deflection Characteristics
It has been noted in Section lO(d) that one of the effects
of axial load was to alter the load-deflection relationships. For
the beams with a small steel percentage, the effect was ~uite large,
while for those with a high steel percentage, it was small.
For a homogeneous elastic beam, the addition of axial load
would not affect the deflections due to lateral loadingo Reinforced
concrete beams, however, develop tension cracks and at high stresses
the concrete is not elastic; consequently, the axial load does have
an effect on deflection. The extent of the effect depends on the
height of the neutral axis and the stress level in the concrete.
For low percentages of steel, the neutral axis lies above
the line of action of the axial 10000 The axial load tITllS provides
a counter moment which tends to reduce the deflections. For high
percentages of steel, the neutral axis is low'er; consequently, the
effect of axial load on deflection is much lesso
The addition of axial load also tends to increase the
deflections in both cases by increasing the compressive stresses in
the concrete and thus causing the onset of inelastic beha.vior in
bending to occur at; a lower lateral load.
Fi~e 17 shows the theoretical effect of a 20=kip axial
load on the moment-rotation relationships for the beams tested.
Figure l7(a) is for the beams with a small steel percentage, A-I

through A-5 and B-1 through B-5o Figure 17(b) is for beams A-ll
through A-15 and B-ll through B-15 which had a. large steel percentage.
The curves of Figo 17 were computed on the basis of a.
completely cracked section, using the concrete stress block presented
in Fig. 4, Refo 20 In the analysis, the axial load. was applied at
mid-height of the section, as in the tests 0
It can be seen that the axial.. load raised considerably the
curve for the section with a low steel percentage, but only slightly
for the section with a high steel percentage. ~It is be-lieved that
these computed relationships account satisfactor~ for the
difference in the effect of the axial load on the load-deflection
curves in Figs. 5 and 60
12. Diagonal Tension Cracking Load
(a) Beams Withou.t Axial Loado It has been noted that
diagonal tension cracks fO:!'med after a considerable number of.'
vertical and inclined cracks had. been observed (see Figo 11).. Each
diagonaJ. tension crack was a continua.tion of.' one of the inclined
cracks. Since the inclined creeks extended almost to the neutral
axis, the diagonal tension ere.eks exteI1..a.ed into the compression
zone.. The fla.tness of the diagonal tension cracks and their sudden
development are further indications that they occurred in the
compression zone.
Diagonal tens ion cracks occur when the princ ipal tens ile
stress reaches the tensile strength of.' the concreteo The variables
which affect the principal stress in the compression zone therefore
27
determine the diagonal tension strength of the beam. The stresses in
the compression zone are determined by the depth to the neutral axis,
the moment at the section, and the shear 0 Since there is a complex
interrelation of the variables involved, and since the pertinent
properties of the concrete are not easily evaluated, an accurate and
useful mathematical prediction of diagonal tension cracking is neither
possible nor practical.. The best solution appears to involve a
simplified empirical approach which takes into account fairly well
the effects of the several variablesc
Since this test program did not include concrete strength
as a variable, and since only two steel percentages were used, the
effect of these two variables was determined from other studieso
Bernaert (Ref .. 3) found that the nominal unit end shearing stress for
uniformly loaded beams at diagonal tension cracking was predicted
quite well by the equ8.tion~
fV v 120 P + 4.3 c
c = !;, + 10 "1 + 0085 f~ d 1000
(1)
Equation (1) gives values which are too high for the beams
reported here, the difference being due to the manner of loading
which results in a different shear distribution" For beams with one
or two symmetrically placed 10ads~ the length effect is considered
more conveniently by the aid ratio j which has significance in both
cases"
In Figo 18 the shear span-depth ratio is plotted against

the quantity 120 p + 4 • .3 v c
ft c
--~~-- which was computed from the O.C$C:; ft 1 + ." C
1000
test resultso The points on this plot can be fitted with the line
23 + 2 a/d. The nominal unit shearing stress at diagonal tension
28
cracking for beams without axial load is then given by the equation:
fl V = 120 P + 4.3 c
c 23 + 2 aId 1 + 0085 f~ 1000
The correlation between the test values for each beam, and
the values computed by equation (2) is shown in Table 5(a)0 The
correlation is very good, except for beam A~13, for which the error is
13 per cento
The data. from. tests on beams under two concentrated loads
reported by Feldman and Siess in Refo 4 are also plotted on Fig. 18.
The maximum error for these beams by equation (2) was found to be 7
per cento Equation (2) is therefore as good for two symmetrica1J.y
placed loads as for centerline loe.ding through a stub. The stub
apparently does not affect the cracking load.
(b) Beams With A.xial Loado Except for two beams, the
axial load. increased the dia~o:nal tension cracking load~ The amount
of the increase depended on the length of the beam and the steel
percentage. Increasing the length and increasing the steel percentage
both decreased the effect of the axi~l loadQ
The axial load has two effects. It lowers the neutral axis
and it increases the compressive stresses, both of which decrease the

29
principal tensile stresses. In the discussion of deflections, however,
it ,,,as seen that for high values of steel percentage the neutral axis
was shifted very littleo Also, for high values of moment, associated
with longer beams, the concrete in the compression zone becomes
inelastic and consequent~ the resistance to shear is reducede An
expression which gives the increase in strength due to axial load
must therefore decrease with increasing steel percentage and increasing
length"
For a homogeneous elastic beam, the effect of axial load on
the diagonal tension strength is simply an addition to the strength
without axial load. For reinforced concrete, the effect had to be
modified to decrease with p and aid for the reasons stated&
The equa.tion for nominal unit shearing stress at diagonal
tension cracking' was written in the form:
120 ;p + 4.3 Vc = 23 + 2 aId
The first term in this equation is from equation (2) while
the second term represents the additional strength due to the axial
load. The linear form of the effect of p and aid on the axial load
contribution was chosen because not enough tests were made to
warrant a more complicated relation" The constants EJ.' IS, and IS were determined empirically from the test results for the beams
with axial load, and the resulting equation for nominal unit shearing
stress at diagonal tension cracking is:

30
_ 120 P + 4 .. 3 vc - 23 + 2 aid
fl C N
+ -7- (0.210 - 3· 4p - 0.034 a/d) 8' bd
The correlation between the test values for each beam, and
the values cOlIIJ?uted by equation (3) is shown in Table 5(b). Except
for beams B-1 and B-ll with the shortest spans, the agreement is
very good. It has been stated that the cracks developed slowly for
the shortest beams and that there was already considerable stress
redistr ibution at the observed cracking load" This probably is the
reason for the difference between the observed and computed values
for these beams.
Equation (3) is equally good for beams with and without axial
load, since for beams without axial load N = 0, and the equation
reduces to equation (2).
130 Shear-COmpression Failures
A shear-compression failure has been defined as fa.ilure by
destruction of the compression zone above an inclined crack at a
load greater than the diagonal tension cracking load... Eight of the
beams tested failed i..11 this manner; two without axial load and six
with axial load~ Oily the shortest beams of those tested without
axial load failed by shear-compression, but with th~ addition of
axial load the two next longest beams for both steel percentages
also failed in this manner. It has been pointed out that beams B-3
and B-13 are considered transition failures"
Since ~he number of beams failing in shear-compression is
jets .... .. oe I~ Un1ve~ of 1111no1a
2101 ICEL . U 208 N. Romine Street r_a, Illinois 61801:
31
small, the analysis consists only of comparing the test results with
what has previously been postulated about this mode of fai1ureo
(a) Beams Without Axial Loado Recent investigators have
tried to correlate this type of failure on the basis of a limiting
moment. Laupa (Ref. 2) gives the following equation for the limiting
shear moment for a beam without axial load~
(4)
Fi~2re 19 shows the ultimate moment plotted against the
shear span ... depth ratio 0 It includes all of the beams with and without
axial load. The beams designated 9'S39 in the legend are those which
failed by shear-compressiono The dotted line is the value of M by s
equation (4), using the concrete st:;:-ength of the beams without axial
load~ Equatj.on (4) includes only properties of the section~ and would
be a horizontal line except for the variations in concrete strength.
Beams A=l and A~ll were the oP~ two beams without axial
load that failed by shear~compressiono Their ultimate moments as
given in Figo 19 are seen to be in reasonable agreement with the
predictions of equation (4)0
Beams A~2 and A-12 failed Ln diagonal tension and, according
to the theory of shear failure presented in Refo 4~ should have
failed at a moment greater than M" It can be seen in Fig. 19 that s
the measured ultimate moment for these two beams was a.ctusJ.ly less
than the computed value of Ms. The difference between the measured

and computed values is 11 per cent for beam A-2 and 14 per cent for
beam A-12. These variations however, are wi thin the range of accuracy
of ~ 15 per cent which has previously been assigned to equation (4)
(Ref' 0 2).
Beams A-3 and A-13 aJ.so failed in diagonal tension and
because of their greater aid vaJ.ues should have failed at ultimate
moments significantly in excess of the computed shear-compression
moment M from equation (4). From Fig 0 19 it is seen that this s
condition is satisfied fai:ply well for beam A-3, but ra.ther poorly
for beam A-l); whereas the measured uJ:timate moment exceeded the
computed value for beam A-3 by 55 in-kips, they were nearly equal for
So far as this investigation indicates, it can be said that
equation (4) is, within the assigned accuracy, a fair measure of the
shear-compression strength of beams without axial load.
It is interesting to note the shapes of the curves in Fig.
19., All four curves rise at the small aid value of' 2, and beam B-1
at this value of aid developed a moment larger than the flexural
ultimate 0 The values of ultimate shear for the shortest beams in
Figs 0 15 and 16 are clearly not of the same order of magnitude as
the others. It has been noted that these beams I did not develop
diagonal tension cracks suddenly or of the same shape as those in
longer beams, but had rather steep cracks which did not flatter out,
and which developed slowly. Considering these facts, it appears that
the behavior of short beams is different than that of longer beams~
33
perhaps fundamentally 0
(b) Beams With Axial Loado The three shortest beams for
each steel percentage tested with axial load failed by shear-compression,
as indicated in Figo 19 «>
It has been suggested that the addition of axial load does
not materially increase the strength of a beam against shear
compression failures, and m~ even decrease ito In Refo 2, an extra
pola.tion of Laupa' s empirical expression on a semi-ra.tional basis
indicated that the compressive force was increased with axial load,
but the increase was almost all or more than 'used up in counteracting
the moment of the axial load; consequently, the la.teral moment was
almost unchangede The curves of Figo 19 indicate that fOT the beams
of this investigation, there was a significant increase in strength
for the beams with axiaJ. lomo It has been stated earlier that the
shear-compression strength was increased more than. the diagonal tension
strength so that beams B-2~ B-3, B~12 and B-13 failed by shear
compression while the correspondbg beams without axial load failed by
diagonal tensiono
The presence of axial load not only increased the total
compressive force in the concrete but also the total tension force in
the steel. This is indicated by the steel stresses recorded in Table
4 where, except for beam B-12, the max~~ steel stresses were all
higher for the beams with axial load than for the corresponding beams
without axial load. For beam B-12 the maximum stress was 100 ksi

34
less than for beam A-12. Tha.t the steel stresses were necessarily
larger for the beams with axial load can easily be shown. Taking
moments about the center of compression at the point of maxtmum moment
at failure yields the following equa.tion:
Equation (5) is solved for f in Table 6 using the measured s
values for kud, and k2 = 0050.. The actual value of k2 was probably
something different from 0.50; however, since the actual value is not
known, and since its effect is small, it was considered suitable to
assume 0.50 for purposes of comparison ..
There are several things to be noticed in Table 60 First,
the moment of the steel stress at failure (column 6) was higher for
beams with axiaJ.. load than for beams without axial loado The amount
of the increase ranged £rom 26 in-kips for beam B-12 to 92 in-kips for
beam B-ll.. Second, there was no significant difference in the amount
of the increase for the beams with the high and the low steel
percentages.. The increase was greatest for the shortest beams and
less for the longer oneso This cannot be interpreted to have
significance 3 however, since the longer beams without axial load
failed in diagonal tension and the moment at failure was presuma.bly
greater than the shear· moment 0 Third, the computed steel stresses at
failure compare fairly well with the measured values, well enough at
least to confirm the trends which are being demonstratedo The larger
differences for some of the beams is doubtless due to the extra-

35
polation used to determine the values at ultimate.
This analysis leads to one important conclusiono It has been
noted that both the compressive force in the concrete and the tension
:force in the steel were larger at failure for the beams with axial load
than for the corresponding beams without axial load. These conditions
cannot be satis:fied by any theory which uses as criteria a single
limiting strain in the concrete and any ordinary strain distribution
whether it be a straight line or one modified by a concentration
factor ''lhich does not depend on the axial load 0 For if the strain in
the steel is determined by the position of the neutral axis and a
limiting concrete strain, then the steel stress can increase only if
the neutral axis rises and the compressive fOTce is diminished» or vice
versa. Obviously a theory which will predict the shear-compression
strength of the beams of' this :Ll1vestigation must be such that is
allows both tension and compl"'ession ro!'c;es to lnl:;!'ease 0
In section lO(a) it was poL~ted out that the steel strain
measvrements L~dicated that the stress in the reinforcement after
diagonal tension cracking was almost c.onstsnt over a. considerable
portion of the spano 'Thus the besms szted like tied arches and there
is no reason wIJY an increase in the tension :forc.e at .failU!"e should
necessarily in'tfolve a reduction of the co..rnpressive force 0
Since the axial l()ad was kept constant at all times, the
ra.tio of axial load to shes;r variedo The values at ultimate :for the
shear~compression :fai~~es ranged from 0062 for beam B-ll to 2.83 for
beam :8-)0 The value of the ra.tio d\~es not appear to have much

significance, however, since the amount of increase in moment due to
axial load is roughly the same in spite of' the variation in the axial
load to. shear ratio.
14. Flexural Failures
The comparison between the computed and measured ultimate
moments for beams A-5 and B-5 which failed in flexure is shown in
Table 7. The equations from which the ultimate flexural moments were
computed are given in the table. The equa.tion for ultimate moment is
equally valid for beams with and without axial load since for beams
without axial load. N = 0, and the equation reduces to the usual one
for beams at flexural ultimate.. The value of eu ' ~k3' and k2 were
assumed as indicated in the table, and represent values which have
been found in other studies to give reliable results.. Since the value
of the deflection at ultimate had to be known for beam B- 5J the
measured value of 100 in .. was usedo
The measured values of the ultimate moment were in good
agreement with the computed values.. Since the computed values were
6 per cent higher in both c ases ~ the equations used appear to be
satisfactory in so far as the effect of axial load on the ultimate
flexural moment is concernedo It also appears that the inclined
cracks which developed near failure did not appreciably affect the
load carrying capacity ..
150 COmparison With Previous Test Results
A previous report (Ref 0 4) presented the results of tests
37
on six beams tested under two point loading with no axial loado The
cross-sectional properties and the shear span of those beams were the
same as beams A-II through A-15 reported here except that in the
previous report one longer beam which failed in flexure was tested.
The purpose of this section is to compare the results of the previous
tests with those reported here.
The beams for which a comparison can be made are listed in
Table 8. Beams L-l through L-6 are from the 'previous report and
beams A-ll through A-l5 are from the present investigation for which
the comparison is to be madeo
In order to present the data in a more consistent manner, it
is necessar,y to adjust the measured values of moment for the variation
in concrete strength. This is done in Table 8 by multiplying the
measured vaJ.ues of ultimate moment by the factor K. The factor K
adjusts the measured values to values corresponding to a concrete
strength of 4000 psi, and is the ratio of the calculated value of
shear moment from equation (4) for a beam with 4000 psi, to the
calculated shear moment for the beam with ft equal to the respective c
values for each beam. The adjusted values of' ultimate moment appear
under the heading KMu :in Table 8, and it is these values which are
to be compared.
In Fig. 20 the beams are compared graphically. The adjusted
values of moment are plotted against the she ar·· span-depth ratio a/do
Also included on the f'igure are the computed value of' M , the s
moment corresponding to first cracking according to equation (2), and

the ultimate flexural moment.
The beams failing in diagonal tension have already been
compared in the section on diagonal tension cracking, and were found
to be in good agreement with the results of these tests. This is
illustrated again in Fig. 20.
The shortest beams, with aid equal to 2, can be seen to be
in good agreement with each other and with M 0 Beam A-12 of this s
investigation with aid equal to 3 failed in diagonal tension at a
moment 14 per cent less than M 1 while the two corresponding beams of s .
the previous report failed in shear-compression at ultimate moments
somewhat greater than M • s
The beams tested previously had an external stirrup placed
just inside the. supports ,.while for' the beams of this report the
stirrup was placed just outside the, ~llpports. It is believed that
this differenc'e ~ account for the greater loads carried by the
short beams of the previous investigation. It may also explain why
the transition to diagonal tension failure was not at the same aid
ratio for the two 'investigations.
Only one flexural failure is presented in Table 8 and Fig.
20. It was the longest beam of those in Ref. 4. The vaJ.ue of
ultimate moment .. was not corrected for ft in the table, since the c
flexural strength does not depend on concrete strength to such a
large extent. The measured ultimate moment was 2 per cent less than
the computed value.

39
v. SUMMARY
The object of this investigation was to .study the effect.of
axial load on the shear strength of reinforced concrete beams.
Twenty beams were tested, ten without axial load and ten
with an axial load of 20 kips. ~cept for" small variations in
concrete strength, the beams tested with axial load were identical
to those tested without axial load. The other variables· were steel
percentage and span length. Only two steel percentages were used,
0.0100 and 0.0333. The span length was varied from 52 to 132 in., in
20-in. increments so that the shear span-depth ratio varied from 2
to 6. Four beams were tested on each span length, one at each steel
percentage with and without axial load.
The beams were loaded in several increments up to failure.
The load was applied at m~dspan through an integraJ..1y cast column
stub. For those beams tested under axial load,. the axial load was
applied at the beginning of the test and was kept constant at 20 kips
throughout the test. Loads and deflections were measured in all of
the beams and strains in the tensile steel were measured in some o
Three modes of failure were observed, shear-compression,
diagonal tension and flexure. Eight beams failed in shear-compression,
ten in diagonal tension and. two in flexure. The shear-compression
failures occurred in the shortest beams, the diagonal tension fe.i1ures
occurred in the medium long beams and the flexural failures occurred
in the two longest beams with the .small steel percentage.

40
1. Diagonal Tension Cracking
The diagonal tension cracking load was observed in all beams
except in those failing in flexure. For the beams which failed in
diagonaJ. tension, the diagonal tension cracking load was also the
ultimate load; however, for those which failed in shear-compression,
the ultimate load was greater than the diagonal tension cracking load.
The following empirical equation was developed for the
nominal unit shearing stress at diagonal tension cracking:
f't - 120 P + 4. 3 c- + N (0 270 3 4 0 034 /d) (-;z;)
v c - 23 + 2 a/d· 1 + 0.85 f' ~t bd • -. J? -. a .-
1000
Equation (3) is equally good for beams with and without
axial load. The correla.tion of the tests results with equation (3)
was within 5 per cent except for three beams. Two of these were the
shortest beams tested with axial load, for which error was 15 and 16
per cent. It is felt that the behavior of very short beams is somewhat
different than for longer ones. Nevertheless, the equa.tion gives
vaJ.ues lower than those measured for the short beams and thus is on
the safe side. The effects of the concrete strength fl. and the steel c
percentage p for beams without axial load were taken from other stUdies
and were found to be satisf'a.ctory in so far as this investigation is
concerned. The ef'fect of axial. load was to increase the diagonal
tension strength. The amount of' the increase was found to be less
for the beams with a. high steel percentage and for the longer beams.
For the longest beams with the high steel percentage, the axial load

41
did not increase the diagonal tension cracking strength.
Equation (3) applies only to beams with an aid ratio equal
to or greater than 2. other studies have indicated that the diagonal
tension cracking strength increases considerably for very short
beams; consequently, equation (3) would require modification to
apply to such beams.
Since only one value of axial load and only two steel
percentages were used, and since the concrete strength was kept
constant, the second. term of equation (3) which represents the add ..
itional strength due to axial load cannot be considered general.
Equation (3) was developed for beams loaded at midspan.
through a stub but was found. to apply equally well to beams loaded
with two symmetrically placed concentrated loads. Thus the stub
does not appear to affect the diagonal tension cracking strength.
2. Shear-Compression Failures
Two of the beams tested without axial load, and six of
those tested with axial load failed in shear-compression. The
moment at ultimate load for the beams without axial load was in
fairly good. agreement with the equation:
(4)
The axial load increased the shear-compression strength
more than the diagonal tension strength with the result that the
mode of failure was changed for some of the beams. For four of the

42
beams which failed in shear-compression with axial load, the
corresponding beams without axial load failed in diagonal tension.
The increase in strength was larger for the shorter beams than for
the longer ones. The increase in moment was in a.l1 cases more than
could be accounted for by the axial load directly. Both the total
compression force in the concrete and the total tension force in
the steel were larger for the beams tested with axial loado
The increase in strength due to axial load did not seem
to be a f'unction of the ratio of axial load to shear.
strain measurements in the steel indicated that there
was a major redistribution of stress after diagonal tension crack-
ing, which resulted in the stress in the steel being constant over a
considerable portion of the span" It is suggested that, since beams
undergo considerable damage at diagonal tension cracking, and since
the shear-compression strength is not as predictable as the diagonal
tension cracking strength, design considerations should perhaps be
based 'on diagonal tension cracking"
3. Flexural Failures
The measured values of the ultimate moment for the flexural
failures were found to be in good agreement with the computed values.
The effect of the axial load was to increase the load~carrying
capacityo
ietB Ie!a~oe !ooa Un1versity of II11no1.
BI06 HeEL 288 N. Romine Str,eet'
Urbana, Illinois 6180~

. REFERENCES
1. Siess, C. P., itA SUggested Program of Tests for the Development of Criteria for the structural Design of Reinforced Concrete Box Culverts,U Civil Engineering Studies, structural Research Series Noo 77, University of lllinois 0 June 1954.
2. Laupa, A., Siess, C. Po, and Newmark, N. Me" liThe Flexural and Shear strength of Reinforced Concrete Box Culverts," Civil Engineering Studies, structural Research Series Noo 12, University of Illinois. April, 1954.
,. Bernaert, So, "strength in Shear of Reinforced Concrete Beams Under Uniform Load,u Mo So Thesis, University of illinois, 1956.
4. Feldman, Ao, and Siess, Co P., "Effect of M::>ment-Shear Ratio on Diagonal Tension Cracking and strength in Shear
43
of Beinforced Concrete Beams,~ Civil Engineering studies, Structural Research Series Noo 107, University of nlinois. June 1955.

44 TABLE' 1
PROPERTIES OF BEAM:)
For all beams: b = 6 in., d = 10 in., h = 12 in.
Beam L aid fl (psi) f d(' stirrups c y in. Ea:t~ll 1 :Ba:t~ll 2 k~;L
(a) Beams reinforced with three No. 4 bars z J2 = 000100
A-l 52 2 4230 4070 66,,5 yes
A-2 72 3 4450 4570 6800 no
A-3 92 4 3220 2820 6506 yes
A-4 112 5 3490 3890 66 .. 6 yes
A-5 132 6 4270 4450 6700 yes
B-1 52 2 4350 3780 66.5 yes
B-2 72 :; 3900 4140 6605 yes
B-3 92 4 4080 3820 67c1 yes
B-4 112 5 3790 4100 6605 yes
B-5 132 6 4190 4120 6700 yes
(b) Beams reinforced with two Noo 2 bars2 E = 000333 A ... ll 52 2 3830 4100 4905 yes
A-l2 72 3 4180 3870 4505 yes
A",,13 92 4 2960 3210 5700 yes
A""l4 112 5 3780 3990 5208 yes
A-J.5 132 6 4070 3630 48.1 yes
B ... J.1 52 2 3940 3660 48Gl yes
B-l2 72 3 13800 3930 5608 yes
B-l3 92 4 4150 4050 5104 yes
BC"3l4 112 5 3880 4250 5206 yes
B-J.5 132 6 4200 4110 4703 yes
Note~ A - series without axial load B - series with axial load of 20 kips '* CD the values of f are the average value
y

TABLE 2(a)
PROPERrIES OF CONCRRrE MIXES BEAM3 RElNFOICED WITH THREE NOo 4 BARS
Beam Bateh Cement~Sand:Grave1 Cement /Water Slump Compressive Modulus of' Age at by weight by weight strength, :fl Rupture, :f Test
c r D83s in. psi psi
A-1 1 1000~3039:5005 1.29 1 4230 383 32 2 1.00:3044:5009 1.2.3 2 1/2 4070 417 .32
A~2 1 1.00~.3049:5.15 1·35 2 4450 500 35 2 1.00~.3048:5010 1.45 3 4570 550 .35
A.". 3 1 1 .. 00~3.49~5013 1.21 1 3220 467 .35 2 1.00~3049~5013 1 .. 22 5 2820 467 35
A-4 1 1,,00:3 .. 48~5013 1005 5 .3490 575 28 2 1 .. 00:3050:5060 1022 .3 3890 642 28
A""5 1 1000~3046~5007 1017 2 4270 383 32 2: 1000~3 .. 49:5011 1022 1 4450 383 32
B~1 1. 1.00:3046~5,,13 10.38 2 4.350 525 33 2~ 1 .. 00:3 .. 51~5 .. 16 10.37 4 3780 458 33
B .... 2 1. 1000:3051:5·12 1 .. 30 2 3900 483 29 2 1000:.3c51:5 .. 07 1·33 2 1/2 4140 475 29
Be» 1. 1000:3·51:5015 1.30 2 4080 375 30 r~ c. 1000:3.49:5·17 1.28 .3 . 3820l 475 30
Bc=>4 1. 1000:.3044:5·11 1024 6 3790 408 27 q c. lo00:3.46~5·13 1,,43 2 4100 458 27
Be>5 1. 1000:3.44:5013 1029 2 4190 542 36 q c. 1000:3047:5020 1029 2 4120 542 36
+="" V1

TABLE 2(b)
PROPERrIES OF CONCRErE MIXES BEAMS REINFOK!ED WITH TWO NO.9 BARS
Beam Batch Cement:Sand:Grave1 Cement/Water Slump Compressive Modulus of Age at by weight by weight Strength, :f 1 Rupture, :f Test c r Da\Ys in. psi psi
A-11 1 1.00:3.47:5.19 1.22 2 3830 417 35 2 1.00:3·51:5·23 1.33 1 4100 417
A-12 1 1.00:3.47:5·19 1034 3 4180 467 29 2 1.00:3.47:5·15 1.38 4 3870 483
A-13 1 1.00:3·57:5·23 1.02 2 1/2 2960 350 28 2 1.00:3.51:5.24 1.31 2 1/2 3210 425
A-14 1 1.00:3.41:5.16 1.28 3 3780 433 26 2 1.00:3.42:5·17 1.42 2 3990 458
A-15 1 1 .. 00:3.39:5·07 1.17 5 4070 508 42 2 1.00:3.39:5 .. 08 1.13 3 3630 450
B-1l 1 1.00:3.47~5·07 1.09 2 3940 .358 35 2 1.00:3051:5.08 1.25 3 3660 450
B-12 1 1000:3052:5·09 1,,21 3 3800 442 35 2 1.00:3.50:5·05 1.21 6 3930 458
B-13 1 1.00:3.43:5·11 1016 3 1/2 4150 425 31 2 1.00:3.39:5.06 1.19 2 1/2 4050 408
B-14 1 1.00:3.40:5 .. 10 1.12 6 3880 408 29 2 1.00:3.21:4 .. 96 1.33 6 4250 433
B-15 1 1.00:3.52:5·14 1.34 2 4200 400 28 2 1.00:)048:5.09 " 1035 2 4110 408
+=-0'\

47
TABLE 3
DISrANCES TO IMPORI'ANT POmrs ON CRACK CAUSIOO FAILURE
Beam a x kd No. x u
in. in. in.
(a) Beams Reinforced With Three No~ 4 Bars
No Axial Load
A-1 20 6.75 0·75 A-2 30 10.0 1.1
A-3 40 16.25 0.8
A-4 50 29·5 0
A-5 60 Flex. 1·5 20-kip Axial Load
B-1 20 6.0 1·7
B-2 30 15·75 1.3
B-3 40 22.0 2.2
B-4 50 28.0 1.8
B-5 60 Flex. 3.0
(b) Beams Reinforced With Two No. 9 Bars
No Axial Load.
A-ll 20 4.0 1.1
A-J.2 30 10·5 1.3
A-J.3 40 12.2 1.2
A-14 50 19·0 1·5
A-15 60 39·0 3.2 20-kip Axial Load
B-ll 20 9·75 2·7
B-l2 30 13·75 3.4
B-13 40 23 2·5 B-14 50 28 3·0
B-15 60 38.0 3.6

4B TABLE 4
TES:r RESULTS
Beam a Axial Mode* Cracking Ultimate M Max:imum ft
No. d Load of Load Load u steel c
P a (Batch 2) Failure P P u stress, c u 2 kips kips kips in-kips ksi psi
(a) Beams reinforced with three No. 4 bars No Axial Load
A-1 2 0 s 20.6 33.0 330 4010 A-2 3 0 ill 18.8 18.8 282 4510 A-3 4 0 Dr 15.4 15·4 308 2820 A-4 5 0 Dr 15·8 15 .. 8 395 3890 A-5 6 0 F 14·1 441 4450
Axial Load = 20 kips B-1 2 20 s 29 .. 8 51.4 514 3780 B-2 3 20 s ,'23.4 29·5 442 4140 B-3 4 20 s 20.6 2108 436 3820 B-4 5 20 Dr 18·9 18 .. 9 472 ' 4100 B-5 6 20 F 15·1 453 4120
(b) Beams reinforced with two No. 9 bars No AxiSl 11000
A-1I 2 0 s 28·3 46 .. 5 465 24.4 4100 A-12 3 0 m 26.5 26 .. 5 391 20·7 3810 A-13 4 0 Dr 2101 2101 422 26.6 3210 A-14 5 0 Dr 24 .. 6 -, ,.-
2LtoO 615 30.2 -Zr\rtr\
:J"7"7V
A-15 6 0 Dr 22.2 22.2 666 41.6 3630
Axial Load = 20 kips B-ll, 2 20 s 3708 64.5 645 31.4 3660 B-12 3 20 s 29·6 33·7 505 19·1 3930 B-13 4 20 s 2605 2708 556 3005 4050 B-14 5 20 :or 23.8 23.8 595 2600 4250 B-15 6 20 ill 21.1 21 .. 1 630 39·5 4110
'* .8 - Shear-Compression Failure DT - Diagonal Tension Failure F - Flexural Failure
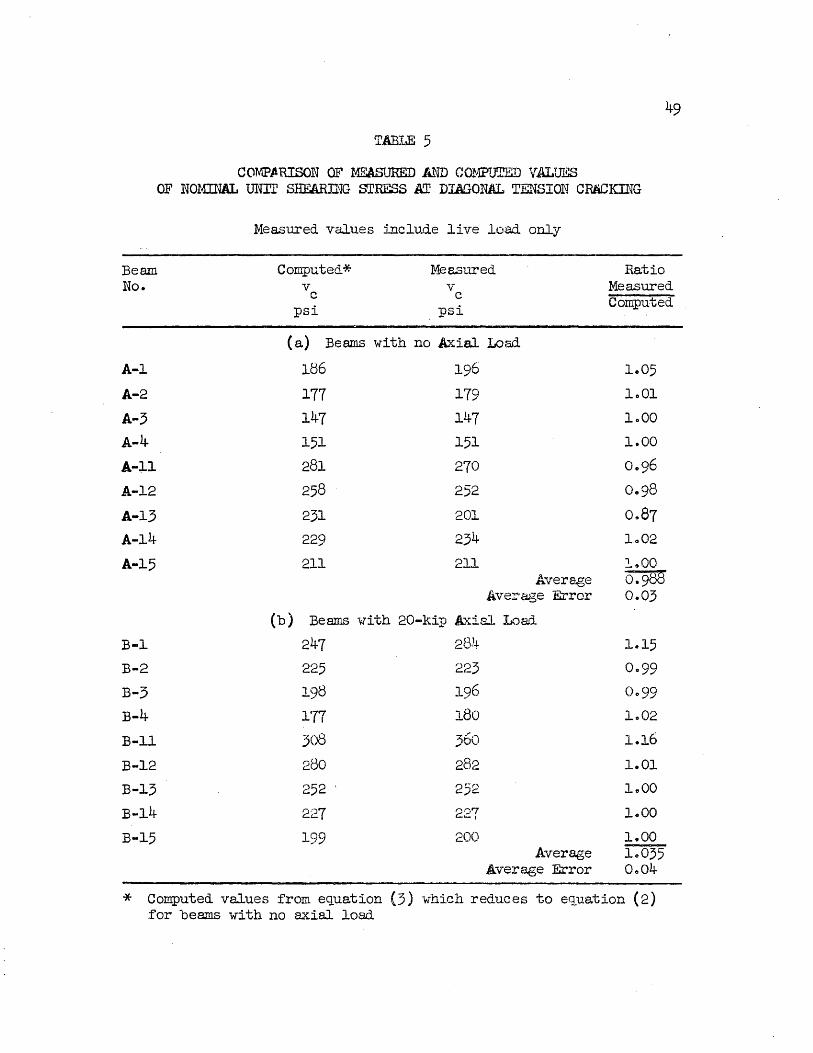
TABLE 5
COMPftRISON OF ME:ASURED AND COMPUTED VALUES OF NOMINAL UNIT SID!.ARING srRESS AT DIAGONAL TENSION CRliCKING
Beam No.
A-I
A-2
A-3
A-4 A-Il.
A-12
A-13 A-14
A-15
B-l B-2
B-3 B-4 B-11
B-12
B-13
B-14
B-15
Measured values include live load only
Computed* v
Me as1..1red v c c
psi . psi
(a) Beams with no AxiaJ. Load
186 196
177 179
147 147
151 151
281 270
258 252
231 201
229 234
211 211 Avere.ge
Aver age Error
(b) Beams with 20-kip Axial Load
247 284
225 223
198 196
1'77 180
308 360 280 282
252 ' 252
227 227
199 200 Average
Average Error
Ratio Measured Computed
1.05
1001
1000
1.00
0·96
0098
0 .. 87
1.,02
:!.,.,OO O.98a 0.03
1.15
0099
0099
1002
1.16
1001
1000
1000
1000 10035 0004
* Computed values from equation (3) which reduces to equation (2) for beams with no axial load

50
TABLE 6
COMPurED STEEL srRESSES FOR SHEAR-COMPRESSION FAILURES
Beam V a kd h kd k f f .Y N(- - Y - ~) A f d(l 2U) s s
No. U u in-kips *
J.D. 2 2 s s , ~ompo" rneas. ** ksi ksi
in. in-kips in-kips (1) (2) (3) \(1;) (5) (6) (7) (8)
A-l 330 0·75 0 330 57·0 B-1 514 1·7 0.25 98 416 75·5
A-2 282 1.1 0 282 49·7 B-2 442 1·3 0·37 100 342 60.8
A-3 308 0.8 0 308 53.4
B-3 436 2.2 0·33 91 345 64·5
A-ll 465 1.1 0 465 24·5 24.4
B-ll 645 2·7 0.25 88 557 32.2 3104
A-12 397 1·3 0 397 21.2 20·7 " B-12 505 3.4 0.22 82 423 25 .. 4 19·7
A-13 422 1.2 0 422 22·5 26.6
B-13 556 2·5 0·56 84 472 27·0 30."5
* k d = measured value from Table 3 u
** k :: 0.50 2

Beam No.
A-5
B-5
y
in.
1.0
51
TABLE 7
COMPARISON OF MEASURED AND COMPt1l'ED VALUES OF ULTIMATE IDMENr FOR FLEXURAL FAILURES
e s
in./in.
.0143
.0094
f * s ksi
86.0
77·3
C
kips
51·7
66.4
Mf
in. -kips Comp.
M Ratio • ~ . Me asured lnMe" - ~ps Computed
as.
441
453
* Since the steel was in the strain-hardening range, the, stressstrain curve was used to determine the steel stress.
where:
~~ = ,1500 + f~
e = 0.004 in./in. u
A = 0.60 in.2
s
b = 6 in.
d = 10 in.
h = 12 in.

52
TABLE 8
COMPARISON WITH TEST RESULTS FOR BEAMS . OF REFERENCE (4)
Beam aid f' M K No. e u
* psi in-kips
L-l 2 3050 444 1.152
L-2 3 3120 459 1.124 I
L-2a 3 5320 540 0·915
L-3 4 4060 480 00985
L-4 5 3740 575 1.029
L-5 6 .4050 690 0.987
L-6 7 4440 735
A-l1 2 4100 465 00987
A-12 3 3870 397 10018
A-13 4 3210 422 10124
A-14 5 3990 615 1.002
A-15 6 3630 666 1.056
M (f' = 4000 psi)
* s e
K = M (Actual f') s e
Note: Beam--L-1 through-· L-6 from Table~ 5, RefD .4.
KM Mode u of in-kips Faill1.re
511 ,8
516 S
494 8
473 ill
592 ill
681 JJ:r
F
459 8
404 1JI'
474 lll'
616 Dr
703 ill
~e~z Be~eren.Q Booa un1v~ty o~ Ill1nola
1106- HeEL 208 N. !oaine Street
~;~11inois 6180n

6"
External. stirrup Leather Strip
tI 6" II
=0::= == o=-= = =0= = =-=0==1==0= = = =0==
steel Plate 611 x 6" x 2"
a 1211
L
steel Plate 12" x 6" x 2" Plaster of Paris
\.0
~ Gage Holes
=cr===-=,@ 6" coc - - -=o==-=--= --0---==0=
a 6"
FIG. 1 DIMENSIONS OF TEST BEAMS
C\J r-l
II .Q
o rl
II
rd
L-J 000
lofb = 6~

Pressure Gage ~""'_J ~
Reaction Beam
Reaction Columns Anchored to Floor
Valve To Pump
t.
To Manifold
Oil Pump
Manifold
Support Angles
Jacks
Test Beam
Support Angle
Concrete bupport Block
FID. 2 TYPICAL TE5'T SErUP
r--
'---
+
~
-=
o Test BealL
I
1--------41 10 Concrete Support
Block
~
r---
L...---"'

Tensi on Rods - ,....- y
::: ::: : :: ::: il! [t ~
r--~
I--~
!:InIIf_ " '--
Jack l Leathe r Pad Nuts.
TOP VIEW
To G Bf!':9 rHa1f Round Bearing Plate
Pump
=cri::11 ..-- A ,-n, r--
I tJ:n:o:x ~ tt
I-- TEST " - -- I -- I - f---- f- -I-- ~ [\.... l../
:a:a[ SPECIMEN
tJ:a:rn ~ L--
L;)C D r r~ l-
SIDE VIEW
FIG. 3 AXIAL LOADING EQUIPMENT

FIG. 4 PHOTOGRAPHS OF AXIAL LOADING EQUIPMENT

U)
PI
50
40
Q 30 .~
~ o H
ut . -jJ 20 o 8
10
()
o
/
/ /
/
0.1
,../ I
I
I I
/
,/
O r) .l-
B-1 Pu = 51~1~ kips
y = o. ~5 inches
..... / --I
_ ..... \ \
\
No Axial Load ------------- Axial Load = 20 kips
______ 1-- _12=-5...
A-5
0.3 0.4 0.5 0.6 0·7 0.8 Midspan Deflection in Inches
FIG. 5 LOAD-DEFUI!TION CURVES FOR BEAMS WITH THREE NO. 4 BARS

U)
~ 'rl
50
40
~ 30 .~
al o H
~ +> 20 o 8
10
o o
I I
I
I B-11 I
I P I u
y
"'" "'" "'" ",'" /\1 ... \,/ 'f
,1 A-12
0.1 0.2
64.5 kips
0.25 in.
----- No Ax. ial Load
----------- Axial Load = 20 kips
B ... 13
0.3 0.4 0·5 Midspan Deflection in Inches
B-15 -----, \
0.6
\ \ \
0·1
FIG. 6 LOAD-DEFLEX!TION CURVES FOR ~ WITH TW NO. 9 BARS
0.8

,.q
~ Q)
~ & 'J)
H Q)
~
Ul
~ .~ Ul Ul Q)
H
M r-1 Q) Q)
M
30
20
10
o
'~
P =j 64.5 kips u
59.4 kips
51.3 kips
39.4 kips
.....-- 7' "'..... I 34.6 kips
31.0 kips
f-- =::::+:::::::~ I p = 0
o 0
~ East
o ~O .... :-.. o
512"
Note
Cracking Load = 37.8 kips N = 20 kips
Fig. 7 grEEr.. SI'RESS DISTRISu.rION FOR SHEAR COMPRESSION FAILURE. BEAM B-ll
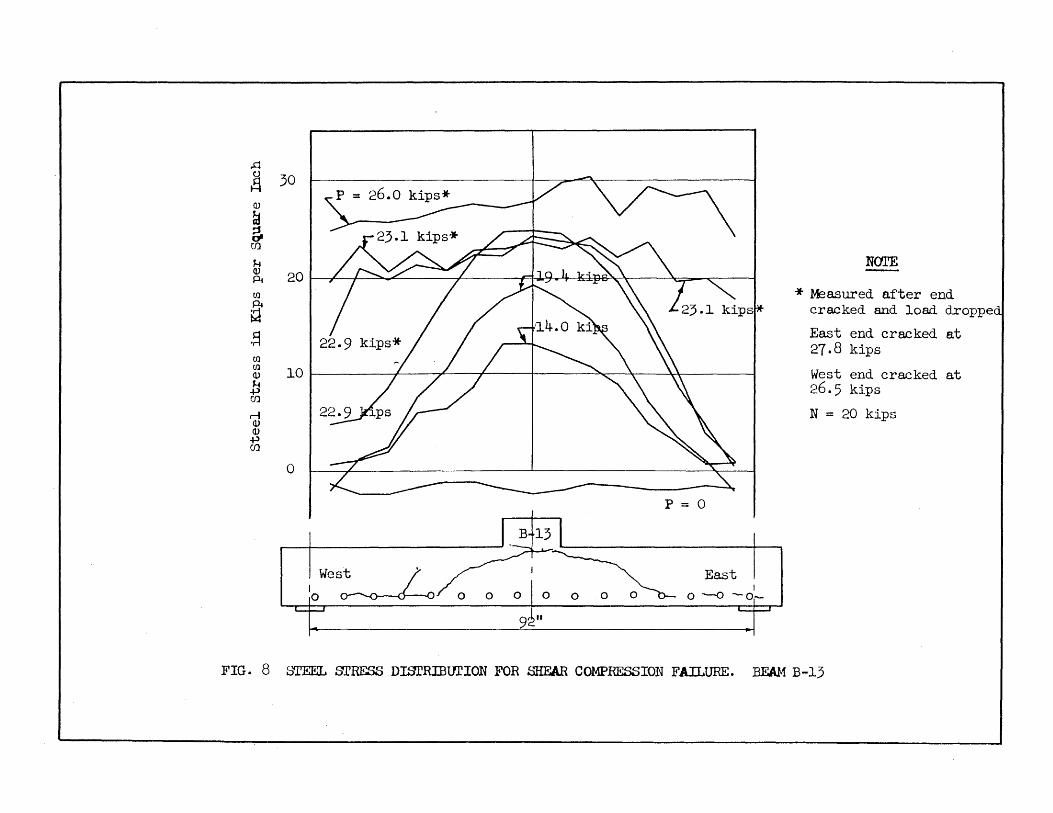
~
~ 30
Q)
~ 6a U)
J.i /"" ~A-" ,,~ \ N<JrE OJ 20 ~
CIl / 123.1~p * ~asured after end ~ cracked and load droppe ~ .~ East end cracked at
22.9 kips* 21.8 kips CIl CIl 10 West end cracked at OJ H 26.5 kips ..p
r:n rl N = 20 kips Q) Q)
..p CJ)
0
P = 0
East IO~ IOwes~ o 0
It
FIG. 8 &'TEEL srRESS DISl'RIBlJrION FOR SHEAR COMPRESSION FAILURE. BEAM B-13
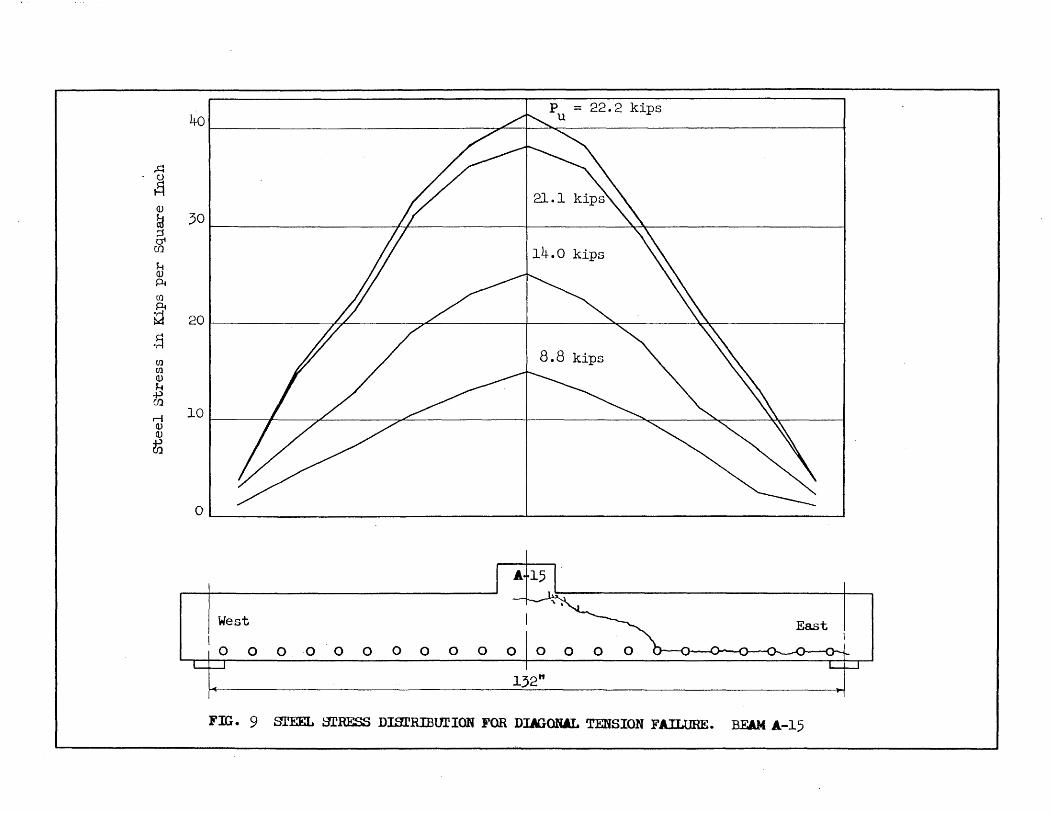
40' 22.2 kips
~
~ <lJ
~ 30 ;:f crt
Cf) II 114.0 kips H <lJ ~
(/)
Pt ~ 20
.~ (/) (/)
<lJ H .p CIl
r-i 10 <lJ <lJ
~
O~I ________________________________ ~ ______________________________ ~
West . I
o 0 000 0 o 0 0 0
132"
FIG. 9 Sl'EEL srRESS DImRIBurION FOR DDGOlW.. TENSION FAILURE. BEAM A-15

(a) P = 22.0 kips
(b) P = 29.6 kips
(c) P = 33.7 kips u (after failure)
FIG. 10 CRACK DEVELOPMENT FOR SHEAR-COMPRESSION FAILURE. BEAM B-12

(a) P = 14.0 kips
(bj P = 22.9 kips
(c) P = 24.6 kips u
(after failure)
FIG. 11 CRACK DEVELOPMENT FOR DIAGONAL TENSION FAILURE. BEAM A-14

(a) Beam A-5 without axial load.
(b) Beam B- 5 with axial load.
p = 14. 7 kips. u
p = 15.1 kips. u
FIG. 12 EFFECT OF AXIAL LOAD ON CRACKING PATTERN FOR FLEXURAL FAILURE

(a) Beam A-ll without axial load.
(b) Beam B-ll with axial load.
p = 46.5 kips. u
p = 64.5 kips. u
FIG. 13 EFFECT OF AXIAL LOAD ON SHEAR-COMPHESSION FAILURE

(a) Beam A-13 without axial load.
(b) Beam B-13 with axial load.
P = 21.1 kips. u
P = 27.8 kips. u
FIG. 14 EFFECT OF AXIAL LOAD ON MODE OF FAILURE

~ ~
r=t
I g E-t
27·5 Failure
25 ------- DT Cracking Without Failure
V V Flex. c u
No Axial. Load. x 0 • Axial Load = 20 kips + c •
20
15
10
®
5
o o 1 2 3 4 5 6 7
aid
FIG. 15 ~T OF aid ON CRACKING AND ULTIMATE SHEliR CAPACITY FOR BEAMS WITH THREE NO. 4 BARS

50
ltD
CJ)
~ 30
f:i
I ~ E-I
20
10
o
f
\
1\ l~'
o 1 2
Failure
------ DT Cracking Without Failure V V
c u No Axial Load x 0
Axial Load = 20 kips + 0
------ ----- b-® ---;;
--------_ .. __ ._-- '----
3 4 5 6 7
aid
FIG. 16 EFFECT OF aid ON CRACICrnG AND ULTIMATE SHEAR CAPACITY FOR BEAMS WITH TWO NO. 9 BARS
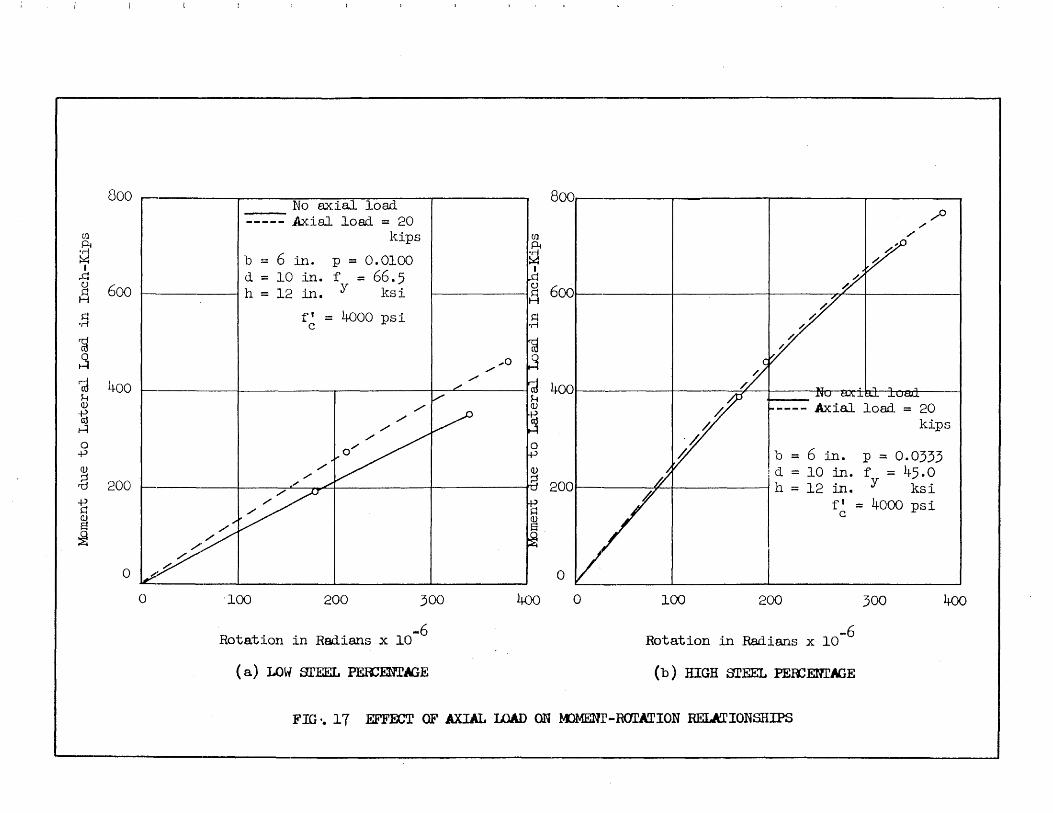
(f)
Pl
~ I
,.q ()
R ~
.r!
~
800 r-
600 l-
No axial load. ----- .Axial load = 20
kips
b ;:;; 6 in. P = 0.0100 d = 10 in. f = 66.5
I h = 12 in.;/ ks i
f' = 4000 psi c
S r
~ 400 IH Q)
iii H a
-j-l
Q)
r8 200
~ CJ S ~
o
./ ./
/' ~~ ..
~:y
./ ./
./
o -100 200 300
Rotation in Radians x 10-6
(a) LOW' srEEL ~E
... 0 ./
800 ",0
,/
U) ,/
Pf , Q h
~
~ _~ 600
400
4001--- 0' l'a-, j A) i hl 1 i ,A,' 20 kips
b = 6 in. p;:;; 0.0333 'd ;:;; 10 in. f ;:;; 45.0
200J-- H~I I h ;:;; 12 in. Y ksi
o o 100 200
fl = 4000 psi c
300
Rotation in Radians x 10-6
(b) HIGH Sl'EEL ~mrAGE
400
FIG '. 17 ~ OF AXIAL LOAD ON KlMENr-R<Jl'ATION RELATIONSHIPS

50
-
40
-0
:: § :0 rl .. of • 30 ~ 0
+ rl
t<\
( ~ L~'~
j23+2a/d ~.~;
~L-------~J----
(.)
, L~ 0 Beams this report ~~
_________ .6 Be ems Ref. (4) Series L . ...::t
~Q 20 ,t>
0 C\.I rl
f'1 120 P + 4. 3 ___ c ___ ~
Vc = 23 + 2 aId · 1 + 0.85 f~ 1000
10
a 2) + ') u a
aid 5 1
FIG. 18 DIAGONAL TENSION CRACKING wrrnour AXIAL LOAD
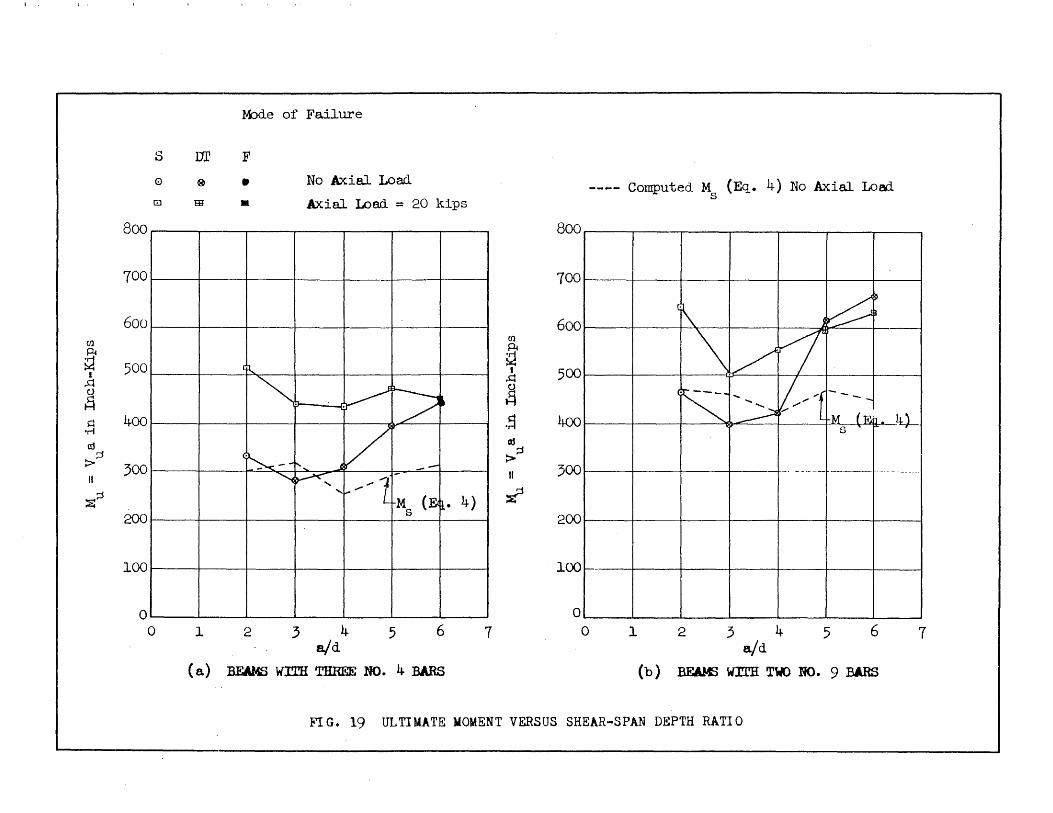
(J)
.~ ~
I ..Q
~ ~
-r-I
m ::1
:>
" ~~
s <:)
[;]
800
700
600
500
400
300
200
100
o o
l-bde of Failure
ill F
Q • No Axial Load
HI • Axial Load = 20 kips
(A..
~ / !l--.. ~. ~~ /
(.~ - --1-- ... ~/ --~ ~ '- ... -'1 -M (~ a. 4) s
1 2 3 4 5 6 aid
( a) BF.NfS WITH THREE NO. 4 BARS
(J)
~ I
.G
~ .~ as >~ II
-:?
7
800
700
600
500
400
300
200
100
o o
---- Computed M (Eq. 4) No Axial Loai s
1 2 3 4 5 6 aid
(b) BEAf.f3 WITH T\«) NO. 9 BARS
FIG. 19 ULTIMATE )laMENT VERSUS SHEAR-SPAN DEPTH RATIO
7
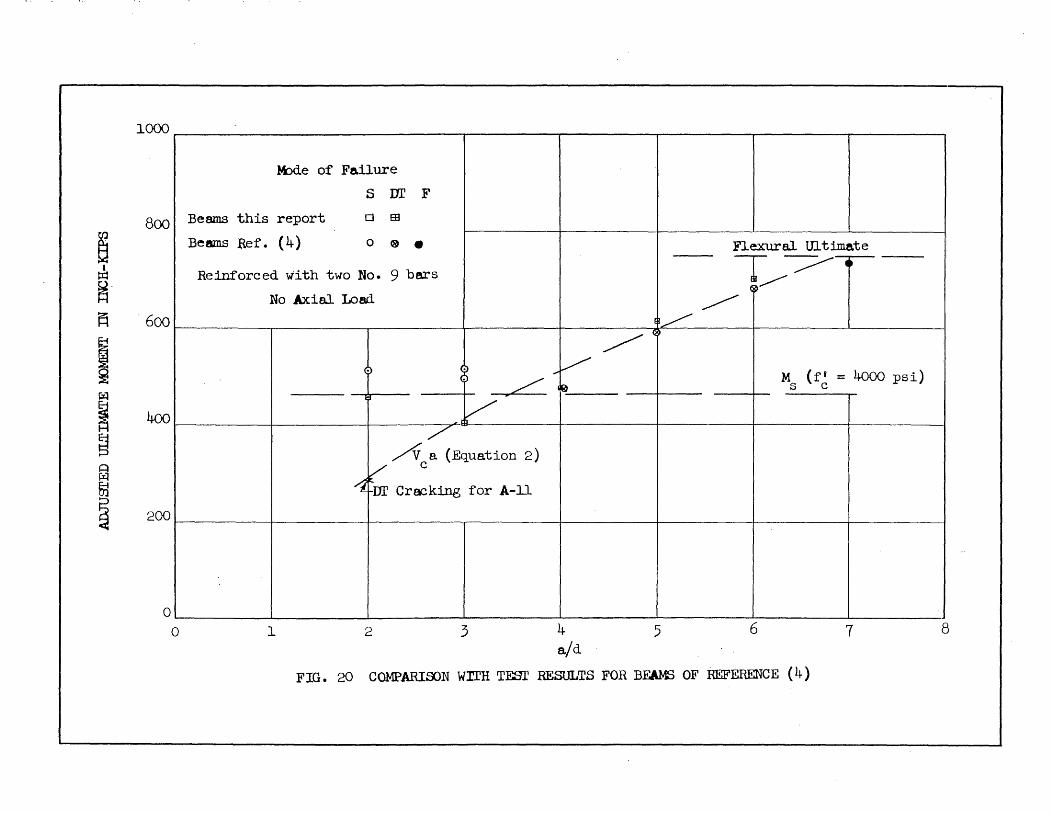
~ I ~
~-
~
I I ~ Q t:£I ttl
~
l~~----------------------r-------r-------'-------'-------~----~
ltbie of Failure
S Dr F
800 I Beams this report Cl En
~ Flexural Ultimat
600 I T -----.-= ~~
V--~ I
Beams Ref. (4) o ® •
Reinforced with two No. 9 bars
No Axial Load
g _L1 I
4001 1 /,v
/v a. (Equat ion 2)
~ Cr~k1ng for A-ll
M (r l = 4000 psi) s c
2°011-----j------i-----~------~----~----~~----J-----~
o 1 2 3 5 6 7 8


