
No.5-22, Ruei-Shu Valley, Ruei-Ping Tsuen Lin Kou Shiang, Taipei 244 Taiwan, R.O.C. TEL:+886-2-8601-3788 FAX:+886-2-8601-3789 Email:[email protected] http://www.quietek.com
CERTIFICATE
Issued Date: Sep. 30, 2009 Report No. : 099053R-ITCEP07V06
This is to certify that the following designated product
Product : Notebook
Trade name : MSI
Model Number : MS-1241, MS-1243, U210, U230
Company Name : MICRO-STAR INT’L Co., LTD.
This product, which has been issued the test report listed as above in QuieTek
Laboratory, is based on a single evaluation of one sample and confirmed to
comply with the requirements of the following EMC standard.
EN 55022:2006+A1: 2007, Class B EN 55024: 1998+A1: 2001+A2: 2003
EN 61000-3-2:2006 IEC 61000-4-2 Edition 1.2: 2001-04
EN 61000-3-3:1995+A1: 2001+A2: 2005 IEC 61000-4-3 Edition 3.0: 2006
IEC 61000-4-4: 2004
IEC 61000-4-5 Edition 2.0: 2005
IEC 61000-4-6 Edition 2.2: 2006
IEC 61000-4-8 Edition 1.1: 2001-03
IEC 61000-4-11 Second Edition: 2004-03
TEST LABORATORY
Vincent Lin / Manager

Appendix Report
Product Name : Notebook
Model No. : MS-1241, MS-1243, U210, U230
Applicant : MICRO-STAR INT’L Co., LTD.
Address : No. 69, Li-De St., Jung-He City, Taipei Hsien, Taiwan, R.O.C.
Date of Receipt : 2009/08/28
Issued Date : 2009/09/30
Report No. : 099053R-ITCEP07V06
Report Version : V1.0
The test results relate only to the samples tested.
The test results shown in the test report are traceable to the national/international standard through the calibration of the equipment and evaluated measurement uncertainty herein.
This report must not be used to claim product endorsement by TAF, NVLAP or any agency of the Government.
The test report shall not be reproduced except in full without the written approval of QuieTek Corporation.

Declaration of Conformity We herewith confirm the following designated products to comply with the requirements set out in the Council Directive on the approximation of the laws of the Member States relating to Electromagnetic Compatibility Directive (2004/108/EC) with applicable standards listed below.
Product : Notebook
Trade name : MSI
Model Number : MS-1241, MS-1243, U210, U230
EN 55022: 2006+A1: 2007 Class B
EN 55024: 1998+A1: 2001+A2: 2003
EN 61000-3-2:2006
EN 61000-3-3:1995+A1: 2001+A2: 2005
Applicable Harmonized
Standards under Directive
2004/108/EC
:
Company Name :
Company Address :
Telephone : Facsimile :
Person in responsible for marking this declaration:
Name (Full Name) Title/ Department
Date Legal Signature

QuieTek Corporation / No.75-1, Wang-Yeh Valley, Yung-Hsing, Chiung-Lin, Hsin-Chu County, Taiwan, R.O.C. Tel: 886-3-592-8858, Fax: 886-3-592-8859, E-mail: [email protected]
Date: Sep. 30, 2009
QTK No.: 099053R-ITCEP07V06
Statement o f Conformi ty
This statement is to certify that the designated product below.
Product : Notebook
Trade name : MSI
Model Number : MS-1241, MS-1243, U210, U230
Company Name : MICRO-STAR INT’L Co., LTD.
EN 55022: 2006+A1: 2007 Class B
EN 55024: 1998+A1: 2001+A2: 2003
EN 61000-3-2:2006
EN 61000-3-3:1995+A1: 2001+A2: 2005
Applicable Standards :
One sample of the designated product has been tested and evaluated in our
laboratory to find in compliance with the applicable standards above. The issued
test report(s) show(s) it in detail.
Report Number : 099053R-ITCEP07V06
TEST LABORATORY
Vincent Lin / Manager
The verification is based on a single evaluation of one sample of above-mentioned products. It does not imply an assessment of the whole production and does not permit the use of the test lab. Logo.
Accredited by NVLAP, TAF-CNLA, DNV, TUV, Nemko

Report No:099053R-ITCEP07V06
Page: 2 of 123
Test Report Cert i f icat ion Issued Date : 2009/09/30 Report No. : 099053R-ITCEP07V06
Product Name : Notebook
Applicant : MICRO-STAR INT’L Co., LTD.
Address : No. 69, Li-De St., Jung-He City, Taipei Hsien, Taiwan, R.O.C.
Manufacturer : MICRO-STAR INT’L Co., LTD.
Model No. : MS-1241, MS-1243, U210, U230
EUT Rated Voltage : AC 100-240V, 50-60Hz
EUT Test Voltage : AC 230 V / 50 Hz
Trade Name : MSI
Applicable Standard : EN 55022: 2006+A1: 2007, Class B
EN 55024: 1998+A1: 2001+A2: 2003
EN 61000-3-2:2006
EN 61000-3-3:1995+A1:2001+A2: 2005
Test Result : Complied
Performed Location : Quietek Corporation (Linkou Laboratory)
No.5-22,Ruei-Shu Valley, Ruei-Ping Tsuen Lin Kuo Shiang,
Taipei, 244 Taiwan, R.O.C.
TEL:+866-2-8601-3788 / FAX:+886-2-8601-3789
Documented By :
( Senior Adm. Specialist / Genie Chang )
Reviewed By :
( Engineer / Jerry Chen )
Approved By :
( Manager / Vincent Lin )

Report No:099053R-ITCEP07V06
Page: 3 of 123
Laboratory Information We , QuieTek Corporation, are an independent EMC and safety consultancy that was established the whole facility in our laboratories. The test facility has been accredited/accepted (audited or listed) by the following related bodies in compliance with ISO 17025, EN 45001 and specified testing scopes:
The related certificate for our laboratories about the test site and management system can be downloaded from QuieTek Corporation’s Web Site :http://tw.quietek.com/modules/enterprise/services.php?item=100 The address and introduction of QuieTek Corporation’s laboratories can be founded in our Web site : http://www.quietek.com/ If you have any comments, Please don’t hesitate to contact us. Our contact information is as below: HsinChu Testing Laboratory :
No.75-2, 3rd Lin, Wangye Keng, Yonghxing Tsuen, Qionglin Shiang, Hsinchu County 307, Taiwan, R.O.C.TEL:+886-3-592-8858 / FAX:+886-3-592-8859 E-Mail : [email protected]
LinKou Testing Laboratory :
No. 5-22, Ruei-Shu Valley, Ruei-Ping Tsuen, Lin-Kou Shiang, Taipei, Taiwan, R.O.C. TEL : 886-2-8601-3788 / FAX : 886-2-8601-3789 E-Mail : [email protected]
Suzhou (China) Testing Laboratory :
No. 99 Hongye Rd., Suzhou Industrial Park Loufeng Hi-Tech Development Zone., Suzhou,China. TEL : +86-512-6251-5088 / FAX : +86-512-6251-5098 E-Mail : [email protected]
Taiwan R.O.C. : BSMI, NCC, TAF
Germany : TUV Rheinland
Norway : Nemko, DNV
USA : FCC, NVLAP
Japan : VCCI

Report No:099053R-ITCEP07V06
Page: 4 of 123
TABLE OF CONTENTS Description Page 1. General Information .................................................................................................... 7
1.1. EUT Description ...................................................................................................... 7
1.2. Mode of Operation .................................................................................................. 8
1.3. Tested System Details............................................................................................. 9
1.4. Configuration of Tested System ............................................................................ 10
1.5. EUT Exercise Software ......................................................................................... 11
2. Technical Test ........................................................................................................... 12
2.1. Summary of Test Result ........................................................................................ 12
2.2. List of Test Equipment ........................................................................................... 13
2.3. Measurement Uncertainty ..................................................................................... 16
2.4. Test Environment .................................................................................................. 18
3. Conducted Emission (Main Terminals)...................................................................... 19
3.1. Test Specification .................................................................................................. 19
3.2. Test Setup ............................................................................................................. 19
3.3. Limit....................................................................................................................... 19
3.4. Test Procedure ...................................................................................................... 20
3.5. Deviation from Test Standard ................................................................................ 20
3.6. Test Result ............................................................................................................ 21
3.7. Test Photograph .................................................................................................... 33
4. Conducted Emissions (Telecommunication Ports).................................................... 35
4.1. Test Specification .................................................................................................. 35
4.2. Test Setup ............................................................................................................. 35
4.3. Limit....................................................................................................................... 35
4.4. Test Procedure ...................................................................................................... 36
4.5. Deviation from Test Standard ................................................................................ 36
4.6. Test Result ............................................................................................................ 37
4.7. Test Photograph .................................................................................................... 55
5. Radiated Emission.................................................................................................... 57
5.1. Test Specification .................................................................................................. 57
5.2. Test Setup ............................................................................................................. 57
5.3. Limit....................................................................................................................... 58
5.4. Test Procedure ...................................................................................................... 59
5.5. Deviation from Test Standard ................................................................................ 59
5.6. Test Result ............................................................................................................ 60
5.7. Test Photograph .................................................................................................... 68
6. Harmonic Current Emission ...................................................................................... 71

Report No:099053R-ITCEP07V06
Page: 5 of 123
6.1. Test Specification .................................................................................................. 71
6.2. Test Setup ............................................................................................................. 71
6.3. Limit....................................................................................................................... 71
6.4. Test Procedure ...................................................................................................... 73
6.5. Deviation from Test Standard ................................................................................ 73
6.6. Test Result ............................................................................................................ 74
6.7. Test Photograph .................................................................................................... 78
7. Voltage Fluctuation and Flicker................................................................................. 79
7.1. Test Specification .................................................................................................. 79
7.2. Test Setup ............................................................................................................. 79
7.3. Limit....................................................................................................................... 79
7.4. Test Procedure ...................................................................................................... 80
7.5. Deviation from Test Standard ................................................................................ 80
7.6. Test Result ............................................................................................................ 81
7.7. Test Photograph .................................................................................................... 83
8. Electrostatic Discharge ............................................................................................. 84
8.1. Test Specification .................................................................................................. 84
8.2. Test Setup ............................................................................................................. 84
8.3. Limit....................................................................................................................... 84
8.4. Test Procedure ...................................................................................................... 85
8.5. Deviation from Test Standard ................................................................................ 85
8.6. Test Result ............................................................................................................ 86
8.7. Test Photograph .................................................................................................... 88
9. Radiated Susceptibility ............................................................................................. 89
9.1. Test Specification .................................................................................................. 89
9.2. Test Setup ............................................................................................................. 89
9.3. Limit....................................................................................................................... 89
9.4. Test Procedure ...................................................................................................... 90
9.5. Deviation from Test Standard ................................................................................ 90
9.6. Test Result ............................................................................................................ 91
9.7. Test Photograph .................................................................................................... 93
10. Electrical Fast Transient/Burst............................................................................... 94
10.1. Test Specification............................................................................................... 94
10.2. Test Setup.......................................................................................................... 94
10.3. Limit ................................................................................................................... 94
10.4. Test Procedure .................................................................................................. 95
10.5. Deviation from Test Standard............................................................................. 95
10.6. Test Result ......................................................................................................... 96

Report No:099053R-ITCEP07V06
Page: 6 of 123
10.7. Test Photograph ................................................................................................ 98
11. Surge................................................................................................................... 100
11.1. Test Specification............................................................................................. 100
11.2. Test Setup........................................................................................................ 100
11.3. Limit ................................................................................................................. 100
11.4. Test Procedure ................................................................................................ 101
11.5. Deviation from Test Standard........................................................................... 101
11.6. Test Result ....................................................................................................... 102
11.7. Test Photograph .............................................................................................. 104
12. Conducted Susceptibility ..................................................................................... 105
12.1. Test Specification............................................................................................. 105
12.2. Test Setup........................................................................................................ 105
12.3. Limit ................................................................................................................. 106
12.4. Test Procedure ................................................................................................ 106
12.5. Deviation from Test Standard........................................................................... 106
12.6. Test Result ....................................................................................................... 107
12.7. Test Photograph .............................................................................................. 109
13. Power Frequency Magnetic Field.........................................................................111
13.1. Test Specification..............................................................................................111
13.2. Test Setup.........................................................................................................111
13.3. Limit ..................................................................................................................111
13.4. Test Procedure .................................................................................................111
13.5. Deviation from Test Standard............................................................................111
13.6. Test Result ....................................................................................................... 112
13.7. Test Photograph .............................................................................................. 114
14. Voltage Dips and Interruption .............................................................................. 115
14.1. Test Specification............................................................................................. 115
14.2. Test Setup........................................................................................................ 115
14.3. Limit ................................................................................................................. 115
14.4. Test Procedure ................................................................................................ 116
14.5. Deviation from Test Standard........................................................................... 116
14.6. Test Result ....................................................................................................... 117
14.7. Test Photograph .............................................................................................. 119
15. Attachment .......................................................................................................... 120
EUT Photograph.................................................................................................. 120

Report No:099053R-ITCEP07V06
Page: 7 of 123
1. General Information
1.1. EUT Description
Product Name Notebook
Trade Name MSI
Model No. MS-1241, MS-1243, U210, U230
Keyparts List
Item Vendor Model Name
AMD Congo L625 1.6GHz, BGA-812pin CPU
AMD Congo L335 1.6GHz, BGA-812pin
WLAN Atheros AR5B95 (AW-NE785H)
3G HUAWEI EM730
Note:
1. This appendix report was based on Quietek report No. 096110R-ITCEP07V06. 2. The EUT is including three models, The MS-1241, MS-1243 for MSI and U210, U230 for different
marketing requirement. 3. The different is adding Model No., CPU, WLAN and 3G.
Report No:099053R-ITCEP07V06
Page: 8 of 123
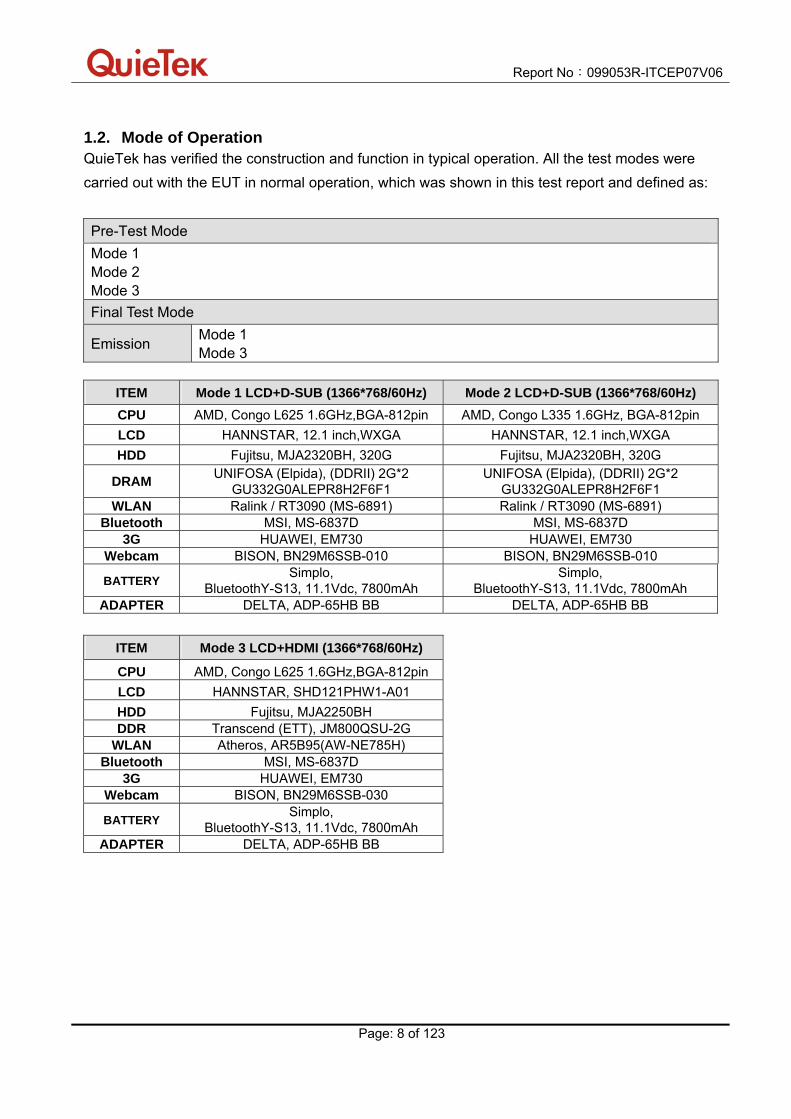
1.2. Mode of Operation QuieTek has verified the construction and function in typical operation. All the test modes were
carried out with the EUT in normal operation, which was shown in this test report and defined as:
Pre-Test Mode
Mode 1 Mode 2 Mode 3
Final Test Mode
Emission Mode 1 Mode 3
ITEM Mode 1 LCD+D-SUB (1366*768/60Hz) Mode 2 LCD+D-SUB (1366*768/60Hz)
CPU AMD, Congo L625 1.6GHz,BGA-812pin AMD, Congo L335 1.6GHz, BGA-812pin
LCD HANNSTAR, 12.1 inch,WXGA HANNSTAR, 12.1 inch,WXGA
HDD Fujitsu, MJA2320BH, 320G Fujitsu, MJA2320BH, 320G
DRAM UNIFOSA (Elpida), (DDRII) 2G*2
GU332G0ALEPR8H2F6F1 UNIFOSA (Elpida), (DDRII) 2G*2
GU332G0ALEPR8H2F6F1 WLAN Ralink / RT3090 (MS-6891) Ralink / RT3090 (MS-6891)
Bluetooth MSI, MS-6837D MSI, MS-6837D 3G HUAWEI, EM730 HUAWEI, EM730
Webcam BISON, BN29M6SSB-010 BISON, BN29M6SSB-010
BATTERY Simplo,
BluetoothY-S13, 11.1Vdc, 7800mAh Simplo,
BluetoothY-S13, 11.1Vdc, 7800mAh ADAPTER DELTA, ADP-65HB BB DELTA, ADP-65HB BB
ITEM Mode 3 LCD+HDMI (1366*768/60Hz)
CPU AMD, Congo L625 1.6GHz,BGA-812pin
LCD HANNSTAR, SHD121PHW1-A01
HDD Fujitsu, MJA2250BH DDR Transcend (ETT), JM800QSU-2G
WLAN Atheros, AR5B95(AW-NE785H) Bluetooth MSI, MS-6837D
3G HUAWEI, EM730 Webcam BISON, BN29M6SSB-030
BATTERY Simplo,
BluetoothY-S13, 11.1Vdc, 7800mAh ADAPTER DELTA, ADP-65HB BB

Report No:099053R-ITCEP07V06
Page: 9 of 123
1.3. Tested System Details The types for all equipments, plus descriptions of all cables used in the tested system (including
inserted cards) are:
Product Manufacturer Model No. Serial No. Power Cord
1 TS9980 R&S N/A N/A Non-Shielded, 1.8m 2 Notebook PC DELL PP04X 2D2ZM1S Non-Shielded, 1.8m 3 Monitor Dell 2408WFPb CN-0NN792-74261-
82S-0YDS Non-Shielded, 1.8m
4 Microphone & Earphone
PCHOME N/A N/A N/A
IPod nano (EMI) Apple A1236 7K818WQRY0P N/A 5 IPod nano (EMS) Apple A1236 7K818WQRY0P N/A
6 USB Mouse DELL MO56UOA G0Y02ERZ N/A 7 Printer EPSON StyLus C63 FAPY094255 Non-Shielded, 1.8m 8 Universal Radio
Communication tester
Rohde & Schwarz
CMU200 104846 Non-Shielded, 1.8m
Report No:099053R-ITCEP07V06
Page: 10 of 123
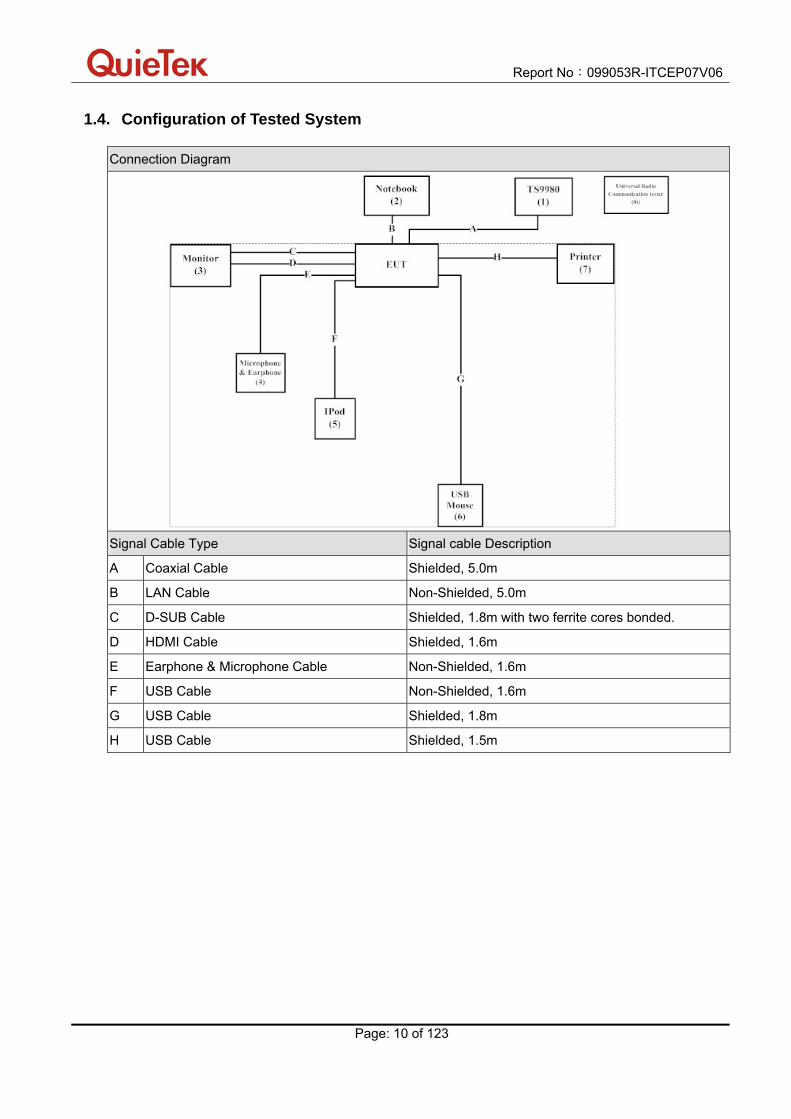
1.4. Configuration of Tested System
Connection Diagram
Signal Cable Type Signal cable Description
A Coaxial Cable Shielded, 5.0m
B LAN Cable Non-Shielded, 5.0m
C D-SUB Cable Shielded, 1.8m with two ferrite cores bonded.
D HDMI Cable Shielded, 1.6m
E Earphone & Microphone Cable Non-Shielded, 1.6m
F USB Cable Non-Shielded, 1.6m
G USB Cable Shielded, 1.8m
H USB Cable Shielded, 1.5m

Report No:099053R-ITCEP07V06
Page: 11 of 123
1.5. EUT Exercise Software
1 Setup the EUT and peripheral as shown on Figure.
2 Connect the power to EUT and peripherals, then turn on the power of all equipments.
3 Waiting for EUT to enter Window Windows XP Operating System, and adjust the display Resolution to the test mode.
4 Connect LAN and to Notebook PC for transmitting data.
5 Activate Wireless interface and Bluetooth function, and perform the wireless data Communication with the other Notebook (write/delete action).
6 Run Windows Media Player program and play a disk with color Bar pattern.
7 Carry out the function of the EUT cell-phone and platform of simulation base of cell-phone and do the line.
8 Run “H" pattern.
9 Begin to test and repeat the above procedure (4)~(7).
Report No:099053R-ITCEP07V06
Page: 12 of 123
2. Technical Test
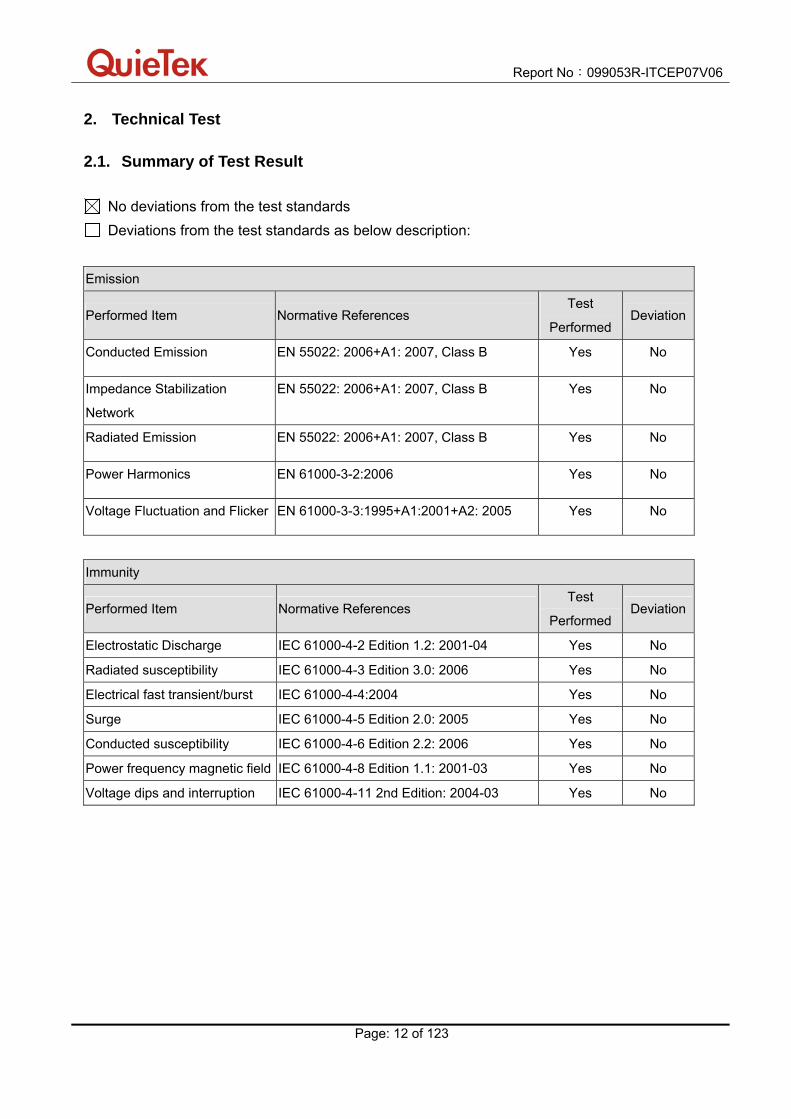
2.1. Summary of Test Result
No deviations from the test standards
Deviations from the test standards as below description:
Emission
Performed Item Normative References Test
Performed Deviation
Conducted Emission EN 55022: 2006+A1: 2007, Class B Yes No
Impedance Stabilization
Network
EN 55022: 2006+A1: 2007, Class B Yes No
Radiated Emission EN 55022: 2006+A1: 2007, Class B Yes No
Power Harmonics EN 61000-3-2:2006 Yes No
Voltage Fluctuation and Flicker EN 61000-3-3:1995+A1:2001+A2: 2005 Yes No
Immunity
Performed Item Normative References Test
Performed Deviation
Electrostatic Discharge IEC 61000-4-2 Edition 1.2: 2001-04 Yes No
Radiated susceptibility IEC 61000-4-3 Edition 3.0: 2006 Yes No
Electrical fast transient/burst IEC 61000-4-4:2004 Yes No
Surge IEC 61000-4-5 Edition 2.0: 2005 Yes No
Conducted susceptibility IEC 61000-4-6 Edition 2.2: 2006 Yes No
Power frequency magnetic field IEC 61000-4-8 Edition 1.1: 2001-03 Yes No
Voltage dips and interruption IEC 61000-4-11 2nd Edition: 2004-03 Yes No

Report No:099053R-ITCEP07V06
Page: 13 of 123
2.2. List of Test Equipment Conducted Emission / SR1 Instrument Manufacturer Type No. Serial No Cal. Date EMI Test Receiver R&S ESCS 30 100366 2008/10/20 LISN R&S ENV4200 833209/007 2009/08/14 LISN R&S ENV216 100085 2009/02/17 Pulse Limiter R&S ESH3-Z2 357.88.10.52 2009/09/09
Impedance Stabilization Network / SR1 Instrument Manufacturer Type No. Serial No Cal. Date Capacitive Voltage Probe Schaffner CVP2200A 18331 2008/11/14 EMI Test Receiver R&S ESCS 30 100366 2008/10/20 LISN R&S ENV216 100085 2009/02/17 LISN R&S ENV4200 833209/007 2009/08/14 lmpedance Stabilization Network
Schaffner ISN T400 19099 2009/09/19
Pulse Limiter R&S ESH3-Z2 357.88.10.52 2009/09/09 RF Current Probe FCC F-65 10KHz~1GHz 198 2008/11/14 BALANCED TELECOM ISN FCC FCC-TLISN-T2-02 20316 2008/11/18 BALANCED TELECOM ISN FCC FCC-TLISN-T4-02 20317 2008/11/18 BALANCED TELECOM ISN FCC FCC-TLISN-T8-02 20319 2008/11/18
Radiated Emission / Site1 Instrument Manufacturer Type No. Serial No Cal. Date Bilog Antenna Schaffner Chase CBL6112B 2918 2009/09/25 Broadband Horn Antenna Schwarzbeck BBHA9170 208 2009/07/25 EMI Test Receiver R&S ESCS 30 100122 2009/02/03 Horn Antenna Schwarzbeck BBHA9120D 305 2009/08/10 Pre-Amplifier QTK N/A N/A 2009/01/03 Spectrum Analyzer Advantest R3162 100803470 2008/11/10
Radiated Emission / 9x6x6_Chamber Instrument Manufacturer Type No. Serial No Cal. Date Spectrum Analyzer (9K-26.5GHz)
Agilent E4408B MY45102743 2009/08/12
Horn Antenna Schwarzbeck 9120D 576 2008/10/21 Pre-Amplifier QuieTek AP-180C CHM/071920 2009/08/04 Power Harmonics / SR3 Instrument Manufacturer Type No. Serial No Cal. Date AC Power Source(Harmonic)
Schaffner NSG 1007 HK54148 2009/06/23
IEC1000-4-X Analyzer(Flicker)
Schaffner CCN 1000-1 X7 1887 2009/06/23
Voltage Fluctuation and Flicker / SR3 Instrument Manufacturer Type No. Serial No Cal. Date AC Power Source(Harmonic)
Schaffner NSG 1007 HK54148 2009/06/23
IEC1000-4-X Analyzer(Flicker)
Schaffner CCN 1000-1 X7 1887 2009/06/23

Report No:099053R-ITCEP07V06
Page: 14 of 123
Electrostatic Discharge / SR3 Instrument Manufacturer Type No. Serial No Cal. Date ESD simulator system TESEQ NSG 438 695 2009/01/15 Horizontal Coupling Plane(HCP)
QuieTek HCP AL50 N/A N/A
Vertical Coupling Plane(VCP)
QuieTek VCP AL50 N/A N/A
Radiated susceptibility / CB5 Instrument Manufacturer Type No. Serial No Cal. Date
AF-BOX R&S AF-BOX ACCUST
100007 N/A
Audio Analyzer R&S UPL 16 100137 2009/04/23 Bilog Antenna Schaffner Chase CBL6112B 2450 2009/01/03 Broad-Band Antenna Schwarzbeck VULB 9166 1085 2009/08/02 Biconilog Antenna EMCO 3149 00071675 2009/05/29 Directional Coupler A&R DC 6180 22735 N/A Dual Microphone Supply B&K 5935 2426784 2009/08/14 Mouth Simulator B&K 4227 2439692 2009/08/14 Power Amplifier A&R 30S1G3 309453 N/A Power Amplifier A&R 100W10000M7 A285000010 N/A Power Amplifier SCHAFFNER CBA9413B 4020 N/A Power Amplifier AR 75A250A 0325371 N/A Power Meter R&S NRVD(P.M) 100219 2009/04/05 Pre-Amplifier A&R 150A220 23067 N/A Probe Microphone B&K 4182 2278070 2009/08/14 Signal Generator R&S SML03 103330 2009/09/08
Electrical fast transient/burst / SR2 Instrument Manufacturer Type No. Serial No Cal. Date Schaffner NSG 2050 System Mainframe
Schaffner N/A N/A 2008/12/28
Surge / SR2 Instrument Manufacturer Type No. Serial No Cal. Date Schaffner NSG 2050 System Mainframe
Schaffner N/A N/A 2008/12/28
Conducted susceptibility / SR6 Instrument Manufacturer Type No. Serial No Cal. Date Schaffner NSG 2070 RF-Generator
Schaffner N/A N/A 2009/04/21

Report No:099053R-ITCEP07V06
Page: 15 of 123
Power frequency magnetic field / SR3 Instrument Manufacturer Type No. Serial No Cal. Date Induction Coil Interface Schaffner INA 2141 6002 N/A Magnetic Loop Coil Schaffner INA 702 160 N/A Triaxial ELF Magnetic Field Meter
F.B.BELL 4090 114135 2009/03/27
Voltage dips and interruption / SR2 Instrument Manufacturer Type No. Serial No Cal. Date Schaffner NSG 2050 System Mainframe
Schaffner N/A N/A 2008/12/28
Schaffner NSG 2050 System Mainframe Instrument Manufacturer Type No. Serial No Cal. Date Burst 4.8KV/16A Generator with CDN
Schaffner PNW2225 200123-098SC 2009/01/15
Damped osc. Wave 100kHz and 1MHz
Schaffner PNW2056 200124-058SC 2009/01/13
Double AC Source Variator Schaffner NSG 642A 30910014938 2009/01/20 Hybrid surge pulse 1.2/50uS
Schaffner PNW 2050 200532-514LU 2009/01/22
PQT Generator Schaffner PNW2003 200138-007SC 2009/01/20 Pulse COUPLING NETWORK
Schaffner CDN131 200124-007SC 2009/01/22
Schaffner NSG 2070 RF-Generator Instrument Manufacturer Type No. Serial No Cal. Date CDN Schaffner CAL U100A 20405 N/A CDN Schaffner TRA U150 20454 N/A CDN M016S Schaffner CAL U100A 20410 N/A CDN M016S Schaffner TRA U150 21167 N/A CDN T002 Schaffner CAL U100 20491 N/A CDN T002 Schaffner TRA U150 21169 N/A CDN T400 Schaffner CAL U100 17735 N/A CDN T400 Schaffner TRA U150 21166 N/A Coupling Decoupling Network
Schaffner CDN M016S 20823 2009/04/02
Coupling Decoupling Network
Schaffner CDN T002 19018 2009/04/02
Coupling Decoupling Network
Schaffner CDN T400 21226 2009/04/02
EM-CLAMP Schaffner KEMZ 801 21024 2009/04/02

Report No:099053R-ITCEP07V06
Page: 16 of 123
2.3. Measurement Uncertainty
Conducted Emission
The measurement uncertainty is evaluated as ± 2.26 Db.
Impedance Stabilization Network
The measurement uncertainty is evaluated as ± 2.26 dB.
Radiated Emission
The measurement uncertainty is evaluated as ± 3.19 Db.
Electrostatic Discharge
As what is concluded in the document from Note2 of clause 5.4.6.2 of ISO/IEC 17025:
1999[2], the requirements for measurement uncertainty in ESD testing are deemed to have
been satisfied, and the testing is reported in accordance with the relevant ESD standards.
The immunity test signal from the ESD system meet the required specifications in IEC
61000-4-2 through the calibration report with the calibrated uncertainty for the waveform of
voltage and timing as being 1.63 % and 2.76%.
Radiated susceptibility
As what is concluded in the document from Note2 of clause 5.4.6.2 of ISO/IEC 17025:
1999[2], the requirements for measurement uncertainty in RS testing are deemed to have
been satisfied, and the testing is reported in accordance with the relevant RS standards.
The immunity test signal from the RS system meet the required specifications in IEC
61000-4-3 through the calibration for the uniform field strength and monitoring for the test
level with the uncertainty evaluation report for the electrical filed strength as being 2.72 Db.
Electrical fast transient/burst
As what is concluded in the document from Note2 of clause 5.4.6.2 of ISO/IEC 17025:
1999[2], the requirements for measurement uncertainty in EFT/Burst testing are deemed to
have been satisfied, and the testing is reported in accordance with the relevant EFT/Burst
standards. The immunity test signal from the EFT/Burst system meet the required
specifications in IEC 61000-4-4 through the calibration report with the calibrated uncertainty
for the waveform of voltage, frequency and timing as being 1.63 %, 2.8 10-10 and
2.76%.
Surge
As what is concluded in the document from Note2 of clause 5.4.6.2 of ISO/IEC 17025:
1999[2], the requirements for measurement uncertainty in Surge testing are deemed to
have been satisfied, and the testing is reported in accordance with the relevant Surge
standards. The immunity test signal from the Surge system meet the required specifications
in IEC 61000-4-5 through the calibration report with the calibrated uncertainty for the
waveform of voltage and timing as being 1.63 % and 2.76%.

Report No:099053R-ITCEP07V06
Page: 17 of 123
Conducted susceptibility
As what is concluded in the document from Note2 of clause 5.4.6.2 of ISO/IEC 17025:
1999[2], the requirements for measurement uncertainty in CS testing are deemed to have
been satisfied, and the testing is reported in accordance with the relevant CS standards.
The immunity test signal from the CS system meet the required specifications in IEC
61000-4-6 through the calibration for unmodulated signal and monitoring for the test level
with the uncertainty evaluation report for the injected modulated signal level through CDN
and EM Clamp/Direct Injection as being 3.72 dB and 2.78 dB.
Power frequency magnetic field
As what is concluded in the document from Note2 of clause 5.4.6.2 of ISO/IEC 17025:
1999[2], the requirements for measurement uncertainty in PFM testing are deemed to have
been satisfied, and the testing is reported in accordance with the relevant PFM standards.
The immunity test signal from the PFM system meet the required specifications in IEC
61000-4-8 through the calibration report with the calibrated uncertainty for the Gauss Meter
to verify the output level of magnetic field strength as being 2 %.
Voltage dips and interruption
As what is concluded in the document from Note2 of clause 5.4.6.2 of ISO/IEC 17025:
1999[2], the requirements for measurement uncertainty in DIP testing are deemed to have
been satisfied, and the testing is reported in accordance with the relevant DIP standards.
The immunity test signal from the DIP system meet the required specifications in IEC
61000-4-11 through the calibration report with the calibrated uncertainty for the waveform of
voltage and timing as being 1.63 % and 2.76%.

Report No:099053R-ITCEP07V06
Page: 18 of 123
2.4. Test Environment
Performed Item Items Required Actual
Temperature (C) 15-35 25
Conducted Emission Humidity (%RH) 25-75 50
Barometric pressure (mbar) 860-1060 950-1000
Temperature (C) 15-35 25
Impedance Stabilization
Network Humidity (%RH) 25-75 50
Barometric pressure (mbar) 860-1060 950-1000
Temperature (C) 15-35 25
Radiated Emission Humidity (%RH) 25-75 50
Barometric pressure (mbar) 860-1060 950-1000
Temperature (C) 15-35 25
Electrostatic Discharge Humidity (%RH) 30-60 59
Barometric pressure (mbar) 860-1060 950-1000
Temperature (C) 15-35 23
Radiated susceptibility Humidity (%RH) 25-75 57
Barometric pressure (mbar) 860-1060 950-1000
Temperature (C) 15-35 24
Electrical fast
transient/burst Humidity (%RH) 25-75 56
Barometric pressure (mbar) 860-1060 950-1000
Temperature (C) 15-35 25
Surge Humidity (%RH) 10-75 56
Barometric pressure (mbar) 860-1060 950-1000
Temperature (C) 15-35 24
Conducted susceptibility Humidity (%RH) 25-75 57
Barometric pressure (mbar) 860-1060 950-1000
Temperature (C) 15-35 23
Power frequency magnetic
field Humidity (%RH) 25-75 55
Barometric pressure (mbar) 860-1060 950-1000
Temperature (C) 15-35 24
Voltage dips and
interruption Humidity (%RH) 25-75 57
Barometric pressure (mbar) 860-1060 950-1000

Report No:099053R-ITCEP07V06
Page: 19 of 123
3. Conducted Emission (Main Terminals)
3.1. Test Specification
According to EMC Standard : EN 55022
3.2. Test Setup
3.3. Limit
Limits
Frequency (MHz)
QP (dBuV)
AV (dBuV)
0.15 - 0.50 66 - 56 56 – 46
0.50-5.0 56 46
5.0 - 30 60 50
Remarks: In the above table, the tighter limit applies at the band edges.

Report No:099053R-ITCEP07V06
Page: 20 of 123
3.4. Test Procedure
The EUT and simulators are connected to the main power through a line impedance
stabilization network (L.I.S.N.). This provides a 50 ohm /50uH coupling impedance for the
measuring equipment. The peripheral devices are also connected to the main power through
a LISN that provides a 50ohm/50uH coupling impedance with 50ohm termination.
(Please refers to the block diagram of the test setup and photographs.)
Both sides of A.C. line are checked for maximum conducted interference. In order to find the
maximum emission, the relative positions of equipment and all of the interface cables must
be changed on conducted measurement.
Conducted emissions were invested over the frequency range from 0.15MHz to 30MHz using
a receiver bandwidth of 9kHz.
3.5. Deviation from Test Standard
No deviation.

Report No:099053R-ITCEP07V06
Page: 21 of 123
3.6. Test Result Site : SR1 Time : 2009/09/01 - 05:17
Limit : CISPR_B_00M_QP Margin : 10
EUT : Notebook Probe : ENV_216_L1 - Line1
Power : AC 230V/50Hz Note : Mode 1

Report No:099053R-ITCEP07V06
Page: 22 of 123
Site : SR1 Time : 2009/09/01 - 05:17
Limit : CISPR_B_00M_QP Margin : 0
EUT : Notebook Probe : ENV_216_L1 - Line1
Power : AC 230V/50Hz Note : Mode 1
Frequency
(MHz)
Correct Factor
(dB)
Reading Level
(dBuV)
Measure Level
(dBuV)
Margin
(dB)
Limit
(dBuV)
Detector Type
1 * 0.193 9.790 44.720 54.510 -10.261 64.771 QUASIPEAK
2 0.447 9.790 36.910 46.700 -10.814 57.514 QUASIPEAK
3 0.990 9.800 31.320 41.120 -14.880 56.000 QUASIPEAK
4 1.572 9.810 29.840 39.650 -16.350 56.000 QUASIPEAK
5 3.013 9.820 23.930 33.750 -22.250 56.000 QUASIPEAK
6 14.845 10.110 22.390 32.500 -27.500 60.000 QUASIPEAK
Note:
1. All Reading Levels are Quasi-Peak and average value.
2. " * ", means this data is the worst emission level.
3. Measurement Level = Reading Level + Correct Factor

Report No:099053R-ITCEP07V06
Page: 23 of 123
Site : SR1 Time : 2009/09/01 - 05:17
Limit : CISPR_B_00M_AV Margin : 0
EUT : Notebook Probe : ENV_216_L1 - Line1
Power : AC 230V/50Hz Note : Mode 1
Frequency
(MHz)
Correct Factor
(dB)
Reading Level
(dBuV)
Measure Level
(dBuV)
Margin
(dB)
Limit
(dBuV)
Detector Type
1 * 0.193 9.790 37.700 47.490 -7.281 54.771 AVERAGE
2 0.447 9.790 23.120 32.910 -14.604 47.514 AVERAGE
3 0.990 9.800 21.290 31.090 -14.910 46.000 AVERAGE
4 1.572 9.810 18.560 28.370 -17.630 46.000 AVERAGE
5 3.013 9.820 15.650 25.470 -20.530 46.000 AVERAGE
6 14.845 10.110 16.440 26.550 -23.450 50.000 AVERAGE
Note:
1. All Reading Levels are Quasi-Peak and average value.
2. " * ", means this data is the worst emission level.
3. Measurement Level = Reading Level + Correct Factor

Report No:099053R-ITCEP07V06
Page: 24 of 123
Site : SR1 Time : 2009/09/01 - 05:18
Limit : CISPR_B_00M_QP Margin : 10
EUT : Notebook Probe : ENV_216_N - Line2
Power : AC 230V/50Hz Note : Mode 1

Report No:099053R-ITCEP07V06
Page: 25 of 123
Site : SR1 Time : 2009/09/01 - 05:18
Limit : CISPR_B_00M_QP Margin : 0
EUT : Notebook Probe : ENV_216_N - Line2
Power : AC 230V/50Hz Note : Mode 1
Frequency
(MHz)
Correct Factor
(dB)
Reading Level
(dBuV)
Measure Level
(dBuV)
Margin
(dB)
Limit
(dBuV)
Detector Type
1 * 0.185 9.780 45.290 55.070 -9.930 65.000 QUASIPEAK
2 0.427 9.790 37.760 47.550 -10.536 58.086 QUASIPEAK
3 0.787 9.790 31.040 40.830 -15.170 56.000 QUASIPEAK
4 1.361 9.790 29.100 38.890 -17.110 56.000 QUASIPEAK
5 3.732 9.820 22.590 32.410 -23.590 56.000 QUASIPEAK
6 16.373 10.190 22.630 32.820 -27.180 60.000 QUASIPEAK
Note:
1. All Reading Levels are Quasi-Peak and average value.
2. " * ", means this data is the worst emission level.
3. Measurement Level = Reading Level + Correct Factor
Report No:099053R-ITCEP07V06
Page: 26 of 123
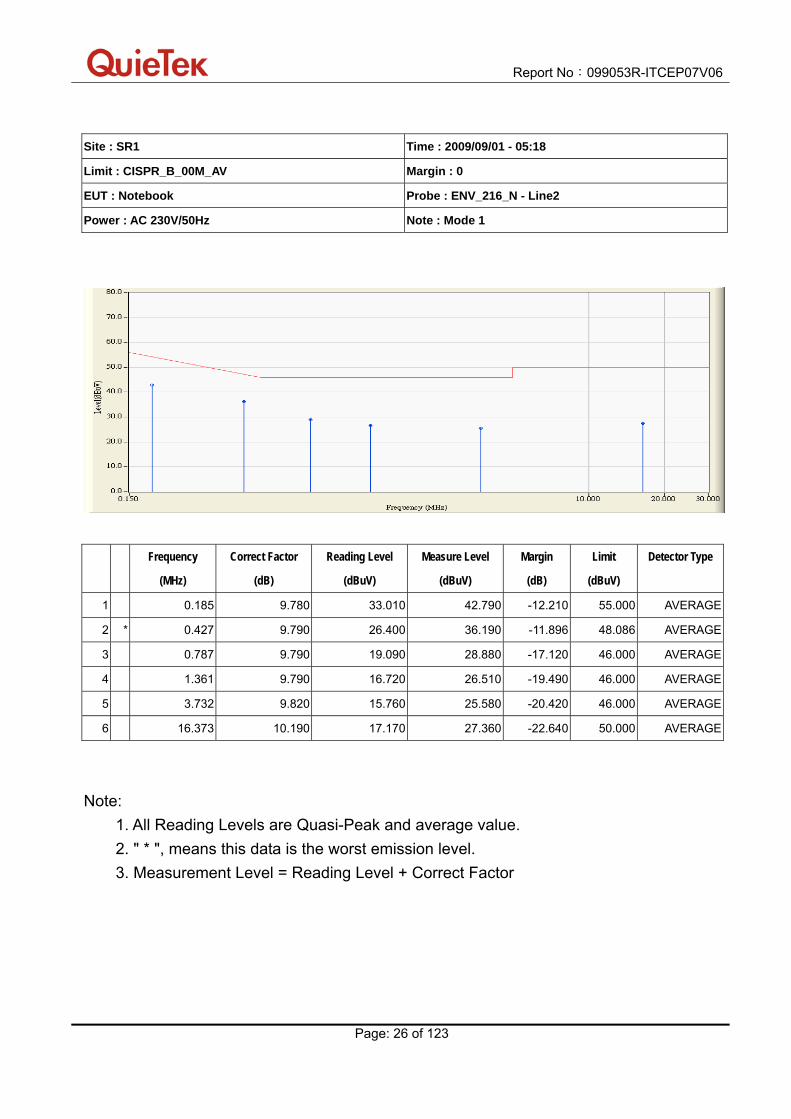
Site : SR1 Time : 2009/09/01 - 05:18
Limit : CISPR_B_00M_AV Margin : 0
EUT : Notebook Probe : ENV_216_N - Line2
Power : AC 230V/50Hz Note : Mode 1
Frequency
(MHz)
Correct Factor
(dB)
Reading Level
(dBuV)
Measure Level
(dBuV)
Margin
(dB)
Limit
(dBuV)
Detector Type
1 0.185 9.780 33.010 42.790 -12.210 55.000 AVERAGE
2 * 0.427 9.790 26.400 36.190 -11.896 48.086 AVERAGE
3 0.787 9.790 19.090 28.880 -17.120 46.000 AVERAGE
4 1.361 9.790 16.720 26.510 -19.490 46.000 AVERAGE
5 3.732 9.820 15.760 25.580 -20.420 46.000 AVERAGE
6 16.373 10.190 17.170 27.360 -22.640 50.000 AVERAGE
Note:
1. All Reading Levels are Quasi-Peak and average value.
2. " * ", means this data is the worst emission level.
3. Measurement Level = Reading Level + Correct Factor

Report No:099053R-ITCEP07V06
Page: 27 of 123
Site : SR1 Time : 2009/09/26 - 12:21
Limit : CISPR_B_00M_QP Margin : 10
EUT : Notebook Probe : ENV_216_L1 - Line1
Power : AC 230V/50Hz Note : Mode 3

Report No:099053R-ITCEP07V06
Page: 28 of 123
Site : SR1 Time : 2009/09/26 - 12:22
Limit : CISPR_B_00M_QP Margin : 0
EUT : Notebook Probe : ENV_216_L1 - Line1
Power : AC 230V/50Hz Note : Mode 3
Frequency
(MHz)
Correct Factor
(dB)
Reading Level
(dBuV)
Measure Level
(dBuV)
Margin
(dB)
Limit
(dBuV)
Detector Type
1 * 0.185 9.790 46.360 56.150 -8.850 65.000 QUASIPEAK
2 0.326 9.790 38.100 47.890 -13.081 60.971 QUASIPEAK
3 0.455 9.790 37.280 47.070 -10.216 57.286 QUASIPEAK
4 0.724 9.798 32.090 41.888 -14.112 56.000 QUASIPEAK
5 1.420 9.800 30.080 39.880 -16.120 56.000 QUASIPEAK
6 17.033 10.110 15.260 25.370 -34.630 60.000 QUASIPEAK
Note:
1. All Reading Levels are Quasi-Peak and average value.
2. " * ", means this data is the worst emission level.
3. Measurement Level = Reading Level + Correct Factor

Report No:099053R-ITCEP07V06
Page: 29 of 123
Site : SR1 Time : 2009/09/26 - 12:22
Limit : CISPR_B_00M_AV Margin : 0
EUT : Notebook Probe : ENV_216_L1 - Line1
Power : AC 230V/50Hz Note : Mode 3
Frequency
(MHz)
Correct Factor
(dB)
Reading Level
(dBuV)
Measure Level
(dBuV)
Margin
(dB)
Limit
(dBuV)
Detector Type
1 * 0.185 9.790 33.380 43.170 -11.830 55.000 AVERAGE
2 0.326 9.790 21.770 31.560 -19.411 50.971 AVERAGE
3 0.455 9.790 24.960 34.750 -12.536 47.286 AVERAGE
4 0.724 9.798 20.960 30.758 -15.242 46.000 AVERAGE
5 1.420 9.800 17.530 27.330 -18.670 46.000 AVERAGE
6 17.033 10.110 9.940 20.050 -29.950 50.000 AVERAGE
Note:
1. All Reading Levels are Quasi-Peak and average value.
2. " * ", means this data is the worst emission level.
3. Measurement Level = Reading Level + Correct Factor

Report No:099053R-ITCEP07V06
Page: 30 of 123
Site : SR1 Time : 2009/09/26 - 12:22
Limit : CISPR_B_00M_QP Margin : 10
EUT : Notebook Probe : ENV_216_N - Line2
Power : AC 230V/50Hz Note : Mode 3

Report No:099053R-ITCEP07V06
Page: 31 of 123
Site : SR1 Time : 2009/09/26 - 12:23
Limit : CISPR_B_00M_QP Margin : 0
EUT : Notebook Probe : ENV_216_N - Line2
Power : AC 230V/50Hz Note : Mode 3
Frequency
(MHz)
Correct Factor
(dB)
Reading Level
(dBuV)
Measure Level
(dBuV)
Margin
(dB)
Limit
(dBuV)
Detector Type
1 * 0.201 9.780 44.470 54.250 -10.293 64.543 QUASIPEAK
2 0.259 9.780 41.900 51.680 -11.206 62.886 QUASIPEAK
3 0.384 9.790 37.980 47.770 -11.544 59.314 QUASIPEAK
4 0.736 9.790 31.470 41.260 -14.740 56.000 QUASIPEAK
5 1.416 9.790 30.120 39.910 -16.090 56.000 QUASIPEAK
6 17.166 10.200 13.980 24.180 -35.820 60.000 QUASIPEAK
Note:
1. All Reading Levels are Quasi-Peak and average value.
2. " * ", means this data is the worst emission level.
3. Measurement Level = Reading Level + Correct Factor

Report No:099053R-ITCEP07V06
Page: 32 of 123
Site : SR1 Time : 2009/09/26 - 12:23
Limit : CISPR_B_00M_AV Margin : 0
EUT : Notebook Probe : ENV_216_N - Line2
Power : AC 230V/50Hz Note : Mode 3
Frequency
(MHz)
Correct Factor
(dB)
Reading Level
(dBuV)
Measure Level
(dBuV)
Margin
(dB)
Limit
(dBuV)
Detector Type
1 0.201 9.780 31.140 40.920 -13.623 54.543 AVERAGE
2 * 0.259 9.780 30.800 40.580 -12.306 52.886 AVERAGE
3 0.384 9.790 26.530 36.320 -12.994 49.314 AVERAGE
4 0.736 9.790 20.370 30.160 -15.840 46.000 AVERAGE
5 1.416 9.790 19.040 28.830 -17.170 46.000 AVERAGE
6 17.166 10.200 8.670 18.870 -31.130 50.000 AVERAGE
Note:
1. All Reading Levels are Quasi-Peak and average value.
2. " * ", means this data is the worst emission level.
3. Measurement Level = Reading Level + Correct Factor

Report No:099053R-ITCEP07V06
Page: 33 of 123
3.7. Test Photograph Test Mode : Mode 1
Description : Front View of Conducted Test
Test Mode : Mode 1
Description : Back View of Conducted Test

Report No:099053R-ITCEP07V06
Page: 34 of 123
Test Mode : Mode 3
Description : Front View of Conducted Test
Test Mode : Mode 3
Description : Back View of Conducted Test

Report No:099053R-ITCEP07V06
Page: 35 of 123
4. Conducted Emissions (Telecommunication Ports)
4.1. Test Specification
According to EMC Standard : EN 55022
4.2. Test Setup
4.3. Limit
Limits
Frequency (MHz)
QP (dBuV)
AV (dBuV)
0.15 - 0.50 84 – 74 74 – 64
0.50 - 30 74 64
Remarks:
The limit decreases linearly with the logarithm of the frequency in the range 0.15 MHz~0.50
MHz.

Report No:099053R-ITCEP07V06
Page: 36 of 123
4.4. Test Procedure
Telecommunication Port:
The mains voltage shall be supplied to the EUT via the LISN when the measurement of
telecommunication port is performed. The common mode disturbances at the
telecommunication port shall be connected to the ISN, which is 150 ohm impedance.
Both alternative cables are tested related to the LCL requested. The measurement range is
from 150kHz to 30MHz. The bandwidth of measurement is set to 9kHz.
The 75dB LCL ISN is used for cat. 6 cable, the 65dB LCL ISN is used for cat. 5 cable, 55dB
LCL ISN is used for cat. 3.
4.5. Deviation from Test Standard
No deviation.

Report No:099053R-ITCEP07V06
Page: 37 of 123
4.6. Test Result Site : SR1 Time : 2009/09/01 - 05:31
Limit : ISN_Voltage_B_00M_QP Margin : 10
EUT : Notebook Probe : ISN_T4 - Line1
Power : AC 230V/50Hz Note : Mode 1, 10Mbps Ping

Report No:099053R-ITCEP07V06
Page: 38 of 123
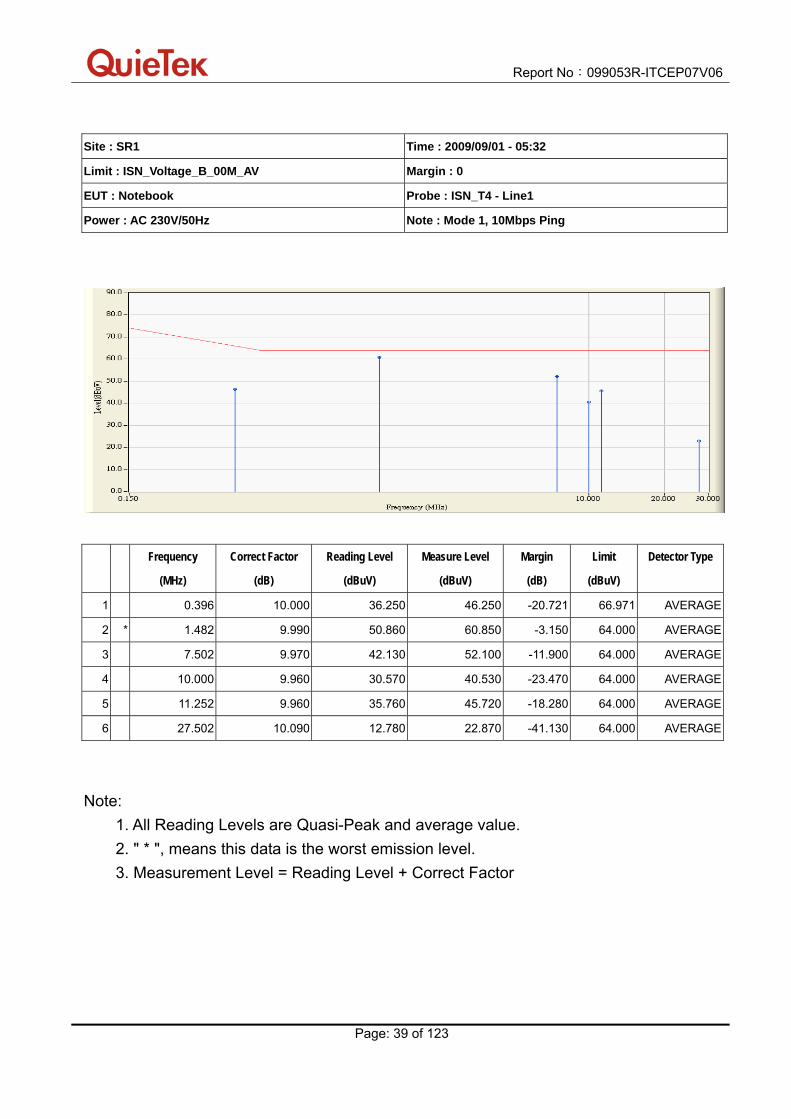
Site : SR1 Time : 2009/09/01 - 05:32
Limit : ISN_Voltage_B_00M_QP Margin : 0
EUT : Notebook Probe : ISN_T4 - Line1
Power : AC 230V/50Hz Note : Mode 1, 10Mbps Ping
Frequency
(MHz)
Correct Factor
(dB)
Reading Level
(dBuV)
Measure Level
(dBuV)
Margin
(dB)
Limit
(dBuV)
Detector Type
1 0.396 10.000 46.060 56.060 -20.911 76.971 QUASIPEAK
2 * 1.482 9.990 54.630 64.620 -9.380 74.000 QUASIPEAK
3 7.502 9.970 42.140 52.110 -21.890 74.000 QUASIPEAK
4 10.000 9.960 42.780 52.740 -21.260 74.000 QUASIPEAK
5 11.252 9.960 49.080 59.040 -14.960 74.000 QUASIPEAK
6 27.502 10.090 24.730 34.820 -39.180 74.000 QUASIPEAK
Note:
1. All Reading Levels are Quasi-Peak and average value.
2. " * ", means this data is the worst emission level.
3. Measurement Level = Reading Level + Correct Factor
Report No:099053R-ITCEP07V06
Page: 39 of 123
Site : SR1 Time : 2009/09/01 - 05:32
Limit : ISN_Voltage_B_00M_AV Margin : 0
EUT : Notebook Probe : ISN_T4 - Line1
Power : AC 230V/50Hz Note : Mode 1, 10Mbps Ping
Frequency
(MHz)
Correct Factor
(dB)
Reading Level
(dBuV)
Measure Level
(dBuV)
Margin
(dB)
Limit
(dBuV)
Detector Type
1 0.396 10.000 36.250 46.250 -20.721 66.971 AVERAGE
2 * 1.482 9.990 50.860 60.850 -3.150 64.000 AVERAGE
3 7.502 9.970 42.130 52.100 -11.900 64.000 AVERAGE
4 10.000 9.960 30.570 40.530 -23.470 64.000 AVERAGE
5 11.252 9.960 35.760 45.720 -18.280 64.000 AVERAGE
6 27.502 10.090 12.780 22.870 -41.130 64.000 AVERAGE
Note:
1. All Reading Levels are Quasi-Peak and average value.
2. " * ", means this data is the worst emission level.
3. Measurement Level = Reading Level + Correct Factor

Report No:099053R-ITCEP07V06
Page: 40 of 123
Site : SR1 Time : 2009/09/01 - 05:28
Limit : ISN_Voltage_B_00M_QP Margin : 10
EUT : Notebook Probe : ISN_T4 - Line1
Power : AC 230V/50Hz Note : Mode 1, 100Mbps

Report No:099053R-ITCEP07V06
Page: 41 of 123
Site : SR1 Time : 2009/09/01 - 05:28
Limit : ISN_Voltage_B_00M_QP Margin : 0
EUT : Notebook Probe : ISN_T4 - Line1
Power : AC 230V/50Hz Note : Mode 1, 100Mbps
Frequency
(MHz)
Correct Factor
(dB)
Reading Level
(dBuV)
Measure Level
(dBuV)
Margin
(dB)
Limit
(dBuV)
Detector Type
1 0.873 9.980 49.710 59.690 -14.310 74.000 QUASIPEAK
2 * 1.482 9.990 54.510 64.500 -9.500 74.000 QUASIPEAK
3 5.236 9.980 44.720 54.700 -19.300 74.000 QUASIPEAK
4 7.373 9.970 43.400 53.370 -20.630 74.000 QUASIPEAK
5 13.357 10.150 50.450 60.600 -13.400 74.000 QUASIPEAK
6 16.228 10.130 52.740 62.870 -11.130 74.000 QUASIPEAK
Note:
1. All Reading Levels are Quasi-Peak and average value.
2. " * ", means this data is the worst emission level.
3. Measurement Level = Reading Level + Correct Factor

Report No:099053R-ITCEP07V06
Page: 42 of 123
Site : SR1 Time : 2009/09/01 - 05:28
Limit : ISN_Voltage_B_00M_AV Margin : 0
EUT : Notebook Probe : ISN_T4 - Line1
Power : AC 230V/50Hz Note : Mode 1, 100Mbps
Frequency
(MHz)
Correct Factor
(dB)
Reading Level
(dBuV)
Measure Level
(dBuV)
Margin
(dB)
Limit
(dBuV)
Detector Type
1 0.873 9.980 39.160 49.140 -14.860 64.000 AVERAGE
2 1.482 9.990 50.390 60.380 -3.620 64.000 AVERAGE
3 5.236 9.980 44.390 54.370 -9.630 64.000 AVERAGE
4 7.373 9.970 39.190 49.160 -14.840 64.000 AVERAGE
5 13.357 10.150 50.440 60.590 -3.410 64.000 AVERAGE
6 * 16.228 10.130 50.830 60.960 -3.040 64.000 AVERAGE
Note:
1. All Reading Levels are Quasi-Peak and average value.
2. " * ", means this data is the worst emission level.
3. Measurement Level = Reading Level + Correct Factor

Report No:099053R-ITCEP07V06
Page: 43 of 123
Site : SR1 Time : 2009/09/01 - 05:26
Limit : ISN_Voltage_B_00M_QP Margin : 10
EUT : Notebook Probe : ISN_T8 - Line1
Power : AC 230V/50Hz Note : Mode 1, 1Gbps

Report No:099053R-ITCEP07V06
Page: 44 of 123
Site : SR1 Time : 2009/09/01 - 05:27
Limit : ISN_Voltage_B_00M_QP Margin : 0
EUT : Notebook Probe : ISN_T8 - Line1
Power : AC 230V/50Hz Note : Mode 1, 1Gbps
Frequency
(MHz)
Correct Factor
(dB)
Reading Level
(dBuV)
Measure Level
(dBuV)
Margin
(dB)
Limit
(dBuV)
Detector Type
1 0.533 10.160 47.570 57.730 -16.270 74.000 QUASIPEAK
2 * 1.486 10.090 55.920 66.010 -7.990 74.000 QUASIPEAK
3 2.529 10.070 49.800 59.870 -14.130 74.000 QUASIPEAK
4 5.408 10.050 36.920 46.970 -27.030 74.000 QUASIPEAK
5 7.322 10.060 33.780 43.840 -30.160 74.000 QUASIPEAK
6 29.935 10.150 35.330 45.480 -28.520 74.000 QUASIPEAK
Note:
1. All Reading Levels are Quasi-Peak and average value.
2. " * ", means this data is the worst emission level.
3. Measurement Level = Reading Level + Correct Factor

Report No:099053R-ITCEP07V06
Page: 45 of 123
Site : SR1 Time : 2009/09/01 - 05:27
Limit : ISN_Voltage_B_00M_AV Margin : 0
EUT : Notebook Probe : ISN_T8 - Line1
Power : AC 230V/50Hz Note : Mode 1, 1Gbps
Frequency
(MHz)
Correct Factor
(dB)
Reading Level
(dBuV)
Measure Level
(dBuV)
Margin
(dB)
Limit
(dBuV)
Detector Type
1 0.533 10.160 36.760 46.920 -17.080 64.000 AVERAGE
2 * 1.486 10.090 50.720 60.810 -3.190 64.000 AVERAGE
3 2.529 10.070 44.010 54.080 -9.920 64.000 AVERAGE
4 5.408 10.050 33.530 43.580 -20.420 64.000 AVERAGE
5 7.322 10.060 29.120 39.180 -24.820 64.000 AVERAGE
6 29.935 10.150 30.880 41.030 -22.970 64.000 AVERAGE
Note:
1. All Reading Levels are Quasi-Peak and average value.
2. " * ", means this data is the worst emission level.
3. Measurement Level = Reading Level + Correct Factor

Report No:099053R-ITCEP07V06
Page: 46 of 123
Site : SR1 Time : 2009/09/26 - 12:30
Limit : ISN_Voltage_B_00M_QP Margin : 10
EUT : Notebook Probe : ISN_T4 - Line1
Power : AC 230V/50Hz Note : Mode 3, 10M

Report No:099053R-ITCEP07V06
Page: 47 of 123
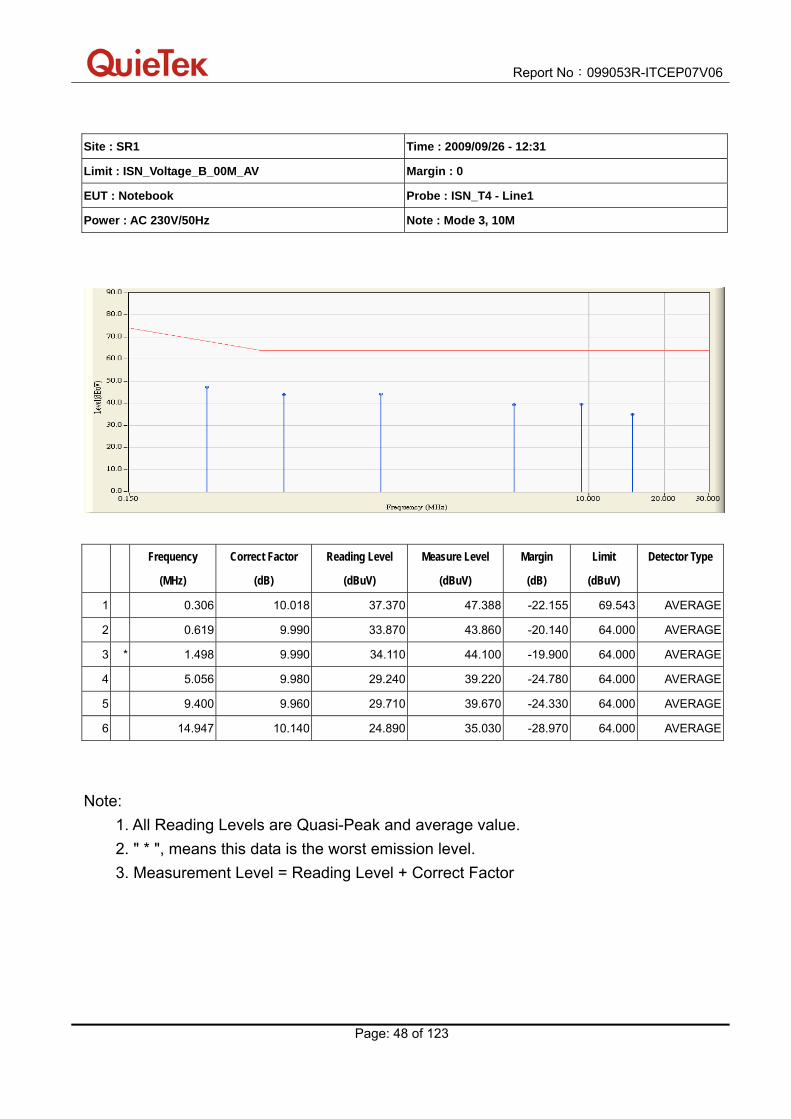
Site : SR1 Time : 2009/09/26 - 12:31
Limit : ISN_Voltage_B_00M_QP Margin : 0
EUT : Notebook Probe : ISN_T4 - Line1
Power : AC 230V/50Hz Note : Mode 3, 10M
Frequency
(MHz)
Correct Factor
(dB)
Reading Level
(dBuV)
Measure Level
(dBuV)
Margin
(dB)
Limit
(dBuV)
Detector Type
1 0.306 10.018 40.740 50.758 -28.785 79.543 QUASIPEAK
2 0.619 9.990 39.780 49.770 -24.230 74.000 QUASIPEAK
3 1.498 9.990 40.430 50.420 -23.580 74.000 QUASIPEAK
4 5.056 9.980 38.120 48.100 -25.900 74.000 QUASIPEAK
5 * 9.400 9.960 42.310 52.270 -21.730 74.000 QUASIPEAK
6 14.947 10.140 37.290 47.430 -26.570 74.000 QUASIPEAK
Note:
1. All Reading Levels are Quasi-Peak and average value.
2. " * ", means this data is the worst emission level.
3. Measurement Level = Reading Level + Correct Factor
Report No:099053R-ITCEP07V06
Page: 48 of 123
Site : SR1 Time : 2009/09/26 - 12:31
Limit : ISN_Voltage_B_00M_AV Margin : 0
EUT : Notebook Probe : ISN_T4 - Line1
Power : AC 230V/50Hz Note : Mode 3, 10M
Frequency
(MHz)
Correct Factor
(dB)
Reading Level
(dBuV)
Measure Level
(dBuV)
Margin
(dB)
Limit
(dBuV)
Detector Type
1 0.306 10.018 37.370 47.388 -22.155 69.543 AVERAGE
2 0.619 9.990 33.870 43.860 -20.140 64.000 AVERAGE
3 * 1.498 9.990 34.110 44.100 -19.900 64.000 AVERAGE
4 5.056 9.980 29.240 39.220 -24.780 64.000 AVERAGE
5 9.400 9.960 29.710 39.670 -24.330 64.000 AVERAGE
6 14.947 10.140 24.890 35.030 -28.970 64.000 AVERAGE
Note:
1. All Reading Levels are Quasi-Peak and average value.
2. " * ", means this data is the worst emission level.
3. Measurement Level = Reading Level + Correct Factor

Report No:099053R-ITCEP07V06
Page: 49 of 123
Site : SR1 Time : 2009/09/26 - 12:33
Limit : ISN_Voltage_B_00M_QP Margin : 10
EUT : Notebook Probe : ISN_T4 - Line1
Power : AC 230V/50Hz Note : Mode 3, 100M

Report No:099053R-ITCEP07V06
Page: 50 of 123
Site : SR1 Time : 2009/09/26 - 12:34
Limit : ISN_Voltage_B_00M_QP Margin : 0
EUT : Notebook Probe : ISN_T4 - Line1
Power : AC 230V/50Hz Note : Mode 3, 100M
Frequency
(MHz)
Correct Factor
(dB)
Reading Level
(dBuV)
Measure Level
(dBuV)
Margin
(dB)
Limit
(dBuV)
Detector Type
1 0.619 9.990 39.660 49.650 -24.350 74.000 QUASIPEAK
2 1.025 9.980 39.820 49.800 -24.200 74.000 QUASIPEAK
3 5.236 9.980 40.370 50.350 -23.650 74.000 QUASIPEAK
4 7.923 9.970 43.940 53.910 -20.090 74.000 QUASIPEAK
5 13.357 10.150 48.400 58.550 -15.450 74.000 QUASIPEAK
6 * 18.244 10.120 50.290 60.410 -13.590 74.000 QUASIPEAK
Note:
1. All Reading Levels are Quasi-Peak and average value.
2. " * ", means this data is the worst emission level.
3. Measurement Level = Reading Level + Correct Factor

Report No:099053R-ITCEP07V06
Page: 51 of 123
Site : SR1 Time : 2009/09/26 - 12:34
Limit : ISN_Voltage_B_00M_AV Margin : 0
EUT : Notebook Probe : ISN_T4 - Line1
Power : AC 230V/50Hz Note : Mode 3, 100M
Frequency
(MHz)
Correct Factor
(dB)
Reading Level
(dBuV)
Measure Level
(dBuV)
Margin
(dB)
Limit
(dBuV)
Detector Type
1 0.619 9.990 34.170 44.160 -19.840 64.000 AVERAGE
2 1.025 9.980 31.290 41.270 -22.730 64.000 AVERAGE
3 5.236 9.980 37.150 47.130 -16.870 64.000 AVERAGE
4 7.923 9.970 41.630 51.600 -12.400 64.000 AVERAGE
5 13.357 10.150 45.800 55.950 -8.050 64.000 AVERAGE
6 * 18.244 10.120 47.550 57.670 -6.330 64.000 AVERAGE
Note:
1. All Reading Levels are Quasi-Peak and average value.
2. " * ", means this data is the worst emission level.
3. Measurement Level = Reading Level + Correct Factor
Report No:099053R-ITCEP07V06
Page: 52 of 123
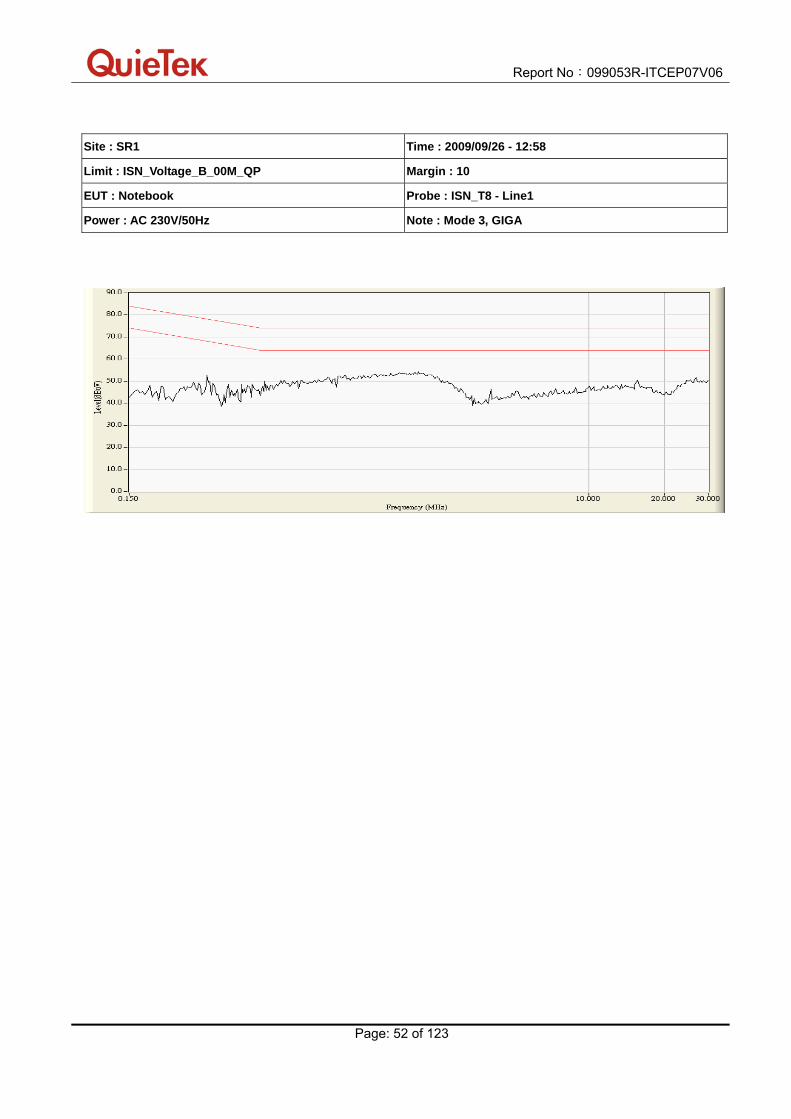
Site : SR1 Time : 2009/09/26 - 12:58
Limit : ISN_Voltage_B_00M_QP Margin : 10
EUT : Notebook Probe : ISN_T8 - Line1
Power : AC 230V/50Hz Note : Mode 3, GIGA

Report No:099053R-ITCEP07V06
Page: 53 of 123
Site : SR1 Time : 2009/09/26 - 12:59
Limit : ISN_Voltage_B_00M_QP Margin : 0
EUT : Notebook Probe : ISN_T8 - Line1
Power : AC 230V/50Hz Note : Mode 3, GIGA
Frequency
(MHz)
Correct Factor
(dB)
Reading Level
(dBuV)
Measure Level
(dBuV)
Margin
(dB)
Limit
(dBuV)
Detector Type
1 0.201 10.236 34.870 45.106 -37.437 82.543 QUASIPEAK
2 0.306 10.208 39.570 49.778 -29.765 79.543 QUASIPEAK
3 0.619 10.150 39.600 49.750 -24.250 74.000 QUASIPEAK
4 * 2.119 10.070 40.340 50.410 -23.590 74.000 QUASIPEAK
5 4.091 10.060 30.200 40.260 -33.740 74.000 QUASIPEAK
6 15.627 10.280 32.500 42.780 -31.220 74.000 QUASIPEAK
Note:
1. All Reading Levels are Quasi-Peak and average value.
2. " * ", means this data is the worst emission level.
3. Measurement Level = Reading Level + Correct Factor

Report No:099053R-ITCEP07V06
Page: 54 of 123
Site : SR1 Time : 2009/09/26 - 12:59
Limit : ISN_Voltage_B_00M_AV Margin : 0
EUT : Notebook Probe : ISN_T8 - Line1
Power : AC 230V/50Hz Note : Mode 3,GIGA
Frequency
(MHz)
Correct Factor
(dB)
Reading Level
(dBuV)
Measure Level
(dBuV)
Margin
(dB)
Limit
(dBuV)
Detector Type
1 0.201 10.236 28.490 38.726 -33.817 72.543 AVERAGE
2 0.306 10.208 35.750 45.958 -23.585 69.543 AVERAGE
3 * 0.619 10.150 35.330 45.480 -18.520 64.000 AVERAGE
4 2.119 10.070 31.820 41.890 -22.110 64.000 AVERAGE
5 4.091 10.060 24.240 34.300 -29.700 64.000 AVERAGE
6 15.627 10.280 26.950 37.230 -26.770 64.000 AVERAGE
Note:
1. All Reading Levels are Quasi-Peak and average value.
2. " * ", means this data is the worst emission level.
3. Measurement Level = Reading Level + Correct Factor
Report No:099053R-ITCEP07V06
Page: 55 of 123
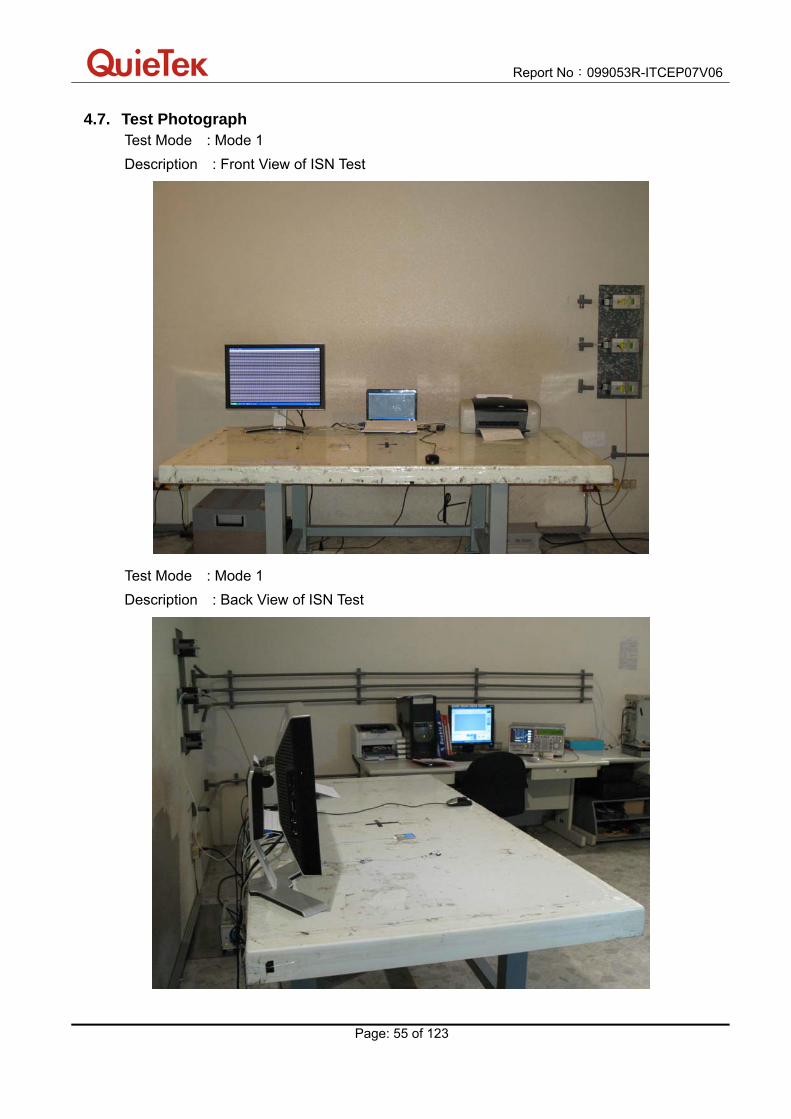
4.7. Test Photograph Test Mode : Mode 1
Description : Front View of ISN Test
Test Mode : Mode 1
Description : Back View of ISN Test
Report No:099053R-ITCEP07V06
Page: 56 of 123
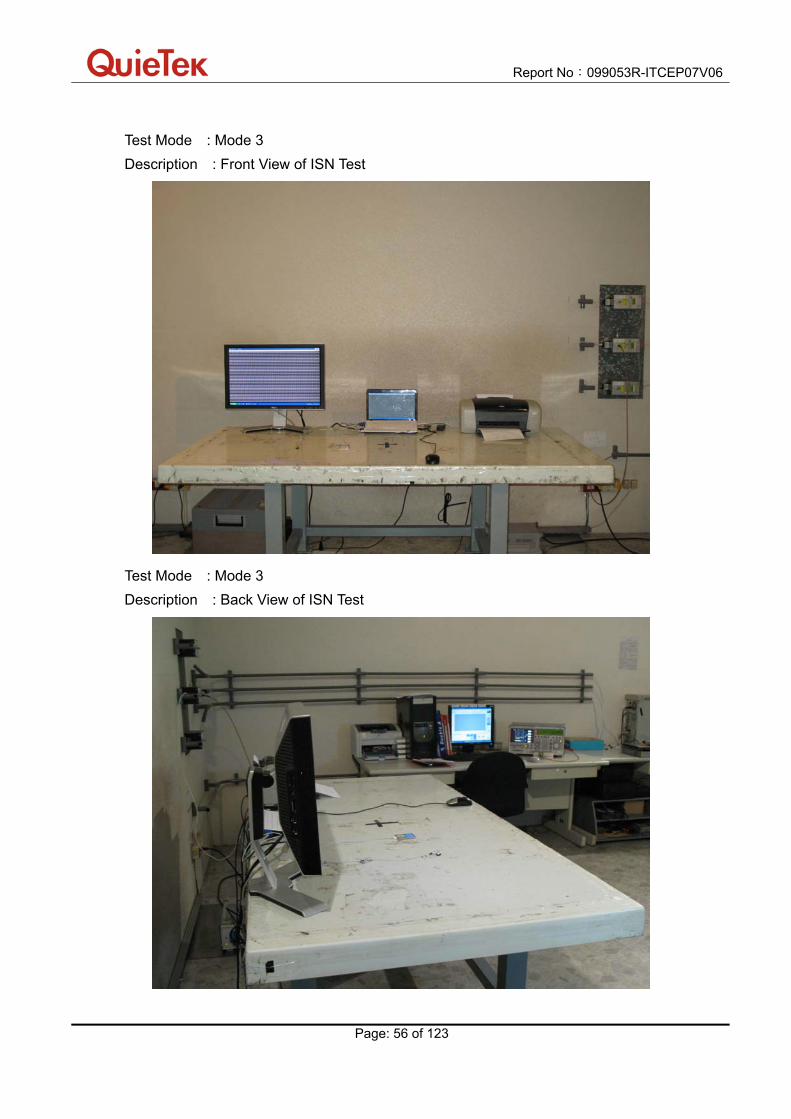
Test Mode : Mode 3
Description : Front View of ISN Test
Test Mode : Mode 3
Description : Back View of ISN Test
Report No:099053R-ITCEP07V06
Page: 57 of 123
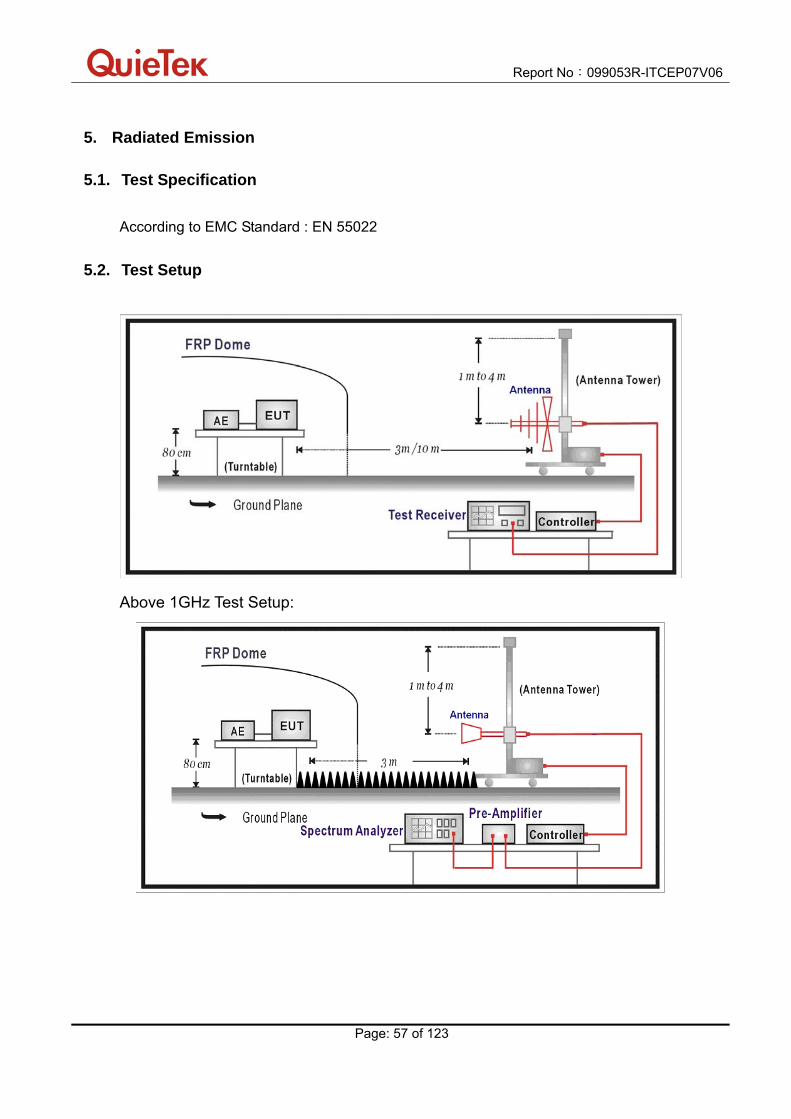
5. Radiated Emission
5.1. Test Specification
According to EMC Standard : EN 55022
5.2. Test Setup
Above 1GHz Test Setup:

Report No:099053R-ITCEP07V06
Page: 58 of 123
5.3. Limit
Limits
Frequency
(MHz) Distance (m) dBuV/m
30 – 230 10 30
230 – 1000 10 37
Limits
Frequency
(GHz)
Distance
(m)
Peak
(dBuV/m)
Average
(dBuV/m)
1 – 3 3 70 50
3 – 6 3 74 54
Remark:
1. The tighter limit shall apply at the edge between two frequency bands.
2. Distance refers to the distance in meters between the measuring instrument
antenna and the closed point of any part of the device or system.
Highest frequency generated or used
in the device or on which the device
operates or tunes (MHz)
Upper frequency of measurement
range (MHz)
Below 108 1000
108 – 500 2000
500 – 1000 5000
Above 1000 5th harmonic of the highest frequency
or 6 GHz, whichever is lower

Report No:099053R-ITCEP07V06
Page: 59 of 123
5.4. Test Procedure
The EUT and its simulators are placed on a turn table which is 0.8 meter above ground. The
turn table can rotate 360 degrees to determine the position of the maximum emission level.
The EUT was positioned such that the distance from antenna to the EUT was 3/10 meters.
The antenna can move up and down between 1 meter and 4 meters to find out the maximum
emission level.
All cable leaving the table-top EUT for a connection outsidethe test site (for example, mains
cable, telephone lines, connections to auxiliary equipment located outside the test area) shall
be fitted with ferrite clamps placed on the floor at the point where the cable reached the floor.
Both horizontal and vertical polarization of the antenna are set on measurement. In order to
find the maximum emission, all of the interface cables must be manipulated on radiated
measurement.
Radiated emissions were invested over the frequency range from 30MHz to1GHz using a
receiver bandwidth of 120kHz and above 1GHz using a receiver bandwidth of 1MHz.
30MHz to1GHz Radiated was performed at an antenna to EUT distance of 10 meters.
Above1GHz Radiated was performed at an antenna to EUT distance of 3 meters.
It is placed with absorb on the ground between EUT and Antenna.
5.5. Deviation from Test Standard
No deviation.

Report No:099053R-ITCEP07V06
Page: 60 of 123
5.6. Test Result Site : OATS-1 Time : 2009/08/31 - 16:43
Limit : CISPR_B_10M_QP Margin : 6
EUT : Notebook Probe : Site1_CBL6112_10M_0811 - HORIZONTAL
Power : AC 230V/50Hz Note : Mode 1
Frequency
(MHz)
Correct Factor
(dB)
Reading Level
(dBuV)
Measure Level
(dBuV/m)
Margin
(dB)
Limit
(dBuV/m)
Detector Type
1 137.440 12.980 5.800 18.780 -11.220 30.000 QUASIPEAK
2 * 229.700 11.779 15.200 26.979 -3.021 30.000 QUASIPEAK
3 295.390 15.609 15.000 30.609 -6.391 37.000 QUASIPEAK
4 312.000 16.177 9.800 25.977 -11.023 37.000 QUASIPEAK
5 405.000 19.303 13.100 32.403 -4.597 37.000 QUASIPEAK
6 540.000 22.197 9.700 31.897 -5.103 37.000 QUASIPEAK
7 997.490 26.203 2.500 28.703 -8.297 37.000 QUASIPEAK
Note:
1. All Readings below 1GHz are Quasi-Peak, above are performed with peak and/or
average measurements as necessary.
2. " * ", means this data is the worst emission level.
3. Measurement Level = Reading Level + Correct Factor

Report No:099053R-ITCEP07V06
Page: 61 of 123
Site : OATS-1 Time : 2009/08/31 - 17:04
Limit : CISPR_B_10M_QP Margin : 6
EUT : Notebook Probe : Site1_CBL6112_10M_0811 - VERTICAL
Power : AC 230V/50Hz Note : Mode 1
Frequency
(MHz)
Correct Factor
(dB)
Reading Level
(dBuV)
Measure Level
(dBuV/m)
Margin
(dB)
Limit
(dBuV/m)
Detector Type
1 45.420 11.189 10.500 21.689 -8.311 30.000 QUASIPEAK
2 * 125.000 13.570 11.200 24.770 -5.230 30.000 QUASIPEAK
3 145.090 12.406 9.700 22.106 -7.894 30.000 QUASIPEAK
4 188.710 10.597 11.400 21.997 -8.003 30.000 QUASIPEAK
5 229.820 11.794 12.300 24.094 -5.906 30.000 QUASIPEAK
6 295.470 15.610 11.700 27.310 -9.690 37.000 QUASIPEAK
7 467.620 20.387 6.100 26.487 -10.513 37.000 QUASIPEAK
8 772.800 24.400 3.300 27.700 -9.300 37.000 QUASIPEAK
9 860.810 25.193 3.900 29.093 -7.907 37.000 QUASIPEAK
Note:
1. All Readings below 1GHz are Quasi-Peak, above are performed with peak and/or
average measurements as necessary.
2. " * ", means this data is the worst emission level.
3. Measurement Level = Reading Level + Correct Factor

Report No:099053R-ITCEP07V06
Page: 62 of 123
Site : OATS-1 Time : 2009/09/26 - 19:16
Limit : CISPR_B_10M_QP Margin : 6
EUT : Notebook Probe : Site1_CBL6112_10M_0811 - HORIZONTAL
Power : AC 230V/50Hz Note : Mode 3
Frequency
(MHz)
Correct Factor
(dB)
Reading Level
(dBuV)
Measure Level
(dBuV/m)
Margin
(dB)
Limit
(dBuV/m)
Detector Type
1 149.312 13.860 13.040 26.900 -3.100 30.000 QUASIPEAK
2 170.902 12.780 14.129 26.909 -3.091 30.000 QUASIPEAK
3 216.000 13.863 12.012 25.875 -4.125 30.000 QUASIPEAK
4 * 240.006 15.590 18.380 33.970 -3.030 37.000 QUASIPEAK
5 319.687 17.929 12.420 30.349 -6.651 37.000 QUASIPEAK
6 540.000 22.758 10.704 33.462 -3.538 37.000 QUASIPEAK
7 720.000 25.170 6.840 32.010 -4.990 37.000 QUASIPEAK
8 960.000 28.486 5.241 33.726 -3.274 37.000 QUASIPEAK
Note:
1. All Readings below 1GHz are Quasi-Peak, above are performed with peak and/or
average measurements as necessary.
2. " * ", means this data is the worst emission level.
3. Measurement Level = Reading Level + Correct Factor

Report No:099053R-ITCEP07V06
Page: 63 of 123
Site : OATS-1 Time : 2009/09/26 - 19:00
Limit : CISPR_B_10M_QP Margin : 6
EUT : Notebook Probe : Site1_CBL6112_10M_0811 - VERTICAL
Power : AC 230V/50Hz Note : Mode 3
Frequency
(MHz)
Correct Factor
(dB)
Reading Level
(dBuV)
Measure Level
(dBuV/m)
Margin
(dB)
Limit
(dBuV/m)
Detector Type
1 49.560 11.143 13.169 24.312 -5.688 30.000 QUASIPEAK
2 125.007 15.012 10.023 25.035 -4.965 30.000 QUASIPEAK
3 177.803 12.495 13.849 26.344 -3.656 30.000 QUASIPEAK
4 * 216.000 13.863 12.602 26.465 -3.535 30.000 QUASIPEAK
5 319.490 17.923 9.030 26.953 -10.047 37.000 QUASIPEAK
6 480.000 21.668 7.777 29.445 -7.555 37.000 QUASIPEAK
7 960.000 28.486 4.840 33.325 -3.675 37.000 QUASIPEAK
Note:
1. All Readings below 1GHz are Quasi-Peak, above are performed with peak and/or
average measurements as necessary.
2. " * ", means this data is the worst emission level.
3. Measurement Level = Reading Level + Correct Factor
Report No:099053R-ITCEP07V06
Page: 64 of 123
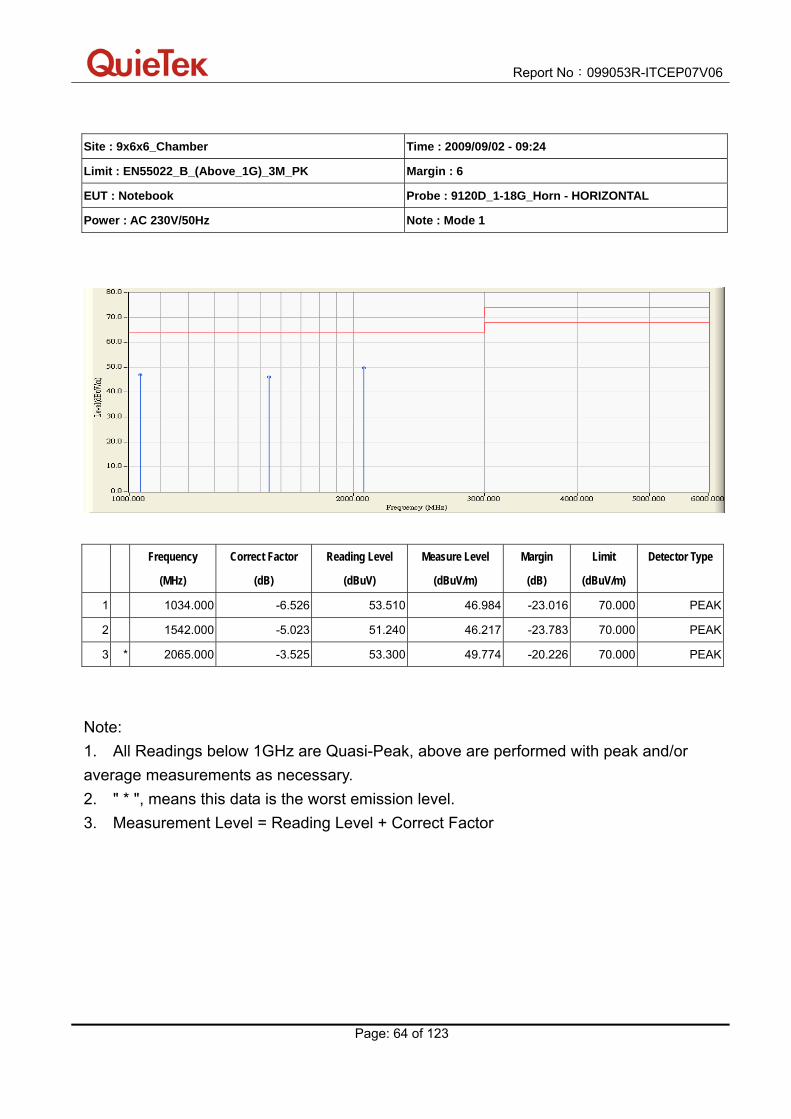
Site : 9x6x6_Chamber Time : 2009/09/02 - 09:24
Limit : EN55022_B_(Above_1G)_3M_PK Margin : 6
EUT : Notebook Probe : 9120D_1-18G_Horn - HORIZONTAL
Power : AC 230V/50Hz Note : Mode 1
Frequency
(MHz)
Correct Factor
(dB)
Reading Level
(dBuV)
Measure Level
(dBuV/m)
Margin
(dB)
Limit
(dBuV/m)
Detector Type
1 1034.000 -6.526 53.510 46.984 -23.016 70.000 PEAK
2 1542.000 -5.023 51.240 46.217 -23.783 70.000 PEAK
3 * 2065.000 -3.525 53.300 49.774 -20.226 70.000 PEAK
Note:
1. All Readings below 1GHz are Quasi-Peak, above are performed with peak and/or
average measurements as necessary.
2. " * ", means this data is the worst emission level.
3. Measurement Level = Reading Level + Correct Factor

Report No:099053R-ITCEP07V06
Page: 65 of 123
Site : 9x6x6_Chamber Time : 2009/09/02 - 09:35
Limit : EN55022_B_(Above_1G)_3M_PK Margin : 6
EUT : Notebook Probe : 9120D_1-18G_Horn - VERTICAL
Power : AC 230V/50Hz Note : Mode 1
Frequency
(MHz)
Correct Factor
(dB)
Reading Level
(dBuV)
Measure Level
(dBuV/m)
Margin
(dB)
Limit
(dBuV/m)
Detector Type
1 1039.000 -6.515 52.300 45.785 -24.215 70.000 PEAK
2 1542.000 -5.023 52.100 47.077 -22.923 70.000 PEAK
3 * 2015.000 -3.724 52.000 48.277 -21.723 70.000 PEAK
Note:
1. All Readings below 1GHz are Quasi-Peak, above are performed with peak and/or
average measurements as necessary.
2. " * ", means this data is the worst emission level.
3. Measurement Level = Reading Level + Correct Factor

Report No:099053R-ITCEP07V06
Page: 66 of 123
Site : 9x6x6_Chamber Time : 2009/09/26 - 13:20
Limit : EN55022_B_(Above_1G)_3M_PK Margin : 6
EUT : Notebook Probe : 9120D_1-18G_Horn - HORIZONTAL
Power : AC 230V 50Hz Note : Mode 3
Frequency
(MHz)
Correct Factor
(dB)
Reading Level
(dBuV)
Measure Level
(dBuV/m)
Margin
(dB)
Limit
(dBuV/m)
Detector Type
1 1035.180 -6.523 54.590 48.066 -21.934 70.000 PEAK
2 1544.790 -5.021 52.320 47.299 -22.701 70.000 PEAK
3 * 2071.170 -3.498 52.940 49.442 -20.558 70.000 PEAK
Note:
1. All Readings below 1GHz are Quasi-Peak, above are performed with peak and/or
average measurements as necessary.
2. " * ", means this data is the worst emission level.
3. Measurement Level = Reading Level + Correct Factor

Report No:099053R-ITCEP07V06
Page: 67 of 123
Site : 9x6x6_Chamber Time : 2009/09/26 - 13:29
Limit : EN55022_B_(Above_1G)_3M_PK Margin : 6
EUT : Notebook Probe : 9120D_1-18G_Horn - VERTICAL
Power : AC 230V 50Hz Note : Mode 3
Frequency
(MHz)
Correct Factor
(dB)
Reading Level
(dBuV)
Measure Level
(dBuV/m)
Margin
(dB)
Limit
(dBuV/m)
Detector Type
1 1041.750 -6.507 53.180 46.672 -23.328 70.000 PEAK
2 1539.500 -5.025 51.790 46.764 -23.236 70.000 PEAK
3 * 2018.390 -3.712 53.140 49.428 -20.572 70.000 PEAK
Note:
1. All Readings below 1GHz are Quasi-Peak, above are performed with peak and/or
average measurements as necessary.
2. " * ", means this data is the worst emission level.
3. Measurement Level = Reading Level + Correct Factor

Report No:099053R-ITCEP07V06
Page: 68 of 123
5.7. Test Photograph Test Mode : Mode 1
Description : Front View of Radiated Test
Test Mode : Mode 1
Description : Back View of Radiated Test
Report No:099053R-ITCEP07V06
Page: 69 of 123
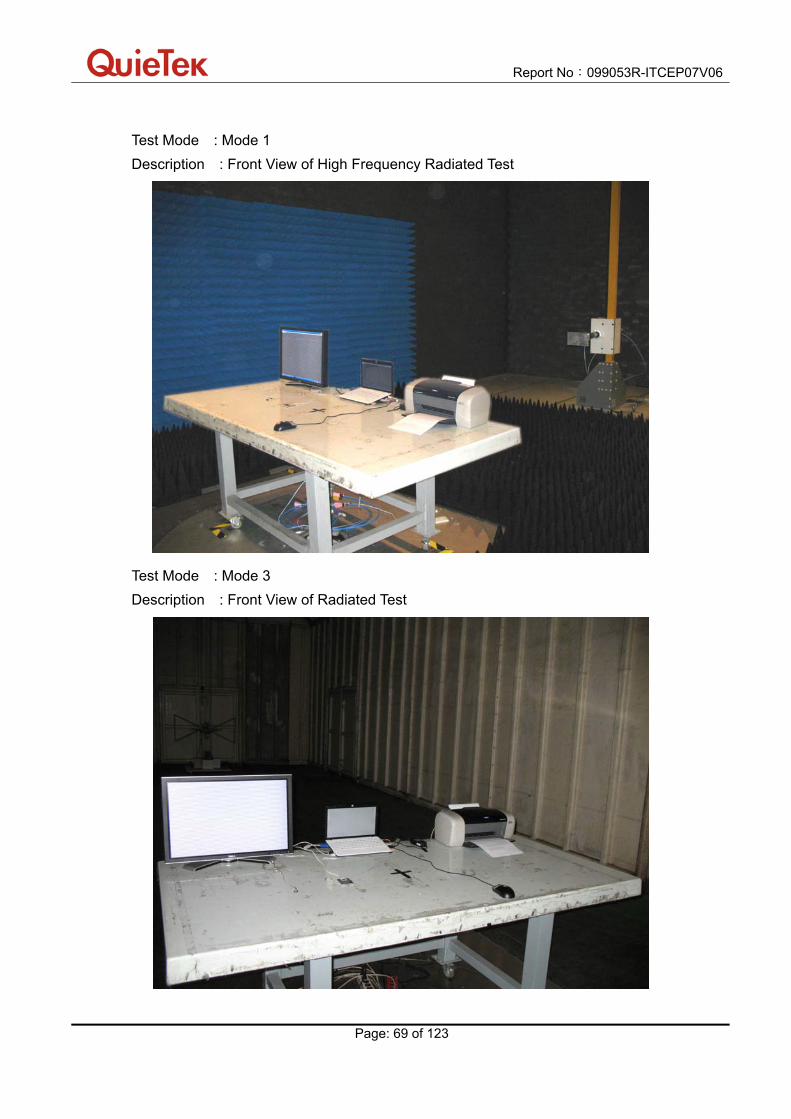
Test Mode : Mode 1
Description : Front View of High Frequency Radiated Test
Test Mode : Mode 3
Description : Front View of Radiated Test
Report No:099053R-ITCEP07V06
Page: 70 of 123
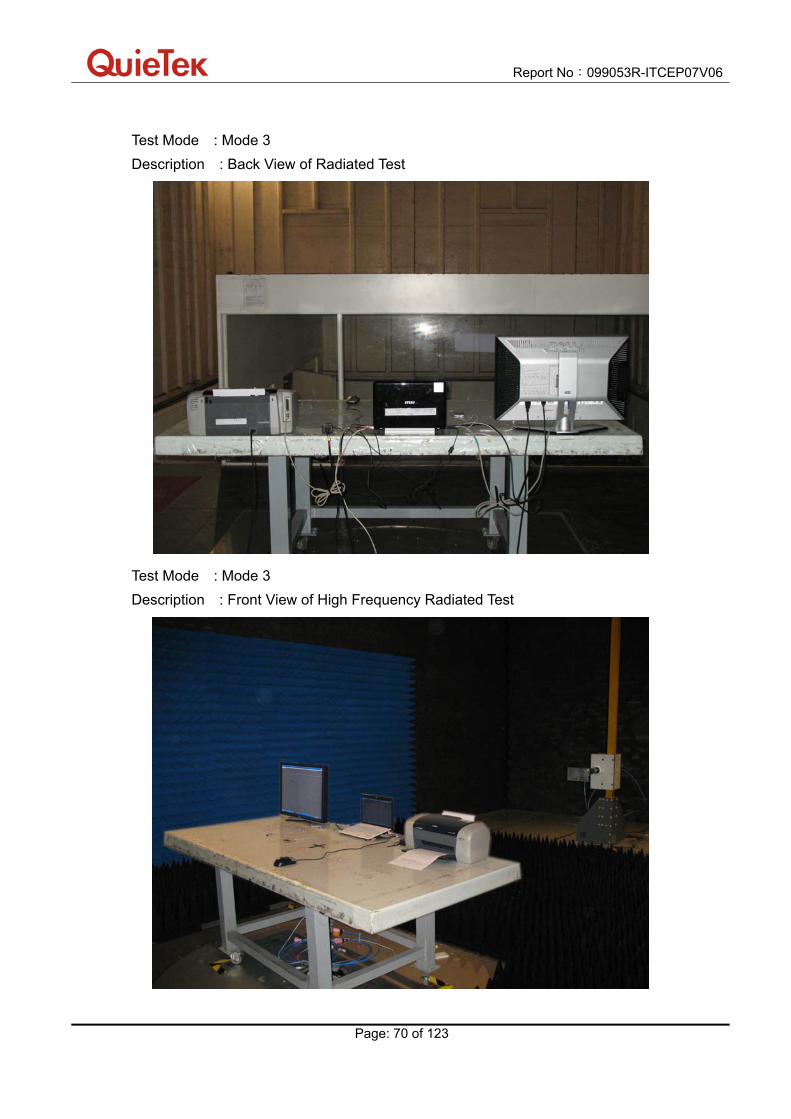
Test Mode : Mode 3
Description : Back View of Radiated Test
Test Mode : Mode 3
Description : Front View of High Frequency Radiated Test

Report No:099053R-ITCEP07V06
Page: 71 of 123
6. Harmonic Current Emission
6.1. Test Specification
According to EMC Standard : EN 61000-3-2
6.2. Test Setup
6.3. Limit
(a) Limits of Class A Harmonics Currents
Harmonics
Order
n
Maximum Permissible
harmonic current
A
Harmonics
Order
n
Maximum Permissible
harmonic current
A
Odd harmonics Even harmonics
3 2.30 2 1.08
5 1.14 4 0.43
7 0.77 6 0.30
9 0.40 8 n 40 0.23 * 8/n
11 0.33
13 0.21
15 n 39 0.15 * 15/n

Report No:099053R-ITCEP07V06
Page: 72 of 123
(b) Limits of Class B Harmonics Currents
For Class B equipment, the harmonic of the input current shall not exceed the maximum
permissible values given in table that is the limit of Class A multiplied by a factor of 1.5.
(c) Limits of Class C Harmonics Currents
Harmonics Order
n
Maximum Permissible harmonic current
Expressed as a percentage of the input
current at the fundamental frequency
%
2 2
3 30.λ*
5 10
7 7
9 5
11 n 39
(odd harmonics only) 3
*λ is the circuit power factor
(d) Limits of Class D Harmonics Currents
Harmonics Order
n
Maximum Permissible
harmonic current per watt
mA/W
Maximum Permissible
harmonic current
A
3 3.4 2.30
5 1.9 1.14
7 1.0 0.77
9 0.5 0.40
11 0.35 0.33
11 n 39
(odd harmonics only) 3.85/n See limit of Class A

Report No:099053R-ITCEP07V06
Page: 73 of 123
6.4. Test Procedure
The EUT is supplied in series with power analyzer from a power source having the same
normal voltage and frequency as the rated supply voltage and the equipment under test.
And the rated voltage at the supply voltage of EUT of 0.94 times and 1.06 times shall be
performed.
6.5. Deviation from Test Standard
No deviation.
Report No:099053R-ITCEP07V06
Page: 74 of 123
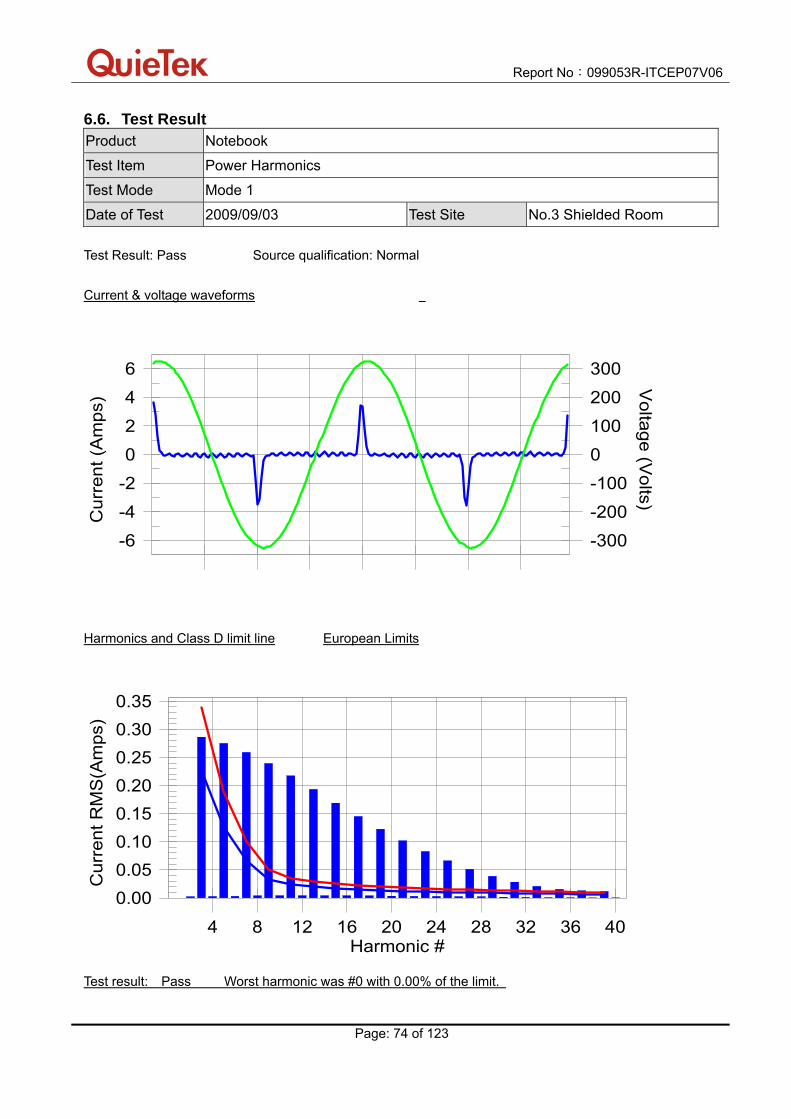
6.6. Test Result Product Notebook
Test Item Power Harmonics
Test Mode Mode 1
Date of Test 2009/09/03 Test Site No.3 Shielded Room
Test Result: Pass Source qualification: Normal
Current & voltage waveforms
-6
-4
-2
0
2
4
6
-300
-200
-100
0
100
200
300
Cu
rre
nt (A
mp
s)
Vo
ltag
e (V
olts)
Harmonics and Class D limit line European Limits
0.00
0.05
0.10
0.15
0.20
0.25
0.30
0.35
Cu
rre
nt R
MS
(Am
ps)
Harmonic #4 8 12 16 20 24 28 32 36 40
Test result: Pass Worst harmonic was #0 with 0.00% of the limit.
Report No:099053R-ITCEP07V06
Page: 75 of 123
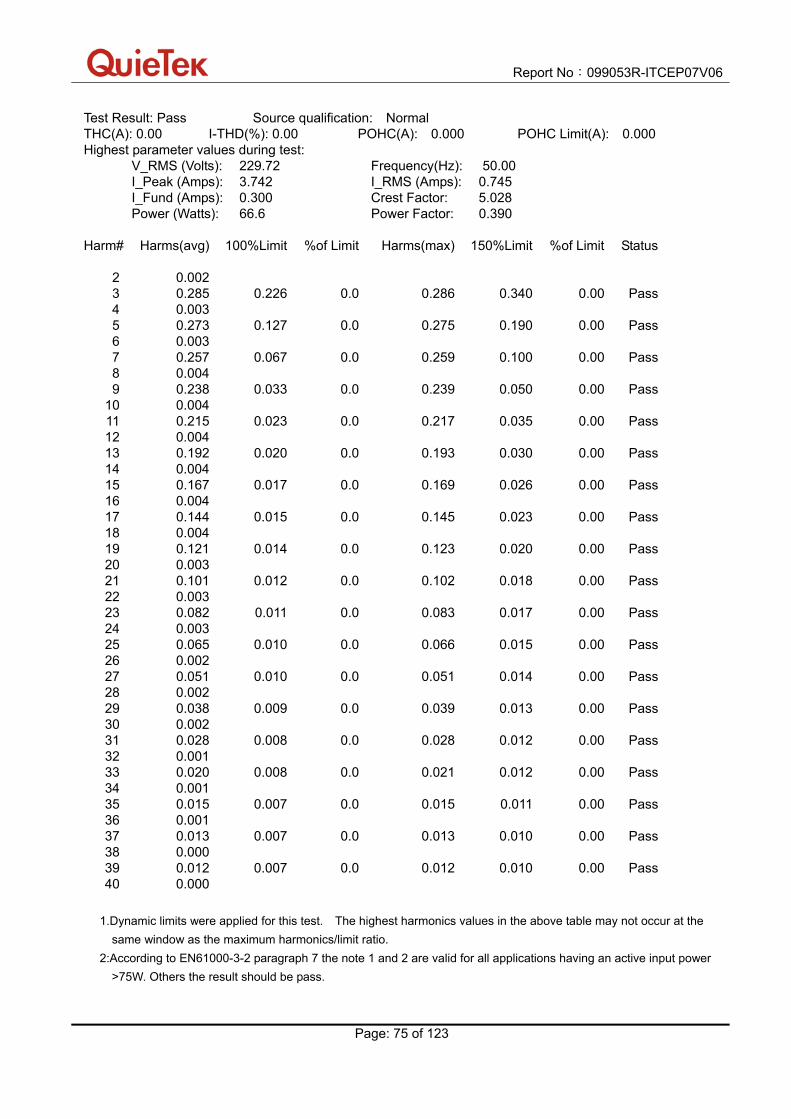
Test Result: Pass Source qualification: Normal THC(A): 0.00 I-THD(%): 0.00 POHC(A): 0.000 POHC Limit(A): 0.000 Highest parameter values during test:
V_RMS (Volts): 229.72 Frequency(Hz): 50.00 I_Peak (Amps): 3.742 I_RMS (Amps): 0.745 I_Fund (Amps): 0.300 Crest Factor: 5.028 Power (Watts): 66.6 Power Factor: 0.390
Harm# Harms(avg) 100%Limit %of Limit Harms(max) 150%Limit %of Limit Status 2 0.002 3 0.285 0.226 0.0 0.286 0.340 0.00 Pass 4 0.003 5 0.273 0.127 0.0 0.275 0.190 0.00 Pass 6 0.003 7 0.257 0.067 0.0 0.259 0.100 0.00 Pass 8 0.004 9 0.238 0.033 0.0 0.239 0.050 0.00 Pass 10 0.004 11 0.215 0.023 0.0 0.217 0.035 0.00 Pass 12 0.004 13 0.192 0.020 0.0 0.193 0.030 0.00 Pass 14 0.004 15 0.167 0.017 0.0 0.169 0.026 0.00 Pass 16 0.004 17 0.144 0.015 0.0 0.145 0.023 0.00 Pass 18 0.004 19 0.121 0.014 0.0 0.123 0.020 0.00 Pass 20 0.003 21 0.101 0.012 0.0 0.102 0.018 0.00 Pass 22 0.003 23 0.082 0.011 0.0 0.083 0.017 0.00 Pass 24 0.003 25 0.065 0.010 0.0 0.066 0.015 0.00 Pass 26 0.002 27 0.051 0.010 0.0 0.051 0.014 0.00 Pass 28 0.002 29 0.038 0.009 0.0 0.039 0.013 0.00 Pass 30 0.002 31 0.028 0.008 0.0 0.028 0.012 0.00 Pass 32 0.001 33 0.020 0.008 0.0 0.021 0.012 0.00 Pass 34 0.001 35 0.015 0.007 0.0 0.015 0.011 0.00 Pass 36 0.001 37 0.013 0.007 0.0 0.013 0.010 0.00 Pass 38 0.000 39 0.012 0.007 0.0 0.012 0.010 0.00 Pass 40 0.000
1.Dynamic limits were applied for this test. The highest harmonics values in the above table may not occur at the
same window as the maximum harmonics/limit ratio.
2:According to EN61000-3-2 paragraph 7 the note 1 and 2 are valid for all applications having an active input power
>75W. Others the result should be pass.

Report No:099053R-ITCEP07V06
Page: 76 of 123
Product Notebook
Test Item Power Harmonics
Test Mode Mode 3
Date of Test 2009/09/29 Test Site No.3 Shielded Room
Test Result: Pass Source qualification: Normal
Current & voltage waveforms
-6
-4
-2
0
2
4
6
-300
-200
-100
0
100
200
300
Cu
rre
nt (A
mp
s)
Vo
ltag
e (V
olts)
Harmonics and Class D limit line European Limits
0.00
0.05
0.10
0.15
0.20
0.25
0.30
0.35
Cu
rre
nt R
MS
(Am
ps)
Harmonic #4 8 12 16 20 24 28 32 36 40
Test result: Pass Worst harmonic was #0 with 0.00% of the limit.

Report No:099053R-ITCEP07V06
Page: 77 of 123
Test Result: Pass Source qualification: Normal THC(A): 0.00 I-THD(%): 0.00 POHC(A): 0.000 POHC Limit(A): 0.000 Highest parameter values during test:
V_RMS (Volts): 229.74 Frequency(Hz): 50.00 I_Peak (Amps): 3.649 I_RMS (Amps): 0.735 I_Fund (Amps): 0.300 Crest Factor: 4.993 Power (Watts): 66.8 Power Factor: 0.397
Harm# Harms(avg) 100%Limit %of Limit Harms(max) 150%Limit %of Limit Status 2 0.002 3 0.284 0.227 0.0 0.282 0.341 0.00 Pass 4 0.002 5 0.272 0.127 0.0 0.271 0.190 0.00 Pass 6 0.003 7 0.255 0.067 0.0 0.254 0.100 0.00 Pass 8 0.003 9 0.234 0.033 0.0 0.234 0.050 0.00 Pass 10 0.004 11 0.211 0.023 0.0 0.211 0.035 0.00 Pass 12 0.004 13 0.186 0.020 0.0 0.187 0.030 0.00 Pass 14 0.004 15 0.161 0.017 0.0 0.162 0.026 0.00 Pass 16 0.004 17 0.137 0.015 0.0 0.139 0.023 0.00 Pass 18 0.004 19 0.114 0.014 0.0 0.116 0.020 0.00 Pass 20 0.003 21 0.094 0.012 0.0 0.096 0.018 0.00 Pass 22 0.003 23 0.076 0.011 0.0 0.078 0.017 0.00 Pass 24 0.003 25 0.060 0.010 0.0 0.062 0.015 0.00 Pass 26 0.002 27 0.047 0.010 0.0 0.048 0.014 0.00 Pass 28 0.002 29 0.035 0.009 0.0 0.036 0.013 0.00 Pass 30 0.001 31 0.026 0.008 0.0 0.027 0.012 0.00 Pass 32 0.001 33 0.020 0.008 0.0 0.020 0.012 0.00 Pass 34 0.001 35 0.016 0.007 0.0 0.015 0.011 0.00 Pass 36 0.001 37 0.013 0.007 0.0 0.013 0.010 0.00 Pass 38 0.000 39 0.012 0.007 0.0 0.012 0.010 0.00 Pass 40 0.000
1.Dynamic limits were applied for this test. The highest harmonics values in the above table may not occur at the
same window as the maximum harmonics/limit ratio.
2:According to EN61000-3-2 paragraph 7 the note 1 and 2 are valid for all applications having an active input power
>75W. Others the result should be pass.
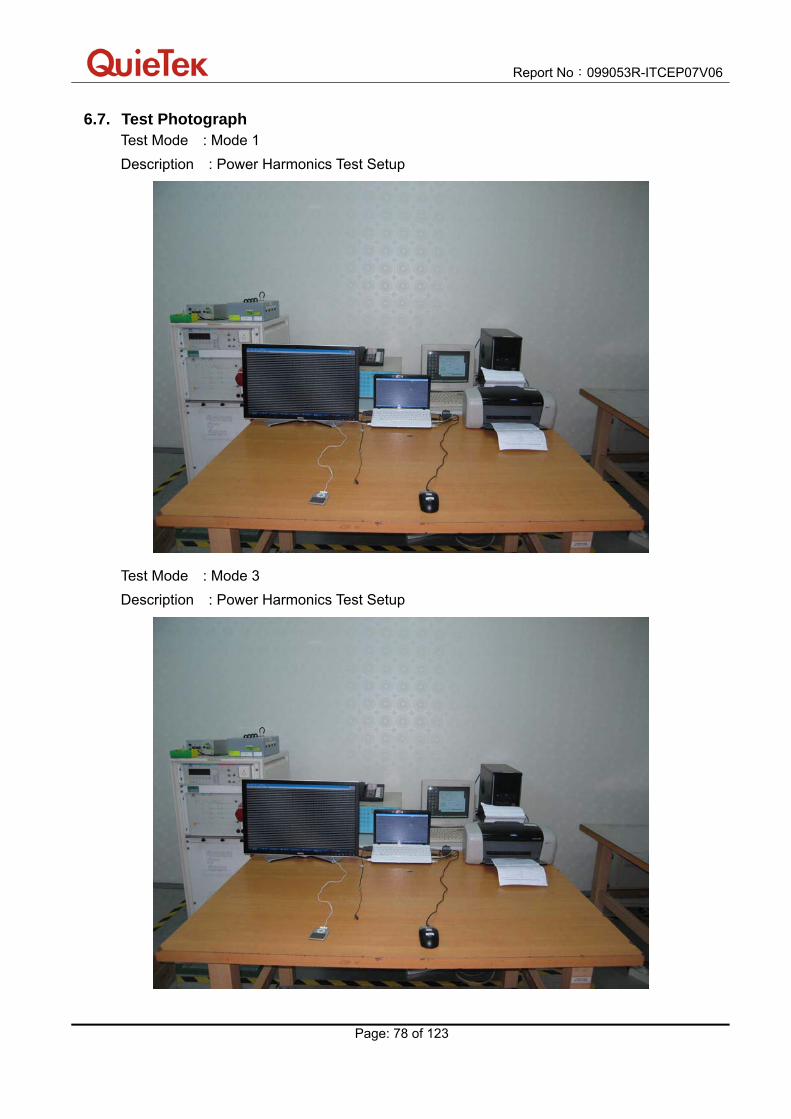
Report No:099053R-ITCEP07V06
Page: 78 of 123
6.7. Test Photograph Test Mode : Mode 1
Description : Power Harmonics Test Setup
Test Mode : Mode 3
Description : Power Harmonics Test Setup

Report No:099053R-ITCEP07V06
Page: 79 of 123
7. Voltage Fluctuation and Flicker
7.1. Test Specification
According to EMC Standard : EN 61000-3-3
7.2. Test Setup
7.3. Limit
The following limits apply:
- the value of Pst shall not be greater than 1.0;
- the value of Plt shall not be greater than 0.65;
- the value of d(t) during a voltage change shall not exceed 3.3 % for more than 500
ms;
- the relative steady-state voltage change, dc, shall not exceed 3.3 %;
- the maximum relative voltage change, dmax, shall not exceed;
a) 4 % without additional conditions;
b) 6 % for equipment which is:
- switched manually, or
- switched automatically more frequently than twice per day, and also has either a
delayed restart (the delay being not less than a few tens of seconds), or manual restart,
after a power supply interruption.
NOTE The cycling frequency will be further limited by the Pst and P1t limit.
For example: a dmax of 6%producing a rectangular voltage change characteristic twice per
hour will give a P1t of about 0.65.

Report No:099053R-ITCEP07V06
Page: 80 of 123
c) 7 % for equipment which is:
- attended whilst in use (for example: hair dryers, vacuum cleaners, kitchen equipment
such as mixers, garden equipment such as lawn mowers, portable tools such as
electric drills), or
- switched on automatically, or is intended to be switched on manually, no more than
twice per day, and also has either a delayed restart (the delay being not less than a
few tens of seconds) or manual restart, after a power supply interruption.
Pst and P1t requirements shall not be applied to voltage changes caused by manual switching.
7.4. Test Procedure
The EUT is supplied in series with power analyzer from a power source having the same
normal voltage and frequency as the rated supply voltage and the equipment under test.
And the rated voltage at the supply voltage of EUT of 0.94 times and 1.06 times shall be
performed.
7.5. Deviation from Test Standard
No deviation.

Report No:099053R-ITCEP07V06
Page: 81 of 123
7.6. Test Result Product Notebook
Test Item Voltage Fluctuation and Flicker
Test Mode Mode 1
Date of Test 2009/09/03 Test Site No.3 Shielded Room
Test Result: Pass Status: Test Completed
Psti and limit line European Limits
0.25
0.50
0.75
1.00
Pst
18:0
7:4
3
Plt and limit line
0.00
0.25
0.50
Plt
18:0
7:4
3
Parameter values recorded during the test: Vrms at the end of test (Volt): 229.60 Highest dt (%): 0.00 Test limit (%): 3.30 Pass Time(mS) > dt: 0.0 Test limit (mS): 500.0 Pass Highest dc (%): 0.00 Test limit (%): 3.30 Pass Highest dmax (%): 0.00 Test limit (%): 4.00 Pass Highest Pst (10 min. period): 0.064 Test limit: 1.000 Pass Highest Plt (2 hr. period): 0.028 Test limit: 0.650 Pass

Report No:099053R-ITCEP07V06
Page: 82 of 123
Product Notebook
Test Item Voltage Fluctuation and Flicker
Test Mode Mode 3
Date of Test 2009/09/29 Test Site No.3 Shielded Room
Test Result: Pass Status: Test Completed
Psti and limit line European Limits
0.25
0.50
0.75
1.00
Pst
9:5
9:4
1
Plt and limit line
0.00
0.25
0.50
Plt
9:5
9:4
1
Parameter values recorded during the test: Vrms at the end of test (Volt): 229.51 Highest dt (%): 0.00 Test limit (%): 3.30 Pass Time(mS) > dt: 0.0 Test limit (mS): 500.0 Pass Highest dc (%): 0.00 Test limit (%): 3.30 Pass Highest dmax (%): 0.00 Test limit (%): 4.00 Pass Highest Pst (10 min. period): 0.064 Test limit: 1.000 Pass Highest Plt (2 hr. period): 0.028 Test limit: 0.650 Pass

Report No:099053R-ITCEP07V06
Page: 83 of 123
7.7. Test Photograph Test Mode : Mode 1
Description : Flicker Test Setup
Test Mode : Mode 3
Description : Flicker Test Setup

Report No:099053R-ITCEP07V06
Page: 84 of 123
8. Electrostatic Discharge
8.1. Test Specification
According to Standard : IEC 61000-4-2
8.2. Test Setup
8.3. Limit
Item Environmental
Phenomena
Units Test Specification Performance
Criteria
Enclosure Port
Electrostatic Discharge kV(Charge Voltage) ±8 Air Discharge
±4 Contact Discharge B
Report No:099053R-ITCEP07V06
Page: 85 of 123
8.4. Test Procedure
Direct application of discharges to the EUT:
Contact discharge was applied only to conductive surfaces of the EUT.
Air discharges were applied only to non-conductive surfaces of the EUT.
During the test, it was performed with single discharges. For the single discharge
time between successive single discharges will be keep longer 1 second. It was at
least ten single discharges with positive and negative at the same selected point.
The selected point, which was performed with electrostatic discharge, was marked
on the red label of the EUT.
Indirect application of discharges to the EUT:
Vertical Coupling Plane (VCP):
The coupling plane, of dimensions 0.5m x 0.5m, is placed parallel to, and positioned
at a distance 0.1m from, the EUT, with the Discharge Electrode touching the
coupling plane.
The four faces of the EUT will be performed with electrostatic discharge. It was at
least ten single discharges with positive and negative at the same selected point.
Horizontal Coupling Plane (HCP):
The coupling plane is placed under to the EUT. The generator shall be positioned
vertically at a distance of 0.1m from the EUT, with the Discharge Electrode touching
the coupling plane.
The four faces of the EUT will be performed with electrostatic discharge. It was at
least ten single discharges with positive and negative at the same selected point.
8.5. Deviation from Test Standard
No deviation.

Report No:099053R-ITCEP07V06
Page: 86 of 123
8.6. Test Result Product Notebook
Test Item Electrostatic Discharge
Test Mode Mode 1
Date of Test 2009/09/03 Test Site No.3 Shielded Room
Item Amount of
Discharge Voltage
Required
Criteria
Complied To
Criteria
(A,B,C)
Results
Air Discharge 10
10
+8kV
-8kV
B
B
B
B
Pass
Pass
Contact Discharge 25
25
+4kV
-4kV
B
B
A
A
Pass
Pass
Indirect Discharge
(HCP)
25
25
+4kV
-4kV
B
B
A
A
Pass
Pass
Indirect Discharge
(VCP Front)
25
25
+4kV
-4kV
B
B
A
A
Pass
Pass
Indirect Discharge
(VCP Left)
25
25
+4kV
-4kV
B
B
A
A
Pass
Pass
Indirect Discharge
(VCP Back)
25
25
+4kV
-4kV
B
B
A
A
Pass
Pass
Indirect Discharge
(VCP Right)
25
25
+4kV
-4kV
B
B
A
A
Pass
Pass
Note:
The testing performed is from lowest level up to the highest level as required by standard, but only
highest level is shown on the report.
NR: No Requirement Meet criteria A: Operate as intended during and after the test Meet criteria B: Operate as intended after the test Meet criteria C: Loss/Error of function Additional Information
EUT stopped operation and could / could not be reset by operator at kV. No false alarms or other malfunctions were observed during or after the test.
Remark:
The Contact discharges were applied at least total 200 discharges at a minimum of four test points.

Report No:099053R-ITCEP07V06
Page: 87 of 123
Product Notebook
Test Item Electrostatic Discharge
Test Mode Mode 3
Date of Test 2009/09/29 Test Site No.3 Shielded Room
Item Amount of
Discharge Voltage
Required
Criteria
Complied To
Criteria
(A,B,C)
Results
Air Discharge 10
10
+8kV
-8kV
B
B
B
B
Pass
Pass
Contact Discharge 25
25
+4kV
-4kV
B
B
A
A
Pass
Pass
Indirect Discharge
(HCP)
25
25
+4kV
-4kV
B
B
A
A
Pass
Pass
Indirect Discharge
(VCP Front)
25
25
+4kV
-4kV
B
B
A
A
Pass
Pass
Indirect Discharge
(VCP Left)
25
25
+4kV
-4kV
B
B
A
A
Pass
Pass
Indirect Discharge
(VCP Back)
25
25
+4kV
-4kV
B
B
A
A
Pass
Pass
Indirect Discharge
(VCP Right)
25
25
+4kV
-4kV
B
B
A
A
Pass
Pass
Note:
The testing performed is from lowest level up to the highest level as required by standard, but only
highest level is shown on the report.
NR: No Requirement Meet criteria A: Operate as intended during and after the test Meet criteria B: Operate as intended after the test Meet criteria C: Loss/Error of function Additional Information
EUT stopped operation and could / could not be reset by operator at kV. No false alarms or other malfunctions were observed during or after the test.
Remark:
The Contact discharges were applied at least total 200 discharges at a minimum of four test points.

Report No:099053R-ITCEP07V06
Page: 88 of 123
8.7. Test Photograph Test Mode : Mode 1
Description : ESD Test Setup
Test Mode : Mode 3
Description : ESD Test Setup

Report No:099053R-ITCEP07V06
Page: 89 of 123
9. Radiated Susceptibility
9.1. Test Specification
According to Standard : IEC 61000-4-3
9.2. Test Setup
9.3. Limit
Item Environmental
Phenomena
Units Test
Specification
Performance
Criteria
Enclosure Port
Radio-Frequency
Electromagnetic Field
Amplitude Modulated
MHz
V/m(Un-modulated, rms)
% AM (1kHz)
80-1000
3
80
A

Report No:099053R-ITCEP07V06
Page: 90 of 123
9.4. Test Procedure
The EUT and load, which are placed on a table that is 0.8 meter above ground, are
placed with one coincident with the calibration plane such that the distance from
antenna to the EUT was 3 meters.
Both horizontal and vertical polarization of the antenna and four sides of the EUT are set
on measurement.
In order to judge the EUT performance, a CCD camera is used to monitor EUT screen.
All the scanning conditions are as follows:
Condition of Test Remarks
1. Field Strength 3 V/m Level 2
2. Radiated Signal AM 80% Modulated with 1kHz
3. Scanning Frequency 80MHz - 1000MHz
4 Dwell Time 3 Seconds
5. Frequency step size f : 1%
6. The rate of Swept of Frequency 1.5 x 10⁻³ decades/s
9.5. Deviation from Test Standard
No deviation.

Report No:099053R-ITCEP07V06
Page: 91 of 123
9.6. Test Result Product Notebook
Test Item Radiated susceptibility
Test Mode Mode 1
Date of Test 2009/09/03 Test Site Chamber5
Frequency
(MHz)
Position
(Angle) Polarity
(H or V)
Field
Strength
(V/m)
Required
Criteria
Complied To
Criteria
(A,B,C)
Results
80-1000 FRONT H 3 A A PASS
80-1000 FRONT V 3 A A PASS
80-1000 BACK H 3 A A PASS
80-1000 BACK V 3 A A PASS
80-1000 RIGHT H 3 A A PASS
80-1000 RIGHT V 3 A A PASS
80-1000 LEFT H 3 A A PASS
80-1000 LEFT V 3 A A PASS
80-1000 UP H 3 A A PASS
80-1000 UP V 3 A A PASS
80-1000 DOWN H 3 A A PASS
80-1000 DOWN V 3 A A PASS
Note:
The testing performed is from lowest level up to the highest level as required by standard, but
only highest level is shown on the report.
Meet criteria A: Operate as intended during and after the test Meet criteria B: Operate as intended after the test Meet criteria C: Loss/Error of function Additional Information
There was no observable degradation in performance. EUT stopped operation and could / could not be reset by operator at V/m
at frequency MHz.
No false alarms or other malfunctions were observed during or after the test.
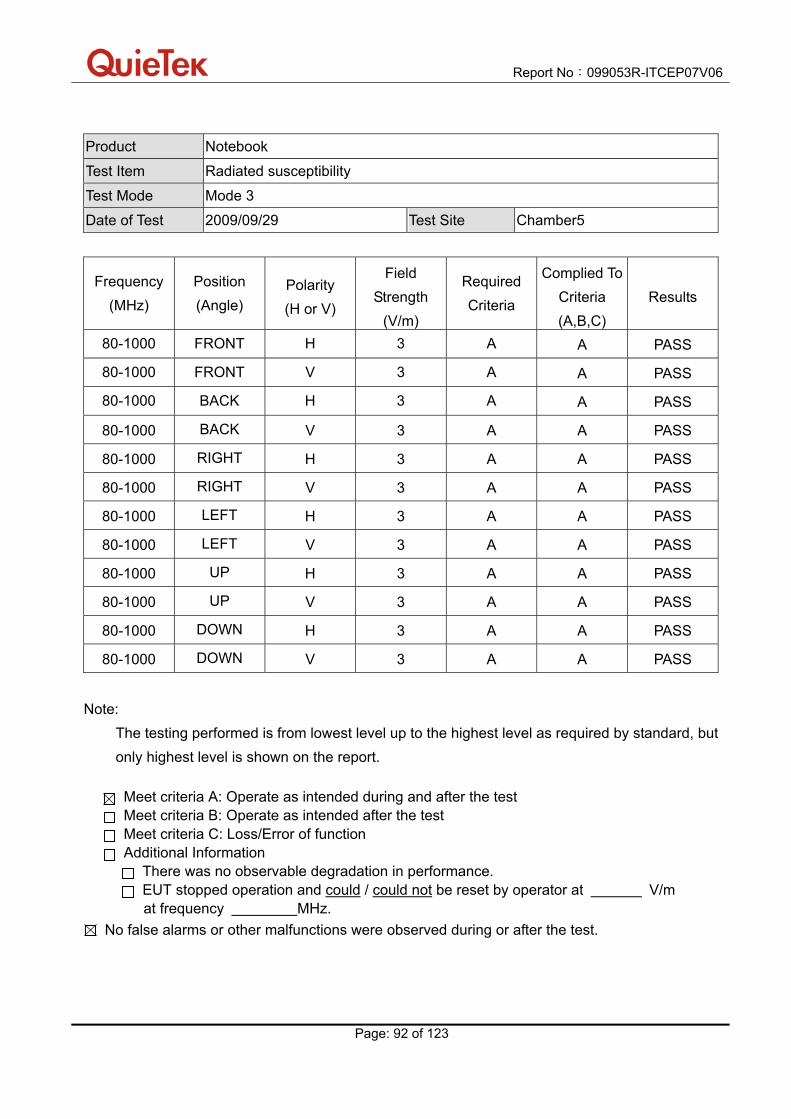
Report No:099053R-ITCEP07V06
Page: 92 of 123
Product Notebook
Test Item Radiated susceptibility
Test Mode Mode 3
Date of Test 2009/09/29 Test Site Chamber5
Frequency
(MHz)
Position
(Angle) Polarity
(H or V)
Field
Strength
(V/m)
Required
Criteria
Complied To
Criteria
(A,B,C)
Results
80-1000 FRONT H 3 A A PASS
80-1000 FRONT V 3 A A PASS
80-1000 BACK H 3 A A PASS
80-1000 BACK V 3 A A PASS
80-1000 RIGHT H 3 A A PASS
80-1000 RIGHT V 3 A A PASS
80-1000 LEFT H 3 A A PASS
80-1000 LEFT V 3 A A PASS
80-1000 UP H 3 A A PASS
80-1000 UP V 3 A A PASS
80-1000 DOWN H 3 A A PASS
80-1000 DOWN V 3 A A PASS
Note:
The testing performed is from lowest level up to the highest level as required by standard, but
only highest level is shown on the report.
Meet criteria A: Operate as intended during and after the test Meet criteria B: Operate as intended after the test Meet criteria C: Loss/Error of function Additional Information
There was no observable degradation in performance. EUT stopped operation and could / could not be reset by operator at V/m
at frequency MHz.
No false alarms or other malfunctions were observed during or after the test.

Report No:099053R-ITCEP07V06
Page: 93 of 123
9.7. Test Photograph Test Mode : Mode 1
Description : Radiated Susceptibility Test Setup
Test Mode : Mode 3
Description : Radiated Susceptibility Test Setup

Report No:099053R-ITCEP07V06
Page: 94 of 123
10. Electrical Fast Transient/Burst
10.1. Test Specification
According to Standard : IEC 61000-4-4
10.2. Test Setup
10.3. Limit
Item Environmental Phenomena
Units Test Specification Performance Criteria
I/O and communication ports Fast Transients Common Mode
kV (Peak) Tr/Th ns Rep. Frequency kHz
+0.5 5/50 5
B
Input DC Power Ports Fast Transients Common Mode
kV (Peak) Tr/Th ns Rep. Frequency kHz
+0.5 5/50 5
B
Input AC Power Ports Fast Transients Common Mode
kV (Peak) Tr/Th ns Rep. Frequency kHz
+1 5/50 5
B
Report No:099053R-ITCEP07V06
Page: 95 of 123
10.4. Test Procedure
The EUT is placed on a table that is 0.8 meter height. A ground reference plane is placed on
the table, and uses a 0.1m insulation between the EUT and ground reference plane.
The minimum area of the ground reference plane is 1m*1m, and 0.65mm thick min, and
projected beyond the EUT by at least 0.1m on all sides.
Test on I/O and communication ports:
The EFT interference signal is through a coupling clamp device couples to the signal and
control lines of the EUT with burst noise for 1minute.
Test on power supply ports:
The EUT is connected to the power mains through a coupling device that directly couples the
EFT/B interference signal.
Each of the Line and Neutral conductors is impressed with burst noise for 1 minute.
The length of the signal and power lines between the coupling device and the EUT is 0.5m.
10.5. Deviation from Test Standard
No deviation.

Report No:099053R-ITCEP07V06
Page: 96 of 123
10.6. Test Result Product Notebook
Test Item Electrical fast transient/burst
Test Mode Mode 1
Date of Test 2009/09/03 Test Site No.2 Shielded Room
Inject
Line Polarity
Voltage
kV
Inject
Time
(Second)
Inject
Method
Required
Criteria
Complied
to
Criteria Result
L+N+PE ± 1kV 60 Direct B A PASS
LAN ± 0.5 kV 60 Clamp B A PASS
Note:
The testing performed is from lowest level up to the highest level as required by standard, but
only highest level is shown on the report.
Meet criteria A : Operate as intended during and after the test
Meet criteria B : Operate as intended after the test
Meet criteria C : Loss/Error of function
Additional Information
EUT stopped operation and could / could not be reset by operator at kV of
Line .
No false alarms or other malfunctions were observed during or after the test.

Report No:099053R-ITCEP07V06
Page: 97 of 123
Product Notebook
Test Item Electrical fast transient/burst
Test Mode Mode 3
Date of Test 2009/09/29 Test Site No.2 Shielded Room
Inject
Line Polarity
Voltage
kV
Inject
Time
(Second)
Inject
Method
Required
Criteria
Complied
to
Criteria Result
L+N+PE ± 1kV 60 Direct B A PASS
LAN ± 0.5 kV 60 Clamp B A PASS
Note:
The testing performed is from lowest level up to the highest level as required by standard, but
only highest level is shown on the report.
Meet criteria A : Operate as intended during and after the test
Meet criteria B : Operate as intended after the test
Meet criteria C : Loss/Error of function
Additional Information
EUT stopped operation and could / could not be reset by operator at kV of
Line .
No false alarms or other malfunctions were observed during or after the test.

Report No:099053R-ITCEP07V06
Page: 98 of 123
10.7. Test Photograph Test Mode : Mode 1
Description : EFT/B Test Setup
Test Mode : Mode 1
Description : EFT/B Test Setup-Clamp

Report No:099053R-ITCEP07V06
Page: 99 of 123
Test Mode : Mode 3
Description : EFT/B Test Setup
Test Mode : Mode 3
Description : EFT/B Test Setup-Clamp

Report No:099053R-ITCEP07V06
Page: 100 of 123
11. Surge
11.1. Test Specification
According to Standard : IEC 61000-4-5
11.2. Test Setup
11.3. Limit
Item Environmental Phenomena Units Test Specification Performance Criteria
Signal Ports and Telecommunication Ports(See 1) and 2) ) Surges Line to Ground
Tr/Th us kV
1.2/50 (8/20) 1
B
Input DC Power Ports Surges Line to Ground
Tr/Th us kV
1.2/50 (8/20) 0.5
B
AC Input and AC Output Power Ports Surges Line to Line Line to Ground
Tr/Th us kV kV
1.2/50 (8/20) 1 2
B
Notes:
1) Applicable only to ports which according to the manufacturer’s may directly to outdoor
cables.
2) Where normal functioning cannot be achieved because of the impact of the CDN on the
EUT, no immunity test shall be required.

Report No:099053R-ITCEP07V06
Page: 101 of 123
11.4. Test Procedure
The EUT and its load are placed on a table that is 0.8 meter above a metal ground plane
measured 1m*1m min. and 0.65mm thick min. And projected beyond the EUT by at least
0.1m on all sides. The length of power cord between the coupling device and the EUT shall
be 2m or less.
For Input and Output AC Power or DC Input and DC Output Power Ports:
The EUT is connected to the power mains through a coupling device that directly couples the
Surge interference signal.
The surge noise shall be applied synchronized to the voltage phase at 00, 900, 1800, 2700 and
the peak value of the a.c. voltage wave. (Positive and negative)
Each of Line-Earth and Line-Line is impressed with a sequence of five surge voltages with
interval of 1 min.
11.5. Deviation from Test Standard
No deviation.

Report No:099053R-ITCEP07V06
Page: 102 of 123
11.6. Test Result Product Notebook
Test Item Surge
Test Mode Mode 1
Date of Test 2009/09/03 Test Site No.2 Shielded Room
Inject
Line Polarity Angle
Voltage
kV
Time
Interval
(Second)
Inject
Method
Required
Criteria
Complied
to
Criteria Result
L-N ± 0 1kV 60 Direct B A PASS
L-N ± 90 1kV 60 Direct B A PASS
L-N ± 180 1kV 60 Direct B A PASS
L-N ± 270 1kV 60 Direct B A PASS
L-PE ± 0 2kV 60 Direct B A PASS
L-PE ± 90 2kV 60 Direct B A PASS
L-PE ± 180 2kV 60 Direct B A PASS
L-PE ± 270 2kV 60 Direct B A PASS
N-PE ± 0 2kV 60 Direct B A PASS
N-PE ± 90 2kV 60 Direct B A PASS
N-PE ± 180 2kV 60 Direct B A PASS
N-PE ± 270 2kV 60 Direct B A PASS
Note:
The testing performed is from lowest level up to the highest level as required by standard, but
only highest level is shown on the report.
Meet criteria A : Operate as intended during and after the test Meet criteria B : Operate as intended after the test Meet criteria C : Loss/Error of function Additional Information
EUT stopped operation and could / could not be reset by operator at kV of Line .
No false alarms or other malfunctions were observed during or after the test.

Report No:099053R-ITCEP07V06
Page: 103 of 123
Product Notebook
Test Item Surge
Test Mode Mode 3
Date of Test 2009/09/29 Test Site No.2 Shielded Room
Inject
Line Polarity Angle
Voltage
kV
Time
Interval
(Second)
Inject
Method
Required
Criteria
Complied
to
Criteria Result
L-N ± 0 1kV 60 Direct B A PASS
L-N ± 90 1kV 60 Direct B A PASS
L-N ± 180 1kV 60 Direct B A PASS
L-N ± 270 1kV 60 Direct B A PASS
L-PE ± 0 2kV 60 Direct B A PASS
L-PE ± 90 2kV 60 Direct B A PASS
L-PE ± 180 2kV 60 Direct B A PASS
L-PE ± 270 2kV 60 Direct B A PASS
N-PE ± 0 2kV 60 Direct B A PASS
N-PE ± 90 2kV 60 Direct B A PASS
N-PE ± 180 2kV 60 Direct B A PASS
N-PE ± 270 2kV 60 Direct B A PASS
Note:
The testing performed is from lowest level up to the highest level as required by standard, but
only highest level is shown on the report.
Meet criteria A : Operate as intended during and after the test Meet criteria B : Operate as intended after the test Meet criteria C : Loss/Error of function Additional Information
EUT stopped operation and could / could not be reset by operator at kV of Line .
No false alarms or other malfunctions were observed during or after the test.

Report No:099053R-ITCEP07V06
Page: 104 of 123
11.7. Test Photograph Test Mode : Mode 1
Description : SURGE Test Setup
Test Mode : Mode 3
Description : SURGE Test Setup

Report No:099053R-ITCEP07V06
Page: 105 of 123
12. Conducted Susceptibility
12.1. Test Specification
According to Standard : IEC 61000-4-6
12.2. Test Setup
CDN Test Mode
EM Clamp Test Mode

Report No:099053R-ITCEP07V06
Page: 106 of 123
12.3. Limit
Item Environmental Phenomena Units Test Specification
Performance Criteria
Signal Ports and Telecommunication Ports Radio-Frequency Continuous Conducted
MHz V (rms, Un-modulated) % AM (1kHz)
0.15-80 3 80
A
Input DC Power Ports Radio-Frequency Continuous Conducted
MHz V (rms, Un-modulated) % AM (1kHz)
0.15-80 3 80
A
Input AC Power Ports Radio-Frequency Continuous Conducted
MHz V (rms, Un-modulated) % AM (1kHz)
0.15-80 3 80
A
12.4. Test Procedure
The EUT are placed on a table that is 0.8 meter height, and a Ground reference plane on the table, EUT are placed upon table and use a 10cm insulation between the EUT and Ground reference plane. For Signal Ports and Telecommunication Ports The disturbance signal is through a coupling and decoupling networks (CDN) or EM-clamp device couples to the signal and Telecommunication lines of the EUT. For Input DC and AC Power Ports The EUT is connected to the power mains through a coupling and decoupling networks for power supply lines. And directly couples the disturbances signal into EUT. Used CDN-M2 for two wires or CDN-M3 for three wires. All the scanning conditions are as follows: Condition of Test Remarks 1. Field Strength 130dBuV(3V) Level 2 2. Radiated Signal AM 80% Modulated with 1kHz 3. Scanning Frequency 0.15MHz – 80MHz 4 Dwell Time 3 Seconds 5. Frequency step size f : 1% 6. The rate of Swept of Frequency 1.5 x 10⁻³ decades/s
12.5. Deviation from Test Standard
No deviation.

Report No:099053R-ITCEP07V06
Page: 107 of 123
12.6. Test Result Product Notebook
Test Item Conducted susceptibility
Test Mode Mode 1
Date of Test 2009/09/03 Test Site No.6 Shielded Room
Frequency
Range
(MHz)
Voltage
Applied
dBuV(V)
Inject
Method
Tested Port
of
EUT
Required
Criteria
Performance
Criteria
Complied To
Result
0.15~80 130 (3V) CDN AC IN A A PASS
0.15~80 130 (3V) CDN LAN 10/100 A A PASS
0.15~80 130 (3V) CDN GIGA LAN A A PASS
Note:
The testing performed is from lowest level up to the highest level as required by standard, but
only highest level is shown on the report.
Meet criteria A : Operate as intended during and after the test
Meet criteria B : Operate as intended after the test
Meet criteria C : Loss/Error of function
Additional Information
EUT stopped operation and could / could not be reset by operator at dBuV(V) at
frequency MHz.
No false alarms or other malfunctions were observed during or after the test. The
acceptance criteria were met, and the EUT passed the test.

Report No:099053R-ITCEP07V06
Page: 108 of 123
Product Notebook
Test Item Conducted susceptibility
Test Mode Mode 3
Date of Test 2009/09/29 Test Site No.6 Shielded Room
Frequency
Range
(MHz)
Voltage
Applied
dBuV(V)
Inject
Method
Tested Port
of
EUT
Required
Criteria
Performance
Criteria
Complied To
Result
0.15~80 130 (3V) CDN AC IN A A PASS
0.15~80 130 (3V) CDN LAN A A PASS
Note:
The testing performed is from lowest level up to the highest level as required by standard, but
only highest level is shown on the report.
Meet criteria A : Operate as intended during and after the test
Meet criteria B : Operate as intended after the test
Meet criteria C : Loss/Error of function
Additional Information
EUT stopped operation and could / could not be reset by operator at dBuV(V) at
frequency MHz.
No false alarms or other malfunctions were observed during or after the test. The
acceptance criteria were met, and the EUT passed the test.
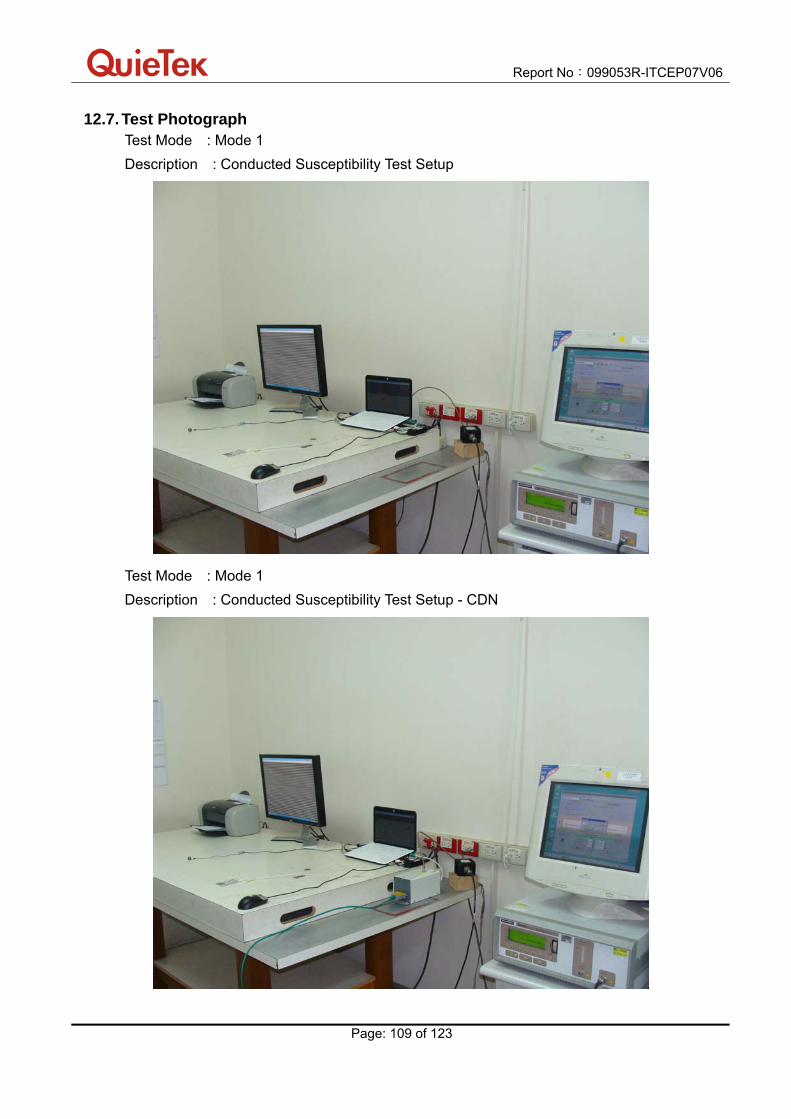
Report No:099053R-ITCEP07V06
Page: 109 of 123
12.7. Test Photograph Test Mode : Mode 1
Description : Conducted Susceptibility Test Setup
Test Mode : Mode 1
Description : Conducted Susceptibility Test Setup - CDN

Report No:099053R-ITCEP07V06
Page: 110 of 123
Test Mode : Mode 3
Description : Conducted Susceptibility Test Setup
Test Mode : Mode 3
Description : Conducted Susceptibility Test Setup - CDN

Report No:099053R-ITCEP07V06
Page: 111 of 123
13. Power Frequency Magnetic Field
13.1. Test Specification
According to Standard : IEC 61000-4-8
13.2. Test Setup
13.3. Limit Item Environmental
Phenomena Units Test Specification Performance
Criteria Enclosure Port Power-Frequency
Magnetic Field Hz A/m (r.m.s.)
50 1
A
13.4. Test Procedure
The EUT and its load are placed on a table which is 0.8 meter above a metal ground
plane measured at least 1m*1m min. The test magnetic field shall be placed at central
of the induction coil.
The test magnetic Field shall be applied 10 minutes by the immersion method to the EUT.
And the induction coil shall be rotated by 90 in order to expose the EUT to the test field
with different orientation (X, Y, Z Orientations).
13.5. Deviation from Test Standard No deviation.
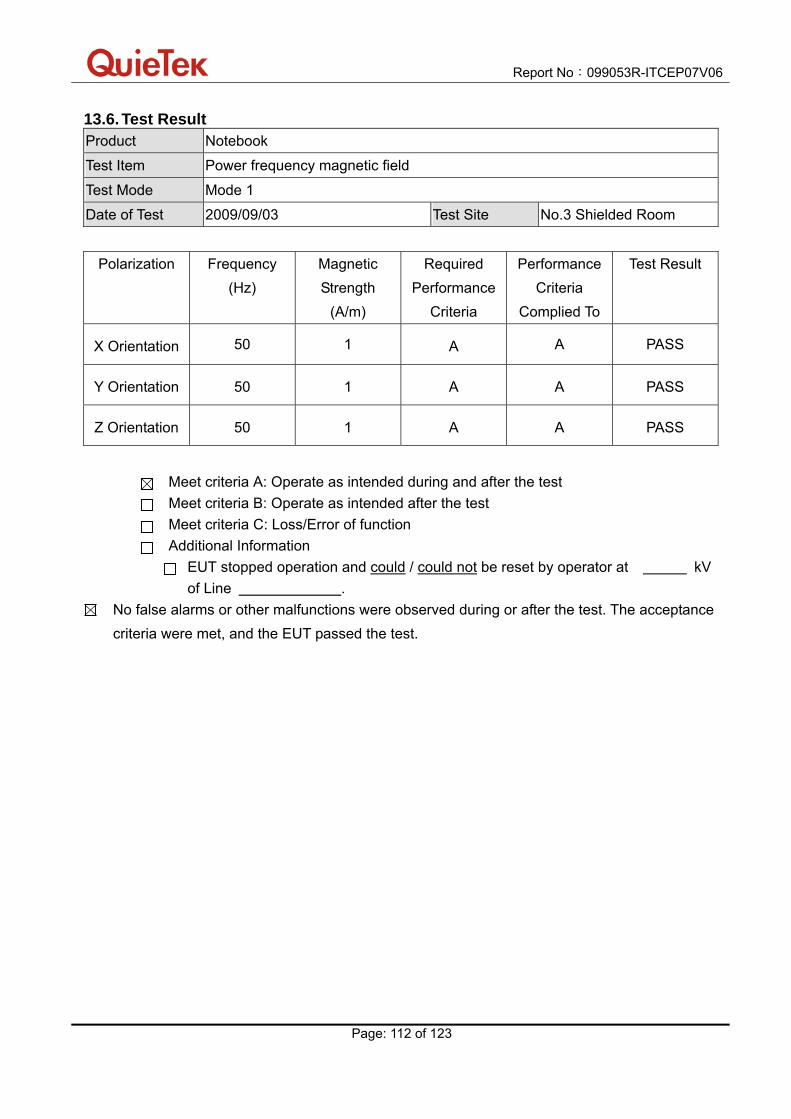
Report No:099053R-ITCEP07V06
Page: 112 of 123
13.6. Test Result Product Notebook
Test Item Power frequency magnetic field
Test Mode Mode 1
Date of Test 2009/09/03 Test Site No.3 Shielded Room
Polarization Frequency
(Hz)
Magnetic
Strength
(A/m)
Required
Performance
Criteria
Performance
Criteria
Complied To
Test Result
X Orientation 50 1 A A PASS
Y Orientation 50 1 A A PASS
Z Orientation 50 1 A A PASS
Meet criteria A: Operate as intended during and after the test
Meet criteria B: Operate as intended after the test
Meet criteria C: Loss/Error of function
Additional Information
EUT stopped operation and could / could not be reset by operator at kV
of Line .
No false alarms or other malfunctions were observed during or after the test. The acceptance
criteria were met, and the EUT passed the test.

Report No:099053R-ITCEP07V06
Page: 113 of 123
Product Notebook
Test Item Power frequency magnetic field
Test Mode Mode 3
Date of Test 2009/09/29 Test Site No.3 Shielded Room
Polarization Frequency
(Hz)
Magnetic
Strength
(A/m)
Required
Performance
Criteria
Performance
Criteria
Complied To
Test Result
X Orientation 50 1 A A PASS
Y Orientation 50 1 A A PASS
Z Orientation 50 1 A A PASS
Meet criteria A: Operate as intended during and after the test
Meet criteria B: Operate as intended after the test
Meet criteria C: Loss/Error of function
Additional Information
EUT stopped operation and could / could not be reset by operator at kV
of Line .
No false alarms or other malfunctions were observed during or after the test. The acceptance
criteria were met, and the EUT passed the test.

Report No:099053R-ITCEP07V06
Page: 114 of 123
13.7. Test Photograph Test Mode : Mode 1
Description : Power Frequency Magnetic Field Test Setup
Test Mode : Mode 3
Description : Power Frequency Magnetic Field Test Setup

Report No:099053R-ITCEP07V06
Page: 115 of 123
14. Voltage Dips and Interruption
14.1. Test Specification
According to Standard : IEC 61000-4-11
14.2. Test Setup
14.3. Limit
Item Environmental
Phenomena
Units Test Specification Performance
Criteria
Input AC Power Ports
% Reduction
Period
30
25 C
Voltage Dips
% Reduction
Period
>95
0.5 B
Voltage Interruptions % Reduction
Period
> 95
250 C

Report No:099053R-ITCEP07V06
Page: 116 of 123
14.4. Test Procedure
The EUT and its load are placed on a table which is 0.8 meter above a metal ground plane
measured 1m*1m min. And 0.65mm thick min. And projected beyond the EUT by at least
0.1m on all sides. The power cord shall be used the shortest power cord as specified by the
manufacturer.
For Voltage Dips/ Interruptions test:
The selection of test voltage is based on the rated power range. If the operation range is
large than 20% of lower power range, both end of specified voltage shall be tested.
Otherwise, the typical voltage specification is selected as test voltage.
The EUT is connected to the power mains through a coupling device that directly couples to
the Voltage Dips and Interruption Generator.
The EUT shall be tested for 30% voltage dip of supplied voltage and duration 25 Periods,
for 95% voltage dip of supplied voltage and duration 0.5 Periods with a sequence of three
voltage dips with intervals of 10 seconds, and for 95% voltage interruption of supplied
voltage and duration 250 Periods with a sequence of three voltage interruptions with
intervals of 10 seconds.
Voltage phase shifting are shall occur at 00, 450, 900 ,1350 ,1800 ,2250, 2700 ,3150 of the
voltage.
14.5. Deviation from Test Standard
No deviation.

Report No:099053R-ITCEP07V06
Page: 117 of 123
14.6. Test Result Product Notebook
Test Item Voltage dips and interruption
Test Mode Mode 1
Date of Test 2009/08/01 Test Site No.2 Shielded Room
Voltage Dips and
Interruption
Reduction(%)
Angle Test Duration
(Periods)
Required
Performance
Criteria
Performance
Criteria
Complied To
Test Result
30 0 25 C A PASS
30 45 25 C A PASS
30 90 25 C A PASS
30 135 25 C A PASS
30 180 25 C A PASS
30 225 25 C A PASS
30 270 25 C A PASS
30 315 25 C A PASS
>95 0 0.5 B A PASS
>95 45 0.5 B A PASS
>95 90 0.5 B A PASS
>95 135 0.5 B A PASS
>95 180 0.5 B A PASS
>95 225 0.5 B A PASS
>95 270 0.5 B A PASS
>95 315 0.5 B A PASS
>95 0 250 C B PASS
>95 45 250 C B PASS
>95 90 250 C B PASS
>95 135 250 C B PASS
>95 180 250 C B PASS
>95 225 250 C B PASS
>95 270 250 C B PASS
>95 315 250 C B PASS
Meet criteria A: Operate as intended during and after the test Meet criteria B: Operate as intended after the test Meet criteria C: Loss/Error of function Additional Information
The nominal voltage of EUT is 230V. EUT stopped operation and could / could not be reset by operator at kV
of Line .
No false alarms or other malfunctions were observed during or after the test. The acceptance
criteria were met, and the EUT passed the test.
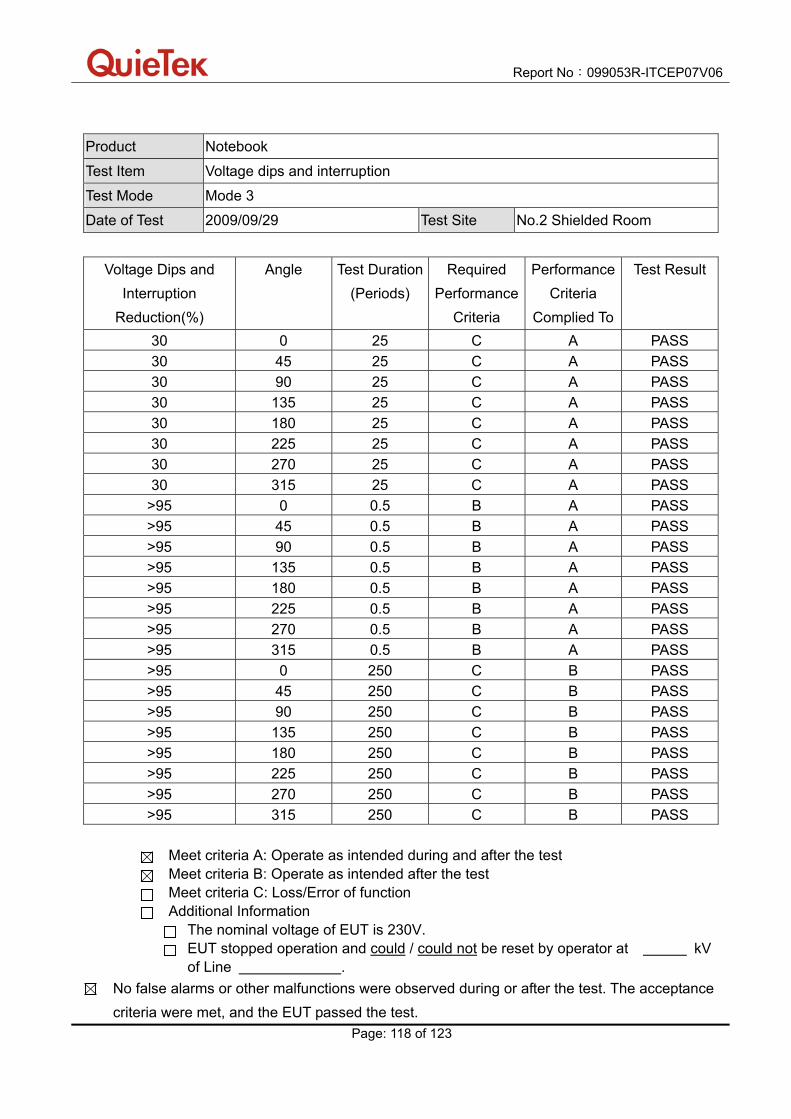
Report No:099053R-ITCEP07V06
Page: 118 of 123
Product Notebook
Test Item Voltage dips and interruption
Test Mode Mode 3
Date of Test 2009/09/29 Test Site No.2 Shielded Room
Voltage Dips and
Interruption
Reduction(%)
Angle Test Duration
(Periods)
Required
Performance
Criteria
Performance
Criteria
Complied To
Test Result
30 0 25 C A PASS
30 45 25 C A PASS
30 90 25 C A PASS
30 135 25 C A PASS
30 180 25 C A PASS
30 225 25 C A PASS
30 270 25 C A PASS
30 315 25 C A PASS
>95 0 0.5 B A PASS
>95 45 0.5 B A PASS
>95 90 0.5 B A PASS
>95 135 0.5 B A PASS
>95 180 0.5 B A PASS
>95 225 0.5 B A PASS
>95 270 0.5 B A PASS
>95 315 0.5 B A PASS
>95 0 250 C B PASS
>95 45 250 C B PASS
>95 90 250 C B PASS
>95 135 250 C B PASS
>95 180 250 C B PASS
>95 225 250 C B PASS
>95 270 250 C B PASS
>95 315 250 C B PASS
Meet criteria A: Operate as intended during and after the test Meet criteria B: Operate as intended after the test Meet criteria C: Loss/Error of function Additional Information
The nominal voltage of EUT is 230V. EUT stopped operation and could / could not be reset by operator at kV
of Line .
No false alarms or other malfunctions were observed during or after the test. The acceptance
criteria were met, and the EUT passed the test.

Report No:099053R-ITCEP07V06
Page: 119 of 123
14.7. Test Photograph Test Mode : Mode 1
Description : Voltage Dips Test Setup
Test Mode : Mode 3
Description : Voltage Dips Test Setup

Report No:099053R-ITCEP07V06
Page: 120 of 123
15. Attachment EUT Photograph
(1) EUT Photo
(2) EUT Photo

Report No:099053R-ITCEP07V06
Page: 121 of 123
(3) EUT Photo
(4) EUT Photo

Report No:099053R-ITCEP07V06
Page: 122 of 123
(5) EUT Photo
(6) EUT Photo

Report No:099053R-ITCEP07V06
Page: 123 of 123
(7) EUT Photo


