
1
2005 guidance update & 2006 targets
December 16, 2005
Robert McFarlaneEVP & Chief Financial Officer

2 all dollars in C$ unless otherwise specified
forward-looking statementsThis presentation and answers to questions contain forward-looking statements that require assumptions about expected future events including competition, financing, financial and operating results and targets that are subject to inherent risks and uncertainties. There is significant risk that predictions and other forward looking statements will not prove to be accurate.
Factors that could cause actual results to differ materially include but are not limited to: economic growth; competition; financing and debt requirements (including share repurchases); tax matters; human resources (including the ongoing impact of introducing the new collective agreement and return to work on operating expenses, customer service and revenue); business integrations; pension performance, funding and expenses; technology (including reliance on systems and information technology); regulatory developments; process risks (including conversion of legacy systems); health and safety; litigation; business continuity events (including man-made and natural threats); and other risk factors discussed herein and listed from time to time in TELUS’ reports.
For additional information on potential risk factors and assumptions, see TELUS’ 2004 Annual Report, updates in 2005 quarterly interim reports and other filings with securities commissions in Canada and the United States.

3
2005 guidance update
Recent developments
2006 targets
2006 priorities
Summary
Questions and answers
Agenda
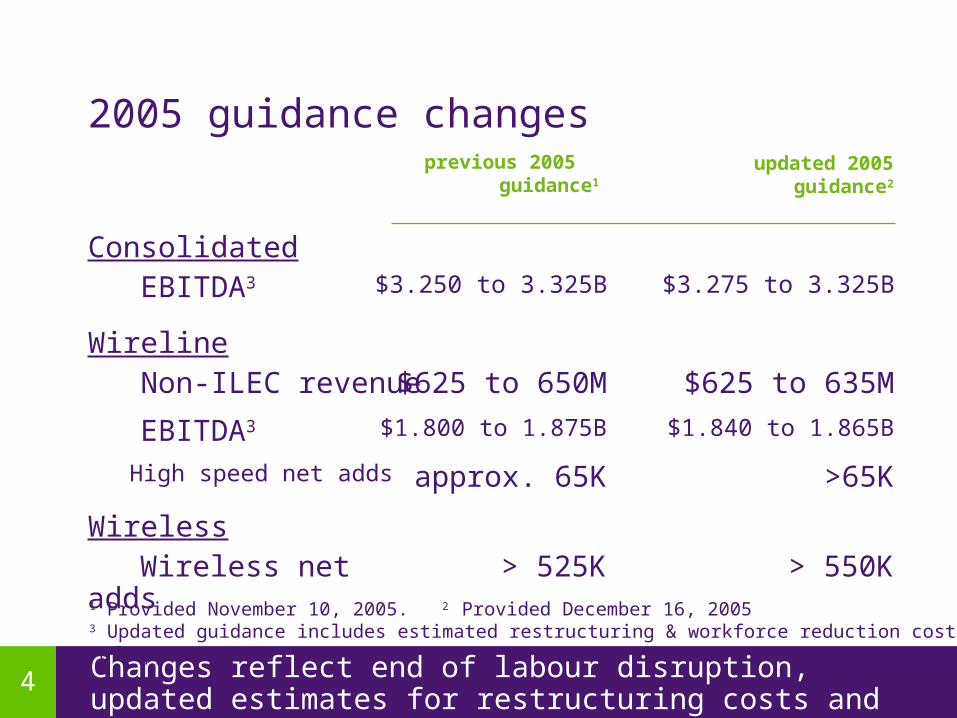
4Changes reflect end of labour disruption, updated estimates for restructuring costs and continued strong wireless growth
2005 guidance changes
1 Provided November 10, 2005. 2 Provided December 16, 20053 Updated guidance includes estimated restructuring & workforce reduction costs of approx. $50M
Wireless
$625 to 650M Non-ILEC revenue
updated 2005 guidance2
Wireline
EBITDA3
previous 2005 guidance1
$3.250 to 3.325B
$625 to 635M
$3.275 to 3.325BConsolidated
> 525K Wireless net adds > 550K
approx. 65K High speed net adds >65K
$1.800 to 1.875B EBITDA3 $1.840 to 1.865B

5 2005 wireless performance well ahead of original targets
2005 wireless guidance summary
1 Provided December 17, 20042 Provided December 16, 2005
425 to 475KWireless Net Adds
$350 to 400MCapex
updated 2005 guidance2
EBITDA
Revenue
original 2005 targets1
$1.35 to $1.40B
$3.2 to $3.25B
>550K
approx. $400M
$1.425 to $1.450B
$3.275 to 3.3B
On track

6Strong execution against original 2005 targets shows resilience of TELUS wireline business
2005 wireline guidance summary
1 Provided December 17, 20042 Provided December 16, 20053 Original target Included restructuring & workforce reduction costs of approx. $100M, vs. approx. $50M for updated guidance
$0 to $10MNon-ILEC EBITDA
$1.85 to $1.90BEBITDA3
updated 2005 guidance2
Non-ILEC Revenue
Revenue
original 2005 targets1
$600 to $650M
$4.7 to $4.75B
Capex
High-Speed Net Adds
$950M to $1.0B
approx. 100K
$15 to 20M
$1.84 to $1.865B
$625 to 635M
$4.825 to $4.85B
approx. $900M
>65K
~
On track

72005 outlook ahead of original targets reflecting continued operating strength in spite of 4 month labour disruption
2005 consolidated guidance summary
1 Provided on December 17, 20042 Updated or reaffirmed December 16, 20053 Original target included restructuring & workforce reduction costs of approx. $100M, vs. approx. $50M for updated guidance
$1.2 to 1.3BFree Cash Flow
$1.3 to 1.4BCapex
$1.65 to 1.85EPS
updated 2005 guidance2
EBITDA3
Revenue
original 2005 targets1
$3.2 to 3.3B
$7.9 to 8.0B
$1.4 to 1.5B
approx. $1.3B
$1.90 to 2.00
$3.275 to 3.325B
$8.1 to 8.15B
On track
8
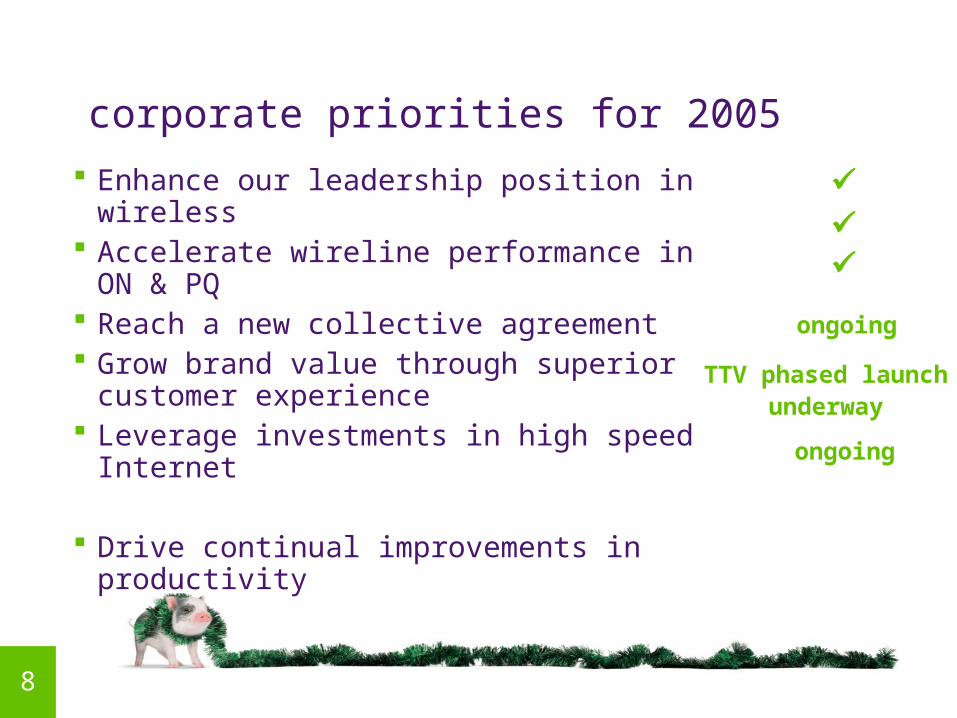
corporate priorities for 2005
Enhance our leadership position in wireless Accelerate wireline performance in ON & PQ Reach a new collective agreement Grow brand value through superior customer
experience Leverage investments in high speed Internet
Drive continual improvements in productivity
TTV phased launch underway
ongoing
ongoing

9
Wireless-wireline merger rationale
Separate wireless and wireline reporting to continue
Advance our industry leading strategy Achieve meaningful commercial differentiation in the market Capitalize technology convergence of wireless and wireline Drive continued operating efficiency and effectiveness
One team, united behind one strategy, defined by one brand
recent developments

10
TELUS executive leadership team structure
DARREN ENTWISTLE
President & CEO
KAREN RADFORD
EVP & President Partner
Solutions & TELUS Quebec
JOE NATALEEVP &
President Business Solutions
JOHN WATSON
EVP & President
Consumer Solutions
EROSSPADOTTO
EVP Technology
Strategy
JANETYALEEVP
Corporate Affairs
KEVIN SALVADORI
EVPBusiness
Transformation & CIO
JOE GRECH
EVP Network
Planning & Operations
ROBERT MCFARLANE
EVP & Chief
Financial Officer
JUDY SHUTTLEWORTH
EVP Human
Resources
TELUS Mobility merged into customer facing structure

2006 targets

12
3.1% GDP growth consistent with Conference Board of Cda
Increased competitive activity from cable-TV, VoIP players
Wireless industry penetration growth similar to 2005
Assume price cap regulatory regime extended for all of 2006
$100M of restr. & workforce reduction costs (~$50M in 2005)
Pension expense increase of ~$40M in 2006 (Discount rate 5.25% vs. 6.0% in 2005)
2006 target considerations (1 of 2)

13
Effective tax rate of approximately 35%
Avg. shares outstanding of 340 to 350M shares depending on NCIB and option exercises
new Normal Course Issuer Bid (NCIB) announced today
Review of tax position indicates cash tax payments expected to be deferred to 2008, from 2007
2006 target considerations (2 of 2)

14
2006 wireless revenue target ($B)
Wireless revenue growth of 15 to 16% driven by continued subscriber & ARPU growth
2005E1 2006E
~3.288
3.775 to 3.825
1 Midpoint of 2005 guidance

15
2006 wireless subscriber net additions target
Wireless net adds expected to remain strong at >550K
2005E 2006E
>4.49M
>5.04M
>550K net adds>550K net
adds

16
2006 wireless EBITDA target ($B)
EBITDA growth of 18 to 22% driven by strong revenue growth and disciplined cost containment
2005E1 2006E
~1.438
1.70 to 1.75
1 Midpoint of 2005 guidance

17
2006 wireless capex target
Wireless capex intensity at best in class 12% level leading to continued strong growth in simple cash flow
approx. $450Mapprox. $400MCapex
$3.775 to 3.825BRevenue $3.275 to 3.30B
approx. 12%Capex intensity approx. 12%
2006E2005E

18
wireless cash flow yield trend
~12%~12%Capex intensity
45 to 46%EBITDA margin1 ~44%
33 to 34%Cash flow yield ~32%
2006E2004 2005E
Strong margins and low capex intensity driving continued premium cash flow yield in 2006
12.5%
40.3%
27.8%
1 based on total revenue
19
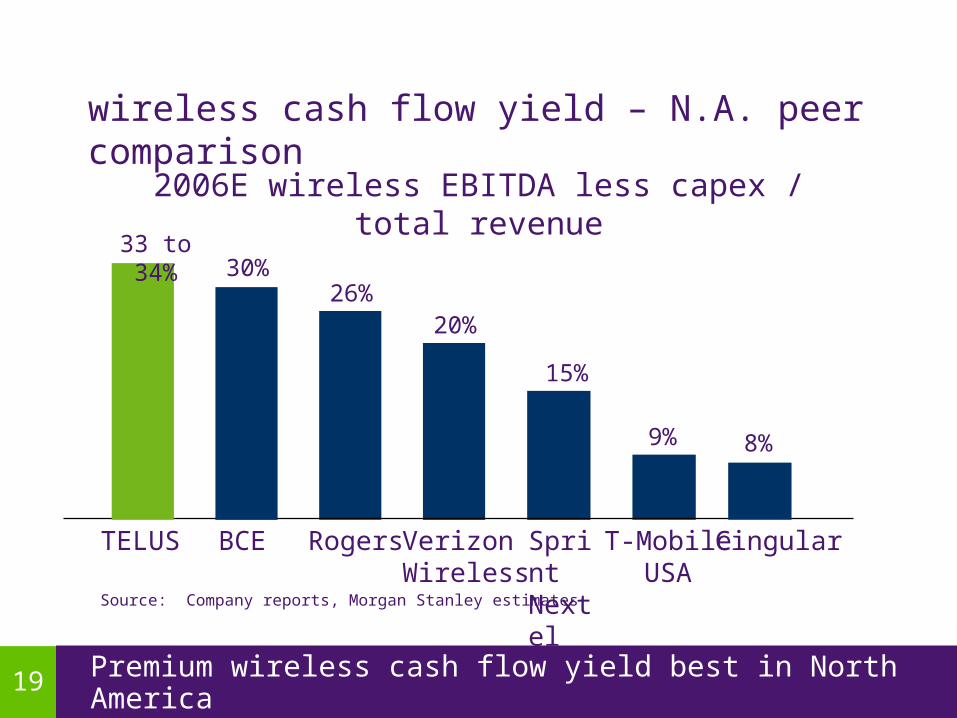
Source: Company reports, Morgan Stanley estimates
TELUS Verizon Wireless
T-MobileUSA
wireless cash flow yield – N.A. peer comparison
2006E wireless EBITDA less capex / total revenue
CingularBCE Rogers Sprint Nextel
33 to 34%30%
26%20%
15%
9% 8%
Premium wireless cash flow yield best in North America

20 Wireless expected to represent 49% and 63% of consolidated EBITDA and cash flow
profitability profile - wireless as % of consolidated
EBITDA less capex 2006E
$2.0 to $2.05B
wireline37%
wireless63%
EBITDA 2006E
$3.5 to 3.6B
wireline51%
wireless49%
21
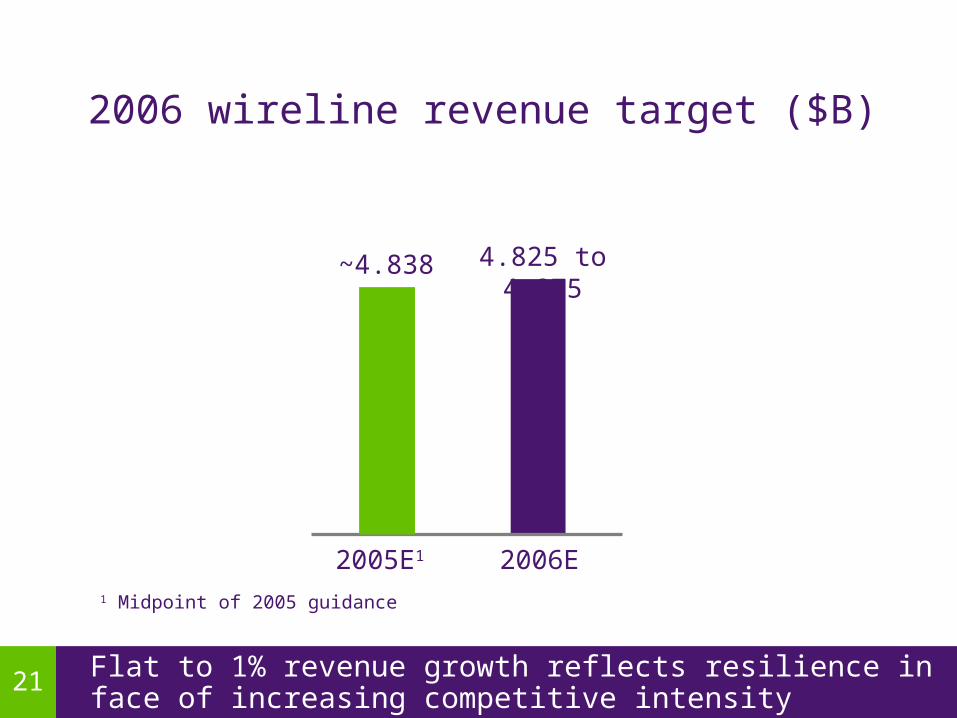
2006 wireline revenue target ($B)
Flat to 1% revenue growth reflects resilience in face of increasing competitive intensity
2005E1 2006E
~4.838 4.825 to 4.875
1 Midpoint of 2005 guidance

22
2006 wireline EBITDA target ($B)
Wireline EBITDA (before restructuring) flat to up $50M
2005E1 2006E2
~1.9031.9 to 1.95
2005E1 2006E2
~1.853 1.8 to 1.85
wireline EBITDA after restructuring
wireline EBITDA before restructuring
1 Midpoint of 2005 guidance. Restructuring & workforce reduction costs of approx. $50M in 20052 Restructuring & workforce reduction costs of approx. $100M in 2006

23
2006 non-ILEC wireline revenue & EBITDA target
Continued focus on profitable, long term growth in C. Canada
2005E1 2006E
~630
650 to 700
2005E1 2006E
~1825 to 40
EBITDA ($M)Revenue ($M)
1 Midpoint of 2005 guidance

24
2006 high-speed Internet subscriber target
>100K target reflects regaining fair share of net adds in maturing market
2005E 2006E
>755K
>855K
>100K net adds>65K net adds

25
2006 wireline capex target ($B)
2006 capex reflects catch-up on deferred capex from 2005
2005E 2006E
1.05 to 1.1~0.9

26
2006 revenue & EBITDA targets
6 to 7% revenue & 6 to 9% EBITDA growth driven by wireless
2005E1 2006E
~8.18.6 to 8.7
TELUS Consolidated
EBITDA ($B)Revenue ($B)
2004
7.6
2005E1 2006E
~3.33.5 to 3.6
2004
3.1
1 Midpoint of 2005 guidance
2003
7.1
2003
2.8

27
EPS target ($)
Earnings growth of 23 to 33% driven by operating profitability growth & lower financing costs
2005E1 2006E
~1.95
2.40 to 2.60
TELUS Consolidated
2004
1.58
1 Midpoint of 2005 guidance
2003
0.92

28
2006 EPS continuity
Normalized EPS growth of 17 to 27%
2005E1 2006E
32 to 50¢
$2.40 to 2.60
TELUS Consolidated
~$2.05~$1.95
17¢
non-recurring
9¢
21¢
9¢7¢
0 to 7¢
2005E normal.
redemption & litigation
tax
1 Midpoint of 2005 guidance.
~22¢
labourdisrup.
EBITDA Growth
interest expense
restruct.costs
otherpensionexpense
29
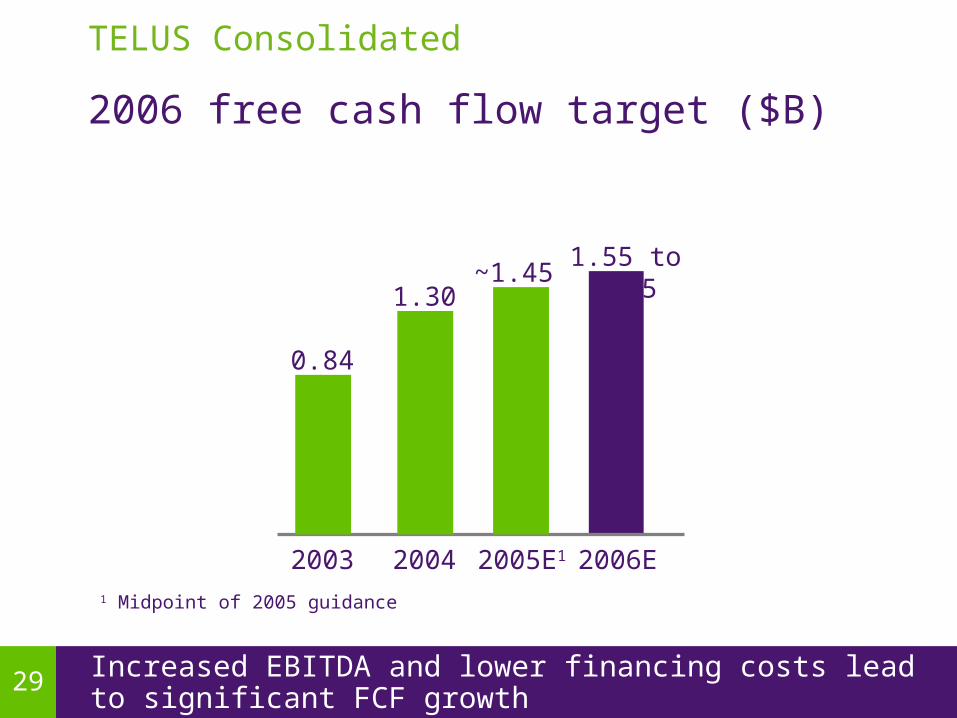
2006 free cash flow target ($B)
Increased EBITDA and lower financing costs lead to significant FCF growth
TELUS Consolidated
2005E1 2006E
~1.451.55 to 1.65
2004
1.30
1 Midpoint of 2005 guidance
2003
0.84

30 2006 targets build upon track record of outstanding growth
2006 consolidated targets summary
1Including restructuring & workforce reduction costs of approx. $50M in 2005 and $100M in 2006
$1.55 to 1.65BFree Cash Flow
$1.50 to 1.55BCapex
$2.40 to 2.60EPS
change
EBITDA1
Revenue
2006 targets
$3.5 to 3.6B
$8.6 to 8.7B
TELUS consolidated
7 to 14%
15 to 19%
23 to 33%
6 to 9%
6 to 7%

31 Repurchased 84% of shares permitted under current NCIB
return of capital - share buy back update
No. of Shares
Repurchased
No. of Shares
Repurchased
Total
Authorized
%
Repurchased
vs. Auth. Since
Inception
Common 1.8M 10.2M 14.0M 73%
Non-Voting 1.8M 11.3M 11.5M 98%
Total 3.6M 21.5M 25.5M 84%
Total cost $159M $901M
TELUS consolidated
Q4-051 Since inception
1 Repurchases up to and including December 15, 2005
32
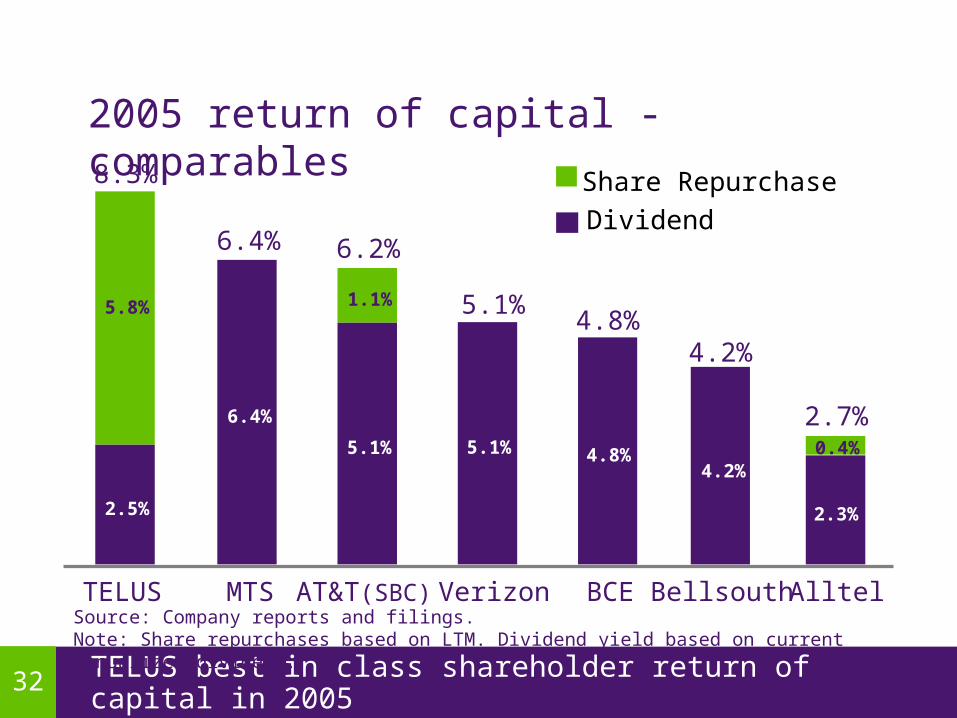
2.5%
6.4%
5.1% 5.1% 4.8%
2.3%
5.8% 1.1%
0.4%
TELUS MTS AT&T(SBC) Verizon BCE Alltel
2005 return of capital - comparables
TELUS best in class shareholder return of capital in 2005
Dividend
Share Repurchase
Source: Company reports and filings. Note: Share repurchases based on LTM. Dividend yield based on current annualized dividend.
8.3%
6.4% 6.2%
5.1%4.8%
2.7%
Bellsouth
4.2%
4.2%

33
Completed $1.6B early debt redemption on Dec. 1, 2005
Announced in November 38% quarterly dividend increase to 27.5 cents per share, for Jan. 1, 2006 payment
Consistent with dividend payout ratio guideline of 45 to 55% of sustainable net earnings
New 24 million share NCIB effective Dec. 20, 2005
Authorized to repurchase up to 12M common and 12M non-voting (up to 7.1% of total shares outstanding)
return of capital summary
TELUS has strong track record for returning capital to investors
TELUS Consolidated

34
Advance TELUS’ leadership position in the Consumer, Business and Wholesale markets
Drive improvements in productivity and service excellence
Strengthen the spirit of the TELUS team and the brand
Develop the best talent in global communications industry
Key priorities for 2006
Focused on executing our growth strategy

35
Summary 2005 outlook revised for non-ILEC revenue, wireline and
Consolidated EBITDA, and increased high speed Internet and wireless net additions
2006 targets consistent with TELUS growth model
2006 targets reflect: Strong revenue growth EBITDA growth driven by Mobility Significant EPS growth driven by strong EBITDA growth,
and lower financing and tax costs Significant FCF generation Continued subscriber growth


37
appendix

38
EBITDA: Earnings, after restructuring and workforce reduction costs, before interest, taxes, depreciation and amortization
Capital intensity: capex divided by total revenue
Cash flow: EBITDA less capex
Free Cash Flow: EBITDA, adding Restructuring and workforce reduction costs, cash interest received and excess of share compensation expense over share compensation payments, subtracting cash interest paid, cash taxes, capital expenditures, and cash restructuring payments
definitions
appendix
TELUS definitions for non-GAAP measures

39
$1,550 to 1,650
~(500)
(1,500 to 1,550)
$3,500 to 3,600
2006E
Free Cash Flow
Net Cash Interest
Capex
EBITDA
($M)
50 to 100Other1:
free cash flow
TELUS consolidated
Continued strong free cash flow generation
1 Restructuring expense (net of cash payments), non-cash share based compensation, & net cash tax recoveries


