1
Hinode Monthly Highlights – Slow Solar Wind Sources
Derived from recent publication from the Hinode/EIS team through the Naval Research Laboratory
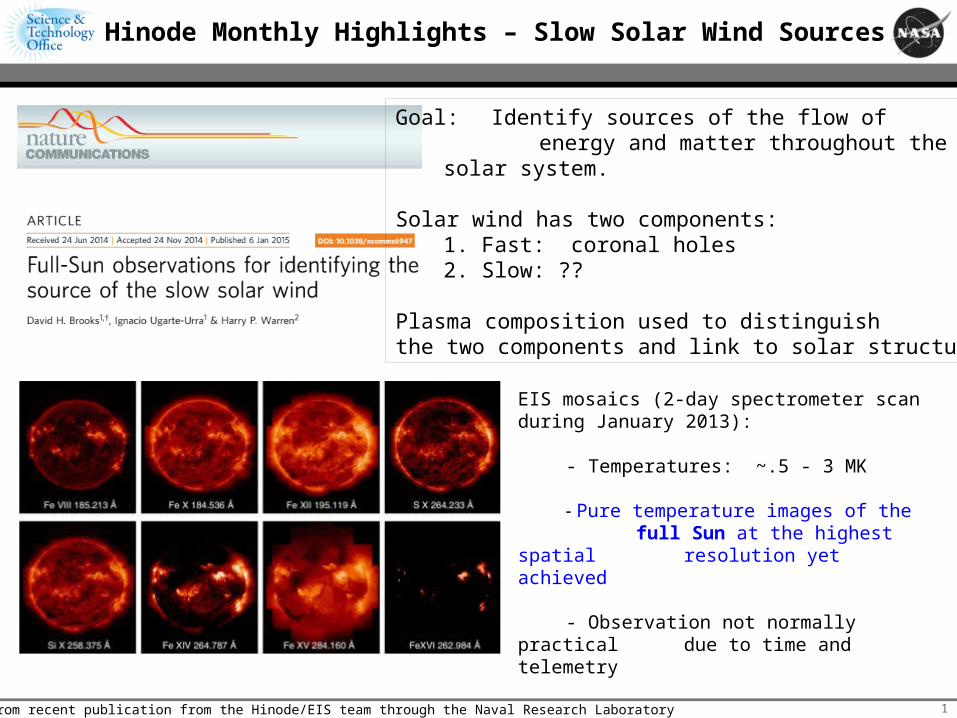
EIS mosaics (2-day spectrometer scan during January 2013):
- Temperatures: ~.5 - 3 MK
- Pure temperature images of the full Sun at the highest spatial resolution yet achieved
- Observation not normally practical due to time and telemetry
Goal: Identify sources of the flow of energy and matter throughout the
solar system.
Solar wind has two components: 1. Fast: coronal holes2. Slow: ??
Plasma composition used to distinguishthe two components and link to solar structures.
2
Hinode Monthly Highlights – Slow Solar Wind Sources
Derived from recent publication from the Hinode/EIS team through the Naval Research Laboratory
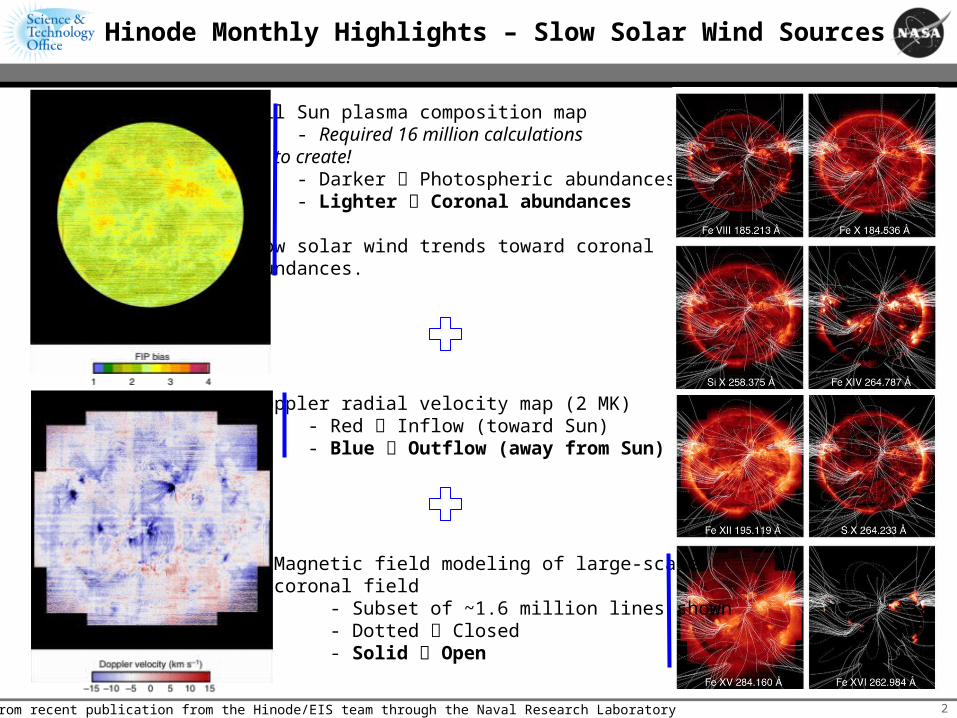
Full Sun plasma composition map - Required 16 million calculations to create! - Darker Photospheric abundances - Lighter Coronal abundances
Slow solar wind trends toward coronal abundances.
Doppler radial velocity map (2 MK) - Red Inflow (toward Sun) - Blue Outflow (away from Sun)
Magnetic field modeling of large-scale coronal field - Subset of ~1.6 million lines shown - Dotted Closed - Solid Open
3
Hinode Monthly Highlights – Slow Solar Wind Sources
Derived from recent publication from the Hinode/EIS team through the Naval Research Laboratory
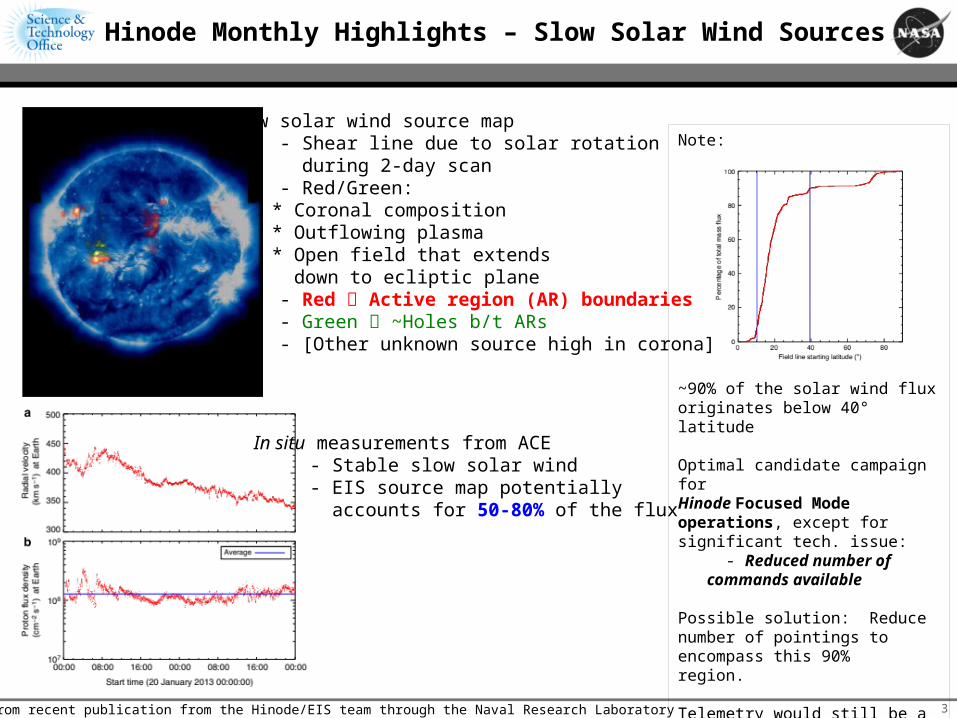
Slow solar wind source map - Shear line due to solar rotation during 2-day scan - Red/Green:
* Coronal composition* Outflowing plasma* Open field that extends down to ecliptic plane
- Red Active region (AR) boundaries - Green ~Holes b/t ARs - [Other unknown source high in corona]
In situ measurements from ACE - Stable slow solar wind - EIS source map potentially accounts for 50-80% of the flux
Note:
~90% of the solar wind fluxoriginates below 40° latitude
Optimal candidate campaign forHinode Focused Mode operations, except for significant tech. issue: - Reduced number of commands available
Possible solution: Reduce number of pointings to encompass this 90% region.
Telemetry would still be a challenge.


