
1
The Population and Luminosity Function of AGNs from SDSS
Lei HaoLei HaoCollaborators: Michael Strauss
SDSS collaboration
Princeton University
CFA Lunch Talk: November, 14, 2002

2
Introduction: AGN emission lines
Broad-line AGNs
Star-forming galaxies
Narrow-line AGNs
Veilleux & Osterbrock (1987)

3
Introduction:Sloan Digital Sky Survey
• AGNs are interesting but rare• SDSS is very promising in having a large AGN
sample:– one-quarter of the sky
– collect spectra of ~ 106 galaxies, 105 quasars, …
• Galaxies: r<17.77• Quasars: i<19.0; color selection• Spectra resolution: ~ 2000• Over 400,000 spectra have been taken.

4
Data Sample
• 114,772 galaxy and quasar spectra in 1151 sq degrees
• 58,038 low redshift (z<0.33) emission line galaxies.
• AGNs are identified by their emission line characteristics.

5
Stellar Subtraction
• Emission lines are very easy to be contaminated by the underlying absorption lines.
• Apply Principle Component Analysis (PCA) to pure absorption line galaxies.
• Use Eigenspectra as stellar templates.
• Plus an A star spectrum; Power-law continuum

6
Stellar Subtraction
• The emission lines of AGN are often contaminated by the host galaxy absorption lines.
• To correct the contamination,the underlying stellar absorption spectrum is removed from the original spectrum.

7
AGN Selections
– FWHM(Hα)>1,200 km/s – 3069 are identified
• Broad Line AGNs
• Narrow Line AGNs
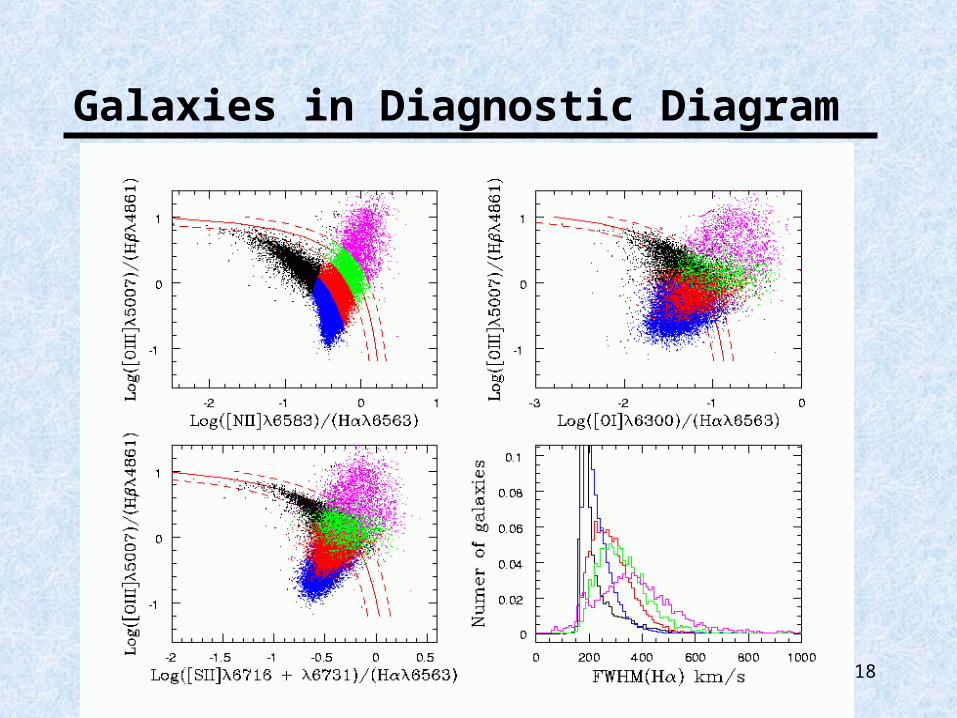
Distinguishing AGNs from star-forming galaxies
Theoretical separation lines predicted by Kewley et.al 2001
Theoretical separation lines predicted by Kewley et.al 2001

8
AGN Selections
– FWHM(Hα)>1,200 km/s – 3069 are identified
• Broad Line AGNs
– 3456 are identified
• Narrow Line AGNs
• Seyferts: Galaxy targeted for spectra in SDSS
• Quasars: Quasar targeted for spectra in SDSS

9
The Redshift and Magnitude Distribution
• Seyfert sample– r-band Petrosian <17.77
– 1281 broad line AGNs
– 2696 narrow line AGNs

10
The Luminosity Function (LF) of Seyferts • We measure the luminosity function as a function
of Hα luminosity.
• Assumption– The luminosity of the nuclei is independent of the
luminosity of its host galaxy.
• We measure the detection probability function for each AGN.
Nucleus SpectrumHost galaxy
Weakened nucleus
Noise
New Spectrum AGN?

11
Luminosity Function: Seyfert 2s

12
Luminosity Function: Seyfert 2s vs. Seyfert 1s

13
Luminosity Function Result and Check
• Divide the AGN sample into subgroups by their redshifts.
• For each group, evaluate the expected AGN luminosity distribution using the LF calculated.
• If LF is correct, the expected distribution should match the observed distribution.

14
Luminosity Function Result and Check
• Divide the AGN sample into subgroups by their host galaxy magnitudes.
• No systematic discrepancy
the nuclei luminosity is not strongly correlated with its host galaxy luminosity.

15
Host galaxy luminosity vs. Nuclear luminosity
• Galaxy Magnitude vs. Hα Luminosity plot
0.01<z<0.03
0.03<z<0.06
0.06<z<0.09
0.09<z<0.12
0.12<z<0.14
0.14<z<0.20.12<z<0.14

16
Host galaxy luminosity vs. Nuclear luminosity
• Correlation test (Kendall’s -statistic) study to check the independency.
• L(host) ~ L(nuclei)
• The principal quantity that determines the AGN luminosity is the Eddington ratio, not the black hole mass.
• Galaxy Magnitude vs. Hα Luminosity plot
• L(host) ~ L(nuclei) (0.0062±0.0005)

17
Summary and Future Work
• From SDSS, we compiled an AGN sample including over 3000 broad-line AGNs and over 3000 narrow-line AGNs
• The LF of the AGNs are calculated and carefully checked.
• Nuclear luminosity is independent to the host galaxy luminosity.
• Future work:– Seyfert LF normalization and low redshift quasar LF– AGN LF evolution– The connection btw. AGNs and host galaxies– The accretion rate of AGNs
18
Galaxies in Diagnostic Diagram

19
Sersic Index
• Animation


