Download - 13. Pulsed Neutron Devices

7/22/2019 13. Pulsed Neutron Devices
http://slidepdf.com/reader/full/13-pulsed-neutron-devices 1/24
13PULSED NEUTRONDEVICES
INTRODUCTION
The availability of pulsed neutron sources allowed the developm ent of severalvaluable formation evaluation techniques: thermal die-away logging andspectroscopy of neutron-induced gamma rays. At the heart of thesetechniques is the neutron generator discussed in Chapter11. In thermal die-away logging, the pulsing capability of this generator is fundamental to thedetermination of the formation thermal neutron absorption properties. Alimited chemical analysis of the formation can be obtained from acombination of the controlled injection of high energy neutrons into theformation and spectroscopy of the neutron-induced gamma rays. Byexploiting the high energy neutron reactions, we can determine the ratioofcarbon to oxygen in the formation. Spectroscopy of gamma rays produced bysubsequent thermal neutron capture reactions allows the detection of a dozenor so important elements present in the formation.
Pulsed neutron devices found their first logging application inthedetermination of water saturation in cased producing wells. The traditionalmethod for obtaining S of course, relies on electrical measurements. Forthe most part, however, producing wells contain metallic casings whichrender electrical measurements useless. Neutrons, however, penetrate thecasing without much difficulty and consequently are applied to the problem ofprobing the formation in such situations.
281

7/22/2019 13. Pulsed Neutron Devices
http://slidepdf.com/reader/full/13-pulsed-neutron-devices 2/24
282 Well Logging for Earth Scientists
Thermal neutron die-away devices respond to the macroscopic thermalcapture cross section, which depends on the chemical constituents of thematrix and pore fluids. Chlorine, which is nearly always present in formationwaters, has a large absorption cross section. Thus a measurement of themacroscopic absorption cross section(C) can provide the means (althoughindirect) for identifying saltwater and for measuring the water saturation.
To motivate the measurementof C, we will first look at the relationshipbetween the concentration of thermal absorbers and the value of themacroscopic cross section. This will givean indication of the dynamic rangeof C expected in logging applications. The technique for determining thevalue of Z from borehole measurements is examined, illustrating some itslimitations. An introduction to interpretation of theC measurement and someapplications are given.
In a second section, an overview of spectroscopyof neutron-inducedgamma rays for formation chemical analysis is presented. The initial aim ofthis technique was to provide an alternate method of determining saturationbehind casing. Rather than the more indirect approach of interpreting ameasurement of C, t is possible to directly measure the ratioof carbon tooxygen atom s in the formation. If the lithology and porosityare known, thisratio can yield saturation. In a separate phaseof the preceding measurement,spectroscopy of gamma rays, induced during the capture of neutrons, yields
substantial information concerning the formation chemical composition.Some of the applications of this latter techniqueare explored in Chapter 19.
THERM AL NEUTRON DIE-AWAY LOGGING
Thermal Neutron Capture
As discussed in Chapter 11, neutron capture is oneof many reactions whichcan take place during neutron interaction with matter. The cross section forcapture varies as l /v at low energies, where v is the neutron velocity. Thus,it is the predominant interaction mechanism at thermal energies and the onlyway neutrons are removed from the system. In the capture of neutrons, thetarget nucleus with atomic mass A transmutes into another isotope of theelement with mass A+1. This "compound nucleus" is formed in an excitedstate that decays nearly immediately, with the emissionof one or moregamma rays. The gamma ray energy can range up to a maximum of about
8 MeV.To appreciate the magnitude of the thermal absorption cross section of afew common (and not so common) elements, refer to Table 13-1, whichorders the elements by mass-normalized absorption cross section. Thedefinition of the mass-normalized cross section follows from the macroscopiccross section. The third column in Table 13-1 gives the absorption cross

7/22/2019 13. Pulsed Neutron Devices
http://slidepdf.com/reader/full/13-pulsed-neutron-devices 3/24
Pulsed Neutron Devices 283
section per nucleus, o in barns cm2). The macroscopic absorptioncross section, C,, is the product of oa and the number of nuclei per cubiccentimeter:
NoC a = o p .A
The mass-normalized cross section,om s just C,/p. This is a useful unitsince a thousand times the mass-normalized cross section is numerically
ELEMENT
Gd Gadolinrum
8 BoronSm Samarium
Eu Europium
Cd Cadmium
LI Lithium
Oy Dypror tum
lr Iridium
Hg Mercury
In Indium
Rh Rhodium
Er Erbium
CI Chlorine
co Cobalt
Tm Thul ium
Ag SilverSc Scandium
HI Hafnium
Re Rhemum
Lu Lutetium
Nd Neodymium
H Hydrogen
Kr Krypton
Mn Mangame
c s c m u m
Yt Ytterbium
Se Selenium
N Nitrogen
TI Titanium
Ta TantalumW TunstenV Vanadium
NI Nickel
K Paraniurn
F e l i o n
Na Sodium
s SOll",
Ca Calcium
A1 Aluminum
P Rlosphorw
s, Slllcon
Mg Magnerium
Be Beryllium
C Carbon0 Oxygen
A
Are. AtomicWeight
I A t o m a MasU ,b)
157
1 0 8150
152
112
6.94
163
192
201
115
103
161
35.45
58 9
169
10845 0
118
186
115
144
1008
83.8
54.9
133
173
19.0
14.01
41.9
181184
50.9
58 1
39.1
55 9
23 0
32 1
40 1
27 0
31 0
28 1
24.3
9 01
12 016.0
Awe. AtomicAbrorption
Cron SectloIb.mr1
49,000
7595,800
4,600
2.450
10.7
930
426
375
193
150
162
33.2
37.2
103
63 626 5
102
88
11
50 5
0.332
25 0
1 3 3
29.0
36.6
11.7
1.85
6.1
21.018.5
5 4
4 43
2 10
2 55
0 530
0 520
0 43
0 230
0 180
0 16
0 063
0.0092
0.00340.00027
,Mas.Normrlsrd
AbsorptionC r a r SLctmn
( c m ~ l g m l '
I88
42.323.3
18.2
13.1
6.14
3 45
1.34
1.13
1.01
0.878
0.583
0.564
0.3800 367
0.3550.355
0.344
0.285
0 265
0 2 11
0 198
0.180
0.146
0.131
0.127
0.0892
0.0795
0.0767
0.06990.0606
0.05960.0454
0 0323
0 0215
00139
000917
0 00646
000513
0 0035
0 0034
000156
O.DOd61
00001700000102
A,Mas-Normalized
ChlorineAbsorptionEquivalents
333
75 041 2
32.3
23.3
10.9
6.1 I
2 37
2.00
1.80
1.56
1.034
1.00
0 674
0 651
0.6300.629
0 610
0.505
0 410
0 314
0.352
0 319
0 259
0 33
0.226
0.158
0.141
0.136
0.1240.107
0.106
0,0806
0 0573
0 0488
0.0246
00173
0.0115
0 0091
0 0062
00061
0.00459
0.00 09
0.000300.000018
+ 1,000 rm S equal to the number 01 c u rontribuled per gram Of Element t per c c 01 bulk material.
Table 13 1. Thermal absorption cross sectionof elements ordered by the mass-normalized cross section. Courtesyof Schlumberger.

7/22/2019 13. Pulsed Neutron Devices
http://slidepdf.com/reader/full/13-pulsed-neutron-devices 4/24
284 Well Logging for Earth Scientists
equivalent to the number of capture units (cu) contributed per gram ofelement per cm3 of bulk material.
It is seen that, in terms of the mass normalized absorption cross section,chlorine is quite prominent on a list of otherwise relatively scarce elements,at least for petrophysical applications. Exceptions are boron, which is oftenassociated with clays, and cadmium, which is used in the construction ofepithermal neutron detectors. The next most important and frequentlyencountered element is hydrogen, which has an atomic cross section twoorders of magnitude less than chlorine. However, because of its concentrationin water, it plays a greater role than most other elements.
Salini ty (%NaCII
Figure 13-1. The macroscopic thermalneutron absorption cross sectionof water (incapture units as a function of salinity. The salinity is given inweight percentof dissolved NaCl.
Figure 13-1, shows how the macroscopic cross section (in capture units)of saltwater varies as a function of the NaCl concentration. The relativelylarge capture cross section for fresh water (22 cu) is due primarily to the
hydrogen, but the addition of NaC1, which has, in its crystalline form, acapture cross section of about 750 cu, increases the capture cross section ofthe liquid dramatically. Due to the lack of effective absorbers in most rockmatrices, their capture cross sections are generally less than 10 cu. Thus thecapture cross section of a formation will depend primarily on the salinity ofthe interstitial water, porosity, and water saturation. Water saturation is an

7/22/2019 13. Pulsed Neutron Devices
http://slidepdf.com/reader/full/13-pulsed-neutron-devices 5/24
Pulsed Neutron Devices 285
important ingredient in theC of a formation, since the capture cross sectionof hydrocarbons is about the same as that of fresh water.Neutron die-awaylogs are generally presented on a scale of0 to 60 cu, which reflects the
anticipated range of variation of this formation parameter. A 30% porousformation containing only saturated saltwater(26 NaCl by weight), willhave a C n excess of 40 cu, depending on the absorbers associated with therock matrix. The presence of a sign ificant oil saturation will consequentlyreduce the observed value ofC.
M easurem ent Technique
In order to determine the macroscopic thermal cross section of a formation,the quantity that is measured is the lifetime of thermal neutrons in anabsorptive medium. The practical realization of a device for this measurementis contingent on the availability of a pulsed source of high energy neutrons.This allows the periodic production of a population of neutrons whoseabsorption is then monitored.
The basic mode of operation consists of pulsing the source of 14 MeVneutrons for a brief period. This forms a cloud of high energy neutrons inthe borehole and formation, which becomes thermalized through repeated
collisions. The neutrons then disappear at a rate which depends upon thethermal absorption properties of the formation and borehole.As each neutronis captured, gamma rays are emitted. The local rate of capture of neutrons isproportional to the density of neutrons, which decreases with time.Thus therate of production of capture gamma rays decreases in time.Measurement ofthe decay of the gamma ray counting rate reflects the decay of the neutronpopulation. For this reason the logging tool generally consists of a detectorof gamm a rays in addition to the source of 14 MeV neutrons.
The operation of such a device is sum marized in Fig. 13-2. Neutrons of
high energy are shown, shortly after emission, forming a cloud of high energyneutrons in the first snapshot. As time passes, the neutrons make collisions,lose energy, and spread further from the point of emission, which is shown inthe series of snapshots. The characteristic dimension of the cloudofneutrons, just prior to thermalization, is the slowing-down length. When theneutrons reach thermal energies and the cloudhas attained a size which isrelated to the migration length, they beginto be absorbed through the thermalcapture process. As time passes, the density of neutrons in the ever-expanding cloud decreases, depending upon the rate of absorption, as
indicated in the sketch of the neutron density as a function of time inFig. 13-2.
In a manner analogous to radioactive decay, the time-dependent behaviorof the capture of thermal neutrons canbe predicted. The reaction rate forthermal neutron absorption is given by the product of the macroscopicabsorption cross section C and the velocity of the neutron v. So, for a

7/22/2019 13. Pulsed Neutron Devices
http://slidepdf.com/reader/full/13-pulsed-neutron-devices 6/24
286 Well L ogging for Earth Scientists
system of N N neutrons, the num ber absorbed in a time dt is:
dNN = -NN Ca v dt . (1)
When integrated, this yields:
(2)-z vl
N N = N i e ,
which relates the number present at time t to the initial number Ni at timezero. The decay time cons tant is equal to l/vC,.
Figure 13-2. Evolution of the thermal neutron population producedby a pukedneutron device.
The value of the capture cross section Ca is listed in Table 13-2 for anumber of materials of interest. Included in the table is the decay timeconstant associated with each value ofC,. It has been computed from therelationship:
The derivation of the decay-time relationship was based upon a simplemodel which starts with a cloud of thermal neutrons at time zero. It is ofinterest to know how much time elapses, after the burst of14 MeV neutrons,before the cloud of thermalized neutrons is present. Estimates basedon the

7/22/2019 13. Pulsed Neutron Devices
http://slidepdf.com/reader/full/13-pulsed-neutron-devices 7/24
Pulsed Neutron Device s 287
average number of collisions required to reduce the energy of the neutrons tothe thermal region and the variation of the mean free path between collisionsindicate that the thermalizing time scale is on the order of1 psec, much
shorter than typical decay times shown in Table 13-2.Capture Cross Sections and Decay Times.
MATERIALQ u aDolomiteLime20 PU LimeWaterSalt Water (26%% NaC1)
4.264.77.0710.06
22125
108696864345220636
Table 13-2. Capture cross section and decay time constants for various materials.
The simple derivation of the capture gamma ray time-dependence missesan important aspect encountered in actual measurement: the thermal neutrondiffusion effect. The diffusion of neutrons in a homogeneous medium arisesfrom spatial variation in the neutron density (or flux). Intuitively, we feelthat the thermalized neutron cloud will have such a spatial variation; initially,the flux of thermal neutrons will be highest near the source and will decreasewith increasing distance from it. Physically, the diffusion of neutrons is to be
expected since in regions of highflux the collision rate will be high, with theresult that neutrons will be scattered more frequently toward regions of lowercollision density. This results in a net current of neutrons from regions ofhigher flux to those of lower flux. The rate at which the diffusion occursdepends on the diffusion coefficient and the gradient of the neutronflux (seeChapter 12). The im plicit assumption in the derivation of Eq. (2) was thatsomehow the global behavior of the neutron density could be monitored at alltimes. In this case, diffusion is of no consequence. How ever, in the actuallogging application, decay of the neutron population is monitored only in the
vicinity of the detector, and thus it is a local measurement.At any observation point, the local thermal neutron density decreases
because the neutrons are diffusing and being captured. To quantify the effectof the diffusion component on the local decay time constant, it is necessary touse the time-dependent diffusion equation (see appendix to this chapter). Theresult is that the apparent decay time of the local neutron population containstwo components:
where Tint is the intrinsic decay time of the formation (i.e., that expected fromglobal monitoring of absorption alone), and2diff is the diffusion time, whichcorresponds to the density reduction of neutrons as a function of time due tothe diffusion of neutrons away from the center of the cloud. The value of~ d f f epends on the distance from the source emission point and the diffusion

7/22/2019 13. Pulsed Neutron Devices
http://slidepdf.com/reader/full/13-pulsed-neutron-devices 8/24
288 Well Logging for Earth Scientists
coefficient. The practical result of the diffusion effect is that, withoutcorrection, the measured C of a formation will appear greater than theintrinsic value due to the diffusion rate of the thermal neutron population inthe vicinity of the detector. The effect will also be larger at low porosity,since the diffusion coefficient D decreases with increasing porosity (seeFig. 11-12).
Instrumentation and Interpretation
In logging devices, numerous schemes are used for controlling the periodduring which the 14 MeV neutrons are produced and the period during which
the gamma rays are measured. Some devices use dual-detector systems in anattempt to correct for the disturbance that can be introduced by the borehole,as well as to provide an estimate of the porosity.
One of the challenges in making the thermal decay measurement is theseparation of the borehole and formation signals. Although one would like tomonitor the neutron population of the formation only, capture gamma raysfrom the borehole are in fact detected also. This component is of littleinterest for the determination of the formation properties. Figure 13-3 showsthe approach used in one device.' A short time after the neutron burst, a
series of timed gates accumulates the gamma ray counting rate as it decays.
HHH-1 2 3 4 5 6
Gates-1 2 3 4 5 6
~ - ~ ~ O O ~ S - ~ ~ ~ O O * S - - - - - C
Figure 13-3. The gamma ray time distribution illustrates the decay of the boreholeportion of the signal and the portion due to the formation. Adaptedfrom Schultz et al.'

7/22/2019 13. Pulsed Neutron Devices
http://slidepdf.com/reader/full/13-pulsed-neutron-devices 9/24
Pulsed Neutron Devices 289
This cycle is repeated every 800 psec. After 1250 of these cycles, abackground signal is determined, which is then appropriately subtracted fromthe preceding sequence of pulsed measurements.
An example of the two-component behavior is shown in the data ofFig. 13-3. The decay rate of gamma rays is shown for two detectors at twospacings from the source. In this experimental setup the borehole absorption( ) exceeds the formation absorption( ), giving rise to the rapid decay ofthe borehole component. Tw o exponentials have been fittedto the data. Thecurve with the longer decay time constant is related toq and could alsohave been determined from the composite decay curveby waiting a sufficientperiod of time (400 psec in this case) before determining the rate of decay.In another situation in which the borehole fluidis fresh and the formation
fluid saline, so that q0 &, the fastest-decaying component will beassociated with the formation. In this case, waiting a sufficiently long timebefore determining the decay constant will result in obtaining only the&,value. In such a case, the decom position of the decay curve into itscomponents is seen to be an advantage.
Near Detecto r Decay
t
Calculated Sum
m \
z - eutron \Burst \A
100 200 300 400 500 600
Far Detector Oecav
Time p s ) Time p s )
Figure 13-4. Laboratory data from a dual-detector device illustrating the two-component time decay. Comp arison of the observed formationCwith the intrinsic value of 15.7 cu shows that the diffusion effect issmaller for the far detector. Adapted fro m Schultz et al.’
The diffusion effect can also be seen in the data of Fig. 13-4. The42-PU sandstone formation in which the measurements were made had a matrixC independently determined to be 11.1 cu. The borehole is filled withsaltwater, and the actualC of the formation filled with fresh water is 15.7 cu,On the left, the nearer of the two detectors sees the formation componentdecay with an apparmt C of 18.3 cu w hile, on the right, the detector farthestfrom the source yields an apparentC f 16.7. As expected, this latter value isquite close to the intrinsic value, but the effect of diffusionis still seen.

7/22/2019 13. Pulsed Neutron Devices
http://slidepdf.com/reader/full/13-pulsed-neutron-devices 10/24
290 Well Logging for Earth Scientists
Table 13-3 compares some values of intrinsic and observed value ofC with aparticular measurement system. Note,in particular, the large discrepancies inthe matrix materials; part are due to absorptive impurities in the samples andpart to the diffusion effect. Other measurement systems with differentdetector spacings and timing schemes may be expected to have differentdiffusion components.
Intrinsic and Measured Z
LimesmneDolomiceAnhydritCGypsumWatn (fresh)oil
Shale
7.14.74.71821
22
8 - 108 ~ 128 - 12
1822
16 - 2220 -60
Table 13-3. Comparison of intrinsic and observed values of X. Adapted fromClavier et aI.1°
Regardless of the engineering details and variations in the pulsing modes,the devices described above are used for the determination of watersaturation, particularly in cased wells. The m ost comm on important thermal
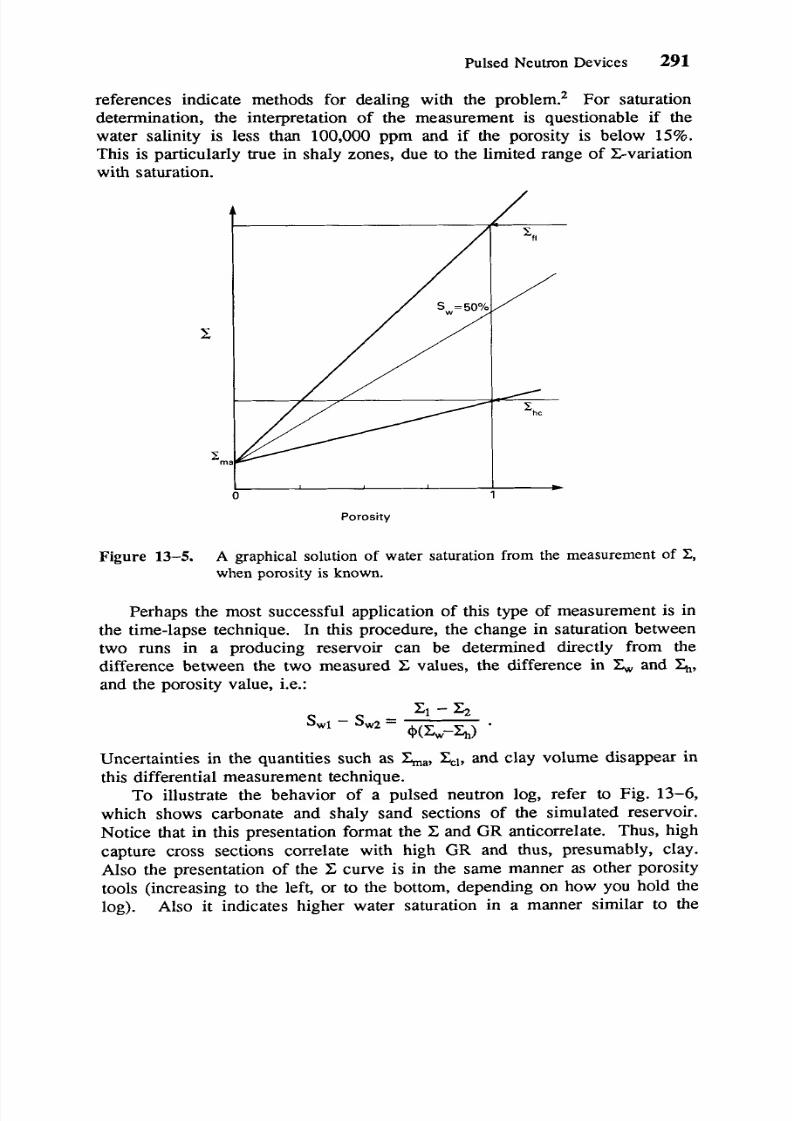
neutron absorber is chlorine, which is present in most formation waters.Hence a measurement of the parameter C resembles the usual open-holeresistivity measurements. It can distinguish between oil and saltwatercontained in the pores. If the porosity is known, gado il interfaces can belocalized. When salinity, porosity, and lithology are known, the watersaturation S, can be computed.
Despite the complexity of the physics of the measurement and itsengineering implementation,C has a particularly simple mixing law. In thesimplest case of a single mineral, the measured valueC consists of two
components, one from the matrix and the other from the formation fluidC = (1-@)Zm + @sf
This simple equation can be written because weare dealing with macroscopiccross sections; by definition, they combine volumetrically. To determinewater saturation, the fluid component is broken further into water andhydrocarbon components:
c 1 - @ F m a + @ W L 4 a S w P l l *
The graphical solution of this particularly simple equation forS, is shown inFig. 13-5. In order to use this approach, the valuesof &, Z and La mustbe known or determined from logs. The presence of a water zone in thelogged interval simplifies this task.
The presence of shale, which may contain thermal absorbers such asboron, seriously disturbs this simple interpretation scheme, but a numberof
7/22/2019 13. Pulsed Neutron Devices
http://slidepdf.com/reader/full/13-pulsed-neutron-devices 11/24
Pulsed Neutron Devices 291
references indicate methods for dealing with the problem.2 For saturationdetermination, the interpretation of the measurement is questionable if thewater salinity is less than 100,000 ppm and if the porosity is below 15%.This is particularly true in shaly zones, due to the limited range of X-variationwith saturation.
*0 1
Porosity
Figure 13-5. A graphical solution of water saturation from the measurement ofE,when porosity isknown.
Perhaps the most successful application of this type of measurementis inthe time-lapse technique. In this procedure, the change in saturation between
two runs in a producing reservoir can be determined directly from thedifference between the two measuredC values, the difference in , and &,,and the porosity value, i.e.:
Uncertainties in the quantities suchas La &, and clay volume disappear inthis differential measurem ent technique.
To illustrate the behavior of a pulsed neutron log, referto Fig. 13-6,
which shows carbonate and shaly sand sections of the simulated reservoir.Notice that in this presentation format theC and GR anticorrelate. Thus, highcapture cross sections correlate with highGR and thus, presumably, clay.Also the presentation of theC curve is in the same manneras other porositytools (increasing to the left, or to the bottom, depending on how you hold thelog). Also it indicates higher water saturation in a manner similar to the

7/22/2019 13. Pulsed Neutron Devices
http://slidepdf.com/reader/full/13-pulsed-neutron-devices 12/24
292 Well Logging for Earth Scientists
Figure 13-6. A typical presentation of a C log in the simulated reservoir.

7/22/2019 13. Pulsed Neutron Devices
http://slidepdf.com/reader/full/13-pulsed-neutron-devices 13/24
Pulsed Neutron Devices 293
2.70 2.60 2.50 2.40 2.30 2.20
Density (g/crn3)
Figure 13-7. A cross plot of c and P b from a zone of the simulated reservoir.Since the interval used containsno hydrocarbon, the determination ofI; s possible.
resistivity logs. The zone below 12200', in Fig.13-6, has been plotted as afunction of the corresponding density values and shown in Fig. 13-7. Atrend line of probable 100% water saturation is shown. The very lowporosity portions are easy to identify, as is the cluster of "shale" points.
PULSED NEUTRON SPECTROSCOPY
Induced gamma ray spectroscopy tools are a slightly more complex family ofpulsed neutron tools. They exploit the identification of gamma rays resultingfrom neutron interactions with the formation nuclei rather than simply thetime behavior of the detected gamma ray flux. These reactions are of thethree general types discussed previously: capture, inelastic, and particle
reactions. In a ll three cases, the resultant nucleus is left in an excited statewhich decays, yielding gamma rays with energies which are characteristic ofthe particular nucleus which has undergone de-excitation. In one type of tool,inelastic interactions are separated from captures by t i ~ n i n g . ~ . ~he inelasticinteractions, which occur only above an energy threshold that varies fromnucleus to nucleus, are produced by relatively high energy neutrons. Thus

7/22/2019 13. Pulsed Neutron Devices
http://slidepdf.com/reader/full/13-pulsed-neutron-devices 14/24
294
gamma rays detected during the neutron burst and immediately thereafter,before the neutron energy has fallen too far,are most likely to be inelastic.At sufficient time after the neutron generator is turned off, capture gammarays will begin to appear as the neutrons thermalize.
Well Logging for Earth Scientists
Inelas t ic Neut roni12 ..1 Scatter ing
J r (EY = 3 .68 Me V
Fast Neut ron
Dur ina Neu t ron Burs t 'ti-1 4 MeV-= Source Ene rgy
EY = 6 . 13 M e V
Figure 13-8. Inelastic reactions of interest in borehole logging applications.Adapted from H e r t z ~ g . ~
Figure 13-8 schematically indicates the important reactions which are
observed during the inelastic phase of operation of a pulsed neutronspectroscopy device. In one case, carbon is excitedby the fast neutron andemits a gamma ray of 4.43 MeV . Two other kinds of reactions with oxygenare shown. In one, the oxygen is transmuted to nitrogen. It subsequentlydecays and emits a gamma ray of 6.13 MeV. The third case is morecomplicated, in that the oxygen is transmuted to I3C, which then emits agamm a ray of 3.68 MeV.
An actual gamma ray spectrum in the inelastic mode, taken in an oil-filled sandstone, is shown in Fig.13-9. With the help of the notations in the
figure, it is possible to identify thepeaks of oxygen and carbon; the distortionresults from the use of an NaI detector. Because of this distortion, standardspectra are carefully determined inthe laboratory for elements with significantgamm a ray emission spectra. The set of inelastic standards used in theanalysis of a measured spectrum is shown in Fig.13-10. In order to quantifythe relative amounts of carbon and oxygen (and other elements), the spectrum

7/22/2019 13. Pulsed Neutron Devices
http://slidepdf.com/reader/full/13-pulsed-neutron-devices 15/24
Pulsed Neutron Devices 295
Figure 13-9, An experimental determined spectrum producedby inelastic reactions
with C and in an oil-filled sandstone. Adapted from H e r t z ~ g . ~
Figure 13-10. Standard spectra for determining the relative signals dueto carbonand oxygen in the spectrum of Fig.13-9. Adapted from H e r t z ~ g . ~

7/22/2019 13. Pulsed Neutron Devices
http://slidepdf.com/reader/full/13-pulsed-neutron-devices 16/24
296 Well Logging or Earth Scientists
measured in the borehole is compared to a linear sum of weighted standardspectra. The weights applied to eachof the standards is varied until the sumis, in a least-squares sense, the bestfit to the observed spectrum. The weightsthen represent the relative concentrationof the elements in the standard set.Another measurement system takes amore direct approach and uses thecounting rate in windows at appropriate locations in the spectrum todetermine the C/O ratio.5
ma.-
Dolomi te
LimestoneDolomi te
0.2 SandstoneLimestone
-
0 10 20 30 40
Porosi ty (P.u.)
Porosi ty (p.u.1
Figure 13-11. The ratio of elemental carbon to oxygen as a function of porosity andoil saturation compared to the tool response COR. Adapted fromH e r t z ~ g . ~
The interest in making the inelastic measurements (which is the only wayto produce gamma rays from carbon and oxygen) canbe understood from aglance at Table 13-4 . There is a great contrast between the atomic carbonand oxygen densities in water and in oil. The upper portion of Fig. 13-11shows the effect of oil saturation on the elementalC/O ratio as a function ofporosity for limestone, dolomite, and sandstone.The lower portion illustrates

7/22/2019 13. Pulsed Neutron Devices
http://slidepdf.com/reader/full/13-pulsed-neutron-devices 17/24
Pulsed Neutron Devices 297
Density [6.023 IO”]
Anhydritc 0.087
W Wr 0.0560.85 0.061
Table 13-4. Comparison of atomic densities of carbon and oxygen (in units ofAvogadro’s number) in formation and fluids of interest. FromWestaway et aL3
the actual tool response; the relative spectral weights of carbon and oxygenare shown as a function of porosity and oil saturation. From this figure, it isclear that for clean formations of a given lithology the interpretation isrelatively straightforward. However, it can be complicated, for example, in acalcite-cemented sandstone which couldbe confused with the presence ofhydrocarbon. Also, an inherent difficulty in the measurement is imm ediatelyobvious. At low porosities the dynamic range of the C/O ratio, as a functionof water saturation , shrinks to zero. Examples of interpretation of this ratioin more complex situations can be found in References3 and 5.
Another mode of operation requires waiting sufficiently long after theburst to avoid the detection of the inelastic events. In this time regime, thegamma rays result from the capture of thermal neutrons. The spectrameasured in this mode are much like those shown in Fig.13-9. Theidentification and quantificationof elements from the capture reactions iscarried out by the use of standards in the same manneras described for theinelastic spectra.
In one type of logging eq~ipment,~he timing procedure for makinginelastic and capture measurements is shown in Fig.13-12. Its features
include inelastic data acquisition during the neutron burst, a backgroundmeasurement period immediately following, and then, after the neutrons arethermalized, a phase that records the capture gamm a rays.
In addition to providing a direct saturation measurement, the inducedgamma spectroscopy toolsare also very important for lithology determinationin complex situations. From induced capture gamma rays,a large number ofelements can be identified hydrogen, silicon, calcium, iron, sulfur, chlorine,and others. Lithology identification canbe made by comparing the yields ofparticular elements. For exam ple, anhydrite is easily identified by the strong
gamma ray yield from the sulfur and calcium comprising this mineral.Limestone can be distinguished from sandstone by comparing the silicon andcalcium yields. Num erous references show examples of this type ofprocedure, as well as interpretation schemes proposedby some servicecompanies.6i7 Chapter19 further discusses the application of thismeasu rement to the determination of formation mineralogy.

7/22/2019 13. Pulsed Neutron Devices
http://slidepdf.com/reader/full/13-pulsed-neutron-devices 18/24
298 Well Logging for Earth Scientists
Neutron Time-( psec)
Inelastic and Capture
y-ray /CaptureCount Rate
Burst Background Capture GateGate Gate
Spectral
Yields
SpectralYield
Burs t Gate
Inelastic=Burst Gate-0.5 Background
Sandstone
B H= 10
CSG=711+1.5 Cement
4 ~ 3 6
so= 00%
Capture Gate
,Data
Figure 13-12. Illustration of the timing requirements for determining gamma rayspectra du e to inelastic and thermal capture events. Included are two
typical spectra obtained from the two phases measured in anoil-saturated sandstone. Adapted from Hertzog
Although the foregoing description of the capabilities of inelastic andcapture spectroscopy sounds very promising, there are a few problemsinherent to making this type of measurement in the borehole. One of themost important is that inboduced by statistics. In the inelastic mode, theproduction of gamm a rays characteristic of carbon and oxygen is governed bythe cross sections, which are extremely small. Thus for realizable neutron
generator outputs, the detected gamma ray flux is much smaller than desiredfor reliable continuous logging. Another problem is associated with thedistortion in the gamma ray spectrum produced by the NaI detector. Thistype of detector does not have adequate resolution to do more than a crudeanalysis of the wealth of gamma rays emanating from a typical formation.
High resolution spectroscopic devices, on the other hand, may provide

7/22/2019 13. Pulsed Neutron Devices
http://slidepdf.com/reader/full/13-pulsed-neutron-devices 19/24
Pulsed Neutron Devices 299
enormous advances in mineralogical identification. Such devices use solidstate gamm a ray detectors having energy-resolving power, orders ofmagnitude better than NaI. To illustrate the energy resolution afforded by theGe detector, see Fig 13-13, which shows the spectrum obtained with a Gedetector in an ore sam ple containing T i0 2 at a concentration of0.2 byweight. In addition to the gamma rays associated with Ti, a large number ofother isotopes have been identified. It can be seen that the identification andquantification of the multitude of gamma ray lines is clearly one of theproblems of this future well logging technique.
Spectrum wi th TiOq - 0.2%
5000
y 4000
a
3000
2000
1000
4750 5000 5250 5500 5750 6000 6250 6500 6750 7000 7250 7500Energy (keV)
i 0
Figure 13 13. Spectrum measured from thermal neutron absorption in an ore samplecontaining 0.2% by weight of TiOz. From Schweitzerand M a ~ ~ e n t e . ~
APPENDIX
A Solution of the Time-dependent Diffusion Equation
The time-dependen t diffusion equation for the density of thermal neutrons, n,is given by:
an Ds - nvz -V2n,a t V
where v is the thermal speed. [Com pare it toEq. (1) of Chapter 12 whichwas for the steady-state case; the time derivativewas zero.] After the burst,the source term becom es zero, and the governing equation is:
an D-nvC + -V2n ,a t V

7/22/2019 13. Pulsed Neutron Devices
http://slidepdf.com/reader/full/13-pulsed-neutron-devices 20/24
300 Well Logging for Earth Scientists
or
DIt is the term -V2n which is absent from the global analysis performed
earlier. By comparing Eq. (A-1) with the result from the global model, anapparent decay time of the neutron population,2 can be anticipated. Theglobal behavior of the neutron population was givenby:
V
t-N = Noe = NoeVza,
from which the decay time,T, can be identified as:
In this manner, the apparent decay time constant of the neutron population,T,, can be seen from Eq. (A-1) to be the sum of two terms: an intrinsic timeconstant and a diffusion time constant. The intrinsic time constant is givenby:
- v z ,Tint
- -
and the diffusion time is definedas:
1 D V2n_--9
z~~ v n
so that the local apparent time relationship is given by:
1 1 1- = - + -
Ta Tint Tdiff ’
which was given in Eq. (4). Thus the local decay rate contains twocomponents: one related to the absorptive properties of the medium, and thesecond the result of neutron diffusion. In order to evaluate the diffusioncomponent of apparent decay andto demonstrate that its value is position-dependent, a solutionof Eq. (A-1) is required. In the case of a point sourcein an infinite homogeneous medium,it should bear some resemblance to thesolution we saw in Chapter12 but with an exponential time dependence withthe characteristic timeT, in it. The exact relation is found to be:
?
- - 4 0 . : + 3Tint e
D ’
1
n(r,t) = noe(LZ - 3‘2
V
where the intrinsic decay timeTint is given by --C.V

7/22/2019 13. Pulsed Neutron Devices
http://slidepdf.com/reader/full/13-pulsed-neutron-devices 21/24
Pulsed Neutron Devices 301
Using this solution, the time constantzdiff associated with the diffusioncan be computed from:
1 D V2n---Tdiff v n
For the case of radial dependence only, the operatorV2 can be written as:
l a av2 = - -z a r ( * x )
Applying this to the solution given above, we find:
D23-1 V V-=
zdiff 2(L:+- D t) 4(L:+-ty D *V V
This demonstrates that the diffusion componentof the apparent decay timewill be dependent on the position of observation as expected. Also, since theneutron flux gradient will change with time, the rate of d iffusion will decreasewith time, which explains whyzdiff is not a time "constant."
The object of the die-away measurement is to determine the formation orintrinsic time decay constant. Since the expression for the apparent timedecay of the neutron population contains the position, r, at which theobservation is made, there seems to be some hope for locating the observationpoint at a position at which the apparentz will equal the intrinsic value. Thiscondition will be true at a distance r, givenby:
= 6(L: + D/v t) .However, this expression contains L,, which will vary with porosity and,ofcourse, time. Thus no observation position will be entirely suitable.Thismay explain the controversy surrounding the magnitude of the diffusioncorrection;* it is tool-design dependent.
The appropriate spacing in 20-PU limestone for an observation time at100 psec can be estimated using a slowing-down lengthof 12 cm, and adiffusion coefficient,D of 0.75 cm, and the thermal neutron velocityof 0.22cmlpsec. This yields a distance of about 55 cm. In the logging application,consisting of a borehole and formation, it is generally observed that thefarther the spacing, the closer will the measured value ofz approach theintrinsic value (see Fig. 13-4).
References
1. Schultz, W. E., Smith, H. D., Jr., Verbout, J. L., Bridges, J. R., andGarcia, G. H., "Experimental Basis for a New Borehole CorrectedPulsed Neutron Capture Logging System," Paper CC, CWLS-SPLASymposium, 1983.

7/22/2019 13. Pulsed Neutron Devices
http://slidepdf.com/reader/full/13-pulsed-neutron-devices 22/24
302 Well Logging for Earth Scientists
2. Hoyer, W. A., ed., Pulsed Neutron Logging SPWLA, Houston, 1979.
3. Westaway, P., Hertzog, R., and Plasek, R. E., "The Gamm aSpectrometer Tool, Inelas ic and Capture Gamm a-Ray Spectroscopy
for Reservoir Analysis,'' Paper SPE 9461, SPE Fifty-fifth AnnualTechnical Conference and Exhibition, 1980.
4. Hertzog, R. C., "Laboratory and Field Evaluationof an Inelastic-Neutron Scattering and Capture-Gamma Ray Spectroscopy Tool,"Paper SPE 7430, Fifty-third Annual Technical Conference, SPE ofAIME, 1978.
5. Oliver, D. W., Frost, E., and Fertl, W. H., "ContinuousCarbodoxygen Logging: Instrumentation, Interpretive Concepts and
Field Applications," Paper 'IT, SPWLA Twenty-second AnnualLogging Symposium, 1981.
6. Gilchrist, W. A., Jr., Quirein, J. A., Boutemy,Y. L., and Tabanou, J.R., "Application of Gamma Ray Spectroscopy to FormationEvaluation," Presented at SPWLA Twenty-third Annual LoggingSymposium, 1982.
7. Flaum, C., and Pirie, G., "Determination of Lithology from InducedGamma Ray Spectroscopy," Paper H, SPWLA Twenty-secondAnnual Logging Symposium, 1981.Hearst, J. R., and Nelson, P., Well Logging f o r Physical PropertiesMcGraw-Hill, New York, 1985.
9. Schweitzer, J. S . and Manente, R. A., "In-Situ Neutron-InducedSpectroscopy of Geological Formations with Germanium Detectors,"American Institute of Physics Conf. Pr oc . Vol. 125, 1985.
10. Clavier, C L., Hoyle, W. R., and Meunier, D., "Quantitative
Interpretation of Thermal Neutron Decay Time Logs,"J P T Vol. 23,1971.
8.
Problems
1. Figure 13-1 shows C as a function of salinity. Since C has a linear
volumetric mixing law, how do you explain the nonlinearity shown inthe figure?
2. Show that the constantof proportionality between2 and - s 4330 psec,
by considering the speed of thermal neutrons and the dimensions ofcapture units.
1c
7/22/2019 13. Pulsed Neutron Devices
http://slidepdf.com/reader/full/13-pulsed-neutron-devices 23/24
Pulsed Neutron Devices 303
Using the data of Table 13-1, com puteC or NaCl whose density is 2.17g/cm3. Express the answer in capture units.
You are using a pulsed neutron device to log a well of a limestonesection in a secondary recovery project. Fresh water injection wells arelocated in the vicinity. The original formation water was know n tocontain 120 kppm NaCI.
a. Construct an interpretation chartto convert X o water saturation asa function of density in the limestone section.
In the lowest section of the limestone, the porosity is20 PU andthe temperature is 100OC. The LLD reading is 2.75 LkM, and C s12 cu. Calculate S, from the laterolog and C. What is areasonable explanation for the discrepancy?
Quantify the cause of the discrepancy.
b.
c.
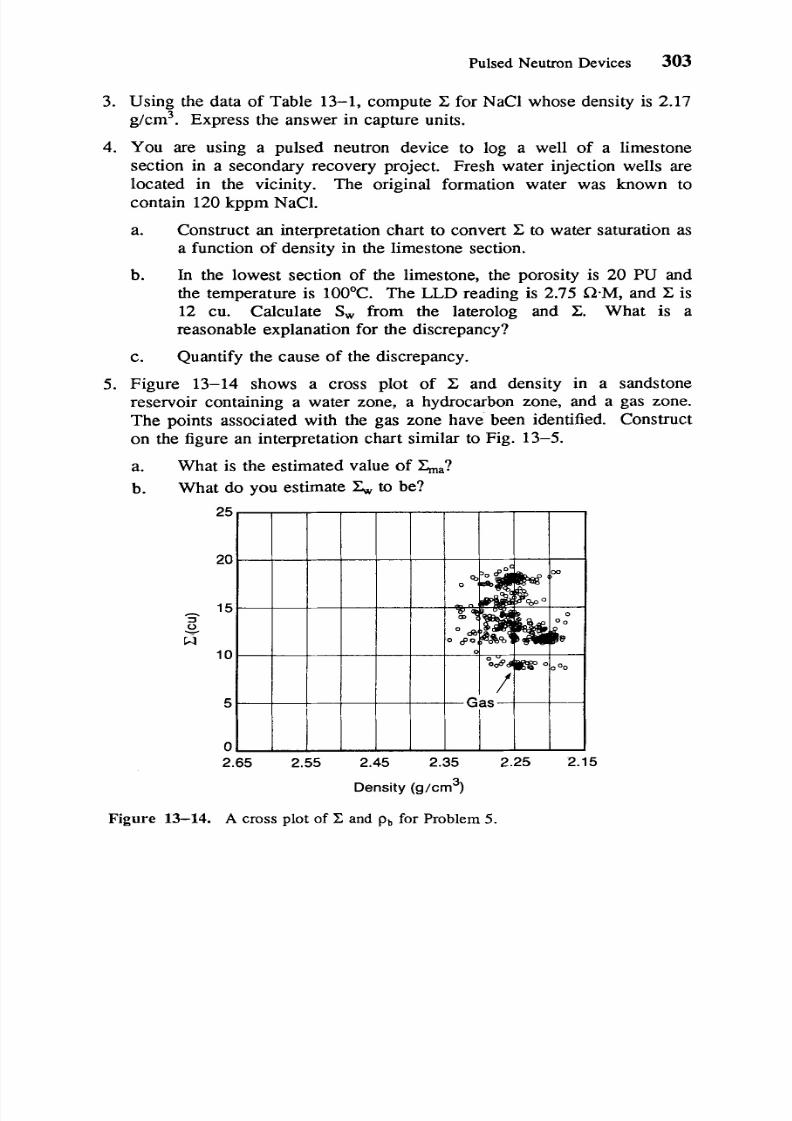
Figure 13-14 shows a cross plot of C and density in a sandstonereservoir containing a water zone, a hydrocarbon zone, and a gas zone.The points associated with the gas zone have been identified. Constructon the figure an interpretation chart similar to Fig. 13-5.
a.
b.
What is the estimated valueof La?
What do you estimate& to be?
2.65 2.55 2.45 2.35 2.25 2.15
Density (g/crn3)
Figure 13-14. A cross plot of Z and pb for Problem 5.

7/22/2019 13. Pulsed Neutron Devices
http://slidepdf.com/reader/full/13-pulsed-neutron-devices 24/24
304 Well Logging for Earth Scientists
6 . In the well of Problem 5, the water resistivity is known tobe 0.18 C2.min a zone at 115'F. Assuming that the water contains NaCl only, whatvalue of C, oes this imply?
a.b.
What is the value of S, in the water zone, using this new input?The induction log clearly sees this zone as100% water: however,the drilling fluid is oil-based mud. What does this say about therelative depth of investigationof the C measurement?


