
1
Financial Expert CEOs and Earnings Management around
Initial Public Offerings
Dimitrios Gounopoulos, Hang Pham1
This Version: April, 2016
Abstract
We study whether the financial experience of chief executive officers (CEOs) is associated with earnings
management around initial public offerings (IPOs). Examining the sample of U.S. initial public offerings
(IPOs) from 2003 to 2011, we find that newly listed firms with financial expert CEOs are less likely to
engage in earnings management than those with non-financial expert CEOs. We also document that for
IPO firms managed by financial expert CEOs the at-issue earnings management is positively associated
with future accounting performance and not significantly related to post-issue long-term stock abnormal
returns. This indicates that financial expert CEOs tend to be informative in financial reporting in order to
allow investors to properly gauge the fair value of the firm. Overall, our findings support the importance
of CEO financial experience in the provision of higher quality financial reporting.
JEL classification: G10, G14, G3
Keywords: IPOs, Financial expertise, CEOs, Earnings management
1Dimitrios Gounopoulos ([email protected]) is a Professor at Newcastle University Business School, University of
Newcastle, Newcastle Upon Tyne, NE1 4SE, UK; Hang Pham ([email protected]) is a Lecturer at the School of Business,
Management and Economics, University of Sussex, Falmer, Brighton BN1 9SL, UK. We are grateful to Pawan Adhikari, Thankom
Arun, Silvia Gaia, John Forker, Kelim Jayasinghe, Arthur Kraft, Anastasia Kopita, Gorge Kouretas, Stuart Manson, Paul McGuinness,
Teerooven Soobaroyen, Theodore Sougiannis, Hardy Thomas Shahzad Uddin and seminar participants at the University of Essex and
Athens University of Economics and Business for valuable comments and suggestions.
16224/13/16

2
1. Introduction
Earnings are commonly used by investors to evaluate the prospective performance of the firm.
Therefore, managers may be tempted to manipulate earnings to influence short-term stock prices. The
incentives to manage earnings are stronger around initial public offerings due to the high level of
information asymmetry between managers and investors. Previous research on earnings management
around IPOs provides evidence of positive abnormal accruals in the issue year and a negative relation
between at-issue earnings management and post-issue long-run stock performance, suggesting that
managers manipulate earnings to mislead investors (Aharony et al. 1993; Friedlan 1994; Teoh et al.
1998a; Teoh et al. 1998b; Roosenbloom and Van De Goot 2003; DuCharme et al. 2004; Gramlich and
Sorensen 2004)2.
Researchers have attempted to understand factors driving earnings management such as firm-
level factors (e.g., firm size, firm performance, leverage, growth, corporate governance, financing
needs, target beating, the involvement of external parties such as underwriters, venture capitalists, and
auditors), and external factors (e.g., capital requirements, and regulations) (see Dechow et al. (2010)
for a review). Based on the upper echelons theory (Hambrick and Mason 1984; Hambrick 2007) which
predicts that managerial background characteristics can partially influence top managers’ decision
making, increasing attention has been drawn to examine another potential determinant of accounting
choices: manager specific factors. Particularly, various studies link earnings quality with some
managerial characteristics such as CEO reputation (Francis et al. 2008), superstar CEOs (Malmendier
and Tate 2009), and managerial ability (Demerjian et al. 2013). However, to the best of our knowledge,
the impacts of CEO financial experience on earnings management around IPOs remain unexplored.
The financial experience of CEOs may play an important role in determining the quality of
financial reporting. Past financial experience equips CEOs with deeper understanding of financial and
accounting issues and structures, thus, allows them to be more capable of providing higher quality
financial reports. Moreover, financial expert CEOs tend to have affiliation with or accreditation from
professional organisations, which requires them to adhere to ethical codes of conduct. This
considerably influence their risk attitudes towards more conservatism in financial reporting. In
addition, misrepresentations in financial reporting will reflect badly on the career and adversely affect
the reputation of financial expert CEOs. Thus, financial expert CEOs will have lower incentives to
manipulate earnings. Although CEOs are not directly involved in overseeing the financial reporting
2 On the contrary, Ball and Shivakumar (2008) find the evidence of more conservative financial reporting among the sample of UK
IPOs.
3
process, they can set the tone from the top and influence the decisions of CFOs (Feng et al. 2011).
Additionally, the financial knowledge also facilitates the communication between CEOs and CFOs
and allows them to work effectively with each other to develop sound accounting policies. Moreover,
financial expert CEOs are more likely to appreciate the importance of accounting information in
influencing investors’ evaluation of the firm and better aware of the types of information demanded
by capital market participants. Therefore, they are more likely to effectively communicate financial
information to the market (Custódio and Metzger 2014).
Therefore, we are motivated to investigate whether the variation in IPO firm’s earnings
management is partially attributable to CEO’s past financial experience. We pose two main research
questions: (1) whether IPOs with financial expert CEOs exhibit lower earnings management in the
offering year, and (2) whether financial expert CEOs exercise their accounting discretion for
informative purposes. To address these questions, we examine a sample of U.S. common share IPOs
over the period 2003-2011. We gather the detailed biographies of all CEOs in our sample which are
available on BoardEx and prospectuses from SEC’s EDGAR database. We define financial expert
CEOs as those having past experience in either banking or investment firms, large auditing firms, or
financial related roles such as an accountant, a treasurer, a VP of finance, and a CFO. We also test the
robustness of our results using more specific measures of financial expertise, specifically, experience
as a CFO and a CPA certification. In addition, utilising the detailed data on the CEO’s work history,
we measure the diversity of CEO financial experience and examine the association between financial
experience diversity and earnings management. We use four variables to proxy for the diversity: the
number of firms in which the CEO has financial experience, the number of financial related roles that
the CEO has, the financial experience at another firms, and the length of time of the financial
experience. We also use the principal component analysis to create a single variable - financial
experience diversity index that accounts for the effects of all the four individual factors. Our results
are robust for alternative measures of CEO financial experience.
An important concern of the study of the impact of managerial characteristics on corporate
decisions is the selection bias which occurs due to the non-random matching of CEOs to firms. With
this study, the earnings management may be driven by some unobserved firm and/or CEO
characteristics that are correlated with CEO financial experience. To account for this endogenous
selection bias issue, we employ the propensity score matching method. We also check the robustness
of our results using alternative econometric approaches which are commonly used to address the
selection concerns, specifically, instrumental variable two-stage least square model, Heckman (1979)

4
two-step treatment effect model, and maximum likelihood treatment effect model. Our results still hold
after controlling for the endogenous selection.
Our main finding is that financial expert CEOs are less likely to engage in earnings
management around IPOs. The influence of financial expert CEOs on earnings management is
strengthened when the CEO has more decision-making power. Specifically, among IPO firms with
financial expert CEOs, earnings management in the offering year is lower for firms with more powerful
CEOs. We also document the positive link between at-issue abnormal accruals and subsequent
accounting performance for IPO firms with financial expert CEOs; however, the relationship is
insignificant for firms with non-financial expert CEOs. In terms of stock performance, while IPO firms
with non-financial expert CEOs that engage in aggressive earnings management in the issue year
exhibit negative post-issue long-run stock performance, the stock performance of IPO firms with
financial expert CEOs following the issue is not associated with the earnings management in the
offering year. The evidence suggests that while non-financial expert CEOs tend to manage earnings to
mislead investors, financial expert CEOs are more likely to provide investors informative financial
figures to allow them to better gauge the fair value of the firm.
Our study makes several contributions to the IPO, earnings management, and management
literature. To the best of our knowledge, our paper provides the first empirical evidence on the
association between CEO financial experience and earnings management in the IPO setting. It adds to
the growing literature on determinants of earnings management by highlighting managerial financial
experience as a new dimension of influencing factors which can be further explored in future research.
The paper also contributes to the literature of upper echelons theory by providing consistent evidence
with the theory’s prediction of the influence of managerial functional experience on corporate strategic
choices. Moreover, our findings also provide implications for firms considering to recruit CEOs with
financial experience.
The manuscript is organised as follows. Section 2 discusses the related literature and hypothesis
development. Section 3 describes the sample and methodology. Section 4 explains our empirical
models of the effect of financial expert CEOs on earnings management around IPOs and the
association between at-issue earnings management and the post-issue accounting and stock
performance. Section 5 presents our empirical results. Section 6 provides additional tests and
robustness checks. Finally, section 7 concludes the paper.

5
2. Related literature and hypothesis development
2.1. Earnings management around IPOs
Agency theory is the main theory governing the study of earnings management around IPOs.
The theory is primarily concerned with the principal-agent problem which occurs due to the conflicts
of interests between the principal, who provides capital for the firm such as shareholders, and the agent,
who manages day to day activities of the firm such as company executives. Principal-agent issue arises
when information asymmetry is present between the two parties (Jensen and Meckling 1976). Since
the principal does not involve directly in the management of the firm and cannot monitor the agent
completely, they have less information about the firm and the agent’s intentions. The information
asymmetry creates the problems of adverse selection, which happens when inside managers have more
information relevant to decision making than outside investors, and moral hazard, which happens when
informed managers behave inappropriately from the perspective of less informed investors.
Information asymmetry is a permanent issue within the IPO setting. Managers can mitigate the
problem by exercising their accounting discretion to communicate information about the timing,
magnitude and risk of future cash flows to the market; however, self-interested managers may be
tempted to exploit the information disparity to mislead less informed investors and manipulate earnings
to influence stock prices (Fields et al. 2001).
There are two contrasting arguments over earnings management around IPOs. The first
argument suggests that IPO can be viewed as an external financing opportunity. Thus, managers have
the incentive to alleviate the information asymmetry to improve price efficiency and lower the cost of
capital. They will employ accounting choices to convey private information to the market to signal the
firm’s future prospects (Watts and Zimmerman 1978; Healy and Palepu 1993; Guay et al. 1996;
Subramanyam 1996; Fields et al. 2001; Kallunki and Martikainen 2003; Louis and Robinson 2005;
Herbohn et al. 2010). The opposing argument postulates that IPO is an event for primary investors to
cash their stock. Thus, managers have strong incentives to maximize their gains by overstating
earnings to increase short-term stock prices. If managers manipulate accruals to boost current reported
earnings, the reversal of accruals in the subsequent period will deteriorate future earnings. This causes
investors to adjust downward their firm evaluation, resulting in the decrease in stock prices in the long-
run. Therefore, opportunistic earnings management in the issue year will adversely influence stock
performance in the post-issue period. This notion of opportunistic earnings management around IPOs
is supported by various studies. The early studies of Aharony et al. (1993) and Friedlan (1994) state
that managers are involved in accrual-based earnings management before the stock offering in an effort
to increase reported earnings. Teoh et al. (1998a) find positive abnormal accruals in the issue year and

6
a negative association between the accruals and post-issue long-run stock performance, indicating that
managers manipulate earnings around IPOs to mislead investors. Several later studies also attest the
aggressive use of accruals during the stock offerings to overstate earnings (DuCharme 2001;
Roosenboom et al. 2003; DuCharme et al. 2004; Marquardt and Wiedman 2004; Morsfield and Tan
2006; Lee and Masulis 2011; Alhadab et al. 2014). On the other hand, Ball and Shivakumar (2008)
suggest that the stringent monitoring from various parties such as regulators, auditors, analysts, and
the press will discourage IPO firms to engage in aggressive earnings management. In their study, they
analyse a sample of UK firms which have financial statements filed as private firms comparable to
those restated and included in the IPO prospectuses, and find that IPO firms are more likely to be
conservative in their financial reporting. However, Lo (2008) argues that the restriction in the sample
selection by Ball and Shivakumar (2008) may exclude firms that engage in earnings management
since managers tend to hide their misbehaviours by providing non-comparable reports.
2.2. CEOs’ financial experience and earnings management around IPOs
The neoclassical view of the firm assumes that managers are homogenous; thus, different
managers would make the same rational choices if they confronted with the same economic
circumstances (Bertrand and Schoar 2003; Ge et al. 2011). Under this view, corporate policies would
not be affected by managerial characteristics. In contrast, the upper echelons theory emphasises the
influence of managerial heterogeneity on corporate outcomes. The theory suggests that managerial
personalities, backgrounds, and experiences such as age, socioeconomics background, formal
education, and functional track can partially affect managers’ interpretations of the situations and
problems they have to deal with and, in turn, impact their decision making (Hambrick and Mason
1984; Hambrick 2007).
Since the development of the upper echelons theory, voluminous studies have empirically
examined the correlation between various manager specific characteristics and corporate decisions,
and provided findings consistent with the theory. Prior empirical studies have shown that managerial
heterogeneity has significant explanatory power for corporate decisions and performance (Bertrand
and Schoar 2003; Adams et al. 2005; Malmendier and Tate 2005, 2009; Malmendier et al. 2011;
Kaplan et al. 2012; Malmendier and Tate 2008; Graham et al. 2013). Most studies focus on education
(Malmendier and Tate 2005), personal characteristics (Kaplan et al. 2012), and personal traits
(Malmendier and Tate 2005, 2008; Malmendier et al. 2011; Graham et al. 2013). Recent research has
further examined the work experience of CEOs. Custódio and Metzger (2013); Custódio et al. (2013)
study CEOs’ work experience in the context of diversifying M&A and show that CEOs with industry

7
expertise perform better in deal negotiations and pay lower premium for the target. The findings of
Custódio et al. (2013) suggest that CEOs with more general managerial skills are better paid than
specialist CEOs, suggesting the importance of general managerial skills over firm-specific skills in
hiring CEOs. Moreover, Custódio and Metzger (2014) provide evidence that CEOs’ past financial
experience influences firm’s financial policies such as cash holdings, leverage, and payout policies.
Prior literature also documents that managers’ characteristics can affect their accounting
choices. Bamber et al. (2010) argue that idiosyncratic differences in managers play a significant role
in firms’ voluntary financial disclosure choices. Managers with financial, accounting, and legal
backgrounds, those born before World War II, and those with past military service tend to be more
conservative in disclosures. Dyreng et al. (2010) document that individual executive effects
significantly influence firms’ tax avoidance. Moreover, Francis et al. (2008) report a negative
association between earnings quality and CEO reputation which is measured by press coverage. They
argue the reason for this correlation is because firms with poor earnings quality tend to hire reputed
CEOs for the expertise that they can bring to the firm, rather than CEOs taking actions to manipulate
earnings to influence market perceptions. Malmendier and Tate (2009) investigate behavior changes
of CEOs after winning prestigious awards in the business press and find that EM increases
considerably subsequent to the award. Demerjian et al. (2013) show that managerial ability is
associated with greater earnings quality represented by fewer subsequent restatements, higher earnings
persistence, fewer errors in bad debt provision, and better accrual estimations. Jiang et al. (2013) study
Chinese listed firms and find evidence that the appointment of financially experienced CEOs reduces
real earnings management, and thus provides higher quality earnings information.
Despite prior findings of the influence of managerial characteristics on accounting decisions,
it remains an empirical question whether CEO financial experience manifest itself in IPO firms’
financial reporting behaviours – in other words, whether IPO firms with financial expert CEOs provide
higher quality financial information. CEOs who have past financial experience generally have more
technical training and deeper understanding of accounting and financial concepts and structures.
According to upper echelons theory, managers with financial experience will draw on their prior work
experience when making accounting decisions. Therefore, we expect that financial expert CEOs will
be more capable of monitoring the accounting process and providing higher quality financial
statements.
Poor financial reporting will also reflect badly on the career of CEOs with a track record as a
financial expert. Furthermore, CEOs with financial experience tend to be affiliated with or accredited
by professional organisations, thus, they are required to adhere to strict ethical codes of conduct. This
considerably affects their risk attitudes towards financial reporting, specifically, they will be more
8
conservative in their financial reporting. Moreover, since IPO firms face stringent monitoring from
SEC and various parties such as auditors, investors, analysts, and the press, if the financial reporting
misbehaviours are detected, it will severely affect the reputation of financial expert CEOs. Therefore,
we expect that financial expert CEOs will have lower incentives to engage in earnings management
around IPOs.
In addition, although CFOs are directly involved in overseeing the accounting process and the
preparation of financial statements, CEOs may set the tone from the top and influence the decisions of
CFOs (Feng et al. 2011). The conjecture that the financial expertise of CEOs may influence their
accounting decisions is further supported by the theory of top management teams (Bunderson and
Sutcliffe 2002; Cannella et al. 2008). This theory posits that the common functional backgrounds
facilitates the communication among top management team members. Therefore, a CEO with financial
background will be able to monitor the firm’s CEO more effectively to strengthen the firm’s
accounting policies. Based on existing theories and empirical evidence, we predict that IPO firms with
financial expert CEOs will exhibit lower earnings management. Our first hypothesis is:
Hypothesis 1: IPOs with financial expert CEOs are less likely to engage in earnings management
in the offering year.
CEOs who have past financial experience should better understand how investors view the
firm’s financial statements and reports. Moreover, their intensive interactions with the market allow
them to appreciate the information needs and the types of information demanded by capital market
participants. They will also be highly aware of the importance of disclosing relevant and useful
information in order to lower the cost of capital for the firm. Especially, their financial expertise allows
them to effectively communicate financial information to investors (Custódio and Metzger 2014).
Furthermore, as mentioned before, the understanding of CEOs about financial and accounting issues
will enhance the communication between CEOs and CFOs. Thus, financial expert CEOs will be able
to work more effectively with the firm’s CFO to develop a financial reporting strategy in which
accounting choices can serve as a channel to convey private information to the market to signal the
firm’s future prospects. Therefore, we expect that financial expert CEOs will be more likely to provide
investors with informative financial reporting. If financial expert CEOs use earnings management in
the offering year for informative purposes, the managed accruals in the offering year will be positively
linked to the accounting performance in the subsequent period. Moreover, since the earnings in the
offering year truly reflects the firm’s prospective performance, there will be no significant abnormal
stock returns in the post-issue period. This leads us to our next hypotheses:

9
Hypothesis 2a: At-issue earnings management is positively linked to post-issue accounting
performance for IPO firms with financial expert CEOs.
Hypothesis 2b: IPO firms with financial expert CEOs that aggressively manage earnings in the
issue year do not exhibit significant post-issue long-run abnormal stock returns.
3. Sample and methodology
3.1. Sample selection
We retrieve our sample of U.S. common share IPOs from 1st January 2003 to 31st December
2011 from the Securities Data Corporation (SDC) New Issues database. We start our sample from
2003 since we focus on examining the earnings management of IPOs after the Sarbanes-Oxley Act
(2002). The U.S. congress passed the Sarbanes-Oxley Act in 2002 as a respond to a number of
corporate accounting scandals such as the cases of Enron and World.com in the early 2000s. The Act
includes many stringent regulations to strengthen financial disclosures and improve corporate
governance practices. Lobo and Zhou (2006) find that the SEC’s requirement that financial statements
be certified by CEOs and CFOs influences managerial behaviors towards more conservatism in
financial reporting. Furthermore, Cohen et al. (2008) also report a decrease in accrual-based earnings
management in the post-Sarbanes Oxley period. We require data three years after the IPO to analyse
post-issue long-term performance; thus, our sample ends in 2011.
Following prior IPO literature, we exclude IPOs with an offer price below $5 per share, limited
partnership, unit offerings, rights issues, American depositary receipts (ADRs), leveraged buyouts
(LBOs), closed-end funds, real estate investment trusts (REITs), spin-offs, privatizations, and financial
institutions. After applying the restrictions, we collect 788 IPOs in our initial sample. We match the
sample with BoardEx to obtain CEO characteristics such as CEO age, gender, work experience, and
education. We search SEC’s EDGAR database for IPO firm’s prospectuses and proxy statements to
gather data on executive compensation, board meetings, and CEO characteristics which are missing
on BoardEx. Regarding CEO reputation, we employ Factiva to track the number of business related
articles in which the CEO is cited over the five year period prior to the offering. In our search for the
articles, we include both CEO’s full name and company name, and limit the results to selected business
publications including major U.S. newspapers (Wall Street Journal, New York Times, Washington
Post, USA Today), top international publications (FT, Asian Wall Street Journal, European Wall Street
Journal, International Herald Tribune), and press releases (PR Newswire, Business Wire). We perform

10
an additional data match with Compustat to obtain accounting data, and with Centre for Research in
Security Prices (CRSP) to collect stock price data. All variable definitions are detailed in Appendix A.
3.2. Earnings management methodology
We compute abnormal accruals as a proxy for earnings management using the cross-sectional
modified Jones (1991) model described in Dechow et al. (1995). The model has been widely used in
prior earnings management literature to measure abnormal accruals (Ye 2014; Doukakis 2014; Franz
et al. 2014). We run the following cross-sectional OLS regression in Equation (1) for each industry-
year with at least 10 observations. The industry is identified by two-digit SIC code, and we exclude
firms going public in three years’ time. This cross-section approach partially controls for industry-
wide changes in economic conditions that influence total accruals independent of managerial
manipulation (DeFond and Jiambalvo 1994; Kasznik 1999).
ti
ti
ti
ti
ti
titi
ti
TA
PPE
TA
SALES
TATA
TACC,
1,
.2
1,
,
1
1,
0
1,
. 1
(1)
where TACCi,t is total accruals computed as earnings before extraordinary items and discontinued
operations less cash flow from operations3; TAi.t-1 is lagged total assets; ∆SALESi,t is the change in total
sales from the fiscal year before the IPO to the fiscal year of the offering; and PPEi,t is the gross value
of property, plant and equipment. All continuous variables are winsorized at the 1 and 99 percentiles
to mitigate the influence of outliers.
The expected component of total accruals (NACCi.t) for the IPO sample is computed using the
coefficient estimates from Equation (1) as follows.
1,
.2
1,
.,
1
1,
0.
1
ti
ti
ti
titi
ti
tiTA
PPE
TA
RECSALES
TANACC
(2)
where ∆RECi.t is the change in receivables from the fiscal year before the IPO to the fiscal year of the
offering. The abnormal accruals (DACCi.t) are computed as the difference between total accruals and
expected accruals.
3 Following Hribar and Collins (2002), we compute total accruals using the cash flow approach to avoid the non-articulation problem
of the balance sheet method.
11
In addition, to mitigate the potential correlation between the abnormal accruals measured using
the Jones model and firms’ performance (Dechow et al. 1995), we employ the performance matching
procedure suggested by Kothari et al. (2005) to match an IPO firm to a non-IPO firm in the same two-
digit SIC industry and year with the closest ROA in the fiscal year before the offering. We allow the
difference in ROA within the range of +/- 10% of the IPO firm’s ROA. The matched firm’s abnormal
accruals are deducted from the IPO firm’s abnormal accruals to get the performance-matched abnormal
accruals for the IPO firm.
3.3. Sample descriptive statistics
Table 1 presents the distribution of our IPO sample from 2003 to 2011 by time and industry.
The majority of IPOs are concentrated from 2004 to 2006, which is consistent with the recovery of the
U.S. economy after the early 2000s recession. Subsequently, the IPO activity shows a considerable
decline due to the financial crisis of 2007-2008 before improving again from 2010. In addition, the
industry clustering is observed in our IPO sample. Approximately 40% of IPOs are in the computer
and high-tech industries (SIC codes 35, 36, 38, and 73).
[Please insert Table 1 about here]
Table 2 provides descriptive statistics for our overall IPO sample and the comparison between
IPO firms with financial expert CEOs and those with non-financial expert CEOs. We winsorize all
continuous variables at the 1 and 99 percentiles to mitigate the issue of outliers. Panel A shows
descriptive statistics of CEO characteristics.
[Please insert Table 2 about here]
Following Custódio and Metzger (2014), we define financial expert CEOs as those having past
experience in either banking or investment firms, large auditing firms (Pricewaterhouse, Deloitte, Ernst
& Young, KPMG, Arthur Andersen, Coopers, Touche Ross), or finance related roles (accountant,
treasurer, VP of finance, CFO). On average, 26% of IPO firms in our sample have financial expert
CEOs. In particular, 11% of the overall CEOs have past experience as a CFO, 10% in accounting-
related roles (i.e. auditor, accountant, and treasurer), 5% in banking, 3% as a VP of finance, and 13%
in other financial roles.
CEOs in our sample have the mean age of approximately 51, have been working as a CEO for
around 4.5 years, and hold an average of roughly 11% ownership of the firm. Moreover, only 3% of

12
the CEOs are female, 7% are firm founder, and 44% also hold the position of the chairman of the
board. The sample of IPO firms with financial expert CEOs and those with non-financial expert CEOs
have the mean values of CEO age, gender, tenure, ownership, founder, and duality in line with those
of the overall sample; and there is no significant differences in these CEO characteristics between the
two samples.
Furthermore, 77% of the CEOs hold a bachelor’s degree, 48% a master’s degree, 29% an MBA,
10% a PhD, and 5% a CPA certification. 16% of the CEOs are Ivy League alumni. The sample of IPO
firms with financial expert CEOs and those with non-financial expert CEOs show significant
differences in their CEOs’ education background. Specifically, compared to non-financial expert
CEOs, on average, more financial expert CEOs appear to have a bachelor’s degree (82% versus 76%),
an advanced management degree such as an MBA (36% versus 26%), and a professional certification
such as a CPA (15% versus 1%). However, a research degree such as a PhD is less popular among
financial expert CEOs (6% of financial expert CEOs versus 11% of non-financial expert CEOs). In
addition, financial expert CEOs are more likely to have graduated from an Ivy League institution than
non-financial expert CEOs (20% and 15% respectively).
Moreover, 69% of the CEOs are recruited from outside of the firm. Financial expert CEOs are
less likely to be hired externally than non-financial expert CEOs (64% and 71% respectively). The
CEOs in our sample become a CEO (either at the IPO firm or at another firm) at the mean age of
around 43. In terms of CEO reputation, on average, there are around 23 articles in major U.S. and
international newspapers and newswires over five years prior to the IPO mentioning about the CEO.
Regarding CEO compensation, the mean CEO equity compensation is $400,000, and the mean CEO
total compensation is $1,200,000. There are no significant differences in the CEO press coverage and
the CEO compensation between the two groups of IPO firms with and without financial expert CEOs.
Panel B illustrates firm and offering characteristics for all IPOs, IPOs with financial expert
CEOs, and IPOs with non-financial expert CEOs. Regarding firm characteristics, on average, IPO
firms in our sample are in operation for 20 years. They have mean leverage ratio of 0.42. In terms of
profitability, approximately 40% of IPO firms report loss in the fiscal year prior to the offering. The
average Altman’s Z-score is -5.86, suggesting that IPO issuers appear to be in financial distress. The
mean industry-adjusted ROA is -0.1 also indicates the underperformance of IPO firms compared to
the industry. Since IPO firms are generally not profitable, the mean ratio of retained earnings to total
equity is also negative (-0.71). The mean ratio of total capital expenditures to total assets is 0.12 and
R&D to total assets 0.11. Moreover, 16% of IPO firms have more than one business segment, 35% are
13
operating in the high-tech industry. The IPO firms’ board of directors meet quite frequently for an
average of nearly 8 meetings a year.
Regarding offering characteristics, issuers raise an average of $166 million in the stock
offering. They have the mean market value at the time of listing of $476 million and an average initial
return of 11%. The mean value of Tobin’s Q of 4.11 and book-to-market ratio of 0.30 reflect potential
perceived growth opportunities for IPO firms. On average, 45% of IPOs are underwritten by top-tier
investment banks, 83% audited by big four accounting firms, and 49% venture-backed. In addition,
IPO issuers in our sample have mean buy-and-hold abnormal returns of 4% three years after the
offering.
Some of the firm and offering characteristics appear to differ between IPOs with financial
expert CEOs and those with non-financial expert CEOs. Compared to IPO firms with non-financial
expert CEOs, those with financial expert CEOs tend to be younger (mean firm age of around 18 years
versus 21 years), have lower leverage ratio (mean leverage ratio of 0.38 versus 0.44), more profitable
(mean industry-adjusted ROA of -0.06 versus -0.11), and less R&D intensive (mean ratio of R&D to
total assets of 0.09 versus 0.12). Moreover, on average, lower proportion of IPOs with financial expert
CEOs are audited by big four auditors and supported by venture capitalists (80% and 41% respectively)
than issuers with non-financial expert CEOs (84% and 52% respectively).
With respect to our earnings management proxy - abnormal accruals, we rely on medians for
statistical inference because medians are less likely than means to be influenced by extreme
observations. The median value of abnormal accruals (-0.07) is significantly lower than zero,
suggesting that IPO firms are not likely to engage in income-increasing earnings management. Since
our sample covers the period from 2003 to 2011, this finding is consistent with prior literature which
documents that the magnitude of earnings management tend to decrease in the post-Sarbanes Oxley
(2002) period. IPO firms with financial expert CEOs and those with non-financial expert CEOs also
show significantly negative median abnormal accruals. However, issuers with financial expert CEOs
have lower abnormal accruals in the offering year than those with non-financial expert CEOs (-0.13
versus -0.06). The difference is strongly significant at the 1% level. This suggests that IPO firms with
financial expert CEOs tend to be more conservative in their financial reporting than those with non-
financial expert CEOs. We also presents the correlation matrix of our variables in Panel C. No
multicollinearity is detected among variables.
Our initial univariate result shows that IPO firms with financial expert CEOs are less likely to
engage in earnings management than non-financial expert CEOs. In order to provide more concrete
14
empirical evidence, we conduct multivariate analysis of the association between earnings management
and financial expertise of CEOs controlling for various determinants of earnings management in the
next section.
4. Empirical models
4.1. Financial expert CEOs and earnings management around IPOs
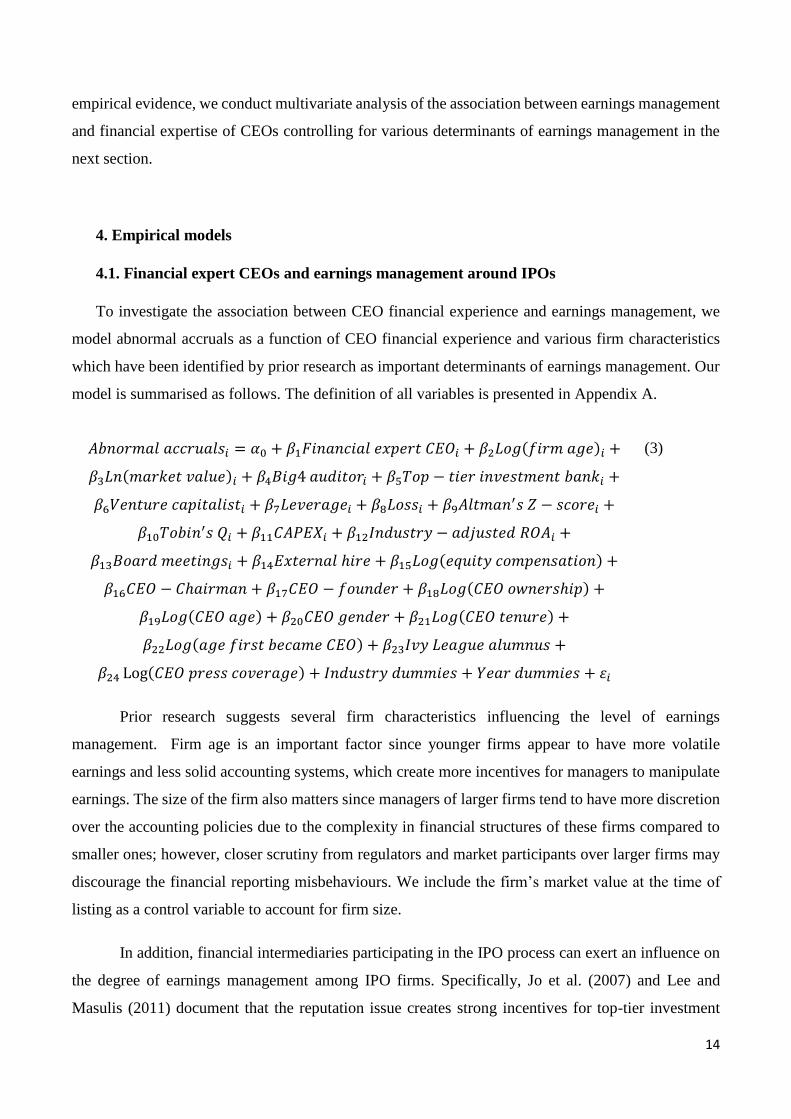
To investigate the association between CEO financial experience and earnings management, we
model abnormal accruals as a function of CEO financial experience and various firm characteristics
which have been identified by prior research as important determinants of earnings management. Our
model is summarised as follows. The definition of all variables is presented in Appendix A.
𝐴𝑏𝑛𝑜𝑟𝑚𝑎𝑙 𝑎𝑐𝑐𝑟𝑢𝑎𝑙𝑠𝑖 = 𝛼0 + 𝛽1𝐹𝑖𝑛𝑎𝑛𝑐𝑖𝑎𝑙 𝑒𝑥𝑝𝑒𝑟𝑡 𝐶𝐸𝑂𝑖 + 𝛽2𝐿𝑜𝑔(𝑓𝑖𝑟𝑚 𝑎𝑔𝑒)𝑖 +
𝛽3𝐿𝑛(𝑚𝑎𝑟𝑘𝑒𝑡 𝑣𝑎𝑙𝑢𝑒)𝑖 + 𝛽4𝐵𝑖𝑔4 𝑎𝑢𝑑𝑖𝑡𝑜𝑟𝑖 + 𝛽5𝑇𝑜𝑝 − 𝑡𝑖𝑒𝑟 𝑖𝑛𝑣𝑒𝑠𝑡𝑚𝑒𝑛𝑡 𝑏𝑎𝑛𝑘𝑖 +
𝛽6𝑉𝑒𝑛𝑡𝑢𝑟𝑒 𝑐𝑎𝑝𝑖𝑡𝑎𝑙𝑖𝑠𝑡𝑖 + 𝛽7𝐿𝑒𝑣𝑒𝑟𝑎𝑔𝑒𝑖 + 𝛽8𝐿𝑜𝑠𝑠𝑖 + 𝛽9𝐴𝑙𝑡𝑚𝑎𝑛′𝑠 𝑍 − 𝑠𝑐𝑜𝑟𝑒𝑖 +
𝛽10𝑇𝑜𝑏𝑖𝑛′𝑠 𝑄𝑖 + 𝛽11𝐶𝐴𝑃𝐸𝑋𝑖 + 𝛽12𝐼𝑛𝑑𝑢𝑠𝑡𝑟𝑦 − 𝑎𝑑𝑗𝑢𝑠𝑡𝑒𝑑 𝑅𝑂𝐴𝑖 +
𝛽13𝐵𝑜𝑎𝑟𝑑 𝑚𝑒𝑒𝑡𝑖𝑛𝑔𝑠𝑖 + 𝛽14𝐸𝑥𝑡𝑒𝑟𝑛𝑎𝑙 ℎ𝑖𝑟𝑒 + 𝛽15𝐿𝑜𝑔(𝑒𝑞𝑢𝑖𝑡𝑦 𝑐𝑜𝑚𝑝𝑒𝑛𝑠𝑎𝑡𝑖𝑜𝑛) +
𝛽16𝐶𝐸𝑂 − 𝐶ℎ𝑎𝑖𝑟𝑚𝑎𝑛 + 𝛽17𝐶𝐸𝑂 − 𝑓𝑜𝑢𝑛𝑑𝑒𝑟 + 𝛽18𝐿𝑜𝑔(𝐶𝐸𝑂 𝑜𝑤𝑛𝑒𝑟𝑠ℎ𝑖𝑝) +
𝛽19𝐿𝑜𝑔(𝐶𝐸𝑂 𝑎𝑔𝑒) + 𝛽20𝐶𝐸𝑂 𝑔𝑒𝑛𝑑𝑒𝑟 + 𝛽21𝐿𝑜𝑔(𝐶𝐸𝑂 𝑡𝑒𝑛𝑢𝑟𝑒) +
𝛽22𝐿𝑜𝑔(𝑎𝑔𝑒 𝑓𝑖𝑟𝑠𝑡 𝑏𝑒𝑐𝑎𝑚𝑒 𝐶𝐸𝑂) + 𝛽23𝐼𝑣𝑦 𝐿𝑒𝑎𝑔𝑢𝑒 𝑎𝑙𝑢𝑚𝑛𝑢𝑠 +
𝛽24 Log(𝐶𝐸𝑂 𝑝𝑟𝑒𝑠𝑠 𝑐𝑜𝑣𝑒𝑟𝑎𝑔𝑒) + 𝐼𝑛𝑑𝑢𝑠𝑡𝑟𝑦 𝑑𝑢𝑚𝑚𝑖𝑒𝑠 + 𝑌𝑒𝑎𝑟 𝑑𝑢𝑚𝑚𝑖𝑒𝑠 + 𝜀𝑖
(3)
Prior research suggests several firm characteristics influencing the level of earnings
management. Firm age is an important factor since younger firms appear to have more volatile
earnings and less solid accounting systems, which create more incentives for managers to manipulate
earnings. The size of the firm also matters since managers of larger firms tend to have more discretion
over the accounting policies due to the complexity in financial structures of these firms compared to
smaller ones; however, closer scrutiny from regulators and market participants over larger firms may
discourage the financial reporting misbehaviours. We include the firm’s market value at the time of
listing as a control variable to account for firm size.
In addition, financial intermediaries participating in the IPO process can exert an influence on
the degree of earnings management among IPO firms. Specifically, Jo et al. (2007) and Lee and
Masulis (2011) document that the reputation issue creates strong incentives for top-tier investment

15
banks to detect financial reporting misrepresentations; thus, earnings management is reduced among
IPO firms underwritten by reputable investment banks. Morsfield and Tan (2006), Hochberg (2012),
and Wongsunwai (2013) find that the monitoring of venture capitalists also contributes to lowering
earnings management around IPOs. Moreover, Becker et al. (1998), Krishnan (2003), and Gul et al.
(2009) report that higher quality audit provided by big four accounting firms discourages managers
from manipulating earnings. Therefore, we control for the effects of reputable underwriters, venture
capitalists, and big four auditors on restraining earnings management.
Prior literature also documents that firms close to debt covenant violations or under financial
distress are more likely to engage in earnings management to overstate earnings (DeFond and
Jiambalvo 1994; Franz et al. 2014; DeAngelo et al. 1994). Moreover, loss firms have more incentives
to manage earnings upward to exceed the positive threshold (Burgstahler and Dichev 1997; Degeorge
et al. 1999). Therefore, we include leverage, Altman’s Z-score, and the incidence of a loss in the fiscal
year prior to the offering as control variables.
Furthermore, Fan (2007) argues that the uncertainty in high-growth firms creates stronger
incentives and better chances for managers of these firms to manipulate earnings to mislead investors.
We capture the effect of growth opportunities by including in our model the level of capital
expenditures and Tobin’s Q as proxies for growth. We also control for the influence of firm
performance on earnings management by including the variable industry-adjusted ROA (Kothari et al.
2005).
Additionally, corporate governance mechanisms play an important role in constraining
managers from manipulating earnings. The degree of board interaction and activities is documented to
be positively related to corporate governance (Vafeas 1999). Xie et al. (2003) further find that board
meeting frequency is associated with lower level of earnings management. Moreover, the greater
independence of the board will enhance its overseeing roles (Klein 2002). The dual role of CEO and
chairman reduces the board independence, and thus adversely affects the effectiveness of the board’s
monitoring activities. Therefore, we include the number of board meetings and CEO duality as control
variables. Furthermore, the ownership structure is documented to influence the level of earnings
management (Dempsey et al. 1993; Kim and Yi 2006; Yeo et al. 2002; Fan and Wong 2002; Fan 2007;
Huang et al. 2013).To account for this effect, we control for CEO ownership and whether a CEO is
also a founder of the firm.

16
Various prior studies indicate that managers have strong incentives to engage in earnings
management to maximise their compensation (Healy 1985; Holthausen et al. 1995; Guidry et al. 1999;
Balsam 1998). Particularly, Bergstresser and Philippon (2006) find that earnings manipulation is more
pronounced when CEO compensation is more closely tied to stocks and options. To control for this
effect of executive compensation on earnings management practices, we include a control variable for
CEO equity compensation.
Previous research shows that various CEO characteristics can influence financial and
accounting policies (Bertrand and Schoar 2003; Malmendier and Tate 2005; Bamber et al. 2010;
Demerjian et al. 2013; Ge et al. 2011). To mitigate the issue of omitted variables on the CEO level
(e.g., CEO financial experience may be correlated with other CEO characteristics that drive our
results), we control for various CEO characteristics, especially those documented in prior research as
determinants of earnings management. We control for CEO gender since Srinidhi et al. (2011) find
that firms with female directors exhibit higher quality financial reporting. Moreover, Kuang et al.
(2014) find that compared with CEOs appointed from within the firm, CEOs hired externally have
more incentives to demonstrate their abilities; thus, they tend to engage in income-increasing earnings
management in the early years of service. Ali and Zhang (2015) provide evidence that managers are
more likely to overstate earnings in their initial years of tenure to exert a favourable influence on the
market’s perception of their ability. Thus, we include CEO age, CEO tenure, and external hire as
control variables. Additionally, Francis et al. (2008) document that CEO reputation, which is proxied
by press coverage, is negatively associated with earnings quality. We also use the number of articles
which mention the CEO names over the five year period before the IPO to control for the link between
CEO reputation and earnings management. Last but not least, the work experience of CEOs may
capture the CEO innate talent instead of accumulated skills (Custódio et al. 2013; Custódio and
Metzger 2014). Following Custódio and Metzger (2013), Custódio et al. (2013), and Custódio and
Metzger (2014) we include the variables Ivy League alumnus and the age first became CEO as proxies
for innate talent.
4.2. At-issue earnings management and post-issue performance
We examine the association between abnormal accruals in the issue year and subsequent
accounting performance to shed light on whether financial expert CEOs are more likely to provide
informative financial reporting. Subramanyam (1996) posits that the positive relationship between
abnormal accruals and subsequent operating cash flows suggests the informative role of earnings

17
management in signalling the firm’s future prospects. Although cash flow from operations (CFO) are
less influenced by accrual reversals which is the problem of ROA, it is more likely to have the
timeliness issue than ROA as a performance measure (Dechow 1994; Bowen et al. 2008). Therefore,
in order to provide more robust evidence, we analyse both CFO and ROA as accounting performance
measures. We estimate the following regressions to examine the association between at-issue abnormal
accruals and subsequent accounting performance.
𝐶𝐹𝑂𝑖,𝑡=1 𝑜𝑟 𝑅𝑂𝐴𝑖,𝑡=1 = 𝛼0 + 𝛽1𝐴𝑏𝑛𝑜𝑟𝑚𝑎𝑙 𝑎𝑐𝑐𝑟𝑢𝑎𝑙𝑠𝑖,𝑡=0 +
𝛽2𝐴𝑏𝑛𝑜𝑟𝑚𝑎𝑙 𝑎𝑐𝑐𝑟𝑢𝑎𝑙𝑠𝑖,𝑡=0 ∗ 𝐹𝑖𝑛𝑎𝑛𝑐𝑖𝑎𝑙 𝑒𝑥𝑝𝑒𝑟𝑡 𝐶𝐸𝑂𝑖,𝑡=0 + 𝛽3𝐶𝐹𝑂𝑖,𝑡=0 +
𝛽4𝐶𝐴𝑃𝐸𝑋𝑖,𝑡=0 + 𝐼𝑛𝑑𝑢𝑠𝑡𝑟𝑦 𝑑𝑢𝑚𝑚𝑖𝑒𝑠 + 𝑌𝑒𝑎𝑟 𝑑𝑢𝑚𝑚𝑖𝑒𝑠 + 𝜀𝑖
(4)
where 𝐶𝐹𝑂𝑖,𝑡=1 is cash flow from operations scaled by lagged total assets in the fiscal year following
the offering; 𝑅𝑂𝐴𝑖,𝑡=1 is net income scaled by lagged total assets in the fiscal year following the
offering. Definitions of all variables are presented in Appendix A. We include the current CFO to
control for potential mean-reversion in accounting performance measures (Barber and Lyon 1996;
Bowen et al. 2008). We also account for the effect of the investment of proceeds on post-issue
performance by including capital expenditure (CAPEX) as a control variable (Teoh et al. 1998b).
Besides accounting performance, we also analyse the post-issue stock performance. If
managers engage in earnings management for informative purposes, investors will more accurately
incorporate the information into their firm valuation. The price adjustment will happen in the short-
term, resulting in insignificant long-term abnormal stock returns. First of all, we use buy-and-hold
returns to examine long-run stock performance. Since buy-and-hold returns mimic investors’
investment experience, they are widely used in long-run performance studies. We run the following
regression of post-issue three-year buy-and-hold abnormal returns (BHARs) on at-issue aggressive
earnings management to examine the effect of at-issue aggressive earnings management on post-issue
long-run stock performance.
𝐵𝐻𝐴𝑅𝑖 = 𝛼0 + 𝛽1𝐴𝑔𝑔𝑟𝑒𝑠𝑠𝑖𝑣𝑒 𝑒𝑎𝑟𝑛𝑖𝑛𝑔𝑠 𝑚𝑎𝑛𝑎𝑔𝑒𝑚𝑒𝑛𝑡𝑖 +
𝛽2𝐴𝑔𝑔𝑟𝑒𝑠𝑠𝑖𝑣𝑒 𝑒𝑎𝑟𝑛𝑖𝑛𝑔𝑠 𝑚𝑎𝑛𝑎𝑔𝑒𝑚𝑒𝑛𝑡𝑖 ∗ 𝐹𝑖𝑛𝑎𝑛𝑐𝑖𝑎𝑙 𝑒𝑥𝑝𝑒𝑟𝑡 𝐶𝐸𝑂𝑖 +
𝛽3𝐿𝑜𝑔(𝑓𝑖𝑟𝑚 𝑎𝑔𝑒)𝑖 + 𝛽4𝐿𝑛(𝑚𝑎𝑟𝑘𝑒𝑡 𝑣𝑎𝑙𝑢𝑒)𝑖 + 𝛽5𝑉𝑒𝑛𝑡𝑢𝑟𝑒 𝑐𝑎𝑝𝑖𝑡𝑎𝑙𝑖𝑠𝑡𝑖 +
𝛽6𝐵𝑜𝑜𝑘 𝑡𝑜 𝑚𝑎𝑟𝑘𝑒𝑡𝑖 + 𝛽7𝑅𝑂𝐴𝑖 + 𝛽8𝑈𝑛𝑑𝑒𝑟𝑝𝑟𝑖𝑐𝑖𝑛𝑔𝑖 + 𝛽9𝑀𝑎𝑟𝑘𝑒𝑡 𝐵𝐻𝑅𝑖 +
Industry dummies + Year dummies + 𝜀𝑖 (5)
18
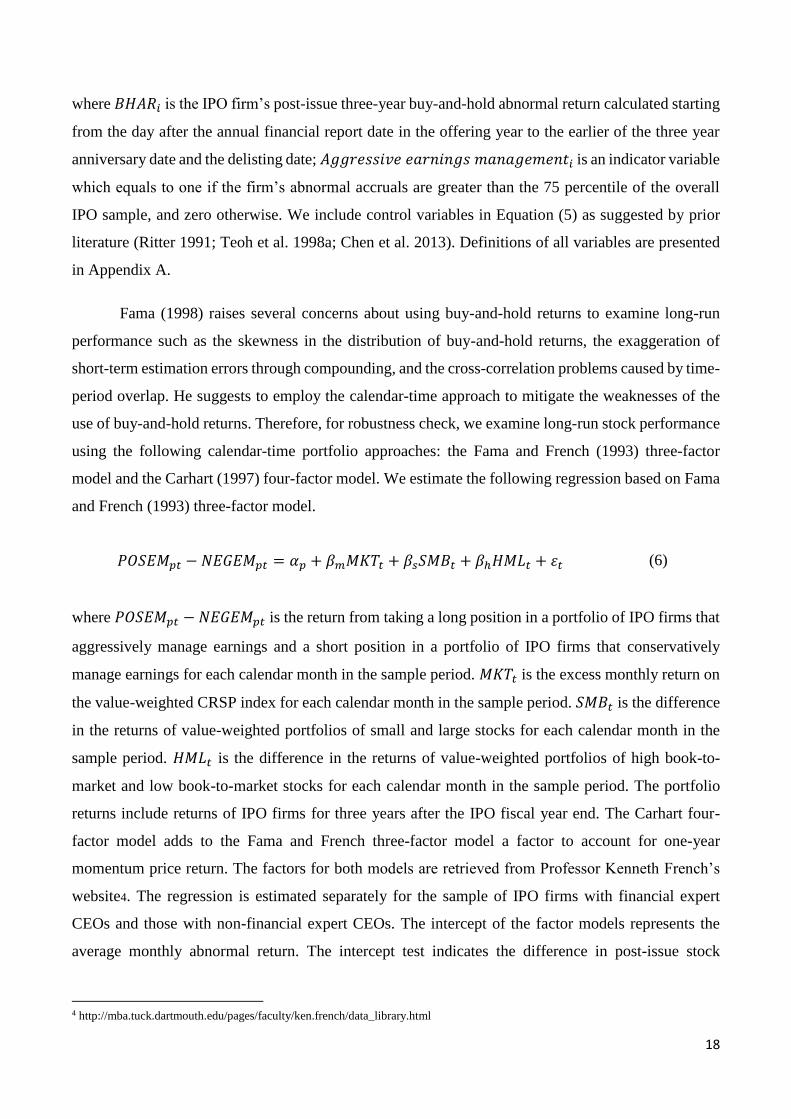
where 𝐵𝐻𝐴𝑅𝑖 is the IPO firm’s post-issue three-year buy-and-hold abnormal return calculated starting
from the day after the annual financial report date in the offering year to the earlier of the three year
anniversary date and the delisting date; 𝐴𝑔𝑔𝑟𝑒𝑠𝑠𝑖𝑣𝑒 𝑒𝑎𝑟𝑛𝑖𝑛𝑔𝑠 𝑚𝑎𝑛𝑎𝑔𝑒𝑚𝑒𝑛𝑡𝑖 is an indicator variable
which equals to one if the firm’s abnormal accruals are greater than the 75 percentile of the overall
IPO sample, and zero otherwise. We include control variables in Equation (5) as suggested by prior
literature (Ritter 1991; Teoh et al. 1998a; Chen et al. 2013). Definitions of all variables are presented
in Appendix A.
Fama (1998) raises several concerns about using buy-and-hold returns to examine long-run
performance such as the skewness in the distribution of buy-and-hold returns, the exaggeration of
short-term estimation errors through compounding, and the cross-correlation problems caused by time-
period overlap. He suggests to employ the calendar-time approach to mitigate the weaknesses of the
use of buy-and-hold returns. Therefore, for robustness check, we examine long-run stock performance
using the following calendar-time portfolio approaches: the Fama and French (1993) three-factor
model and the Carhart (1997) four-factor model. We estimate the following regression based on Fama
and French (1993) three-factor model.
𝑃𝑂𝑆𝐸𝑀𝑝𝑡 − 𝑁𝐸𝐺𝐸𝑀𝑝𝑡 = 𝛼𝑝 + 𝛽𝑚𝑀𝐾𝑇𝑡 + 𝛽𝑠𝑆𝑀𝐵𝑡 + 𝛽ℎ𝐻𝑀𝐿𝑡 + 𝜀𝑡 (6)
where 𝑃𝑂𝑆𝐸𝑀𝑝𝑡 − 𝑁𝐸𝐺𝐸𝑀𝑝𝑡 is the return from taking a long position in a portfolio of IPO firms that
aggressively manage earnings and a short position in a portfolio of IPO firms that conservatively
manage earnings for each calendar month in the sample period. 𝑀𝐾𝑇𝑡 is the excess monthly return on
the value-weighted CRSP index for each calendar month in the sample period. 𝑆𝑀𝐵𝑡 is the difference
in the returns of value-weighted portfolios of small and large stocks for each calendar month in the
sample period. 𝐻𝑀𝐿𝑡 is the difference in the returns of value-weighted portfolios of high book-to-
market and low book-to-market stocks for each calendar month in the sample period. The portfolio
returns include returns of IPO firms for three years after the IPO fiscal year end. The Carhart four-
factor model adds to the Fama and French three-factor model a factor to account for one-year
momentum price return. The factors for both models are retrieved from Professor Kenneth French’s
website4. The regression is estimated separately for the sample of IPO firms with financial expert
CEOs and those with non-financial expert CEOs. The intercept of the factor models represents the
average monthly abnormal return. The intercept test indicates the difference in post-issue stock
4 http://mba.tuck.dartmouth.edu/pages/faculty/ken.french/data_library.html
19
performance between IPO firms with aggressive earnings management and those with conservative
earnings management.
5. Empirical results
5.1. Financial expert CEOs and earnings management around IPOs
Table 3 presents the results of our OLS regression analysis of the association between financial
expert CEOs and earnings management around IPOs. The regressions include both year and industry
fixed effects, and the standard errors are adjusted for heteroskedasticity. Column 1 reports the
estimates of an OLS regression of abnormal accruals on financial expert CEO dummy variable and a
set of firm-level control variables. Column 2 reports the estimates of an OLS regression of abnormal
accruals on financial expert CEO dummy variable and both firm-level and CEO-level control
variables. Our results are consistent for both regressions.
[Please insert Table 3 about here]
The coefficients on the variable financial expert CEO are negative and statistically significant
at the 1% level. This suggests that IPO firms managed by CEOs with financial experience are less
likely to engage in earnings management in the offering year. The signs of control variables are
generally in line with prior literature. Examination of firm-level factors influencing earnings
management indicates that earnings management is positively associated with the level of leverage
and negatively associated with growth opportunities as measured by Tobin’s Q. In terms of CEO
characteristics, we find that CEOs recruited externally are less likely to manipulate earnings in the
offering year, CEOs with education background from Ivy League institutions also tend to engage less
in earnings management, but CEO reputation is positively linked to the level of earnings management
around IPOs.
5.2. At-issue earnings management and post-issue performance
Table 4 presents the regression results on whether the earnings management in the issue year
explains firm performance in the post-issue periods. Panel A illustrates the analysis of post-issue
accounting performance measured by CFO and ROA. Column 1 shows the result of the regression
with ROA as the dependent variable, and Column 2 shows the result of the regression with CFO as the
dependent variable. We include industry and year fixed effects and adjust standard errors for
heteroskedasticity. Our results are consistent for both regressions. The coefficients on abnormal
20
accruals are insignificant, suggesting that the level of abnormal accruals of IPO firms with non-
financial expert CEOs is unrelated to subsequent accounting performance. This supports the conjecture
that non-financial expert CEOs tend to manipulate earnings opportunistically. If managers manipulate
accruals to overstate earnings to mislead investors, the managed earnings will not be sustainable in the
subsequent period. Thus, the level of abnormal accruals in the offering year will not reflect future
performance. The coefficients on the interaction term Abnormal accruals*Financial expert CEO are
positive and significant at the 10% level. Additionally, the sum of the estimated coefficients of
Abnormal accruals and Abnormal accruals*Financial expert CEO are significantly positive at the 1%
level. The results suggest that financial expert CEOs tend to use accruals to communicate private
information to the market to signal the firm’s future prospects; thus, the degree of abnormal accruals
in the issue year is positively related to future accounting performance.
[Please insert Table 4 about here]
Panel B presents the regression analysis of post-issue long-run stock performance. We include
both the industry and year fixed effects and adjust the standard errors for heteroskedasticity. The
coefficient on Aggressive earnings management is negative and significant at the 5% level. This
suggests that non-financial expert CEOs generally engage in aggressive earnings management in the
issue year to mislead investors. When actual earnings are revealed and do not meet investors’
expectations, they revise downward their valuation, leading to negative abnormal stock returns in the
post-issue period. The coefficient on the interaction term Aggressive earnings management*Financial
expert CEO is significantly positive, indicating that for IPO firms with financial expert CEOs, the post-
issue long-run stock performance improves with the existence of aggressive earnings management in
the issue year. In addition, the sum of the estimated coefficients of Aggressive earnings management
and Aggressive earnings management*Financial expert CEO is insignificantly different from zero.
This finding confirms that financial expert CEOs tend to exercise their accounting discretion to
communicate private information to the market, allowing investors better gauge the firm value. Price
adjustment will occur in the short-run, leaving insignificant long-run abnormal stock returns.
Panel C presents intercept estimates of Fama and French three-factor model and Carhart four-
factor model. Both models provide consistent results. The intercept estimates are significantly negative
for the sample of IPO firms with non-financial expert CEOs. However, for the sample of IPO firms
with financial expert CEOs, the intercept estimates are insignificantly different from zero. The results
suggest that while IPOs managed by non-financial expert CEOs that engage in aggressive earnings
management in the issue year underperform those that employ conservative financial reporting, IPOs
21
managed by financial expert CEOs exhibit no significant difference in post-issue long-run stock
performance between aggressive and conservative issuers.
Overall, our findings from the analysis of both accounting and stock performance in the post-
issue period are consistent with our conjecture that financial expert CEOs tend to employ their
accounting discretion to better convey the firm’s future prospects to the market.
6. Additional tests and robustness checks
6.1. Endogeneity control
The literature on CEO characteristics commonly raises the concern about the endogenous
CEO-firm matching which may bias the estimation of the impact of CEO characteristics on corporate
decisions. For instance, IPO firms that are committed to provide high quality financial information to
investors may have preferences to hire managers with financial experience, but according the upper
echelons theory, managers with financial backgrounds are more likely to draw on their past finance
and accounting experience to implement sound accounting policies. The endogeneity of CEO selection
makes it unclear whether the earnings management is attributable to CEO financial experience or the
difference in earnings management is due to the non-random assignment of CEOs to firms.
To address the endogeneity of CEO selection problem, we employ the propensity score
matching procedure (PSM). Using this method, we can compare the earnings management of a firm
that appoints a financial expert CEO with the earnings management of the same firm if it had appointed
a non-financial expert CEO. In order to perform the matching, we measure the propensity score, which
is the conditional probability of receiving the treatment (having a financial expert CEO) given a firm’s
pre-treatment characteristics, for all the IPOs by estimating a probit regression for the likelihood of
firms having a financial expert CEO based on various observable CEO, firm, and industry
characteristics. We then match each observation in the treated group with the control group based on
its propensity score obtained from the predicted probability taken from the first stage probit estimation.
Panel A of Table 5 presents the results for the average effect of the treatment on the treated
(ATET) on earnings management for IPO firms with financial expert CEOs and those with non-
financial expert CEOs. The matching variables include firm-level factors (firm age, firm size, big four
auditor, top-tier investment bank, venture capitalist, leverage, loss, Altman’s Z-score, Tobin’s Q,
capital expenditures, R&D intensity, retained earnings, diversification, ROA, and board meetings),
CEO-level factors (dual position of CEO and Chairman, founder, ownership, age, gender, tenure,

22
innate talent proxied by age first became CEO and Ivy League alumnus, CEO reputation measured by
press coverage), industry factor (high-tech industry), and year effects. The ATET is negative and
strongly significant at the 1% level, indicating that IPO firms with financial expert CEOs are associated
with significantly lower earnings management. This finding is consistent with the results presented
previously on our baseline regression (Equation 3).
[Please insert Table 5 about here]
We also check the robustness of our results using other commonly used empirical specifications
for addressing endogeneity concerns including instrumental variable two-stage least squares (2SLS),
Heckman (1979) two-step treatment-effect, and maximum likelihood estimation (MLE) treatment-
effect. These econometric approaches all require the estimation of a selection model accounting for
the assignment of financial expert CEOs to firms. Custódio and Metzger (2014) document that
financial expert CEOs are more likely to be matched to firms in the mature stage of their life cycle,
while non-financial expert CEOs are more likely to be appointed by growth firms. Therefore, in the
selection model, we control for firm characteristics associated with firms’ life cycle suggested by
Custódio and Metzger (2014) including R&D intensity, retained earnings, diversification, and an
indicator controlling for high-tech industry. For the 2SLS model, in the first stage, we estimate the
regression of exogenous variable on instrumental variables and exogenous variables. In the second
stage, we run the original regression (Equation 3) with the endogenous variable replaced by the fitted
value from the first stage regression. For the two-step treatment effect model, in the first stage, we
estimate the selection equation using a probit regression of the likelihood that a firm appoints a
financial expert CEO. The estimated self-selection correction term, inverse Mills ratio, is added to the
original regression (Equation 3) and the linear outcome regression is estimated as normal. For the MLE
model, both the selection and the outcome regressions are estimated simultaneously by maximum
likelihood estimation. MLE is more efficient that the two-step treatment effect model if the error terms
in the selection and outcome equations have a bivariate normal distribution.
Panel B of Table 5 presents the results of the regressions of abnormal accruals on financial
expert CEO using the three estimation models: 2SLS, Heckman two-step treatment effect, and MLE
treatment effect. The results hold for alternative econometric models used. For the 2SLS model, the
Durbin-Wu-Hausman test of endogeneity is significant at the 5% level, indicating the endogeneity
problem. The inverse Mills ratio from the Heckman two-step treatment effect model is significant at
the 10% level, suggesting the issue of selection bias. The likelihood ratio test of the correlation between
the two error terms of the selection and outcome equations from the MLE treatment effect model shows

23
a strongly significant result at the 1% level. The evidence from the endogeneity tests of the three
estimation approaches confirms the endogenous selection issue in our sample. In terms of the
instruments, the variable retained earnings is significantly positive, which is in line with prior
literature. The level of retained earnings are greater in mature firms and as shown in Custódio and
Metzger (2014) financial expert CEOs are more likely to be appointed among firms in the mature state
of their life cycle. Most importantly, the coefficients on the variable financial expert CEO are all
significantly negative, which is consistent with the results obtained using the baseline OLS regression
(Equation 3).
6.2. CEO financial experience, CEO power and earnings management
In this section, we examine whether the CEO power and CEO financial experience interact and
further reduce earnings management around the stock offerings. Prior research suggests that CEOs
with more decision-making power can impose a significant impact over corporate financial strategies
and firm performance (Daily and Johnson 1997; Adams et al. 2005; Veprauskaitė and Adams 2013;
Chikh and Filbien 2011). Particularly, CEOs my set the tone from the top and influence CFOs’
decisions (Feng et al. 2011). Therefore, we expect that the influence of financial expert CEOs over
earnings management is more pronounced if the CEOs have more power over the board and other
executives. We employ four dimensions suggested by Finkelstein (1992) to measure CEO power,
namely, structural, ownership, expertise, and prestige powers. These power sources are widely used in
studies examining CEO power, for example, Adams et al. (2005), Chikh and Filbien (2011),
Veprauskaitė and Adams (2013). Structural power is based on the organizational structure, the
authority earned at a higher rank allows managers to have a greater degree of control over the
subordinates. To proxy for structural power, we use CEO duality, which occurs when the CEO is also
the chairman of the board. Regarding ownership power, managers have a stronger position in the agent-
principal relationship if they have more ownership in the firm.
To proxy for ownership power, we use the variable CEO ownership, which is the percentage
of shares owned by the CEO before the offering. In addition, being a founder of the firm also
strengthens the relationship between the CEO and the board; thus, we include another proxy for
ownership power – CEO founder, which takes the value of one if the CEO is also a founder of the
firm. In terms of expertise power, relevant expertise that is critical to the organisation allows managers
to more effectively handle both internal and external factors influencing the organisational success. In
our analysis we use CEO tenure as a proxy for expertise power. The CEO’s understanding of the firm

24
accumulates over the time that the CEO works in the firm. Concerning prestige power, managerial
prestige enhances the power of managers in many ways, for example, by conveying to other executives
about their personal importance and adding value to the firm through their external connections. We
use the variable Ivy League alumnus as a proxy for prestige power. CEOs graduated from Ivy League
institutions not only possess top qualifications but also tend to have more powerful friends and
contacts.
We standardize and aggregate the five variables (i.e., CEO-Chairman, CEO-Founder, CEO
ownership, CEO tenure, and Ivy League alumnus) to generate the variable CEO power accounting for
the effects of all four sources of managerial power. We create the interaction term between CEO power
and Financial expert CEO and run the original regression (Equation 3) including the interaction effect.
The result is presented in Table 6.
[Please insert Table 6 about here]
The coefficient on the variable Financial expert CEO remains negative and strongly significant
at the 1% level. The coefficient on the interaction term is also significantly negative, indicating that
the CEO power strengthens the effect of financial expert CEOs on earnings management. Moreover,
the F-test of the sum of the coefficients of the variable Financial expert CEO and the interaction term
Financial expert CEO*CEO power gives a significant negative result. This suggests that among IPO
firms with financial expert CEOs the level of earnings management is lower for firms whose CEOs
have more power in decision making. Overall, our results confirm the importance of CEO power in
facilitating the influence of financial expert CEOs on financial reporting.
6.3. Alternative measures of financial expertise
In the main analysis, we examine the association between earnings management and the
financial experience of the CEO. We define financial experience broadly to cover past financial
experience of the CEO in either a banking or investment firm, auditing firm, and other financial related
roles. In this section, we check the robustness of our results with more specific measures of CEO
financial expertise: CFO experience, CPA certification, and both CFO experience and CPA
certification. CFOs are directly responsible for overseeing financial reporting process, so the past
experience as a CFO equips the managers with relevant knowledge and skills which can influence their
decisions on firm’s accounting choices. In order to gain the accreditation by the American Institute of
Certified Public Accountants (AICPA), CPA holders need to meet both the knowledge and

25
professional experience requirements. They also need to keep their knowledge updated and adhere to
ethical codes of conduct. Thus, we postulate that CEOs having a CPA certification show greater
understanding of financial reporting and higher professional ethics.
We run the regressions of abnormal accruals on CFO experience and CPA certification. All
control variables are similar to the original regression model (Equation 3). The regression analyses are
presented in Panel A of Table 7. The coefficients on the variables CFO, CPA, and CFO&CPA are all
significantly negative. This suggests that CEOs who obtain the past experience as a CFO, hold a CPA
certification, or possess both the CFO experience and CPA certification are less likely to manipulate
earnings in the offering year.
[Please insert Table 7 about here]
Utilising our data on the detailed work experience history of CEOs, we expand to investigate
whether the diversity of CEO financial experience influences the degree of earnings management
around IPOs. We examine four aspects of financial experience: (1) number of firms in which the CEO
has past financial experience, (2) number of financial and accounting related roles that the CEO holds
in their past work history, (3) whether the CEO has past financial experience at another firm, and (4)
the length of time of CEO financial experience. For each of these aspects, higher value is interpreted
as greater financial experience diversity. Moreover, we employ principal component analysis (PCA)
to extract common components from the four variables to create an index of financial experience
diversity. Using one variable instead of the five variables individually helps mitigate the
multicollinearity problem, reduce measurement errors, and enhance the power of regression tests. In
addition, we create an indicator variable financial experience diversity dummy, which takes the value
of one if the CEO has the financial experience diversity index greater than the median of the whole
IPO sample.
To analyse the association between earnings management and financial experience diversity,
we run the regressions of earnings management on each of the variable proxies for financial experience
diversity, financial experience diversity index, and financial experience diversity dummy. The results
of the PCA and regressions are presented in Panel B of Table 7. All the variables used to proxy for
financial experience diversity are highly correlated, which is desirable since the single common factor
generated by PCA will better summarize their effects. Using the PCA method, we obtain only one
component with an eigenvalue higher than one (eigenvalue of 3.507). The four variables have positive
loadings, being positively correlated with the index. The index gives highest weight to the number of
firms in which the CEO has past financial experience and lowest weight to the CEO financial

26
experience at another firm. The financial experience diversity index is calculated by applying the
scores to the standardised financial experience components. Regarding the regression results, the
coefficients on the individual financial experience diversity variables, the index, and the financial
experience diversity dummy are all negative and significant at the 5% level. The findings indicate that
CEOs with more diverse financial experience tend to engage less in earnings management. We also
check the robustness of our results on the relationship between abnormal accruals in the offering year
and the post-issue performance for IPO firms whose CEOs have experience as a CFO and diverse
financial experience. The results remain stable and also suggest that financial expert CEOs tend to
manage earnings for informative purposes.
7. Conclusion
The study provides new empirical evidence on the association between CEO financial
experience and earnings management around IPOs. We find that IPO firms with financial expert CEOs
are associated with lower earnings management in the offering year. We also test the link between
earnings management in the issue year and post-issue performance to examine whether financial expert
CEOs exercise their accounting discretion to opportunistically manipulate earnings or to provide
investors with more informative financial reporting. We find the positive relation between at-issue
abnormal accruals and subsequent accounting performance measured by both CFO and ROA for
issuers with financial expert CEOs. For issuers with non-financial expert CEOs, on the other hand, the
at-issue abnormal accruals are not related to the subsequent accounting performance. In terms of stock
performance, we document the negative relationship between the incidence of aggressive earnings
management in the offering year and the post-issue abnormal stock returns for IPO firms with non-
financial expert CEOs. The relationship is insignificant for IPO firms with financial expert CEOs. Our
findings are consistent with the conjecture that financial expert CEOs tend to manage accruals to better
inform the investors about the firm’s future prospects. The overall evidence supports the role of
managerial financial experience in influencing IPO firms’ financial reporting.

27
References
Adams, R. B., H. Almeida, and D. Ferreira. 2005. Powerful CEOs and Their Impact on Corporate Performance.
The Review of Financial Studies 18 (4):1403-1432.
Aharony, J., C. Lin, and L. Loeb. 1993. Initial Public Offerings, accounting choices, and earnings management.
Contemporary Accounting Research 10 (1):61-81.
Ali, A., and W. Zhang. 2015. CEO tenure and earnings management. Journal of Accounting and Economics 59
(1):60-79.
Ball, R., and L. Shivakumar. 2008. Earnings quality at initial public offerings. Journal of Accounting and
Economics 45:324–349.
Balsam, S. 1998. Discretionary Accounting Choices and CEO Compensation*. Contemporary Accounting
Research 15 (3):229-252.
Bamber, L. S., J. John, and W. Isabel Yanyan. 2010. What's My Style? The Influence of Top Managers on
Voluntary Corporate Financial Disclosure. Accounting Review 85 (4):1131-1162.
Barber, B. M., and J. D. Lyon. 1996. Detecting abnormal operating performance: The empirical power and
specification of test statistics. Journal of Financial Economics 41 (3):359-399.
Becker, C., M. Defond, J. Jiambalvo, and J. Subramanyam. 1998. The effect of audit quality on earnings
management. Contemporary Accounting Research, 15 (1):1-24.
Bergstresser, D., and T. Philippon. 2006. CEO incentives and earnings management. Journal of Financial
Economics 80:511–529.
Bertrand, M., and A. Schoar. 2003. Managing with style: The effect of managers on corporate policy. The
Quarterly Journal of Economics 118:1169-1208.
Bowen, R. M., S. Rajgopal, and M. Venkatachalam. 2008. Accounting Discretion, Corporate Governance, and
Firm Performance*. Contemporary Accounting Research 25 (2):351-405.
Bunderson, J. S., and K. M. Sutcliffe. 2002. Comparing Alternative Conceptualizations of Functional Diversity
in Management Teams: Process and Performance Effects. The Academy of Management Journal 45
(5):875-893.
Burgstahler, D., and I. Dichev. 1997. Earnings management to avoid earnings decreases and losses. Journal of
Accounting and Economics 24:99-126.
Cannella, A. A., J.-H. Park, and H.-U. Lee. 2008. Top Management Team Functional Background Diversity
and Firm Performance: Examining the Roles of Team Member Colocation and Environmental
Uncertainty. The Academy of Management Journal 51 (4):768-784.
Carhart, M. 1997. On persistence in mutual fund performance. Journal of Finance 52 (1):57-82.
Chen, S.-S., W.-C. Lin, S.-C. Chang, and C.-Y. Lin. 2013. Information Uncertainty, Earnings Management, and
Long-run Stock Performance Following Initial Public Offerings. Journal of Business Finance &
Accounting 40 (9-10):1126-1154.
Chikh, S., and J.-Y. Filbien. 2011. Acquisitions and CEO power: Evidence from French networks. Journal of
Corporate Finance 17 (5):1221-1236.
Cohen, D. A., A. Dey, and T. Z. Lys. 2008. Real and Accrual-Based Earnings Management in the Pre- and Post-
Sarbanes-Oxley Periods. Accounting Review 83 (3):757-787.
Custódio, C., M. A. Ferreira, and P. Matos. 2013. Generalists versus specialists: Lifetime work experience and
chief executive officer pay. Journal of Financial Economics 108 (2):471-492.
Custódio, C., and D. Metzger. 2013. How Do CEOs Matter? The Effect of Industry Expertise on Acquisition
Returns. Review of Financial Studies 26 (8):2008-2047.
———. 2014. Financial expert CEOs: CEO׳s work experience and firm׳s financial policies. Journal of
Financial Economics 114 (1):125-154.
Daily, C. M., and J. L. Johnson. 1997. Sources of CEO Power and Firm Financial Performance: A Longitudinal
Assessment. Journal of Management 23 (2):97.
DeAngelo, E., H. DeAngelo, and D. Skinner. 1994. Accounting choices of troubled companies. Journal of
Accounting and Economics 17:113−143.
Dechow, P. 1994. Accounting earnings and cash flows as measures of firm performance: The role of accounting
accruals. Journal of Accounting and Economics 18 (1):3-42.
Dechow, P., W. Ge, and C. Schrand. 2010. Understanding earnings quality: A review of the proxies, their
determinants and their consequences. Journal of Accounting & Economics 50:344-401.

28
Dechow, P., R. Sloan, and A. Sweeney. 1995. Detecting earnings management. The Accounting Review 70
(2):193-225.
DeFond, M. L., and J. Jiambalvo. 1994. Debt convenant violation and manipulation of accruals. Journal of
Accounting & Economics 17:145-176.
Degeorge, F., J. Patel, and R. Zeckhauser. 1999. Earnings management to exceed thresholds. Journal of
Business 72:1−33.
Demerjian, P. R., B. Lev, M. F. Lewis, and S. E. McVay. 2013. Managerial Ability and Earnings Quality.
Accounting Review 88 (2):463-498.
Dempsey, S. J., H. G. Hunt, and N. W. Schroeder. 1993. Earnings management and corporate ownership
structure: An examination of extraordinary item reporting. Journal of Business Finance & Accounting
20:479−500.
Doukakis, L. C. 2014. The effect of mandatory IFRS adoption on real and accrual-based earnings management
activities. Journal of Accounting and Public Policy 33 (6):551-572.
DuCharme, L., P. Malatesta, and S. Sefcik. 2004. Earnings management, stock issues, and shareholder lawsuits.
Journal of Financial Economics 71 (1):27-49.
Dyreng, S. D., M. Hanlon, and E. L. Maydew. 2010. The Effects of Executives on Corporate Tax Avoidance.
Accounting Review 85 (4):1163-1189.
Fama, E. 1998. Market efficiency, long term returns and behavioral finance. Journal of Financial Economics
49:283-306.
Fama, E., and K. French. 1993. Common risk factors in the returns on bonds and stocks. Journal of Financial
Economics 33:3-56.
Fan, J. P. H., and T. J. Wong. 2002. Corporate ownership structure and the informativeness of accounting
earnings in East Asia. Journal of Accounting and Economics 33 (3):401-425.
Fan, Q. 2007. Earnings Management and Ownership Retention for Initial Public Offering Firms: Theory and
Evidence Accounting Review 82 (1).
Feng, M., W. Ge, S. Luo, and T. Shevlin. 2011. Why do CFOs become involved in material accounting
manipulations? Journal of Accounting and Economics 51 (1–2):21-36.
Fields, T. D., T. Z. Lys, and L. Vincent. 2001. Empirical research on accounting choice. Journal of Accounting
and Economics 31 (1–3):255-307.
Finkelstein, S. 1992. Power in Top Management Teams: Dimensions, Measurement, and Validation. The
Academy of Management Journal 35 (3):505-538.
Francis, J., A. H. Huang, S. Rajgopal, and A. Y. Zang. 2008. CEO Reputation and Earnings Quality*.
Contemporary Accounting Research 25 (1):109-147.
Franz, D., H. HassabElnaby, and G. Lobo. 2014. Impact of proximity to debt covenant violation on earnings
management. Review of Accounting Studies 19 (1):473-505.
Friedlan, J. 1994. Accounting choices of issuers of initial public offerings. Contemporary Accounting Research
11:1-31.
Ge, W., D. Matsumoto, and J. L. Zhang. 2011. Do CFOs Have Style? An Empirical Investigation of the Effect
of Individual CFOs on Accounting Practices*. Contemporary Accounting Research 28 (4):1141-1179.
Graham, J. R., C. R. Harvey, and M. Puri. 2013. Managerial attitudes and corporate actions. Journal of Financial
Economics 109 (1):103-121.
Gramlich, J., and O. Sorensen. 2004. Voluntary management earning forecasts and discretionary accruals:
Evidence from Danish IPOs. European Accounting Review 13 (2):235-259.
Guay, W. R., S. Kothari, and R. L. Watts. 1996. A market based evalaution of discretionary accruals model.
Journal of Accounting Research 34:183-105.
Guidry, F., A. Leone, and S. Rock. 1999. Earnings-based bonus plans and earnings management business unit
managers. Journal of Accounting and Economics 26:113−142.
Gul, F. A., S. Y. K. Fung, and B. Jaggi. 2009. Earnings quality: Some evidence on the role of auditor tenure and
auditors’ industry expertise. Journal of Accounting and Economics 47 (3):265-287.
Hambrick, D. C. 2007. Upper Echelons Theory: An Update. The Academy of Management Review 32 (2):334-
343.
Hambrick, D. C., and P. A. Mason. 1984. Upper Echelons: The Organization as a Reflection of Its Top
Managers. The Academy of Management Review 9 (2):193-206.
Healy, P. M. 1985. The effect of bonus schemes on accounting decisions. Journal of Accounting & Economics
7 (85-112).
29
Healy, P. M., and K. G. Palepu. 1993. The effect of firms financial disclosure strategies on stock prices.
Accounting Horizons 7:1-11.
Heckman, J. 1979. Sample selection bias as a specification error. Econometrica 47:153-161.
Herbohn, K., I. Tutticci, and P. S. Khor. 2010. Changes in Unrecognised Deferred Tax Accruals from Carry-
Forward Losses: Earnings Management or Signalling? Journal of Business Finance & Accounting 37
(7-8):763-791.
Hochberg, Y. V. 2012. Venture Capital and Corporate Governance in the Newly Public Firm. Review of Finance
16 (2):429-480.
Holthausen, R., D. Larker, and R. Sloan. 1995. Annual bonus schemes and the manipulation of earnings. Journal
of Accounting and Economics 19:29−74.
Hribar, P., and D. W. Collins. 2002. Errors in Estimating Accruals: Implications for Empirical Research.
Journal of Accounting Research 40 (1):105-134.
Huang, H. H., W. Wang, and J. Zhou. 2013. Shareholder Rights, Insider Ownership and Earnings Management.
Abacus 49 (1):46-73.
Jensen, M. C., and W. H. Meckling. 1976. Theory of the firm: Managerial behavior, agency costs and ownership
structure. Journal of Financial Economics 3 (4):305-360.
Jiang, F., B. Zhu, and J. Huang. 2013. CEO's financial experience and earnings management. Journal of
Multinational Financial Management 23 (3):134-145.
Jo, H., Y. Kim, and M. S. Park. 2007. Underwriter choice and earnings management: evidence from seasoned
equity offerings Review of Accounting Studies 12 (1):23-59.
Jones, J. J. 1991. Earnings management during import relief investigations. Journal of Accounting Research
37:55-81.
Kallunki, J.-P., and M. Martikainen. 2003. Earnings management as a predictor of future profitability of Finnish
firms. European Accounting Review 12 (2):311-325.
Kaplan, S. N., M. M. Klebanov, and M. Sorensen. 2012. Which CEO Characteristics and Abilities Matter? The
Journal of Finance 67 (3):973-1007.
Kasznik, R. 1999. On the association between corporate voluntary disclosure and earnings management.
Journal of Accounting Research 37:58-81.
Kim, J.-B., and C. H. Yi. 2006. Ownership Structure, Business Group Affiliation, Listing Status, and Earnings
Management: Evidence from Korea*. Contemporary Accounting Research 23 (2):427-464.
Klein, A. 2002. Audit committee, board of director characteristics, and earnings management. In Journal of
Accounting and Economics, 375-400.
Kothari, S. P., A. J. Leone, and C. E. Wasley. 2005. Performance matched discretionary accrual measures.
Journal of Accounting and Economics 39 (1):163-197.
Krishnan, G. V. 2003. Does big 6 auditor industry expertise constrain earnings management? Accounting
Horizons (Suppl.):1–16.
Kuang, Y. F., B. Qin, and J. L. Wielhouwer. 2014. CEO Origin and Accrual-Based Earnings Management.
Accounting Horizons 28 (3):605-626.
Lee, G., and R. W. Masulis. 2011. Do more reputable financial institutions reduce earnings management by IPO
issuers? Journal of Corporate Finance 17 (4):982-1000.
Lo, K. 2008. Earnings management and earnings quality. Journal of Accounting and Economics 45 (2-3):350-
357.
Lobo, G. J., and J. Zhou. 2006. Did Conservatism in Financial Reporting Increase after the Sarbanes-Oxley
Act? Initial Evidence. Accounting Horizons 20 (1):57-73.
Louis, H., and D. Robinson. 2005. Do managers credibly use accruals to signal private information? Evidence
from the pricing of discretionary accruals around stock splits. Journal of Accounting and Economics 39
(2):361-380.
Malmendier, U., and G. Tate. 2005. CEO Overconfidence and Corporate Investment. The Journal of Finance
60 (6):2661-2700.
———. 2008. Who makes acquisitions? CEO overconfidence and the market's reaction. Journal of Financial
Economics 89 (1):20-43.
———. 2009. Superstar CEOs. The Quarterly Journal of Economics 124 (4):1593-1638.
Malmendier, U., G. Tate, and J. O. N. Yan. 2011. Overconfidence and Early-Life Experiences: The Effect of
Managerial Traits on Corporate Financial Policies. The Journal of Finance 66 (5):1687-1733.

30
Morsfield, S. G., and C. E. L. Tan. 2006. Do Venture Capitalists Influence the Decision to Manage Earnings in
Initial Public Offerings? Accounting Review 81 (5):1119-1150.
Ritter, J. R. 1991. The Long-Run Performance of Initial Public Offerings. Journal of Finance 46 (1):3-27.
Roosenbloom, P., and T. Van De Goot. 2003. Takeover Defences and IPO Firm Value in the Netherlands.
European Financial Management 9 (4):484-511.
Srinidhi, B. I. N., F. A. Gul, and J. Tsui. 2011. Female Directors and Earnings Quality*. Contemporary
Accounting Research 28 (5):1610-1644.
Subramanyam, K. 1996. The pricing of discretionary accruals. Journal of Accounting and Economics 22:249-
281.
Teoh, S., I. Welch, and T. Wong. 1998a. Earnings management and the long-run market performance of initial
public offerings. Journal of Finance 53:1935–1974.
Teoh, S. H., T. J. Wong, and G. R. Rao. 1998b. Are accruals during initial public offerings opportunistic?
Review of Accounting Studies 3:175–208.
Vafeas, N. 1999. Board meeting frequency and firm performance. Journal of Financial Economics 53 (1):113-
142.
Veprauskaitė, E., and M. Adams. 2013. Do powerful chief executives influence the financial performance of
UK firms? The British Accounting Review 45 (3):229-241.
Watts, R. L., and J. L. Zimmerman. 1978. Towards a Positive Theory of the Determination of Accounting
Standards. Accounting Review 53 (1):112.
Wongsunwai, W. 2013. The Effect of External Monitoring on Accrual-Based and Real Earnings Management:
Evidence from Venture-Backed Initial Public Offerings*. Contemporary Accounting Research 30
(1):296-324.
Xie, B., I. Davidson, Wallace N., and P. J. DaDalt. 2003. Earnings management and corporate governance: the
role of the board and the audit committee. Journal of Corporate Finance 9 (3):295-316.
Ye, K. 2014. Independent director cash compensation and earnings management. Journal of Accounting and
Public Policy 33 (4):391-400.
Yeo, G. H. H., P. M. S. Tan, K. W. Ho, and S. S. Chen. 2002. Corporate Ownership Structure and the
Informativeness of Earnings. Journal of Business Finance & Accounting 29 (7-8):1023-1046.

31
Appendix A: Variable definition
Panel A: CEO characteristics
Variable Definition
CEO age Age of the CEO in years.
CEO gender Dummy variable equal to one if the CEO is female, and zero otherwise.
CEO tenure Number of years working as CEO in the firm.
CEO-Chairman Dummy variable equal to one if the CEO is also chairman of the board, and zero otherwise.
CEO-Founder Dummy variable equal to one if the CEO is also founder of the firm, and zero otherwise.
CEO ownership Percentage of shares owned by the CEO before the offering.
Bachelor’s degree Dummy variable equal to one if the CEO has a bachelor’s degree, and zero otherwise.
Master’s degree Dummy variable equal to one if the CEO has a master’s degree, and zero otherwise.
MBA Dummy variable equal to one if the CEO has an MBA degree, and zero otherwise.
PhD Dummy variable equal to one if the CEO has a PHD degree, and zero otherwise.
CPA Dummy variable equal to one if the CEO has a CPA certification, and zero otherwise.
Ivy League alumnus Dummy variable equal to one if the CEO is an alumnus of an Ivy League institution, and
zero otherwise. Age first became CEO Age at which the CEO became CEO for the first time.
External hire Dummy variable equal to one if the CEO is hired externally, and zero if the CEO is internally
promoted. CEO press coverage Number of articles containing the CEO’s name and company major U.S. newspapers (Wall
Street Journal, New York Times, Washington Post, USA Today), top international
publications (FT, Asian Wall Street Journal, European Wall Street Journal, International
Herald Tribune), and press releases (PR Newswire, Business Wire).
Compensation equity Equity compensation of the CEO which consists of equity incentives and value of options
granted. Compensation total Total compensation of the CEO which consists of salary, bonus, equity incentives, non-
equity incentives, options, and other compensation. CFO role Dummy variable equal to one if the CEO has past experience in a CFO position, and zero
otherwise. Financial expert CEO Dummy variable equal to one if the CEO has past financial experience in either a banking
or investment firm, in a large auditing firm (Pricewaterhouse, Deloitte, Ernst & Young,
KPMG, Arthur Andersen, Coopers, Touche Ross), or in a finance related role (accountant,
treasurer, VP of finance, CFO); and zero otherwise.
Financial experience diversity index First factor of applying principal components analysis to four proxies of the diversity of
financial experience: (1) number of firms in which the CEO has past financial experience,
(2) number of financial and accounting related roles that the CEO holds in their past work
history, (3) whether the CEO has past financial experience at another firm, and (4) the length
of time of CEO financial experience.
Financial experience diversity dummy Dummy variable equal to one if the CEO’s financial experience diversity index is above the
sample median, and zero otherwise.
Panel B: Firm characteristics
Variable Definition
Abnormal accruals Abnormal accruals computed using modified Jones (1991) model and adjusted for abnormal
accruals of a performance-matched non-IPO firm based on performance matching procedure
suggested by Kothari (2005).
Firm age Firm age in years measured as the difference between the firm’s IPO year and its founding
year. Company founding years are collected from the Field-Ritter dataset.5
Market value Firm’s market value at the time of the listing.
Leverage Ratio of total debt to total assets.
Loss Dummy variable equal to one if the IPO firms have negative earnings before interest and
taxes in the fiscal year prior to the offering, and zero otherwise.
CAPEX Average capital expenditures in the IPO year and one year after scaled by total assets at the
beginning of the offering year.
5 The Field-Ritter dataset is available on Jay Ritter’s webpage: http://bear.warrington.ufl.edu/ritter/FoundingDates.htm.

32
Industry-adjusted ROA Industry-adjusted ROA is calculated by subtracting mean ROA of the two-digit SIC industry
group from the firm’s ROA. ROA is calculated as the ratio of net income to total assets.
Big4 auditor Dummy variable equal to one if the firm is audited by a big four audit firm, and zero
otherwise. Big four audit firms include Ernst & Young, Deloitte & Touche, KPMG, and
PricewaterhouseCoopers.
Venture capitalist Dummy variable equal to one if the firm is venture backed, and zero otherwise.
Top-tier investment bank Dummy variable equal to one if the firm is underwritten by most reputational underwriters,
zero otherwise. Most reputational underwriters are those with a ranking score of 9.0 or above
based on Jay Ritter’s underwriter rakings.6
Book-to-market Ratio of book value to market value.
R&D Ratio of research and development expenses to book value of total assets.
Retained earnings Ratio of retained earnings to common equity.
Diversification Dummy variable equal to one if the firm has more than one business segment, and zero
otherwise. High-tech industry Dummy variable equal to one if the firm is in the high-tech industry, and zero otherwise.
Panel C: Stock returns variables
Variable Definition
BHAR Firm’s three-year post-issue buy-and-hold abnormal return calculated starting from the day
after the annual financial report date in the offering year to the earlier of the three year
anniversary date and the delisting date.
Market BHR Three-year buy-and-hold value weighted market index return.
Underpricing Stock return on the first day of trading.
POSEM Monthly return of the portfolio of IPO firms that undertake aggressive earnings management
in the offering year.
NEGEM Monthly return of the portfolio of IPO firms that undertake conservative earnings
management in the offering year.
MKT Excess monthly return on the value-weighted CRSP index.
SMB Difference in the monthly returns of value-weighted portfolios of small and large stocks.
HML Difference in the monthly returns of value-weighted portfolios of high book-to-market
stocks and low book-to-market stocks.
6 IPO underwriter reputation rankings are available on Jay Ritter’s webpage: http://bear.warrington.ufl.edu/ritter/ipodata.htm.

33
Table 1
Distribution of IPOs by time and industry
Panel A: Time distribution
Year
All IPOs
(N = 688)
IPOs with financial expert
CEO
(N = 180)
IPOs with nonfinancial
expert CEO
(N = 508)
N % N % N %
2003 41 6 16 9 25 5 2004 129 19 35 19 94 19
2005 113 16 30 17 83 16
2006 113 16 33 18 80 16
2007 126 18 29 16 97 19
2008 16 2 4 2 12 2
2009 35 5 9 5 26 5
2010 59 9 15 8 44 9
2011 56 8 9 5 47 9
Panel B: Industry distribution
Industry name SIC codes
All IPOs
IPOs with financial
expert CEO
IPOs with nonfinancial
expert CEO
N % N % N %
Oil and gas 13 30 4 9 5 21 4
Food products 20 8 1 3 2 5 1
Chemical products 28 125 18 25 14 100 20
Manufacturing 30-34 23 3 3 2 20 4
Computer equipment & services 35, 73 160 23 57 32 103 20
Electronic equipment 36 60 9 10 6 50 10
Scientific instruments 38 64 9 14 8 50 10
Transportation and public utilities 41, 42, 44-49 57 8 12 7 45 9
Wholesale and retail trade 50-59 61 9 19 11 42 8
Entertainment services 70, 78, 79 9 1 4 2 5 1
Health services 80 15 2 3 2 12 2
All others 01, 12, 15, 17, 22-
27, 29, 37, 39, 72,
75, 82, 87, 96
76 11 21 12 55 11
Total 51 688 100 180 100 508 100

34
Table 2 Descriptive statistics
The table presents descriptive statistics of the sample of U.S. IPOs over the period from 2003 to 2011. CEO characteristics, firm and offering characteristics, and correlation matrix are illustrated in Panel A, B,
and C respectively. All variables are defined in Table 1. T-tests and Wilcoxon sign rank tests are used to test the difference of means and medians from zero. Tests of difference in means and medians between
two samples of IPO firms with a financial and nonfinancial expert CEO are based on t-tests and Wilcoxon rank sum tests. One, two and three asterisks denote statistical significance at the 10%, 5% and 1% levels,
respectively. N denotes the number of observations.
Panel A: CEO characteristics
CEO financial expertise
All IPOs
N Mean p25 p50 p75 sd
Financial expert 688 0.26 0.00 0.00 1.00 0.44 CFO 688 0.11 0.00 0.00 0.00 0.32 Banker 688 0.05 0.00 0.00 0.00 0.22 Auditor 688 0.03 0.00 0.00 0.00 0.18 Accountant 688 0.02 0.00 0.00 0.00 0.14 Treasurer 688 0.05 0.00 0.00 0.00 0.22 VP of finance 688 0.03 0.00 0.00 0.00 0.16 Other financial roles 688 0.13 0.00 0.00 0.00 0.34
CEO characteristics
All IPOs IPOs with financial
expert CEO
IPOs with nonfinancial
expert CEO
Difference
N Mean p25 p50 p75
7575
75
sd Mean Mean p-value
CEO age 652 51.14 46.00 51.00 57.00 8.05 50.91 51.22 0.338 CEO gender 688 0.03 0.00 0.00 0.00 0.16 0.02 0.03 0.177 CEO tenure 665 4.64 1.56 3.72 6.61 4.11 4.33 4.75 0.118 CEO-Chairman 688 0.44 0.00 0.00 1.00 0.50 0.47 0.43 0.138 CEO-founder 688 0.07 0.00 0.00 0.00 0.25 0.07 0.07 0.405 CEO ownership 663 11.21 2.00 4.50 10.20 18.44 11.10 11.25 0.461 Bachelor’s degree 688 0.77 1.00 1.00 1.00 0.42 0.82 0.76 0.048 Master’s degree 688 0.48 0.00 0.00 1.00 0.50 0.51 0.47 0.199 MBA 688 0.29 0.00 0.00 1.00 0.45 0.36 0.26 0.006 PhD 688 0.10 0.00 0.00 0.00 0.30 0.06 0.11 0.014 CPA 688 0.05 0.00 0.00 0.00 0.21 0.15 0.01 0.000 Ivy League alumnus 688 0.16 0.00 0.00 0.00 0.37 0.20 0.15 0.051 External hire 688 0.69 0.00 1.00 1.00 0.46 0.64 0.71 0.061 Age first became CEO 615 42.52 37.00 42.00 49.00 8.34 42.26 42.61 0.324 CEO press coverage 688 23.37 5.00 15.00 31.00 25.92 23.04 23.49 0.422
Equity compensation 673 0.40 0.00
0.01 0.20 1.30 0.37 0.41 0.345 Total compensation 673 1.20 0.38 0.60 1.20 2.00 1.10 1.30 0.169

35
Panel B: Firm and offering characteristics
Firm characteristics
All IPOs
IPOs with financial
expert CEO
IPOs with nonfinancial
expert CEO
Difference
N Mean p25 p50 p75
7575
75
sd Mean Mean p-value Firm age 676 20.03 6.00 10.00 21.00 24.51 17.67 20.88 0.067 Leverage 512 0.42 0.11 0.32 0.57 0.43 0.38 0.44 0.083 Loss 528 0.43 0.00 0.00 1.00 0.50 0.42 0.44 0.335 Altman’s Z-score 558 -5.86 -8.63 -0.53 1.79 15.57 -5.65 -5.93 0.426 Industry-adjusted ROA 688 -0.10 -0.11 0.00 0.02 0.33 -0.06 -0.11 0.050 Retained earnings 514 -0.71 -1.21 -0.16 0.18 3.50 -0.34 -0.86 0.065 CAPEX 587 0.12 0.03 0.07 0.15 0.18 0.13 0.12 0.227 R&D 514 0.11 0.00 0.01 0.15 0.18 0.09 0.12 0.052 Diversification 688 0.16 0.00 0.00 0.00 0.37 0.17 0.16 0.322 High-tech 688 0.35 0.00 0.00 1.00 0.48 0.32 0.37 0.145 Board meetings 670 7.73 5.00 7.00 10.00 3.99 7.47 7.83 0.155
Offering characteristics
All IPOs
IPOs with financial
expert CEO
IPOs with nonfinancial
expert CEO
Difference
N Mean p25 p50 p75
7575
75
sd Mean Mean p-value Proceeds 688 165.57 54.00 91.35 169.00 212.65 182.46 159.59 0.108 Market value 688 475.72 0.00 265.68 597.29 679.65 486.67 471.84 0.401 Underpricing 665 0.11 0.00 0.07 0.19 0.17 0.11 0.11 0.433 Tobin’s Q 600 4.11 1.95 2.92 4.75 3.63 4.23 4.07 0.323 Book to market 495 0.30 0.15 0.27 0.42 0.23 0.32 0.30 0.160 Top-tier investment bank 686 0.45 0.00 0.00 1.00 0.50 0.43 0.46 0.235 Big4 auditor 686 0.83 1.00 1.00 1.00 0.37 0.80 0.84 0.082 Venture capitalist 688 0.49 0.00 0.00 1.00 0.50 0.41 0.52 0.008 BHAR 513 0.04 -0.59 -0.12 0.38 0.92 0.20 -0.02 0.008
Earnings management proxy
All IPOs
IPOs with financial
expert CEO
IPOs with nonfinancial
expert CEO
Difference
N Mean p25 p50 p75
7575
75
sd Median Median p-value
Abnormal accruals 551 -0.21 -0.30 -0.07*** 0.08 0.89 -0.13*** -0.06*** 0.010

36
Panel C: Correlation matrix
Financial
expert
CEO
Log(firm
age)
Ln(market
value)
Big4 auditor Top-tier
investment
bank
Venture
capitalist
Leverage Loss Altman’s Z-
score
Tobin’s Q CAPEX
Financial expert CEO 1.000 Log(firm age) -0.040 1.000 Ln(market value) 0.000 0.109 1.000 Big4 auditor -0.053 0.064 0.120 1.000 Top-tier investment bank -0.028 0.147 0.157 0.281 1.000 Venture capitalist -0.092 -0.486 0.053 0.196 0.016 1.000 Leverage -0.062 0.160 -0.125 -0.099 0.028 -0.288 1.000 Loss -0.019 -0.416 -0.181 0.055 -0.061 0.465 0.005 1.000 Altman’s Z-score 0.008 0.267 0.414 0.005 0.126 -0.222 -0.327 -0.515 1.000 Tobin’s Q 0.019 -0.178 0.124 -0.011 0.001 0.214 -0.001 0.183 -0.132 1.000 CAPEX 0.031 -0.164 -0.115 -0.172 -0.042 -0.111 -0.079 -0.042 0.052 -0.022 1.000 Industry-adjusted ROA 0.063 0.221 -0.071 -0.023 0.039 -0.263 -0.077 -0.579 0.488 -0.084 0.023 Board meetings -0.039 -0.187 0.078 0.084 -0.013 0.350 -0.122 0.190 -0.122 0.110 -0.077 External hire -0.059 -0.059 -0.002 -0.023 0.016 -0.019 0.013 0.007 -0.028 0.001 0.023 Log(equity compensation) 0.014 -0.136 -0.010 0.042 0.033 0.214 -0.024 0.199 -0.078 -0.019 -0.020 CEO-Chairman 0.042 -0.051 0.092 -0.107 -0.036 -0.035 0.012 -0.028 0.068 0.039 0.073 CEO-Founder 0.009 -0.134 0.029 -0.048 -0.050 0.081 -0.078 0.074 -0.065 0.060 0.098 Log(CEO ownership) 0.005 -0.206 0.037 -0.168 -0.092 0.140 -0.116 0.015 0.032 0.189 0.120 Log(CEO age) -0.017 0.212 -0.007 -0.036 -0.032 -0.223 0.081 -0.092 0.018 -0.150 0.006 CEO gender -0.035 -0.013 0.041 0.049 -0.003 0.095 -0.035 0.035 -0.054 0.062 0.000 Log(CEO tenure) -0.050 -0.140 0.174 -0.012 -0.069 0.264 -0.177 0.083 0.015 0.131 -0.073 Log(age first became CEO) -0.020 0.153 -0.089 0.052 -0.009 -0.193 0.091 -0.104 -0.013 -0.147 0.042 Ivy League alumnus 0.063 -0.047 -0.038 0.091 -0.026 0.133 -0.051 0.062 0.004 0.065 -0.002 Log(CEO press coverage) -0.011 -0.136 0.125 0.139 0.092 0.315 -0.177 0.231 -0.016 0.126 -0.111
Industry-
adjusted
ROA
Board
meetings
External
hire
Log(equity
compensation)
CEO-
Chair
man
CEO-
Founder
Log(CEO
ownership)
Log(CEO
age)
CEO
gender
Log(CEO
tenure)
Log(age
first became
CEO)
Ivy
League
alumnus
Log(CEO
press
coverage)
ROA 1.000 Board meetings -0.084 1.000 External hire -0.030 -0.075 1.000 Log(equity compensation) -0.138 0.125 -0.013 1.000 CEO-Chairman 0.029 -0.055 0.084 -0.085 1.000 CEO-Founder -0.067 0.014 0.032 -0.016 0.121 1.000 Log(CEO ownership) 0.002 0.013 0.030 -0.160 0.373 0.123 1.000 Log(CEO age) -0.010 -0.104 0.051 -0.032 0.122 -0.013 -0.055 1.000 CEO gender 0.001 0.039 0.031 0.000 -0.053 0.064 -0.016 0.007 1.000 Log(CEO tenure) -0.092 0.192 0.106 -0.069 0.161 0.023 0.365 0.015 0.000 1.000 Log(age first became CEO) 0.030 -0.100 -0.133 0.016 -0.102 -0.095 -0.313 0.656 0.027 -0.306 1.000 Ivy League alumnus -0.050 0.094 -0.040 0.010 0.091 -0.025 0.029 -0.079 0.002 0.024 -0.118 1.000 Log(CEO press coverage) -0.108 0.245 0.046 0.097 0.050 0.024 0.066 -0.114 0.013 0.180 -0.159 0.118 1.000
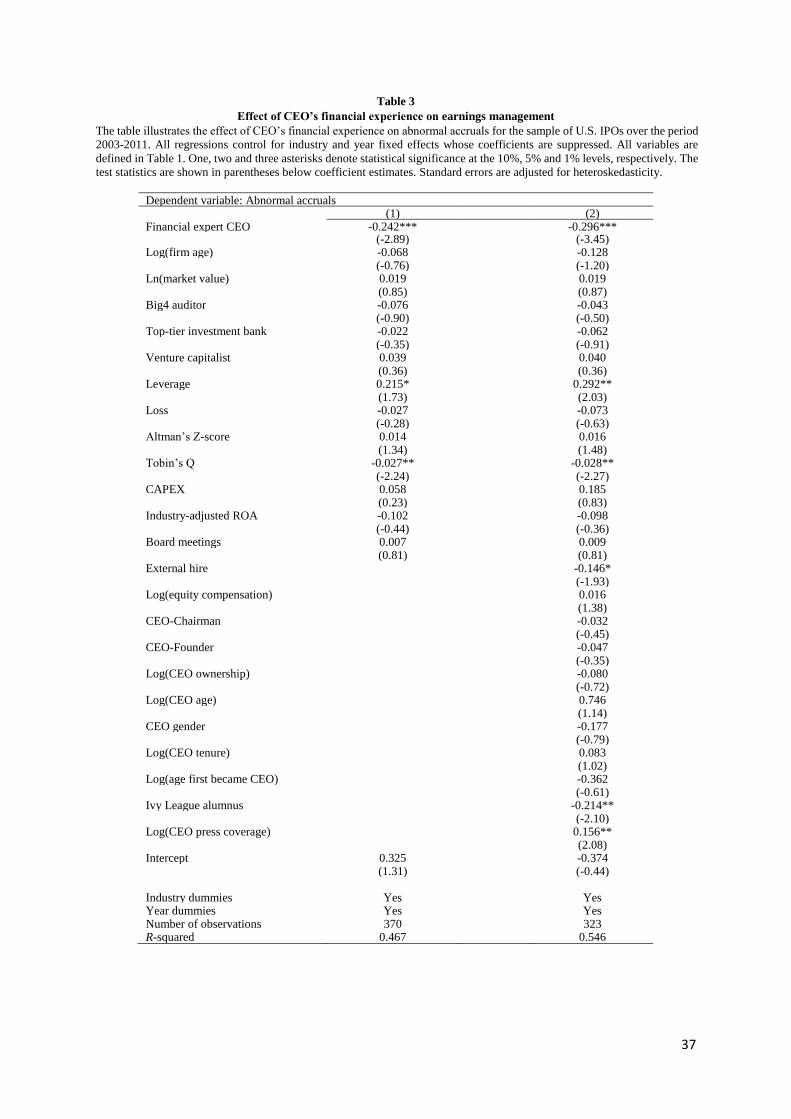
37
Table 3
Effect of CEO’s financial experience on earnings management
The table illustrates the effect of CEO’s financial experience on abnormal accruals for the sample of U.S. IPOs over the period
2003-2011. All regressions control for industry and year fixed effects whose coefficients are suppressed. All variables are
defined in Table 1. One, two and three asterisks denote statistical significance at the 10%, 5% and 1% levels, respectively. The
test statistics are shown in parentheses below coefficient estimates. Standard errors are adjusted for heteroskedasticity.
Dependent variable: Abnormal accruals
Abnormal accruals (1) (2) Financial expert CEO -0.242*** -0.296*** (-2.89) (-3.45) Log(firm age) -0.068 -0.128 (-0.76) (-1.20) Ln(market value) 0.019 0.019 (0.85) (0.87) Big4 auditor -0.076 -0.043 (-0.90) (-0.50) Top-tier investment bank -0.022 -0.062 (-0.35) (-0.91) Venture capitalist 0.039 0.040 (0.36) (0.36) Leverage 0.215* 0.292** (1.73) (2.03) Loss -0.027 -0.073 (-0.28) (-0.63) Altman’s Z-score 0.014 0.016 (1.34) (1.48) Tobin’s Q -0.027** -0.028** (-2.24) (-2.27) CAPEX 0.058 0.185 (0.23) (0.83) Industry-adjusted ROA -0.102 -0.098 (-0.44) (-0.36) Board meetings 0.007 0.009 (0.81) (0.81) External hire -0.146* (-1.93) Log(equity compensation) 0.016 (1.38) CEO-Chairman -0.032 (-0.45) CEO-Founder -0.047 (-0.35) Log(CEO ownership) -0.080 (-0.72) Log(CEO age) 0.746 (1.14) CEO gender -0.177 (-0.79) Log(CEO tenure) 0.083 (1.02) Log(age first became CEO) -0.362 (-0.61) Ivy League alumnus -0.214** (-2.10) Log(CEO press coverage) 0.156** (2.08) Intercept 0.325 -0.374 (1.31) (-0.44) Industry dummies Yes Yes Year dummies Yes Yes Number of observations 370 323 R-squared 0.467 0.546

38
Table 4
Effect of at-issue earnings management on post-issue performance
The table illustrates the effect of at-issue earnings management on post-issue accounting and stock performance for the sample
of U.S. IPOs over the period 2003-2011. All regressions control for industry and year fixed effects whose coefficients are
suppressed. All variables are defined in Table 1. One, two and three asterisks denote statistical significance at the 10%, 5%
and 1% levels, respectively. The test statistics are shown in parentheses below coefficient estimates. Standard errors are
adjusted for heteroskedasticity.
Panel A: Post-issue accounting performance
ROA CFO (1) (2) Abnormal accruals 0.008 -0.008 (0.47) (-0.43) Abnormal accruals * Financial expert CEO 0.037* 0.038* (1.90) (1.75) CFO 0.279*** 0.216*** (9.69) (6.15) CAPEX 0.022 0.148*** (0.31) (2.79) Intercept 0.061 0.109** (1.07) (2.44) Industry dummies Yes Yes Year dummies Yes Yes
P-value of F-test [Abnormal accruals +
Abnormal accruals * Financial expert CEO = 0] 0.000
0.009
Number of observations 454 454 R-squared 0.615 0.589
Panel B: Post-issue stock performance (event-time approach)
BHAR Aggressive earnings management -0.274** (-2.25) Aggressive earnings management * Financial expert CEO 0.538* (1.76) Log(firm age) 0.083 (0.50) Ln(market value) -0.001 (-0.01) Venture capitalist -0.057 (-0.43) Book-to-market 0.299 (1.41) ROA 0.024*** (3.05) Underpricing 0.344 (1.07) Market BHR 0.095 (1.00) Intercept -1.420*** (-2.87) Industry dummies Yes Year dummies Yes
P-value of F-test [Aggressive earnings management +
Aggressive earnings management * Financial expert CEO = 0] 0.374
Number of observations 460 R-squared 0.110
Panel C: Post-issue stock performance (calendar-time approach)
Fama-French three-factor model Without financial expert CEO -0.013** (-2.04) With financial expert CEO -0.006 (-0.60) Carhart four-factor model Without financial expert CEO -0.013* (-1.95) With financial expert CEO -0.007 (-0.65)

39
Table 5
Endogeneity control
The table illustrates the analyses of the effect of CEO’s past financial experience on earnings management in the issue year
for the sample of U.S. IPOs over the period 2003-2011, controlling for the endogeneity of CEO selection using alternative
econometric approaches: instrumental variable (IV), Heckman’s two-step treatment effect, maximum likelihood estimation
(MLE) treatment effect, and propensity score matching. All variables are defined in Table 1. One, two and three asterisks
denote statistical significance at the 10%, 5% and 1% levels, respectively.
Panel A: Propensity score matching
Matching variables: R&D, retained earnings, diversification, log(firm age), ln(market value), big4 auditor, top-tier
investment bank, venture capitalist, leverage, loss, Altman’s Z-score, Tobin’s Q, CAPEX, industry-adjusted ROA, board
meetings, CEO-Chairman, CEO-Founder, log(CEO ownership), log(CEO age), CEO gender, log(CEO tenure), log(age
first became CEO), Ivy League alumnus, log(CEO press coverage), high-tech industry, year dummies
Abnormal accruals
ATET
(Financial expert vs. Non-financial expert)
-0.255***
(-3.48)
Number of observations 285

40
Panel B: Instrumental variable approach and Treatment effect model Dependent variable: Abnormal accruals
2SLS Heckman MLE Selection Outcome Selection Outcome Selection Outcome Financial expert CEO -1.701** -2.912* -0.698*** (-2.00) (-1.80) (-3.45) Log(firm age) -0.058 -0.075 0.029 -0.013 (-0.45) (-0.40) (0.14) (-0.15) Ln(market value) 0.002 0.032 0.037 0.036** (0.09) (0.85) (0.80) (1.97) Big4 auditor 0.057 0.051 -0.045 -0.034 (0.54) (0.31) (-0.24) (-0.41) Top-tier investment bank -0.002 -0.033 -0.040 -0.036 (-0.03) (-0.29) (-0.33) (-0.60) Venture capitalist -0.200** -0.247 0.012 0.063 (-2.12) (-1.06) (0.07) (0.62) Leverage -0.048 0.119 0.199 0.229* (-0.60) (0.81) (1.19) (1.66) Loss 0.108 0.100 -0.048 -0.065 (1.04) (0.52) (-0.28) (-0.65) Altman’s Z-score 0.000 0.017** 0.016*** 0.017* (0.16) (2.01) (2.68) (1.66) Tobin’s Q -0.001 -0.012 -0.006 -0.011 (-0.07) (-0.71) (-0.31) (-1.33) CAPEX -0.079 -0.126 -0.013 -0.081 (-0.24) (-0.27) (-0.03) (-0.38) Industry-adjusted ROA 0.054 -0.070 -0.077 -0.148 (0.42) (-0.23) (-0.33) (-0.62) Board meetings 0.002 0.005 0.000 0.005 (0.19) (0.32) (0.03) (0.55) External hire -0.153** -0.334** -0.106 -0.119* (-1.99) (-2.07) (-0.80) (-1.67) Log(equity compensation) 0.000 0.016 0.014 0.013 (0.01) (0.80) (0.63) (1.14) CEO-Chairman 0.054 0.018 -0.061 -0.077 (0.74) (0.16) (-0.47) (-1.22) CEO-Founder 0.007 -0.125 -0.114 -0.136 (0.07) (-0.74) (-0.56) (-1.14) Log(CEO ownership) -0.051 -0.120 -0.036 -0.048 (-0.53) (-0.78) (-0.24) (-0.54) Log(CEO age) 0.092 0.435 0.135 0.432 (0.12) (0.35) (0.11) (0.74) CEO gender -0.085 -0.427 -0.344 -0.278 (-0.61) (-1.45) (-1.10) (-1.33) Log(CEO tenure) 0.029 0.161 0.121 0.116 (0.38) (1.38) (0.89) (1.55) Log(age first became CEO) 0.331 0.389 -0.009 -0.143 (0.51) (0.36) (-0.01) (-0.27) Ivy League alumnus 0.137 0.060 -0.127 -0.127 (1.27) (0.32) (-0.74) (-1.60) Log(CEO press coverage) -0.003 0.136 0.139 0.155** (-0.03) (1.20) (1.02) (2.06) Intercept -0.532 -1.086 -0.492*** 0.674 -0.535*** -0.375 (-0.52) (-0.72) (-3.95) (0.33) (-4.43) (-0.50) R&D 0.237 0.109 0.483 (0.88) (0.23) (0.95) Retained earnings 0.017* 0.041* 0.080** (1.76) (1.76) (2.30) Diversification 0.038 0.031 0.068 (0.40) (0.15) (0.37) High-tech industry -0.079 -0.033 0.036 (-0.60) (-0.19) (0.21) Industry dummies Yes Yes Yes Yes Yes Yes Year dummies Yes Yes Yes Yes Yes Yes
Durbin-Wu-Hausman test against
H0: variables are exogenous (p-value) 0.046
Inverse Mills ratio 1.625* (1.66)
Likelihood ratio test against
H0: ρ = 0 (p-value)
0.004
Number of observations 285 285 285 285 285 285

41
Table 6
Analysis of the interaction effect between CEO financial experience and CEO power
The table illustrates the effect of CEO financial experience on earnings management controlling for the interaction effect
between CEO financial experience and CEO power for the sample of U.S. IPOs over the period 2003-2011. All regressions
control for industry and year fixed effects whose coefficients are suppressed. CEO power is measured as the sum of the
standardised variables: CEO-Chairman, CEO-Founder, CEO ownership, CEO tenure, and Ivy League alumnus. All other
variables are defined in Table 1. One, two and three asterisks denote statistical significance at the 10%, 5% and 1% levels,
respectively. The test statistics are shown in parentheses below coefficient estimates. Standard errors are adjusted for
heteroskedasticity.
Abnormal accruals
Financial expert CEO -0.297*** (-3.69) Financial expert CEO * CEO power -0.066* (-1.72) Log(firm age) -0.120 (-1.22) Ln(market value) 0.019 (0.84) Big4 auditor -0.037 (-0.42) Top-tier investment bank -0.055 (-0.82) Venture capitalist 0.026 (0.25) Leverage 0.258* (1.88) Loss -0.051 (-0.45) Altman’s Z-score 0.014 (1.39) Tobin’s Q -0.028** (-2.20) CAPEX 0.107 (0.47) Industry-adjusted ROA -0.050 (-0.19) Board meetings 0.007 (0.73) External hire -0.137* (-1.81) Log(equity compensation) 0.012 (1.08) Log(CEO age) 1.076* (1.68) CEO gender -0.239 (-1.10) Log(age first became CEO) -0.686 (-1.37) Log(CEO press coverage) 0.162** (2.17) Intercept -0.410 (-0.52) Industry dummies Yes Year dummies Yes P-value of F-test [Financial expert CEO +
Financial expert CEO*CEO power = 0] 0.000
Number of observations 323 R-squared 0.548

42
Table 7
Robustness checks – Alternative measures of financial experience
The table illustrates the analyses of the effect of CEO’s past experience as a CFO, CPA qualification, and financial experience
diversity on earnings management in the issue year for the sample of U.S. IPOs over the period 2003-2011. All regressions
control for industry and year fixed effects whose coefficients are suppressed. All variables are defined in Table 1. One, two
and three asterisks denote statistical significance at the 10%, 5% and 1% levels, respectively. The test statistics are shown in
parentheses below coefficient estimates. Standard errors are adjusted for heteroskedasticity.
Panel A: Effect of CEO’s past experience as a CFO and CPA qualification on earnings management
Dependent variable: Abnormal accruals (1) (2) (3) CFO -0.186** (-2.23) CPA -0.338* (-1.79) CFO&CPA -0.208* (-1.78) Log(firm age) -0.108 -0.106 -0.111 (-0.99) (-0.98) (-1.03) Ln(market value) 0.020 0.021 0.021 (0.93) (0.95) (0.95) Big4 auditor -0.056 -0.035 -0.048 (-0.64) (-0.39) (-0.55) Top-tier investment bank -0.049 -0.071 -0.059 (-0.72) (-1.00) (-0.85) Venture capitalist 0.105 0.095 0.104 (0.84) (0.77) (0.84) Leverage 0.312** 0.305** 0.307** (2.04) (2.02) (2.02) Loss -0.112 -0.087 -0.102 (-1.00) (-0.75) (-0.90) Altman’s Z-score 0.016 0.016 0.016 (1.37) (1.39) (1.37) Tobin’s Q -0.030** -0.028** -0.029** (-2.39) (-2.31) (-2.27) CAPEX 0.232 0.199 0.206 (1.03) (0.88) (0.90) Industry-adjusted ROA -0.119 -0.105 -0.103 (-0.43) (-0.39) (-0.37) Board meetings 0.008 0.007 0.008 (0.70) (0.66) (0.74) External hire -0.133 -0.110 -0.116 (-1.64) (-1.39) (-1.47) Log(equity compensation) 0.012 0.013 0.014 (1.00) (1.04) (1.14) CEO-Chairman -0.052 -0.045 -0.042 (-0.71) (-0.64) (-0.58) CEO-Founder -0.043 -0.065 -0.048 (-0.31) (-0.46) (-0.35) Log(CEO ownership) -0.081 -0.075 -0.080 (-0.71) (-0.66) (-0.69) Log(CEO age) 0.694 0.615 0.716 (1.08) (0.97) (1.12) CEO gender -0.155 -0.161 -0.153 (-0.69) (-0.71) (-0.67) Log(CEO tenure) 0.072 0.070 0.076 (0.87) (0.85) (0.91) Log(age first became CEO) -0.376 -0.393 -0.423 (-0.64) (-0.67) (-0.73) Ivy League alumnus -0.241** -0.256** -0.251** (-2.23) (-2.41) (-2.32) Log(CEO press coverage) 0.157* 0.166** 0.158** (1.95) (2.08) (1.98) Intercept -0.318 -0.221 -0.301 (-0.38) (-0.26) (-0.35) Industry dummies Yes Yes Yes Year dummies Yes Yes Yes Number of observations 323 323 323 R-squared 0.522 0.526 0.518

43
Panel B: Effect of CEO’s financial experience diversity on earnings management
Dependent variable: Abnormal accruals
(1) (2) (3) (4) (5) (6) Number of firms -0.086** (-2.03) Number of roles -0.061** (-2.01) Financial experience at another firm -0.194** (-2.48) Log(financial experience time) -0.192** (-2.20) Financial experience diversity index -0.034** (-2.31) Financial experience diversity dummy -0.163** (-2.34) Log(firm age) -0.104 -0.110 -0.090 -0.094 -0.098 -0.103 (-0.95) (-1.01) (-0.82) (-0.86) (-0.90) (-0.94) Ln(market value) 0.019 0.018 0.020 0.020 0.020 0.023 (0.88) (0.83) (0.92) (0.93) (0.89) (1.03) Big4 auditor -0.053 -0.060 -0.043 -0.047 -0.052 -0.049 (-0.61) (-0.68) (-0.50) (-0.54) (-0.59) (-0.56) Top-tier investment bank -0.052 -0.051 -0.054 -0.058 -0.053 -0.055 (-0.76) (-0.74) (-0.79) (-0.84) (-0.77) (-0.80) Venture capitalist 0.103 0.105 0.104 0.108 0.104 0.106 (0.83) (0.85) (0.84) (0.87) (0.84) (0.85) Leverage 0.317** 0.311** 0.314** 0.313** 0.315** 0.304** (2.07) (2.05) (2.06) (2.05) (2.06) (2.00) Loss -0.118 -0.119 -0.113 -0.112 -0.117 -0.113 (-1.05) (-1.05) (-1.02) (-1.00) (-1.04) (-1.01) Altman’s Z-score 0.016 0.016 0.016 0.016 0.016 0.016 (1.39) (1.39) (1.38) (1.37) (1.39) (1.37) Tobin’s Q -0.029** -0.029** -0.030** -0.029** -0.030** -0.030** (-2.33) (-2.33) (-2.40) (-2.36) (-2.38) (-2.43) CAPEX 0.218 0.216 0.248 0.231 0.231 0.235 (0.95) (0.95) (1.10) (1.02) (1.02) (1.04) Industry-adjusted ROA -0.125 -0.124 -0.119 -0.116 -0.123 -0.121 (-0.45) (-0.44) (-0.43) (-0.42) (-0.44) (-0.43) Board meetings 0.009 0.008 0.009 0.008 0.008 0.008 (0.80) (0.77) (0.80) (0.77) (0.79) (0.72) External hire -0.128 -0.119 -0.117 -0.125 -0.125 -0.119 (-1.61) (-1.52) (-1.49) (-1.57) (-1.57) (-1.51) Log(equity compensation) 0.014 0.013 0.012 0.012 0.013 0.011 (1.14) (1.10) (0.97) (0.98) (1.03) (0.90) CEO-Chairman -0.045 -0.038 -0.052 -0.046 -0.046 -0.040 (-0.62) (-0.52) (-0.71) (-0.63) (-0.63) (-0.54) CEO-Founder -0.046 -0.043 -0.049 -0.053 -0.048 -0.044 (-0.33) (-0.31) (-0.35) (-0.38) (-0.35) (-0.32) Log(CEO ownership) -0.078 -0.084 -0.068 -0.071 -0.076 -0.076 (-0.68) (-0.73) (-0.60) (-0.62) (-0.67) (-0.67) Log(CEO age) 0.698 0.714 0.726 0.699 0.701 0.662 (1.08) (1.11) (1.12) (1.08) (1.08) (1.02) CEO gender -0.149 -0.150 -0.166 -0.158 -0.157 -0.168 (-0.67) (-0.67) (-0.74) (-0.70) (-0.70) (-0.75) Log(CEO tenure) 0.077 0.078 0.069 0.075 0.076 0.079 (0.92) (0.93) (0.83) (0.89) (0.91) (0.94) Log(age first became CEO) -0.363 -0.377 -0.343 -0.358 -0.348 -0.347 (-0.62) (-0.64) (-0.58) (-0.60) (-0.59) (-0.59) Ivy League alumnus -0.251** -0.245** -0.240** -0.245** -0.244** -0.238** (-2.34) (-2.28) (-2.23) (-2.29) (-2.28) (-2.22) Log(CEO press coverage) 0.162** 0.157* 0.164** 0.162** 0.162** 0.147* (2.01) (1.96) (2.06) (2.03) (2.02) (1.84) Intercept -0.379 -0.364 -0.490 -0.422 -0.447 -0.327 (-0.45) (-0.43) (-0.57) (-0.50) (-0.52) (-0.39) Industry dummies Yes Yes Yes Yes Yes Yes Year dummies Yes Yes Yes Yes Yes Yes Number of observations 323 323 323 323 323 323 R-squared 0.521 0.520 0.524 0.521 0.522 0.523

44
Pairwise correlation Number of
firms
Number of
roles
Financial
experience at
another firm
Log(financial
experience
time)
Number of firms 1.000
Number of roles 0.908 1.000
Financial experience at another firm 0.814 0.764 1.000
Log(financial experience time) 0.853 0.818 0.856 1.000
First component: Eigenvalue of 3.50742 and proportion explained of 0.8769
Loadings
Number of firms 0.510
Number of roles 0.498
Financial experience at another firm 0.489
Log(financial experience time) 0.503
Panel C: Post-issue accounting performance ROA CFO ROA CFO (1) (2) (3) (4) Abnormal accruals 0.013 -0.006 0.012 -0.007 (0.82) (-0.36) (0.74) (-0.38) Abnormal accruals * CFO 0.031 0.049** (1.43) (2.05)
Abnormal accruals * Financial experience
diversity dummy
0.034 0.046** (1.64) (2.08)
CFO 0.276*** 0.214*** 0.277*** 0.215*** (9.49) (6.07) (9.55) (6.09) CAPEX 0.033 0.161*** 0.034 0.162*** (0.46) (2.99) (0.47) (3.00) Intercept 0.062 0.114** 0.065 0.117** (1.09) (2.52) (1.16) (2.54) Industry dummies Yes Yes Yes Yes Year dummies Yes Yes Yes Yes
P-value of F-test [ Abnormal accruals +
Abnormal accruals * CFO = 0 ]
0.000 0.001
P-value of F-test [ Abnormal accruals +
Abnormal accruals * Financial experience
diversity dummy= 0 ] 0.000 0.002
Number of observations 454
454
454 454 R-squared 0.614
0.589
0.614 0.589

45
Panel D: Post-issue stock performance
BHAR BHAR (1) (2)
Aggressive earnings management -0.202* -0.192 (-1.66) (-1.51) Aggressive earnings management * CFO 0.555 (1.14) Abnormal accruals * Financial experience diversity
dummy
0.247 (0.76)
Log(firm age) 0.071 0.071 (0.43) (0.43) Ln(market value) -0.006 -0.003 (-0.12) (-0.07) Venture capitalist -0.072 -0.065 (-0.54) (-0.48) Book-to-market 0.305 0.316 (1.42) (1.47) ROA 0.023*** 0.023*** (3.10) (3.08) Underpricing 0.351 0.329 (1.11) (1.00) Market index return 0.110 0.115 (1.22) (1.25) Intercept -0.417 -0.438 (-1.03) (-1.08) Industry dummies Yes Yes Year dummies Yes Yes P-value of F-test [Aggressive earnings management
+ Aggressive earnings management * CFO = 0] 0.469
P-value of F-test [Aggressive earnings management
+ Aggressive earnings management * Financial
experience diversity dummy = 0]
0.863
Number of observations 460
460
R-squared 0.103
0.100


