
7/26/2019 172868_Fertilizer Industry Handbook_with Notes
http://slidepdf.com/reader/full/172868fertilizer-industry-handbookwith-notes 1/50
IR-Date: 2014-07-18
0

7/26/2019 172868_Fertilizer Industry Handbook_with Notes
http://slidepdf.com/reader/full/172868fertilizer-industry-handbookwith-notes 2/50
1
Yara Fertilizer Industry Handbook
This handbook describes the fertilizer industry and in particular the nitrogen part
which is the most relevant for Yara International.The document does not describe Yara or its strategies. For information on Yara-
specific issues please see the Capital Markets Day presentations.
Fertilizers are essential plant nutrients that are applied to a crop to achieve
optimal yield and quality. The following slides describe the value and
characteristics of fertilizers in modern food production.
2

7/26/2019 172868_Fertilizer Industry Handbook_with Notes
http://slidepdf.com/reader/full/172868fertilizer-industry-handbookwith-notes 3/50
Three main nutrients: Nitrogen, Phosphorus and Potassium
• Nitrogen (N), the main constituent of proteins, is essential for growth and
development in plants. Supply of nitrogen determines a plant’s growth, vigour,colour and yield
• Phosphorus (P) is vital for adequate root development and helps the plant
resist drought. Phosphorus is also important for plant growth and development,
such as the ripening of seed and fruit
• Potassium (K) is central to the translocation of photosynthesis within plants,
and for high-yielding crops. Potassium helps improve crop resistance to
lodging, disease and drought.
In addition to the three primary nutrients, the secondary nutrients sulphur,
magnesium and calcium are required for optimum crop growth. Calcium is
particularly important for the yield, quality and storage capacity of high-value
crops such as fruit and vegetables.
A complete plant life cycle is only possible if all plant nutrients are available to the
crop.
Each plant nutrient has its specific physiological functions which cannot be
replaced by any other nutrient.
3 4
The law of minimum
The ‘law of minimum’ is often illustrated with a water barrel, with staves of
different lengths. The barrel̀ s capacity to hold water is determined by theshortest stave. Similarly, crop yields are frequently limited by shortages of
nutrients or water. Once the limiting factor (constraint) has been corrected, yield
will increase until the next limiting factor is encountered.
Nutrients are classified into three sub-groups based on plant growth needs.
These are:
• Macro or primary nutrients: nitrogen (N), phosphorus (P), potassium (K)
• Major or secondary nutrients: calcium (Ca), magnesium (Mg) and sulphur (S)
• Micro nutrients or trace elements: chlorine (Cl), iron (Fe), manganese (Mn),
boron (B), selenium (Se), zinc (Zn), copper (Cu), molybdenum (Mo) etc.
Yield responses to nitrogen are frequently observed, as nitrogen is often alimiting factor to crop production, but not the only factor. Balanced nutrition is
used to obtain maximum yield and avoid shortages of nutrients.

7/26/2019 172868_Fertilizer Industry Handbook_with Notes
http://slidepdf.com/reader/full/172868fertilizer-industry-handbookwith-notes 4/50
5
Nutrients are depleted with the harvest
As crops take up nutrients from the soil, a substantial proportion of these
nutrients are removed from the field when the crops are harvested. While somenutrients can be returned to the field through crop residues and other organic
matter, this alone cannot provide optimum fertilization and crop yields over time.
Mineral fertilizers can provide an optimal nutrient balance, tailored to the
demands of the specific crop, soil and climate conditions, maximising crop yield
and quality whilst also minimizing environmental impacts.
6
Organic fertil izer contains the same inorganic molecules as mineral
fertilizer
Crops can be fed with mineral or organic fertilizers (manure), and in both casesthe crop will utilize the same inorganic molecules. A complete nutrient program
must take into account soil reserves, use of manure or fertilizers, and an
accurate supplement of mineral fertilizers.
Manures build up the organic content of soil and at the same time support
beneficial micro flora (e.g. bacteria) to grow on plant roots. The efficiency of
organic fertilizer is dependent on an appropriate bacteria content in the soil. The
right bacteria break down the organic content in manures and supply them as
nutrients for plant growth. But the quality and quantity of nutrient supplied to
plants via this process is inconsistent and is very much dependent upon the
vagaries of soil and climatic factors. Plant productivity achieved by supplying
organic matter is low compared with mineral nutrients supplied in the form of fertilizers.
The separation of livestock and arable farming regions has lead to nutrient
distribution inefficiency, with a surplus in the animal farming regions. The low
nutrient content and bulky nature of manures makes transportation inconvenient
and costly.

7/26/2019 172868_Fertilizer Industry Handbook_with Notes
http://slidepdf.com/reader/full/172868fertilizer-industry-handbookwith-notes 5/50
7
Organic farming accounts for less than 1% of cultivated land
37 million hectares of agricultural land were managed organically in 2012, slightly
up from 2011. Almost two-thirds of the agricultural land under organic management is grassland
(23 million hectares).
With most of the are cultivated organically being grassland and low productivity,
the impact of organic farming on fertilizer demand is limited.
A li fe-c ycl e p ers pec ti ve on fer ti li zer is im po rt ant
When new acreage is converted to cropland, above ground carbon is
immediately removed and converted to CO2, whereas carbon stored in theground will leak out more gradually.
When the ambition is to minimize total carbon footprint from global biomass
production, efficient use of land, based on modern agricultural practices, is
therefore of great importance. Intensive farming with high yields is a important to
preserve forests - the real carbon sink tanks.
Organic farming with low yields would push for further deforestation and climate
warming.
8

7/26/2019 172868_Fertilizer Industry Handbook_with Notes
http://slidepdf.com/reader/full/172868fertilizer-industry-handbookwith-notes 6/50
9
Am on g th e majo r pl ant nu tr ien ts , nit ro gen is mo st imp or tan t fo r hi gh er
crop yields
The fertilizer market is composed of three main nutrients – nitrogen,phosphorous and potassium. Nitrogen is by far the largest nutrient, accounting
for 60% of total consumption, and Yara is the leading producer of this nutrient.
Phosphorus (phosphate) and potassium fertilizers are primarily applied to
improve crop quality. Annual application is not always needed, as the soil
absorbs and stores these two nutrients for a longer period compared with
nitrogen. Nitrogen must be applied every year to maintain yield and biomass.
There are fewer large suppliers of phosphate and potash fertilizers, as
phosphate rock and potash mineral deposits are only available in certain regions
of the world.
Nitrogen fertilizers are produced in many countries, reflecting the wide
availability of key raw materials - natural gas and air, needed for its productionon an industrial scale. The global nitrogen market is therefore less consolidated,
but some regions such as Europe and the US have seen significant restructuring
of their nitrogen industries in the last decade.
10
Correct use of fertilizers can yield a 790% return on investment
Using 192 kg N/ha (winter wheat in Europe), it is possible to produce 9.3 tons of
grain per hectare. The fertilizer cost at this application level using CAN (27% N)at EUR 254/t (1.167 USD/kg N) would be 192 kg x 1.167 USD = 224 USD/ha
Using a wheat price of 245 USD/t, the farmer gets the following alternative
revenue scenarios:
• Optimal nitrogen level: 9.30 t grain/ha * 245 USD = 2,279 USD/ha
• No nitrogen fertilizer added: 2.07 t grain/ha * 245 USD = 507 USD/ha
The difference in revenues is 1,772 USD/ha resulting from an input cost of 224
USD/ha, i.e. a return on investment of 790%.

7/26/2019 172868_Fertilizer Industry Handbook_with Notes
http://slidepdf.com/reader/full/172868fertilizer-industry-handbookwith-notes 7/50
11
Nitrate is immediately and easily taken up by plants
Ammonia (NH3) is the basis for all nitrogen fertilizers and it contains the highest
amount of nitrogen (82%). Ammonia can be applied directly to the soil, but for several reasons, including environmental, it is common to further processammonia into, e.g., urea or nitrates before application. If ammonia is applieddirectly to the soil, it must be converted to ammonium (NH 4) and nitrate beforeplants can use it as a source of nitrogen.
While ammonium and nitrate are readily available to plants, urea first needs tobe transformed to ammonium and then to nitrate.
The transformation process is dependent upon many environmental andbiological factors. E.g., under low temperatures and low pH (as seen in Europe),urea transformation is slow and difficult to predict with resulting nitrogen andefficiency losses. Nitrates, in comparison, are readily absorbed by the plants
with minimum losses. Therefore, nitrates are widely regarded as a qualitynitrogen fertilizer for European agricultural conditions. This is reflected in their large market share.
12
Nitrate is a more efficient fertilizer than urea
Field trials confirm that nitrates give higher crop yields than urea and thus
contribute to both higher farm revenue and better land use.Urea has a lower carbon footprint at the production stage of the fertilizer lifecyclethan ammonium nitrate. This is mainly due to the fact that part of the CO2
generated in ammonia production is captured in the urea. However, the CO2 isreleased as soon as the urea is applied on the field. In addition, more N2O isemitted from urea in the nitrification process. Urea also emits more ammonia tothe atmosphere during farming than AN. The loss of ammonium from urea alsorequires higher dosage to compensate for higher losses. Overall, the life cyclecarbon footprint of urea is higher than that of ammonium nitrate. Field trialsconfirm that nitrates give higher crop yields than urea and thus contribute to bothhigher farm revenue and better land use.

7/26/2019 172868_Fertilizer Industry Handbook_with Notes
http://slidepdf.com/reader/full/172868fertilizer-industry-handbookwith-notes 8/50
The more nitrate in fertilizer, the higher the yield
There are numerous examples of experiments that support the superior
performance of nitrates in arable, fruit and vegetable crop production, both withregard to yield and quality.
For arable crops, nitrogen fertilizer containing 50% nitrate and 50% ammoniumsuch as CAN or AN are likely to be the most financially rewarding option, due tothe relatively low crop value.
For higher-value cash crops such as fruit and vegetables, fertilizer productscontaining a high amount of nitrate nitrogen are likely to be the optimum choice,especially for rapidly growing vegetables which need nitrogen readily available
The most extensive study comparing different forms of nitrogen fertilizers wasperformed on behalf of the UK government between 2003 and 2005 (Departmentfor Environment, Food and Rural Affaires, DEFRA). Besides quantitativedifferences, the study highlighted the variability of results observed with urea andUAN. The required nitrogen application rates can therefore not be predicted withthe same reliability as with ammonium nitrate.
13
Benefits of nitrates are high in tropical climates
The trial was carried out in the Cerrado region of Bahia by/at “Research and
Technology Centre of Western Bahia (CPTO) – Fundacao Bahia, Brazil. The trialwas done with a 1st season maize (season 2012/2013, previous crop wassoybean (2011/2012) under conventional tillage system. Site location: LuisEduardo Magalhaes (LEM).
14

7/26/2019 172868_Fertilizer Industry Handbook_with Notes
http://slidepdf.com/reader/full/172868fertilizer-industry-handbookwith-notes 9/50
Field tr ials confirm the advantages of applying nitrates instead of a
commodity nitrogen fertilizer
For wheat in UK trials concluded that yields improved by 3%, while for orangeproduction in Brazil the yield improvement was a massive 17% using nitratesinstead of urea.
Winter wheat, UK
• Average of 15 field trials between 1994 and 1998, both N forms tested at 160 kgN/ha
• Levington Research
• Yield with urea = 8.38 t/ha, CAN = 8.63 t/ha
• Grain price = 180 €/t (price at farm in NW-Germany, Nov 2011)
Citrus, Brazil
• Based on 1 field trial with oranges in Brazil, both N forms tested at 180 kg N/ha
• Cantarella, 2003
• Yield with urea = 37.1 t/ha = 909 boxes, AN = 43.3 t/ha = 1061 boxes
• Price per box = 4 $ = 3.01 € (industry price excluding harvest service, Nov2011)
15 16
Different quality between blended and compound NPK
In compound NPKs, all the N, P and K nutrients are included in every piece of fertilizer, while in a blended NPK, mixes of straight fertilizer like urea, nitrates,DAP, TSP, MOP, SOP etc, are mixed, or blended together.
The photo on the left shows a typical low quality blended product with a widevariation of particle sizes, shapes and nutrient contents. Larger, denser particleswill spread further, and smaller lighter particles will spread the least distance.Where different sized particles have different nutrient content, this leads tosegregation of nutrients upon spreading. In turn this will create uneven cropgrowth, and typical striping on crops such as cereals or rice. Compare this to thepicture on the right of compound NPKs. Here we have a purposely defineddistribution of particle sizes for a uniform spread pattern. With compound
fertilizers, all the nutrients are in every particle, so no segregation of individualnutrients is guaranteed. All together this ensures accurate feeding of crops.

7/26/2019 172868_Fertilizer Industry Handbook_with Notes
http://slidepdf.com/reader/full/172868fertilizer-industry-handbookwith-notes 10/50
17
Careful handling of blended NPKs important to avoid segregation
Segregation of fertilizer blends can occur on loading into ships or bulk heaps, as
larger particles will round to the edge of the heap. Careful handling of blendedproducts is required to prevent segregation. With compound productssegregation of individual nutrients is not possible. However, it is also important tohandle these products carefully and separation of smaller as larger particles willalter the particle size distribution and spreading pattern.
18
Striping due to poor distribution of nutrients
Our spreading tests have shown the deviation in actual nutrient application rate
compared to target nutrient rate can be considerable. Deviation in nutrient rateswill cause a major impact on the quality and yield of grains/fresh fruit andvegetables.

7/26/2019 172868_Fertilizer Industry Handbook_with Notes
http://slidepdf.com/reader/full/172868fertilizer-industry-handbookwith-notes 11/50
19
Compound NPKs provide higher yields for the farmer
The benefits of using compound NPKs are many:1. The farmer get the nutrients they have paid for
2. Saving of labor costs for balanced nutrition through a convenient singleapplication
3. Less nutrient losses through volatilization and surface runoff
4. Efficient and fast acting nutrients
5. Less environmental impact and lower carbon footprint
The fertilizer industry
Due to the transportability of fertilizers, the industry is highly global meaning that
the price of a standard fertilizer like urea is nearly the same everywhere adjustingfor transportation costs. Consequently, it is important to focus on the globalindustry and supply-demand balance rather than regional ones.
20

7/26/2019 172868_Fertilizer Industry Handbook_with Notes
http://slidepdf.com/reader/full/172868fertilizer-industry-handbookwith-notes 12/50
21
Nitrogen is the largest nutrient with projected annual growth rate of 1.5%
In 2013 the consumption of nitrogen and potash increased, while consumption
of phosphates declined. Nitrogen consumption increased by 1.8% while
phosphate demand ended 0.2% lower than in 2012. Potassium consumption
increased by 2.8%.
Going forward, The International Fertilizer Association (IFA) forecasts nitrogen
fertilizer demand growth at 1.5% per year through 2019. A growth rate of 1.6% a
year is estimated for phosphate and 2.6% for potassium.
For urea a higher growth rate is expected as this product is taking market share
from other nitrogen products.
22
The key nitrogen, phosphate and potash products are urea, DAP and MOP
respectively
Urea, DAP and MOP are the key products for following price developments for nitrogen, phosphorus and potassium respectively. They have a large market
share and are widely traded around the world.
Urea contains 46% nitrogen, and its share of nitrogen consumption is
increasing. The majority of new and pipeline nitrogen capacity in the world is in
the form of urea.
Diammonium phosphate (DAP) contains 46% phosphate (measured in P2O5)
and 18% nitrogen. Monammonium phosphate (MAP) contains 46% phosphate
and 11% nitrogen.
Potassium chloride (MOP) contains is 60% potash, measured in K 2O.

7/26/2019 172868_Fertilizer Industry Handbook_with Notes
http://slidepdf.com/reader/full/172868fertilizer-industry-handbookwith-notes 13/50
23
Geographical variances in fertilizer application
Fertilizer demand is mostly influenced by the evolution of the planted area and
yields, the crop mix, crop prices and fertilizer-to-crop price ratios, fertilizer
subsidy regimes, nutrient management regulations, nutrient recycling practices,
and innovation.
Nitrogen is by far the largest nutrient, accounting for 60% of total consumption.
Phosphorus (phosphate) and potassium fertilizers are primarily applied to
improve crop quality. Annual application is not always needed, as the soil
absorbs and stores these two nutrients for a longer period compared with
nitrogen. Nitrogen must be applied every year to maintain yield and biomass.
Brazil consumes substantial amounts of phosphate and potash due to a large
soybean production.
24
As ia is th e lar ges t fer til izer mar ket , bu t Lat in Am eri ca has th e hi gh est
growth rate
Asian share of global nitrogen consumption was 62% in 2013 with China
representing approximately half of that share.
Whereas Chinese consumption is expected to decelerate going forward, the
highest growth rates should be witnessed in sub-regions with recovering
agriculture such as Eastern Europe and Central Asia and in regions with a large
potential to increase agricultural production. Latin America falls into the latter
category, and although it still accounts for a relatively small volume, the region is
expected to keep its position as the region with the highest growth rate.
Consumption in mature markets like North America and West Europe is forecast
to grow at a slower pace while Chinese consumption is expected flat over the
next years.

7/26/2019 172868_Fertilizer Industry Handbook_with Notes
http://slidepdf.com/reader/full/172868fertilizer-industry-handbookwith-notes 14/50
25
Geographical variances in nitrogen fertilizers demand
There are large variations in nitrogen fertilizer use in different regions/countries.
Urea, the fastest growing nitrogen product, is popular in warmer climates. UAN
is mainly used in North America, while nitrates are mainly used in Europe. In the
US, ammonia is also used as a source of nitrogen in agriculture, especially for
direct fall application.
In China, urea is dominant. China is also the only country that uses ammonium
bicarbonate (ABC). Although ABC is gradually being phased out, it has still
around 17% market share in China.
Brazil consumes substantial amounts of phosphate and potash due to a large
soybean production.
Nitrogen market is more fragmented and competitive than potash and
phosphate markets
Nitrogen fertilizers are produced in many countries, reflecting the wide availability
of key raw materials - natural gas and air, needed for its production on an
industrial scale. The global nitrogen market is therefore less consolidated, but
some regions such as Europe and the US have seen significant restructuring of
their nitrogen industries in the last decade.
There are fewer large suppliers of phosphate and potash fertilizers, as phosphate
rock and potash mineral deposits are only available in certain regions of the
world. The potash industry is even more consolidated than the phosphate
industry.
26

7/26/2019 172868_Fertilizer Industry Handbook_with Notes
http://slidepdf.com/reader/full/172868fertilizer-industry-handbookwith-notes 15/50
27
Yara and Agrium are the two largest fertil izer companies measured by
revenues
28
Yara is the global no. 1 producer of ammonia, nitrates and NPK
Yara’s position gives it unique opportunities to leverage economies of scale and
spread best practice across a large network of plants, an important driver for
Yara’s competitive returns.

7/26/2019 172868_Fertilizer Industry Handbook_with Notes
http://slidepdf.com/reader/full/172868fertilizer-industry-handbookwith-notes 16/50
29
Yara benefits from a favourable cost position in its European home market for nitrates and NPKs
The ammonia position reflects move away from traditional oil-linked natural gas
contracts to more hub / spot gas exposure in contracts
Nitrates: Stable cost position approximately 10-20% below European
competitors. The 2008 nitrate position is explained by Tertre’s gas contract
which was revised during 2008.
Yara is also the low-cost leader on NPK producing 20% below European
competitors.
Fertilizer industry dynamics
This section describes in more detail the competitive forces and product flows for
the main nitrogen products.
30

7/26/2019 172868_Fertilizer Industry Handbook_with Notes
http://slidepdf.com/reader/full/172868fertilizer-industry-handbookwith-notes 17/50
31
The fert il izer industry is becoming more consolidated and market-
orientated
In the past, the fertilizer industry has been affected by state funds driving
investments from a food security point of view rather than from a business point
of view, and by weak fertilizer companies that existed as part of government-
owned enterprises or conglomerates. As state involvement is declining and
conglomerates are cleaning up their portfolios, there is a trend towards
consolidation and more financial discipline across the whole industry.
This development is strengthened by WTO and EU enlargement which creates
more equal terms for all players in the industry.
In recent years there has been a significant spread between “low-cost gas
regions” outside Europe, creating a significant cost advantage for fertilizer plants
located in the former. However, this spread is expected to narrow due to
increased global LNG activity and higher pipeline capacity into Europe,
improving liquidity.
Am mo ni a
Ammonia is the key intermediate product in the production of all nitrogen
fertilizers. A strong ammonia position and understanding of the ammonia market
is essential for a leading nitrogen fertilizer company.
32

7/26/2019 172868_Fertilizer Industry Handbook_with Notes
http://slidepdf.com/reader/full/172868fertilizer-industry-handbookwith-notes 18/50
33
China is the largest ammonia producer
Ammonia is the key intermediate for all nitrogen fertilizer products and large
nitrogen-consuming countries are also large producers of ammonia.
Ammonia is predominantly upgr aded to other nitrogen products at its production
site. Only 18.2 million tons or 11% of the ammonia produced globally in 2013
was traded. Ammonia production reached 171 million tons, an increase of 2.6%
compared to 2012. The trend from 2003 to 2013 shows a growth rate of 2.6%
per year.
Only 10% of ammonia production is traded
In 2013, world ammonia trade decreased with 3% to 18.2 million tons implying
that only 10% of world ammonia production was traded. Including the urea share
from industrial consumption, urea consumes 54% of all ammonia production.
This ammonia needs to be upgraded on site as urea production requires CO2
which is a by-product of the ammonia production.
For the ammonia that is traded, there are four main categories of customers:
1. There is a substantial industrial market for traded ammonia
2. Producers of main phosphate fertilizers such as DAP and MAP (also some
types of NPK) import ammonia as the regions with phosphate reserves often
lack nitrogen capacity
3. Some of the nitrate capacity is also based on purchased ammonia.
4. Direct application on the field, only common in USA
Of the traded ammonia, Yara has a market share of around 20%. This leading
position gives the company a good overview of the global supply / demand
balance of ammonia and enables the company to make better business
decisions.
34

7/26/2019 172868_Fertilizer Industry Handbook_with Notes
http://slidepdf.com/reader/full/172868fertilizer-industry-handbookwith-notes 19/50
35
Trinidad is the world’s largest ammonia exporter
The large ammonia exporters in the world have access to competitively priced
natural gas, the key raw material for its production. Trinidad has large natural
gas reserves and also lies in close proximity to the world’s largest importer of
ammonia, the US. Trinidad has large stand-alone ammonia plants and excellent
maritime facilities that cater for export markets. Yara owns two large ammonia
production facilities in Trinidad.
The Middle East also has some of the world’s largest reserves of natural gas.
The Qafco fertilizer complex in Qatar produces significant amounts of ammonia,
but most of the ammonia produced in Qafco is upgraded to urea. Therefore,
Qafco is a major exporter of urea and there is a relatively small surplus of
ammonia left for exports.
In the US, imported ammonia is used for DAP/MAP production, for various
industrial applications and directly as a nitrogen fertilizer.
India uses its imported ammonia mostly to produce DAP.
36
The majority of ammonia trade follows the routes shown in the map, mainly
from countries w ith cheaper gas
The key centre for ammonia trade is Yuzhnyy in the Black Sea. This is the most
liquid location, and where most spot trades take place. Russian and Ukrainian
ammonia is sold wherever netbacks are the highest, and since they are key
suppliers to USA, Europe and Mediterranean, relative pricing for the various
locations West of Suez is very stable.
Asia is almost in a balanced situation. If there is a deficit, imports from the Black
Sea are necessary, and fob prices in Asia increase. If there is a surplus, Asian
exporters have to compete West of Suez, and Asian fob price levels suffer.

7/26/2019 172868_Fertilizer Industry Handbook_with Notes
http://slidepdf.com/reader/full/172868fertilizer-industry-handbookwith-notes 20/50
Urea
Urea is the largest finished nitrogen fertilizer product and is traded globally. Even
though many markets prefer other nitrogen fertilizers for better agronomic
properties, urea is the commodity reference product with an important influenceon most other nitrogen fertilizer prices.
37 38
Urea is the main nitrogen fertilizer product
Urea production increased to 169.3 million tons in 2013, up 4.9% from 2012.
During the years 2003-2013, urea production grew on average at 3.9% per year.
The largest producers are also the largest consumers, namely China and India.China is self-sufficient on nitrogen fertilizer but India’s imports requirement is
growing.
Most of the new nitrogen capacity in the world is urea, so it is natural that
production/consumption growth rates are higher for urea than for ammonia/total
nitrogen. Lately, the difference has been quite large, since urea has taken
market share, particularly from ammonium bicarbonate in China. In addition, a
major share of the capacity shutdowns in high energy cost regions have been
stand-alone ammonia plants.
As urea has a high nitrogen content (46%), transport is relatively cheap. In
addition, demand growth is to a large extent taking place in climates which favor
urea use.

7/26/2019 172868_Fertilizer Industry Handbook_with Notes
http://slidepdf.com/reader/full/172868fertilizer-industry-handbookwith-notes 21/50
39
Natural gas-rich regions generally tend to be big exporters of urea
Urea is a global fertilizer and is more traded than ammonia. Exports from China
above 8.3 million tons in 2013, up from 6.8 million tons in 2012. Global trade of
urea increased by 4.1% in 2013, to 44.8 million tons. The most important shiftswere stronger exports from China, Qatar, Oman and UAN. Qatar is for the first
time the second largest urea exporter, only after China. In 2013, they surpassed
Russia. Ukraine and Iran exported less.
The main urea exporters are gas-rich countries/regions with small domestic
markets. However, there are some exceptions.
China has huge domestic capacity. Although the main purpose is to supply the
domestic market, during periods with strong global demand China is needed to
balance the market.
North America, Latin America and South and East Asia are the main importingregions.
40
Black Sea and Arab Gulf are main urea export hubs
There are two main hubs to follow in the urea trade market, Black Sea and Arab
Gulf. These flows determine the global prices.
Black Sea exports supply Europe and Latin America, while Arab Gulf exports
supply North America and Asia/Oceania. All the other flows, of more regional
nature, like Venezuela to USA, Indonesia to other Asian countries etc, are only
interesting to the extent they affect the need for Black Sea/Arab Gulf material. As
an example, if China reduces its export, the Arab Gulf is not able to supply Asia
on its own. Black Sea urea will flow to Asia, and an upward price movement will
tend to take place.
The relative pricing between Black Sea and Arab Gulf depends on where they
compete on the marginal volume. If the main drive is from Latin
America/Europe/Africa, Black Sea will lead. If it is Asia/North America, Arab Gulf
will lead.
7/26/2019 172868_Fertilizer Industry Handbook_with Notes
http://slidepdf.com/reader/full/172868fertilizer-industry-handbookwith-notes 22/50
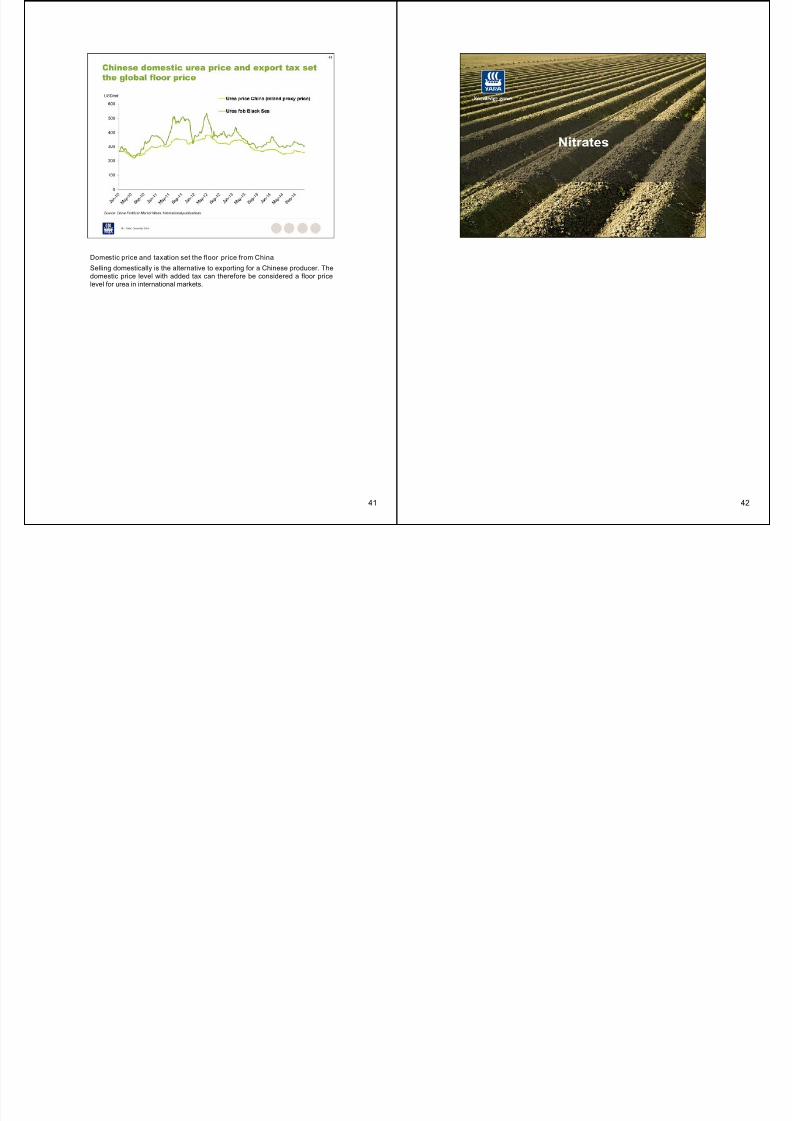
Domestic price and taxation set the floor price from China
Selling domestically is the alternative to exporting for a Chinese producer. The
domestic price level with added tax can therefore be considered a floor price
level for urea in international markets.
41 42

7/26/2019 172868_Fertilizer Industry Handbook_with Notes
http://slidepdf.com/reader/full/172868fertilizer-industry-handbookwith-notes 23/50
43
Am mo ni um ni tr ate (AN, 33.5% ni tr og en) and Calci um amm on iu m ni tr ate
(CAN, 27% nitrogen) are the main nitrate fertilizer products
Nitrates production increased to 20.2 million tons in 2013, up 1.5% from 2012.
During the years 2003-2013, nitrates production grew on average at 2.7% per year. So in 2013 the production growth was below the 10-year trend. All the
growth was for AN, CAN was stable.
Russia is the largest producer and exporter of nitrates, followed by the USA.
Keep in mind that AN solution for UAN production is included in the US figures.
China has had quite strong focus on adding more nitrate based capacity and is
third largest producer. Compared to 2012 there were three countries with a
significant production drop, Hungary, Lithuania and not surprisingly Ukraine.
44
Limited trade of nitrates globally
Nitrates is mainly a European product and contains only 27-34% nitrogen
making it less attractive to transport.
Compared to 2012 more than half of the drop in AN trade can be attributed to a
substantial reduction in exports from Ukraine. Also worth mentioning that Brazil
and Turkey increased their AN imports sharply, by 19% and 35%, respectively.
Apart from that, stable or lower import volumes.

7/26/2019 172868_Fertilizer Industry Handbook_with Notes
http://slidepdf.com/reader/full/172868fertilizer-industry-handbookwith-notes 24/50
Industry value drivers
This section describes how the economic mechanisms of the fertilizer industry
work and what determines fertilizer prices and company profits.
45 46
Fertilizer prices are cyclical
Fertilizer prices are cyclical just like any other commodity. The cyclicality is
primarily caused by the “lumpiness” in supply additions resulting in periods of
overcapacity and undercapacity.

7/26/2019 172868_Fertilizer Industry Handbook_with Notes
http://slidepdf.com/reader/full/172868fertilizer-industry-handbookwith-notes 25/50
47
Drivers of supply and demand
In general, when demand is low, there tends to be a ”supply-driven” fertilizer
market in which the established “price floor” indirectly determines fertilizer
prices. This price floor is set by the producing region with the highest natural gasprices. Historically the highest gas prices were in the US and in Western Europe
but since 2009 the Ukrainian and other Eastern European producers have had
the highest gas costs together with coal based producers in China.
When fertilizer demand is high, there is typically a ”demand-driven” market with
fertilizer prices above floor prices for swing (highest cost) regions.
The fertilizer market balance and capacity utilization are other key factors that
impact prices for urea and other N-fertilizers.
Yara’s gas consumption in its fully-owned plants is approximately 205 million
MMBtu (of which 165 is in Europe). Adding Yara’s share of joint venture
companies (including Burrup), the total consumption of natural gas isapproximately 310 million MMBtu.
Drivers of demand
The main demand driver for fertilizer is food demand which translates into
demand for grains and other farm products.
48

7/26/2019 172868_Fertilizer Industry Handbook_with Notes
http://slidepdf.com/reader/full/172868fertilizer-industry-handbookwith-notes 26/50
49
Nitrogen consumption growth is expected to be higher than global
population growth
Population growth and economic growth are the main drivers for increased
fertilizer consumption. Industrial consumption of nitrogen is mainly driven byeconomic growth and environmental legislation.
50
Global grain consum ption growing steadily
Over the last 5 decades, grain consumption has increased by 2.1% a year on
average while population has grown by 1.6% per year.
Dips in grains consumption have only been seen on four occasions, and these
were related to supply issues rather than demand issues.
Per capita arable land available for cultivation is decreasing, while demand for
food keeps growing
The Food and Agriculture Organization of the United Nations (FAO) confirms
that a key challenge for agriculture is to increase productivity. Key ways of
achieving this are by replacing nutrients removed with the harvest, improving
resource management, breeding new crop varieties and expanding agricultural
knowledge.

7/26/2019 172868_Fertilizer Industry Handbook_with Notes
http://slidepdf.com/reader/full/172868fertilizer-industry-handbookwith-notes 27/50
51
Global per capita consumption of meat is increasing
Pork and poultry are gaining popularity on a global basis, and meat consumption
requires feed. To produce 1 tonne of poultry meat, feed corresponding to 2 tons
of grain is needed. The multipliers are 4 for pork and 7 for beef.
Nitrogen required for meat production is estimated at 20-30% of total nitrogen
fertilizer consumption
Strong development in grain prices reflect the productivity challenge the
world is faced with .
Strong agricultural prices and farmer margins are a pre-requisite for increased
agricultural productivity. Many parts of the world still suffer from sub-optimalgrowing practices, and continued strong incentives are needed to boost global
grain production.
52

7/26/2019 172868_Fertilizer Industry Handbook_with Notes
http://slidepdf.com/reader/full/172868fertilizer-industry-handbookwith-notes 28/50
Higher productivity key challenge
The average per capita cereal production increased gradually from the 60’s up
until the mid 80s, but trended lower the next 15-20 years before rising grain
prices as shown on the previous page provided the necessary incentives to turnthe negative trend.
53 54
Steady growth in grain consumptio n, production is volatile due to weather

7/26/2019 172868_Fertilizer Industry Handbook_with Notes
http://slidepdf.com/reader/full/172868fertilizer-industry-handbookwith-notes 29/50
Crop producing countries
The United States and China are large producers of agricultural products. While
the US is the biggest producer of maize and soybeans, China is the biggest
producer of rice.
55 56
The three large grain crops, wheat, rice and corn (maize), consume about
half of all fertilizer used in agriculture
The fertilizer market is not only a significant market in terms of size, but also an
essential industry serving global food production. Grain production is the mostimportant agricultural activity in the world, with global output at approximately
2.46 billion tons for the 2014 harvest.
It would not be possible to achieve this scale of production without intensive
agriculture and use of mineral fertilizers. Therefore, grains are naturally the
largest end-market for fertilizers followed by cash crops such as vegetables,
fruit, flowers and vines. In order to gain a good understanding of the fertilizer
market, it is necessary to understand both the grain market and the market for
cash crops.

7/26/2019 172868_Fertilizer Industry Handbook_with Notes
http://slidepdf.com/reader/full/172868fertilizer-industry-handbookwith-notes 30/50
57
Geographical variances in nitrogen application
There are large regional differences when it comes to what crops nitrogen is
being applied to.
Due to strong growth in bioethanol production in the US the last 6-7 years, cornhas become by far the biggest nitrogen-consuming crop in the US. Wheat and
other cereals like barley are dominating in Europe and Russia. In Asia, rice is a
big nitrogen-consuming crop in addition to the fruits & vegetables segment in
China.
These regional differences impact regional demand patterns as soft commodity
prices develop differently and hence impact farmer economics and farmers’
incentives to apply fertilizer differently depending on what crops are dominating.
For Yara, with its strong European presence, wheat is the most important grain.
58
Regional differences in fertilizer intensity
There are considerable differences in agricultural intensity (measured here in
annual nitrogen applied per hectare) between the main agricultural regions of
the world, with higher intensity in the northern hemisphere than the southernhemisphere. For example, the same crops may have application rates 2-3 times
higher in the US than in Brazil.
This illustrates the significant remaining potential for improved agricultural
productivity especially in India and Brazil. The existing differences in annual
application rates are especially significant when taking into account that these
regions have a much higher rate of double-cropping (2 harvests per year) than in
the northern hemisphere.

7/26/2019 172868_Fertilizer Industry Handbook_with Notes
http://slidepdf.com/reader/full/172868fertilizer-industry-handbookwith-notes 31/50
Yield differences
There are large regional yield variations. These variations reflect among other
things differences in agricultural practices including fertilization intensity as
shown on the previous page.Weather and differences in soil quality imply that not all regions can achieve the
same yields. However, the large differences observed today clearly indicate that
by using the right techniques, including a correct fertilization, yields and grain
production can be increased significantly.
59 60
Fertilizer cost is less than 1/4 compared to tot al grain product ion cost
Fertilizer costs relative to total production costs of corn has been stable over the
last three years and represent around 22% in 2014F. For other major crops, the
relative share is smaller varying from 8% for soybeans up to 15% for wheat.

7/26/2019 172868_Fertilizer Industry Handbook_with Notes
http://slidepdf.com/reader/full/172868fertilizer-industry-handbookwith-notes 32/50
Biofuel growth projected to continue
World biofuel output is projected to grow by 30% from 2014 to 2030, with the US
and Brazil as the two dominant producers. The significant plans for biodiesel
production in China, India, Indonesia and Malaysia are subject to someuncertainty with regard to scope and timing.
61 62
Biofuel crops boost fertilizer consumption
World N-fertilizer consumption due to biofuels production was estimated to be
3.5 million tons N in the 2009/10 growing season. This corresponds roughly to
3% of global nitrogen consumption.With around 1/3 of US corn production supplying ethanol production, the US is
by far the main contributor, accounting for close to 60% of all nitrogen being
consumed for biofuels production.

7/26/2019 172868_Fertilizer Industry Handbook_with Notes
http://slidepdf.com/reader/full/172868fertilizer-industry-handbookwith-notes 33/50
Current GM traits have minor effect on ferti lizer consumpti on
The global area planted to genetically modified crops amounted to 175.2 million
hectares in 2013.
The main traits today are resistance against herbicide and insects, which havelittle impact on fertilizer consumption. Traits aiming at improving yields and yield
stability will imply higher nutrient consumption and greater incentives for
investing in inputs like fertilizer. An example of such a trait is drought tolerance
(or other traits that increases the crops ability to adopt to unfavorable
conditions).
Improved nitrogen efficiency is a trait that potentially can have a negative impact
on nutrient consumption. However, no major breakthroughs have been made on
this recently and research on this trait is still at the “proof of concept” stage.
63
Fertilizer is a seasonal busi ness
The seasonality is to a large extent linked to weather. Hence, there are large
regional differences in when crops are planted and harvested and therefore
when fertilizer is being applied.Fertilizer is typically applied when seeds are planted, implying that the main
application on the northern Hemisphere is during the first half of the calendar
year while on the southern Hemisphere it is during the second half of the
calendar year. Winter wheat is an exception, while planting typically is done in
the second half of the year, fertilizer application is done in the spring.
In certain countries, certain crops are harvested twice a year, this applies
especially to countries on the southern hemisphere like India and Brazil.
64

7/26/2019 172868_Fertilizer Industry Handbook_with Notes
http://slidepdf.com/reader/full/172868fertilizer-industry-handbookwith-notes 34/50
Drivers of supply
The main driver of supply is the cost of natural gas which is the main raw material
in the production of nitrogen fertilizer.
65 66
Natural gas is the major nitrogen cost driver
Using a gas price of 6-8 USD per MMBtu, natural gas constitutes about 90% of
ammonia cash production costs which is why almost all new nitrogen capacity
(excluding China) is being built in low cost gas areas such as the Middle Eastand Northern Africa.
Ammonia is an intermediate product for all nitrogen fertilizer, while nitric acid is a
second intermediate product for the production of, e.g. nitrates. Finished fertilizer
products are urea, nitrates (CAN, AN), NPK and others. Industrial products
range from high purity carbon dioxide and basic nitrogen chemicals to industrial
applications of upgraded fertilizer products.

7/26/2019 172868_Fertilizer Industry Handbook_with Notes
http://slidepdf.com/reader/full/172868fertilizer-industry-handbookwith-notes 35/50
67
Industrial production of fertilizers involves several chemical processes
The basis for producing nitrogen fertilizers is ammonia, which is produced in
industrial scale by combining nitrogen in the air with hydrogen in natural gas,
under high temperature and pressure and in the presence of catalysts. Thisprocess for producing ammonia is called the ‘Haber-Bosch’ process.
Phosphorus is produced from phosphate rock by digesting the latter with a
strong acid. It is then combined with ammonia to form Di-ammonium phosphate
(DAP) or Mono-ammonium phosphate (MAP) through a process called
ammonization.
Potassium is mined from salt deposits. Large potash deposits are found in
Canada and Russia, which are the world’s major producers of this nutrient.
Phosphate and potash are sold separately or combined with, e.g. nitrogen, to
form NPK fertilizers.
The side streams of the main production process (e.g. gases, nitrogenchemicals) can be utilized for industrial products
68
Four different ways to produce NPK fertilizers
Chemically produced NPK fertilizers are made by one of two important
production routes:
1) The nitrophosphate process or
2) the sulphuric acid (mixed-acid) process.
Phosphorus is produced from phosphate rock by digesting the latter with a
strong acid (nitric acid or sulphuric acid). Potassium and other salts are added.
The solution containing nitrogen in ammoniacal (NH4) and nitrate (NH3) form,
phosphorus and potassium is either granulated or prilled. The result is a
compound NPK where all the nutrients are included in one fertilizer particle. In
addition the fertilizers may contain secondary nutrients (sulphur and
magnesium) and/or micronutrients such as boron, zink and iron.
3) In a dry blended NPK, nitrogen, phosphorus and potassium raw materials in
solid form are blended together in a bulk mixer.
4) The production of compound fertilizers by steam granulation, all the raw
materials are in their solid (powder) form and mixed and granulated in the
presence of water, steam and heat.

7/26/2019 172868_Fertilizer Industry Handbook_with Notes
http://slidepdf.com/reader/full/172868fertilizer-industry-handbookwith-notes 36/50
69
Reduced energy consumption in nitrogen manufacturing
The Haber-Bosch synthesis has not been challenged for almost 80 years, but
technology development in the 20th century has reduced energy consumption
down towards the practical and theoretical minimum.The energy base has changed, and technological advances have improved
energy efficiency significantly. The graph illustrates that the industry is now more
sensitive to energy price than developments in technology.
Most nitrogen fertilizer plants utilize natural gas. However, any type of
hydrocarbon or coal can be used. In China most plants use coal. Energy
consumption can vary significantly. For an efficient plant using natural gas it
takes approximately 33 MMBtu of natural gas to produce one ton of ammonia
(35 GJ). This translates into 40 MMBtu per ton nitrogen (42 GJ/tN). Converting
ammonia to urea requires another 3 to 4 MMBtu per ton urea. This translates
into about 48 MMBtu per ton nitrogen (51 GJ/tN)). As a rule of thumb, ammonia
plants using coal require between 50 per cent and 100 per cent more energy per unit of nitrogen produced.
70
West European ammonia producers are highly energy efficient
Ammonia producers in Western Europe have invested heavily in energy-efficient
technology due to the historically high cost of energy in the region. According to
EFMA, several ammonia plants in West Europe run on the lowest feasibleenergy consumption levels and emit the lowest possible amount of CO2 per
tonne of ammonia produced.
The Western European ammonia industry is on average more energy efficient
than ammonia producers in other parts of the world. This is also driven by EU
environmental regulations for pollution control, which requires running plants at
higher standards than elsewhere.

7/26/2019 172868_Fertilizer Industry Handbook_with Notes
http://slidepdf.com/reader/full/172868fertilizer-industry-handbookwith-notes 37/50
71
Urea consumption growth higher than capacity growth History shows that many ammonia projects are cancelled or delayed
Of the 35 ammonia projects in pipeline in 2002 to be completed within 2008, only
11 were realized.
72

7/26/2019 172868_Fertilizer Industry Handbook_with Notes
http://slidepdf.com/reader/full/172868fertilizer-industry-handbookwith-notes 38/50
73
Long lead-time on projects
Over the last years it has typically taken at least 5-6 years from a project for a
new ammonia and urea plant is initiated until the new plant is operational, even
without unexpected delays.
Price relations
Based on the demand and supply drivers this section explores how prices in the
end are determined.
74

7/26/2019 172868_Fertilizer Industry Handbook_with Notes
http://slidepdf.com/reader/full/172868fertilizer-industry-handbookwith-notes 39/50
75
Upgrading margin for converting ammonia into urea
While energy costs for the ammonia swing producers set a price floor for
ammonia, the ammonia price sets a floor for the urea price. If the urea price
drops below this floor, more ammonia will be offered for sale, less urea will besold, and the relationship will be restored.
In a tight supply/demand scenario for nitrogen where there is a demand driven
urea margin, the correlation is lower. Such a scenario is often seen during
periods with strong prices for agricultural soft commodities.
76
Correlation between long-term grain and fertilizer prices
Variations in grain prices (corn or wheat) explain approximately 50% of the
variations in the urea price, making grain prices one of the most important
factors driving fertilizer prices. Some of the correlation may of course bespurious, like GDP growth, Chinese imports, strength of the USD etc.

7/26/2019 172868_Fertilizer Industry Handbook_with Notes
http://slidepdf.com/reader/full/172868fertilizer-industry-handbookwith-notes 40/50
77
Average demand-driven marg in o f USD 67/t
The location of swing urea production has varied over the past decade, from the
US Gulf, via Ukraine and now China. However, urea prices have only been
supply-driven for shorter periods at a time, with the average demand-drivenmargin for the period 2004 – 2013 approximately USD 66 per ton. From 2014 the
market has turned supply driven with China continuing being the swing producer.
Urea prices determin e the price range for nit rates
There is a strong correlation between urea and nitrate prices, as they to some
extent are substitutes. For agronomic reasons linked to the effectiveness of the
nitrogen form, farmers are willing to pay a higher price per unit nitrogen fromnitrates than from urea. The correlation is stronger in the medium to long term
than within a season. However, crop prices are also an important factor that
impacts the nitrate price and the nitrate premium. The higher the crop value is,
the more willing the farmer is to pay a premium for a product that gives a higher
yield and quality.
78

7/26/2019 172868_Fertilizer Industry Handbook_with Notes
http://slidepdf.com/reader/full/172868fertilizer-industry-handbookwith-notes 41/50
79 80
7/26/2019 172868_Fertilizer Industry Handbook_with Notes
http://slidepdf.com/reader/full/172868fertilizer-industry-handbookwith-notes 42/50
81
Production economics
This section describes the cash costs associated with production of standard
nitrogen products which is useful to know in supply-driven situations with pricing
determined by the marginal (swing) producers.
82

7/26/2019 172868_Fertilizer Industry Handbook_with Notes
http://slidepdf.com/reader/full/172868fertilizer-industry-handbookwith-notes 43/50
83
Production economics
90% of Yara’s operational cash costs are raw materials, energy and freight. A
major part of these purchases can be terminated on short notice reducing the
financial consequences of delivery slow-downs.Yara’s plants can be stopped at short notice and at low cost as response to
decline in deliveries or to take advantage of cheaper imported ammonia.
84
Natural gas costs the most important cost component
With a natural gas price of USD 8/MMBtu gas cost represents around 90% of the
ammonia production cash costs. In this example, one dollar increase in gas cost givesUSD 36 higher gas costs.
Most of the “other production costs” are fixed costs and therefore subject to scale
advantages.
A new, highly efficient plant may use natural gas in the low thirties range to produce one
tonne of ammonia; the corresponding figure for old, poorly maintained plants will be in
the mid-forties.
mt = metric tonne
All cost estimates are fob plant cash costs excluding load-out, depreciation, corporateoverhead and debt service for a US proxy plant located in Louisiana (ca. 1,300 metric
tons per day capacity). In this example load-out barge is excluded.

7/26/2019 172868_Fertilizer Industry Handbook_with Notes
http://slidepdf.com/reader/full/172868fertilizer-industry-handbookwith-notes 44/50
85
Ammonia is the main in pu t for u rea p roduct ion
Typically, it takes 0.58 tonne ammonia for each tonne urea. If we add the gas
cost in ammonia (USD 182) and the additional process gas costs needed for the
production of urea (5.2 MMBtu x USD 8/MMBtu = USD 41), natural gas
represents around 90% of the total production cash cost.
All cost estimates are fob plant cash costs excluding depreciation, corporate
overhead and debt service for a US proxy plant located in Louisiana (~1,300 mt
per day capacity).
86
Consumption factors to compare price movements
As shown in the costing example for urea, the real ammonia consumption factor
is above the theoretical consumption factor, which is based on N content. The
difference varies between plants according to their energy efficiency. Using thetheoretical consumption factors is easier when making calculations. If the N
content for a product is known (46% N in urea), the ammonia consumption factor
can easily be calculated by dividing the figure with the N content in ammonia
(0.46/0.82 = 0.56).
Based on this illustration, it is possible to follow relative variation in the various
nitrogen prices. As an example, if ammonia becomes USD10/mt more
expensive, the production cost of urea increases by 10 * 0.56 (0.46/0.82) =
5.6USD/mt. Similarly, if the urea price increases by USD10/mt, a price increase
of 10 * (0.27/0.46) = USD5.9/mt of CAN would keep the relative pricing at the
same level.

7/26/2019 172868_Fertilizer Industry Handbook_with Notes
http://slidepdf.com/reader/full/172868fertilizer-industry-handbookwith-notes 45/50
87
Phosphate processing routes
The 3 main phosphate finished fertilizer products are diammonium phosphate
(DAP), monammonium phosphate (MAP) and triple superphosphate (TSP), all of
which are based on phosphate rock processed via intermediate production of
phosphoric acid.
Nitrogen applications extend beyond fertilizer
The Industrial segment markets numerous industrial products, mainly originating
from Yara’s Upstream and Downstream fertilizer operations, with certain products
being intermediates in the production of fertilizers.
88

7/26/2019 172868_Fertilizer Industry Handbook_with Notes
http://slidepdf.com/reader/full/172868fertilizer-industry-handbookwith-notes 46/50
89
Main industrial prod ucts and applications
The ammonia nitrogen route provides opportunities in industrial processes
where ammonia, urea or nitric acid can be used as traded raw materials.
Examples are urea for the glue industry and ammonia for acrylonitrile producers(textile fibres). Other downstream applications are abatement of NOx gases from
power plants, industry and vehicles.
Another branch of the Industrial tree is nitric acid, where derived products are
technical grade ammonium nitrates for explosives, and calcium nitrate for a
range of applications including odour control, waste water treatment, treatment
of drilling fluids, and catalyst applications for the production of rubber gloves.
Yara Industrial’s gas business includes argon extracted from our ammonia
plants, as well as oxygen, and nitrogen. A derived product from Yara’s nitrate
plants is nitrous oxide (N2O or laughing gas) for the medical sector. Yara’s
ammonia plants produce the best food and beverage grade CO2 as a co-
product. This has led to a unique position as the leading European supplier of liquid CO2. Yara Industrial’s dry ice factories in France, England, Germany,
Ireland and Denmark have been developed to utilize our strong position towards
the food and transportation industry.
90
Multiple products and applications
Chemicals is the largest segment where GDP growth in industrialized markets
represents the key growth driver.
Environmental applications is the fastest growing segment, growth is driven bylegislation and by the need to treat NOx emissions from heavy-duty trucks and in
the power sector.
Technical ammonium nitrate (TAN) is the most global of all Industrial business
units, where Yara already is the world’s largest independent supplier of technical
nitrates to the civil explosives industry. Asia and Australia are expected to drive
growth in this business, with Europe and the US being more mature markets.
As industrial demand has a lower share of total ur ea demand than for nitrogen in
total, the effect for the urea market is less. Industrial use of urea covers roughly
30% of total industrial nitrogen demand.

7/26/2019 172868_Fertilizer Industry Handbook_with Notes
http://slidepdf.com/reader/full/172868fertilizer-industry-handbookwith-notes 47/50
The pace of growth in nitrogen chemicals for Industrial applications
is higher than global N-fertilizer growth
91
Effective abatement of nitrogen oxides
NOx emissions produce smog which is highly toxic to humans. Most national
governments have given commitments, and are implementing legislation to
reduce NOx
emissions and improve the air quality
Yara was at the forefront of product development when we created a new
product for an application linked to NOx abatement. This product is now called
AdBlue, which is utilized with SCR technology for NOx abatement in heavy-duty
trucks, passenger cars and non-road vehicles such as tractors, construction and
mining vehicles and trains. Yara is the world’s largest producer of AdBlue, and its
Air1 brand is the only global brand.
Similar technology, based on ammonia and/or urea, is used to reduce emissions
of industrial installations such as power plants, cement factories, waste
incinerators etc.
Europe is expected to progressively apply more stringent NOx emission limits.
Also in the marine segment legislations on NOx and SOx are being implemented.
92

7/26/2019 172868_Fertilizer Industry Handbook_with Notes
http://slidepdf.com/reader/full/172868fertilizer-industry-handbookwith-notes 48/50
H2S abatement for waste water
The presence of hydrogen sulphide (H2S) in waste water and sludge is defined
as a septic condition. By preventing septic conditions from arising, negative
effects like odors, health hazards, corrosion and reduced efficiency of the
treatment plant, can be eliminated or reduced.
Yaras calcium nitrate based septicity control process is a natural biological
method of preventing septicity and removing H2S by controlled dosage of nitrate.
It can be used both for municipal sewer systems and industrial wastewater and
sludge, and is non-toxic, non-corrosive, pH-neutral and safe-to-handle.
Nitrate-based products are also used to reduce H2S toxic emissions in oil fields
and pipelines.
93 94
Technical AN: the main raw material for civil explosives
Technical ammonium nitrate is the main raw material for ANFO (Ammonium
Nitrate Fuel Oil) which is the most used and most economical civil explosive
currently on the market. The main civil explosive market segments are mining
and infrastructure development.
ANFO was developed 40 years ago and has grown to be the most widely used
industrial blasting agent in the world, due to its excellent manufacturing,
handling and storage properties, low cost per energy unit, high safety levels and
outstanding performance.
Calcium nitrate is used as a secondary nitrate in emulsion explosives. It extends
the shelf life of the emulsion, increases the solubility of the ammonium nitrate
and increases the total energy content of the emulsion.

7/26/2019 172868_Fertilizer Industry Handbook_with Notes
http://slidepdf.com/reader/full/172868fertilizer-industry-handbookwith-notes 49/50
95
CO2 at every stage of food production and p rocessing
The main applications of CO2 are for use in the production of soft drinks and in
the brewing sector, as well as for process cooling and freezing in the food
sector. Carbon dioxide (CO2
) is used in the production, storage and transport of
foods; from the planting of salads and tomatoes as seeds in the greenhouse, or
from when salmon are introduced as fry in fish farms until they arrive on the
dining table.
In greenhouses without a supply of CO2, the level of this gas can drop to under
half of what is normally found in air. When the correct amount of CO 2 added at
the right time (during periods of light) some plant cultures can increase their
yield by 30-50%.
CO2 or nitrogen is used as a cooling agent for the freezing of foods, as
atmospheres in the packing of foodstuffs to prolong the shelf-life of the products,
and to maintain a controlled temperature during storage and transport. CO2 gas
enables low temperatures to be attained in a short time, preventing damage andminimizing thawing damage.
An im al Feed in du st ry wit h sev eral nu tr it io nal pr od uc ts bas ed on co re
chemicals
96

7/26/2019 172868_Fertilizer Industry Handbook_with Notes
http://slidepdf.com/reader/full/172868fertilizer-industry-handbookwith-notes 50/50
97


