
SUPPLEMENTAL INFORMATION
FEBRUARY 15, 2017
1Q17 CFO Commentary
1
FORWARD-LOOKING STATEMENTS
This presentation may be deemed to contain forward-looking statements, which address a variety of subjects, including, for
example, financial goals and expectations, including earnings per share goals, shareholder returns, market trends, growth
opportunities and business strategy, and expected customer demand for our products. Statements that are not historical
facts, including statements about our beliefs and expectations, are forward-looking statements. Such statements are based
on our current expectations, beliefs, assumptions, estimates, forecasts, and projections, and are subject to a number of
uncertainties and factors, which could cause actual results to differ materially from those described in the forward-looking
statements, and such statements should not be relied upon as representing Analog Devices’ expectations or beliefs as of
any date subsequent to the date of this presentation. Important factors that may affect actual outcomes and results include:
any faltering in global economic conditions or the stability of credit financial markets; erosion of consumer confidence and
declines in consumer spending; unavailability of raw materials, services or supplies or manufacturing capacity; changes in
geographic, product or consumer mix; our ability to successfully integrate acquired businesses and technologies; adverse
results in litigation matters; and other risk factors described in our most recent filings with the Securities and Exchange
Commission, including the risk factors contained in ADI’s most recent Quarterly Report on Form 10-Q. Except as required by
law, we do not undertake any obligation to update forward looking statements made by us to reflect subsequent events or
circumstances.
GAAP RECONCILIATION
This presentation includes non-GAAP financial measures that have been adjusted in order to provide investors with useful
information regarding our results of operations and business trends. Reconciliations of these non-GAAP measures to their
most directly comparable GAAP measures can be found on slides 13 and 14.
Summary
2
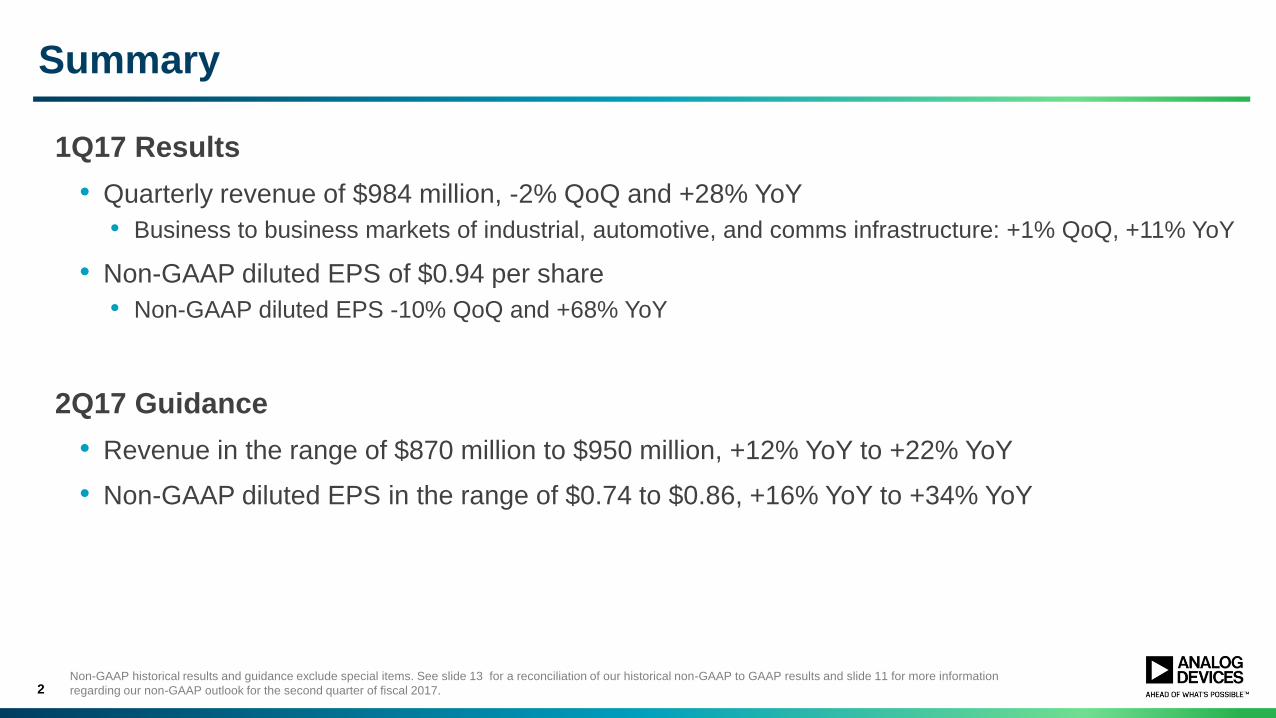
1Q17 Results
• Quarterly revenue of $984 million, -2% QoQ and +28% YoY
• Business to business markets of industrial, automotive, and comms infrastructure: +1% QoQ, +11% YoY
• Non-GAAP diluted EPS of $0.94 per share
• Non-GAAP diluted EPS -10% QoQ and +68% YoY
2Q17 Guidance
• Revenue in the range of $870 million to $950 million, +12% YoY to +22% YoY
• Non-GAAP diluted EPS in the range of $0.74 to $0.86, +16% YoY to +34% YoY
Non-GAAP historical results and guidance exclude special items. See slide 13 for a reconciliation of our historical non-GAAP to GAAP results and slide 11 for more information
regarding our non-GAAP outlook for the second quarter of fiscal 2017.
1Q17 Financial Snapshot
3
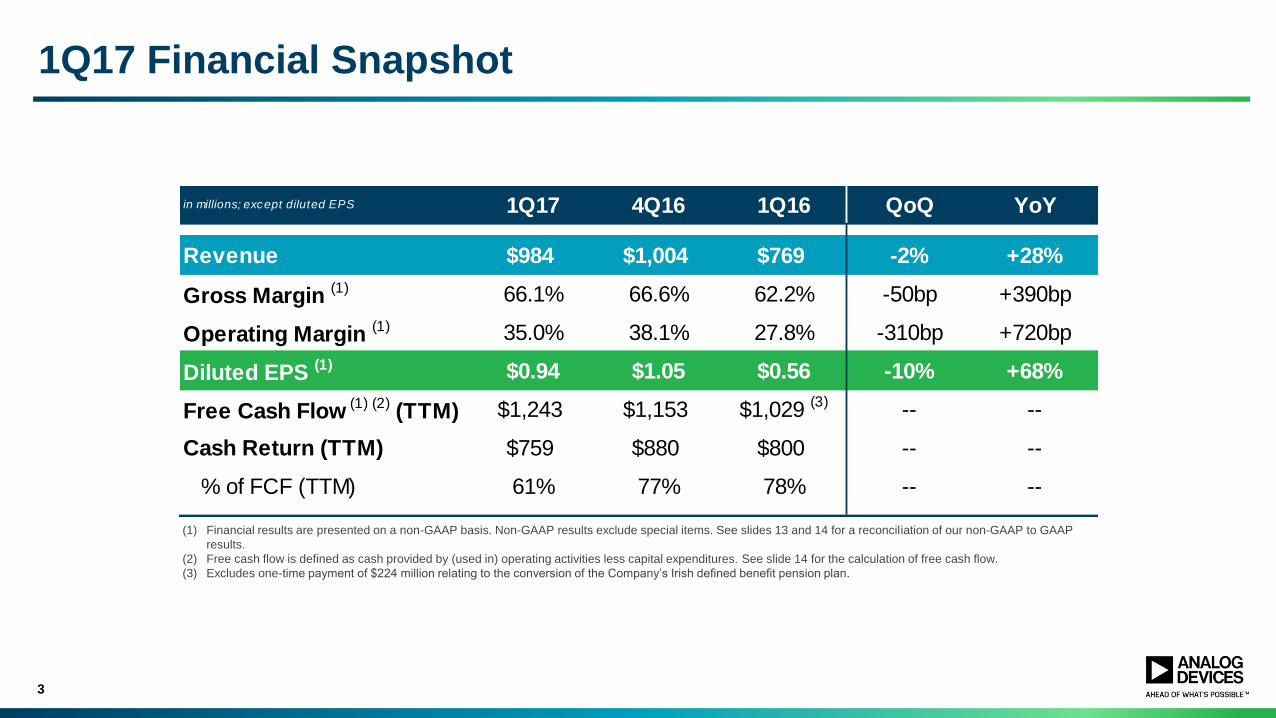
(1) Financial results are presented on a non-GAAP basis. Non-GAAP results exclude special items. See slides 13 and 14 for a reconciliation of our non-GAAP to GAAP
results.
(2) Free cash flow is defined as cash provided by (used in) operating activities less capital expenditures. See slide 14 for the calculation of free cash flow.
(3) Excludes one-time payment of $224 million relating to the conversion of the Company’s Irish defined benefit pension plan.
in millions; except diluted EPS 1Q17 4Q16 1Q16 QoQ YoY
Revenue $984 $1,004 $769 -2% +28%
Gross Margin (1) 66.1% 66.6% 62.2% -50bp +390bp
Operating Margin (1) 35.0% 38.1% 27.8% -310bp +720bp
Diluted EPS (1) $0.94 $1.05 $0.56 -10% +68%
Free Cash Flow (1) (2) (TTM) $1,243 $1,153 $1,029 (3) -- --
Cash Return (TTM) $759 $880 $800 -- --
% of FCF (TTM) 61% 77% 78% -- --
4
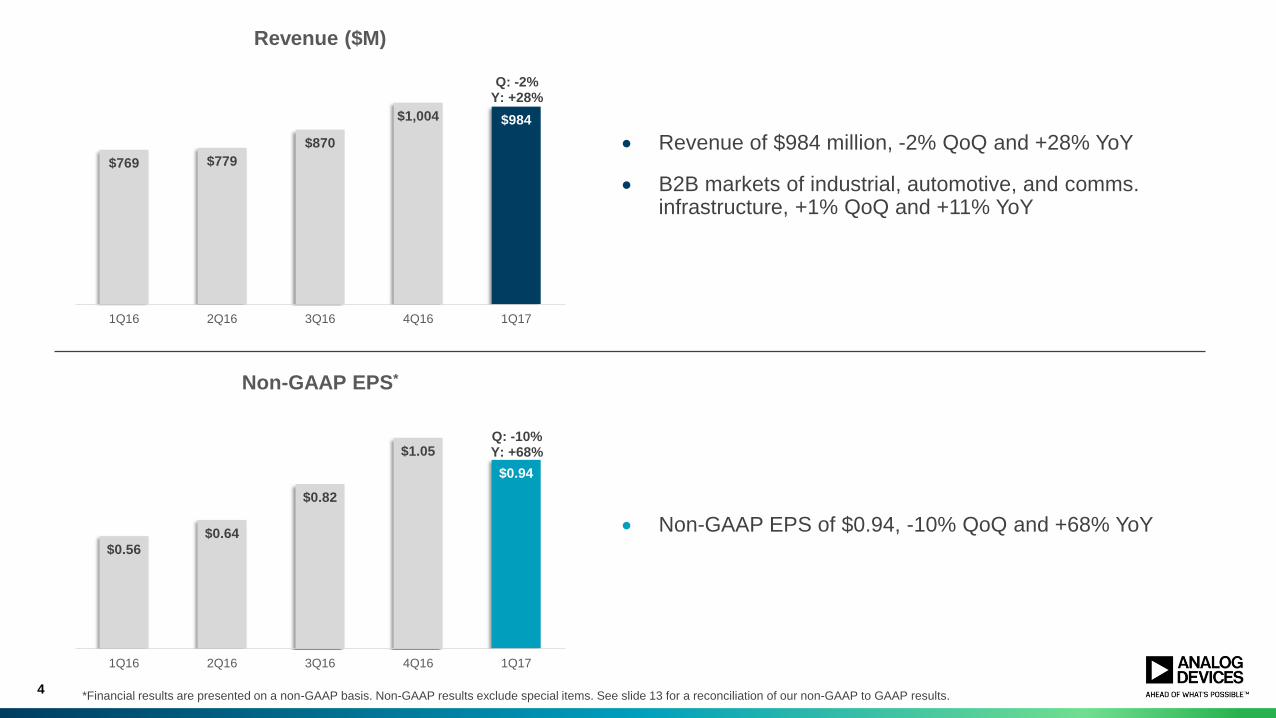
Revenue of $984 million, -2% QoQ and +28% YoY
B2B markets of industrial, automotive, and comms. infrastructure, +1% QoQ and +11% YoY
Non-GAAP EPS of $0.94, -10% QoQ and +68% YoY
*Financial results are presented on a non-GAAP basis. Non-GAAP results exclude special items. See slide 13 for a reconciliation of our non-GAAP to GAAP results.
$769 $779
$870
$1,004 $984
1Q16 2Q16 3Q16 4Q16 1Q17
Revenue ($M)
Q: -2%Y: +28%
$0.56
$0.64
$0.82
$1.05
$0.94
1Q16 2Q16 3Q16 4Q16 1Q17
Non-GAAP EPS*
Q: -10%Y: +68%
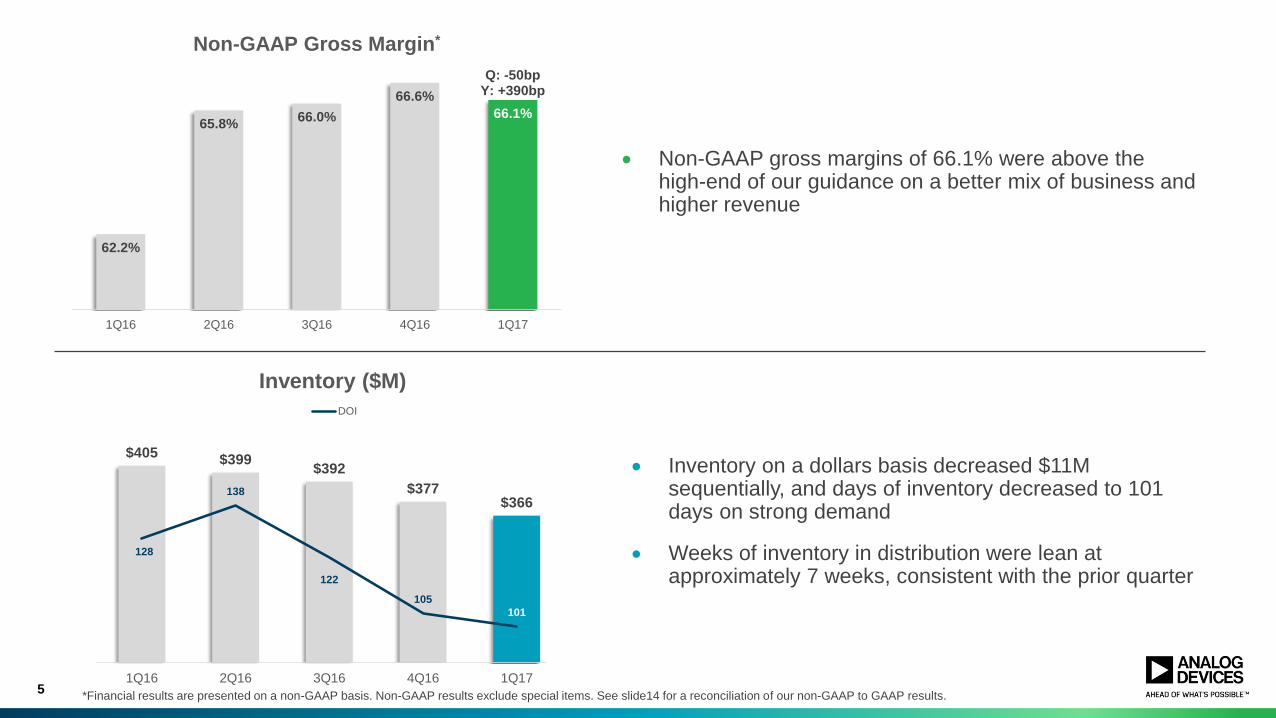
$405$399
$392
$377$366
128
138
122
105
101
90
100
110
120
130
140
150
160
$250
$270
$290
$310
$330
$350
$370
$390
$410
$430
1Q16 2Q16 3Q16 4Q16 1Q17
Inventory ($M)
DOI
5
Non-GAAP gross margins of 66.1% were above the high-end of our guidance on a better mix of business and higher revenue
Inventory on a dollars basis decreased $11M sequentially, and days of inventory decreased to 101 days on strong demand
Weeks of inventory in distribution were lean at approximately 7 weeks, consistent with the prior quarter
*Financial results are presented on a non-GAAP basis. Non-GAAP results exclude special items. See slide14 for a reconciliation of our non-GAAP to GAAP results.
62.2%
65.8%66.0%
66.6%
66.1%
1Q16 2Q16 3Q16 4Q16 1Q17
Non-GAAP Gross Margin*
Q: -50bpY: +390bp
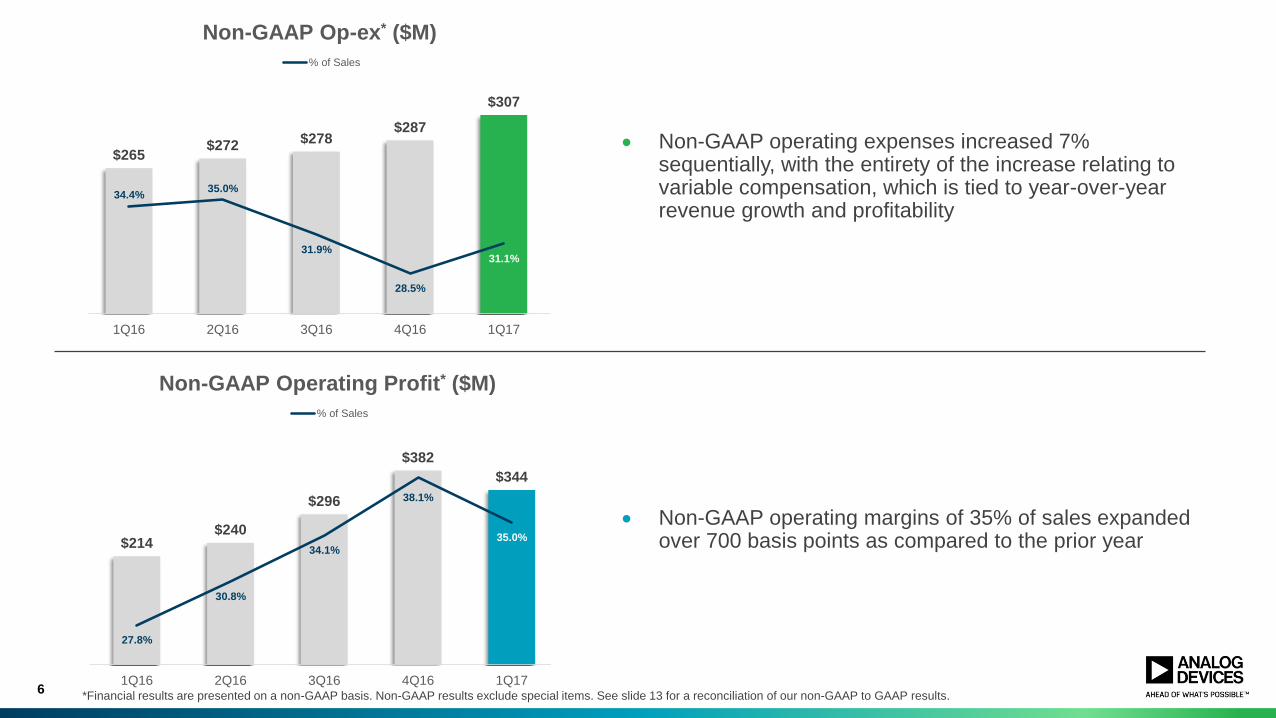
$214$240
$296
$382
$344
27.8%
30.8%
34.1%
38.1%
35.0%
25.0%
27.0%
29.0%
31.0%
33.0%
35.0%
37.0%
39.0%
41.0%
$0
$50
$100
$150
$200
$250
$300
$350
$400
$450
1Q16 2Q16 3Q16 4Q16 1Q17
Non-GAAP Operating Profit* ($M)
% of Sales
$265$272
$278$287
$307
34.4%35.0%
31.9%
28.5%
31.1%
25.0%
27.0%
29.0%
31.0%
33.0%
35.0%
37.0%
39.0%
41.0%
43.0%
45.0%
$150
$170
$190
$210
$230
$250
$270
$290
$310
$330
1Q16 2Q16 3Q16 4Q16 1Q17
Non-GAAP Op-ex* ($M)
% of Sales
6
Non-GAAP operating expenses increased 7% sequentially, with the entirety of the increase relating to variable compensation, which is tied to year-over-year revenue growth and profitability
Non-GAAP operating margins of 35% of sales expanded over 700 basis points as compared to the prior year
*Financial results are presented on a non-GAAP basis. Non-GAAP results exclude special items. See slide 13 for a reconciliation of our non-GAAP to GAAP results.

$1,028 $1,028
$1,083
$1,153
$1,243
29.9%30.3%
31.9%
33.7%34.2%
27.0%
29.0%
31.0%
33.0%
35.0%
37.0%
39.0%
$825
$875
$925
$975
$1,025
$1,075
$1,125
$1,175
$1,225
$1,275
1Q16 2Q16 3Q16 4Q16 1Q17
Free Cash Flow* (TTM, $M)
Margin
7
Cash and short-term investments balance was $6.3 billion, with $2.7 billion available domestically
Approximately $3.8 billion in debt outstanding, resulting in a net cash position of $2.5 billion
Generated $286 million of free cash flow in the first quarter, an increase of 46% over the prior year
Over the past twelve months, free cash flow generated was $1.2 billion, or 34% of sales
*Financial results are presented on a non-GAAP basis. Non-GAAP results exclude special items. See slide 14 for a reconciliation of our non-GAAP to GAAP results. 1Q16
through 3Q16 TTM free cash flow results excludes one-time payment of $224 million relating to the conversion of the Company’s Irish defined benefit pension plan.
$3.8 $3.8 $3.8 $4.1
$6.3
$1.7 $1.7 $1.7 $1.7
$3.8
1Q16 2Q16 3Q16 4Q16 1Q17
Cash and Debt ($B)
Cas
h
Deb
t
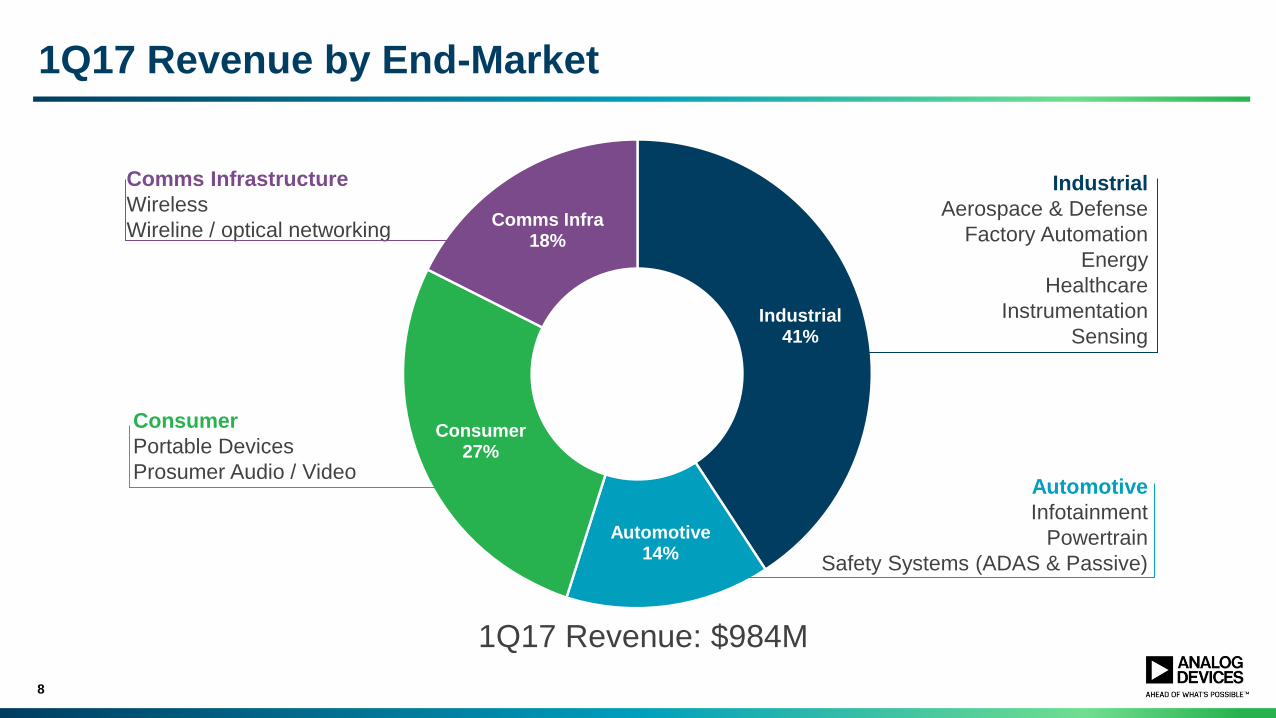
Industrial41%
Automotive14%
Consumer27%
Comms Infra18%
1Q17 Revenue by End-Market
8
Industrial
Aerospace & Defense
Factory Automation
Energy
Healthcare
Instrumentation
Sensing
Consumer
Portable Devices
Prosumer Audio / Video
Comms Infrastructure
Wireless
Wireline / optical networking
Automotive
Infotainment
Powertrain
Safety Systems (ADAS & Passive)
1Q17 Revenue: $984M

9
Industrial sales +1% QoQ and +15% YoY
Very strong results in the seasonally slower first quarter – broad based strength across all industrial sectors year-over-year.
On a sequential basis, Industrial Instrumentation applications outperformed, with particular strength in ATE, and Factory Automation saw continued improvement
Automotive sales -2% QoQ and +10% YoY
Broad-based strength year-over-year across content-rich Infotainment, Powertrain, and ADAS applications
Sequential results better-than-seasonal
$348
$385
$374
$396$401
1Q16 2Q16 3Q16 4Q16 1Q17
Industrial ($M)
Q: +1%Y: +15%
$127
$138$135
$142$139
1Q16 2Q16 3Q16 4Q16 1Q17
Automotive ($M)
Q: -2%Y: +10%

10
Comms infrastructure sales +1% QoQ and +4% YoY
Optical networking drove the year-on-year revenue increase, and both wireless and wireline infrastructure were stable sequentially, a good result in what is typically a seasonally weaker quarter
Consumer sales -8% QoQ and +113% YoY
Portable consumer applications strength continued in the seasonally slower Consumer-revenue first quarter
$127
$81
$186
$294
$270
1Q16 2Q16 3Q16 4Q16 1Q17
Consumer ($M)
Q: -8%Y: +113%
$168
$175$174
$172
$174
1Q16 2Q16 3Q16 4Q16 1Q17
Communications Infrastructure ($M)
Q: +1%Y: +4%
2Q17 Guidance
11
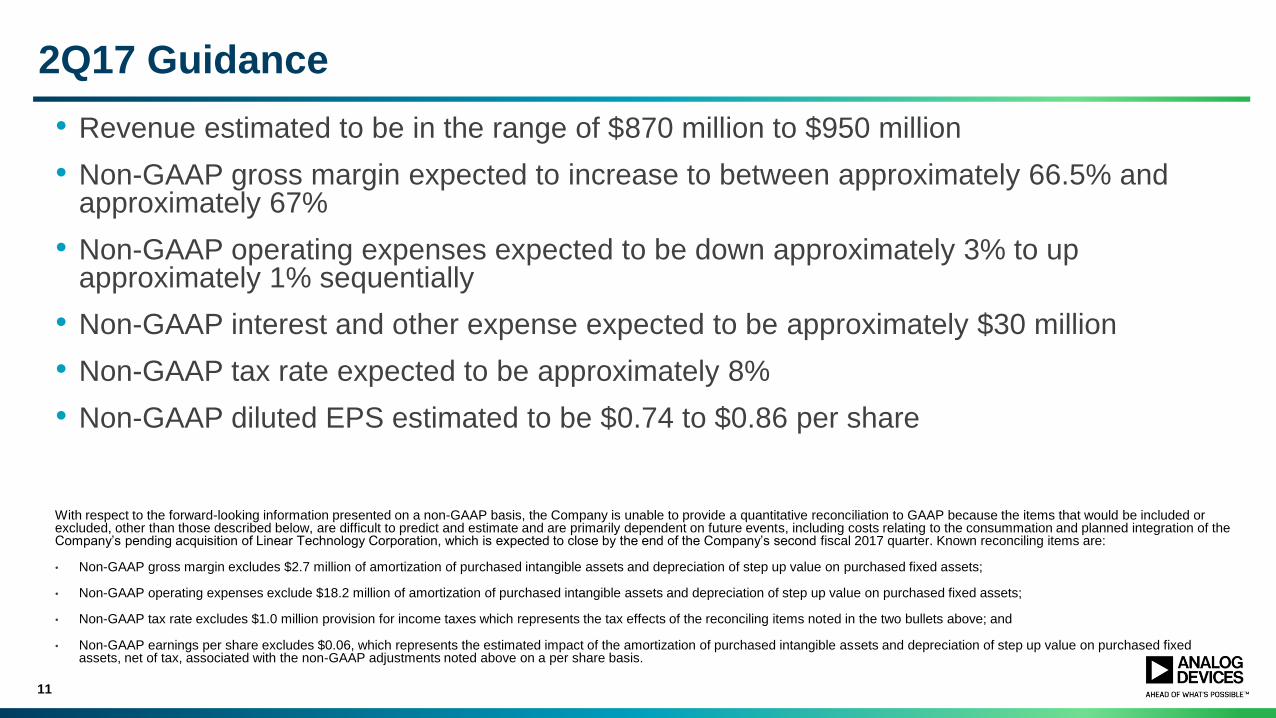
• Revenue estimated to be in the range of $870 million to $950 million
• Non-GAAP gross margin expected to increase to between approximately 66.5% and approximately 67%
• Non-GAAP operating expenses expected to be down approximately 3% to up approximately 1% sequentially
• Non-GAAP interest and other expense expected to be approximately $30 million
• Non-GAAP tax rate expected to be approximately 8%
• Non-GAAP diluted EPS estimated to be $0.74 to $0.86 per share
With respect to the forward-looking information presented on a non-GAAP basis, the Company is unable to provide a quantitative reconciliation to GAAP because the items that would be included or excluded, other than those described below, are difficult to predict and estimate and are primarily dependent on future events, including costs relating to the consummation and planned integration of the Company’s pending acquisition of Linear Technology Corporation, which is expected to close by the end of the Company’s second fiscal 2017 quarter. Known reconciling items are:
• Non-GAAP gross margin excludes $2.7 million of amortization of purchased intangible assets and depreciation of step up value on purchased fixed assets;
• Non-GAAP operating expenses exclude $18.2 million of amortization of purchased intangible assets and depreciation of step up value on purchased fixed assets;
• Non-GAAP tax rate excludes $1.0 million provision for income taxes which represents the tax effects of the reconciling items noted in the two bullets above; and
• Non-GAAP earnings per share excludes $0.06, which represents the estimated impact of the amortization of purchased intangible assets and depreciation of step up value on purchased fixed assets, net of tax, associated with the non-GAAP adjustments noted above on a per share basis.
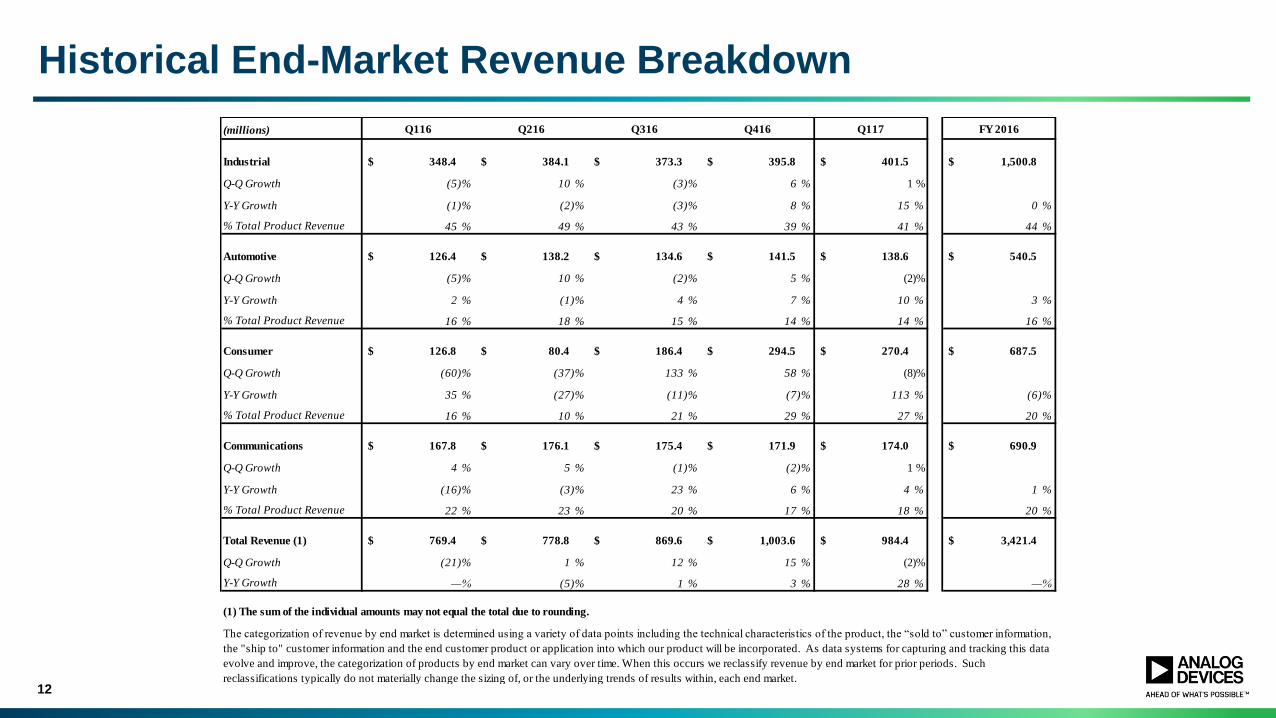
Historical End-Market Revenue Breakdown
12
(millions) Q116 Q216 Q316 Q416 Q117 FY 2016
Industrial 348.4$ 384.1$ 373.3$ 395.8$ 401.5$ 1,500.8$
Q-Q Growth (5)% 10 % (3)% 6 % 1 %
Y-Y Growth (1)% (2)% (3)% 8 % 15 % 0 %
% Total Product Revenue 45 % 49 % 43 % 39 % 41 % 44 %
Automotive 126.4$ 138.2$ 134.6$ 141.5$ 138.6$ 540.5$
Q-Q Growth (5)% 10 % (2)% 5 % (2)%
Y-Y Growth 2 % (1)% 4 % 7 % 10 % 3 %
% Total Product Revenue 16 % 18 % 15 % 14 % 14 % 16 %
Consumer 126.8$ 80.4$ 186.4$ 294.5$ 270.4$ 687.5$
Q-Q Growth (60)% (37)% 133 % 58 % (8)%
Y-Y Growth 35 % (27)% (11)% (7)% 113 % (6)%
% Total Product Revenue 16 % 10 % 21 % 29 % 27 % 20 %
Communications 167.8$ 176.1$ 175.4$ 171.9$ 174.0$ 690.9$
Q-Q Growth 4 % 5 % (1)% (2)% 1 %
Y-Y Growth (16)% (3)% 23 % 6 % 4 % 1 %
% Total Product Revenue 22 % 23 % 20 % 17 % 18 % 20 %
Total Revenue (1) 769.4$ 778.8$ 869.6$ 1,003.6$ 984.4$ 3,421.4$
Q-Q Growth (21)% 1 % 12 % 15 % (2)%
Y-Y Growth —% (5)% 1 % 3 % 28 % —%
(1) The sum of the individual amounts may not equal the total due to rounding.
The categorization of revenue by end market is determined using a variety of data points including the technical characteristics of the product, the “sold to” customer information,
the "ship to" customer information and the end customer product or application into which our product will be incorporated. As data systems for capturing and tracking this data
evolve and improve, the categorization of products by end market can vary over time. When this occurs we reclassify revenue by end market for prior periods. Such
reclassifications typically do not materially change the sizing of, or the underlying trends of results within, each end market.
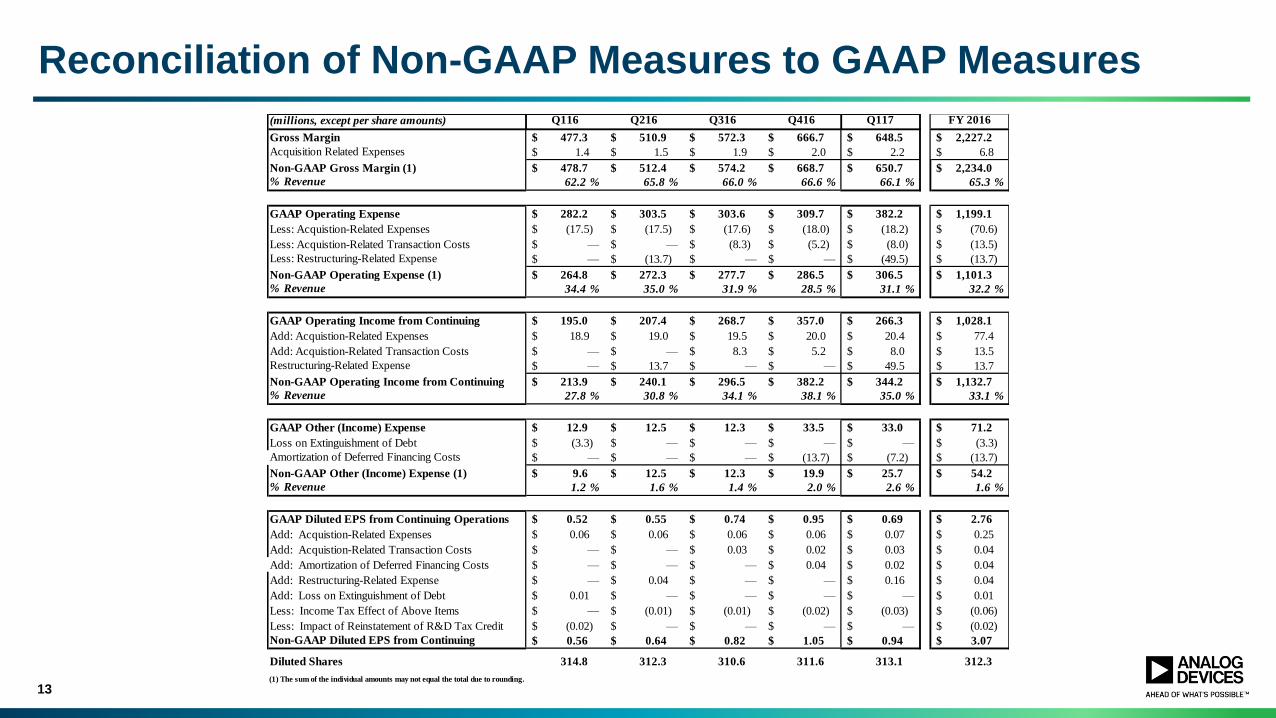
Reconciliation of Non-GAAP Measures to GAAP Measures
13
(millions, except per share amounts) Q116 Q216 Q316 Q416 Q117 FY 2016
Gross Margin 477.3$ 510.9$ 572.3$ 666.7$ 648.5$ 2,227.2$
Acquisition Related Expenses 1.4$ 1.5$ 1.9$ 2.0$ 2.2$ 6.8$
Non-GAAP Gross Margin (1) 478.7$ 512.4$ 574.2$ 668.7$ 650.7$ 2,234.0$
% Revenue 62.2 % 65.8 % 66.0 % 66.6 % 66.1 % 65.3 %
GAAP Operating Expense 282.2$ 303.5$ 303.6$ 309.7$ 382.2$ 1,199.1$
Less: Acquistion-Related Expenses (17.5)$ (17.5)$ (17.6)$ (18.0)$ (18.2)$ (70.6)$
Less: Acquistion-Related Transaction Costs —$ —$ (8.3)$ (5.2)$ (8.0)$ (13.5)$
Less: Restructuring-Related Expense —$ (13.7)$ —$ —$ (49.5)$ (13.7)$
Non-GAAP Operating Expense (1) 264.8$ 272.3$ 277.7$ 286.5$ 306.5$ 1,101.3$
% Revenue 34.4 % 35.0 % 31.9 % 28.5 % 31.1 % 32.2 %
GAAP Operating Income from Continuing 195.0$ 207.4$ 268.7$ 357.0$ 266.3$ 1,028.1$
Add: Acquistion-Related Expenses 18.9$ 19.0$ 19.5$ 20.0$ 20.4$ 77.4$
Add: Acquistion-Related Transaction Costs —$ —$ 8.3$ 5.2$ 8.0$ 13.5$
Restructuring-Related Expense —$ 13.7$ —$ —$ 49.5$ 13.7$
Non-GAAP Operating Income from Continuing 213.9$ 240.1$ 296.5$ 382.2$ 344.2$ 1,132.7$
% Revenue 27.8 % 30.8 % 34.1 % 38.1 % 35.0 % 33.1 %
GAAP Other (Income) Expense 12.9$ 12.5$ 12.3$ 33.5$ 33.0$ 71.2$
Loss on Extinguishment of Debt (3.3)$ —$ —$ —$ —$ (3.3)$
Amortization of Deferred Financing Costs —$ —$ —$ (13.7)$ (7.2)$ (13.7)$
Non-GAAP Other (Income) Expense (1) 9.6$ 12.5$ 12.3$ 19.9$ 25.7$ 54.2$
% Revenue 1.2 % 1.6 % 1.4 % 2.0 % 2.6 % 1.6 %
GAAP Diluted EPS from Continuing Operations 0.52$ 0.55$ 0.74$ 0.95$ 0.69$ 2.76$
Add: Acquistion-Related Expenses 0.06$ 0.06$ 0.06$ 0.06$ 0.07$ 0.25$
Add: Acquistion-Related Transaction Costs —$ —$ 0.03$ 0.02$ 0.03$ 0.04$
Add: Amortization of Deferred Financing Costs —$ —$ —$ 0.04$ 0.02$ 0.04$
Add: Restructuring-Related Expense —$ 0.04$ —$ —$ 0.16$ 0.04$
Add: Loss on Extinguishment of Debt 0.01$ —$ —$ —$ —$ 0.01$
Less: Income Tax Effect of Above Items —$ (0.01)$ (0.01)$ (0.02)$ (0.03)$ (0.06)$
Less: Impact of Reinstatement of R&D Tax Credit (0.02)$ —$ —$ —$ —$ (0.02)$
Non-GAAP Diluted EPS from Continuing 0.56$ 0.64$ 0.82$ 1.05$ 0.94$ 3.07$
Diluted Shares 314.8 312.3 310.6 311.6 313.1 312.3
(1) The sum of the individual amounts may not equal the total due to rounding.
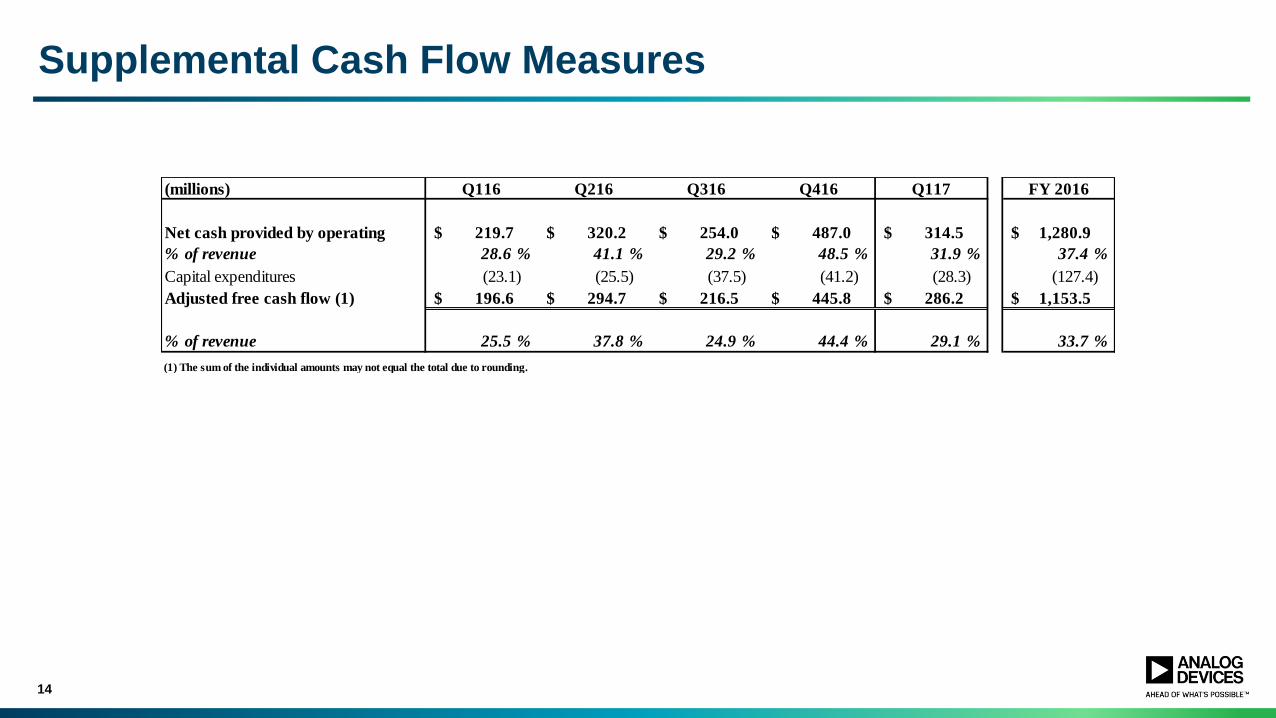
Supplemental Cash Flow Measures
14
(millions) Q116 Q216 Q316 Q416 Q117 FY 2016
Net cash provided by operating 219.7$ 320.2$ 254.0$ 487.0$ 314.5$ 1,280.9$
% of revenue 28.6 % 41.1 % 29.2 % 48.5 % 31.9 % 37.4 %
Capital expenditures (23.1) (25.5) (37.5) (41.2) (28.3) (127.4)
Adjusted free cash flow (1) 196.6$ 294.7$ 216.5$ 445.8$ 286.2$ 1,153.5$
% of revenue 25.5 % 37.8 % 24.9 % 44.4 % 29.1 % 33.7 %
(1) The sum of the individual amounts may not equal the total due to rounding.

Contact Information
15
Ali Husain, Treasurer and Director of Investor Relations
Michael C. Lucarelli, Senior Manager of Investor Relations


