
2005 by The Education Trust-West
Use of Instructional Time?
BOTTOM LINE?Teachers are Left with about
24 School DaysOR
18 Eight Hour Days Per Subject
Per Year

2005 by The Education Trust-West
#3: Make Sure Your Instructional System is
Fully and Carefully Aligned…and That Nothing
About Teaching and Learning is Left to Chance

2005 by The Education Trust-West
Historically, most of the really important decisions
about what students should learn and what kind
of work was “good enough” left to individual
teachers.

2005 by The Education Trust-West
Result? A System That:
• Doesn’t expect very much from MOST students; and,
• Expects much less from some types of students than others.

2005 by The Education Trust-West
Source: Prospects (ABT Associates, 1993), in “Prospects: Final Report on Student Outcomes”, PES, DOE, 1997.
‘A’ Work in Poor Schools Would Earn ‘Cs’ in Affluent
Schools87
35
56
34 41
22 21
11
0
100
Per
cent
ile -
CT
BS
4
A B C DGrades
Seventh Grade Math
Low-poverty schools High-poverty schools

2005 by The Education Trust-West
Students can do no better than
the assignments they are given...

2005 by The Education Trust-West
Grade 7 Writing Assignment
Source: Unnamed school district in California, 2002-03 school year.
Essay on Anne FrankEssay on Anne Frank
Your essay will consist of an opening paragraph which Your essay will consist of an opening paragraph which introduced the title, author and general background of the introduced the title, author and general background of the novel. novel. Your thesis will state specifically what Anne's overall Your thesis will state specifically what Anne's overall personality is, and what general psychological and personality is, and what general psychological and intellectual changes she exhibits over the course of the intellectual changes she exhibits over the course of the bookbookYou might organize your essay by grouping psychological You might organize your essay by grouping psychological and intellectual changes OR you might choose 3 or 4 and intellectual changes OR you might choose 3 or 4 characteristics (like friendliness, patience, optimism, self characteristics (like friendliness, patience, optimism, self doubt) and show how she changes in this area. doubt) and show how she changes in this area.

2005 by The Education Trust-West
Grade 7 Writing Assignment
Source: Unnamed school district in California, 2002-03 school year.
•My Best Friend:My Best Friend:
•A chore I hate:A chore I hate:
•A car I want:A car I want:
•My heartthrob:My heartthrob:
2004 by The Education Trust-West

2005 by The Education Trust-West
Even in college-prep classes, differences in rigor…

2005 by The Education Trust-West
Using the SAME TEXT BOOKCollege-prep assignments from:
School A, District A, California
1467 students enrolled in 2005• 82% White• 6% Asian• 4% Latino• 2% Black
• 2% Low-Income
School B, District B, California
2001 students enrolled in 2005• 45% White• 4% Asian
• 48% Latino• 1% Black
• 27% Low-Income

2005 by The Education Trust-West
Same Text Book: High-Level college-prep
assignment.• Describe the fundamental problems in
the economy that helped cause the Great Depression. Consider agriculture, consumer spending and debt, distribution of wealth, the stock market
• Describe how people struggled to survive during the Depression
• How did Hoover’s belief in “rugged individualism” shape his policies during the depression?

2005 by The Education Trust-West
Same Text Book:Low Level college-prep
assignment.• Role play (Meet the Press) &
interview key people of the era• Draw a political cartoon highlighting
a major event of the time• Share excerpts from noted literary
authors-Lewis, Fitzgerald, Hemingway, Hughes
• Listen to jazz artists of the 20’s• Construct a collage depicting new
inventions

2005 by The Education Trust-West
High Performing Schools and Districts
• Have clear and specific goals for what students should learn in every grade, including the order in which they should learn it;
• Provide teachers with common curriculum, assignments;
• Assess students every 4-8 weeks to measure progress;
• ACT immediately on the results of those assessments.

2005 by The Education Trust-West
#4. Insist on Rigor and High Standards for All Students. Make the
College Prep Curriculum the Default Curriculum.

2005 by The Education Trust-West
Not all students have access to college-prep
classes.

2005 by The Education Trust-West
Latino and Black are less likely to attend High Schools that offer
High-Level Math Courses
67
5160
45
77
59
0
20
40
60
80
100
Trigonometry CalculusPe
rce
nt
of
Stu
de
nts
Att
en
din
g H
igh
Sc
ho
ols
th
at
Off
er
Hig
h-L
ev
el M
ath
Co
urs
es
Black
Latino
White
Source: Clifford Adelman, U.S. Department of Education, The Toolbox Revisited, 2006.

2005 by The Education Trust-West
Low-SES Students are less likely to attend High Schools that offer
High-Level Math Courses
64
44
83
72
0
20
40
60
80
100
Trigonometry CalculusPe
rce
nt
of
Stu
de
nts
Att
en
din
g H
igh
Sc
ho
ols
th
at
Off
er
Hig
h-L
ev
el M
ath
Co
urs
es
Low SES
High SES
Source: Clifford Adelman, U.S. Department of Education, The Toolbox Revisited, 2006.
SES quintiles are composites of family income, parental education, prestige of parental occupation(s), and the presence of reading materials and computers in the household.

2005 by The Education Trust-West
Latino and Black students are less likely to take the full complement of
Science Courses
22%25%
31%
45%
0%
10%
20%
30%
40%
50%
Black
Latino
White
Asian
Source: U.S. Department of Education
Per
cen
tag
e o
f 12
th G
rad
e S
tud
ents
Tak
ing
B
iolo
gy,
Ch
emis
try,
an
d P
hys
ics

2005 by The Education Trust-West
Even though most students want to go to college, the truth is, many low income students and students of color aren’t getting the classes in the first place.

2005 by The Education Trust-West
Gompers HS:
• 1543 Students
• 87.1% Latino & African-American
• 81.1% low-income
• 17% of graduates successfully completed A-G in 2004
La Jolla HS:
• 1688 students
• 25% Latino & African-American
• 17.8% low-income
• 56.7% of graduates successfully completed A-G in 2004
San Diego City Schools: Two High Schools
Source: CA Dept of Education, 2005

2005 by The Education Trust-West
48
30
6 3
10
1
19
6
12
4 5 3
0
10
20
30
40
50
60
Pre-Alg Beg Alg Int Alg Adv Alg Geometry Pre-calc Calc
Gompers HS La Jolla HSNu
mb
er
of
cla
sse
s o
ffe
red
in 2
00
4-0
5Opportunities to take higher level math classes are much
more limited at the high-poverty, high-minority high school:Gompers HS vs. La Jolla HS, San Diego City Schools
Source: Ed Trust-West Analysis of CA Dept of Education Data, 2005
2005 by The Education Trust-West
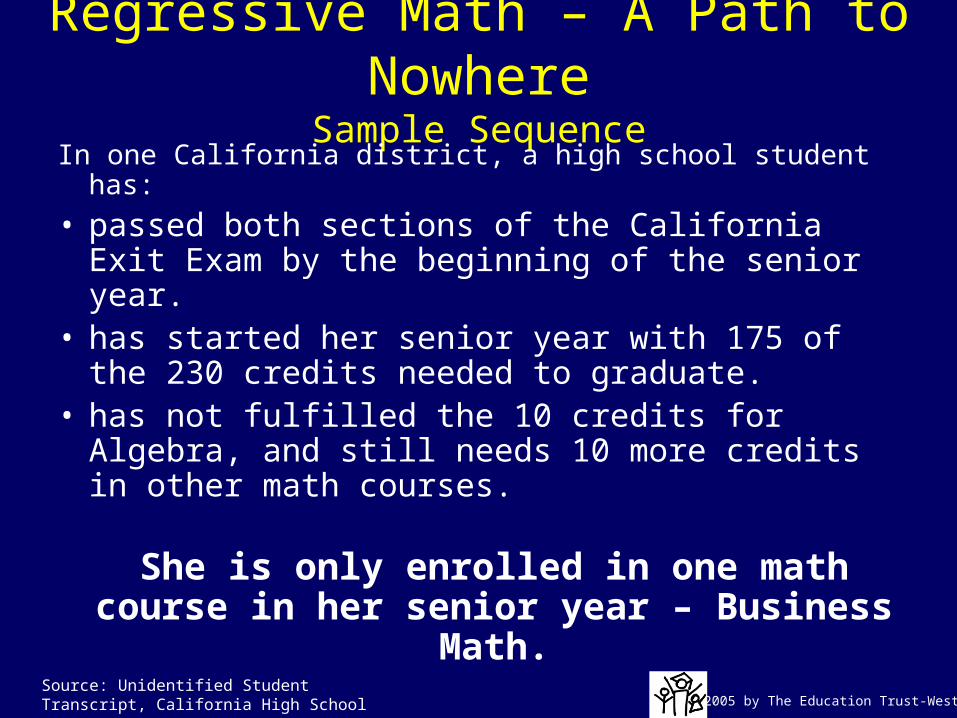
Regressive Math – A Path to Nowhere
Sample SequenceIn one California district, a high school student has:
• passed both sections of the California Exit Exam by the beginning of the senior year.
• has started her senior year with 175 of the 230 credits needed to graduate.
• has not fulfilled the 10 credits for Algebra, and still needs 10 more credits in other math courses.
She is only enrolled in one math course in her senior year –
Business Math.Source: Unidentified Student Transcript, California High School

2005 by The Education Trust-West
In that same district 20% of students are enrolled in
Regressive Math. More than half of those are
Latino.
Regressive Math – A Path to Nowhere

2005 by The Education Trust-West
But are most of our kids getting anything that even
remotely resemblesINTENSE?

2005 by The Education Trust-West
Jake’s Fall Schedule, Freshman Year
English
Health Ed/Academic Foundations (Required Course for all freshmen)
Conceptual Physics
Volleyball

2005 by The Education Trust-West
Spring Schedule, Freshman Year
Algebra
Auto Shop
Auto Shop
Volleyball

2005 by The Education Trust-West
Fall Schedule, Sophomore Year
English
Spanish
Chemistry
Open Period (required)

2005 by The Education Trust-West
Spring Schedule, Sophomore Year
Geometry
W. History
Volleyball
Open Period (required)

2005 by The Education Trust-West
Fall Schedule, Junior Year
Mythology
Algebra
Auto Shop
Career Choices

2005 by The Education Trust-West
Spring Schedule, Junior Year
Algebra 2
American History
Arts Tech
English

2005 by The Education Trust-West
Senior Year?
Too embarrassing to even show

2005 by The Education Trust-West
Consequences?

2005 by The Education Trust-West
The Highest Level of Math Reached in High School is a Strong Predictor of BA
Attainment
8375
60
39
17
7
0
20
40
60
80
100
Calculus Precalculus Trigonometry Algebra 2 Geometry Algebra 1
Per
cen
t A
ttai
nin
g a
Bac
hel
or'
s
Source: Clifford Adelman, U.S. Department of Education, The Toolbox Revisited, 2006.

2005 by The Education Trust-West
High School Curriculum Intensity is a Strong Predictor of Bachelor’s Degree
Completion
82
9
0
20
40
60
80
100
Most Intense Curriculum Least Intense Curriculum
Per
cen
t o
f S
tud
ents
Co
mp
leti
ng
a
Bac
hel
or'
s D
egre
e
Source: Clifford Adelman, U.S. Department of Education, The Toolbox Revisited, 2006.
Curriculum quartiles are composites of English, math, science, foreign language, social studies, computer science, Advanced Placement, the highest level of math, remedial math and remedial English classes taken during high school.
2005 by The Education Trust-West
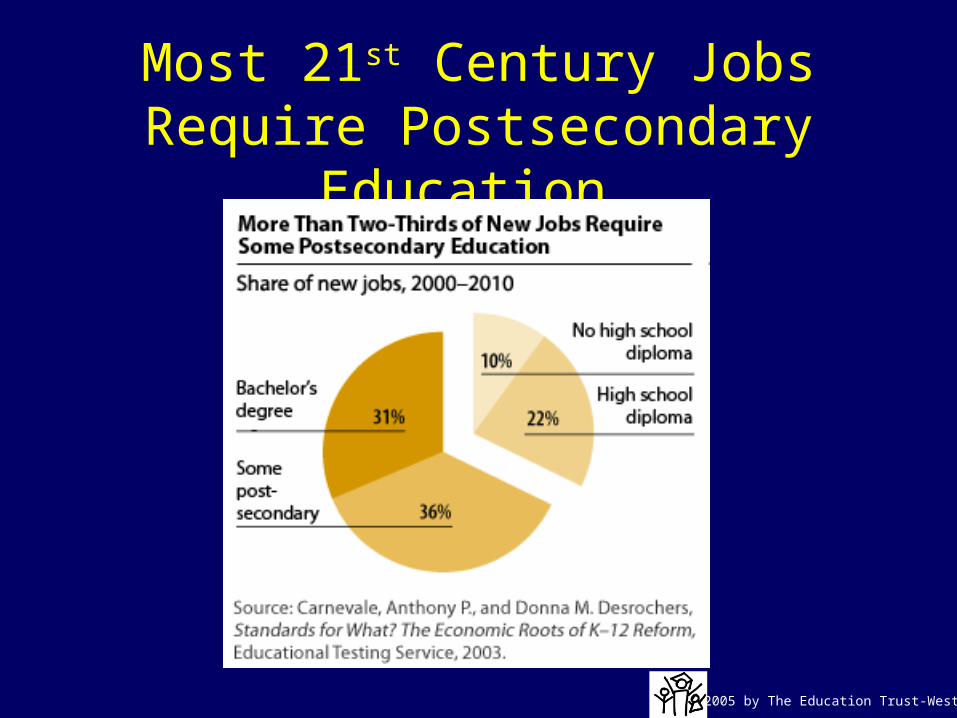
Most 21st Century Jobs Require Postsecondary
Education

2005 by The Education Trust-West
College isn’t for everyone. But a college prep curriculum is.

2005 by The Education Trust-West
High School Course-Taking Indicates Opportunity for Success in the
Workplace
75%85%
0%
20%
40%
60%
80%
100%
Algebra I I or higher Geometry or higher
The percentage of workers in the highest-paying jobs that took high-level math courses in high school
Source: Carnevale and Desrochers, ETS, Connecting Education Standards & Employment: Course Taking Patterns of Young Workers, ADP: Workplace Study, 2002:

2005 by The Education Trust-West
American Diploma Project Interviews with Employers:
• They mostly want the same things that higher education wants!– Strong Reading Ability – read/comprehend
informational and technical texts– Emphatic about literature – understanding other
cultures is necessary with diverse customers and co-workers
– Writing ability key– Mathematics Imperative – data, probability,
statistics and competent problem solvers. Algebra I, Geometry and Algebra II.
Source: Workplace Study by the National Alliance for Business for the American Diploma Project, unpublished report, 2002.

2005 by The Education Trust-West
But Even in Jobs We Don’t Expect…
Requirements for Tool and Die Makers
• Four or five years of apprenticeship and/or postsecondary training;
• Algebra, geometry, trigonometry and statistics;
• Average earnings: $40,000 per year.
Requirements for Sheet Metal Workers
• Four or five years of apprenticeship;
• Algebra, geometry, trigonometry and technical reading;
Requirements for Auto Technicians
• A solid grounding in physics is necessary to understand force, hydraulics, friction and electrical circuits.

2005 by The Education Trust-West
Even in Jobs We Don’t Expect…
Plumbing-Heating-Air Conditioning
• Four or five years of apprenticeship
and/or post-secondary training;
• Algebra, plane geometry,
trigonometry and statistics;
• Physics, chemistry, biology,
engineering economics.
ALL of these jobs require a strong
foundation of reading, writing
and speaking the English
language in order to
comprehend instructions and
technical manuals
Construction and Engineering
• Four or five years of apprenticeship
and/or post-secondary training;
• Algebra, plane geometry
• Critical thinking, problem solving,
reading and writing
Sources: Plumbing : Shapiro, D., and Nichols, J. Constructing Your Future: Consider a Career in Plumbing, Heating, Ventilation, Air Conditioning (HVAC) PHCC Auxiliary 2005 downloaded March 13, 3006 http://www.phccweb.org/PDFs/PHCC20pg.pdf, Construction: California Apprenticeship Council Division of Apprenticeship Standards 2001 Annual Legislative Report Downloaded March 15, 2006 http://www.dir.ca.gov/das/DASAnnualReport2001/LegRep2001.pdf#search='architecture%2C%20construction%2C%20engineering%20%28ace%20pathway%29%20course%20outline'

2005 by The Education Trust-West
Employers Are Less Willing to Help
“Remedial programs were victims of mid-90s cost cutting initiatives: from a high point of 24% of [businesses] in 1993, the share of companies sponsoring such programs dropped to 15% in 1999 and 12.3% in 2001.”
--2001 American Management Association Survey on Workplace Testing
2005 by The Education Trust-West
Employers are looking for better educated workers
elsewhere
Example: Toyota Motor Corporation

2005 by The Education Trust-West
Why Ontario, Canada is a better location for a new
Toyota plant…“The level of the workforce in general is so high the training program you need for people, even for people who have never worked in a Toyota plant before, is minimal compared to what you have to go through in the southeastern United States,”
--Gerry Fedchun, president of Automotive Parts Manufacturers’ Association, 7/8/2005
Source: www.cbc.ca/cp/business/050630/b0630102.html

2005 by The Education Trust-West
“In Alabama, trainers had to use ‘pictorials’ to teach some illiterate workers how to use high-tech plant equipment.”
--Gerry Fedchun, president of Automotive Parts Manufacturers’ Association, 7/8/2005
Source: www.cbc.ca/cp/business/050630/b0630102.html

2005 by The Education Trust-West
With college-prep curricula, students of all sorts will learn more...

2005 by The Education Trust-West
Source: USDOE, NCES, Vocational Education in the United States: Toward the Year 2000, in Issue Brief: Students Who Prepare for College and Vocation
*Grade 8-grade 12 test score gains based on 8th grade achievement.
Low Quartile Students Gain More From College Prep
Courses*
1916
28
20
0
30
Math Reading
NE
LS
Sco
re G
ain
Vocational College Prep

2005 by The Education Trust-West
San Jose Unified – College Prep Curriculum For All
AP Scores with a score of AP >=3
43.5
57.4
0102030405060
1999 2004748 Test Taken 1197 Tests Taken
Source: EdTrust West analysis of California Department of Education data

2005 by The Education Trust-West
Students taking rigorous courses will fail less often...

2005 by The Education Trust-West
Challenging Curriculum Results in Lower Failure Rates, Even for Lowest Achievers
16
23
47
31
0
50
Quartile I (Lowest) Quartile 2
Per
cen
t E
arn
ing
"D
" o
r "F
"
College Prep Low Level
Source: SREB, “Middle Grades to High School: Mending a Weak Link”. Unpublished Draft, 2002.
Ninth-grade English performance, by high/low level course, and eighth-grade reading achievement quartiles

2005 by The Education Trust-West
Gaps will close.

2005 by The Education Trust-West
SJUSD SAT9 & CAT6 Matched Reading Scores at
Grades 4-9 for Students who Have Been Tested with STAR Every Year Since 1998
Gap reduced by 48%
Gap reduced by 48%
Med
ian
Nat
iona
l Per
cent
ileM
edia
n N
atio
nal P
erce
ntile
Source: San Jose Unified School District
*CAT6 scores adjusted to SAT9 scale

2005 by The Education Trust-West
SJUSD SAT9 & CAT6 Matched Mathematics Scores at
Grades 3-9 for Students who Have Been Tested with STAR Every Year Since 1998
Gap reduced by 43%
*CAT6 scores adjusted to SAT9 scale
Med
ian
Nat
iona
l Per
cent
ileM
edia
n N
atio
nal P
erce
ntile
Source: San Jose Unified School District

2005 by The Education Trust-West
Students will work harder.

2005 by The Education Trust-West
66%
70%
81%
88%
0% 20% 40% 60% 80% 100%
Would have worked harder if expectationswere higher
Were confident they could have graduatedfrom high school
Recognized that graduating from high schoolwas vital to their success
Had passing grades
Source: The Silent Epidemic: Perspectives of High School Dropouts, Civic Enterprises, March 2006
Recent poll shows that 66% of dropouts would have worked harder if expectations
were higher.

2005 by The Education Trust-West
And they’ll succeed more.

2005 by The Education Trust-West
SJUSD Graduation Rates
72%73%70%
87% 84% 79% 80%
0%10%20%30%40%50%60%70%80%90%
100%
1998 1999 2000 2001 2002 2003 2004
Source: Ed Trust West analysis of CA Dept of Ed data, 2005
Estimated completion rate
using Cumulative Promotion Index
methodology
69%71%72% 77% 73% 73% 73%
0%10%20%30%40%50%60%70%80%90%
100%
1998 1999 2000 2001 2002 2003 2004
Estimated completion rate
using Manhattan Institute
methodology

2005 by The Education Trust-West
LAUSD High Schools That Have High Percentages of Their Graduates
Completing College Prep Curriculum (A-G) Have Fewer Suspensions and
Lower Failure Rates
46%
16%
37%
23%
64%
11%21%
12%
0%10%20%30%40%50%60%70%80%90%
100%
HSCompletion
Rate
SuspensionRate
% of F's inMath
% of F's inEnglish
LowPercentageA-G Grads
HighPercentageA-G Grads
Source: Ed Trust West Analysis of School-Level Data, School Accountability Report Cards, 2005.

2005 by The Education Trust-West
#5. Monitor the Distribution of Teacher
Talent…andMake Sure Low-Income and Minority Students Have the High Quality Teachers They Need

2005 by The Education Trust-West
Teachers Matter Big Time.

2005 by The Education Trust-West
Students Who Start 2nd Grade at About the Same Level of Math
Achievement…
55 57
0
20
40
60
80
100
Group 1 Group 2
Avera
ge P
erc
en
tile
Ran
k
Beginning of 2nd Grade
Source: Heather Jordan, Robert Mendro, and Dash Weerasinghe, The Effects of Teachers on Longitudinal Student Achievement, 1997.

2005 by The Education Trust-West
…Finish 5th Grade Math at Dramatically Different Levels Depending on the Quality
of Their Teachers
55 57
77
27
0
20
40
60
80
100
Group 1 Assigned to ThreeEFFECTIVE Teachers
Group 2 Assigned to ThreeINEFFECTIVE Teachers
Avera
ge P
erc
en
tile
Ran
k
Beginning of 2nd Grade End of 5th Grade
Source: Heather Jordan, Robert Mendro, and Dash Weerasinghe, The Effects of Teachers on Longitudinal Student Achievement, 1997.

2005 by The Education Trust-West
Students Who Start 3rd Grade at About the Same Level of Reading
Achievement…
59 60
0
20
40
60
80
100
Group 1 Group 2
Ave
rag
e P
erce
nti
le R
ank
Beginning of 3rd Grade
Source: Heather Jordan, Robert Mendro, and Dash Weerasinghe, The Effects of Teachers on Longitudinal Student Achievement, 1997.

2005 by The Education Trust-West
…Finish 6th Grade at Dramatically Different Levels Depending on the Quality of Their
Teachers
59 60
76
42
0
20
40
60
80
100
Group 1 Assigned to ThreeEFFECTIVE Teachers
Group 2 Assigned to ThreeINEFFECTIVE Teachers
Avera
ge P
erc
en
tile
Ran
k
Beginning of 3rd Grade End of 6th Grade
Source: Heather Jordan, Robert Mendro, and Dash Weerasinghe, The Effects of Teachers on Longitudinal Student Achievement, 1997.

2005 by The Education Trust-West
But poor and minority students don’t get their fair
share of our strongest teachers.

2005 by The Education Trust-West
Poor and Minority Students Get More Inexperienced*
Teachers20%
11%
21%
10%
0%
25%
Perc
en
t o
f T
each
ers
Wh
o A
re
Inexp
eri
en
ced
Source: National Center for Education Statistics, “Monitoring Quality: An Indicators Report,” December 2000.
*Teachers with 3 or fewer years of experience.
High poverty Low poverty High minority Low minority
Note: High poverty refers to the top quartile of schools with students eligible for free/reduced price lunch. Low poverty-bottom quartile of schools with students eligible for free/reduced price lunch. High minority-top quartile; those schools with the highest concentrations of minority students. Low minority-bottom quartile of schools with the lowest concentrations of minority students

2005 by The Education Trust-West
More Classes in High-Poverty, High-Minority Schools Taught By Out-of-
Field Teachers34%
19%
29%
21%
0%
50%
Per
cen
t o
f C
lass
es T
aug
ht
by
Ou
t o
f F
ield
Tea
cher
s
*Teachers lacking a college major or minor in the field. Data for secondary-level core academic classes.Source: Craig D. Jerald, All Talk, No Action: Putting an End to Out-of-Field Teaching, The Education Trust, 2002.
High poverty Low poverty High minority Low minority
Note: High Poverty school-50% or more of the students are eligible for free/reduced price lunch. Low-poverty school -15% or fewer of the students are eligible for free/reduced price lunch.
High-minority school - 50% or more of the students are nonwhite. Low-minority school- 15% or fewer of the students are nonwhite.

2005 by The Education Trust-West
Middle Grades – Classes Taught by Teachers Without at Least a College Minor in the Subject
Source: Craig D. Jerald, All Talk, No Action: Putting an End to Out-of-Field Teaching, The Education Trust, 2002.
53%
38%
49%
40%
0%
60%
High-Poverty Low-Poverty Schools Schools
High-Minority Low-Minority Schools Schools
Percent of middle
school classes
taught by a teacher without
at least a minor in
the subject
(>50%) (<15%) (>50%) (<15%)
*Data is for core academic classes.
2005 by The Education Trust-West
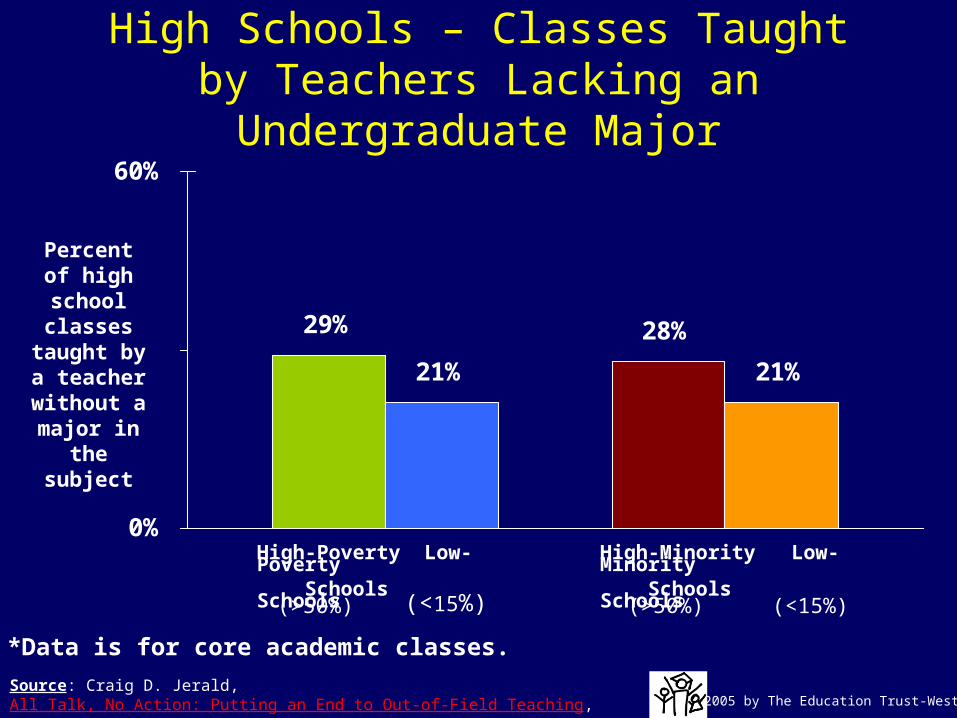
High Schools – Classes Taught by Teachers Lacking an Undergraduate
Major
Source: Craig D. Jerald, All Talk, No Action: Putting an End to Out-of-Field Teaching, The Education Trust, 2002.
29%
21%
28%
21%
0%
60%
High-Poverty Low-Poverty Schools Schools
High-Minority Low-Minority Schools Schools
Percent of high
school classes
taught by a teacher without a major in
the subject
(>50%) (<15%) (>50%) (<15%)
*Data is for core academic classes.
2005 by The Education Trust-West
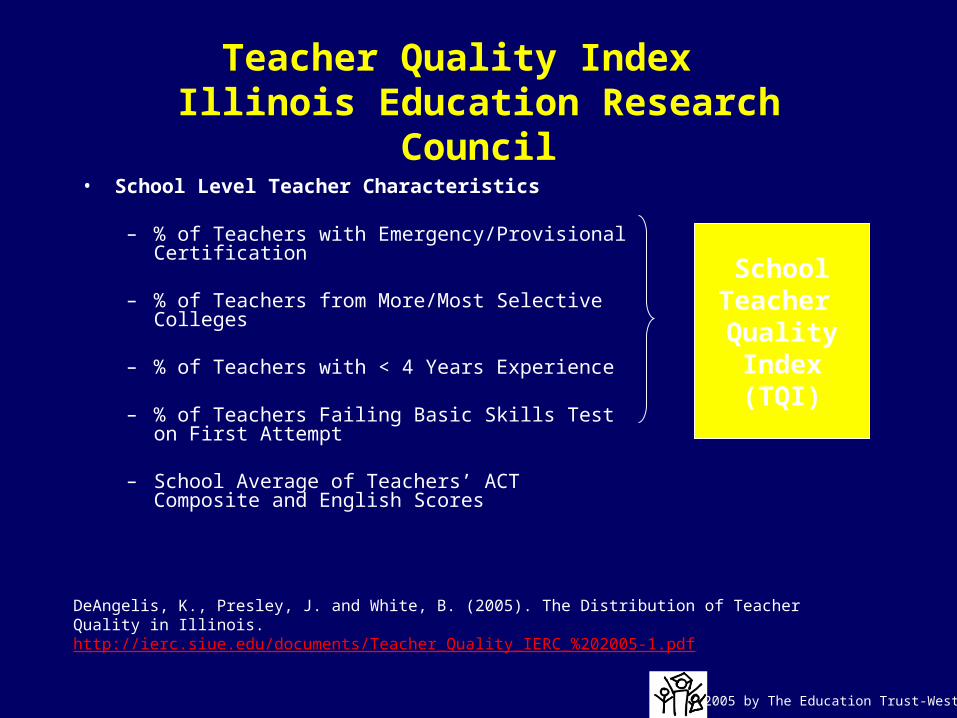
Teacher Quality Index Illinois Education Research Council
• School Level Teacher Characteristics
– % of Teachers with Emergency/Provisional Certification
– % of Teachers from More/Most Selective Colleges
– % of Teachers with < 4 Years Experience
– % of Teachers Failing Basic Skills Test on First Attempt
– School Average of Teachers’ ACT Composite and English Scores
SchoolTeacher QualityIndex(TQI)
DeAngelis, K., Presley, J. and White, B. (2005). The Distribution of Teacher Quality in Illinois. http://ierc.siue.edu/documents/Teacher_Quality_IERC_%202005-1.pdf
2005 by The Education Trust-West
IERC College Readiness Index
• Uses ACT scores and self-reported GPA
• Five levels– Not/least ready– Minimally ready– Somewhat ready– More ready– Most ready
Presley, J. and Gong, Y. (2005). The Demographics and Academics of College Readiness in Illinois. http://ierc.siue.edu/documents/College%20Readiness%20-%202005-3.pdf

2005 by The Education Trust-West
Illinois: Distribution of School TQI by
School Percent Minority•Very high percent minority schools are likely to have very low school TQIs.
•There is little difference in TQI distribution below the highest minority quartile (i.e. below about 60% minority).

2005 by The Education Trust-West
Impact?

2005 by The Education Trust-West
College Readiness at High Poverty, High Minority Schools by TQI
26%
3%
73%
38%
0
10
20
30
40
50
60
70
80
Lowest TQI Upper Middle TQI
Pe
rce
nt
of
Stu
de
nts
More/Most Ready
Not/Least Ready
Presley, J. and Gong, Y. (2005). The Demographics and Academics of College Readiness in Illinois. http://ierc.siue.edu/documents/College%20Readiness%20-%202005-3.pdf

2005 by The Education Trust-West
Percent of Students More/Most Ready by High School TQI and
Highest Math Level
6 6
1611
25
48
18
42
67
20
52
76
21
57
81
0102030405060708090
Algebra II Trigonometryor other
advancedmath
Calculus
Per
cen
t o
f S
tud
ents
Lowest 10%
11-25%
Lower Middle TQI
Upper Middle TQI
Highest TQI
Presley, J. and Gong, Y. (2005). The Demographics and Academics of College Readiness in Illinois. http://ierc.siue.edu/documents/College%20Readiness%20-%202005-3.pdf

2005 by The Education Trust-West
Let’s Get That Again!
STUDENTS WHO STUDIED ALL THE WAY THROUGH CALCULUS IN SCHOOLS WITH THE LOWEST
TEACHER QUALITY LEARNED LESS MATH THAN STUDENTS WHO ONLY
WENT THROUGH ALGEBRA 2 IN SCHOOLS WITH JUST AVERAGE
TEACHER QUALITY.

2005 by The Education Trust-West
Some of the differences occur between poor and rich
school districts.But there are big differences within
school districts, as well. In fact, in most states these differences are larger than
between-district differences.

2005 by The Education Trust-West
California: Study after study shows large differences in
experience and education of teachers in high vs. low-
poverty schools.These differences, of course, reflected in different salaries.

2005 by The Education Trust-West
A Tale of Two Schools
Granada Hills High SchoolLos Angeles Unified
• 32% Latino & African American
• 27% of students receive free or reduced price lunch
• Academic Performance Index = 773
Locke High SchoolLos Angeles Unified
• 99% Latino & African American
• 66% of students receive free or reduced price lunch
• Academic Performance Index = 440
Source: CA Department of Education, 2003-04 data
2005 by The Education Trust-West
In accordance with district and state practice, both schools report the same average teacher salary.

2005 by The Education Trust-West
The average teacher at Locke High School actually gets paid an estimated $8,034 less every year than his counterpart at
Granada Hills High School.
If Locke spent as much as Granada Hills on teacher salaries for its 119 teachers, the school budget would increase by nearly a million dollars ($956,056) every year.

2005 by The Education Trust-West
A Tale of Two Schools
Washington High SchoolSan Francisco Unified
• 13% Latino & African American
• 37% of students receive free or reduced price lunch
• Academic Performance Index = 760
Mission High SchoolSan Francisco Unified
• 67% Latino & African American
• 75% of students receive free or reduced price lunch
• Academic Performance Index = 518
Source: CA Department of Education, 2003-04 data

2005 by The Education Trust-West
The average teacher at Mission High School actually gets paid an
estimated $9,901 less every year than his counterpart at Washington
High School.
If Mission spent as much as Washington on teacher salaries for its 57 teachers, the school budget would increase by $564,357 every
year.

2005 by The Education Trust-West
Again, both report the same average teacher salary.

2005 by The Education Trust-West
Average School Gaps in 10 Largest CA Districts by School Type
DISTRICT
Poverty Minority
Elementary Middle
High School
Elementary Middle
High School
Elk Grove Unified 36,561-
157,937 325,113 102,762-
319,075 252,503
Fresno Unified 125,881 104,980 85,534 108,113 126,829 125,639
Long Beach Unified 362,683 251,012 574,387 381,587 218,585 289,968
Los Angeles Unified 83,363 175,960 -23,763 112,743 200,178 161,686
Sacramento City Unified 140,144 -39,078 227,073 142,012 89,692 522,459
San Bernardino City Unified 228,668 239,357 463,426 231,464 345,367 382,690
San Diego Unified 139,972 216,460 267,900 223,072 268,907 254,832
San Francisco Unified 43,817 44,905 195,426 86,399 146,006 263,816
San Juan Unified 81,899 202,423 103,330 53,964 150,314 139,570
Santa Ana Unified 120,456 309,381-
215,960 84,678 175,133 64,291

2005 by The Education Trust-West
You don’t have to just sit by and watch that happen.
SB 687.RBB.

2005 by The Education Trust-West
If we had the courage and creativity to change these
patterns?
2005 by The Education Trust-West
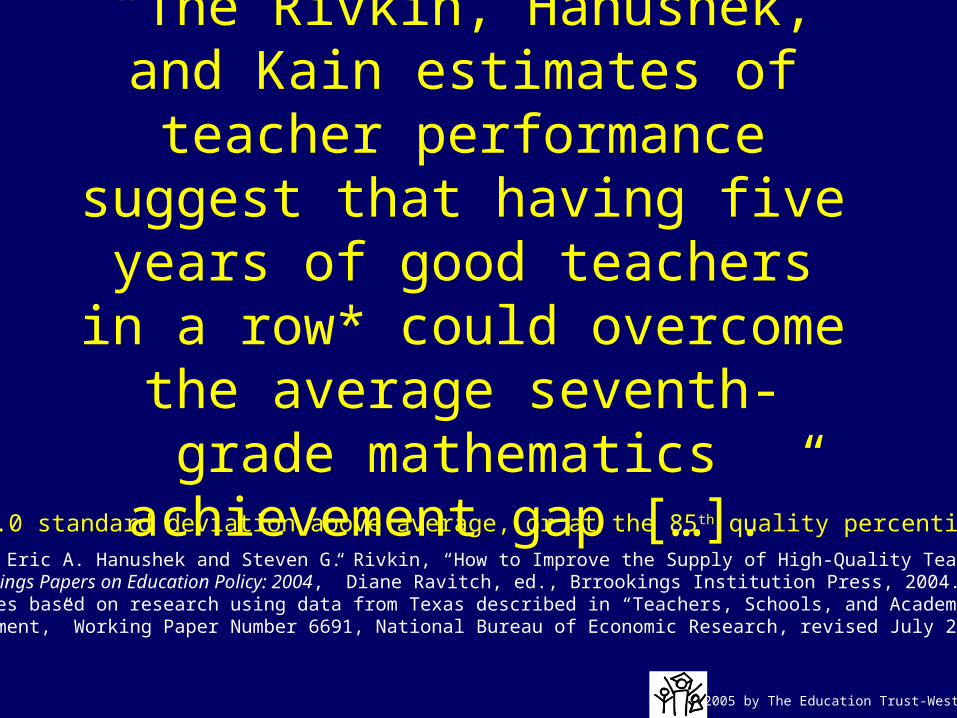
“The Rivkin, Hanushek, and Kain estimates of teacher performance suggest that having five years of good teachers in a row* could overcome the average
seventh-grade mathematics achievement gap […].”
* “1.0 standard deviation above average, or at the 85th quality percentile”SOURCE: Eric A. Hanushek and Steven G. Rivkin, “How to Improve the Supply of High-Quality Teachers,” In Brookings Papers on Education Policy: 2004,” Diane Ravitch, ed., Brrookings Institution Press, 2004.Estimates based on research using data from Texas described in “Teachers, Schools, and AcademicAchievement,” Working Paper Number 6691, National Bureau of Economic Research, revised July 2002.

2005 by The Education Trust-West
Bottom Line: If we’re serious about all kids college and work ready we have got to move the
teacher quality and gap conversation to the top of civic
and political agendas.

2005 by The Education Trust-West
Why is it so hard?Despite our greater
understanding of how important teachers are, it has been very hard to get
traction on an improvement agenda.

2005 by The Education Trust-West
Problem 1: Too polite to criticize, demand.
Not much to say here, except…

2005 by The Education Trust-West
SPEAK UP!!!
Just as we’ve needed pressure from higher ed and business to help us
ratchet up standards for high school students, does higher ed needs
pressure from K-12 and business to ratchet up quality of teacher
preparation? If so, what would be productive for you?

2005 by The Education Trust-West
Problem 2: Paralyzed by supply fears . . . And so we
never get to equity. Confront the Myths and Fears
Head – On.

2005 by The Education Trust-West
What do we really know about supply and turnover?
That most of the myths are…just that.

2005 by The Education Trust-West
Myth #1
“Turnover in the teaching profession is just terrible!
More than 50% are gone in 3 years.”

2005 by The Education Trust-West
Overall, the three-year teacher retention rate for recently graduated teachers is one of the best new-professional retention rates in the country.
• Nationally, 76% of recently graduated K-12 teachers who worked full time in 1994 remained teachers in 1997.
• Full-time and part-time new teachers remained on the job at higher rates than full-time or part-time engineers, scientists, lab and research assistants or employees in the legal profession.
Source: Presley, Jennifer. (2003). Occupational Stability of New College Graduates. Edwardsville, IN: Illinois Education Research Council, Southern Illinois University Edwardsville. 1 & 3.
© 2006 T
he Education T
rust, Inc.

2005 by The Education Trust-West
Full-time Retention Rate Over a Three Year Period by Occupation
47
51
65
68
76
76
0 10 20 30 40 50 60 70 80 90 100
Legal Professionals and LegalSupport Occupations
Computer and TechnicalOccupations
Engineers, Scientists, Lab andResearch Assistants
Law Enforcement, Military
K-12 Teachers
Health Occupations
Pro
fess
ion
Percentage
© 2006 T
he Education T
rust, Inc.
Source: Presley, Jennifer. (2003). Occupational Stability of New College Graduates. Edwardsville, IN: Illinois Education Research Council, Southern Illinois University Edwardsville. 2.

2005 by The Education Trust-West
Annual turnover in teaching profession? 7%
Annual turnover elsewhere in the workforce? 7%
2005 by The Education Trust-West
Myth #2
“Teachers are terribly dissatisfied with their work—much more so in recent years, especially because
of the pressure from NCLB.”

2005 by The Education Trust-West
Fact - Teacher satisfaction has remained fairly constant over the past 15 years.
• The percentage of teachers who noted they are “very satisfied” or “somewhat satisfied” (as opposed to “somewhat dissatisfied,” “very dissatisfied,” or “not sure”) has hovered around 87% since 1988, peaking at 92% in 2001.
• In 2003, 57% of teachers reported that they were “very satisfied” with their job, up from 52% in 2001 and 54% in 1995.
[1] 1988—87%, 1989—86%, 1995—87%, 2001—92%, 2003—87%
© 2006 T
he Education T
rust, Inc.
Source: Metropolitan Life Insurance Company, The MetLife Survey of the American Teacher. (2003). An Examination of School Leadership: A Survey of Teachers, Principals, Parents and Teachers. New York: Harris Interactive, Inc. Exhibit 4.2—Teachers’ Job Satisfaction (1984-2003). 66.

2005 by The Education Trust-West
Myth #3
“We’re facing shortages of up to 2.2 million new teachers
over the next decade.”

2005 by The Education Trust-West
Each year, approximately:
• 220,000+ teachers retire or otherwise leave profession;
• Nation’s colleges produce approximately 200,000 new teachers;
• 200,000+ vacancies filled, approximately 40% from returning teachers, and the remainder from new or recent grads.

2005 by The Education Trust-West
BUT…
• Although there may be enough teachers in the aggregate, there may not be enough teachers qualified to teach each of the subject areas.
• Likewise, there may not be enough teachers available who want to teach in certain geographic locations.
• And, we know there are not enough high-quality teachers going to high-poverty, high-minority schools.
Source: Ingersoll, Richard M. (2003). Is There Really a Teacher Shortage? Seattle, WA: Center for the Study of Teaching and Policy, University of Washington. 8. and Murphey, Patrick J. and Michael M. DeArmond. (2003). From the Headlines to the Front Lines: The Teacher Shortage and Its Implications for Recruitment Policy. Seattle, WA: Center for Reinventing Public Education, University of Washington. 21-22.
© 2006 T
he Education T
rust, Inc.

2005 by The Education Trust-West
Myth #4
“Nobody wants to teach in urban school districts.”

2005 by The Education Trust-West
Fact - The good news is that strong recruitment techniques can attract highly-qualified teachers to high-needs schools.
• The New Teacher Project reported that aggressive recruiting yielded far more qualified applicants per position, including in high-needs subject areas, than the district could hire.
– In one urban school district, the ratio of applicants to positions was 20 to 1, with other districts garnering a ratio of between 5 to 1 and 7 to 1.
Source: Levin, Jessica and Meredith Quinn. (2003). Missed Opportunities: How We Keep High-Quality Teachers Out of Urban Classrooms. New York: The New Teacher Project. 5.
© 2006 T
he Education T
rust, Inc.

2005 by The Education Trust-West
• Chicago Public Schools– CPS received 13,700 applications for
about 1,500 teacher vacancies from candidates applying for the 2006-2007 school year.
– The district estimates that by the end of the hiring season, they will receive 18,500 applications.

2005 by The Education Trust-West
• Teach For America - which only places teachers in high-needs schools - reports record high numbers of applicants for teaching positions. – In the 2005-06 recruiting season, Teach For
America received a record 19,000 applications for about 2,400 positions.
Source: Teach for America Press Release. (June 1, 2006) “In Strong Job Market, Record Number Of Graduating SeniorsApply To Teach For America.” http://www.teachforamerica.org/documents/060106_2006.Application.Numbers.pdf
© 2006 T
he Education T
rust, Inc.
2005 by The Education Trust-West
We need to look very closely at our data, avoid repeating
myths and aggressively counter those who are
spreading misinformation.

2005 by The Education Trust-West
Problem #3:We haven’t learned enough from high
impact teachers.

2005 by The Education Trust-West
What do we know?
Way too little. But several actionable conclusions.

2005 by The Education Trust-West
Today, drawing primarily from five new studies:
• Comparing the Effects of Different Routes to Teaching in NYC (The Teacher Pathway Project--Boyd, Grossman, Lankford, Loeb, Wyckoff)
• Identifying Effective Teachers Using Performance on the Job (The Hamilton Project--Gordon, Kane, Staiger) LAUSD
• Everyone’s Doing It, But What Does Teacher Testing Tell Us About Teacher Effectiveness?—Dan Goldhaber, Univ of Washington and the Urban Institute.
• Illinois Education Research Council.• Louisiana Blue Ribbon Commission.

2005 by The Education Trust-West
#1. No matter how good teachers will eventually
become, they are NOT as good in their first year or two
of practice.Teacher effectiveness grows for at least 3-5 years. Growth
biggest from year 1 to 2.

2005 by The Education Trust-West
“…student performance increases as a result of increased experience over the first three or four years of experience, with little or no difference thereafter.”
Boyd, D., Grossman, P., Lankford, H., Loeb, P.,Wyckoff, J. (2005). How Changes in Entry Requirements Alter the Teacher Workforce and Affect Student Achievement. www.teacherpolicyresearch.org

2005 by The Education Trust-West
Source: Gordon, R., Kane, T.J., and Staiger, D.O. (2006). Identifying Effective teachers Using Performance on the Job. Washington, D.C.: The Brookings Institution.
Some Payoff for Experience

2005 by The Education Trust-West
Goldhaber: Gains in first few years. But “I find little
evidence of productivity gains associated with
experience beyond 5 years.

2005 by The Education Trust-West
#2. ROUTE OF ENTRY…
…doesn’t matter very much.

2005 by The Education Trust-West
LAUSD: 3 Pathways to Teaching
• Traditional;• Alternate;• Uncertified

2005 by The Education Trust-West
Source: Gordon, R., Kane, T.J., and Staiger, D.O. (2006). Identifying Effective teachers Using Performance on the Job. Washington, D.C.: The Brookings Institution.
Similar Effectiveness, Regardless of Certification

2005 by The Education Trust-West
“…in many cases, a teacher’s pathwaymakes little difference in the achievementof students…”“… the measured differences* are not largein magnitude…”
Boyd, D., Grossman, P., Lankford, H., Loeb, P.,Wyckoff, J. (2005). How Changes in Entry Requirements Alter the Teacher Workforce and Affect Student Achievement. www.teacherpolicyresearch.org

2005 by The Education Trust-West
Some nuances…
• Traditional a little better with younger children, especially in reading;
• Alternates a little better with older children, especially in math;
• Most differences in lower grades wash out by year 3.

2005 by The Education Trust-West
#3. Differences WITHIN each category, though, are huge.

2005 by The Education Trust-West
Effectiveness More Important
than Certification “The difference between the 75th
percentileteacher and the 50th percentile
teacher for all three groups of teachers was roughly five times as large as the difference between the average certified teacher and the average uncertified teacher.”Three groups = traditionally certified, alternatively certified, and uncertified
Gordon, R., Kane, T.J., and Staiger, D.O. (2006). Identifying Effective teachers Using Performance on the Job. Washington, D.C.: The Brookings Institution.

2005 by The Education Trust-West
Huge Differences in Teachers’ Effectiveness
An average student assigned to a bottomquartile teacher lost 5 percentile points
whilea demographically similar student with a
topquartile teacher gained 5 percentile
points.
Gordon, R., Kane, T.J., and Staiger, D.O. (2006). Identifying Effective teachers Using Performance on the Job. Washington, D.C.: The Brookings Institution.

2005 by The Education Trust-West
Source: Gordon, R., Kane, T.J., and Staiger, D.O. (2006). Identifying Effective teachers Using Performance on the Job. Washington, D.C.: The Brookings Institution.
10 Point Average Difference Between Top and Bottom
Teachers
2005 by The Education Trust-West
#4. There is some disagreement about whether
those differences can be predicted from measurable
teacher characteristics.

2005 by The Education Trust-West
Research pretty consistent about…
• Teacher test performance, especially verbal;
• Teacher content mastery, especially in higher grades;
Selectivity of undergraduate college also sometimes predictive. Race can be relevant, too.

2005 by The Education Trust-West
In NYC, Alternate Route Teachers much higher on all
these measures.Traditional
Teaching Fellow
Teach for America
Failed Gen. Knowledge Exam
16% 1.8% 0%
Score on LAST Test
246 267 275
From Highly Selective College
11% 44% 70%
% Black and Latino
20% 31% 23%

2005 by The Education Trust-West
But at least in NYC and LAUSD, the relationships between these things and
achievement not clear.

2005 by The Education Trust-West
Goldhaber: Clear positive effect of higher performance
on licensure exams, especially in mathematics.
But some false negs and false positives.

2005 by The Education Trust-West
Bottom Line: Improving the Value Added of Teacher
Force Has to be at Heart of Our Strategy.
2005 by The Education Trust-West
“Massive Impact”
“If the effects were to accumulate, having atop-quartile teacher rather than a bottomquartile teacher four years in a row would be:• enough to close the black-white test scoregap…; and,• Have twice the impact of reducing
class size from 22 to 16.”
Source: Gordon, R., Kane, T.J., and Staiger, D.O. (2006). Identifying Effective teachers Using Performance on the Job. Washington, D.C.: The Brookings Institution.

2005 by The Education Trust-West
Lastly, and what everyone will always want to talk about. . .
#6. Would more money help?

2005 by The Education Trust-West
Nation: Inequities in State and Local Revenue Per Student
Gap
High Poverty vs. Low Poverty Districts
-$907 per student
High Minority vs. Low Minority Districts
-$614 per student
Source: The Funding Gap, 2005. The Education Trust. Data are for 2003

2005 by The Education Trust-West
But how much more money will help depends on how wisely
we spend it.

2005 by The Education Trust-West
Some districts get more for less.

2005 by The Education Trust-West
Some districts that out-perform spend less
NAEP 2005 Grade 8 Math -Overall Scale Scores
220
230
240
250
260
270
280
290
Aus
tin
Cha
rlot
te
Bos
ton
San
Die
go
Hou
ston
New
Yor
k C
ity
Chi
cago
Los
Ang
eles
Cle
vela
nd
Atla
nta
Dis
tric
t of C
olum
bia
Ave
rag
e S
cale
Sco
re
Source: National Center for Education Statistics, http://nces.ed.gov/nationsreportcard/nde and Standard and Poor’s www.schoolmatters.com
$7,284
$7,132
$12,562
$8,311
$6,923
$11.920
$7,799
$8,283
$10,199
$11,312
$11,847

2005 by The Education Trust-West
In the end, it is about choices adults make.
At the Main, Achievement and Opportunity Gaps Come from Choices That Educators and Policymakers Make. Choices About:
- How Much to Spend on Whom. - What to Expect of Different Schools
and Students. - Choices Even About Who Teachers Whom. - Choices About How to Organize Classroom and Schools.

2005 by The Education Trust-West
The Education Trust-West510-465-6444
www.edtrustwest.org
The Education Trust202-293-1217
www.edtrust.org


