Download - 2009 Outlook Presentation

1Copyright 2008. The NPD Group, Inc. All Rights Reserved. This presentation is Proprietary and Confidential andmay not be disclosed in any manner, in whole or in part, to any third party without the express written consent of NPD.
2009 Aftermarket OutlookNovember 2008

$385 $493
52 wks ending 10/8/07 52 wks ending 10/6/08
Gallons: Gallons: --1.5% (2 Billion gallons less)1.5% (2 Billion gallons less)
28.1%28.1%IncreaseIncrease
$108 Billion$108 BillionIncreaseIncrease
Source: US Government and NPD Estimate
Estimated Gasoline Spending (Billions)
Consumers spent billions more on gasoline

61.6 61.2 59.3 57.7 53.4
2004 2005 2006 2007 1H08
Source: The NPD Group/ Motor Fuels Index
7.5%7.5%DecreaseDecrease
Consumer reported gallons have declined

Voice of the Consumer: Driving Patterns

5Copyright 2008. The NPD Group, Inc. All Rights Reserved. This presentation is Proprietary and Confidential andmay not be disclosed in any manner, in whole or in part, to any third party without the express written consent of NPD.
Driving PatternsNovember 2008

Gallons:
59.548.6
21.120.2
16.313.413.311.4
7.57.26.86.56.23.93.32.10.43.3
Drove less
Reduced/consolidated shopping trips
Avoided idling
Drove 55 mph or less
Cancelled vacation plans
Removed excess weight from the vehicle
Vacationed closer to home
Carpooled
Rode a bike or walked
Worked from home/telecommuted
Bought a more fuel efficient vechicle
Took public transportation (bus, train, etc.)
Worked closer to home
Sold my less fuel efficient vehicle
Worked less
Moved closer to work
Bought an electric/hybrid vehicle
Other
Driving and vehicle behavior has changed
QUESTIONConsidering the price of gasoline over the past year,
which of the following have you actually done?
Source: The NPD Group

Gallons:
11.4
7.5
7.2
6.5
6.2
3.3
2.1
Carpooled
Rode a bike or walked
Worked from home/telecommuted
Took public transportation (bus, train, etc.)
Worked closer to home
Worked less
Moved closer to work
Changing commute/travel method
Source: The NPD Group
QUESTIONConsidering the price of gasoline over the past year,
which of the following have you actually done?

Gallons:
59.5
48.6
Drove less
Reduced/consolidated
shopping trips
Changing Shopping Patterns
Source: The NPD Group
QUESTIONConsidering the price of gasoline over the past year,
which of the following have you actually done?

Gallons:
21.1
20.2
13.4
6.8
3.9
0.4
Avoided idling
Drove 55 mph or less
Removed excess weight from thevehicle
Bought a more fuel efficient vechicle
Sold my less fuel efficient vehicle
Bought an electric/hybrid vehicle
Increasing Fuel Efficiency
Source: The NPD Group
QUESTIONConsidering the price of gasoline over the past year,
which of the following have you actually done?

Gallons:
16.3
13.3
Cancelledvacation plans
Vacationed closerto home
Changing Vacation Plans
Source: The NPD Group
QUESTIONConsidering the price of gasoline over the past year,
which of the following have you actually done?

Behavioral change occurs around $3.00/Gallon
Gallons:
Annual Miles Driven and Gasoline Prices
Source: The NPD Group
0
50
100
150
200
250
300
350
400
450
Jan
-79
Jan
-80
Jan
-81
Jan
-82
Jan
-83
Jan
-84
Jan
-85
Jan
-86
Jan
-87
Jan
-88
Jan
-89
Jan
-90
Jan
-91
Jan
-92
Jan
-93
Jan
-94
Jan
-95
Jan
-96
Jan
-97
Jan
-98
Jan
-99
Jan
-00
Jan
-01
Jan
-02
Jan
-03
Jan
-04
Jan
-05
Jan
-06
Jan
-07
Jan
-08
Ce
nts
pe
r G
all
on
1,500
1,700
1,900
2,100
2,300
2,500
2,700
2,900
3,100Nominal Price Real Price Miles Driven

Voice of the Consumer: Gas Prices

Gallon Volume Trend suggests more mileage declines
Gallons:
Miles Driven and Gasoline Gallons (Pct. Change vs. Year Ago)
Source: The NPD Group
-7.00%
-6.00%
-5.00%
-4.00%
-3.00%
-2.00%
-1.00%
0.00%
1.00%
2.00%
3.00%
8/10/07
8/24/07
9/7/07
9/21/07
10/5/07
10/19/07
11/2/07
11/16/07
11/30/07
12/14/07
12/28/07
1/11/08
1/25/08
2/8/08
2/22/08
3/7/08
3/21/08
4/4/08
4/18/08
5/2/08
5/16/08
5/30/08
6/13/08
6/27/08
7/11/08
7/25/08
8/8/08
8/22/08
9/5/08
9/19/08
10/3/08
10/17/08
Miles Driven (Millions) PCYA Gasoline Gallons (PCYA)

Gasoline spending, driving patterns and economic pressure have taken their toll on automotive spending
Gallons:
Source: The NPD Group
-15.0%
-10.0%
-5.0%
0.0%
5.0%
10.0%
Jan
-06
Feb
-06
Ma
r-0
6
Ap
r-0
6
Ma
y-0
6
Jun
-06
Jul-
06
Au
g-0
6
Se
p-0
6
Oc
t-0
6
No
v-0
6
De
c-0
6
Jan
-07
Feb
-07
Ma
r-0
7
Ap
r-0
7
Ma
y-0
7
Jun
-07
Jul-
07
Au
g-0
7
Se
p-0
7
Oc
t-0
7
No
v-0
7
De
c-0
7
Jan
-08
Feb
-08
Ma
r-0
8
Ap
r-0
8
Ma
y-0
8
Jun
-08
Jul-
08
Au
g-0
8
Se
p-0
8
Percent Change vs. Year Ago
Dollar Volume Unit Volume
Monthly Auto Parts Channel Sales Trend

What can we learn from the coffee business?
Gallons:
Source: USDA and Starbucks Annual Reports
0
5
10
15
20
25
20
06
20
02
19
98
19
94
19
90
19
86
19
82
19
78
19
74
19
70
19
66
19
62
19
58
19
54
19
50
19
46
19
42
19
38
19
34
19
30
19
26
19
22
19
18
19
14
19
10
Co
ffe
e P
ou
nd
s P
er
Ca
pit
a
0.0
1.0
2.0
3.0
4.0
5.0
6.0
7.0
8.0
9.0
Sta
rbu
ck
s A
nn
ua
l R
ev
en
ue
(B
illio
ns)

16Copyright 2008. The NPD Group, Inc. All Rights Reserved. This presentation is Proprietary and Confidential andmay not be disclosed in any manner, in whole or in part, to any third party without the express written consent of NPD.
Vehicle OutlookNovember 2008

Voice of the Consumer: Vehicle Trends

15.7
10.6
17.2
11.2
Plan/Might purchase new vehicle Plan to purchase used vehicle
2007 2008
Gallons:
More consumers would like to purchase a vehicle in 2009
QUESTIONAre you planning to purchase a vehicle (new or used) in 2009?
Source: The NPD Group
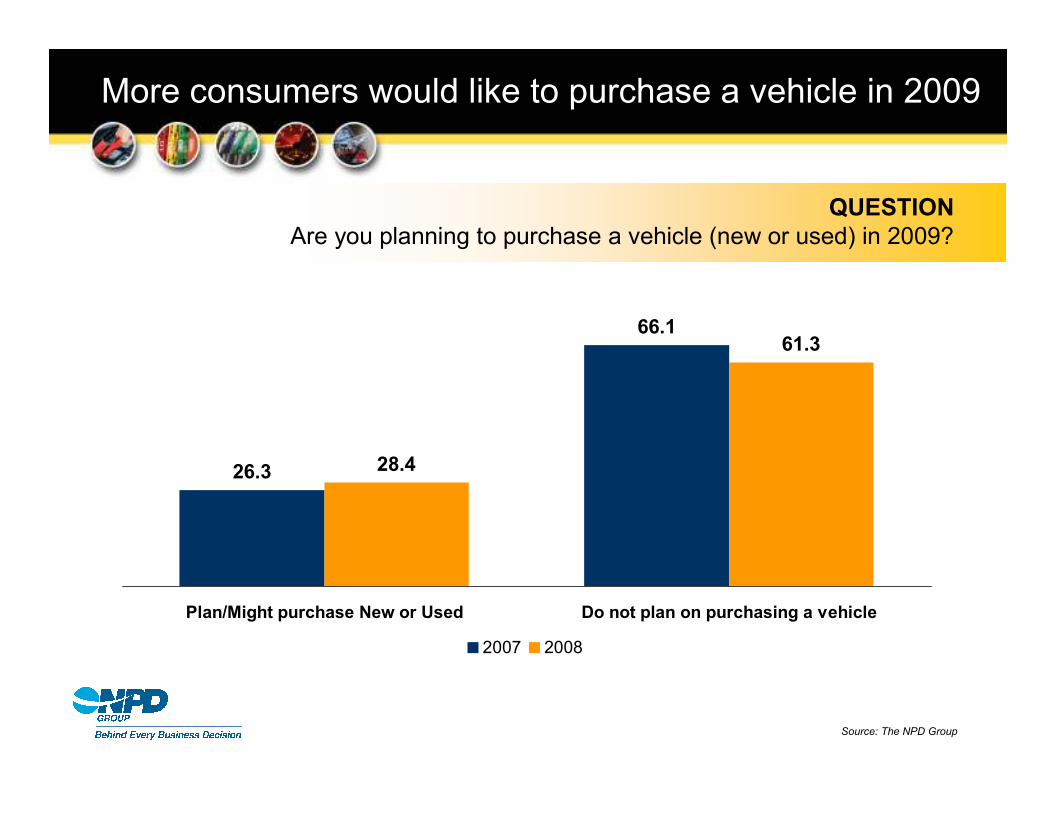
26.3
66.1
28.4
61.3
Plan/Might purchase New or Used Do not plan on purchasing a vehicle
2007 2008
Gallons:
More consumers would like to purchase a vehicle in 2009
QUESTIONAre you planning to purchase a vehicle (new or used) in 2009?
Source: The NPD Group

Gallons:
40.5
42.5
7.7
Yes
Possibly
No
Plan/Might buy New or Used
Fuel efficiency is driving vehicle purchase intent
QUESTIONAre you planning to purchase a more fuel efficient vehicle?
Source: The NPD Group

Gallons:
43.3
29.3
7.0
6.4
4.5
1.3
0.6
0.6
7.0
More fuel efficient car
Hybrid
More fuel efficient sport utility
More fuel efficient mini van/van
More fuel efficient truck
Smart car
Electric car
Motorcycle
Don't know
Plan to buy more efficient vehicle
Fuel efficiency is driving vehicle purchase intent
QUESTIONWhat type of fuel efficient vehicle will you purchase?
Source: The NPD Group

Vehicle sales trend is declining
Gallons:
Source: US Department of Commerce
New Vehicle Unit Sales
-40.0%
-30.0%
-20.0%
-10.0%
0.0%
10.0%
20.0%
30.0%
Jan
-05
Feb
-05
Ma
r-0
5A
pr-
05
Ma
y-0
5Ju
n-0
5Ju
l-0
5A
ug
-05
Se
p-0
5O
ct-
05
No
v-0
5D
ec
-05
Jan
-06
Feb
-06
Ma
r-0
6A
pr-
06
Ma
y-0
6Ju
n-0
6Ju
l-0
6A
ug
-06
Se
p-0
6O
ct-
06
No
v-0
6D
ec
-06
Jan
-07
Feb
-07
Ma
r-0
7A
pr-
07
Ma
y-0
7Ju
n-0
7Ju
l-0
7A
ug
-07
Se
p-0
7O
ct-
07
No
v-0
7D
ec
-07
Jan
-08
Feb
-08
Ma
r-0
8A
pr-
08
Ma
y-0
8Ju
n-0
8Ju
l-0
8A
ug
-08
Se
p-0
8
Percent Change vs. Year Ago
Passenger Cars Light Trucks/SUVs

Vehicle Trend Opportunities and Threats
� Opportunities
– Extend the life and/or enhance the performance of aging vehicles
– Improve Fuel Efficiency
� Threats
– Long term changes in the vehicle fleet

24Copyright 2008. The NPD Group, Inc. All Rights Reserved. This presentation is Proprietary and Confidential andmay not be disclosed in any manner, in whole or in part, to any third party without the express written consent of NPD.
Maintenance and Repair OutlookNovember 2008
Voice of the Consumer: Automotive Maintenance

Gallons:
56.4
37.4
22.5
15.9
12.2
8.7
8.3
7.1
6.5
5.6
3.7
3.6
2.7
1.5
30.0
Checked tire pressure
Changed air filter
Replaced fuel filter
Changed spark plugs
Changed oil more oftenUsed fuel additive to clean engine/improve
performance
Used a more premium oil in vehicle
Used oil additive or engine treatment
Used fuel additive to improve gas mileage
Changed oil less often
Replaced O2 sensor
Purchased a more premium grade of gasoline
Purchased a higher quality brand of gasoline
Other
None of these
Automotive Maintenance Behavior Has Changed
QUESTIONWhen thinking about automotive maintenance what changes have you made?
Source: The NPD Group

Auto parts store sales show consumer demand for fuel performance and efficiency
Gallons:
Source: The NPD Group/AAIM
Gasoline Spending and Complete Fuels System Cleaner Unit Sales
-20.00%
-10.00%
0.00%
10.00%
20.00%
30.00%
40.00%
50.00%
60.00%
Jul-
06
Au
g-0
6
Se
p-0
6
Oc
t-0
6
No
v-0
6
De
c-0
6
Jan
-07
Feb
-07
Ma
r-0
7
Ap
r-0
7
Ma
y-0
7
Jun
-07
Jul-
07
Au
g-0
7
Se
p-0
7
Oc
t-0
7
No
v-0
7
De
c-0
7
Jan
-08
Feb
-08
Ma
r-0
8
Ap
r-0
8
Ma
y-0
8
Jun
-08
Jul-
08
Au
g-0
8
Se
p-0
8
Percent Change vs. Year Ago
Gasoline Spending Avg Weekly Complete Fuels System Cleaner Sales

9.3
19.0
61.7
10.3
18.1
59.9
Yes Possibly No
2007 2008
Gallons:
Expectations for Repair is Steady in 2009
QUESTIONAre you planning to make major repairs in 2009?
Source: The NPD Group

6.9
20.4
69.0
12.1
21.4
62.8
Will do all repairs myself Will do some repairs myself Will have a professionalservice provider do all the
repairs
2007 2008
Gallons:
More Consumers Intend To Do Their Own Repair Work
QUESTIONWho will perform repair work in 2009?
Source: The NPD Group

19.3 17.1
60.0
8.1
23.9
64.4
Will do all repairs myself Will do some repairs myself Will have a professionalservice provider do all the
repairs
Vehicle Repair in 2009 - YES Vehicle Repair in 2009 - POSSIBLY
Gallons:
Among Those Who Say “Yes” They Will Make Major Repair in 2009, DIY Intentions Are Even Higher
QUESTIONWho will perform repair work in 2009?
Source: The NPD Group

96.4
16.2
1.8
5.4
5.4
2.7
0.9
4.5
3.6
91.5
21.5
2.3
2.3
1.5
1.5
1.5
0.8
0.8
Auto Parts Store
Mass Merchant
Convenience Store or GasStation
Warehouse Club
Home Improvement Store
Dollar Store
Drug Store
National Chains
Grocery Store
2007 2008Gallons:
Auto Parts Stores Remain The “Go To” Channel
QUESTIONWhere will DIY’ers shop for parts?
Source: The NPD Group

52.7
31.6
14.8
6.3
5.2
4.7
57.1
30.7
14.4
7.1
5.2
4.3
Repair Shop
Car Dealer
Tire Store
Auto Parts Store
Quick Lube
Mass Merchant
2007 2008
Trend Toward Repair Shops Will Continue
QUESTIONWhere will DIFM’ers go for service?
Source: The NPD Group

79.8
10.77.7
1.8
78.7
11.07.4
2.9
75.9
12.77.0 4.3
Miles Months Other Don't Know
2006 2007 2008
Most Consumers Look To The Odometer To Determine Oil Change Intervals
QUESTIONHow do you determine how often to change your oil?
Source: The NPD Group

41.4 42.244.5
2006 2007 2008
More Than 3,000
More Consumers Go Beyond 3,000 Miles
QUESTIONHow do you determine how often to change your oil?
Source: The NPD Group

50.7
58.2
66.4
2006 2007 2008
More Than 3 Months
More Consumers Go Beyond 3 Months
QUESTIONHow do you determine how often to change your oil?
Source: The NPD Group

63.859.4 58.6
30.733.4 35.4
2006 2007 2008
Yes No
Longer Intervals Are Reflected In Consumers Mind Set Too
QUESTIONDo you believe you should change oil every 3 months or 3,000 miles?
Source: The NPD Group

Repair and Maintenance Opportunities and Threats
� Opportunities
– Fuel efficiency message does motivate behavior
– Aging vehicle fleet could spur repair growth
– DIY minded consumers need your help
– Independent repair shops positioned for growth
� Threats
– Oil change intervals likely to grow

38Copyright 2008. The NPD Group, Inc. All Rights Reserved. This presentation is Proprietary and Confidential andmay not be disclosed in any manner, in whole or in part, to any third party without the express written consent of NPD.
Automotive Spending Outlook and Attitudes
November 2008

$1,711
$1,240
2007 2008
Average Estimated Total Spending
Consumers Expect To Spend Less
QUESTIONHow much will you spend on vehicles (excluding fuel) in 2009?
Source: The NPD Group

46.6
30.5
22.8
51.1
30.7
18.1
Less Than $500 $500 to $1,000 More Than $1000
2007 2008
Lower Spending Expectations Is Driven By Big Ticket Repairs
QUESTIONHow much will you spend on vehicles (excluding fuel) in 2009?
Source: The NPD Group

29.3 28.7
22.5 21.218.0
15.9 15.2 15.012.9
9.5 9.3
Automotive
accessories
Car
wash/wax
Air
fresheners
Gasoline
Wheels
Professional
repairs
Automotive
parts
Fuel/oil
additives
Tires
Motor oil
Antifreeze
Plan To Spend Less
Consumers Look To Reduce Discretionary Automotive Spending
QUESTIONConsidering current economic conditions do you plan to spend…
Source: The NPD Group

33.4
14.410.0 8.1 8.1
5.6 3.7 2.9 2.9 2.2 1.0
Gasoline
Motor oil
Tires
Fuel/oil
additives
Professional
repairs
Automotive
parts
Wheels
Antifreeze
Car
wash/wax
Automotive
accessories
Air
fresheners
Plan to Spend More
Some Consumers See Maintenance, Performance, and Repair As Money Well Spent
QUESTIONConsidering current economic conditions do you plan to spend…
Source: The NPD Group

51.8 49.743.4 42.8
38.634.2 30.7
23.816.5 15.4
Is reasonably
priced
Increases gas
mileage in
vehicle
Is made with
quality materials
Increases
engine
performance
Easy to install
or use
Cleans the
engine
Is better for the
air/environment
Made with
environmentally
friendly
materials
Made with
recyclable
materials
Enhances the
appearance of
the vehicle
% Very Important
Price, Performance, and Quality Define the Value Proposition
QUESTIONHow important are the following characteristics?
Source: The NPD Group

8.7
35.8
47.8
I purchase the least expensive product
available
I purchase the product that has the highest
quality and will last the longest, even if it
costs a little more
I purchase the product that will make my car
perform its best
Automotive Parts
Reflects a Change Due to Economy/Gas Prices
13.8%
Price Is Secondary to Fit, Function, and Quality When It Comes To Parts
QUESTIONWhich statement best reflects your purchase behaviors?
Source: The NPD Group

13.4
27.3
52.9
I purchase the least expensive product
available
I purchase the product that has the highest
quality and will last the longest, even if it
costs a little more
I purchase the product that will make my car
perform its best
Automotive Maintenance Products
Price Is More A Factor In Maintenance, But Still Secondary To Performance
QUESTIONWhich statement best reflects your purchase behavior?
Source: The NPD Group
Reflects a Change Due to Economy/Gas Prices
16.7%

27.4
20.8
28.4
I purchase the least expensive product
available
I purchase the product that has the highest
quality and will last the longest, even if it
costs a little more
I purchase the product that will make my car
perform its best
Appearance and Accessories
Appearance and Accessory Consumers Are More Focused On Price
QUESTIONWhich statement best reflects your purchase behavior?
Source: The NPD Group
Reflects a Change Due to Economy/
Gas Prices
18.0%

39.2
14.2
43.4
I purchase the least expensive product
available
I purchase the product that has the highest
quality and will last the longest, even if it
costs a little more
I purchase the product that will make my car
perform its best
Gasoline
Price and Performance Polarization Define Gasoline Consumers
QUESTIONWhich statement best reflects your purchase behavior?
Source: The NPD Group
Reflects a Change Due to Economy/Gas Prices
34.6%

12.7
16.1
39.2
I purchase the least expensive product
available
I purchase the product that has the highest
quality and will last the longest, even if it
costs a little more
I purchase the product that will make my car
perform its best
Fuel/Oil Additives
Performance Is The Driver For Additive Sales
QUESTIONWhich statement best reflects your purchase behavior?
Source: The NPD Group
Reflects a Change Due to Economy/Gas Prices
21.1%

Automotive Spending Opportunities and Threats
� Opportunities
– Maintenance and minor repairs will be money well spent
– Performance, quality, and efficiency value proposition resonates
– Differentiation is key
• Price/value
• Quality/performance
� Threats
– Consumers look to forego items viewed as discretionary

Final Thoughts
� Keys to growth in a challenging economic environment
– Differentiated product
• Performance
• Quality
• Value
– Differentiated Purchase Experience

51
Thank You
David Portalatin
Director of Industry Analysis
The NPD Group
713-576-5126


