2012 Applied Demography ConferenceSession 2C
Julien Bérard-ChagnonDemography Division
Statistics Canada
Monday, January 9, 2012
Using tax data to estimate the number of families and
households in Canada

Statistics Canada • Statistique Canada2
Context
Households (HHs) estimates are used in the calibration of many of Statistics Canada’s surveys
Census families (CFs) estimates are released yearly
Limitations in previous methodologies fuelled the need to develop a new, integrated methodology
3
Plan of the presentation
Concepts Previous methodologies T1 Family File (T1FF) New methodology Comparisons Concluding remarks
Statistics Canada • Statistique Canada

Statistics Canada • Statistique Canada4
Concepts
Census families• Married or common-law couple • Lone-parent family
Households• Person or a group of persons who occupy the same
dwelling

Statistics Canada • Statistique Canada5
Previous methodologies
Census families• Number : Component-cohort approach• Characteristics : extrapolation based on previous
censuses
Households• Headship ratios based on previous censuses
Significant limitations

6
T1 Family File (T1FF)
T1 income tax data from the Canada Revenue Agency (CRA)
Aims at recreating Canadian population and families with tax data
Produced yearly since 1982 Very good coverage Contains basic demographic information
Statistics Canada • Statistique Canada
7
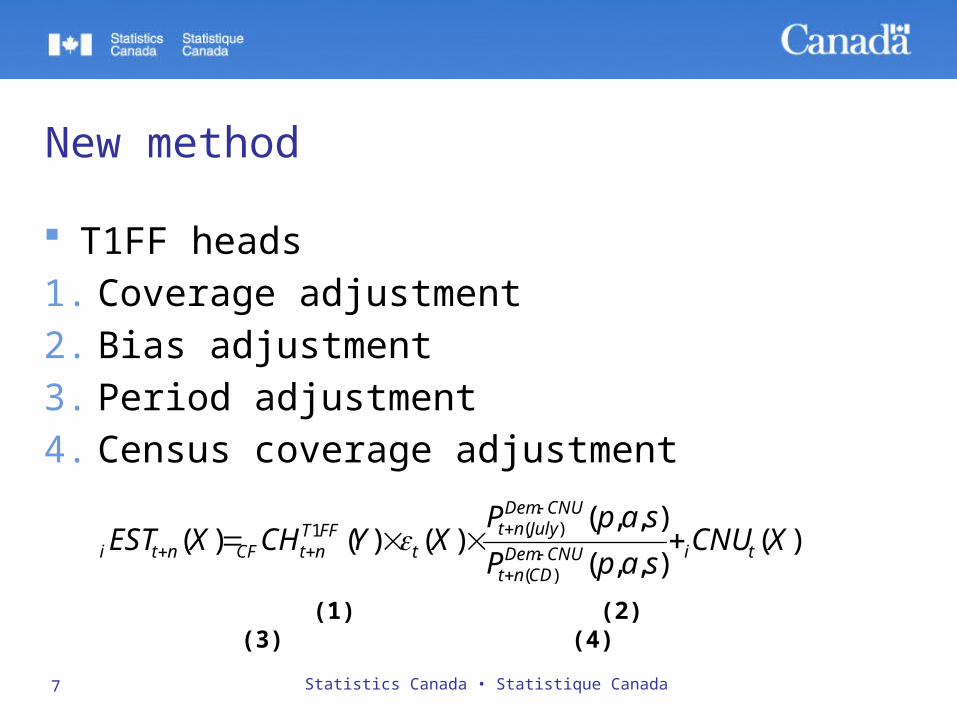
New method
T1FF heads
1. Coverage adjustment
2. Bias adjustment
3. Period adjustment
4. Census coverage adjustment
Statistics Canada • Statistique Canada
)(),,(
),,()()()(
.)(
.)(1 XCNU
sapP
sapPXYCHXEST tiCNUDem
CDnt
CNUDemJulynt
tFFTntCFnti
(1) (2) (3) (4)
8
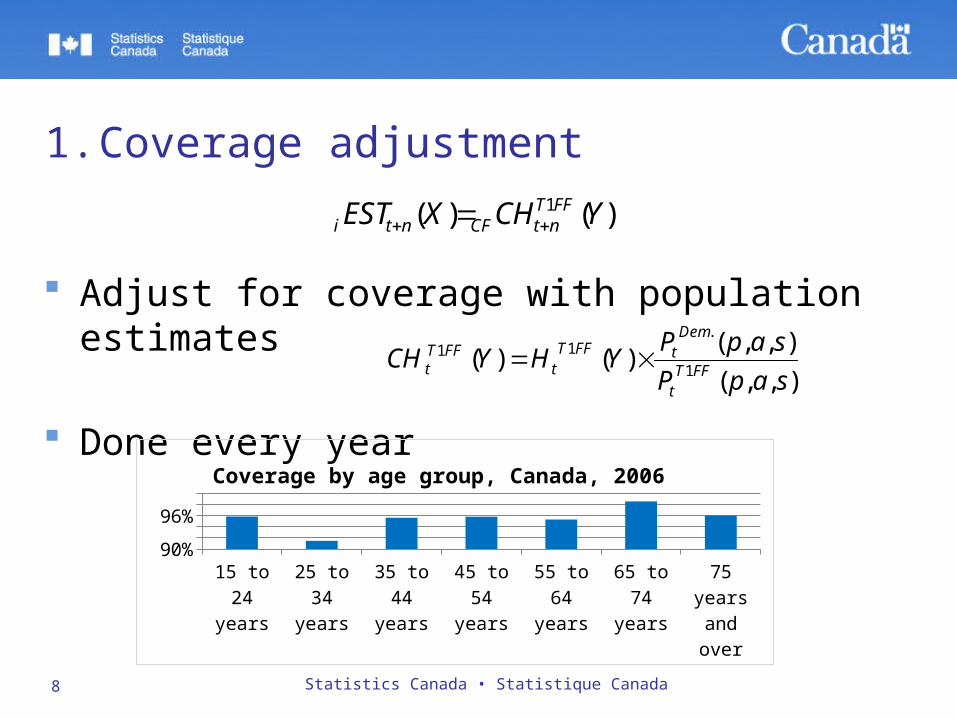
1. Coverage adjustment
Adjust for coverage with population estimates
Done every year ),,(
),,()()( 1
.11
sapP
sapPYHYCH FFT
t
DemtFFT
tFFT
t
Statistics Canada • Statistique Canada
15 to 24 years
25 to 34 years
35 to 44 years
45 to 54 years
55 to 64 years
65 to 74 years
75 years and over
90%
94%
98%
Coverage by age group, Canada, 2006
)()( 1 YCHXEST FFTntCFnti
9
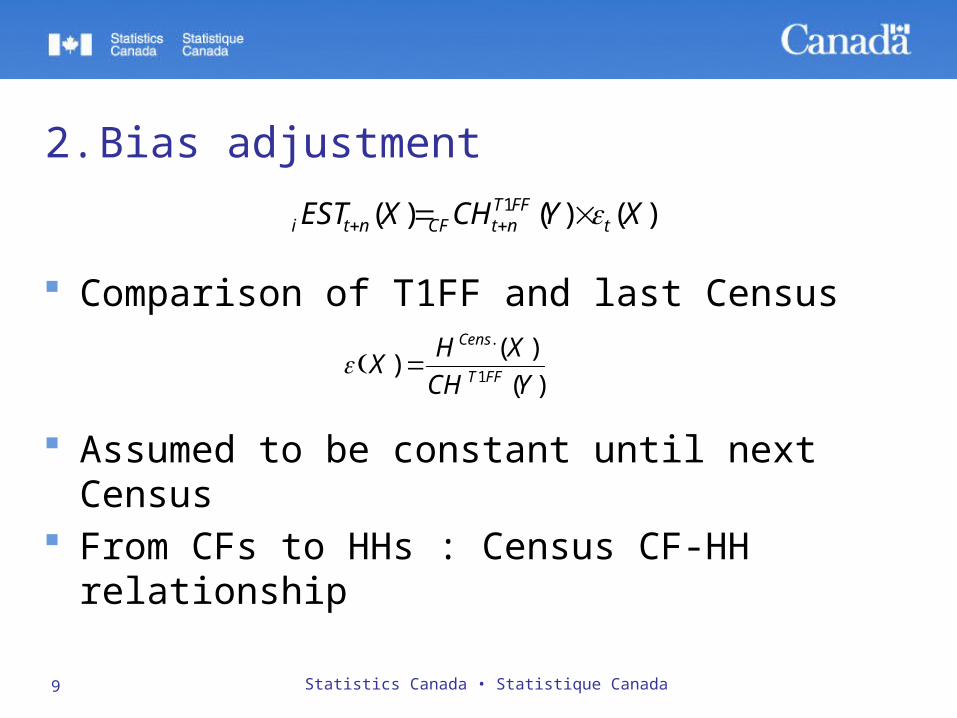
2. Bias adjustment
Comparison of T1FF and last Census
Assumed to be constant until next Census From CFs to HHs : Census CF-HH relationship
)(
)()
1
.
YCH
XHX
FFT
Cens
Statistics Canada • Statistique Canada
)()()( 1 XYCHXEST tFFTntCFnti

10
3. Period adjustment
Desired date of reference : July 1st
date of reference : Census Day (CD) Headship ratios
• Exclusion of Census net undercoverage (CNU) from population estimates
)()(1 XYCH FFTnt
Statistics Canada • Statistique Canada
),,(
),,()()()(
.)(
.)(1
sapP
sapPXYCHXEST
CNUDemCDnt
CNUDemJulynt
tFFTntCFnti

11
4. Census coverage adjustment
Method uses Census coverage studies to estimate CF net undercoverage• HH net undercoverage is obtained with Census ratios
Assumed to be constant until next Census• 2006 : around 150,000 CFs and 335,000 HHs
Statistics Canada • Statistique Canada
)(),,(
),,()()()(
.)(
.)(1 XCNU
sapP
sapPXYCHXEST tiCNUDem
CDnt
CNUDemJulynt
tFFTntCFnti
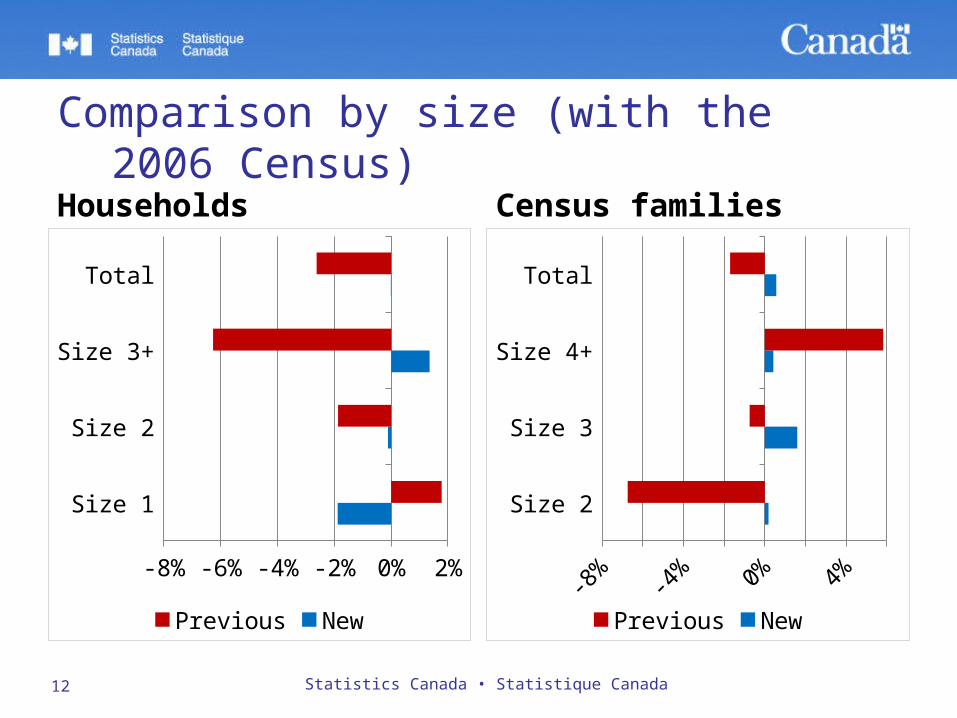
Comparison by size (with the 2006 Census)
Households
Size 1
Size 2
Size 3+
Total
-8% -6% -4% -2% 0% 2%
Previous New
Census families
Size 2
Size 3
Size 4+
Total
-8%-6%-4%-2% 0% 2% 4% 6%
Previous New
12 Statistics Canada • Statistique Canada
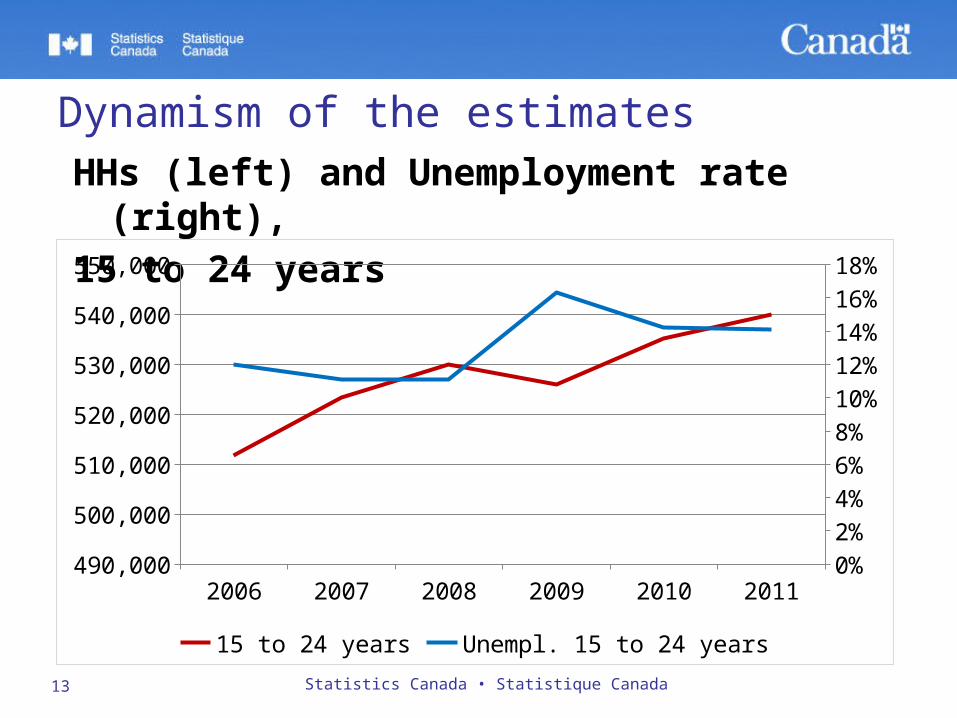
Dynamism of the estimates
Statistics Canada • Statistique Canada13
HHs (left) and Unemployment rate (right),
15 to 24 years
2006 2007 2008 2009 2010 2011495,000500,000505,000510,000515,000520,000525,000530,000535,000540,000545,000
0%
2%
4%
6%
8%
10%
12%
14%
16%
18%
15 to 24 years Unempl. 15 to 24 years
14
Concluding remarks
New method based on tax data Internal consistency between CFs and HHs Dynamic estimates Better results
Statistics Canada • Statistique Canada

15
Questions or comments ?
You can consult our population and family estimation methods:• Internet : www.statcan.gc.ca
Contact us :• Client Services:
1-866-767-5611• Email :
[email protected] Thank you very much ! Merci beaucoup !
Statistics Canada • Statistique Canada


