
2012 Market Review
Speed Retirement SystemJanuary 4, 2012
The fibonacci sequenceis derived by adding1 + 2 and adding the
result to the last number.ie, 1+2=3, 3+2= 5, 5+3 =8, etc

The end result it that you geta numerical relationship between
the numerical sequence thatsome traders feel have significance
in the marketplace.
The main fib numbers are23.6%, 38.2%,
61.8% and 100%There are two other levels
at 76.4 & 78.6%
The expectation is that pricewill hold support (or resistance)
at one of these percentages.

I’m not going to go intoa lot of detail on the fibonacci
sequence because youcan google it and find
an incredible amount ofinformation on the subject.
The other way the fib numbersare used are to predict price
extensions. The commonfib extensions are …
1, 125%, 161.8% & 261.8%
Ok, so how do you use this?
One way to use the fib #’sare to see where you expect
the market to stop afteran impulse move.
(either up or down)
For example, after a stockmoves up and begins to
correct, you wouldexpect the downmove
correction to stop at either23.6%, 38.2%, 61.8% or 100%
of the last upmove.
The depth of the correctionwill give you a clue as to
to the strength ofthe last upmove.
For example, a correctionthat stops at under 50%
is considered strong.
Likewise, a stock that movesup (or down) less than
100% of that last impulse moveis thought to be
weakening.

Remember, this worksfor both upmoves,
as well as downmoves.

I don’t want you to thinkthat this is the holy grail,but it can give you clues
at to what you expectthe price action to do.

Let’s look at somereal world examples.

For those of you whowere members when
Speed Retirementstarted back in April of 2010,
you will rememberthat I was looking for amarket top last April.

This is why …


Let’s look at arecent example …

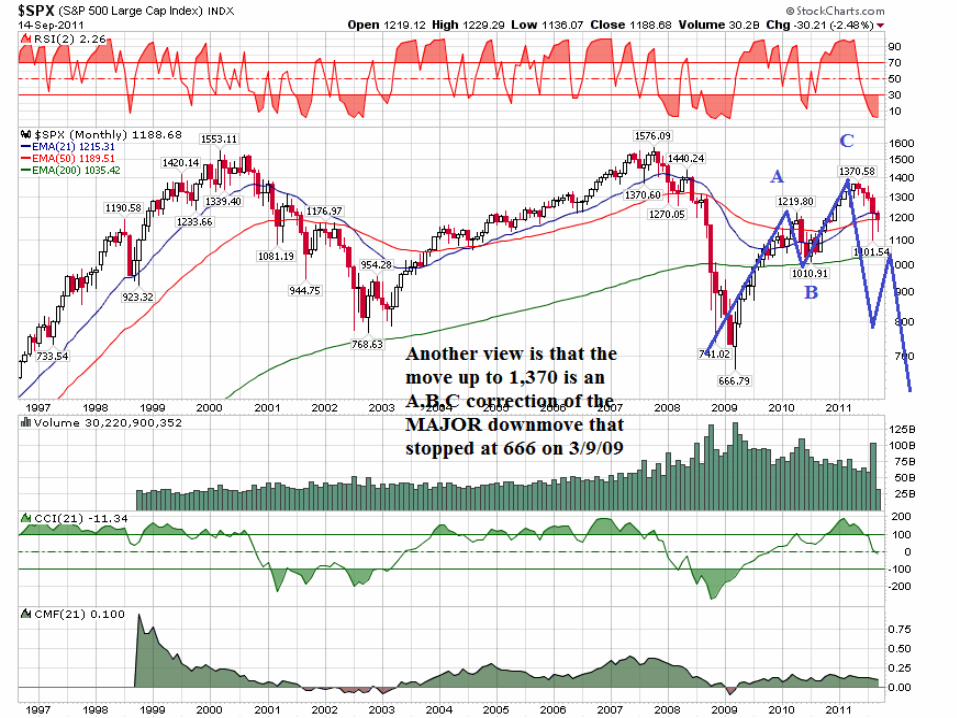
This is a 5 year monthly chart of the S & P 500 Index …

I like to use the fib levelsin conjunction with
price bars. As you cansee, the 61.8% level
is VERY powerful!

Let’s look at the Top of theMarket on May 2, 2011

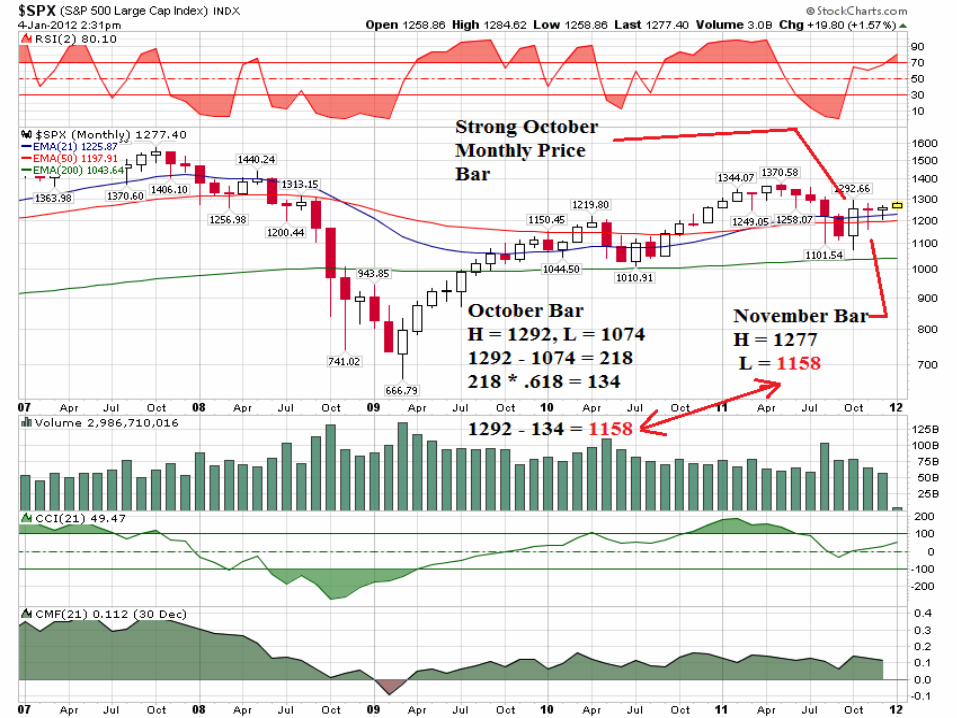
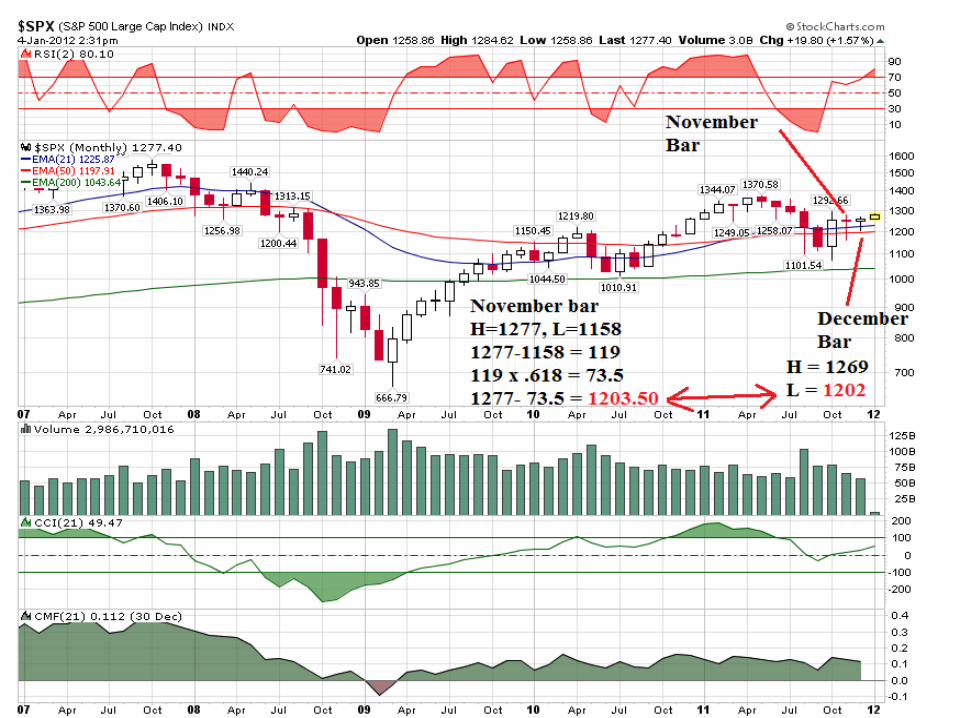
Let’s look at the MonthlyPrice formation on the
S & P 500

S & P 500Price & Time
Projection
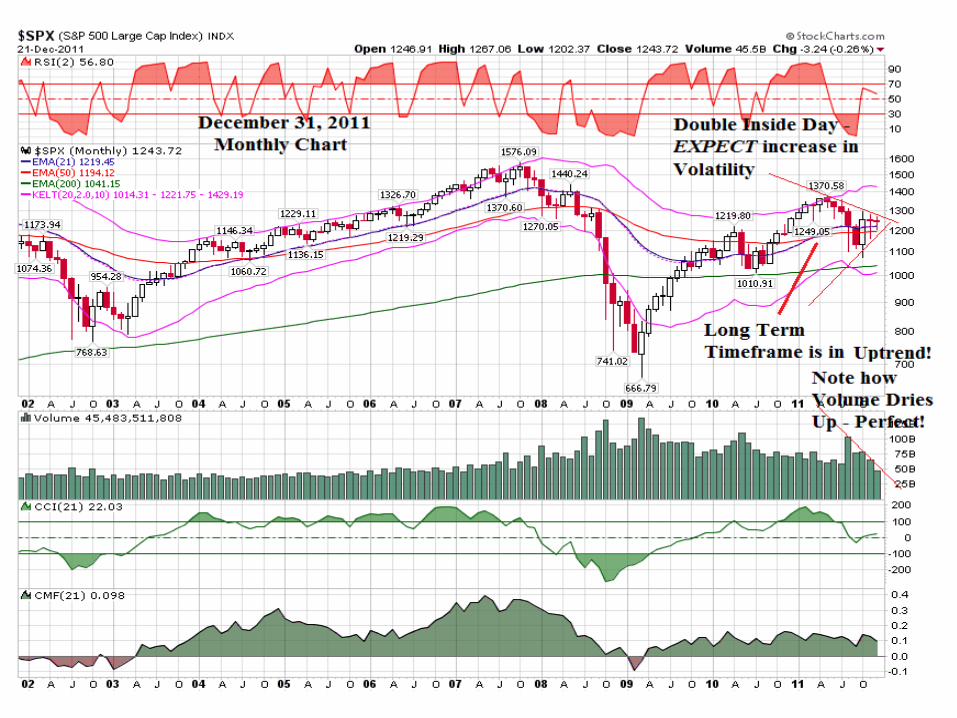
We know that based onthe Double inside day
formation on the monthlycharts for the S & P 500, we
expect a big move afterthe high or the low is
taken out.
I’ve shown these chartsbefore, but these are
the two possible scenariosthat can happen.

Scenario 1:
Scenario 2:


What conditions wouldconfirm either pattern?Pattern 1: Bear Market-
a) Low at 1010 taken outb) the 21 ema to cross
under the 50 ema (at least)Pattern 2: Bull Market-
a) A few closes above thehigh of the inside day, andb) preferable a close above
the October high
I know, but even duringthe big bear market of
2007 to 2009, the 21 emadid not cross under the50 ema until it cost you
a lot of money!
Ok, so let’s shorten upthe ema’s on themonthly charts …

Let’s project where themarket could go assuming
the “C” point isconfirmed at the
October Low of 1074.
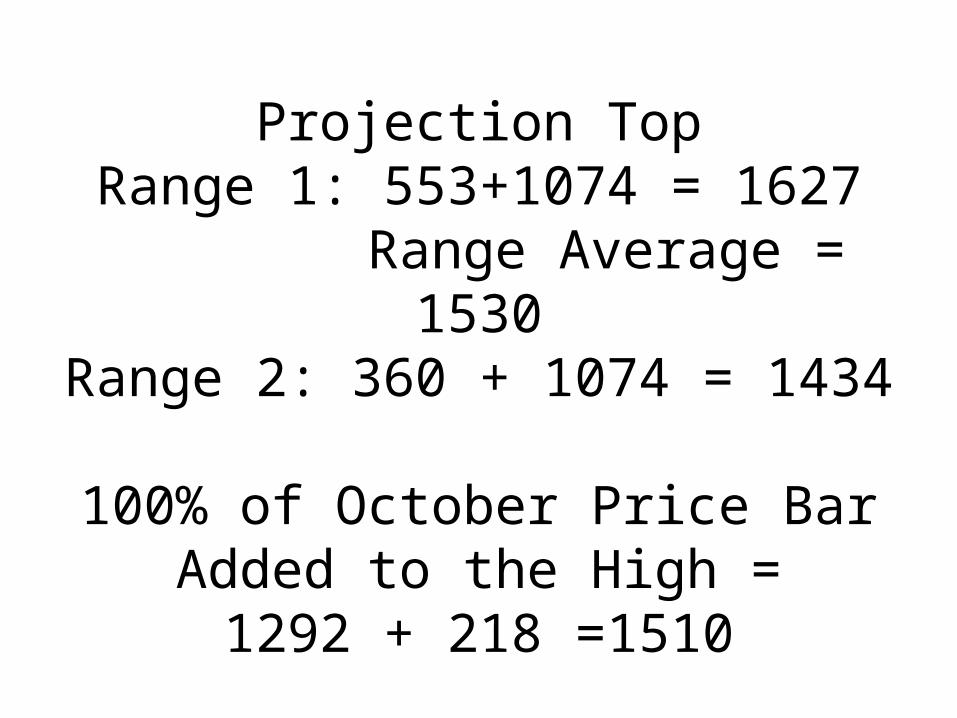
Projection TopRange 1: 553+1074 = 1627 Range Average = 1530Range 2: 360 + 1074 = 1434
100% of October Price BarAdded to the High =1292 + 218 =1510
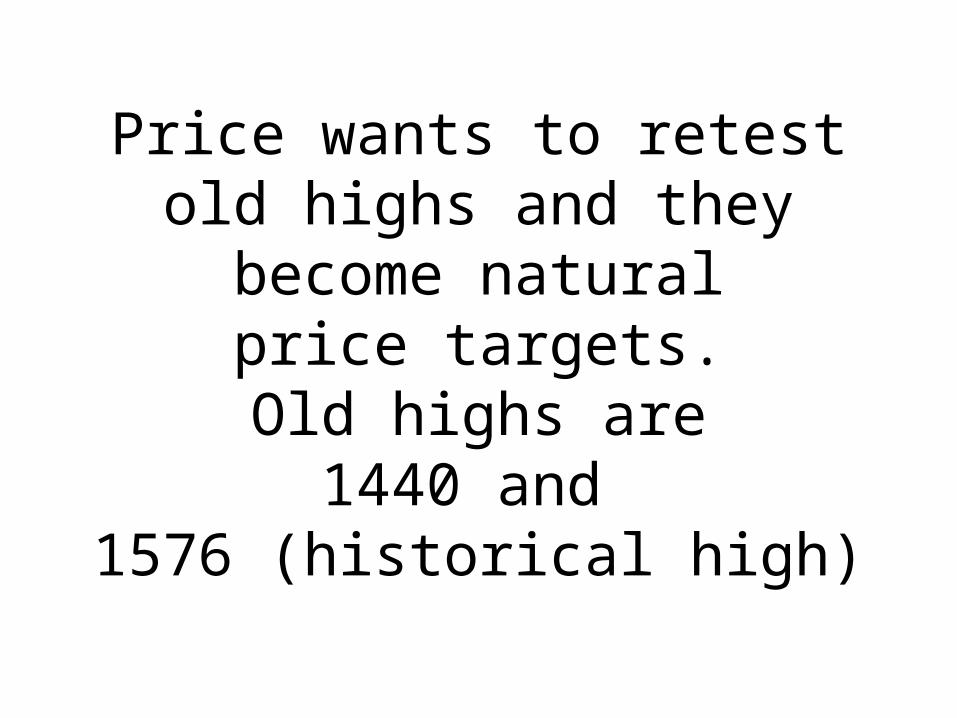
Price wants to retestold highs and they
become naturalprice targets.Old highs are
1440 and 1576 (historical high)
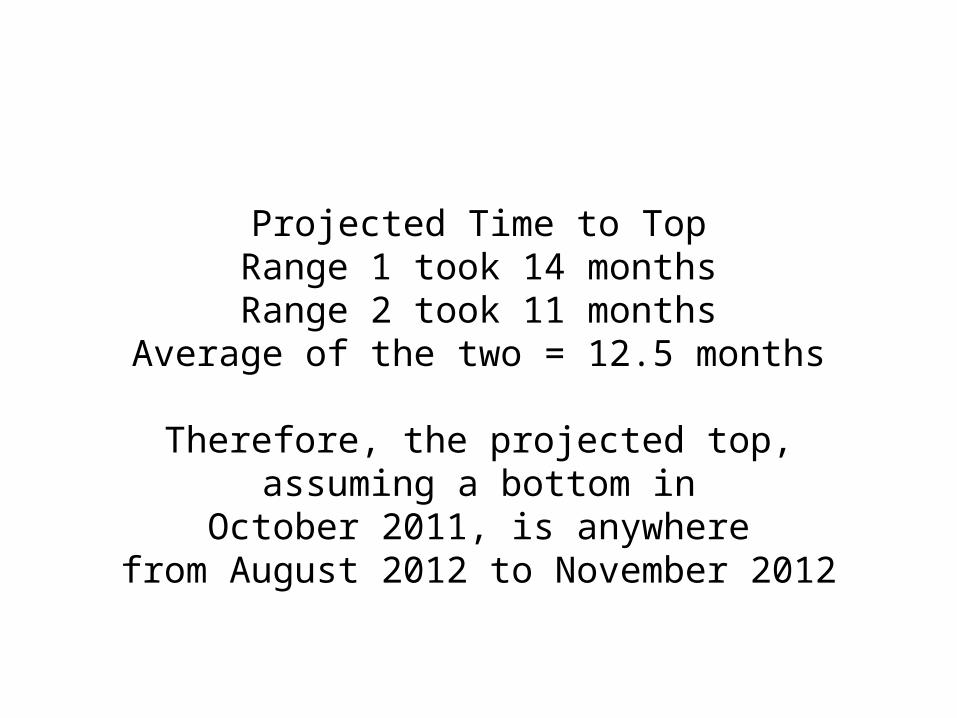
Projected Time to TopRange 1 took 14 monthsRange 2 took 11 months
Average of the two = 12.5 months
Therefore, the projected top,assuming a bottom in
October 2011, is anywherefrom August 2012 to November 2012

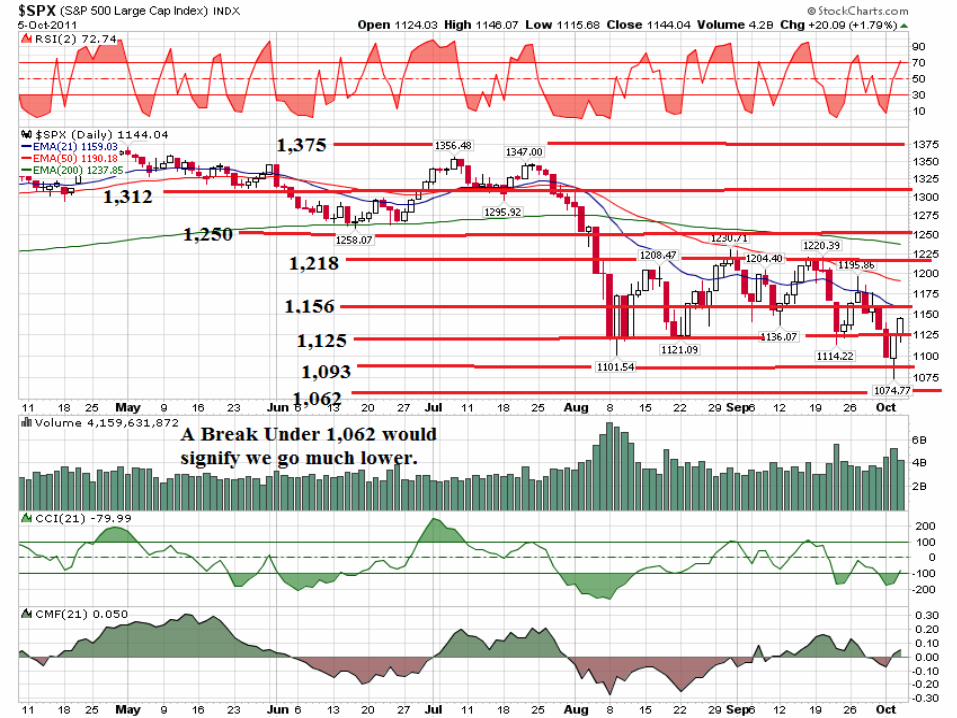
Upside resistance is at 1312.After that, the next major
resistance line is 1375.
1437.50 is a key line onthe upside. I don’t expectwe take that out the first
time up.Support lines are at 1250
and then at 1218.

This is from the October 5, 2010
State of the MarketPresentation.
Let’s look at sentiment& % of Stocks above
their 200 Day moving average.

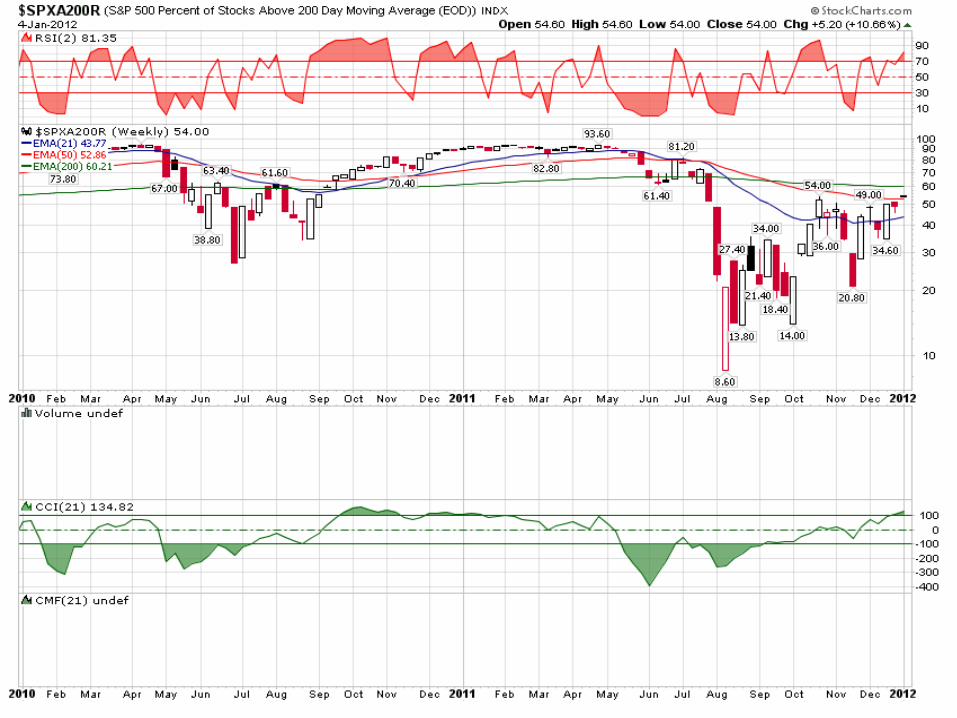
I don’t know if wewill get a generational
correction, like theone that ended on
March 9, 2009,but we will have
opportunity!
Buying at the generationalbottom in March 2009,
afforded untold opportunity.Look at VCI, PCLN, GMCR, F,
CAT, ARCC, LULU, CMG
Thanks for Watching!
Speed Retirement SystemJanuary 4, 2012


