
2013 Final Water Transfer Report
———— Prepared for
Glenn-Colusa Irrigation District
May 2014
550-00-13-03


Table of Contents
i Glenn-Colusa Irrigation District May 2014 2013 Final Water Transfer Report N\C\550\00-13-03\WP\BK_Water Transfer Report
1.0 Introduction ....................................................................................................................................... 1 Purpose ...................................................................................................................................... 1 1.1 Background ................................................................................................................................ 1 1.2 Water Transfer Authorization ..................................................................................................... 1 1.3 Scope ......................................................................................................................................... 1 1.4
2.0 Project Description ........................................................................................................................... 1
3.0 Monitoring Network ........................................................................................................................... 4 Groundwater Production Monitoring .......................................................................................... 4 3.13.1.1 Methods ............................................................................................................................ 4 3.1.2 Frequencies ...................................................................................................................... 4
Power Consumption Monitoring ................................................................................................. 7 3.23.2.1 Methods ............................................................................................................................ 7 3.2.2 Frequencies ...................................................................................................................... 7
Groundwater Level Monitoring ................................................................................................... 7 3.33.3.1 Methods ............................................................................................................................ 7 3.3.2 Frequencies ...................................................................................................................... 8
Water Quality Monitoring ........................................................................................................... 8 3.43.4.1 Methods ............................................................................................................................ 8 3.4.2 Frequencies ...................................................................................................................... 8
4.0 Project Results.................................................................................................................................. 8 Groundwater Production ............................................................................................................ 8 4.1 Water Levels .............................................................................................................................. 9 4.24.2.1 Production Wells ............................................................................................................... 9 4.2.2 Observation Wells Screened from Zero to 200 Feet Deep ............................................ 11 4.2.3 Observation Wells Screened from 200 to 700 Feet Deep .............................................. 11 4.2.4 Observation Wells Screened from 700 to 1,400 Feet Deep ........................................... 12 4.2.5 Regional Water Level Trends ......................................................................................... 13
Water Quality ........................................................................................................................... 13 4.3
5.0 Conclusions .................................................................................................................................... 13
6.0 References ..................................................................................................................................... 16
List of Appendices
Appendix A: Field Data Sheets
Appendix A.1: Water Production Field Data Sheets
Appendix A.2: Power Meter Field Data Sheets
Appendix A.3: Water Quality and Water Level Field Data Sheets
Appendix B: DWR Seller Groundwater Data Forms
Appendix C: Groundwater Level Hydrographs
Appendix D: Groundwater Level Contour Maps
Appendix E: DWR Change in Groundwater Elevation Maps, Spring 2013 to Spring 2014

Table of Contents
ii Glenn-Colusa Irrigation District May 2014 2013 Final Water Transfer Report N\C\550\00-13-03\WP\BK_Water Transfer Report
List of Tables
Table 1. Well Construction Details ......................................................................................................... 5
Table 2. Groundwater Production Results, ac-ft .................................................................................... 9
Table 3. Production Well Water Levels ................................................................................................ 10
Table 4. Average Change in Groundwater Elevation, Spring 2013 to Spring 2014 ............................. 13
List of Figures
Figure 1. Location Map ........................................................................................................................... 2
Figure 2. Site Map .................................................................................................................................. 3
Figure 3. Monitoring Network ................................................................................................................. 6
Figure 4. GCID Production Well Depth to Groundwater....................................................................... 10
Figure 5. Production Well Specific Conductance ................................................................................. 14

2013 Final Water Transfer Report
1 Glenn-Colusa Irrigation District May 2014 2013 Final Water Transfer Report N\C\550\00-13-03\WP\BK_Water Transfer Report
1.0 INTRODUCTION
Purpose 1.1
The purpose of this 2013 Final Water Transfer Report (report) is to document the groundwater-substitution water transfer (water transfer) conducted by Glenn-Colusa Irrigation District (GCID) in the summer of 2013, and to evaluate the effects of the water transfer on local groundwater and surface water conditions. GCID pumped groundwater from July to September 2013 to make water available for transfer to the San Luis & Delta Mendota Water Authority (SLDMWA). Groundwater was pumped in lieu of diverting surface water under its pre-1914 water right and its Settlement Contract No. 14-06-200-855A-R-1 with the United States Bureau of Reclamation (USBR).
Background 1.2
GCID is located in the northern Sacramento Valley, approximately 80 miles north of Sacramento, California (Figure 1). GCID’s service area covers approximately 175,000 acres.
Water Transfer Authorization 1.3
The groundwater substitution water transfer was performed pursuant to State of California Department of Water Resources (DWR) State Water Project Analysis Office (SWPAO) 2013 Transfer Water Agreement #13-710 (SWPAO, 2013), entered into by GCID, SLDMWA, and DWR. The agreement allowed a gross amount of 5,000 acre-feet (ac-ft), or net amount of 4,400 ac-ft, of water to be transferred from GCID to SLDMWA between July 1, 2013 and September 30, 2013.
Scope 1.4
This report satisfies the requirements of the Groundwater Pumping, Monitoring and Reporting Plan (MRP) (GCID, 2013) included as an exhibit in 2013 Transfer Water Agreement #13-710. The report documents groundwater production and groundwater monitoring activities performed in support of the water transfer. All groundwater production, groundwater level, and groundwater quality data collected during the water transfer is included in the report. Additionally, the pre-transfer and post-transfer groundwater level monitoring data has been incorporated, so each well dataset spans from March 2013 through March 2014. The report also evaluates the effects of the water transfer on nearby groundwater and surface water supplies and local groundwater users.
2.0 PROJECT DESCRIPTION
From July 1, 2013 to September 25, 2013, GCID performed a groundwater substitution water transfer by pumping groundwater from five production wells located within the GCID service area. Production well locations are displayed on Figure 2. The point of transfer, located at River Mile 206 near GCID’s Hamilton City Pump Station, is also displayed on Figure 2. The points of discharge for the pumped groundwater are located in the GCID Main Canal, adjacent to each production well. The places of use for groundwater pumped during the water transfer were locations within the GCID service area.

0 2010
Miles
LEGEND
GCID Service Area
Last Saved: 5/2/2014 3:11:23 PM bkaasa; N:\Clients\550 Glenn-Colusa Irrigation District\00-13-03 Wtr Tran Monitor & Report\GIS\Figures\Figure 1 Location Map.mxd
FIGURE 1Glenn-Colusa Irrigation District
2013 Final Water Transfer Report
LOCATION MAP

"6
"6
"6
"6
"6
#0GCID 1
GCID 2
GCID 3
GCID 4
GCID 5(Jacinto)
DiversionPoint
0 10.5
Miles
LEGEND
GCID Service Area
GCID Main Canal
"6 GCID Production Well
#0 Water Transfer Diversion Point
Last Saved: 5/6/2014 10:38:02 AM bkaasa; N:\Clients\550 Glenn-Colusa Irrigation District\00-13-03 Wtr Tran Monitor & Report\GIS\Figures\Figure 2 Site Map.mxd
Note:1. Water pumped from all production wells wasdischarged directly into the GCID Main Canal.
FIGURE 2Glenn-Colusa Irrigation District
2013 Final Water Transfer Report
SITE MAP

2013 Final Water Transfer Report
4 Glenn-Colusa Irrigation District May 2014 2013 Final Water Transfer Report N\C\550\00-13-03\WP\BK_Water Transfer Report
GCID pumped groundwater to make water available for transfer to SLDMWA in lieu of diverting surface water under its pre-1914 water right and its Settlement Contract No. 14-06-200-855A-R-USBR. The gross volume of water pumped was 5,000 ac-ft. An assumed depletion loss of 12 percent, or 600 ac-ft, was applied to the total volume pumped, resulting in a net amount of 4,400 ac-ft of transferred water.
During the water transfer, GCID collected pumping volume, pumping rate, power usage, water level, and water quality data from the production wells. Additional groundwater level data was obtained from DWR’s California Statewide Groundwater Elevation Monitoring (CASGEM) online database.
3.0 MONITORING NETWORK
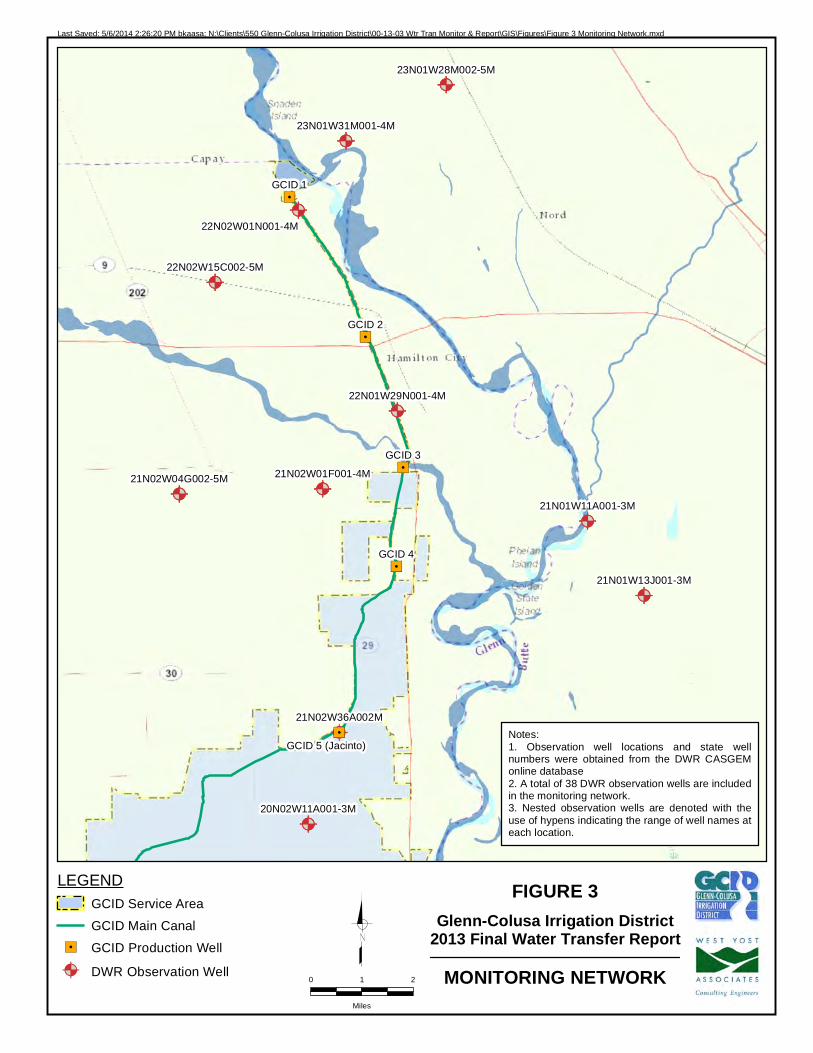
The monitoring network is displayed on Figure 3 and listed in Table 1. Table 1 also includes well construction details for the wells in the monitoring network. The monitoring network consists of the five GCID production wells and a total of 39 DWR observation wells. The 39 DWR observation wells are primarily nested monitoring wells, with up to four different wells at each site varying with depth. As seen on Figure 3, there are 12 observation well locations for the 39 observation wells. Please note that monitoring well 21N01W24B001M was only monitored four times by DWR during the transfer monitoring period. Therefore, it is not included in the report analysis; however, the groundwater level data was included in Appendix B.
Groundwater Production Monitoring 3.1
3.1.1 Methods
Flow meters installed at each production well were used to measure instantaneous flow rate and total cumulative volume pumped during the water transfer. Prior to beginning the water transfer, a State of California Licensed Professional Engineer certified that each flow meter was properly installed and calibrated. The initial flow totalizer value for each flow meter was recorded before pumping began. During pumping, GCID recorded the instantaneous flow rate in gallons per minute and cumulative volume pumped in ac-ft from each flow meter. Total volume pumped was calculated by subtracting the initial flow totalizer value from the most recently recorded value up to the cessation of transfer pumping. This production data was recorded on field data sheets included in Appendix A.1 and subsequently transferred electronically to the DWR Seller Groundwater Data Form, which comprises Appendix B.
3.1.2 Frequencies
As required by the MRP, water production data from the GCID production wells was obtained at a minimum weekly frequency during the water transfer period. Instantaneous flow rate and total volume pumped were reported monthly to the appropriate review contacts identified in Article 21.a-b and the Glenn County Department of Agriculture Water Resource Coordinator, Lisa Hunter, per Article 4.e of the Water Transfer Agreement (SWPAO, 2013).

Well Name State Well Number Latitude LongitudeTotal Depth,
feetScreened Interval(s),
feet bgsTotal Screen Length, feet
Reference Point Elevation, feet mean sea level
Power Source
GCID 1 22N02W02J001M 39.7873 -122.0494 1,320800 to 820, 840 to 870,
900 to 1,240, 1,270 to 1,300420 164.00 Electric
GCID 2 22N01W19K005M 39.7474 -122.0219 1,250 920 to 1,230 310 154.21 ElectricGCID 3 21N01W05D001M 39.7099 -122.0080 1,248 782 to 1,228 446 150.70 ElectricGCID 4 21N01W31H001M 39.6821 -122.0115 1,261 799 to 1,241 442 143.89 ElectricGCID 5 (Jacinto) 21N02W36A001M 39.6351 -122.0329 720 190 to 500, 600 to 710 420 134.70 Electric
20N02W11A001M 20N02W11A001M 39.6087 -122.0456 90 70 to 90 20 125.90 NA(b)
20N02W11A002M 20N02W11A002M 39.6087 -122.0456 160 140 to 160 20 125.40 NA20N02W11A003M 20N02W11A003M 39.6087 -122.0456 510 490 to 510 20 125.90 NA
21N01W11A001M 21N01W11A001M 39.6943 -121.9410 1,311810 to 820, 960 to 970,
1,050 to 1,060, 1,270 to 1,28040 133.82 NA
21N01W11A002M 21N01W11A002M 39.6943 -121.9410 200 125 to 135, 175 to 185 20 133.56 NA21N01W11A003M 21N01W11A003M 39.6943 -121.9410 104 30 to 50 20 133.23 NA21N01W13J001M 21N01W13J001M 39.6730 -121.9206 830 780 to 820 40 128.94 NA21N01W13J002M 21N01W13J002M 39.6730 -121.9206 610 570 to 591 21 129.21 NA21N01W13J003M 21N01W13J003M 39.6730 -121.9206 400 355 to 385 30 129.46 NA21N02W01F001M 21N02W01F001M 39.7044 -122.0383 600 547 to 557 10 162.13 NA21N02W01F002M 21N02W01F002M 39.7044 -122.0383 385 297 to 307 10 162.28 NA21N02W01F003M 21N02W01F003M 39.7044 -122.0383 119 109 to 119 10 162.28 NA21N02W01F004M 21N02W01F004M 39.7044 -122.0383 80 55 to 65 10 163.22 NA21N02W04G002M 21N02W04G002M 39.7033 -122.0910 964 928 to 938 10 180.21 NA21N02W04G003M 21N02W04G003M 39.7033 -122.0910 715 674 to 684, 693 to 704 21 180.51 NA21N02W04G004M 21N02W04G004M 39.7033 -122.0910 327 165 to 175, 269 to 279 20 180.31 NA21N02W04G005M 21N02W04G005M 39.7033 -122.0910 99 57 to 67 10 181.16 NA21N02W36A002M 21N02W36A002M 39.6351 -122.0332 145 120 to 140 20 137.49 NA
22N01W29N001M 22N01W29N001M 39.7263 -122.0106 1,204859 to 879, 990 to 1,010,
1,116 to 1,13659 150.95 NA
22N01W29N002M 22N01W29N002M 39.7263 -122.0106 670549 to 559, 595 to 605,
631 to 64130 150.68 NA
22N01W29N003M 22N01W29N003M 39.7263 -122.0106 400189 to 199, 255 to 265, 320 to 330, 370 to 380
40 149.99 NA
22N01W29N004M 22N01W29N004M 39.7263 -122.0106 120 89 to 99 10 149.06 NA22N02W01N001M 22N02W01N001M 39.7836 -122.0462 1,100 810 to 820, 1,040 to 1,050 20 161.07 NA22N02W01N002M 22N02W01N002M 39.7836 -122.0462 730 700 to 710 10 161.31 NA22N02W01N003M 22N02W01N003M 39.7836 -122.0462 440 210 to 220, 360 to 370 20 161.50 NA22N02W01N004M 22N02W01N004M 39.7836 -122.0462 108 70 to 80 10 161.65 NA22N02W15C002M 22N02W15C002M 39.7634 -122.0771 825 760 to 781 21 192.37 NA22N02W15C003M 22N02W15C003M 39.7634 -122.0771 422 370 to 380 10 192.01 NA22N02W15C004M 22N02W15C004M 39.7634 -122.0771 258 210 to 220 10 192.25 NA22N02W15C005M 22N02W15C005M 39.7634 -122.0771 100 60 to 70 10 192.71 NA
23N01W28M002M 23N01W28M002M 39.8188 -121.9912 1,044791 to 801, 881 to 891, 951 to
961, 1,011 to 1,02140 160.33 NA
23N01W28M003M 23N01W28M003M 39.8188 -121.9912 696 640 to 650, 660 to 670 20 160.57 NA23N01W28M004M 23N01W28M004M 39.8188 -121.9912 217 120 to 130, 155 to 165 20 160.70 NA23N01W28M005M 23N01W28M005M 39.8188 -121.9912 72 30 to 50 20 161.05 NA23N01W31M001M 23N01W31M001M 39.8028 -122.0294 1,200 969 to 979, 1,020 to 1,030 20 162.86 NA23N01W31M002M 23N01W31M002M 39.8028 -122.0294 616 545 to 555, 590 to 600 20 162.76 NA23N01W31M003M 23N01W31M003M 39.8028 -122.0294 245 140 to 150, 191 to 201 20 162.68 NA23N01W31M004M 23N01W31M004M 39.8028 -122.0294 106 66 to 76 10 162.58 NA
Monitoring Wells (a)
Table 1. Well Construction Details
(a)Monitoring well construction details were obtained from the California Department of Water Resources CASGEM database. (b)NA - Not applicable.
Production Wells
N\C\550\00-13-03\WP\BK_Water Transfer Report\TablesLast Revised: 05-09-14
Glenn-Colusa Irrigation District2013 Final Water Transfer Report
@A@A@A@A
@A@A@A
@A@A@A
@A@A@A@A@A@A@A@A
@A
@A@A@A@A
@A@A@A@A"/
"/
"/
"/
"/
@A@A@A@A
@A@A@A@A
@A@A@A
22N02W15C002-5M
21N01W11A001-3M
21N01W13J001-3M
21N02W01F001-4M21N02W04G002-5M
21N02W36A002M
22N01W29N001-4M
22N02W01N001-4M
GCID 1
GCID 2
GCID 3
GCID 4
GCID 5 (Jacinto)
23N01W28M002-5M
23N01W31M001-4M
20N02W11A001-3M
0 21
Miles
LEGEND
GCID Service Area
GCID Main Canal
"/ GCID Production Well
@A DWR Observation Well
Last Saved: 5/6/2014 2:26:20 PM bkaasa; N:\Clients\550 Glenn-Colusa Irrigation District\00-13-03 Wtr Tran Monitor & Report\GIS\Figures\Figure 3 Monitoring Network.mxd
Notes:1. Observation well locations and state wellnumbers were obtained from the DWR CASGEMonline database2. A total of 38 DWR observation wells are includedin the monitoring network.3. Nested observation wells are denoted with theuse of hypens indicating the range of well names ateach location.
FIGURE 3Glenn-Colusa Irrigation District
2013 Final Water Transfer Report
MONITORING NETWORK

2013 Final Water Transfer Report
7 Glenn-Colusa Irrigation District May 2014 2013 Final Water Transfer Report N\C\550\00-13-03\WP\BK_Water Transfer Report
Power Consumption Monitoring 3.2
3.2.1 Methods
All five GCID production wells were operated using electric power during the water transfer. GCID staff collected electric meter readings of power consumption for the production wells during the water transfer. Power consumption was measured in kilowatt-hours (kWh). Power meter readings were recorded on the field data sheets included in Appendix A.2.
Power consumption data for production well GCID 1 was not available during the water transfer. GCID 1 obtains power from the nearby Hamilton City Pump Station and does not have a dedicated electric meter. Also of note, the electric meter on production well GCID 5 resets after a value of 999.99 kWh. Electric meter readings collected from GCID 5 are not accurate representations of the total power consumption. Total power consumption for GCID 5 will be obtained from the monthly power company invoices, when available.
3.2.2 Frequencies
As required by the MRP, power consumption data from the GCID production wells was obtained at a minimum weekly frequency while the wells were pumping. Power consumption data was reported on a monthly basis to the appropriate review contacts identified in the Water Transfer Agreement (SWPAO, 2013).
Groundwater Level Monitoring 3.3
3.3.1 Methods
GCID collected depth to groundwater measurements in each of the production wells listed in Table 1 using an electronic water level sounder. Depth to water was measured from the top of the sounding tube to the water surface and recorded to the nearest tenth of a foot (0.1 foot) for each well. The elevation for the top of each sounding tube, measured by a State of California licensed professional land surveyor, was used to convert the depth to groundwater measurements into groundwater surface elevations. Each production well was also equipped with an In-Situ, Inc. LevelTROLL pressure transducer/data logger (LevelTROLL). The LevelTROLL datasets were included to supplement the manual measurements used to create the hydrographs in Appendix C, Figures C-1 to C-5. Manual water level data were recorded on field data sheets included in Appendix A.3 and reported electronically to the appropriate review contacts identified in the Water Transfer Agreement (SWPAO, 2013) on a monthly basis from the start of the transfer through March 2014.
Water level measurements for the observation wells listed in Table 1 were collected by DWR. The DWR observation wells were equipped with LevelTROLL pressure transducers, which recorded water level measurements on one-hour intervals. GCID downloaded the water level data for the observation wells from DWR’s CASGEM online database.

2013 Final Water Transfer Report
8 Glenn-Colusa Irrigation District May 2014 2013 Final Water Transfer Report N\C\550\00-13-03\WP\BK_Water Transfer Report
3.3.2 Frequencies
As required by the MRP, monthly water level measurements were obtained from the wells listed in Table 1 from March 2013 until prior to the start of the transfer. Weekly water level measurements were collected during the transfer period and for one month after the end of the transfer, after which readings were collected on a monthly cycle.
Water Quality Monitoring 3.4
3.4.1 Methods
GCID collected field water quality measurements from each of the five production wells listed in Table 1 using a Horiba U-52 Multi Parameter Water Quality Meter. The water quality meter was calibrated by GCID on a weekly basis for both pH and specific conductance. Water quality monitoring was not required for the DWR observation wells.
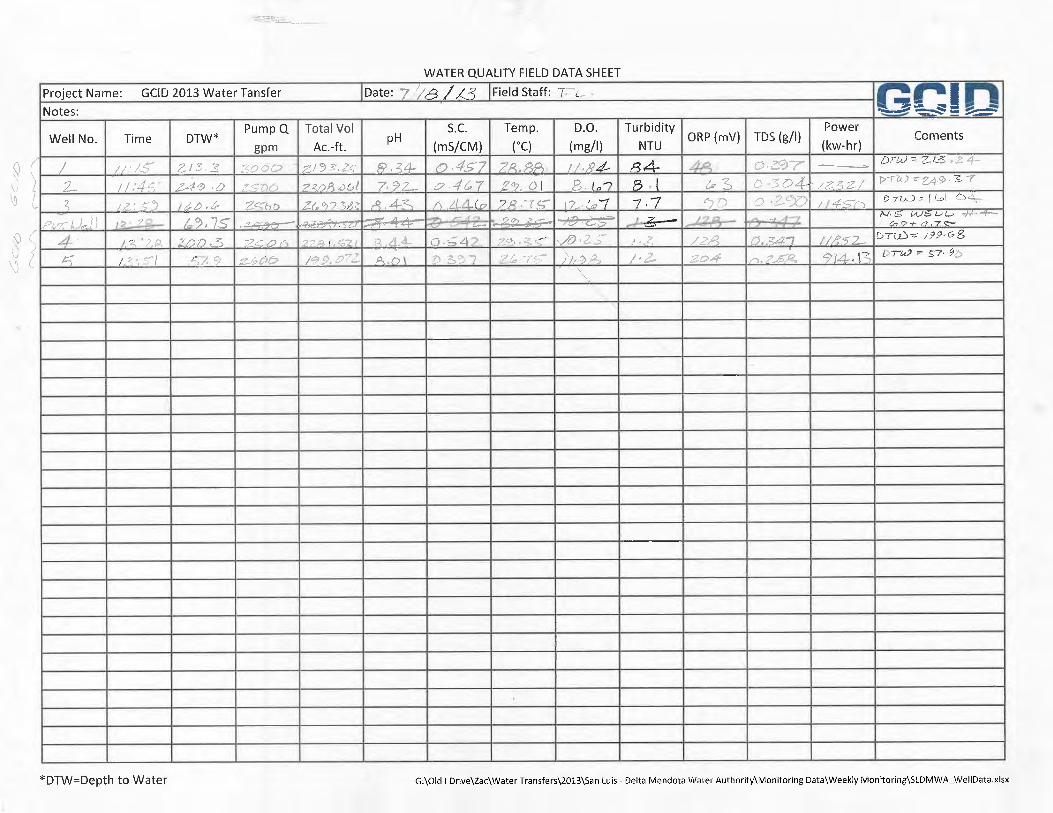
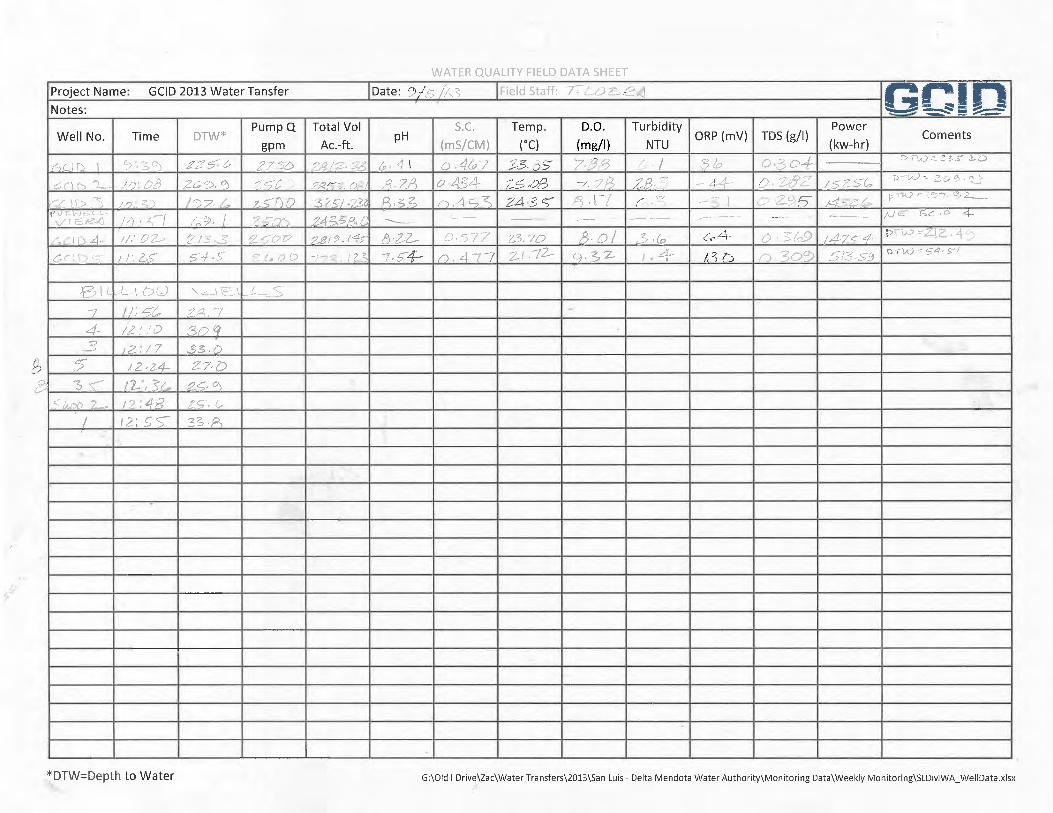
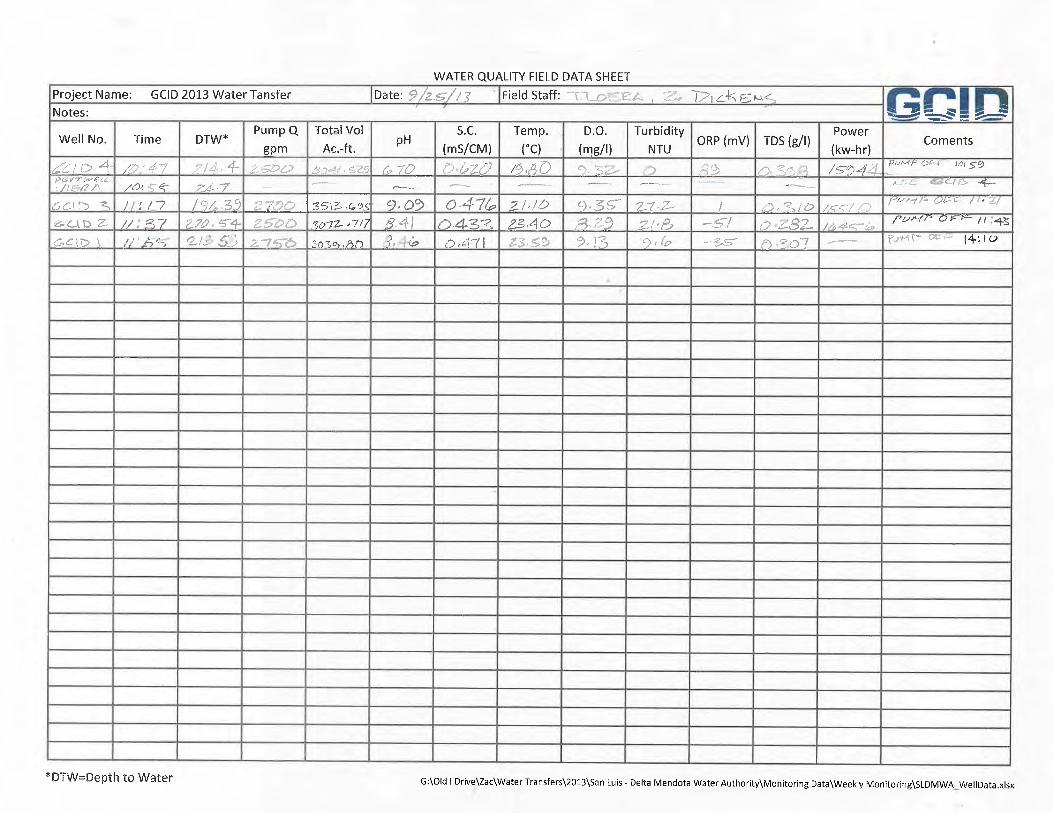
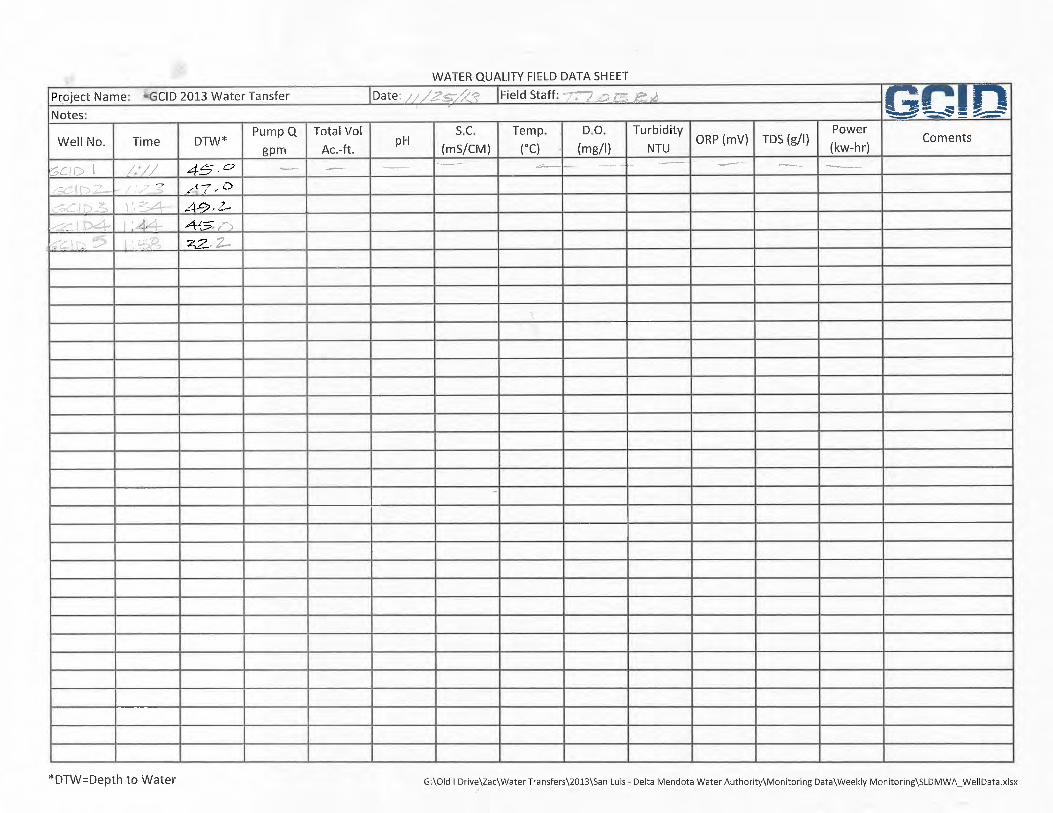
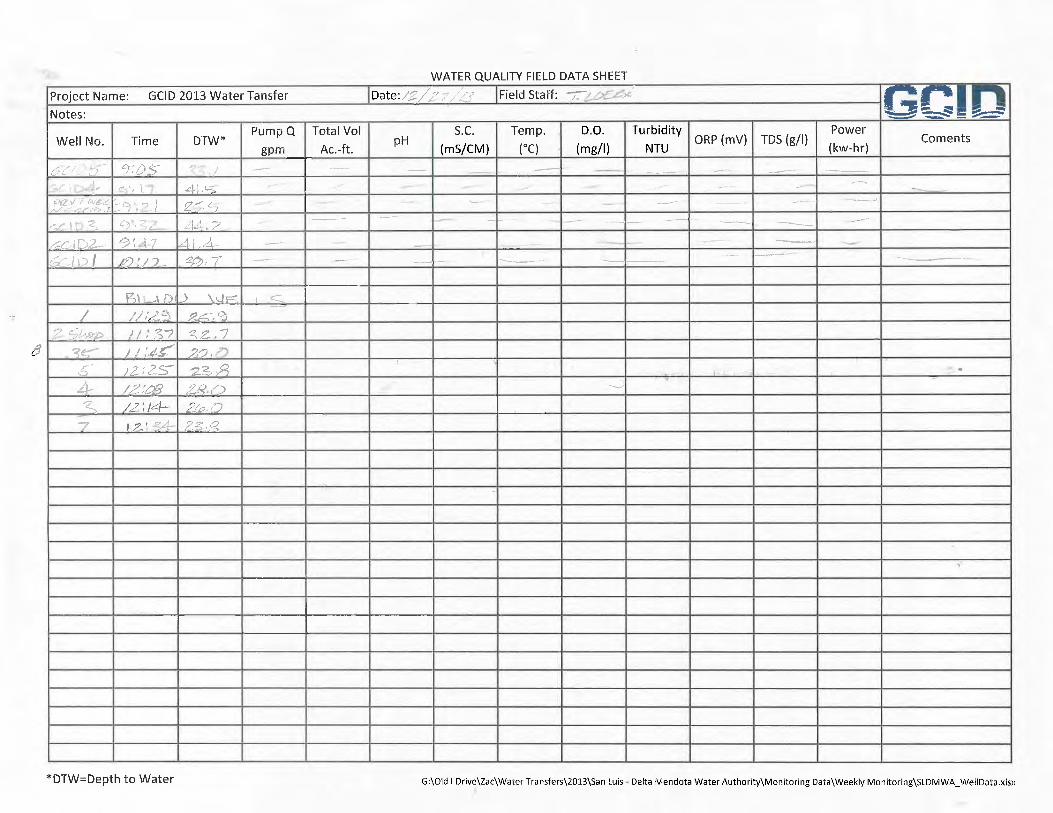
As part of the MRP, GCID was only required to record measurements of specific conductance; however, additional water quality parameters (e.g., pH, temperature, dissolved oxygen, turbidity, oxidation reduction potential and total dissolved solids) were also occasionally recorded. Field water quality parameters recorded during the water transfer are included on the field data sheets in Appendix A.3.
3.4.2 Frequencies
GCID collected water quality measurements from each production well at a minimum monthly frequency throughout the water transfer period, and also at the beginning and ending of pumping, as required by the MRP.
4.0 PROJECT RESULTS
All manually collected water production, power consumption, water level, and water quality data were recorded on field data sheets, which are included in Appendix A. Tabulated data, provided electronically to the appropriate review contacts identified in of the Water Transfer Agreement (SWPAO, 2013) on a monthly basis, are included in Appendix B. Water level hydrographs for the production wells and observations wells listed in Table 1 are included in Appendix C. Groundwater elevation contour maps, displaying groundwater elevation contours from before pumping, at the end of pumping, and after recovery, are included in Appendix D.
Groundwater Production 4.1
Table 2 lists the groundwater production results for each of the production wells used in the water transfer. As seen in the table, each well pumped approximately 1,000 ac-ft of water during the transfer period of July 1, 2013 to September 25, 2013, for a total of 5,000 ac-ft. A net total of 4,400 ac-ft of transferable water was calculated after subtracting an assumed 12 percent depletion loss.

2013 Final Water Transfer Report
9 Glenn-Colusa Irrigation District May 2014 2013 Final Water Transfer Report N\C\550\00-13-03\WP\BK_Water Transfer Report
Table 2. Groundwater Production Results, ac-ft
Well Name
July August September Total by Well
07/01/13 to 08/01/13
08/01/13 to 08/29/13
08/29/13 to 09/25/13
07/01/13 to 09/25/13
GCID 1 403.1 365.3 301.5 1,070
GCID 2 351.1 322.6 286.2 960
GCID 3 354.2 328.5 330.4 1,013
GCID 4 343.6 316.5 289.8 950
GCID 5 360.6 340.9 305.9 1,007
Total Water Pumped
1,813 1,674 1,514 5,000
Total Transferrable Water(a)
1,595 1,473 1,332 4,400
(a) Total transferrable water calculated as total water pumped minus 12 percent depletion losses.
Water Levels 4.2
Water level measurements collected from the production wells during the water transfer are listed in the field data sheets in Appendix A.3 and in the DWR Seller Groundwater Data Form, included as Appendix B. Water level data for the observation wells in the monitoring network were downloaded from the CASGEM online database, and are listed in Appendix B. Hydrographs for the production wells and observation wells listed in Table 1 are included in Appendix C. For observation well locations with multiple nested monitoring well completions, all hydrographs created for the respective nested monitoring well are displayed on the same figure. Groundwater elevation contour maps for the project area are included in Appendix D.
4.2.1 Production Wells
Depth to groundwater for the GCID production wells from March 2013 to March 2014 is shown on Figure 4. Individual hydrographs for the GCID production wells are shown on Figures C-1 to C-5 in Appendix C. Drawdown within the GCID production wells during the water transfer period ranged from approximately 20 feet in GCID 5 to 240 feet in GCID 2 by the end of the transfer period. Table 3 lists the water level elevations for the pumping wells for select time periods.

2013 Final Water Transfer Report
10 Glenn-Colusa Irrigation District May 2014 2013 Final Water Transfer Report N\C\550\00-13-03\WP\BK_Water Transfer Report
Table 3. Production Well Water Levels
Well Name
Water Surface Elevation, feet msl Change in
Groundwater Elevation March 2013 to March
2014 March 2013 June 2013 September 2013 March 2014
GCID 1 140.00 129.80 -63.30 130.30 -9.70
GCID 2 129.11 NA(a) -116.33 117.61 -11.50
GCID 3 119.00 111.44 -47.80 110.70 -8.30
GCID 4 113.99 107.14 -70.51 106.29 -7.70
GCID 5 105.40 95.06 77.3 103.40 -2.00
(a) Water level data not available.
Figure 4. GCID Production Well Depth to Groundwater

2013 Final Water Transfer Report
11 Glenn-Colusa Irrigation District May 2014 2013 Final Water Transfer Report N\C\550\00-13-03\WP\BK_Water Transfer Report
As seen in Table 3, March 2014 water level elevations in GCID 3 and GCID 4 recovered to within one foot of their June 2013 elevations. Water level elevations in GCID 1 and GCID 5 were higher in March 2014 than the June 2013 pre-pumping elevations. As seen on Figure 4, water level trends stabilize toward pre-transfer March 2013 levels during the post-transfer recovery period.
4.2.2 Observation Wells Screened from Zero to 200 Feet Deep
Hydrographs for the DWR observation wells are shown on Figures C-6 to C-16 in Appendix C. Observation wells screened from zero to 200 feet deep are displayed in green or orange colors. Review of the hydrographs for wells screened between zero and 200 feet deep indicates that pumping from the GCID production wells had no discernible effect on the water levels. Water level declines for wells screened from zero to 200 feet deep typically begin before the start of water transfer pumping and then stabilize and begin recovery before then end of water transfer pumping.
Contour maps for wells screened from zero to 200 feet deep for June 2013, September 2013, and March 2014 are displayed on Figure D-1, D-2 and D-3, respectively, in Appendix D. These contour maps display water level elevations before the start of pumping, at the end of pumping, and after water levels had recovered. As seen on Figure D-1 and D-2, there is a decline in the groundwater level for wells screened from zero to 200 feet deep of about five feet from June 2013 to September 2013. March 2014 recovered groundwater levels, displayed on Figure D-3, show that groundwater level elevations, at a minimum, recovered to within a few feet of the June 2013 pre-pumping water levels, or in some cases exceeded the pre-pumping water levels. Groundwater elevations typically reach their maximum annual values for any given year in the March-April timeframe. These maximum elevations occur near the end of the wet-season in response to recharge and before the onset of the growing season when groundwater pumping increases. The fact that some March 2014 groundwater elevations were greater than some June 2013 groundwater elevations is consistent with this typical annual pattern. Longer term changes in precipitation also affected the groundwater levels measured before and after the transfer. The winter of 2013-2014 was extremely dry. The low levels of precipitation and runoff resulted in limited groundwater recharge and generally lower groundwater elevations throughout the Sacramento Valley. Given these annual and longer term trends, the groundwater elevations measured before and after the transfer demonstrate that the groundwater elevations recovered to levels consistent with regional trends by March 2014.
4.2.3 Observation Wells Screened from 200 to 700 Feet Deep
Hydrographs for observation wells screened from 200 to 700 feet deep are displayed in red or purple colors on Figure C-6 through C-16 in Appendix C. As seen on the hydrographs, the majority of observation wells screened between 200 and 700 feet deep do not display water level declines related directly to the project pumping. Water level declines for wells screened from 200 to 700 feet deep typically begin before the start of water transfer pumping and then stabilize and begin recovery before the end of water transfer pumping.
2013 Final Water Transfer Report
12 Glenn-Colusa Irrigation District May 2014 2013 Final Water Transfer Report N\C\550\00-13-03\WP\BK_Water Transfer Report
As seen on Figure C-12, observation well 22N01W29N002M is the only well screened between 200 and 700 feet deep that appears to be affected by the water transfer pumping. Observation well 22N01W29N002M is located between GCID 2 and GCID 3, so it is likely affected by the cumulative drawdown of both pumping wells, in addition to pumping from any private wells nearby. The pre-pumping June 2013 water level in observation well 22N01W29N002M was approximately 111 feet mean sea level (msl). The water surface elevation in September 2013 reached a low of approximately 97 feet msl. Water level recovered to approximately 120 feet msl by March 2014, about nine feet higher than the pre-pumping water level. A total of 14 feet of drawdown was observed between the pre-pumping water level and end-of-pumping water level. The majority of privately owned water wells in the area are screened from 200 to 700 feet deep, and only a portion of the drawdown in observation well 22N01W29N002M is likely attributable to the GCID pumping.
Contour maps for wells screened from 200 to 700 feet deep for June 2013, September 2013, and March 2014 are displayed on Figure D-4, D-5 and D-6, respectively, in Appendix D. These contour maps display water level elevations before the start of pumping, at the end of pumping, and after water levels have recovered. As seen on Figure D-4 and D-5, there is a decline in the water level for wells screened from 200 to 700 feet deep of about five to 15 feet from June 2013 to September 2013. March 2014 recovered water levels, displayed on Figure D-6, show that water level elevations generally recovered to higher values than the June 2013 pre-pumping water levels.
4.2.4 Observation Wells Screened from 700 to 1,400 Feet Deep
Hydrographs for observation wells screened from 700 to 1,400 feet deep are displayed in blue on Figure C-6 through C-16 in Appendix C. Observation wells 21N01W13J001M and 23N01W28M002M, did not display any groundwater level declines attributable to the GCID pumping. The remaining observation wells screened from 700 to 1,400 feet deep displayed groundwater level declines likely attributable to the pumping from the GCID production wells. Groundwater level declines ranged from approximately nine feet to 85 feet at distances of 3.8 to 0.3 miles, respectively.
Contour maps for wells screened from 700 to 1,400 feet deep for June 2013, September 2013, and March 2014 are displayed on Figure D-7, D-8 and D-9, respectively, in Appendix D. These contour maps display water level elevations before the start of pumping, at the end of pumping, and after water levels have recovered. As seen on Figures D-7 and D-8, there is a large decline in the water level for observation wells screened from 700 to 1,400 feet deep from June 2013 to September 2013. March 2014 recovered water levels, displayed on Figure D-9, show that water level elevations generally recovered to within a five feet of the June 2013 pre-pumping water levels, or in some cases climbed above the pre-pumping water levels.
2013 Final Water Transfer Report
13 Glenn-Colusa Irrigation District May 2014 2013 Final Water Transfer Report N\C\550\00-13-03\WP\BK_Water Transfer Report
4.2.5 Regional Water Level Trends
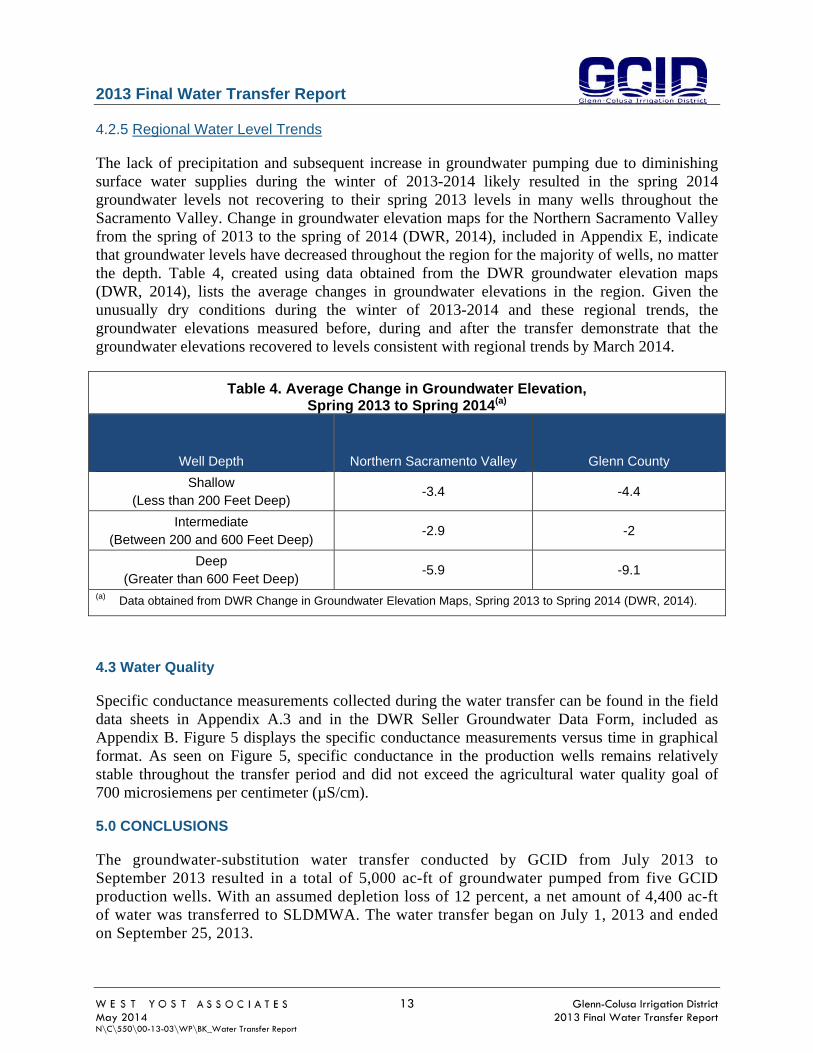
The lack of precipitation and subsequent increase in groundwater pumping due to diminishing surface water supplies during the winter of 2013-2014 likely resulted in the spring 2014 groundwater levels not recovering to their spring 2013 levels in many wells throughout the Sacramento Valley. Change in groundwater elevation maps for the Northern Sacramento Valley from the spring of 2013 to the spring of 2014 (DWR, 2014), included in Appendix E, indicate that groundwater levels have decreased throughout the region for the majority of wells, no matter the depth. Table 4, created using data obtained from the DWR groundwater elevation maps (DWR, 2014), lists the average changes in groundwater elevations in the region. Given the unusually dry conditions during the winter of 2013-2014 and these regional trends, the groundwater elevations measured before, during and after the transfer demonstrate that the groundwater elevations recovered to levels consistent with regional trends by March 2014.
Table 4. Average Change in Groundwater Elevation, Spring 2013 to Spring 2014(a)
Well Depth Northern Sacramento Valley Glenn County
Shallow (Less than 200 Feet Deep)
-3.4 -4.4
Intermediate (Between 200 and 600 Feet Deep)
-2.9 -2
Deep (Greater than 600 Feet Deep)
-5.9 -9.1
(a) Data obtained from DWR Change in Groundwater Elevation Maps, Spring 2013 to Spring 2014 (DWR, 2014).
Water Quality 4.3
Specific conductance measurements collected during the water transfer can be found in the field data sheets in Appendix A.3 and in the DWR Seller Groundwater Data Form, included as Appendix B. Figure 5 displays the specific conductance measurements versus time in graphical format. As seen on Figure 5, specific conductance in the production wells remains relatively stable throughout the transfer period and did not exceed the agricultural water quality goal of 700 microsiemens per centimeter (µS/cm).
5.0 CONCLUSIONS
The groundwater-substitution water transfer conducted by GCID from July 2013 to September 2013 resulted in a total of 5,000 ac-ft of groundwater pumped from five GCID production wells. With an assumed depletion loss of 12 percent, a net amount of 4,400 ac-ft of water was transferred to SLDMWA. The water transfer began on July 1, 2013 and ended on September 25, 2013.

Figure 5Glenn-Colusa Irrigation District
2013 Final Water Transfer Report
PRODUCTION WELL SPECIFIC CONDUCTANCE
0
100
200
300
400
500
600
700
800
7/1/13 7/8/13 7/15/13 7/22/13 7/29/13 8/5/13 8/12/13 8/19/13 8/26/13 9/2/13 9/9/13 9/16/13 9/23/13 9/30/13
Specific Co
nductance (µS/cm
)
DateGCID 1 GCID 2 GCID 3 GCID 4 GCID 5
2013 Final Water Transfer Report
15 Glenn-Colusa Irrigation District May 2014 2013 Final Water Transfer Report N\C\550\00-13-03\WP\BK_Water Transfer Report
The majority of water level declines caused by pumping from the GCID production wells during the 2013 water transfer were observed in observation wells screened at depths greater than 700 feet below ground surface (bgs). Though there were substantial declines in the water levels for these observation wells, there are no known water users with wells screened at similar depth intervals located within the area of influence of the GCID production wells. Additionally, water levels in the GCID production wells and observation wells screened greater than 700 feet bgs generally recovered to within a few feet of their pre-pumping water levels, and in some instances surpassed their pre-pumping water levels by March 2014.
The majority of water users in the project area have wells screened between 200 and 700 feet bgs. Pumping from the GCID production wells during the water transfer appeared to induce additional drawdown in only one observation well screened between 200 and 700 feet bgs, well 22N01W29N002M. These results are consistent with results from a long-term aquifer performance test conducted by the Stony Creek Fan Partners (West Yost, 2012). The drawdown observed in observation well 22N01W29N002M from June 2013 to September 2013 was approximately 14 feet. However, only a portion of that drawdown is likely attributable to pumping from the GCID production wells because other parties were probably operating wells producing from the same interval. Additionally, water levels for every observation well screened between 200 and 700 feet bgs in the monitoring network recovered to elevations higher than their respective pre-pumping water levels by March 2014.
Observation wells screened from zero to 200 feet bgs displayed no additional drawdown caused by pumping from the GCID production wells. These results are consistent with results from a long-term aquifer performance test conducted by the Stony Creek Fan Partners (West Yost, 2012). Additionally, because water levels in wells screened from zero to 200 feet bgs were not affected by GCID’s pumping during the water transfer, it is highly unlikely that the GCID’s pumping had any effect on surface water in the vicinity of the project.
Groundwater levels have declined throughout the region from the spring of 2013 to the spring of 2014, as indicated on the DWR change in groundwater elevation maps (DWR, 2014). These groundwater level declines are likely due to the lack of precipitation and subsequent increase in groundwater pumping throughout the Sacramento Valley. The year-to-year declines were observed in the majority of wells, no matter the depth (DWR, 2014). These regional trends likely had an effect on the groundwater level drawdowns observed during the water transfer and the subsequent recovery, but the groundwater level measurements made before, during, and after the transfer demonstrate that post-transfer groundwater elevations recovered to levels consistent with regional trends.
Pumping from the GCID production wells for the water transfer did not cause a recognizable deterioration in water quality. Specific conductance was measured from each production well were collected on a minimum weekly basis. Specific conductance remained relatively stable throughout the pumping period, and did not exceed the agricultural water quality goal of 700 µs/cm.

2013 Final Water Transfer Report
16 Glenn-Colusa Irrigation District May 2014 2013 Final Water Transfer Report N\C\550\00-13-03\WP\BK_Water Transfer Report
6.0 REFERENCES
DWR, 2014, Change in Groundwater Elevation Maps, Spring 2013 to Spring 2014, Shallow Aquifer Zone, http://www.water.ca.gov/groundwater/data_and_monitoring/northern_region/ GroundwaterLevel/GWLevelMonitReports/ShallowSpring2013to2014.pdf
DWR, 2014, Change in Groundwater Elevation Maps, Spring 2013 to Spring 2014, Intermediate Aquifer Zone, http://www.water.ca.gov/groundwater/data_and_monitoring/northern_region/ GroundwaterLevel/GWLevelMonitReports/IntermediateSpring2013to2014.pdf
DWR, 2014, Change in Groundwater Elevation Maps, Spring 2013 to Spring 2014, Deep Aquifer Zone, http://www.water.ca.gov/groundwater/data_and_monitoring/northern_region/ GroundwaterLevel/GWLevelMonitReports/DeepSpring2013to2014.pdf
DWR, 2014, State of California Department of Water Resources California Statewide Groundwater Elevation Monitoring Database, http://www.water.ca.gov/groundwater/ casgem/online_system.cfm
GCID, 2013, Glenn-Colusa Irrigation District 2013 Water Transfer Groundwater Pumping, Monitoring, and Reporting Plan
SWPAO, 2013, State Water Project Analysis Office 2013 Water Transfer Agreement # 13-710
West Yost Associates, 2012, Stony Creek Fan Partners Aquifer Performance Testing Report
APPENDIX A Field Data Sheets
A.1 Water Production Field Data Sheets
A.2 Power Meter Field Data Sheets
A.3 Water Quality and Water Level Field Data Sheets

APPENDIX A.1 Water Production Field Data Sheets

i? :f)
.y l3CiC )ate
July
Rcidinti
Daily Flow Meter Readings Form
2013
August
Duff. Pifl Date Readina Duff. ah Date
Location: Deep Well #1
Month:
September
Reading Duff. CA
JI31 1969.93 30131 30/31 .
2 225S2 21 3 1i% 20b 3
4 2 -11 75
5 i:O2\ 7 34zv 5 1 V 5
6 2o3, 3oo.’ 6 6
7 7 7
8 2-10b 8 8
9 1’t 3O $ 9
10 10
12 12 2i
9S0 13 13
j421’-1022 2 - 14 14
15cLc1’ 15 15
16 7ftjf75 16 16
17 i!7ij
___
oO 17: 17
18 18 2 18 1 -
19 2ot1fl 19 T 19
20 20 20
21 21 21
22 22 :::’! 22
23 :
oe’ 23 23
24 - 24 24
25 25 25
26 22qI 7 2To 26 26
27q, 27 27
28 28
29 L725,1 29
30 30 30
31 ___ 31 -. ____ ___ 31

i I3. c5 July
Oate Reading Duff.
.aI31 2112.177
I 2iiziii
2 4O �
3
4
5
6 i1-i/3 �
7
8 2A32
9 iot3 - 10 2tiu.
11 -Z
12
13
14 a 16-0 ai w
Lt 16
Daily Flow Meter Readings Form
2013
August
r Date Reading Duff. CFr’.
30/31
2 27co 25I
3 2 q lj527
4Z9L!t
0 5
6T’:*
8
_91 _
4 10 -sc-
117 1- 1 1
12
13
’- 14
15
16
-
Location: Deep Well #2
Month:
September
Date Reading Duff. pp’
30/31
2 7
3
4
5 .
7 7
86.
9 5 ___ 1HiL1
12
13
14i
15
16
17 , �’ __________ ____ 4-’- -- -* ____ ____ _____ - ____ ____
18 z5t5 18 __________ ____ ____ 18
t2:’:1IK-J - 19’i-7,y ___ L3 19 ________ ___ 19
20 20 20
21 zo 21 21
22 22 __ 22
23 ç 23 23
24 24 24
25 2jji3 25 25
26 257 26 __ __ 26
27 LC 27 27
28 28 ___ 28
29 29 29
30 -- 30 30
31

Daily Flow Meter Readings Form Location: Deep Well #3
2013 Month:
August September
Duff. OPP, Date Readinci Duff. tPi Date Readinq Duff.
1)
7, L) o’126 July Date Readinci
40I31 2500.645 30131 30/31
I Z5c6’U Mq I 2q I
2 252-iZ3 2So 2 çiç’ 2,O( 2
3 2Si 24° 3 Z%T1D 3
4 4 Z% 2! 251 4 :
5 1sg;i $Jg 5 5
6 2S7,703 6 . : 6
7 25&: 71 7 :s7 7 �I: :�� ___
8 2S1fl ___ i5° 8 8
. 5t-1i 25q? 9 9
10 10 ;YE: 10
11 55iI ____ 11 . : ____ � :: 11 ____ ____
12 12
13 13
14 14 14
15: 17, 15 15
16 2
’, 16 : 16
17 2-575 173ç: 17
18 18
19 Z 19 19 7
20T 20Q - j 20
21 21 21
22 22 22
23 23 23
24 � 24 24
25 ZjCb 25 a 25
26 M65 KW
Z7Ot 26 26
27 - 27 27
28 a:: 28 28
29 29T 25 29
30 30 30
31 ______ - 31 __ __ 31

Daily Flow Meter Readings Form
Location: Deep Well #
JPiEb
2013
Month:
1&5c July August
September
Date Readina Duff. wm Date Readina Duff. orn Date Readina Duff. Gwr
.0/31 2091.638 30/31 30/31
I 29T 25O I ___
2 1 24 02 . ZSjc, 2 -N3w
3z!13 373
4 TL 4
5 w; 5 :7Z 5
6ijqq9 52 6 6
7 ?& O)/O 5 7 T: y
8 8
9 ’1i711Tf i3 91j Ti 9 TT
10 10 :i::- \ ’ 10
-i 11 .
12 �_ z: :: 12 12 -
13 13 13
14 14_________
15 a- 15 15
16 %oc 16 -
17 7- 21 o7 17 17
18 7 ’ 18 18
19 lit 19 19
20 20 20
21 21 21
227c 22 22
23 i5- f 23 23
24 24 24
25 2?B7 5O 25 25
26 7 ___ 2~r, 26 ___ ___ 26
27 27 27
28 :’ 28
29 /Oj1 29
30 3 30 30
31 31 ___ 31

Daily Flow Meter Readings Form
Location: Deep Well #5
2013
Month:
4 11 e, I 0c5 July
August
September
fliff c’ Date Readina Duff. QPin Date
Readina Duff. CJ’jr’,
.0I31 0 30131 30131
2 2 1 3 2
! 2 / 2&b 3 Ty 3
z i 4 4
9t tO1 5 ;::
- 6 6
Ck 7
8 q, It 2J iO 8
9 9L 1-9 it �2tY 9 ;: 9 3U3
10 Zc;3 10 _____ ___ T 10 ;c)\%(
I I -- ’ 7 D .
12 12
13 IO 13 13
14 ISL iS9 :2!fPO 14 -r- 14
15 15 15
16 16 16
17 JqL,% 2iO 17 17 H1
18 18 18
19 Tj:L 19
20 Rc1
20 20 ?
21 -: 21 C1 21
22 22 22
2315L-� 237 Zi 23
247c 24 24
25 23 25 - 25
26 2Lf 26 26
27 zi. 27 27
28 28c(; 28
29 29 (g 29
30 7.co 30 30
31 ___ 7c 31 ___ 31

APPENDIX A.2 Power Meter Field Data Sheets

July
te Readinq
Daily Flow Meter Readings Form
2013 KWH
August
Duff. cfs Date Readina Duff. cfs Date
cD Location; Deep Well #2
Month:
September
Readina Duff. cfs
30/31 30131 30/31
1 1 1
2 ffrj 2 2
3 3 3
4 4 4
5 5 5
6 6 : ThT 6
7 7 7
8 8 8
9 9
10 10 10
12 12 12
13 13 13
14 14 14
15 15
16 16 16
17 17 17
18 18 18
19 19 19
20 20 20
21 21 21
22 22 22
23 23 23
24 24 24
25 25 25
26 26 26
27 27 27
28 28
29 29 29
30 ______ __ __ 30 11 L 31 31 I ___ 1

IL tncTt Daily Flow Meter Readings Form
Location: Deep Well #3
2013 KWH
Month:
July August
September
Date Readina Duff. cfs Date Readina 01ff. cfs Date Readina Duff. cfs
30131 - 30/31 30131
I
2 C 2
3 3 3
4 4 4
5 5 5
6 6:i 6 7 7 7
8 8
9 9
10
12
131 1-
_______ __ 14
15 16 17 18
19
20
21 ---
10 10
12 12
13
14
15
__-- 14
15
16 16 17 17 18 18 19 19
21
22
20
21
22 22 23
24 25
26
27 _ _
29
30
31
24
25
26
27
28
29
31
23 23
24
25
26
27
28
29

IE rncrf
Daily Flow Mater Readings Form Location ; Deep Well #Ej
2013 KWH
Month:
July August September
nate Readina Duff. cfs Date Readina Duff. cfs Date
Readina Duff.. cf
30/31 30131 30/31
1 1 1
2 2
3 3 3
4 4 4
5 5 5
6 6 6
7 _ 7 8 8 8 9 9 9
10 10 10
12 12 12 13 13 13 14 14 14 15 15 15 16 16 16 17 17 17 18 18 18 19 19 19 20 20 20 21 21 21 22 22 22 23 iT 23 23 24 24 24 25 25 25 26 26 26 27 27 27
28 28 29 29 ____ ____ 29
30 30 31 ____ ____ 31

TE iETI Daily Flow Meter Readings Form
Location: Deep Well #5
2013 KWH
Month:
July August
September
- Date Reading Duff. cfs Date Readina Duff. cfs Date Readina 01ff. cfs
.i0131 30/31 30/31
1 I 1
2
-
2 2
3
4
81 _
12 12 __ I -
- I
15 14
14 14
16 16
15 15
17 17
18 18
19 19
20 20 L/!
21 21
22 23
23 23 24
24
26 26
26 27 27
27 28 28
28 29 29
29 30
30 31
31

APPENDIX A.3 Water Quality and Water Level Field Data Sheets

Water Quality San ig Field Data Sheet Page -
Project Name: GCID Water Transfer Date: 7/1/2013 WEST ’(OS I
A S S 0 C I A I F S
Project Number: Time:
Well Name: Field Staff: Barrett Kaasa
Sampling Event: July 2013 - Beginning of Transfer Equipment Type: WQ Meter, WL Meter
Total Depth of Well (Feet): Water Column (Feet): 2 Well: 0.16 gal/ft 4 Well 0.65 gal/ft
Static Depth to Water (Feet): One Casing Volume (Gallons): 2.5 Well: 0.25 gal /ft 6 Well 1.5 gal/ft
Time H S, C.
(mS/CM) Temp.
( ° C) D.O.
(mg/1) Turbidity
(NTU) ORP (my)
__________
TDS (mg/1)
__________
Comments
______________________________________ Gati&2 �-thgs
i -7 (2. 7
ii 20 t
17 ,(c 7.? 3 J ,
Sample ID: Time Sample Collected: Analytical Laboratory:
Notes: oj

WATER QUALITY FIELD DATA SHEET
Project Name: GCID 2013 Water Tansfer IDate: IField Staff: g.ul Notes:
Well No. Time DTW* Pump 0
gpm
Total Vol
Ac.-ft. pH
S.C.
(mS/CM)
Temp.
(°C)
D.O.
(mg/1)
Turbidity
NTU ORP (mV) TDS (mg/1) Coments
G:\OId I Drive\Zac\Water Transfers\2013\San Luis - Delta Mendota Water Authority\SLDMWA_WeIIDataxlsx

WATER QUALITY FIELD DATA SHEET
Project Name: GCID 2013 Water Tansfer IDate: 7 IField Staff: /. / i�v�21 :n::~,
Notes:
Well No. Time DTW* Pump Q
gpm
Total Vol
Ac.-ft.
S.C./
(mS/CM)
Temp.
(°C)
D.O.
(mg/1)
Turbidity
NTU ORP (mV)
7 TDS (rn/l) /(/ Coments
/
147 4
_____ //4. . ... .. .
/ :.�7 . .
.......
...+O.5 N C1 iL)i
G:\OId I Driv\Zac\Water Transfers\2013\San Luis - Delta Mendota Water Authority\SLDMWAWeIIData.xlsx

WATER QUALITY FIELD DATA SHEET
Project Name: GClD2Ol3 Water Tansfer IDate: lnemstaff :
Notes:
Pump Q Total Vol S.C. Temp. D.O. Turbidity ORP (mV) TDS (g/I)
PowerpH Coments Well No. Time DTW*
gpm Ac.-ft. (MS/CM) (°C) (mg/1) NTU (kw-hr)
_______ _______ _______ :r’� _______ _______ _______ _______ _______ ______ _______ _______ _______ _______________
* DTVV=Depth to Water G:\OId I Drive\Zac\Water Transfers\2013\San Luis - Delta Mendota Water Authority\Monitoring Data\Weekly Mon itoring\SLDMWA_WeIIData.xIsx
WATER QUALITY FIELD DATA SHEET
Project Name: GOD 2013 Water Tansfer IDate: 7 /7 /7 IField Staff: :n,Notes:
Pump Q Total Vol S.C. Temp. D.O. T ’Turbidity Power Well No. Time DTW* pH ORP (mV) TDS (g/l) Coments
gpm Ac.-ft. (mS/CM) (°C) (mg/ 1 ) NTU (kw-hr)
______
* DTW=Depth to Water G:\Old I Drive\Zac\Water Transfers\2013\San Luis - Delta Mendota Water Authority\Monitoring Data\Weekly Monitoring\SLDMWA_WeIIData.xlsx

WATER QUALITY FIELD DATA SHEET
Project Name: GCID 2013 Water Tansfer TD ate: Field Staff: /
Notes:
Well No. Time DTW* Pump Q
gpm
Total Vol
Ac.-ft. pH
S.C.
(mS/CM)
Temp.
(°C)
D.O.
(mg/ 1 )
T ’Turbidity
NTU ORP (mV) TDS (g/I)
Power
(kw-hr) Coments
*DTW=Depth to Water G:\OId I Drive\Zac\Water Transfers\2013\San Luis - Delta Mendota Water Authority\Monitoring Data\Weekly Monitoring\SLDMWA_WeIlData.xlsx

WATER QUALITY FIELD DATA SHEET
Project Name: GOD 2013 Water Tansfer IDate: IField Staff: -- - RIX- Notes:
Pump Q Total Vol S.C. Temp. D.C. Turbidity Power Well No. Time DTW* pH ORP (mV) TDS (g/l) Coments
gpm Ac-ft. (MS/CM) (IC) (mg/ 1 ) NTU (kw-hr)
. . .. .�
_____________________________________ ___________________________________ ___________________________________ ..��� ..��. .-��
______ ..� � -�
. _________________________________ _______________________________ _________________________________ _________________________________ _________________________________ �
(:. �. . z� .. ________ ________ ________ ________ ________ ________ ________ ________ _________ ________
* DTW=Depth to Water G:\OId I Drive\Zac\Water Transfers\2013\San Luis - Delta Mendota Water Authority\Monitoring Data\Weekly Monitoring\SLDMWA_WeIIData.xlsx

WATER QUALITY FIELD DATA SHEET
Project Name: GOD 2013 Water Tansfer IDate: .: IField Staff: f 1 I Il Notes:
Pump 0 Total Vol S.C. Temp. D.O. Turbidity Power Well No. Time DTW* pH ORP (mV) TDS (g/l) Coments
gpm Ac-ft. (mS/CM) ( C) (mg/ 1 ) NTU (kw-hr)
* DTW= Depth to Water G:\OId I Drive\Zac\Water Transfers\2013\San Luis - Delta Mendota Water Authority\Monitoring Data\Weekly Monitoring\SLDMWAWelIData.xlsx

WATER QUALITY FIELD DATA SHEET
Project Name: GCID2Ol3 Water Tansfer Date: Field Staff: -- R _ r,_ 1 J_I Notes:
Pump Q Total Vol S.C. Temp. D.C. Turbidity Power Well No. Time DTW* pH ORP (mV) TDS (g/l) Coments
gpm Ac-ft. (mS/CM) (°C) (mg/ 1 ) NTU (kw-hr)
* DTW=Depth to Water G:\Old I Drive\Zac\Water Transfers\2013\San Luis - Delta Mendota Water Authority\Monitoring Data\Weekly Monitoring\SLDMWAWeIIData.xlsx

WATER QUALITY FIELD DATA SHEET
Project Name: GOD 2013 Water Tansfer IDate: 51 / IField Staff: . = a% m%in Notes:
Well No. Time DTW* Pump Q
gpm
Total Vol
Ac-ft. pH
S.C.
(ms/cm)
Temp.
( 1 C)
D.O.
(mg/1)
Turbidity
NTU ORP (mV) TDS (g/l)
Power
(kw-hr) Coments
- . .,. 1/ -�4
.. .. ..., ...
. . . ;........ .. =.. =�� . !. .
* DTW= Depth to Water G:\OId I Drive\Zac\Water Transfers\2013\San Luis Delta Mendota Water Authority\Monitoring Data\Weekly Monitoring\SLDMWA_WeIIData.xlsx

WATER QUALITY FIELD DATA SHEET
Project Name: GOD 2Ol3 Water Tansfer IDate: Field Staff: n I Notes:
Pump Q Total Vol S.C. Temp. D.O. Turbidity Power Well No. Time DTW* pH ORP (my) TDS (g/l) Coments
gpm Ac. -ft. (mS/CM) (*C) (mg/1) NTU (kw-hr)
/
--
* DTW=Depth to Water G:\OId I Drive\Zac\Water Transfers\2013\San Luis Delta Mendota Water Authority\Monitoring Data\Weekly Monitoring\SLDMWA_WelIData.xlsx
WATER QUALITY FIELD DATA SHEET
Project Name: GCID 2013 Water Tansfer IDate: IField Staff:
N co-em %-,- i n otes:
Pump Q Total Vol S.C. Temp. D.O. Turbidity Power Well No. Time DTW* pH ORP (mV) TDS (g/l) Coments
gpm Ac.-ft. (mS/CM) ( 1 C) (mg/ 1 ) NTU (kw-hr)
.....� �. . . .� ���H. .�� ... ..
* DTW= Depth to Water G:\OId I Drive\Zac\Water Transfers\2013\San Luis - Delta Mendota Water Authority\Monitoring Data\Weekly Monitoring\SLDMWA_WeIlData.xlsx

WATER QUALITY FIELD DATA SHEET
Project Name: GCID 2013 Water Tansfer Date: Field Staff:
Notes:
Well No. Time DTW* Pump Q
gpm
Total Vol
Ac.-ft. pH
S.C.
(mS/CM)
Temp.
(°C)
D.O.
(mg/1)
Turbidity
NTU ORP (mV) TDS (g/I)
Power
(kw-hr) Coments
*DTWDepth to Water G:\OId I Drive\Zac\Water Transfers\2013\San Luis - Delta Mendota Water Authority\Monitoring Data\Weekly Monitoring\SLDMWA_WelIData.xlsx

WATER QUALITY FIELD DATA SHEET
Project Name: GOD 2013 Water Tansfer Date: &)// IField Staff:
Notes:
ORP (my) TDS (g 1)
Pump 0 Total Vol S.C. Temp. D.O. Turbidity Power
pH Well No. Time DTW* gpm Ac-ft. (MS/CM) (°C) (mg/ 1 ) NTU (kw-hr)
Coments
c... . �. �/. _____ _____ _____ _____ __________
/
* DTW= Depth to Water G:\OId I Drive\Zac\Water Transfers\2013\San Luis - Delta Mendota Water Authority\Monitoring Data\Weeldy Monitoring\SLDMWA_WeIlData.xlsx

WATER QUALITY FIELD DATA SHEET
Project Name: GCID 2013 Water Tansfer bate: IField Staff:
Notes:
Pump Q Total Vol S.C. Temp. D.O. Turbidity Power Well No. Time DTW* pH ORP (mV) TDS (g/l) Coments
gpm Ac-ft. (MS/CM) ( 1 C) (mg/ 1 ) NTU (kw-hr)
* DTW= Depth to Water G:\OId I Drive\Zac\Water Transfers\2013\San Luis - Delta Mendota Water Authority\Monitoring Data\Weekly Monitoring\SLDMWA_Weiloata.xlsx

Water Quality Sampling Field Data Sheet Page of
Project Name: Date: 0 (2Lj WEST YOST
.ASSOCATES
Project Number: Time:
Well Name: Field Staff:
Sampling Event: r- Equipment Type:
Total Depth of Well (Feet): Water Column (Feet): 2 Well: 0.16 gal/ft
Static Depth to Water (Feet): One Casing Volume (Gallons): 2.5 Well: 0.25 gal/ft
Time
Total Volume Withdrawn S.C. Temp.
(°C) Gallons
D.O. (mg/1)
Turbidity (NTU)
Comment
0 0
231 0.
o.5Y 2H0 (.St
Sample ID:
Time Sample Collected:
Notes:

WATER QUALITY FIELD DATA SHEET
Project Name: GCID 2013 Water Tansfer IDate: IField Staff: 7
Notes:
Well No. Time DTW* Pump Q
gpm
Total Vol
Ac.-ft. pH
S.C.
(MS/CM)
Temp.
(°C)
D.O.
(mg/ 1 )
Turbidity
NTU ORP (mV) TDS (g/l)
Power
(kw-hr) Coments
- - -- -, I
* DTW= Depth to Water G:\OId I Drive\Zac\Water Transfers\2013\San Luis - Delta Mendota Water Authority\Monitoring Data\Weekly Mon itoring\SLDMWAWeIIData.xlsx
WATER QUALITY FIELD DATA SHEET
Project Name: GCID 2013 Water Tansfer IDate: JField Staff: hin Notes:
Well No. Time DTW* Pump Q
gpm
Total Vol
Ac-ft. pH
S.C.
(MS/CM)
Temp.
(°C)
D.O.
(ng/l)
Turbidity
NTU ORP mV/
/ TDS’ ’I’
Power
(kw-hr) omen C ts
I - ) / /
/c6
* DTW=De pth to Water G:\Old I Drive\Zac\Water Transfers\2013\San Luis - Delta Mendota Water Authority\Monitoring Data\Weekly Monitoring\SLDMWAWeIIDaLa.xlsx

WATER QUALITY FIELD DATA SHEET
Project Name: i/:/: IField Staff: - Notes:
ilk r- ,.- r%- i n Well No. Time DTW*
Pump Q
gpm
Total Vol
Ac.-ft. pH
S.C.
(MS/CM)
Temp.
(’C)
D.O.
(mg/ 1 )
Turbidity
NTU ORP (mV) TDS (g/l)
Power
(kw-hr) Coments
eo
-
...
* DTW=Depth to Water G:\OId I Drive\Zac\Water Trarisfers\2013\San Luis - Delta Mendota Water Authority\Monitoring Data\Weekly Monitoring\SLDMWA_WellData.xlsx

WATER QUALITY FIELD DATA SHEET
Project Name: GCID2Ol3 Water Tansfer Date: p/i Field Staff. .. I’l J’l Notes:
Pump Q Total Vol S.C. Temp. D.O. Turbidity Power Well No. Time DTW* pH ORP (mV) TDS (g/l) Coments
gpm Ac-ft. (mS/CM) (*C) (mg/ 1 ) NTU (kw_ hr)
* DTW=Depth to Water G:\OId I Drive\Zac\Water Transfers\2013\San Luis - eIta Mendota Water Authority\Monitoring Data\Weekly Monitoring\SLDMWA_WeIIData.xlsx

WATER QUALITY FIELD DATA SHEET
Project Name: GCID 2013 Water Tansfer
Notes:
Well No. Time DTW* Pump Q Total Vol
gpm Ac.-ft.
> /1
Date: IField Staff:
S.C. Temp. D ORP (mV) TDS (g/I)
O. Turbidity Power pH
(mS/CM) (°C) (mg/1) NTU I I I (kw-hr) Coments
* DTWDe pth to Water G:\Old I Drive\Zac\Water Transfers\2013\San Luis - Delta Mendota Water Authority\Monitoring Data\Weekly Mon itoring\SLDMWAWeIIData.xlsx

Project Name: GCID 2013 Water Tansfer
Notes:
Well No. Time DTW* Pump 0 Total Vol
gpm Ac.-ft.
WATER QUALITY FIELD DATA SHEET
Date://7i Ije1d Staff: ni S.C. Temp. D.O. Turbidity Power
pH (mS/CM) (°C) (mg/I) NTU
ORP (mV) TDS (g/l) (kw-hr)
Coments
*DTWDepth to Water G:\OId I Drive\Zac\Water Transfers\2013\San Luis - Delta Mendota Water Authority\Monitoring Data\Weekly Monitoririg\SLDMWAWeIIData.xlsx

WATER QUALITY FIELD DATA SHEET
Project Name: GCID 2013 Water Tansfer IDate: ///// IField Staff: r: Ri,’ i 1’l Notes:
Pump Q Total Vol S.C. Temp. D.O. Turbidity Power Well No. Time DTW* pH ORP (my) TDS (g/l) Coments
gpm Ac-ft. (MS/CM) ( ,C) (mg/ 1 ) NTU (kw-hr)
ZL-
. /
* DTW=Depth to Water G:\OId I Drive\Zac\Water Transfers\2013\San Luis - Delta Mendota Water Authority\Monitoring Data\Weekly Monitoring\SLDMWA_WeIIData.xlsx
WATER QUALITY FIELD DATA SHEET
Project Name: GCID 2013 Water Tansfer Date: Z . . Field Staff: R, IMI! Notes:
Well No. Time DTW* Pump 0
gpm
Total Vol pH
S.C.
(mS/CM)
Temp.
(°C)
D.O.
(mg/ 1 )
Turbidity
NTU ORP (mV) TDS (g/I)
Power
(kw-hr) Coments
* DTW=Depth to Water G:\OId I Drive\Zac\Water Transfers\2013\San Luis - Delta Mendota Water Authority\Monitoring Data\Weekly Monitoring\SLDMWA_WellData.xlsx
WATER QUALITY FIELD DATA SHEET
Project Name: GCID 2013 Water Tansfer IDate: Field Staff: gm%- 1 n
Notes:
Pump Q Total Vol S.C. Temp. D.O. Turbidity Power Well No. Time DTW* pH ORP (my) TDS (g/l) Coments
gpm Ac.-ft. (MS/CM) (*C) (mg/1) NTU (kw-hr)
I i
* DTW=Depth to Water G:\OId I Drive\Zac\Water Transfers\2013\San Luis - Delta Mendota Water Authority\Monitoring Data\Weekly Monitoring\SLDMWA_WeIlData.xlsx

WATER QUALITY FIELD DATA SHEET
Project Name: GCID 2013 Water Tansfer Date: I Field Staff:
N n._
otes:
Pump Q Total Vol S.C. Temp. D.O. Turbidity Power Well No. Time DTW* pH ORP (mV) TDS (g/l) Coments
gpm Ac.-ft. (MS/CM) ( C) (mg/ 1 ) NTU (kw-hr)
. ___ _ ______ ___ ________
* DTW=Depth to Water G:\OId I Drive\Zac\Water Transfers\2013\San Luis - Delta Mendota Water Authority\Monitoring Data\Weekly Monitoring\SLDMWA_WeIIData.xlsx

WATER QUALITY FIELD DATA SHEET
Project Name: GCID2Ol3 Water Tansfer Date: IField Stall: Notes:
Pump Q Total Vol S.C. Temp. D.O. Turbidity Power Well No. Time DTW* pH ORP (mV) TDS (g/l) Coments
gpm Ac.-ft. (mS/CM) (°C) mg/1 NTU (kw-hr)
* DTW=Depth to Water G:\OId I Drive\Zac\Water Transfers\2013\San Luis - Delta Mendota Water Authority\Monitoring Data\Weekly Monitoring\SLDMWA_WeIIDataxlsx

WATER QUALITY FIELD DATA SHEET
Project Name: GCID 2013 WaterTf a te: 1 r I fl Notes:
Pump Q Total Vol S.C. Temp. D.O. Turbidity Power Well No. Time DTW* pH ORP (my) TDS (g/l) i>; Coments
gpm Ac.-ft. (mS/CM) ( C) (mg/ 1 ) NTU (kw-hr)
* DTW=Depth to Water G:\OId I Drivc\Zac\Water Transfers\2013\San Luis - Delta Mendota Water Authority\Monitoring Data\Weekly Monitoring\SLDMWAWeIIData.xlsx

APPENDIX B DWR Seller Groundwater Data Forms

Directions: Key in data from the "Seller Groundwater Data Collection Form" into the applicable input columns in green below.
State/Agency Well Number
Production Well Name
MeasuringAgency
Measurement Date
Measure Time (24 Hour
Time)
Water Level(Feet Below Reference
Point)
Reference Point*(ex. Top of Casing, Sounding
Tube, etc.)
Specific Conductance
Units(µS/cm)
pH (pH units)
Temperature
(ºF or ºC)Instantaneous
Flow RateFlow Rate Units
(gpm or cfs)Totalizer Reading
Cumulative Totalizer Volume
Totalizer Units(Gallons,
Acre-Feet, etc.)
Power Reading
Power Consumption
Power Units (KWH or hours of operation)
22N02W02J001M GCID 1 GCID 3/1/13 0:00 24.00 164.00 (Sounding Tube)22N02W02J001M GCID 1 GCID 4/1/13 0:00 23.70 164.00 (Sounding Tube)22N02W02J001M GCID 1 GCID 5/1/13 0:00 25.60 164.00 (Sounding Tube)22N02W02J001M GCID 1 GCID 6/1/13 0:00 30.00 164.00 (Sounding Tube)22N02W02J001M GCID 1 GCID 6/30/13 0:00 N/D 164.00 (Sounding Tube) 1969.93 Note: Initial Prepumping Value22N02W02J001M GCID 1 GCID 7/1/13 10:00 144.15 164.00 (Sounding Tube) 412 µS/cm 8.12 23.33 3000 gpm 1970.67 0.74 Acre-Feet N/D N/D KWH22N02W02J001M GCID 1 GCID 7/2/13 10:18 180.70 164.00 (Sounding Tube) µS/cm N/D N/D 3000 gpm 1983.05 13.12 Acre-Feet N/D N/D KWH22N02W02J001M GCID 1 GCID 7/11/13 10:18 204.70 164.00 (Sounding Tube) 524 µS/cm 7.99 25.77 3000 gpm 2104.64 134.71 Acre-Feet N/D N/D KWH22N02W02J001M GCID 1 GCID 7/15/13 14:56 208.30 164.00 (Sounding Tube) µS/cm N/D N/D 3000 gpm 2156.6 186.67 Acre-Feet N/D N/D KWH22N02W02J001M GCID 1 GCID 7/18/13 11:15 213.13 164.00 (Sounding Tube) 457 µS/cm 8.34 28.88 3000 gpm 2193.25 223.32 Acre-Feet N/D N/D KWH22N02W02J001M GCID 1 GCID 7/25/13 13:09 217.70 164.00 (Sounding Tube) 545 µS/cm 7.65 27.19 3000 gpm 2285.43 315.5 Acre-Feet N/D N/D KWH22N02W02J001M GCID 1 GCID 8/1/13 8:19 220.90 164.00 (Sounding Tube) 479 µS/cm 7.28 23.37 3000 gpm 2373.04 403.11 Acre-Feet N/D N/D KWH22N02W02J001M GCID 1 GCID 8/8/13 8:13 223.60 164.00 (Sounding Tube) 527 µS/cm 7.56 23.1 3000 gpm 2462.4 492.47 Acre-Feet N/D N/D KWH22N02W02J001M GCID 1 GCID 8/15/13 9:17 225.60 164.00 (Sounding Tube) 522 µS/cm 7.27 23.84 3000 gpm 2551.79 581.86 Acre-Feet N/D N/D KWH22N02W02J001M GCID 1 GCID 8/22/13 8:54 226.90 164.00 (Sounding Tube) 503 µS/cm 7.84 23.78 3000 gpm 2639.85 669.92 Acre-Feet N/D N/D KWH22N02W02J001M GCID 1 GCID 8/29/13 8:10 224.90 164.00 (Sounding Tube) 485 µS/cm 7.47 24.32 3000 gpm 2738.35 768.42 Acre-Feet N/D N/D KWH22N02W02J001M GCID 1 GCID 9/5/13 9:39 225.60 164.00 (Sounding Tube) 467 µS/cm 6.41 23.85 2750 gpm 2812.28 842.35 Acre-Feet N/D N/D KWH22N02W02J001M GCID 1 GCID 9/12/13 8:18 227.30 164.00 (Sounding Tube) 504 µS/cm 7.30 23.26 2750 gpm 2897.42 927.49 Acre-Feet N/D N/D KWH22N02W02J001M GCID 1 GCID 9/19/13 8:03 213.50 164.00 (Sounding Tube) 528 µS/cm 7.20 22.6 2750 gpm 2966.8 996.87 Acre-Feet N/D N/D KWH22N02W02J001M GCID 1 GCID 9/25/13 11:55 218.58 164.00 (Sounding Tube) 471 µS/cm 8.46 23.59 2750 gpm 3039.8 1069.87 Acre-Feet N/D N/D KWH22N02W02J001M GCID 1 GCID 10/3/13 9:57 70.90 164.00 (Sounding Tube)22N02W02J001M GCID 1 GCID 10/10/13 9:21 63.30 164.00 (Sounding Tube)22N02W02J001M GCID 1 GCID 10/17/13 8:22 58.70 164.00 (Sounding Tube)22N02W02J001M GCID 1 GCID 10/21/13 8:41 56.70 164.00 (Sounding Tube)22N02W02J001M GCID 1 GCID 10/31/13 9:40 52.80 164.00 (Sounding Tube)22N02W02J001M GCID 1 GCID 11/25/13 13:11 45.00 164.00 (Sounding Tube)22N02W02J001M GCID 1 GCID 12/27/13 10:12 39.70 164.00 (Sounding Tube)22N02W02J001M GCID 1 GCID 1/29/14 12:21 37.00 164.00 (Sounding Tube)22N02W02J001M GCID 1 GCID 2/27/14 10:27 38.50 164.00 (Sounding Tube)22N02W02J001M GCID 1 GCID 3/27/14 12:28 33.70 164.00 (Sounding Tube)
2013 Water Transfer Program
Comments such as water quality meter calibration information, unusual site conditions,
etc…
STATE OF CALIFORNIATHE NATURAL RESOURCES AGENCYDEPARTMENT OF WATER RESOURCES
Seller Groundwater Data Electronic Reporting Form
General Seller and Well Information Production Well Flow, Volume, and Energy UsageWater Quality
Required OptionalGroundwater LevelsDate/Time
Directions: Key in data from the "Seller Groundwater Data Collection Form" into the applicable input columns in green below.
State/Agency Well Number
Production Well Name
MeasuringAgency
Measurement Date
Measure Time (24 Hour
Time)
Water Level(Feet Below Reference
Point)
Reference Point*(ex. Top of Casing, Sounding
Tube, etc.)
Specific Conductance
Units(µS/cm)
pH (pH units)
Temperature
(ºF or ºC)Instantaneous
Flow RateFlow Rate Units
(gpm or cfs)Totalizer Reading
Cumulative Totalizer Volume
Totalizer Units(Gallons,
Acre-Feet, etc.)
Power Reading
Power Consumption
Power Units (KWH or hours of operation)
2013 Water Transfer Program
Comments such as water quality meter calibration information, unusual site conditions,
etc…
STATE OF CALIFORNIATHE NATURAL RESOURCES AGENCYDEPARTMENT OF WATER RESOURCES
Seller Groundwater Data Electronic Reporting Form
General Seller and Well Information Production Well Flow, Volume, and Energy UsageWater Quality
Required OptionalGroundwater LevelsDate/Time
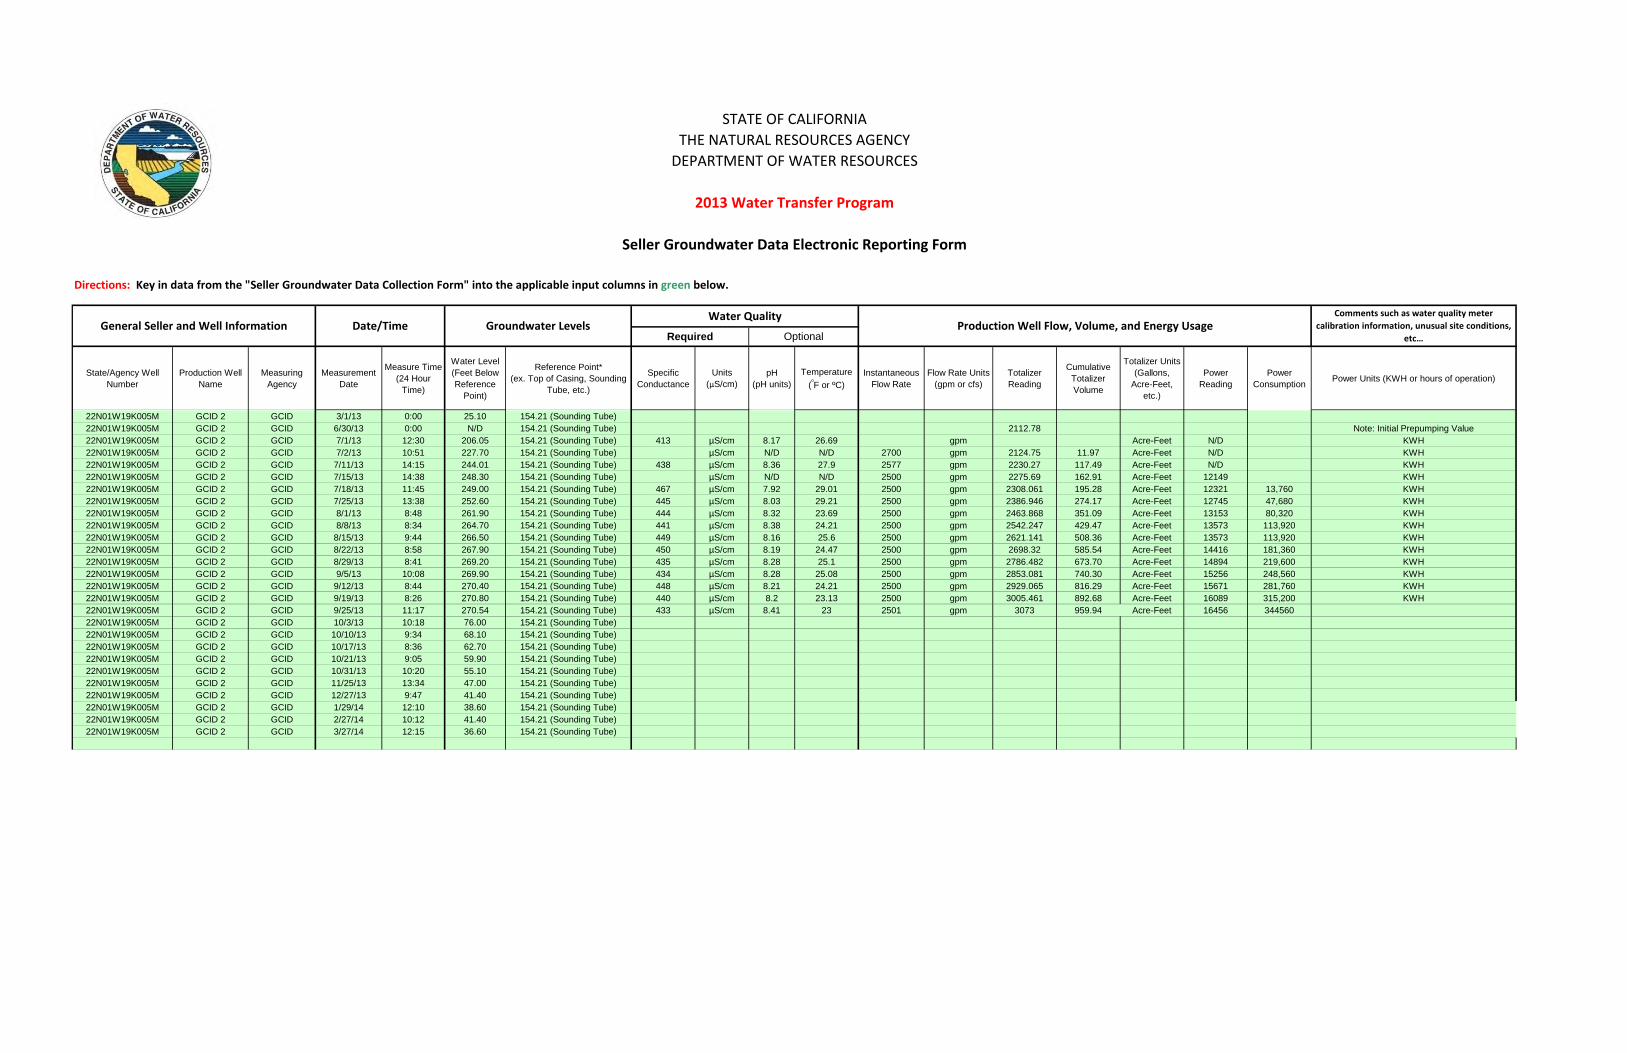
22N01W19K005M GCID 2 GCID 3/1/13 0:00 25.10 154.21 (Sounding Tube)22N01W19K005M GCID 2 GCID 6/30/13 0:00 N/D 154.21 (Sounding Tube) 2112.78 Note: Initial Prepumping Value22N01W19K005M GCID 2 GCID 7/1/13 12:30 206.05 154.21 (Sounding Tube) 413 µS/cm 8.17 26.69 gpm Acre-Feet N/D KWH22N01W19K005M GCID 2 GCID 7/2/13 10:51 227.70 154.21 (Sounding Tube) µS/cm N/D N/D 2700 gpm 2124.75 11.97 Acre-Feet N/D KWH22N01W19K005M GCID 2 GCID 7/11/13 14:15 244.01 154.21 (Sounding Tube) 438 µS/cm 8.36 27.9 2577 gpm 2230.27 117.49 Acre-Feet N/D KWH22N01W19K005M GCID 2 GCID 7/15/13 14:38 248.30 154.21 (Sounding Tube) µS/cm N/D N/D 2500 gpm 2275.69 162.91 Acre-Feet 12149 KWH22N01W19K005M GCID 2 GCID 7/18/13 11:45 249.00 154.21 (Sounding Tube) 467 µS/cm 7.92 29.01 2500 gpm 2308.061 195.28 Acre-Feet 12321 13,760 KWH22N01W19K005M GCID 2 GCID 7/25/13 13:38 252.60 154.21 (Sounding Tube) 445 µS/cm 8.03 29.21 2500 gpm 2386.946 274.17 Acre-Feet 12745 47,680 KWH22N01W19K005M GCID 2 GCID 8/1/13 8:48 261.90 154.21 (Sounding Tube) 444 µS/cm 8.32 23.69 2500 gpm 2463.868 351.09 Acre-Feet 13153 80,320 KWH22N01W19K005M GCID 2 GCID 8/8/13 8:34 264.70 154.21 (Sounding Tube) 441 µS/cm 8.38 24.21 2500 gpm 2542.247 429.47 Acre-Feet 13573 113,920 KWH22N01W19K005M GCID 2 GCID 8/15/13 9:44 266.50 154.21 (Sounding Tube) 449 µS/cm 8.16 25.6 2500 gpm 2621.141 508.36 Acre-Feet 13573 113,920 KWH22N01W19K005M GCID 2 GCID 8/22/13 8:58 267.90 154.21 (Sounding Tube) 450 µS/cm 8.19 24.47 2500 gpm 2698.32 585.54 Acre-Feet 14416 181,360 KWH22N01W19K005M GCID 2 GCID 8/29/13 8:41 269.20 154.21 (Sounding Tube) 435 µS/cm 8.28 25.1 2500 gpm 2786.482 673.70 Acre-Feet 14894 219,600 KWH22N01W19K005M GCID 2 GCID 9/5/13 10:08 269.90 154.21 (Sounding Tube) 434 µS/cm 8.28 25.08 2500 gpm 2853.081 740.30 Acre-Feet 15256 248,560 KWH22N01W19K005M GCID 2 GCID 9/12/13 8:44 270.40 154.21 (Sounding Tube) 448 µS/cm 8.21 24.21 2500 gpm 2929.065 816.29 Acre-Feet 15671 281,760 KWH22N01W19K005M GCID 2 GCID 9/19/13 8:26 270.80 154.21 (Sounding Tube) 440 µS/cm 8.2 23.13 2500 gpm 3005.461 892.68 Acre-Feet 16089 315,200 KWH22N01W19K005M GCID 2 GCID 9/25/13 11:17 270.54 154.21 (Sounding Tube) 433 µS/cm 8.41 23 2501 gpm 3073 959.94 Acre-Feet 16456 34456022N01W19K005M GCID 2 GCID 10/3/13 10:18 76.00 154.21 (Sounding Tube)22N01W19K005M GCID 2 GCID 10/10/13 9:34 68.10 154.21 (Sounding Tube)22N01W19K005M GCID 2 GCID 10/17/13 8:36 62.70 154.21 (Sounding Tube)22N01W19K005M GCID 2 GCID 10/21/13 9:05 59.90 154.21 (Sounding Tube)22N01W19K005M GCID 2 GCID 10/31/13 10:20 55.10 154.21 (Sounding Tube)22N01W19K005M GCID 2 GCID 11/25/13 13:34 47.00 154.21 (Sounding Tube)22N01W19K005M GCID 2 GCID 12/27/13 9:47 41.40 154.21 (Sounding Tube)22N01W19K005M GCID 2 GCID 1/29/14 12:10 38.60 154.21 (Sounding Tube)22N01W19K005M GCID 2 GCID 2/27/14 10:12 41.40 154.21 (Sounding Tube)22N01W19K005M GCID 2 GCID 3/27/14 12:15 36.60 154.21 (Sounding Tube)

Directions: Key in data from the "Seller Groundwater Data Collection Form" into the applicable input columns in green below.
State/Agency Well Number
Production Well Name
MeasuringAgency
Measurement Date
Measure Time (24 Hour
Time)
Water Level(Feet Below Reference
Point)
Reference Point*(ex. Top of Casing, Sounding
Tube, etc.)
Specific Conductance
Units(µS/cm)
pH (pH units)
Temperature
(ºF or ºC)Instantaneous
Flow RateFlow Rate Units
(gpm or cfs)Totalizer Reading
Cumulative Totalizer Volume
Totalizer Units(Gallons,
Acre-Feet, etc.)
Power Reading
Power Consumption
Power Units (KWH or hours of operation)
2013 Water Transfer Program
Comments such as water quality meter calibration information, unusual site conditions,
etc…
STATE OF CALIFORNIATHE NATURAL RESOURCES AGENCYDEPARTMENT OF WATER RESOURCES
Seller Groundwater Data Electronic Reporting Form
General Seller and Well Information Production Well Flow, Volume, and Energy UsageWater Quality
Required OptionalGroundwater LevelsDate/Time
21N01W05D001M GCID 3 GCID 3/1/13 0:00 31.70 150.70 (Sounding Tube)21N01W05D001M GCID 3 GCID 4/1/13 0:00 31.20 150.70 (Sounding Tube)21N01W05D001M GCID 3 GCID 5/1/13 0:00 32.15 150.70 (Sounding Tube)21N01W05D001M GCID 3 GCID 6/1/13 0:00 35.60 150.70 (Sounding Tube)21N01W05D001M GCID 3 GCID 6/30/13 0:00 N/D 150.70 (Sounding Tube) 2500.65 Note: Initial Prepumping Value21N01W05D001M GCID 3 GCID 7/1/13 11:00 126.10 150.70 (Sounding Tube) 478 µS/cm 8.14 26.65 2700 gpm 2502.02 1.37 Acre-Feet N/D KWH21N01W05D001M GCID 3 GCID 7/2/13 11:15 139.50 150.70 (Sounding Tube) µS/cm N/D N/D 2600 gpm 2513.88 13.23 Acre-Feet N/D KWH21N01W05D001M GCID 3 GCID 7/11/13 11:01 155.40 150.70 (Sounding Tube) 483 µS/cm 8.33 27.04 2600 gpm 2618.71 118.06 Acre-Feet N/D KWH21N01W05D001M GCID 3 GCID 7/15/13 14:25 158.60 150.70 (Sounding Tube) µS/cm N/D N/D 2500 gpm 2664.165 163.52 Acre-Feet 11282 KWH21N01W05D001M GCID 3 GCID 7/18/13 12:59 160.60 150.70 (Sounding Tube) 446 µS/cm 8.43 28.75 2500 gpm 2697.383 196.73 Acre-Feet 11450 13,440 KWH21N01W05D001M GCID 3 GCID 7/25/13 14:00 197.60 150.70 (Sounding Tube) 480 µS/cm 8.42 29.14 2700 gpm 2774.25 273.60 Acre-Feet 11822 43,200 KWH21N01W05D001M GCID 3 GCID 8/1/13 9:31 194.60 150.70 (Sounding Tube) 488 µS/cm 8.36 23.69 2600 gpm 2854.89 354.24 Acre-Feet 12232 76,000 KWH21N01W05D001M GCID 3 GCID 8/8/13 8:57 194.10 150.70 (Sounding Tube) 458 µS/cm 8.34 23.58 2600 gpm 2935.624 434.97 Acre-Feet 12651 109,520 KWH21N01W05D001M GCID 3 GCID 8/15/13 10:07 195.30 150.70 (Sounding Tube) 459 µS/cm 8.24 25.01 2600 gpm 3015.417 514.77 Acre-Feet 13076 143,520 KWH21N01W05D001M GCID 3 GCID 8/22/13 9:22 196.30 150.70 (Sounding Tube) 462 µS/cm 8.16 24.1 2500 gpm 3093.808 593.16 Acre-Feet 13494 176,960 KWH21N01W05D001M GCID 3 GCID 8/29/13 9:08 197.10 150.70 (Sounding Tube) 450 µS/cm 8.38 24.44 2500 gpm 3183.344 682.69 Acre-Feet 13967 214,800 KWH21N01W05D001M GCID 3 GCID 9/5/13 10:30 197.60 150.70 (Sounding Tube) 453 µS/cm 8.33 24.35 2500 gpm 3251.23 750.58 Acre-Feet 14326 243,520 KWH21N01W05D001M GCID 3 GCID 9/12/13 9:13 198.10 150.70 (Sounding Tube) 467 µS/cm 8.24 23.55 2500 gpm 3329.124 828.47 Acre-Feet 14738 276,480 KWH21N01W05D001M GCID 3 GCID 9/19/13 8:51 198.50 150.70 (Sounding Tube) 466 µS/cm 8.20 23.34 2500 gpm 3407.458 906.81 Acre-Feet 15152 309,600 KWH21N01W05D001M GCID 3 GCID 9/25/13 11:17 196.39 150.70 (Sounding Tube) 476 µS/cm 9.09 21.1 2501 gpm 3513.695 1013.05 Acre-Feet 15510 338,240 KWH21N01W05D001M GCID 3 GCID 10/3/13 10:29 70.70 150.70 (Sounding Tube)21N01W05D001M GCID 3 GCID 10/10/13 9:45 63.50 150.70 (Sounding Tube)21N01W05D001M GCID 3 GCID 10/17/13 8:47 59.10 150.70 (Sounding Tube)21N01W05D001M GCID 3 GCID 10/21/13 9:05 57.10 150.70 (Sounding Tube)21N01W05D001M GCID 3 GCID 10/31/13 10:30 53.60 150.70 (Sounding Tube)21N01W05D001M GCID 3 GCID 11/25/13 13:34 49.20 150.70 (Sounding Tube)21N01W05D001M GCID 3 GCID 12/27/13 9:32 44.20 150.70 (Sounding Tube)21N01W05D001M GCID 3 GCID 1/29/14 11:59 42.60 150.70 (Sounding Tube)21N01W05D001M GCID 3 GCID 2/27/14 9:57 44.00 150.70 (Sounding Tube)21N01W05D001M GCID 3 GCID 3/27/14 12:00 40.00 150.70 (Sounding Tube)
Directions: Key in data from the "Seller Groundwater Data Collection Form" into the applicable input columns in green below.
State/Agency Well Number
Production Well Name
MeasuringAgency
Measurement Date
Measure Time (24 Hour
Time)
Water Level(Feet Below Reference
Point)
Reference Point*(ex. Top of Casing, Sounding
Tube, etc.)
Specific Conductance
Units(µS/cm)
pH (pH units)
Temperature
(ºF or ºC)Instantaneous
Flow RateFlow Rate Units
(gpm or cfs)Totalizer Reading
Cumulative Totalizer Volume
Totalizer Units(Gallons,
Acre-Feet, etc.)
Power Reading
Power Consumption
Power Units (KWH or hours of operation)
2013 Water Transfer Program
Comments such as water quality meter calibration information, unusual site conditions,
etc…
STATE OF CALIFORNIATHE NATURAL RESOURCES AGENCYDEPARTMENT OF WATER RESOURCES
Seller Groundwater Data Electronic Reporting Form
General Seller and Well Information Production Well Flow, Volume, and Energy UsageWater Quality
Required OptionalGroundwater LevelsDate/Time
21N01W31H001M GCID 4 GCID 3/1/13 0:00 29.90 143.89 (Sounding Tube)21N01W31H001M GCID 4 GCID 4/1/13 0:00 29.20 143.89 (Sounding Tube)21N01W31H001M GCID 4 GCID 5/1/13 0:00 30.35 143.89 (Sounding Tube)21N01W31H001M GCID 4 GCID 6/1/13 0:00 33.30 143.89 (Sounding Tube)21N01W31H001M GCID 5 GCID 6/30/13 0:00 N/D 143.89 (Sounding Tube) 2091.64 Note: Initial Prepumping Value21N01W31H001M GCID 4 GCID 7/1/13 11:20 156.40 143.89 (Sounding Tube) 546 µS/cm 8.22 25.59 2500 gpm 2092.82 1.18 Acre-Feet N/D KWH21N01W31H001M GCID 4 GCID 7/2/13 11:27 174.90 143.89 (Sounding Tube) µS/cm N/D N/D 2500 gpm 2103.758 12.12 Acre-Feet N/D KWH21N01W31H001M GCID 4 GCID 7/11/13 11:41 192.90 143.89 (Sounding Tube) 445 µS/cm 6.77 28.92 2500 gpm 2205.171 113.53 Acre-Feet N/D KWH21N01W31H001M GCID 4 GCID 7/15/13 14:12 196.10 143.89 (Sounding Tube) µS/cm N/D N/D 2500 gpm 2248.826 157.19 Acre-Feet 11677 KWH21N01W31H001M GCID 4 GCID 7/18/13 13:28 200.30 143.89 (Sounding Tube) 542 µS/cm 8.44 29.35 2500 gpm 2281.521 189.88 Acre-Feet 11852 14,000 KWH21N01W31H001M GCID 4 GCID 7/25/13 14:29 203.30 143.89 (Sounding Tube) 558 µS/cm 8.39 28.89 2500 gpm 2360.123 268.48 Acre-Feet 12271 47,520 KWH21N01W31H001M GCID 4 GCID 8/1/13 10:02 205.30 143.89 (Sounding Tube) 582 µS/cm 8.30 23.14 2500 gpm 2435.252 343.61 Acre-Feet 12674 79,760 KWH21N01W31H001M GCID 4 GCID 8/8/13 9:25 207.00 143.89 (Sounding Tube) 579 µS/cm 8.32 23.32 2500 gpm 2511.624 419.98 Acre-Feet 13088 112,880 KWH21N01W31H001M GCID 4 GCID 8/15/13 10:38 208.00 143.89 (Sounding Tube) 579 µS/cm 8.23 24.85 2500 gpm 2588.616 496.98 Acre-Feet 13508 146,480 KWH21N01W31H001M GCID 4 GCID 8/22/13 9:55 208.80 143.89 (Sounding Tube) 562 µS/cm 8.17 23.66 2500 gpm 2664.563 572.92 Acre-Feet 13921 179,520 KWH21N01W31H001M GCID 4 GCID 8/29/13 9:37 212.10 143.89 (Sounding Tube) 572 µS/cm 8.30 24.2 2500 gpm 2751.707 660.07 Acre-Feet 14393 217,280 KWH21N01W31H001M GCID 4 GCID 9/5/13 11:02 213.30 143.89 (Sounding Tube) 577 µS/cm 8.22 23.7 2500 gpm 2819.145 727.51 Acre-Feet 14754 246,160 KWH21N01W31H001M GCID 4 GCID 9/12/13 9:46 213.50 143.89 (Sounding Tube) 538 µS/cm 8.32 23.2 2500 gpm 2896.368 804.73 Acre-Feet 15168 279,280 KWH21N01W31H001M GCID 4 GCID 9/19/13 9:22 214.00 143.89 (Sounding Tube) 584 µS/cm 8.23 22.14 2500 gpm 2973.968 882.33 Acre-Feet 15583 312,480 KWH21N01W31H001M GCID 4 GCID 9/25/13 10:47 214.40 143.89 (Sounding Tube) 620 µS/cm 6.70 19.8 2501 gpm 3041.529 949.89 Acre-Feet 15944 341,360 KWH21N01W31H001M GCID 4 GCID 10/3/13 10:46 63.50 143.89 (Sounding Tube)21N01W31H001M GCID 4 GCID 10/10/13 9:58 57.40 143.89 (Sounding Tube)21N01W31H001M GCID 4 GCID 10/17/13 9:01 53.90 143.89 (Sounding Tube)21N01W31H001M GCID 4 GCID 10/21/13 8:58 52.20 143.89 (Sounding Tube)21N01W31H001M GCID 4 GCID 10/31/13 10:51 49.30 143.89 (Sounding Tube)21N01W31H001M GCID 4 GCID 11/25/13 13:44 45.00 143.89 (Sounding Tube)21N01W31H001M GCID 4 GCID 12/27/13 9:17 41.50 143.89 (Sounding Tube)21N01W31H001M GCID 4 GCID 1/29/14 11:51 40.00 143.89 (Sounding Tube)21N01W31H001M GCID 4 GCID 2/27/14 9:46 40.70 143.89 (Sounding Tube)21N01W31H001M GCID 4 GCID 3/27/14 11:48 37.60 143.89 (Sounding Tube)

Directions: Key in data from the "Seller Groundwater Data Collection Form" into the applicable input columns in green below.
State/Agency Well Number
Production Well Name
MeasuringAgency
Measurement Date
Measure Time (24 Hour
Time)
Water Level(Feet Below Reference
Point)
Reference Point*(ex. Top of Casing, Sounding
Tube, etc.)
Specific Conductance
Units(µS/cm)
pH (pH units)
Temperature
(ºF or ºC)Instantaneous
Flow RateFlow Rate Units
(gpm or cfs)Totalizer Reading
Cumulative Totalizer Volume
Totalizer Units(Gallons,
Acre-Feet, etc.)
Power Reading
Power Consumption
Power Units (KWH or hours of operation)
2013 Water Transfer Program
Comments such as water quality meter calibration information, unusual site conditions,
etc…
STATE OF CALIFORNIATHE NATURAL RESOURCES AGENCYDEPARTMENT OF WATER RESOURCES
Seller Groundwater Data Electronic Reporting Form
General Seller and Well Information Production Well Flow, Volume, and Energy UsageWater Quality
Required OptionalGroundwater LevelsDate/Time
21N02W36A001M GCID 5 GCID 3/1/13 0:00 29.30 134.70 (Sounding Tube)21N02W36A001M GCID 5 GCID 4/1/13 0:00 29.50 134.70 (Sounding Tube)21N02W36A001M GCID 5 GCID 5/1/13 0:00 37.70 134.70 (Sounding Tube)21N02W36A001M GCID 5 GCID 6/1/13 0:00 37.70 134.70 (Sounding Tube)21N02W36A001M GCID 5 GCID 6/30/13 0:00 N/D 134.70 (Sounding Tube) 0 Note: Initial Prepumping Value21N02W36A001M GCID 5 GCID 7/1/13 12:00 57.15 134.70 (Sounding Tube) 355 µS/cm 7.84 22.26 2600 gpm Acre-Feet N/D KWH21N02W36A001M GCID 5 GCID 7/2/13 11:46 58.80 134.70 (Sounding Tube) µS/cm N/D N/D 2600 gpm 12.44 12.44 Acre-Feet N/D KWH21N02W36A001M GCID 5 GCID 7/11/13 15:20 58.80 134.70 (Sounding Tube) 408 µS/cm 7.95 25.36 2600 gpm 118.74 118.74 Acre-Feet N/D KWH21N02W36A001M GCID 5 GCID 7/15/13 13:56 60.40 134.70 (Sounding Tube) µS/cm N/D N/D 2600 gpm 164.187 164.19 Acre-Feet 139.15 KWH21N02W36A001M GCID 5 GCID 7/18/13 13:51 57.90 134.70 (Sounding Tube) 397 µS/cm 8.01 26.75 2600 gpm 199.072 199.07 Acre-Feet 914.13 KWH21N02W36A001M GCID 5 GCID 7/25/13 14:50 58.60 134.70 (Sounding Tube) 425 µS/cm 8.00 26.21 2600 gpm 280.962 280.96 Acre-Feet 468.58 KWH21N02W36A001M GCID 5 GCID 8/1/13 10:29 55.60 134.70 (Sounding Tube) 443 µS/cm 7.83 21.23 2600 gpm 360.633 360.63 Acre-Feet 590.77 58,751 KWH21N02W36A001M GCID 5 GCID 8/8/13 9:05 52.20 134.70 (Sounding Tube) 454 µS/cm 7.81 21.73 2600 gpm 442.464 442.46 Acre-Feet 203.97 KWH21N02W36A001M GCID 5 GCID 8/15/13 11:04 54.90 134.70 (Sounding Tube) 464 µS/cm 7.72 23.32 2600 gpm 525.238 525.24 Acre-Feet 973.21 KWH21N02W36A001M GCID 5 GCID 8/22/13 10:19 55.30 134.70 (Sounding Tube) 488 µS/cm 7.72 22.18 2600 gpm 607.343 607.34 Acre-Feet 541.12 KWH21N02W36A001M GCID 5 GCID 8/29/13 10:01 55.60 134.70 (Sounding Tube) 462 µS/cm 7.67 22.61 2600 gpm 701.522 701.52 Acre-Feet 916.66 KWH21N02W36A001M GCID 5 GCID 9/5/13 11:25 54.50 134.70 (Sounding Tube) 477 µS/cm 7.54 21.72 2600 gpm 773.123 773.12 Acre-Feet 513.59 KWH21N02W36A001M GCID 5 GCID 9/12/13 10:10 57.40 134.70 (Sounding Tube) 492 µS/cm 7.80 21.51 2600 gpm 854.97 854.97 Acre-Feet 27.61 KWH21N02W36A001M GCID 5 GCID 9/19/13 9:40 54.80 134.70 (Sounding Tube) 481 µS/cm 7.95 20.59 2600 gpm 937.198 937.20 Acre-Feet 581.14 KWH21N02W36A001M GCID 5 GCID 9/25/13 7:26 50.00 134.70 (Sounding Tube) 515 µS/cm 6.36 18.65 2700 gpm 1007.38 1007.38 Acre-Feet N/D KWH21N02W36A001M GCID 5 GCID 10/3/13 10:59 31.80 134.70 (Sounding Tube)21N02W36A001M GCID 5 GCID 10/10/13 13:55 34.00 134.70 (Sounding Tube)21N02W36A001M GCID 5 GCID 10/17/13 9:13 33.40 134.70 (Sounding Tube)21N02W36A001M GCID 5 GCID 10/21/13 8:41 33.90 134.70 (Sounding Tube)21N02W36A001M GCID 5 GCID 10/31/13 11:03 33.00 134.70 (Sounding Tube)21N02W36A001M GCID 5 GCID 11/25/13 13:58 32.23 134.70 (Sounding Tube)21N02W36A001M GCID 5 GCID 11/25/13 13:58 32.23 134.70 (Sounding Tube)21N02W36A001M GCID 5 GCID 12/27/13 9:05 33.10 134.70 (Sounding Tube)21N02W36A001M GCID 5 GCID 1/29/14 11:38 35.60 134.70 (Sounding Tube)21N02W36A001M GCID 5 GCID 2/27/14 9:30 32.30 134.70 (Sounding Tube)21N02W36A001M GCID 5 GCID 3/27/14 11:30 31.30 134.70 (Sounding Tube)

Directions: Key in data from the "Seller Groundwater Data Collection Form" into the applicable input columns in green below.
State/Agency Well Number
Monitoring Well NameMeasuring
AgencyMeasurement
Date
Measure Time (24 Hour
Time)
Water Level(Feet Below Reference
Point)
Reference Point(ex. Top of
Casing, Sounding Tube, etc.)
20N02W11A001M 20N02W11A001M DWR 3/18/13 0:00 10.02 125.90 (TOC)20N02W11A001M 20N02W11A001M DWR 5/23/13 0:00 7.00 125.90 (TOC)20N02W11A001M 20N02W11A001M DWR 6/26/13 0:00 4.66 125.90 (TOC)20N02W11A001M 20N02W11A001M DWR 7/3/13 0:00 3.94 125.90 (TOC)20N02W11A001M 20N02W11A001M DWR 7/9/13 0:00 3.75 125.90 (TOC)20N02W11A001M 20N02W11A001M DWR 7/16/13 0:00 5.80 125.90 (TOC)20N02W11A001M 20N02W11A001M DWR 7/24/13 0:00 5.20 125.90 (TOC)20N02W11A001M 20N02W11A001M DWR 7/29/13 0:00 4.87 125.90 (TOC)20N02W11A001M 20N02W11A001M DWR 8/6/13 0:00 3.20 125.90 (TOC)20N02W11A001M 20N02W11A001M DWR 8/13/13 0:00 3.76 125.90 (TOC)20N02W11A001M 20N02W11A001M DWR 8/20/13 0:00 3.30 125.90 (TOC)20N02W11A001M 20N02W11A001M DWR 9/4/13 0:00 4.78 125.90 (TOC)20N02W11A001M 20N02W11A001M DWR 9/12/13 0:00 6.00 125.90 (TOC)20N02W11A001M 20N02W11A001M DWR 9/18/13 0:00 7.16 125.90 (TOC)20N02W11A001M 20N02W11A001M DWR 10/8/13 0:00 8.03 125.90 (TOC)20N02W11A001M 20N02W11A001M DWR 10/15/13 0:00 7.39 125.90 (TOC)20N02W11A001M 20N02W11A001M DWR 10/25/13 0:00 5.20 125.90 (TOC)20N02W11A001M 20N02W11A001M DWR 11/21/13 0:00 9.16 125.90 (TOC)20N02W11A001M 20N02W11A001M DWR 12/18/13 0:00 11.60 125.90 (TOC)20N02W11A001M 20N02W11A001M DWR 1/15/14 0:00 12.92 125.90 (TOC)20N02W11A001M 20N02W11A001M DWR 2/19/14 0:00 13.02 125.90 (TOC)20N02W11A001M 20N02W11A001M DWR 3/17/14 0:00 9.75 125.90 (TOC)
20N02W11A002M 20N02W11A002M DWR 3/18/13 0:00 13.83 125.40 (TOC)20N02W11A002M 20N02W11A002M DWR 5/23/13 0:00 13.80 125.40 (TOC)20N02W11A002M 20N02W11A002M DWR 6/26/13 0:00 12.11 125.40 (TOC)20N02W11A002M 20N02W11A002M DWR 7/3/13 0:00 15.28 125.40 (TOC)20N02W11A002M 20N02W11A002M DWR 7/9/13 0:00 13.70 125.40 (TOC)20N02W11A002M 20N02W11A002M DWR 7/16/13 0:00 14.00 125.40 (TOC)20N02W11A002M 20N02W11A002M DWR 7/24/13 0:00 16.45 125.40 (TOC)20N02W11A002M 20N02W11A002M DWR 7/29/13 0:00 13.53 125.40 (TOC)20N02W11A002M 20N02W11A002M DWR 8/6/13 0:00 13.80 125.40 (TOC)20N02W11A002M 20N02W11A002M DWR 8/13/13 0:00 13.07 125.40 (TOC)20N02W11A002M 20N02W11A002M DWR 8/20/13 0:00 13.75 125.40 (TOC)20N02W11A002M 20N02W11A002M DWR 9/4/13 0:00 13.13 125.40 (TOC)20N02W11A002M 20N02W11A002M DWR 9/12/13 0:00 14.50 125.40 (TOC)20N02W11A002M 20N02W11A002M DWR 9/18/13 0:00 14.56 125.40 (TOC)20N02W11A002M 20N02W11A002M DWR 10/8/13 0:00 14.95 125.40 (TOC)20N02W11A002M 20N02W11A002M DWR 10/15/13 0:00 14.47 125.40 (TOC)20N02W11A002M 20N02W11A002M DWR 10/25/13 0:00 13.95 125.40 (TOC)20N02W11A002M 20N02W11A002M DWR 11/21/13 0:00 14.41 125.40 (TOC)20N02W11A002M 20N02W11A002M DWR 12/18/13 0:00 16.60 125.40 (TOC)20N02W11A002M 20N02W11A002M DWR 1/15/14 0:00 18.90 125.40 (TOC)20N02W11A002M 20N02W11A002M DWR 2/19/14 0:00 16.55 125.40 (TOC)20N02W11A002M 20N02W11A002M DWR 3/17/14 0:00 14.97 125.40 (TOC)
20N02W11A003M 20N02W11A003M DWR 3/18/13 0:00 21.51 125.90 (TOC)20N02W11A003M 20N02W11A003M DWR 5/23/13 0:00 30.15 125.90 (TOC)20N02W11A003M 20N02W11A003M DWR 6/26/13 0:00 25.64 125.90 (TOC)20N02W11A003M 20N02W11A003M DWR 7/3/13 0:00 33.35 125.90 (TOC)20N02W11A003M 20N02W11A003M DWR 7/9/13 0:00 32.50 125.90 (TOC)20N02W11A003M 20N02W11A003M DWR 7/16/13 0:00 32.90 125.90 (TOC)20N02W11A003M 20N02W11A003M DWR 7/24/13 0:00 31.58 125.90 (TOC)20N02W11A003M 20N02W11A003M DWR 7/29/13 0:00 31.61 125.90 (TOC)20N02W11A003M 20N02W11A003M DWR 8/6/13 0:00 29.80 125.90 (TOC)20N02W11A003M 20N02W11A003M DWR 8/13/13 0:00 29.87 125.90 (TOC)20N02W11A003M 20N02W11A003M DWR 8/20/13 0:00 29.40 125.90 (TOC)20N02W11A003M 20N02W11A003M DWR 9/4/13 0:00 28.81 125.90 (TOC)20N02W11A003M 20N02W11A003M DWR 9/12/13 0:00 29.30 125.90 (TOC)20N02W11A003M 20N02W11A003M DWR 9/18/13 0:00 28.24 125.90 (TOC)20N02W11A003M 20N02W11A003M DWR 10/8/13 0:00 22.79 125.90 (TOC)20N02W11A003M 20N02W11A003M DWR 10/15/13 0:00 23.92 125.90 (TOC)20N02W11A003M 20N02W11A003M DWR 10/25/13 0:00 23.85 125.90 (TOC)20N02W11A003M 20N02W11A003M DWR 11/21/13 0:00 22.74 125.90 (TOC)20N02W11A003M 20N02W11A003M DWR 12/18/13 0:00 25.70 125.90 (TOC)20N02W11A003M 20N02W11A003M DWR 1/15/14 0:00 24.96 125.90 (TOC)20N02W11A003M 20N02W11A003M DWR 2/19/14 0:00 22.15 125.90 (TOC)20N02W11A003M 20N02W11A003M DWR 3/17/14 0:00 20.42 125.90 (TOC)
21N01W11A001M 21N01W11A001M DWR 3/21/13 0:00 15.00 133.82 (TOC)21N01W11A001M 21N01W11A001M BC-DW&RC 5/23/13 0:00 22.05 133.82 (TOC)21N01W11A001M 21N01W11A001M DWR 6/26/13 0:00 24.72 133.82 (TOC)21N01W11A001M 21N01W11A001M DWR 7/3/13 0:00 26.32 133.82 (TOC)21N01W11A001M 21N01W11A001M BC-DW&RC 7/8/13 0:00 27.10 133.82 (TOC)21N01W11A001M 21N01W11A001M DWR 7/9/13 0:00 27.40 133.82 (TOC)21N01W11A001M 21N01W11A001M DWR 7/16/13 0:00 29.55 133.82 (TOC)21N01W11A001M 21N01W11A001M DWR 7/24/13 0:00 30.98 133.82 (TOC)21N01W11A001M 21N01W11A001M BC-DW&RC 7/30/13 0:00 32.20 133.82 (TOC)21N01W11A001M 21N01W11A001M DWR 8/6/13 0:00 33.20 133.82 (TOC)21N01W11A001M 21N01W11A001M DWR 8/13/13 0:00 33.29 133.82 (TOC)21N01W11A001M 21N01W11A001M DWR 8/20/13 0:00 33.40 133.82 (TOC)21N01W11A001M 21N01W11A001M DWR 9/4/13 0:00 33.42 133.82 (TOC)21N01W11A001M 21N01W11A001M DWR 9/12/13 0:00 33.20 133.82 (TOC)21N01W11A001M 21N01W11A001M DWR 9/18/13 0:00 32.35 133.82 (TOC)21N01W11A001M 21N01W11A001M DWR 10/8/13 0:00 29.21 133.82 (TOC)21N01W11A001M 21N01W11A001M DWR 10/17/13 0:00 27.97 133.82 (TOC)21N01W11A001M 21N01W11A001M DWR 10/25/13 0:00 27.50 133.82 (TOC)21N01W11A001M 21N01W11A001M DWR 11/22/13 0:00 25.31 133.82 (TOC)21N01W11A001M 21N01W11A001M DWR 12/18/13 0:00 23.20 133.82 (TOC)21N01W11A001M 21N01W11A001M DWR 1/15/14 0:00 23.53 133.82 (TOC)21N01W11A001M 21N01W11A001M DWR 2/19/14 0:00 23.07 133.82 (TOC)21N01W11A001M 21N01W11A001M DWR 3/17/14 0:00 20.70 133.82 (TOC)
21N01W11A002M 21N01W11A002M DWR 3/21/13 0:00 18.50 133.56 (TOC)21N01W11A002M 21N01W11A002M BC-DW&RC 5/23/13 0:00 18.75 133.56 (TOC)21N01W11A002M 21N01W11A002M DWR 6/26/13 0:00 19.22 133.56 (TOC)21N01W11A002M 21N01W11A002M DWR 7/3/13 0:00 19.58 133.56 (TOC)21N01W11A002M 21N01W11A002M BC-DW&RC 7/8/13 0:00 19.30 133.56 (TOC)
Comments such as water quality meter calibration information, unusual site conditions, etc…
General Seller and Well Information Date/Time Groundwater Level
STATE OF CALIFORNIA
THE NATURAL RESOURCES AGENCY
DEPARTMENT OF WATER RESOURCES
2012 Water Transfer Program
Seller Groundwater Data Electronic Reporting Form

Directions: Key in data from the "Seller Groundwater Data Collection Form" into the applicable input columns in green below.
State/Agency Well Number
Monitoring Well NameMeasuring
AgencyMeasurement
Date
Measure Time (24 Hour
Time)
Water Level(Feet Below Reference
Point)
Reference Point(ex. Top of
Casing, Sounding Tube, etc.)
Comments such as water quality meter calibration information, unusual site conditions, etc…
General Seller and Well Information Date/Time Groundwater Level
STATE OF CALIFORNIA
THE NATURAL RESOURCES AGENCY
DEPARTMENT OF WATER RESOURCES
2012 Water Transfer Program
Seller Groundwater Data Electronic Reporting Form
21N01W11A002M 21N01W11A002M DWR 7/9/13 0:00 19.60 133.56 (TOC)21N01W11A002M 21N01W11A002M DWR 7/16/13 0:00 19.10 133.56 (TOC)21N01W11A002M 21N01W11A002M DWR 7/24/13 0:00 18.96 133.56 (TOC)21N01W11A002M 21N01W11A002M BC-DW&RC 7/30/13 0:00 20.30 133.56 (TOC)21N01W11A002M 21N01W11A002M DWR 8/6/13 0:00 19.70 133.56 (TOC)21N01W11A002M 21N01W11A002M DWR 8/13/13 0:00 18.19 133.56 (TOC)21N01W11A002M 21N01W11A002M DWR 8/20/13 0:00 19.70 133.56 (TOC)21N01W11A002M 21N01W11A002M DWR 9/4/13 0:00 20.33 133.56 (TOC)21N01W11A002M 21N01W11A002M DWR 9/12/13 0:00 21.25 133.56 (TOC)21N01W11A002M 21N01W11A002M DWR 9/18/13 0:00 20.01 133.56 (TOC)21N01W11A002M 21N01W11A002M DWR 10/8/13 0:00 20.86 133.56 (TOC)21N01W11A002M 21N01W11A002M DWR 10/17/13 0:00 20.31 133.56 (TOC)21N01W11A002M 21N01W11A002M DWR 10/25/13 0:00 21.40 133.56 (TOC)21N01W11A002M 21N01W11A002M DWR 11/22/13 0:00 20.27 133.56 (TOC)21N01W11A002M 21N01W11A002M DWR 12/18/13 0:00 20.30 133.56 (TOC)21N01W11A002M 21N01W11A002M DWR 1/15/14 0:00 20.54 133.56 (TOC)21N01W11A002M 21N01W11A002M DWR 2/19/14 0:00 19.97 133.56 (TOC)21N01W11A002M 21N01W11A002M DWR 3/17/14 0:00 19.10 133.56 (TOC)
21N01W11A003M 21N01W11A003M DWR 3/21/13 0:00 18.30 133.23 (TOC)21N01W11A003M 21N01W11A003M BC-DW&RC 5/23/13 0:00 17.80 133.23 (TOC)21N01W11A003M 21N01W11A003M DWR 6/26/13 0:00 17.22 133.23 (TOC)21N01W11A003M 21N01W11A003M DWR 7/3/13 0:00 17.61 133.23 (TOC)21N01W11A003M 21N01W11A003M BC-DW&RC 7/8/13 0:00 17.50 133.23 (TOC)21N01W11A003M 21N01W11A003M DWR 7/9/13 0:00 17.45 133.23 (TOC)21N01W11A003M 21N01W11A003M DWR 7/16/13 0:00 17.70 133.23 (TOC)21N01W11A003M 21N01W11A003M DWR 7/24/13 0:00 17.59 133.23 (TOC)21N01W11A003M 21N01W11A003M BC-DW&RC 7/30/13 0:00 17.90 133.23 (TOC)21N01W11A003M 21N01W11A003M DWR 8/6/13 0:00 18.20 133.23 (TOC)21N01W11A003M 21N01W11A003M DWR 8/13/13 0:00 19.58 133.23 (TOC)21N01W11A003M 21N01W11A003M DWR 8/20/13 0:00 18.45 133.23 (TOC)21N01W11A003M 21N01W11A003M DWR 9/4/13 0:00 19.02 133.23 (TOC)21N01W11A003M 21N01W11A003M DWR 9/12/13 0:00 19.05 133.23 (TOC)21N01W11A003M 21N01W11A003M DWR 9/18/13 0:00 18.99 133.23 (TOC)21N01W11A003M 21N01W11A003M DWR 10/8/13 0:00 19.25 133.23 (TOC)21N01W11A003M 21N01W11A003M DWR 10/17/13 0:00 19.51 133.23 (TOC)21N01W11A003M 21N01W11A003M DWR 10/25/13 0:00 19.70 133.23 (TOC)21N01W11A003M 21N01W11A003M DWR 11/22/13 0:00 19.57 133.23 (TOC)21N01W11A003M 21N01W11A003M DWR 12/18/13 0:00 19.70 133.23 (TOC)21N01W11A003M 21N01W11A003M DWR 1/15/14 0:00 19.97 133.23 (TOC)21N01W11A003M 21N01W11A003M DWR 2/19/14 0:00 19.43 133.23 (TOC)21N01W11A003M 21N01W11A003M DWR 3/17/14 0:00 18.80 133.23 (TOC)
21N01W13J001M 21N01W13J001M DWR 3/21/13 0:00 14.70 128.94 (TOC)21N01W13J001M 21N01W13J001M BC-DW&RC 5/23/13 0:00 25.80 128.94 (TOC)21N01W13J001M 21N01W13J001M DWR 6/26/13 0:00 25.02 128.94 (TOC)21N01W13J001M 21N01W13J001M DWR 7/3/13 0:00 29.38 128.94 (TOC)21N01W13J001M 21N01W13J001M BC-DW&RC 7/8/13 0:00 29.40 128.94 (TOC)21N01W13J001M 21N01W13J001M DWR 7/9/13 0:00 29.10 128.94 (TOC)21N01W13J001M 21N01W13J001M DWR 7/16/13 0:00 31.95 128.94 (TOC)21N01W13J001M 21N01W13J001M DWR 7/24/13 0:00 31.27 128.94 (TOC)21N01W13J001M 21N01W13J001M BC-DW&RC 7/30/13 0:00 32.90 128.94 (TOC)21N01W13J001M 21N01W13J001M DWR 8/6/13 0:00 31.40 128.94 (TOC)21N01W13J001M 21N01W13J001M DWR 8/13/13 0:00 31.05 128.94 (TOC)21N01W13J001M 21N01W13J001M DWR 8/20/13 0:00 29.70 128.94 (TOC)21N01W13J001M 21N01W13J001M DWR 8/27/13 0:00 29.10 128.94 (TOC)21N01W13J001M 21N01W13J001M DWR 9/4/13 0:00 29.92 128.94 (TOC)21N01W13J001M 21N01W13J001M DWR 9/12/13 0:00 28.50 128.94 (TOC)21N01W13J001M 21N01W13J001M DWR 9/18/13 0:00 28.44 128.94 (TOC)21N01W13J001M 21N01W13J001M DWR 10/8/13 0:00 26.02 128.94 (TOC)21N01W13J001M 21N01W13J001M DWR 10/17/13 0:00 25.80 128.94 (TOC)21N01W13J001M 21N01W13J001M DWR 10/25/13 0:00 26.00 128.94 (TOC)21N01W13J001M 21N01W13J001M DWR 11/22/13 0:00 24.55 128.94 (TOC)21N01W13J001M 21N01W13J001M DWR 12/18/13 0:00 22.60 128.94 (TOC)21N01W13J001M 21N01W13J001M DWR 1/15/14 0:00 22.97 128.94 (TOC)21N01W13J001M 21N01W13J001M DWR 2/19/14 0:00 21.69 128.94 (TOC)21N01W13J001M 21N01W13J001M DWR 3/17/14 0:00 20.30 128.94 (TOC)
21N01W13J002M 21N01W13J002M DWR 3/21/13 0:00 14.75 129.21 (TOC)21N01W13J002M 21N01W13J002M BC-DW&RC 5/23/13 0:00 25.45 129.21 (TOC)21N01W13J002M 21N01W13J002M DWR 6/26/13 0:00 23.44 129.21 (TOC)21N01W13J002M 21N01W13J002M DWR 7/3/13 0:00 27.74 129.21 (TOC)21N01W13J002M 21N01W13J002M BC-DW&RC 7/8/13 0:00 27.30 129.21 (TOC)21N01W13J002M 21N01W13J002M DWR 7/9/13 0:00 28.00 129.21 (TOC)21N01W13J002M 21N01W13J002M DWR 7/16/13 0:00 31.80 129.21 (TOC)21N01W13J002M 21N01W13J002M DWR 7/24/13 0:00 28.96 129.21 (TOC)21N01W13J002M 21N01W13J002M DWR 8/6/13 0:00 28.50 129.21 (TOC)21N01W13J002M 21N01W13J002M DWR 8/13/13 0:00 28.76 129.21 (TOC)21N01W13J002M 21N01W13J002M DWR 8/20/13 0:00 27.50 129.21 (TOC)21N01W13J002M 21N01W13J002M DWR 8/27/13 0:00 27.05 129.21 (TOC)21N01W13J002M 21N01W13J002M DWR 9/4/13 0:00 27.99 129.21 (TOC)21N01W13J002M 21N01W13J002M DWR 9/12/13 0:00 26.85 129.21 (TOC)21N01W13J002M 21N01W13J002M DWR 9/18/13 0:00 27.79 129.21 (TOC)21N01W13J002M 21N01W13J002M DWR 10/8/13 0:00 24.73 129.21 (TOC)21N01W13J002M 21N01W13J002M DWR 10/17/13 0:00 24.51 129.21 (TOC)21N01W13J002M 21N01W13J002M DWR 10/25/13 0:00 25.20 129.21 (TOC)21N01W13J002M 21N01W13J002M DWR 11/22/13 0:00 23.55 129.21 (TOC)21N01W13J002M 21N01W13J002M DWR 12/18/13 0:00 21.90 129.21 (TOC)21N01W13J002M 21N01W13J002M DWR 1/15/14 0:00 22.26 129.21 (TOC)21N01W13J002M 21N01W13J002M DWR 2/19/14 0:00 21.08 129.21 (TOC)21N01W13J002M 21N01W13J002M DWR 3/17/14 0:00 20.10 129.21 (TOC)
21N01W13J003M 21N01W13J003M DWR 3/21/13 0:00 14.80 129.46 (TOC)21N01W13J003M 21N01W13J003M BC-DW&RC 5/23/13 0:00 25.55 129.46 (TOC)21N01W13J003M 21N01W13J003M DWR 6/26/13 0:00 22.35 129.46 (TOC)21N01W13J003M 21N01W13J003M DWR 7/3/13 0:00 26.11 129.46 (TOC)21N01W13J003M 21N01W13J003M BC-DW&RC 7/8/13 0:00 25.60 129.46 (TOC)21N01W13J003M 21N01W13J003M DWR 7/9/13 0:00 35.15 129.46 (TOC)

Directions: Key in data from the "Seller Groundwater Data Collection Form" into the applicable input columns in green below.
State/Agency Well Number
Monitoring Well NameMeasuring
AgencyMeasurement
Date
Measure Time (24 Hour
Time)
Water Level(Feet Below Reference
Point)
Reference Point(ex. Top of
Casing, Sounding Tube, etc.)
Comments such as water quality meter calibration information, unusual site conditions, etc…
General Seller and Well Information Date/Time Groundwater Level
STATE OF CALIFORNIA
THE NATURAL RESOURCES AGENCY
DEPARTMENT OF WATER RESOURCES
2012 Water Transfer Program
Seller Groundwater Data Electronic Reporting Form
21N01W13J003M 21N01W13J003M DWR 7/16/13 0:00 40.40 129.46 (TOC)21N01W13J003M 21N01W13J003M DWR 7/24/13 0:00 27.15 129.46 (TOC)21N01W13J003M 21N01W13J003M BC-DW&RC 7/30/13 0:00 38.95 129.46 (TOC)21N01W13J003M 21N01W13J003M DWR 8/6/13 0:00 26.70 129.46 (TOC)21N01W13J003M 21N01W13J003M DWR 8/13/13 0:00 27.11 129.46 (TOC)21N01W13J003M 21N01W13J003M DWR 8/20/13 0:00 25.95 129.46 (TOC)21N01W13J003M 21N01W13J003M DWR 8/27/13 0:00 25.70 129.46 (TOC)21N01W13J003M 21N01W13J003M DWR 9/4/13 0:00 26.46 129.46 (TOC)21N01W13J003M 21N01W13J003M DWR 9/12/13 0:00 25.70 129.46 (TOC)21N01W13J003M 21N01W13J003M DWR 9/18/13 0:00 35.97 129.46 (TOC)21N01W13J003M 21N01W13J003M DWR 10/8/13 0:00 23.90 129.46 (TOC)21N01W13J003M 21N01W13J003M DWR 10/17/13 0:00 23.75 129.46 (TOC)21N01W13J003M 21N01W13J003M DWR 10/25/13 0:00 24.60 129.46 (TOC)21N01W13J003M 21N01W13J003M DWR 11/22/13 0:00 22.97 129.46 (TOC)21N01W13J003M 21N01W13J003M DWR 12/18/13 0:00 21.55 129.46 (TOC)21N01W13J003M 21N01W13J003M DWR 1/15/14 0:00 21.82 129.46 (TOC)21N01W13J003M 21N01W13J003M DWR 2/19/14 0:00 20.72 129.46 (TOC)21N01W13J003M 21N01W13J003M DWR 3/17/14 0:00 20.00 129.46 (TOC)
21N01W24B001M 21N01W24B001M DWR 3/20/13 11:09 16.08 127.96 (TOC)21N01W24B001M 21N01W24B001M DWR 7/31/13 7:27 34.19 127.96 (TOC)21N01W24B001M 21N01W24B001M DWR 10/16/13 7:23 27.28 127.96 (TOC)
21N02W01F001M 21N02W01F001M DWR 3/21/13 0:00 30.85 162.13 (TOC)21N02W01F001M 21N02W01F001M DWR 5/23/13 0:00 45.10 162.13 (TOC)21N02W01F001M 21N02W01F001M DWR 6/26/13 0:00 53.13 162.13 (TOC)21N02W01F001M 21N02W01F001M DWR 7/3/13 0:00 54.29 162.13 (TOC)21N02W01F001M 21N02W01F001M DWR 7/9/13 0:00 55.30 162.13 (TOC)21N02W01F001M 21N02W01F001M DWR 7/16/13 0:00 56.70 162.13 (TOC)21N02W01F001M 21N02W01F001M DWR 7/24/13 0:00 58.52 162.13 (TOC)21N02W01F001M 21N02W01F001M DWR 7/30/13 0:00 59.74 162.13 (TOC)21N02W01F001M 21N02W01F001M DWR 8/6/13 0:00 60.85 162.13 (TOC)21N02W01F001M 21N02W01F001M DWR 8/13/13 0:00 61.25 162.13 (TOC)21N02W01F001M 21N02W01F001M DWR 8/20/13 0:00 60.20 162.13 (TOC)21N02W01F001M 21N02W01F001M DWR 8/27/13 0:00 59.80 162.13 (TOC)21N02W01F001M 21N02W01F001M DWR 9/4/13 0:00 58.00 162.13 (TOC)21N02W01F001M 21N02W01F001M DWR 9/12/13 0:00 57.30 162.13 (TOC)21N02W01F001M 21N02W01F001M DWR 9/18/13 0:00 57.10 162.13 (TOC)21N02W01F001M 21N02W01F001M DWR 10/8/13 0:00 51.75 162.13 (TOC)21N02W01F001M 21N02W01F001M DWR 10/16/13 0:00 51.11 162.13 (TOC)21N02W01F001M 21N02W01F001M DWR 10/25/13 0:00 50.30 162.13 (TOC)21N02W01F001M 21N02W01F001M DWR 11/21/13 0:00 45.78 162.13 (TOC)21N02W01F001M 21N02W01F001M DWR 12/18/13 0:00 42.30 162.13 (TOC)21N02W01F001M 21N02W01F001M DWR 1/15/14 0:00 43.07 162.13 (TOC)21N02W01F001M 21N02W01F001M DWR 2/19/14 0:00 42.49 162.13 (TOC)21N02W01F001M 21N02W01F001M DWR 3/20/14 0:00 40.26 162.13 (TOC)
21N02W01F002M 21N02W01F002M DWR 3/21/13 0:00 30.81 162.28 (TOC)21N02W01F002M 21N02W01F002M DWR 5/23/13 0:00 48.50 162.28 (TOC)21N02W01F002M 21N02W01F002M DWR 6/26/13 0:00 48.08 162.28 (TOC)21N02W01F002M 21N02W01F002M DWR 7/3/13 0:00 56.27 162.28 (TOC)21N02W01F002M 21N02W01F002M DWR 7/9/13 0:00 53.40 162.28 (TOC)21N02W01F002M 21N02W01F002M DWR 7/16/13 0:00 64.80 162.28 (TOC)21N02W01F002M 21N02W01F002M DWR 7/24/13 0:00 61.33 162.28 (TOC)21N02W01F002M 21N02W01F002M DWR 7/30/13 0:00 56.25 162.28 (TOC)21N02W01F002M 21N02W01F002M DWR 8/6/13 0:00 56.60 162.28 (TOC)21N02W01F002M 21N02W01F002M DWR 8/13/13 0:00 50.85 162.28 (TOC)21N02W01F002M 21N02W01F002M DWR 8/20/13 0:00 57.80 162.28 (TOC)21N02W01F002M 21N02W01F002M DWR 8/27/13 0:00 52.50 162.28 (TOC)21N02W01F002M 21N02W01F002M DWR 9/4/13 0:00 50.86 162.28 (TOC)21N02W01F002M 21N02W01F002M DWR 9/12/13 0:00 50.00 162.28 (TOC)21N02W01F002M 21N02W01F002M DWR 9/18/13 0:00 51.97 162.28 (TOC)21N02W01F002M 21N02W01F002M DWR 10/8/13 0:00 42.55 162.28 (TOC)21N02W01F002M 21N02W01F002M DWR 10/16/13 0:00 43.06 162.28 (TOC)21N02W01F002M 21N02W01F002M DWR 10/25/13 0:00 50.25 162.28 (TOC)21N02W01F002M 21N02W01F002M DWR 11/21/13 0:00 38.38 162.28 (TOC)21N02W01F002M 21N02W01F002M DWR 12/18/13 0:00 40.50 162.28 (TOC)21N02W01F002M 21N02W01F002M DWR 1/15/14 0:00 48.09 162.28 (TOC)21N02W01F002M 21N02W01F002M DWR 2/19/14 0:00 38.65 162.28 (TOC)21N02W01F002M 21N02W01F002M DWR 3/20/14 0:00 37.66 162.28 (TOC)
21N02W01F003M 21N02W01F003M DWR 3/21/13 0:00 28.05 162.84 (TOC)21N02W01F003M 21N02W01F003M DWR 5/23/13 0:00 35.20 162.84 (TOC)21N02W01F003M 21N02W01F003M DWR 6/26/13 0:00 37.94 162.84 (TOC)21N02W01F003M 21N02W01F003M DWR 7/3/13 0:00 40.10 162.84 (TOC)21N02W01F003M 21N02W01F003M DWR 7/9/13 0:00 39.73 162.84 (TOC)21N02W01F003M 21N02W01F003M DWR 7/16/13 0:00 43.50 162.84 (TOC)21N02W01F003M 21N02W01F003M DWR 7/24/13 0:00 42.99 162.84 (TOC)21N02W01F003M 21N02W01F003M DWR 7/30/13 0:00 42.17 162.84 (TOC)21N02W01F003M 21N02W01F003M DWR 8/6/13 0:00 42.35 162.84 (TOC)21N02W01F003M 21N02W01F003M DWR 8/13/13 0:00 41.55 162.84 (TOC)21N02W01F003M 21N02W01F003M DWR 8/20/13 0:00 42.80 162.84 (TOC)21N02W01F003M 21N02W01F003M DWR 8/27/13 0:00 41.85 162.84 (TOC)21N02W01F003M 21N02W01F003M DWR 9/4/13 0:00 40.45 162.84 (TOC)21N02W01F003M 21N02W01F003M DWR 9/12/13 0:00 41.10 162.84 (TOC)21N02W01F003M 21N02W01F003M DWR 9/18/13 0:00 41.96 162.84 (TOC)21N02W01F003M 21N02W01F003M DWR 10/8/13 0:00 39.74 162.84 (TOC)21N02W01F003M 21N02W01F003M DWR 10/16/13 0:00 39.55 162.84 (TOC)21N02W01F003M 21N02W01F003M DWR 10/25/13 0:00 40.65 162.84 (TOC)21N02W01F003M 21N02W01F003M DWR 11/21/13 0:00 38.00 162.84 (TOC)21N02W01F003M 21N02W01F003M DWR 12/18/13 0:00 38.40 162.28 (TOC)21N02W01F003M 21N02W01F003M DWR 1/15/14 0:00 41.02 162.28 (TOC)21N02W01F003M 21N02W01F003M DWR 2/19/14 0:00 38.97 162.28 (TOC)21N02W01F003M 21N02W01F003M DWR 3/20/14 0:00 37.69 162.28 (TOC)
21N02W01F004M 21N02W01F004M DWR 3/21/13 0:00 27.36 163.22 (TOC)21N02W01F004M 21N02W01F004M DWR 5/23/13 0:00 33.40 163.22 (TOC)21N02W01F004M 21N02W01F004M DWR 6/26/13 0:00 37.05 163.22 (TOC)

Directions: Key in data from the "Seller Groundwater Data Collection Form" into the applicable input columns in green below.
State/Agency Well Number
Monitoring Well NameMeasuring
AgencyMeasurement
Date
Measure Time (24 Hour
Time)
Water Level(Feet Below Reference
Point)
Reference Point(ex. Top of
Casing, Sounding Tube, etc.)
Comments such as water quality meter calibration information, unusual site conditions, etc…
General Seller and Well Information Date/Time Groundwater Level
STATE OF CALIFORNIA
THE NATURAL RESOURCES AGENCY
DEPARTMENT OF WATER RESOURCES
2012 Water Transfer Program
Seller Groundwater Data Electronic Reporting Form
21N02W01F004M 21N02W01F004M DWR 7/3/13 0:00 38.26 163.22 (TOC)21N02W01F004M 21N02W01F004M DWR 7/9/13 0:00 38.35 163.22 (TOC)21N02W01F004M 21N02W01F004M DWR 7/16/13 0:00 40.10 163.22 (TOC)21N02W01F004M 21N02W01F004M DWR 7/24/13 0:00 40.44 163.22 (TOC)21N02W01F004M 21N02W01F004M DWR 7/30/13 0:00 40.23 163.22 (TOC)21N02W01F004M 21N02W01F004M DWR 8/6/13 0:00 40.55 163.22 (TOC)21N02W01F004M 21N02W01F004M DWR 8/13/13 0:00 40.48 163.22 (TOC)21N02W01F004M 21N02W01F004M DWR 8/20/13 0:00 40.50 163.22 (TOC)21N02W01F004M 21N02W01F004M DWR 8/27/13 0:00 40.45 163.22 (TOC)21N02W01F004M 21N02W01F004M DWR 9/4/13 0:00 39.47 163.22 (TOC)21N02W01F004M 21N02W01F004M DWR 9/12/13 0:00 39.80 163.22 (TOC)21N02W01F004M 21N02W01F004M DWR 9/18/13 0:00 40.21 163.22 (TOC)21N02W01F004M 21N02W01F004M DWR 10/8/13 0:00 38.91 163.22 (TOC)21N02W01F004M 21N02W01F004M DWR 10/16/13 0:00 38.93 163.22 (TOC)21N02W01F004M 21N02W01F004M DWR 10/25/13 0:00 39.50 163.22 (TOC)21N02W01F004M 21N02W01F004M DWR 11/21/13 0:00 37.99 163.22 (TOC)21N02W01F004M 21N02W01F004M DWR 12/18/13 0:00 37.80 163.22 (TOC)21N02W01F004M 21N02W01F004M DWR 1/15/14 0:00 39.45 163.22 (TOC)21N02W01F004M 21N02W01F004M DWR 2/19/14 0:00 39.00 163.22 (TOC)21N02W01F004M 21N02W01F004M DWR 3/20/14 0:00 37.56 163.22 (TOC)
21N02W04G002M 21N02W04G002M DWR 3/21/13 0:00 62.53 180.21 (TOC)21N02W04G002M 21N02W04G002M DWR 5/23/13 0:00 63.50 180.21 (TOC)21N02W04G002M 21N02W04G002M DWR 6/26/13 0:00 69.39 180.21 (TOC)21N02W04G002M 21N02W04G002M DWR 7/3/13 0:00 70.14 180.21 (TOC)21N02W04G002M 21N02W04G002M DWR 7/9/13 0:00 71.70 180.21 (TOC)21N02W04G002M 21N02W04G002M DWR 7/16/13 0:00 74.30 180.21 (TOC)21N02W04G002M 21N02W04G002M DWR 7/24/13 0:00 78.33 180.21 (TOC)21N02W04G002M 21N02W04G002M DWR 7/30/13 0:00 81.68 180.21 (TOC)21N02W04G002M 21N02W04G002M DWR 8/6/13 0:00 85.40 180.21 (TOC)21N02W04G002M 21N02W04G002M DWR 8/13/13 0:00 88.73 180.21 (TOC)21N02W04G002M 21N02W04G002M DWR 8/20/13 0:00 92.20 180.21 (TOC)21N02W04G002M 21N02W04G002M DWR 8/27/13 0:00 94.80 180.21 (TOC)21N02W04G002M 21N02W04G002M DWR 9/4/13 0:00 97.51 180.21 (TOC)21N02W04G002M 21N02W04G002M DWR 9/12/13 0:00 100.15 180.21 (TOC)21N02W04G002M 21N02W04G002M DWR 9/18/13 0:00 101.51 180.21 (TOC)21N02W04G002M 21N02W04G002M DWR 10/1/13 0:00 103.92 180.21 (TOC)21N02W04G002M 21N02W04G002M DWR 10/8/13 0:00 103.41 180.21 (TOC)21N02W04G002M 21N02W04G002M DWR 10/16/13 0:00 101.59 180.21 (TOC)21N02W04G002M 21N02W04G002M DWR 10/25/13 0:00 98.85 180.21 (TOC)21N02W04G002M 21N02W04G002M DWR 11/21/13 0:00 90.14 180.21 (TOC)21N02W04G002M 21N02W04G002M DWR 12/18/13 0:00 83.50 180.21 (TOC)21N02W04G002M 21N02W04G002M DWR 1/15/14 0:00 79.42 180.21 (TOC)21N02W04G002M 21N02W04G002M DWR 2/19/14 0:00 78.32 180.21 (TOC)21N02W04G002M 21N02W04G002M DWR 3/19/14 0:00 75.88 180.21 (TOC)
21N02W04G003M 21N02W04G003M DWR 3/21/13 0:00 49.93 180.51 (TOC)21N02W04G003M 21N02W04G003M DWR 5/23/13 0:00 60.50 180.51 (TOC)21N02W04G003M 21N02W04G003M DWR 6/26/13 0:00 70.23 180.51 (TOC)21N02W04G003M 21N02W04G003M DWR 7/3/13 0:00 70.97 180.51 (TOC)21N02W04G003M 21N02W04G003M DWR 7/9/13 0:00 72.30 180.51 (TOC)21N02W04G003M 21N02W04G003M DWR 7/16/13 0:00 74.60 180.51 (TOC)21N02W04G003M 21N02W04G003M DWR 7/24/13 0:00 75.49 180.51 (TOC)21N02W04G003M 21N02W04G003M DWR 7/30/13 0:00 78.59 180.51 (TOC)21N02W04G003M 21N02W04G003M DWR 8/6/13 0:00 80.05 180.51 (TOC)21N02W04G003M 21N02W04G003M DWR 8/13/13 0:00 79.24 180.51 (TOC)21N02W04G003M 21N02W04G003M DWR 8/20/13 0:00 78.50 180.51 (TOC)21N02W04G003M 21N02W04G003M DWR 8/27/13 0:00 79.45 180.51 (TOC)21N02W04G003M 21N02W04G003M DWR 9/4/13 0:00 77.94 180.51 (TOC)21N02W04G003M 21N02W04G003M DWR 9/12/13 0:00 79.50 180.51 (TOC)21N02W04G003M 21N02W04G003M DWR 9/18/13 0:00 79.04 180.51 (TOC)21N02W04G003M 21N02W04G003M DWR 10/1/13 0:00 76.10 180.51 (TOC)21N02W04G003M 21N02W04G003M DWR 10/8/13 0:00 75.94 180.51 (TOC)21N02W04G003M 21N02W04G003M DWR 10/16/13 0:00 75.47 180.51 (TOC)21N02W04G003M 21N02W04G003M DWR 10/25/13 0:00 74.75 180.51 (TOC)21N02W04G003M 21N02W04G003M DWR 11/21/13 0:00 69.70 180.51 (TOC)21N02W04G003M 21N02W04G003M DWR 12/18/13 0:00 65.50 180.51 (TOC)21N02W04G003M 21N02W04G003M DWR 1/15/14 0:00 65.85 180.51 (TOC)21N02W04G003M 21N02W04G003M DWR 2/19/14 0:00 63.46 180.51 (TOC)21N02W04G003M 21N02W04G003M DWR 3/19/14 0:00 60.98 180.51 (TOC)
21N02W04G004M 21N02W04G004M DWR 3/21/13 0:00 30.61 180.31 (TOC)21N02W04G004M 21N02W04G004M DWR 5/23/13 0:00 64.20 180.31 (TOC)21N02W04G004M 21N02W04G004M DWR 6/26/13 0:00 56.63 180.31 (TOC)21N02W04G004M 21N02W04G004M DWR 7/3/13 0:00 70.08 180.31 (TOC)21N02W04G004M 21N02W04G004M DWR 7/9/13 0:00 64.40 180.31 (TOC)21N02W04G004M 21N02W04G004M DWR 7/16/13 0:00 62.15 180.31 (TOC)21N02W04G004M 21N02W04G004M DWR 7/24/13 0:00 72.52 180.31 (TOC)21N02W04G004M 21N02W04G004M DWR 7/30/13 0:00 67.88 180.31 (TOC)21N02W04G004M 21N02W04G004M DWR 8/6/13 0:00 68.90 180.31 (TOC)21N02W04G004M 21N02W04G004M DWR 8/13/13 0:00 67.14 180.31 (TOC)21N02W04G004M 21N02W04G004M DWR 8/20/13 0:00 56.90 180.31 (TOC)21N02W04G004M 21N02W04G004M DWR 8/27/13 0:00 59.60 180.31 (TOC)21N02W04G004M 21N02W04G004M DWR 9/4/13 0:00 64.30 180.31 (TOC)21N02W04G004M 21N02W04G004M DWR 9/12/13 0:00 59.50 180.31 (TOC)21N02W04G004M 21N02W04G004M DWR 9/18/13 0:00 54.40 180.31 (TOC)21N02W04G004M 21N02W04G004M DWR 10/1/13 0:00 49.08 180.31 (TOC)21N02W04G004M 21N02W04G004M DWR 10/8/13 0:00 52.43 180.31 (TOC)21N02W04G004M 21N02W04G004M DWR 10/16/13 0:00 56.09 180.31 (TOC)21N02W04G004M 21N02W04G004M DWR 10/25/13 0:00 47.50 180.31 (TOC)21N02W04G004M 21N02W04G004M DWR 11/21/13 0:00 43.13 180.31 (TOC)21N02W04G004M 21N02W04G004M DWR 12/18/13 0:00 50.20 180.31 (TOC)21N02W04G004M 21N02W04G004M DWR 1/15/14 0:00 47.25 180.31 (TOC)21N02W04G004M 21N02W04G004M DWR 2/19/14 0:00 42.30 180.31 (TOC)21N02W04G004M 21N02W04G004M DWR 3/19/14 0:00 40.84 180.31 (TOC)
21N02W04G005M 21N02W04G005M DWR 3/21/13 0:00 31.49 181.16 (TOC)21N02W04G005M 21N02W04G005M DWR 5/23/13 0:00 40.90 181.16 (TOC)

Directions: Key in data from the "Seller Groundwater Data Collection Form" into the applicable input columns in green below.
State/Agency Well Number
Monitoring Well NameMeasuring
AgencyMeasurement
Date
Measure Time (24 Hour
Time)
Water Level(Feet Below Reference
Point)
Reference Point(ex. Top of
Casing, Sounding Tube, etc.)
Comments such as water quality meter calibration information, unusual site conditions, etc…
General Seller and Well Information Date/Time Groundwater Level
STATE OF CALIFORNIA
THE NATURAL RESOURCES AGENCY
DEPARTMENT OF WATER RESOURCES
2012 Water Transfer Program
Seller Groundwater Data Electronic Reporting Form
21N02W04G005M 21N02W04G005M DWR 6/26/13 0:00 45.97 181.16 (TOC)21N02W04G005M 21N02W04G005M DWR 7/3/13 0:00 47.54 181.16 (TOC)21N02W04G005M 21N02W04G005M DWR 7/9/13 0:00 48.75 181.16 (TOC)21N02W04G005M 21N02W04G005M DWR 7/16/13 0:00 49.60 181.16 (TOC)21N02W04G005M 21N02W04G005M DWR 7/24/13 0:00 50.20 181.16 (TOC)21N02W04G005M 21N02W04G005M DWR 7/30/13 0:00 50.57 181.16 (TOC)21N02W04G005M 21N02W04G005M DWR 8/6/13 0:00 51.20 181.16 (TOC)21N02W04G005M 21N02W04G005M DWR 8/13/13 0:00 51.22 181.16 (TOC)21N02W04G005M 21N02W04G005M DWR 8/20/13 0:00 50.80 181.16 (TOC)21N02W04G005M 21N02W04G005M DWR 8/27/13 0:00 50.55 181.16 (TOC)21N02W04G005M 21N02W04G005M DWR 9/4/13 0:00 50.75 181.16 (TOC)21N02W04G005M 21N02W04G005M DWR 9/12/13 0:00 50.35 181.16 (TOC)21N02W04G005M 21N02W04G005M DWR 9/18/13 0:00 49.79 181.16 (TOC)21N02W04G005M 21N02W04G005M DWR 10/1/13 0:00 47.47 181.16 (TOC)21N02W04G005M 21N02W04G005M DWR 10/8/13 0:00 47.46 181.16 (TOC)21N02W04G005M 21N02W04G005M DWR 10/16/13 0:00 48.26 181.16 (TOC)21N02W04G005M 21N02W04G005M DWR 10/25/13 0:00 47.40 181.16 (TOC)21N02W04G005M 21N02W04G005M DWR 11/21/13 0:00 45.27 181.16 (TOC)21N02W04G005M 21N02W04G005M DWR 12/18/13 0:00 44.20 181.16 (TOC)21N02W04G005M 21N02W04G005M DWR 1/15/14 0:00 45.03 181.16 (TOC)21N02W04G005M 21N02W04G005M DWR 2/19/14 0:00 44.18 181.16 (TOC)21N02W04G005M 21N02W04G005M DWR 3/19/14 0:00 41.59 181.16 (TOC)
21N02W36A002M 21N02W36A002M DWR 3/18/13 0:00 27.29 137.49 (TOC)21N02W36A002M 21N02W36A002M DWR 5/23/13 0:00 29.40 137.49 (TOC)21N02W36A002M 21N02W36A002M DWR 6/26/13 0:00 27.49 137.49 (TOC)21N02W36A002M 21N02W36A002M DWR 7/3/13 0:00 34.33 137.49 (TOC)21N02W36A002M 21N02W36A002M DWR 7/9/13 0:00 31.00 137.49 (TOC)21N02W36A002M 21N02W36A002M DWR 7/16/13 0:00 31.00 137.49 (TOC)21N02W36A002M 21N02W36A002M DWR 7/24/13 0:00 34.16 137.49 (TOC)21N02W36A002M 21N02W36A002M DWR 7/29/13 0:00 29.22 137.49 (TOC)21N02W36A002M 21N02W36A002M DWR 8/6/13 0:00 31.60 137.49 (TOC)21N02W36A002M 21N02W36A002M DWR 8/13/13 0:00 28.53 137.49 (TOC)21N02W36A002M 21N02W36A002M DWR 8/20/13 0:00 30.20 137.49 (TOC)21N02W36A002M 21N02W36A002M DWR 8/27/13 0:00 29.50 137.49 (TOC)21N02W36A002M 21N02W36A002M DWR 9/4/13 0:00 28.68 137.49 (TOC)21N02W36A002M 21N02W36A002M DWR 9/12/13 0:00 30.95 137.49 (TOC)21N02W36A002M 21N02W36A002M DWR 9/18/13 0:00 32.08 137.49 (TOC)21N02W36A002M 21N02W36A002M DWR 10/1/13 0:00 27.74 137.49 (TOC)21N02W36A002M 21N02W36A002M DWR 10/8/13 0:00 29.74 137.49 (TOC)21N02W36A002M 21N02W36A002M DWR 10/15/13 0:00 29.85 137.49 (TOC)21N02W36A002M 21N02W36A002M DWR 10/25/13 0:00 28.95 137.49 (TOC)21N02W36A002M 21N02W36A002M DWR 11/21/13 0:00 28.38 137.49 (TOC)21N02W36A002M 21N02W36A002M DWR 12/18/13 0:00 30.30 137.49 (TOC)21N02W36A002M 21N02W36A002M DWR 1/15/14 0:00 34.68 137.49 (TOC)21N02W36A002M 21N02W36A002M DWR 2/19/14 0:00 29.80 137.49 (TOC)21N02W36A002M 21N02W36A002M DWR 3/20/14 0:00 28.56 137.49 (TOC)
22N01W29N001M 22N01W29N001M DWR 3/18/13 0:00 25.93 150.95 (TOC)22N01W29N001M 22N01W29N001M DWR 5/23/13 0:00 29.40 150.95 (TOC)22N01W29N001M 22N01W29N001M DWR 6/26/13 0:00 34.02 150.95 (TOC)22N01W29N001M 22N01W29N001M DWR 7/3/13 0:00 37.11 150.95 (TOC)22N01W29N001M 22N01W29N001M DWR 7/9/13 0:00 48.30 150.95 (TOC)22N01W29N001M 22N01W29N001M DWR 7/16/13 0:00 56.20 150.95 (TOC)22N01W29N001M 22N01W29N001M DWR 7/24/13 0:00 61.94 150.95 (TOC)22N01W29N001M 22N01W29N001M DWR 7/29/13 0:00 66.92 150.95 (TOC)22N01W29N001M 22N01W29N001M DWR 8/6/13 0:00 71.80 150.95 (TOC)22N01W29N001M 22N01W29N001M DWR 8/13/13 0:00 74.66 150.95 (TOC)22N01W29N001M 22N01W29N001M DWR 8/20/13 0:00 76.95 150.95 (TOC)22N01W29N001M 22N01W29N001M DWR 8/27/13 0:00 78.50 150.95 (TOC)22N01W29N001M 22N01W29N001M DWR 9/4/13 0:00 79.88 150.95 (TOC)22N01W29N001M 22N01W29N001M DWR 9/12/13 0:00 81.00 150.95 (TOC)22N01W29N001M 22N01W29N001M DWR 9/18/13 0:00 81.40 150.95 (TOC)22N01W29N001M 22N01W29N001M DWR 10/1/13 0:00 72.07 150.95 (TOC)22N01W29N001M 22N01W29N001M DWR 10/8/13 0:00 63.46 150.95 (TOC)22N01W29N001M 22N01W29N001M DWR 10/20/13 0:00 58.95 150.95 (TOC)22N01W29N001M 22N01W29N001M DWR 10/25/13 0:00 53.20 150.95 (TOC)22N01W29N001M 22N01W29N001M DWR 11/21/13 0:00 44.97 150.95 (TOC)22N01W29N001M 22N01W29N001M DWR 12/18/13 0:00 40.60 150.95 (TOC)22N01W29N001M 22N01W29N001M DWR 1/15/14 0:00 38.17 150.95 (TOC)22N01W29N001M 22N01W29N001M DWR 2/19/14 0:00 41.63 150.95 (TOC)22N01W29N001M 22N01W29N001M DWR 3/19/14 0:00 35.84 150.95 (TOC)
22N01W29N002M 22N01W29N002M DWR 3/18/13 0:00 22.66 150.68 (TOC)22N01W29N002M 22N01W29N002M DWR 5/23/13 0:00 32.80 150.68 (TOC)22N01W29N002M 22N01W29N002M DWR 6/26/13 0:00 39.47 150.68 (TOC)22N01W29N002M 22N01W29N002M DWR 7/3/13 0:00 40.32 150.68 (TOC)22N01W29N002M 22N01W29N002M DWR 7/9/13 0:00 41.95 150.68 (TOC)22N01W29N002M 22N01W29N002M DWR 7/16/13 0:00 44.50 150.68 (TOC)22N01W29N002M 22N01W29N002M DWR 7/24/13 0:00 47.50 150.68 (TOC)22N01W29N002M 22N01W29N002M DWR 7/29/13 0:00 49.07 150.68 (TOC)22N01W29N002M 22N01W29N002M DWR 8/6/13 0:00 51.65 150.68 (TOC)22N01W29N002M 22N01W29N002M DWR 8/13/13 0:00 53.13 150.68 (TOC)22N01W29N002M 22N01W29N002M DWR 8/20/13 0:00 53.30 150.68 (TOC)22N01W29N002M 22N01W29N002M DWR 8/27/13 0:00 53.30 150.68 (TOC)22N01W29N002M 22N01W29N002M DWR 9/4/13 0:00 53.47 150.68 (TOC)22N01W29N002M 22N01W29N002M DWR 9/12/13 0:00 53.10 150.68 (TOC)22N01W29N002M 22N01W29N002M DWR 9/18/13 0:00 52.86 150.68 (TOC)22N01W29N002M 22N01W29N002M DWR 10/1/13 0:00 50.67 150.68 (TOC)22N01W29N002M 22N01W29N002M DWR 10/8/13 0:00 47.55 150.68 (TOC)22N01W29N002M 22N01W29N002M DWR 10/20/13 0:00 45.99 150.68 (TOC)22N01W29N002M 22N01W29N002M DWR 10/25/13 0:00 43.20 150.68 (TOC)22N01W29N002M 22N01W29N002M DWR 11/21/13 0:00 37.84 150.68 (TOC)22N01W29N002M 22N01W29N002M DWR 12/18/13 0:00 34.50 150.68 (TOC)22N01W29N002M 22N01W29N002M DWR 1/15/14 0:00 33.97 150.68 (TOC)22N01W29N002M 22N01W29N002M DWR 2/19/14 0:00 34.19 150.68 (TOC)22N01W29N002M 22N01W29N002M DWR 3/19/14 0:00 30.73 150.68 (TOC)

Directions: Key in data from the "Seller Groundwater Data Collection Form" into the applicable input columns in green below.
State/Agency Well Number
Monitoring Well NameMeasuring
AgencyMeasurement
Date
Measure Time (24 Hour
Time)
Water Level(Feet Below Reference
Point)
Reference Point(ex. Top of
Casing, Sounding Tube, etc.)
Comments such as water quality meter calibration information, unusual site conditions, etc…
General Seller and Well Information Date/Time Groundwater Level
STATE OF CALIFORNIA
THE NATURAL RESOURCES AGENCY
DEPARTMENT OF WATER RESOURCES
2012 Water Transfer Program
Seller Groundwater Data Electronic Reporting Form
22N01W29N003M 22N01W29N003M DWR 3/18/13 0:00 23.76 149.99 (TOC)22N01W29N003M 22N01W29N003M DWR 5/23/13 0:00 35.50 149.99 (TOC)22N01W29N003M 22N01W29N003M DWR 6/26/13 0:00 33.06 149.99 (TOC)22N01W29N003M 22N01W29N003M DWR 7/3/13 0:00 45.77 149.99 (TOC)22N01W29N003M 22N01W29N003M DWR 7/9/13 0:00 39.10 149.99 (TOC)22N01W29N003M 22N01W29N003M DWR 7/16/13 0:00 41.10 149.99 (TOC)22N01W29N003M 22N01W29N003M DWR 7/24/13 0:00 149.99 (TOC)22N01W29N003M 22N01W29N003M DWR 7/29/13 0:00 40.77 149.99 (TOC)22N01W29N003M 22N01W29N003M DWR 8/6/13 0:00 39.45 149.99 (TOC)22N01W29N003M 22N01W29N003M DWR 8/13/13 0:00 36.05 149.99 (TOC)22N01W29N003M 22N01W29N003M DWR 8/20/13 0:00 37.15 149.99 (TOC)22N01W29N003M 22N01W29N003M DWR 8/27/13 0:00 37.35 149.99 (TOC)22N01W29N003M 22N01W29N003M DWR 9/4/13 0:00 35.23 149.99 (TOC)22N01W29N003M 22N01W29N003M DWR 9/12/13 0:00 34.50 149.99 (TOC)22N01W29N003M 22N01W29N003M DWR 9/18/13 0:00 32.50 149.99 (TOC)22N01W29N003M 22N01W29N003M DWR 10/1/13 0:00 28.03 149.99 (TOC)22N01W29N003M 22N01W29N003M DWR 10/8/13 0:00 29.61 149.99 (TOC)22N01W29N003M 22N01W29N003M DWR 10/20/13 0:00 31.67 149.99 (TOC)22N01W29N003M 22N01W29N003M DWR 10/25/13 0:00 32.80 149.99 (TOC)22N01W29N003M 22N01W29N003M DWR 11/21/13 0:00 27.24 149.99 (TOC)22N01W29N003M 22N01W29N003M DWR 12/18/13 0:00 29.20 149.99 (TOC)22N01W29N003M 22N01W29N003M DWR 1/15/14 0:00 29.95 149.99 (TOC)22N01W29N003M 22N01W29N003M DWR 2/19/14 0:00 26.34 149.99 (TOC)22N01W29N003M 22N01W29N003M DWR 3/19/14 0:00 24.87 149.99 (TOC)
22N01W29N004M 22N01W29N004M DWR 3/18/13 0:00 17.65 149.06 (TOC)22N01W29N004M 22N01W29N004M DWR 5/23/13 0:00 22.10 149.06 (TOC)22N01W29N004M 22N01W29N004M DWR 6/26/13 0:00 23.72 149.06 (TOC)22N01W29N004M 22N01W29N004M DWR 7/3/13 0:00 25.52 149.06 (TOC)22N01W29N004M 22N01W29N004M DWR 7/9/13 0:00 25.05 149.06 (TOC)22N01W29N004M 22N01W29N004M DWR 7/16/13 0:00 26.20 149.06 (TOC)22N01W29N004M 22N01W29N004M DWR 7/24/13 0:00 26.13 149.06 (TOC)22N01W29N004M 22N01W29N004M DWR 7/29/13 0:00 25.78 149.06 (TOC)22N01W29N004M 22N01W29N004M DWR 8/6/13 0:00 26.10 149.06 (TOC)22N01W29N004M 22N01W29N004M DWR 8/13/13 0:00 25.36 149.06 (TOC)22N01W29N004M 22N01W29N004M DWR 8/20/13 0:00 25.50 149.06 (TOC)22N01W29N004M 22N01W29N004M DWR 8/27/13 0:00 26.30 149.06 (TOC)22N01W29N004M 22N01W29N004M DWR 9/4/13 0:00 25.79 149.06 (TOC)22N01W29N004M 22N01W29N004M DWR 9/12/13 0:00 25.70 149.06 (TOC)22N01W29N004M 22N01W29N004M DWR 9/18/13 0:00 25.56 149.06 (TOC)22N01W29N004M 22N01W29N004M DWR 10/1/13 0:00 24.12 149.06 (TOC)22N01W29N004M 22N01W29N004M DWR 10/8/13 0:00 24.50 149.06 (TOC)22N01W29N004M 22N01W29N004M DWR 10/20/13 0:00 24.41 149.06 (TOC)22N01W29N004M 22N01W29N004M DWR 10/25/13 0:00 24.25 149.06 (TOC)22N01W29N004M 22N01W29N004M DWR 11/21/13 0:00 23.88 149.06 (TOC)22N01W29N004M 22N01W29N004M DWR 12/18/13 0:00 24.70 149.06 (TOC)22N01W29N004M 22N01W29N004M DWR 1/15/14 0:00 25.51 149.06 (TOC)22N01W29N004M 22N01W29N004M DWR 2/19/14 0:00 24.13 149.06 (TOC)22N01W29N004M 22N01W29N004M DWR 3/19/14 0:00 22.62 149.06 (TOC)
22N02W01N001M 22N02W01N001M DWR 3/19/13 0:00 20.97 161.07 (TOC)22N02W01N001M 22N02W01N001M DWR 5/23/13 0:00 26.30 161.07 (TOC)22N02W01N001M 22N02W01N001M DWR 6/26/13 0:00 31.60 161.07 (TOC)22N02W01N001M 22N02W01N001M DWR 7/3/13 0:00 67.30 161.07 (TOC)22N02W01N001M 22N02W01N001M DWR 7/9/13 0:00 85.80 161.07 (TOC)22N02W01N001M 22N02W01N001M DWR 7/16/13 0:00 94.15 161.07 (TOC)22N02W01N001M 22N02W01N001M DWR 7/24/13 0:00 101.30 161.07 (TOC)22N02W01N001M 22N02W01N001M DWR 7/30/13 0:00 105.00 161.07 (TOC)22N02W01N001M 22N02W01N001M DWR 8/6/13 0:00 108.90 161.07 (TOC)22N02W01N001M 22N02W01N001M DWR 8/13/13 0:00 111.48 161.07 (TOC)22N02W01N001M 22N02W01N001M DWR 8/20/13 0:00 113.30 161.07 (TOC)22N02W01N001M 22N02W01N001M DWR 8/27/13 0:00 114.30 161.07 (TOC)22N02W01N001M 22N02W01N001M DWR 9/4/13 0:00 115.63 161.07 (TOC)22N02W01N001M 22N02W01N001M DWR 9/12/13 0:00 116.80 161.07 (TOC)22N02W01N001M 22N02W01N001M DWR 9/18/13 0:00 91.30 161.07 (TOC)22N02W01N001M 22N02W01N001M DWR 10/1/13 0:00 71.33 161.07 (TOC)22N02W01N001M 22N02W01N001M DWR 10/8/13 0:00 61.67 161.07 (TOC)22N02W01N001M 22N02W01N001M DWR 10/20/13 0:00 57.26 161.07 (TOC)22N02W01N001M 22N02W01N001M DWR 10/25/13 0:00 52.00 161.07 (TOC)22N02W01N001M 22N02W01N001M DWR 11/22/13 0:00 42.20 161.07 (TOC)22N02W01N001M 22N02W01N001M DWR 12/18/13 0:00 36.70 161.07 (TOC)22N02W01N001M 22N02W01N001M DWR 1/15/14 0:00 34.50 161.07 (TOC)22N02W01N001M 22N02W01N001M DWR 2/19/14 0:00 37.92 161.07 (TOC)22N02W01N001M 22N02W01N001M DWR 3/19/14 0:00 30.87 161.07 (TOC)
22N02W01N002M 22N02W01N002M DWR 3/19/13 0:00 18.76 161.31 (TOC)22N02W01N002M 22N02W01N002M DWR 5/23/13 0:00 40.95 161.31 (TOC)22N02W01N002M 22N02W01N002M DWR 6/26/13 0:00 50.62 161.31 (TOC)22N02W01N002M 22N02W01N002M DWR 7/3/13 0:00 55.69 161.31 (TOC)22N02W01N002M 22N02W01N002M DWR 7/9/13 0:00 63.00 161.31 (TOC)22N02W01N002M 22N02W01N002M DWR 7/16/13 0:00 64.70 161.31 (TOC)22N02W01N002M 22N02W01N002M DWR 7/24/13 0:00 67.94 161.31 (TOC)22N02W01N002M 22N02W01N002M DWR 7/30/13 0:00 68.50 161.31 (TOC)22N02W01N002M 22N02W01N002M DWR 8/6/13 0:00 74.40 161.31 (TOC)22N02W01N002M 22N02W01N002M DWR 8/13/13 0:00 68.44 161.31 (TOC)22N02W01N002M 22N02W01N002M DWR 8/20/13 0:00 64.30 161.31 (TOC)22N02W01N002M 22N02W01N002M DWR 8/27/13 0:00 70.15 161.31 (TOC)22N02W01N002M 22N02W01N002M DWR 9/4/13 0:00 65.25 161.31 (TOC)22N02W01N002M 22N02W01N002M DWR 9/12/13 0:00 66.80 161.31 (TOC)22N02W01N002M 22N02W01N002M DWR 9/18/13 0:00 61.62 161.31 (TOC)22N02W01N002M 22N02W01N002M DWR 10/1/13 0:00 50.71 161.31 (TOC)22N02W01N002M 22N02W01N002M DWR 10/8/13 0:00 46.25 161.31 (TOC)22N02W01N002M 22N02W01N002M DWR 10/20/13 0:00 45.70 161.31 (TOC)22N02W01N002M 22N02W01N002M DWR 10/25/13 0:00 45.65 161.31 (TOC)22N02W01N002M 22N02W01N002M DWR 11/22/13 0:00 34.07 161.31 (TOC)22N02W01N002M 22N02W01N002M DWR 12/18/13 0:00 31.25 161.31 (TOC)22N02W01N002M 22N02W01N002M DWR 1/15/14 0:00 33.68 161.31 (TOC)22N02W01N002M 22N02W01N002M DWR 2/19/14 0:00 30.02 161.31 (TOC)

Directions: Key in data from the "Seller Groundwater Data Collection Form" into the applicable input columns in green below.
State/Agency Well Number
Monitoring Well NameMeasuring
AgencyMeasurement
Date
Measure Time (24 Hour
Time)
Water Level(Feet Below Reference
Point)
Reference Point(ex. Top of
Casing, Sounding Tube, etc.)
Comments such as water quality meter calibration information, unusual site conditions, etc…
General Seller and Well Information Date/Time Groundwater Level
STATE OF CALIFORNIA
THE NATURAL RESOURCES AGENCY
DEPARTMENT OF WATER RESOURCES
2012 Water Transfer Program
Seller Groundwater Data Electronic Reporting Form
22N02W01N002M 22N02W01N002M DWR 3/19/14 0:00 25.13 161.31 (TOC)
22N02W01N003M 22N02W01N003M DWR 3/19/13 0:00 22.91 161.50 (TOC)22N02W01N003M 22N02W01N003M DWR 5/23/13 0:00 38.50 161.50 (TOC)22N02W01N003M 22N02W01N003M DWR 6/26/13 0:00 35.24 161.50 (TOC)22N02W01N003M 22N02W01N003M DWR 7/3/13 0:00 51.43 161.50 (TOC)22N02W01N003M 22N02W01N003M DWR 7/9/13 0:00 46.45 161.50 (TOC)22N02W01N003M 22N02W01N003M DWR 7/16/13 0:00 48.25 161.50 (TOC)22N02W01N003M 22N02W01N003M DWR 7/24/13 0:00 48.97 161.50 (TOC)22N02W01N003M 22N02W01N003M DWR 7/30/13 0:00 48.52 161.50 (TOC)22N02W01N003M 22N02W01N003M DWR 8/6/13 0:00 46.30 161.50 (TOC)22N02W01N003M 22N02W01N003M DWR 8/13/13 0:00 44.36 161.50 (TOC)22N02W01N003M 22N02W01N003M DWR 8/20/13 0:00 43.30 161.50 (TOC)22N02W01N003M 22N02W01N003M DWR 8/27/13 0:00 41.30 161.50 (TOC)22N02W01N003M 22N02W01N003M DWR 9/4/13 0:00 42.21 161.50 (TOC)22N02W01N003M 22N02W01N003M DWR 9/12/13 0:00 37.95 161.50 (TOC)22N02W01N003M 22N02W01N003M DWR 9/18/13 0:00 36.88 161.50 (TOC)22N02W01N003M 22N02W01N003M DWR 10/1/13 0:00 29.51 161.50 (TOC)22N02W01N003M 22N02W01N003M DWR 10/8/13 0:00 30.55 161.50 (TOC)22N02W01N003M 22N02W01N003M DWR 10/20/13 0:00 31.87 161.50 (TOC)22N02W01N003M 22N02W01N003M DWR 10/25/13 0:00 32.25 161.50 (TOC)22N02W01N003M 22N02W01N003M DWR 11/22/13 0:00 25.38 161.50 (TOC)22N02W01N003M 22N02W01N003M DWR 12/18/13 0:00 29.50 161.50 (TOC)22N02W01N003M 22N02W01N003M DWR 1/15/14 0:00 29.50 161.50 (TOC)22N02W01N003M 22N02W01N003M DWR 2/19/14 0:00 24.23 161.50 (TOC)22N02W01N003M 22N02W01N003M DWR 3/19/14 0:00 22.67 161.50 (TOC)
22N02W01N004M 22N02W01N004M DWR 3/19/13 0:00 25.44 161.65 (TOC)22N02W01N004M 22N02W01N004M DWR 5/23/13 0:00 27.40 161.65 (TOC)22N02W01N004M 22N02W01N004M DWR 6/26/13 0:00 26.53 161.65 (TOC)22N02W01N004M 22N02W01N004M DWR 7/3/13 0:00 28.64 161.65 (TOC)22N02W01N004M 22N02W01N004M DWR 7/9/13 0:00 28.20 161.65 (TOC)22N02W01N004M 22N02W01N004M DWR 7/16/13 0:00 28.45 161.65 (TOC)22N02W01N004M 22N02W01N004M DWR 7/24/13 0:00 27.89 161.65 (TOC)22N02W01N004M 22N02W01N004M DWR 7/30/13 0:00 28.77 161.65 (TOC)22N02W01N004M 22N02W01N004M DWR 8/6/13 0:00 28.00 161.65 (TOC)22N02W01N004M 22N02W01N004M DWR 8/13/13 0:00 28.61 161.65 (TOC)22N02W01N004M 22N02W01N004M DWR 8/20/13 0:00 27.85 161.65 (TOC)22N02W01N004M 22N02W01N004M DWR 8/27/13 0:00 27.80 161.65 (TOC)22N02W01N004M 22N02W01N004M DWR 9/4/13 0:00 28.39 161.65 (TOC)22N02W01N004M 22N02W01N004M DWR 9/12/13 0:00 28.40 161.65 (TOC)22N02W01N004M 22N02W01N004M DWR 9/18/13 0:00 27.54 161.65 (TOC)22N02W01N004M 22N02W01N004M DWR 10/1/13 0:00 26.57 161.65 (TOC)22N02W01N004M 22N02W01N004M DWR 10/8/13 0:00 27.07 161.65 (TOC)22N02W01N004M 22N02W01N004M DWR 10/20/13 0:00 26.70 161.65 (TOC)22N02W01N004M 22N02W01N004M DWR 10/25/13 0:00 27.00 161.65 (TOC)22N02W01N004M 22N02W01N004M DWR 11/22/13 0:00 26.15 161.65 (TOC)22N02W01N004M 22N02W01N004M DWR 12/18/13 0:00 26.75 161.65 (TOC)22N02W01N004M 22N02W01N004M DWR 1/15/14 0:00 27.22 161.65 (TOC)22N02W01N004M 22N02W01N004M DWR 2/19/14 0:00 25.62 161.65 (TOC)22N02W01N004M 22N02W01N004M DWR 3/19/14 0:00 24.81 161.65 (TOC)
22N02W15C002M 22N02W15C002M DWR 3/20/13 10:13 60.27 192.37 (TOC)22N02W15C002M 22N02W15C002M DWR 5/23/13 0:00 62.00 192.37 (TOC)22N02W15C002M 22N02W15C002M DWR 7/3/13 0:00 67.75 192.37 (TOC)22N02W15C002M 22N02W15C002M DWR 7/9/13 0:00 73.70 192.37 (TOC)22N02W15C002M 22N02W15C002M DWR 7/16/13 0:00 81.50 192.37 (TOC)22N02W15C002M 22N02W15C002M DWR 7/24/13 0:00 88.90 192.37 (TOC)22N02W15C002M 22N02W15C002M DWR 7/31/13 0:00 94.31 192.37 (TOC)22N02W15C002M 22N02W15C002M DWR 8/6/13 0:00 98.30 192.37 (TOC)22N02W15C002M 22N02W15C002M DWR 8/13/13 0:00 102.58 192.37 (TOC)22N02W15C002M 22N02W15C002M DWR 8/20/13 0:00 105.95 192.37 (TOC)22N02W15C002M 22N02W15C002M DWR 8/27/13 0:00 105.65 192.37 (TOC)22N02W15C002M 22N02W15C002M DWR 9/4/13 0:00 111.30 192.37 (TOC)22N02W15C002M 22N02W15C002M DWR 9/12/13 0:00 113.40 192.37 (TOC)22N02W15C002M 22N02W15C002M DWR 9/18/13 0:00 114.65 192.37 (TOC)22N02W15C002M 22N02W15C002M DWR 10/1/13 0:00 113.35 192.37 (TOC)22N02W15C002M 22N02W15C002M DWR 10/8/13 0:00 107.68 192.37 (TOC)22N02W15C002M 22N02W15C002M DWR 10/15/13 7:30 102.00 192.37 (TOC)22N02W15C002M 22N02W15C002M DWR 10/25/13 0:00 97.20 192.37 (TOC)22N02W15C002M 22N02W15C002M DWR 11/22/13 0:00 86.52 192.37 (TOC)22N02W15C002M 22N02W15C002M DWR 12/18/13 0:00 80.25 192.37 (TOC)22N02W15C002M 22N02W15C002M DWR 1/15/14 0:00 76.49 192.37 (TOC)22N02W15C002M 22N02W15C002M DWR 2/19/14 0:00 78.68 192.37 (TOC)22N02W15C002M 22N02W15C002M DWR 3/18/14 7:08 73.43 192.37 (TOC)
22N02W15C003M 22N02W15C003M DWR 3/20/13 9:40 45.46 192.01 (TOC)22N02W15C003M 22N02W15C003M DWR 5/23/13 0:00 78.25 192.01 (TOC)22N02W15C003M 22N02W15C003M DWR 6/26/13 0:00 85.81 192.01 (TOC)22N02W15C003M 22N02W15C003M DWR 7/3/13 0:00 96.83 192.01 (TOC)22N02W15C003M 22N02W15C003M DWR 7/9/13 0:00 97.70 192.01 (TOC)22N02W15C003M 22N02W15C003M DWR 7/16/13 0:00 101.55 192.01 (TOC)22N02W15C003M 22N02W15C003M DWR 7/24/13 0:00 101.06 192.01 (TOC)22N02W15C003M 22N02W15C003M DWR 7/31/13 0:00 99.72 192.01 (TOC)22N02W15C003M 22N02W15C003M DWR 8/6/13 0:00 103.50 192.01 (TOC)22N02W15C003M 22N02W15C003M DWR 8/13/13 0:00 92.13 192.01 (TOC)22N02W15C003M 22N02W15C003M DWR 8/20/13 0:00 81.50 192.01 (TOC)22N02W15C003M 22N02W15C003M DWR 8/27/13 0:00 80.10 192.01 (TOC)22N02W15C003M 22N02W15C003M DWR 9/4/13 0:00 80.53 192.01 (TOC)22N02W15C003M 22N02W15C003M DWR 9/12/13 0:00 83.90 192.01 (TOC)22N02W15C003M 22N02W15C003M DWR 9/18/13 0:00 77.35 192.01 (TOC)22N02W15C003M 22N02W15C003M DWR 10/1/13 0:00 61.06 192.01 (TOC)22N02W15C003M 22N02W15C003M DWR 10/8/13 0:00 62.75 192.01 (TOC)22N02W15C003M 22N02W15C003M DWR 10/15/13 7:12 62.00 192.01 (TOC)22N02W15C003M 22N02W15C003M DWR 10/25/13 0:00 68.20 192.01 (TOC)22N02W15C003M 22N02W15C003M DWR 11/22/13 0:00 56.90 192.01 (TOC)22N02W15C003M 22N02W15C003M DWR 12/18/13 0:00 6.70 192.01 (TOC) Data point was verified with DWR Northern Region22N02W15C003M 22N02W15C003M DWR 1/15/14 0:00 57.60 192.01 (TOC)
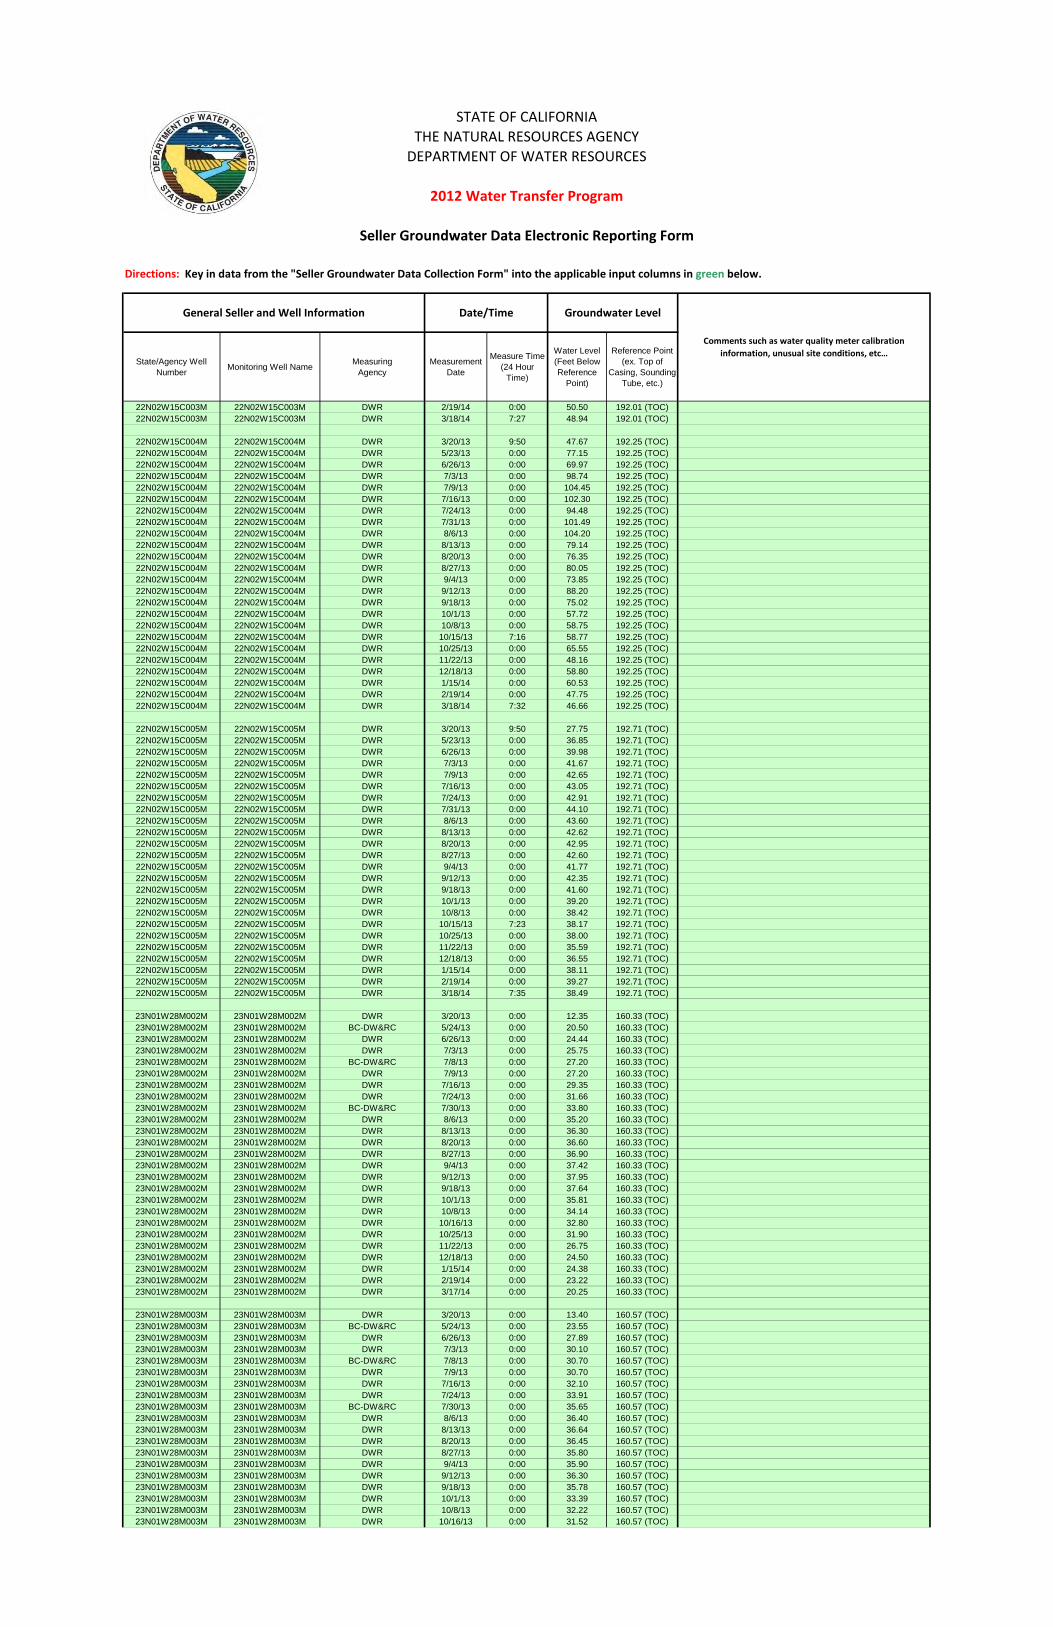
Directions: Key in data from the "Seller Groundwater Data Collection Form" into the applicable input columns in green below.
State/Agency Well Number
Monitoring Well NameMeasuring
AgencyMeasurement
Date
Measure Time (24 Hour
Time)
Water Level(Feet Below Reference
Point)
Reference Point(ex. Top of
Casing, Sounding Tube, etc.)
Comments such as water quality meter calibration information, unusual site conditions, etc…
General Seller and Well Information Date/Time Groundwater Level
STATE OF CALIFORNIA
THE NATURAL RESOURCES AGENCY
DEPARTMENT OF WATER RESOURCES
2012 Water Transfer Program
Seller Groundwater Data Electronic Reporting Form
22N02W15C003M 22N02W15C003M DWR 2/19/14 0:00 50.50 192.01 (TOC)22N02W15C003M 22N02W15C003M DWR 3/18/14 7:27 48.94 192.01 (TOC)
22N02W15C004M 22N02W15C004M DWR 3/20/13 9:50 47.67 192.25 (TOC)22N02W15C004M 22N02W15C004M DWR 5/23/13 0:00 77.15 192.25 (TOC)22N02W15C004M 22N02W15C004M DWR 6/26/13 0:00 69.97 192.25 (TOC)22N02W15C004M 22N02W15C004M DWR 7/3/13 0:00 98.74 192.25 (TOC)22N02W15C004M 22N02W15C004M DWR 7/9/13 0:00 104.45 192.25 (TOC)22N02W15C004M 22N02W15C004M DWR 7/16/13 0:00 102.30 192.25 (TOC)22N02W15C004M 22N02W15C004M DWR 7/24/13 0:00 94.48 192.25 (TOC)22N02W15C004M 22N02W15C004M DWR 7/31/13 0:00 101.49 192.25 (TOC)22N02W15C004M 22N02W15C004M DWR 8/6/13 0:00 104.20 192.25 (TOC)22N02W15C004M 22N02W15C004M DWR 8/13/13 0:00 79.14 192.25 (TOC)22N02W15C004M 22N02W15C004M DWR 8/20/13 0:00 76.35 192.25 (TOC)22N02W15C004M 22N02W15C004M DWR 8/27/13 0:00 80.05 192.25 (TOC)22N02W15C004M 22N02W15C004M DWR 9/4/13 0:00 73.85 192.25 (TOC)22N02W15C004M 22N02W15C004M DWR 9/12/13 0:00 88.20 192.25 (TOC)22N02W15C004M 22N02W15C004M DWR 9/18/13 0:00 75.02 192.25 (TOC)22N02W15C004M 22N02W15C004M DWR 10/1/13 0:00 57.72 192.25 (TOC)22N02W15C004M 22N02W15C004M DWR 10/8/13 0:00 58.75 192.25 (TOC)22N02W15C004M 22N02W15C004M DWR 10/15/13 7:16 58.77 192.25 (TOC)22N02W15C004M 22N02W15C004M DWR 10/25/13 0:00 65.55 192.25 (TOC)22N02W15C004M 22N02W15C004M DWR 11/22/13 0:00 48.16 192.25 (TOC)22N02W15C004M 22N02W15C004M DWR 12/18/13 0:00 58.80 192.25 (TOC)22N02W15C004M 22N02W15C004M DWR 1/15/14 0:00 60.53 192.25 (TOC)22N02W15C004M 22N02W15C004M DWR 2/19/14 0:00 47.75 192.25 (TOC)22N02W15C004M 22N02W15C004M DWR 3/18/14 7:32 46.66 192.25 (TOC)
22N02W15C005M 22N02W15C005M DWR 3/20/13 9:50 27.75 192.71 (TOC)22N02W15C005M 22N02W15C005M DWR 5/23/13 0:00 36.85 192.71 (TOC)22N02W15C005M 22N02W15C005M DWR 6/26/13 0:00 39.98 192.71 (TOC)22N02W15C005M 22N02W15C005M DWR 7/3/13 0:00 41.67 192.71 (TOC)22N02W15C005M 22N02W15C005M DWR 7/9/13 0:00 42.65 192.71 (TOC)22N02W15C005M 22N02W15C005M DWR 7/16/13 0:00 43.05 192.71 (TOC)22N02W15C005M 22N02W15C005M DWR 7/24/13 0:00 42.91 192.71 (TOC)22N02W15C005M 22N02W15C005M DWR 7/31/13 0:00 44.10 192.71 (TOC)22N02W15C005M 22N02W15C005M DWR 8/6/13 0:00 43.60 192.71 (TOC)22N02W15C005M 22N02W15C005M DWR 8/13/13 0:00 42.62 192.71 (TOC)22N02W15C005M 22N02W15C005M DWR 8/20/13 0:00 42.95 192.71 (TOC)22N02W15C005M 22N02W15C005M DWR 8/27/13 0:00 42.60 192.71 (TOC)22N02W15C005M 22N02W15C005M DWR 9/4/13 0:00 41.77 192.71 (TOC)22N02W15C005M 22N02W15C005M DWR 9/12/13 0:00 42.35 192.71 (TOC)22N02W15C005M 22N02W15C005M DWR 9/18/13 0:00 41.60 192.71 (TOC)22N02W15C005M 22N02W15C005M DWR 10/1/13 0:00 39.20 192.71 (TOC)22N02W15C005M 22N02W15C005M DWR 10/8/13 0:00 38.42 192.71 (TOC)22N02W15C005M 22N02W15C005M DWR 10/15/13 7:23 38.17 192.71 (TOC)22N02W15C005M 22N02W15C005M DWR 10/25/13 0:00 38.00 192.71 (TOC)22N02W15C005M 22N02W15C005M DWR 11/22/13 0:00 35.59 192.71 (TOC)22N02W15C005M 22N02W15C005M DWR 12/18/13 0:00 36.55 192.71 (TOC)22N02W15C005M 22N02W15C005M DWR 1/15/14 0:00 38.11 192.71 (TOC)22N02W15C005M 22N02W15C005M DWR 2/19/14 0:00 39.27 192.71 (TOC)22N02W15C005M 22N02W15C005M DWR 3/18/14 7:35 38.49 192.71 (TOC)
23N01W28M002M 23N01W28M002M DWR 3/20/13 0:00 12.35 160.33 (TOC)23N01W28M002M 23N01W28M002M BC-DW&RC 5/24/13 0:00 20.50 160.33 (TOC)23N01W28M002M 23N01W28M002M DWR 6/26/13 0:00 24.44 160.33 (TOC)23N01W28M002M 23N01W28M002M DWR 7/3/13 0:00 25.75 160.33 (TOC)23N01W28M002M 23N01W28M002M BC-DW&RC 7/8/13 0:00 27.20 160.33 (TOC)23N01W28M002M 23N01W28M002M DWR 7/9/13 0:00 27.20 160.33 (TOC)23N01W28M002M 23N01W28M002M DWR 7/16/13 0:00 29.35 160.33 (TOC)23N01W28M002M 23N01W28M002M DWR 7/24/13 0:00 31.66 160.33 (TOC)23N01W28M002M 23N01W28M002M BC-DW&RC 7/30/13 0:00 33.80 160.33 (TOC)23N01W28M002M 23N01W28M002M DWR 8/6/13 0:00 35.20 160.33 (TOC)23N01W28M002M 23N01W28M002M DWR 8/13/13 0:00 36.30 160.33 (TOC)23N01W28M002M 23N01W28M002M DWR 8/20/13 0:00 36.60 160.33 (TOC)23N01W28M002M 23N01W28M002M DWR 8/27/13 0:00 36.90 160.33 (TOC)23N01W28M002M 23N01W28M002M DWR 9/4/13 0:00 37.42 160.33 (TOC)23N01W28M002M 23N01W28M002M DWR 9/12/13 0:00 37.95 160.33 (TOC)23N01W28M002M 23N01W28M002M DWR 9/18/13 0:00 37.64 160.33 (TOC)23N01W28M002M 23N01W28M002M DWR 10/1/13 0:00 35.81 160.33 (TOC)23N01W28M002M 23N01W28M002M DWR 10/8/13 0:00 34.14 160.33 (TOC)23N01W28M002M 23N01W28M002M DWR 10/16/13 0:00 32.80 160.33 (TOC)23N01W28M002M 23N01W28M002M DWR 10/25/13 0:00 31.90 160.33 (TOC)23N01W28M002M 23N01W28M002M DWR 11/22/13 0:00 26.75 160.33 (TOC)23N01W28M002M 23N01W28M002M DWR 12/18/13 0:00 24.50 160.33 (TOC)23N01W28M002M 23N01W28M002M DWR 1/15/14 0:00 24.38 160.33 (TOC)23N01W28M002M 23N01W28M002M DWR 2/19/14 0:00 23.22 160.33 (TOC)23N01W28M002M 23N01W28M002M DWR 3/17/14 0:00 20.25 160.33 (TOC)
23N01W28M003M 23N01W28M003M DWR 3/20/13 0:00 13.40 160.57 (TOC)23N01W28M003M 23N01W28M003M BC-DW&RC 5/24/13 0:00 23.55 160.57 (TOC)23N01W28M003M 23N01W28M003M DWR 6/26/13 0:00 27.89 160.57 (TOC)23N01W28M003M 23N01W28M003M DWR 7/3/13 0:00 30.10 160.57 (TOC)23N01W28M003M 23N01W28M003M BC-DW&RC 7/8/13 0:00 30.70 160.57 (TOC)23N01W28M003M 23N01W28M003M DWR 7/9/13 0:00 30.70 160.57 (TOC)23N01W28M003M 23N01W28M003M DWR 7/16/13 0:00 32.10 160.57 (TOC)23N01W28M003M 23N01W28M003M DWR 7/24/13 0:00 33.91 160.57 (TOC)23N01W28M003M 23N01W28M003M BC-DW&RC 7/30/13 0:00 35.65 160.57 (TOC)23N01W28M003M 23N01W28M003M DWR 8/6/13 0:00 36.40 160.57 (TOC)23N01W28M003M 23N01W28M003M DWR 8/13/13 0:00 36.64 160.57 (TOC)23N01W28M003M 23N01W28M003M DWR 8/20/13 0:00 36.45 160.57 (TOC)23N01W28M003M 23N01W28M003M DWR 8/27/13 0:00 35.80 160.57 (TOC)23N01W28M003M 23N01W28M003M DWR 9/4/13 0:00 35.90 160.57 (TOC)23N01W28M003M 23N01W28M003M DWR 9/12/13 0:00 36.30 160.57 (TOC)23N01W28M003M 23N01W28M003M DWR 9/18/13 0:00 35.78 160.57 (TOC)23N01W28M003M 23N01W28M003M DWR 10/1/13 0:00 33.39 160.57 (TOC)23N01W28M003M 23N01W28M003M DWR 10/8/13 0:00 32.22 160.57 (TOC)23N01W28M003M 23N01W28M003M DWR 10/16/13 0:00 31.52 160.57 (TOC)

Directions: Key in data from the "Seller Groundwater Data Collection Form" into the applicable input columns in green below.
State/Agency Well Number
Monitoring Well NameMeasuring
AgencyMeasurement
Date
Measure Time (24 Hour
Time)
Water Level(Feet Below Reference
Point)
Reference Point(ex. Top of
Casing, Sounding Tube, etc.)
Comments such as water quality meter calibration information, unusual site conditions, etc…
General Seller and Well Information Date/Time Groundwater Level
STATE OF CALIFORNIA
THE NATURAL RESOURCES AGENCY
DEPARTMENT OF WATER RESOURCES
2012 Water Transfer Program
Seller Groundwater Data Electronic Reporting Form
23N01W28M003M 23N01W28M003M DWR 10/25/13 0:00 30.20 160.57 (TOC)23N01W28M003M 23N01W28M003M DWR 11/22/13 0:00 26.32 160.57 (TOC)23N01W28M003M 23N01W28M003M DWR 12/18/13 0:00 24.95 160.57 (TOC)23N01W28M003M 23N01W28M003M DWR 1/15/14 0:00 25.41 160.57 (TOC)23N01W28M003M 23N01W28M003M DWR 2/19/14 0:00 23.22 160.57 (TOC)23N01W28M003M 23N01W28M003M DWR 3/17/14 0:00 20.45 160.57 (TOC)
23N01W28M004M 23N01W28M004M DWR 03/20/2013 0:00 17.10 160.70 (TOC)23N01W28M004M 23N01W28M004M BC-DW&RC 5/24/13 0:00 26.30 160.70 (TOC)23N01W28M004M 23N01W28M004M DWR 6/26/13 0:00 28.94 160.70 (TOC)23N01W28M004M 23N01W28M004M DWR 7/3/13 0:00 33.10 160.70 (TOC)23N01W28M004M 23N01W28M004M BC-DW&RC 7/8/13 0:00 31.60 160.70 (TOC)23N01W28M004M 23N01W28M004M DWR 7/9/13 0:00 30.90 160.70 (TOC)23N01W28M004M 23N01W28M004M DWR 7/16/13 0:00 32.00 160.70 (TOC)23N01W28M004M 23N01W28M004M DWR 7/24/13 0:00 33.02 160.70 (TOC)23N01W28M004M 23N01W28M004M BC-DW&RC 7/30/13 0:00 34.65 160.70 (TOC)23N01W28M004M 23N01W28M004M DWR 8/6/13 0:00 33.80 160.70 (TOC)23N01W28M004M 23N01W28M004M DWR 8/13/13 0:00 34.35 160.70 (TOC)23N01W28M004M 23N01W28M004M DWR 8/20/13 0:00 33.90 160.70 (TOC)23N01W28M004M 23N01W28M004M DWR 8/27/13 0:00 33.70 160.70 (TOC)23N01W28M004M 23N01W28M004M DWR 9/4/13 0:00 34.22 160.70 (TOC)23N01W28M004M 23N01W28M004M DWR 9/12/13 0:00 33.20 160.70 (TOC)23N01W28M004M 23N01W28M004M DWR 9/18/13 0:00 33.79 160.70 (TOC)23N01W28M004M 23N01W28M004M DWR 10/1/13 0:00 31.39 160.70 (TOC)23N01W28M004M 23N01W28M004M DWR 10/8/13 0:00 30.69 160.70 (TOC)23N01W28M004M 23N01W28M004M DWR 10/16/13 0:00 30.14 160.70 (TOC)23N01W28M004M 23N01W28M004M DWR 10/25/13 0:00 30.90 160.70 (TOC)23N01W28M004M 23N01W28M004M DWR 11/22/13 0:00 27.92 160.70 (TOC)23N01W28M004M 23N01W28M004M DWR 12/18/13 0:00 28.00 160.70 (TOC)23N01W28M004M 23N01W28M004M DWR 1/15/14 0:00 28.32 160.70 (TOC)23N01W28M004M 23N01W28M004M DWR 2/19/14 0:00 25.97 160.70 (TOC)23N01W28M004M 23N01W28M004M DWR 3/17/14 0:00 22.90 160.70 (TOC)
23N01W28M005M 23N01W28M005M DWR 3/20/13 0:00 17.45 161.05 (TOC)23N01W28M005M 23N01W28M005M BC-DW&RC 5/24/13 0:00 25.60 161.05 (TOC)23N01W28M005M 23N01W28M005M DWR 6/26/13 0:00 28.61 161.05 (TOC)23N01W28M005M 23N01W28M005M DWR 7/3/13 0:00 30.68 161.05 (TOC)23N01W28M005M 23N01W28M005M BC-DW&RC 7/8/13 0:00 30.70 161.05 (TOC)23N01W28M005M 23N01W28M005M DWR 7/9/13 0:00 30.60 161.05 (TOC)23N01W28M005M 23N01W28M005M DWR 7/16/13 0:00 31.85 161.05 (TOC)23N01W28M005M 23N01W28M005M DWR 7/24/13 0:00 32.70 161.05 (TOC)23N01W28M005M 23N01W28M005M BC-DW&RC 7/30/13 0:00 33.55 161.05 (TOC)23N01W28M005M 23N01W28M005M DWR 8/6/13 0:00 33.90 161.05 (TOC)23N01W28M005M 23N01W28M005M DWR 8/13/13 0:00 33.83 161.05 (TOC)23N01W28M005M 23N01W28M005M DWR 8/20/13 0:00 34.00 161.05 (TOC)23N01W28M005M 23N01W28M005M DWR 8/27/13 0:00 34.05 161.05 (TOC)23N01W28M005M 23N01W28M005M DWR 9/4/13 0:00 33.89 161.05 (TOC)23N01W28M005M 23N01W28M005M DWR 9/12/13 0:00 33.60 161.05 (TOC)23N01W28M005M 23N01W28M005M DWR 9/18/13 0:00 33.47 161.05 (TOC)23N01W28M005M 23N01W28M005M DWR 10/1/13 0:00 31.98 161.05 (TOC)23N01W28M005M 23N01W28M005M DWR 10/8/13 0:00 31.35 161.05 (TOC)23N01W28M005M 23N01W28M005M DWR 10/16/13 0:00 30.86 161.05 (TOC)23N01W28M005M 23N01W28M005M DWR 10/25/13 0:00 30.80 161.05 (TOC)23N01W28M005M 23N01W28M005M DWR 11/22/13 0:00 28.72 161.05 (TOC)23N01W28M005M 23N01W28M005M DWR 12/18/13 0:00 28.20 161.05 (TOC)23N01W28M005M 23N01W28M005M DWR 1/15/14 0:00 28.54 161.05 (TOC)23N01W28M005M 23N01W28M005M DWR 2/19/14 0:00 26.79 161.05 (TOC)23N01W28M005M 23N01W28M005M DWR 3/17/14 0:00 30.86 161.05 (TOC)
23N01W31M001M 23N01W31M001M DWR 3/20/13 0:00 22.00 162.86 (TOC)23N01W31M001M 23N01W31M001M BC-DW&RC 5/24/13 0:00 28.75 162.86 (TOC)23N01W31M001M 23N01W31M001M DWR 6/26/13 0:00 31.92 162.86 (TOC)23N01W31M001M 23N01W31M001M DWR 7/3/13 0:00 35.60 162.86 (TOC)23N01W31M001M 23N01W31M001M BC-DW&RC 7/8/13 0:00 43.40 162.86 (TOC)23N01W31M001M 23N01W31M001M DWR 7/9/13 0:00 44.30 162.86 (TOC)23N01W31M001M 23N01W31M001M DWR 7/16/13 0:00 52.00 162.86 (TOC)23N01W31M001M 23N01W31M001M DWR 7/24/13 0:00 56.84 162.86 (TOC)23N01W31M001M 23N01W31M001M BC-DW&RC 7/29/13 0:00 59.55 162.86 (TOC)23N01W31M001M 23N01W31M001M DWR 8/6/13 0:00 63.80 162.86 (TOC)23N01W31M001M 23N01W31M001M DWR 8/13/13 0:00 65.44 162.86 (TOC)23N01W31M001M 23N01W31M001M DWR 8/20/13 0:00 68.35 162.86 (TOC)23N01W31M001M 23N01W31M001M DWR 8/27/13 0:00 69.70 162.86 (TOC)23N01W31M001M 23N01W31M001M DWR 9/4/13 0:00 71.18 162.86 (TOC)23N01W31M001M 23N01W31M001M DWR 9/12/13 0:00 72.00 162.86 (TOC)23N01W31M001M 23N01W31M001M DWR 9/18/13 0:00 69.94 162.86 (TOC)23N01W31M001M 23N01W31M001M DWR 10/1/13 0:00 62.61 162.86 (TOC)23N01W31M001M 23N01W31M001M DWR 10/8/13 0:00 56.92 162.86 (TOC)23N01W31M001M 23N01W31M001M DWR 10/16/13 0:00 51.96 162.86 (TOC)23N01W31M001M 23N01W31M001M DWR 10/25/13 0:00 49.50 162.86 (TOC)23N01W31M001M 23N01W31M001M DWR 11/22/13 0:00 41.21 162.86 (TOC)23N01W31M001M 23N01W31M001M DWR 12/18/13 0:00 38.20 162.86 (TOC)23N01W31M001M 23N01W31M001M DWR 1/15/14 0:00 36.46 162.86 (TOC)23N01W31M001M 23N01W31M001M DWR 2/19/14 0:00 37.39 162.86 (TOC)23N01W31M001M 23N01W31M001M DWR 3/17/14 0:00 32.10 162.86 (TOC)
23N01W31M002M 23N01W31M002M DWR 3/20/13 0:00 20.10 162.76 (TOC)23N01W31M002M 23N01W31M002M BC-DW&RC 5/24/13 0:00 37.15 162.76 (TOC)23N01W31M002M 23N01W31M002M DWR 6/26/13 0:00 39.31 162.76 (TOC)23N01W31M002M 23N01W31M002M DWR 7/3/13 0:00 43.94 162.76 (TOC)23N01W31M002M 23N01W31M002M BC-DW&RC 7/8/13 0:00 42.80 162.76 (TOC)23N01W31M002M 23N01W31M002M DWR 7/9/13 0:00 42.85 162.76 (TOC)23N01W31M002M 23N01W31M002M DWR 7/16/13 0:00 46.90 162.76 (TOC)23N01W31M002M 23N01W31M002M DWR 7/24/13 0:00 47.18 162.76 (TOC)23N01W31M002M 23N01W31M002M BC-DW&RC 7/29/13 0:00 47.05 162.76 (TOC)23N01W31M002M 23N01W31M002M DWR 8/6/13 0:00 49.30 162.76 (TOC)23N01W31M002M 23N01W31M002M DWR 8/13/13 0:00 47.61 162.76 (TOC)23N01W31M002M 23N01W31M002M DWR 8/20/13 0:00 49.55 162.76 (TOC)23N01W31M002M 23N01W31M002M DWR 8/27/13 0:00 48.70 162.76 (TOC)

Directions: Key in data from the "Seller Groundwater Data Collection Form" into the applicable input columns in green below.
State/Agency Well Number
Monitoring Well NameMeasuring
AgencyMeasurement
Date
Measure Time (24 Hour
Time)
Water Level(Feet Below Reference
Point)
Reference Point(ex. Top of
Casing, Sounding Tube, etc.)
Comments such as water quality meter calibration information, unusual site conditions, etc…
General Seller and Well Information Date/Time Groundwater Level
STATE OF CALIFORNIA
THE NATURAL RESOURCES AGENCY
DEPARTMENT OF WATER RESOURCES
2012 Water Transfer Program
Seller Groundwater Data Electronic Reporting Form
23N01W31M002M 23N01W31M002M DWR 9/4/13 0:00 49.34 162.76 (TOC)23N01W31M002M 23N01W31M002M DWR 9/12/13 0:00 47.75 162.76 (TOC)23N01W31M002M 23N01W31M002M DWR 9/18/13 0:00 43.72 162.76 (TOC)23N01W31M002M 23N01W31M002M DWR 10/1/13 0:00 39.50 162.76 (TOC)23N01W31M002M 23N01W31M002M DWR 10/8/13 0:00 39.31 162.76 (TOC)23N01W31M002M 23N01W31M002M DWR 10/16/13 0:00 36.97 162.76 (TOC)23N01W31M002M 23N01W31M002M DWR 10/25/13 0:00 37.85 162.76 (TOC)23N01W31M002M 23N01W31M002M DWR 11/22/13 0:00 32.09 162.76 (TOC)23N01W31M002M 23N01W31M002M DWR 12/18/13 0:00 32.60 162.76 (TOC)23N01W31M002M 23N01W31M002M DWR 1/15/14 0:00 33.59 162.76 (TOC)23N01W31M002M 23N01W31M002M DWR 2/19/14 0:00 29.46 162.76 (TOC)23N01W31M002M 23N01W31M002M DWR 3/17/14 0:00 25.90 162.76 (TOC)
23N01W31M003M 23N01W31M003M DWR 3/20/13 0:00 23.85 162.68 (TOC)23N01W31M003M 23N01W31M003M BC-DW&RC 5/24/13 0:00 38.25 162.68 (TOC)23N01W31M003M 23N01W31M003M DWR 6/26/13 0:00 33.43 162.68 (TOC)23N01W31M003M 23N01W31M003M DWR 7/3/13 0:00 50.22 162.68 (TOC)23N01W31M003M 23N01W31M003M BC-DW&RC 7/8/13 0:00 40.05 162.68 (TOC)23N01W31M003M 23N01W31M003M DWR 7/9/13 0:00 43.45 162.68 (TOC)23N01W31M003M 23N01W31M003M DWR 7/16/13 0:00 45.00 162.68 (TOC)23N01W31M003M 23N01W31M003M DWR 7/24/13 0:00 44.76 162.68 (TOC)23N01W31M003M 23N01W31M003M BC-DW&RC 7/29/13 0:00 45.50 162.68 (TOC)23N01W31M003M 23N01W31M003M DWR 8/6/13 0:00 43.15 162.68 (TOC)23N01W31M003M 23N01W31M003M DWR 8/13/13 0:00 43.07 162.68 (TOC)23N01W31M003M 23N01W31M003M DWR 8/20/13 0:00 42.45 162.68 (TOC)23N01W31M003M 23N01W31M003M DWR 8/27/13 0:00 40.60 162.68 (TOC)23N01W31M003M 23N01W31M003M DWR 9/4/13 0:00 43.23 162.68 (TOC)23N01W31M003M 23N01W31M003M DWR 9/12/13 0:00 38.30 162.68 (TOC)23N01W31M003M 23N01W31M003M DWR 9/18/13 0:00 37.59 162.68 (TOC)23N01W31M003M 23N01W31M003M DWR 10/1/13 0:00 31.75 162.68 (TOC)23N01W31M003M 23N01W31M003M DWR 10/8/13 0:00 31.65 162.68 (TOC)23N01W31M003M 23N01W31M003M DWR 10/16/13 0:00 33.20 162.68 (TOC)23N01W31M003M 23N01W31M003M DWR 10/25/13 0:00 32.30 162.68 (TOC)23N01W31M003M 23N01W31M003M DWR 11/22/13 0:00 28.30 162.68 (TOC)23N01W31M003M 23N01W31M003M DWR 12/18/13 0:00 32.70 162.68 (TOC)23N01W31M003M 23N01W31M003M DWR 1/15/14 0:00 31.93 162.68 (TOC)23N01W31M003M 23N01W31M003M DWR 2/19/14 0:00 27.22 162.68 (TOC)23N01W31M003M 23N01W31M003M DWR 3/17/14 0:00 25.50 162.68 (TOC)
23N01W31M004M 23N01W31M004M DWR 3/20/13 0:00 24.80 162.58 (TOC)23N01W31M004M 23N01W31M004M BC-DW&RC 5/24/13 0:00 27.05 162.58 (TOC)23N01W31M004M 23N01W31M004M DWR 6/26/13 0:00 27.95 162.58 (TOC)23N01W31M004M 23N01W31M004M DWR 7/3/13 0:00 28.58 162.58 (TOC)23N01W31M004M 23N01W31M004M BC-DW&RC 7/8/13 0:00 28.50 162.58 (TOC)23N01W31M004M 23N01W31M004M DWR 7/9/13 0:00 28.60 162.58 (TOC)23N01W31M004M 23N01W31M004M DWR 7/16/13 0:00 28.80 162.58 (TOC)23N01W31M004M 23N01W31M004M DWR 7/24/13 0:00 29.00 162.58 (TOC)23N01W31M004M 23N01W31M004M BC-DW&RC 7/29/13 0:00 29.20 162.58 (TOC)23N01W31M004M 23N01W31M004M DWR 8/6/13 0:00 29.35 162.58 (TOC)23N01W31M004M 23N01W31M004M DWR 8/13/13 0:00 29.58 162.58 (TOC)23N01W31M004M 23N01W31M004M DWR 8/20/13 0:00 29.70 162.58 (TOC)23N01W31M004M 23N01W31M004M DWR 8/27/13 0:00 29.80 162.58 (TOC)23N01W31M004M 23N01W31M004M DWR 9/4/13 0:00 30.00 162.58 (TOC)23N01W31M004M 23N01W31M004M DWR 9/12/13 0:00 29.85 162.58 (TOC)23N01W31M004M 23N01W31M004M DWR 9/18/13 0:00 29.97 162.58 (TOC)23N01W31M004M 23N01W31M004M DWR 10/1/13 0:00 29.23 162.58 (TOC)23N01W31M004M 23N01W31M004M DWR 10/8/13 0:00 29.21 162.58 (TOC)23N01W31M004M 23N01W31M004M DWR 10/16/13 0:00 29.36 162.58 (TOC)23N01W31M004M 23N01W31M004M DWR 10/25/13 0:00 29.45 162.58 (TOC)23N01W31M004M 23N01W31M004M DWR 11/22/13 0:00 28.87 162.58 (TOC)23N01W31M004M 23N01W31M004M DWR 12/18/13 0:00 28.95 162.58 (TOC)23N01W31M004M 23N01W31M004M DWR 1/15/14 0:00 29.11 162.58 (TOC)23N01W31M004M 23N01W31M004M DWR 2/19/14 0:00 28.38 162.58 (TOC)23N01W31M004M 23N01W31M004M DWR 3/17/14 0:00 26.60 162.58 (TOC)

APPENDIX C Groundwater Level Hydrographs
Figure C-1 Hydrograph GCID 1
Figure C-2 Hydrograph GCID 2
Figure C-3 Hydrograph GCID 3
Figure C-4 Hydrograph GCID 4
Figure C-5 Hydrograph GCID 5
Figure C-6 Hydrograph 20N02W11A001-3M
Figure C-7 Hydrograph 21N01W11A001-3M
Figure C-8 Hydrograph 21N01W13J001-3M
Figure C-9 Hydrograph 21N02W01F001-4M
Figure C-10 Hydrograph 21N02W04G002-5M
Figure C-11 Hydrograph 21N02W36A002M
Figure C-12 Hydrograph 22N01W29N001-4M
Figure C-13 Hydrograph 22N02W01N001-4M
Figure C-14 Hydrograph 22N02W15C002-5M
Figure C-15 Hydrograph 23N01W28M002-5M
Figure C-16 Hydrograph 23N01W31M001-4M

Figure C-1Glenn-Colusa Irrigation District
2013 Final Water Transfer Report
HYDROGRAPH GCID 1
‐150
‐100
‐50
0
50
100
150
200
Mar‐13 Apr‐13 May‐13 Jun‐13 Jul‐13 Aug‐13 Sep‐13 Oct‐13 Nov‐13 Dec‐13 Jan‐14 Feb‐14 Mar‐14 Apr‐14
Water Surface Elevatio
n (feet m
ean sea level)
Date
GCID 1 (800 to 1,300)
Note:1. Depths from the ground surface to the uppermost and lowermost
screened sections are shown in parentheses after each well name.

Figure C-2Glenn-Colusa Irrigation District
2013 Final Water Transfer Report
HYDROGRAPH GCID 2
‐150
‐100
‐50
0
50
100
150
200
Mar‐13 Apr‐13 May‐13 Jun‐13 Jul‐13 Aug‐13 Sep‐13 Oct‐13 Nov‐13 Dec‐13 Jan‐14 Feb‐14 Mar‐14 Apr‐14
Water Surface Elevatio
n (feet m
ean sea level)
Date
GCID 2 (920 to 1,230)
Note:1. Depths from the ground surface to the uppermost and lowermost
screened sections are shown in parentheses after each well name. 2. Groundwater level data are unavailable for GCID 2 between March 1,
2013 and July 1, 2013.

Figure C-3Glenn-Colusa Irrigation District
2013 Final Water Transfer Report
HYDROGRAPH GCID 3
‐150
‐100
‐50
0
50
100
150
200
Mar‐13 Apr‐13 May‐13 Jun‐13 Jul‐13 Aug‐13 Sep‐13 Oct‐13 Nov‐13 Dec‐13 Jan‐14 Feb‐14 Mar‐14 Apr‐14
Water Surface Elevatio
n (feet m
ean sea level)
Date
GCID 3 (782 to 1,228)
Note:1. Depths from the ground surface to the uppermost and lowermost
screened sections are shown in parentheses after each well name.

Figure C-4Glenn-Colusa Irrigation District
2013 Final Water Transfer Report
HYDROGRAPH GCID 4
‐150
‐100
‐50
0
50
100
150
200
Mar‐13 Apr‐13 May‐13 Jun‐13 Jul‐13 Aug‐13 Sep‐13 Oct‐13 Nov‐13 Dec‐13 Jan‐14 Feb‐14 Mar‐14 Apr‐14
Water Surface Elevatio
n (feet m
ean sea level)
Date
GCID 4 (799 to 1,241)
Note:1. Depths from the ground surface to the uppermost and lowermost
screened sections are shown in parentheses after each well name.
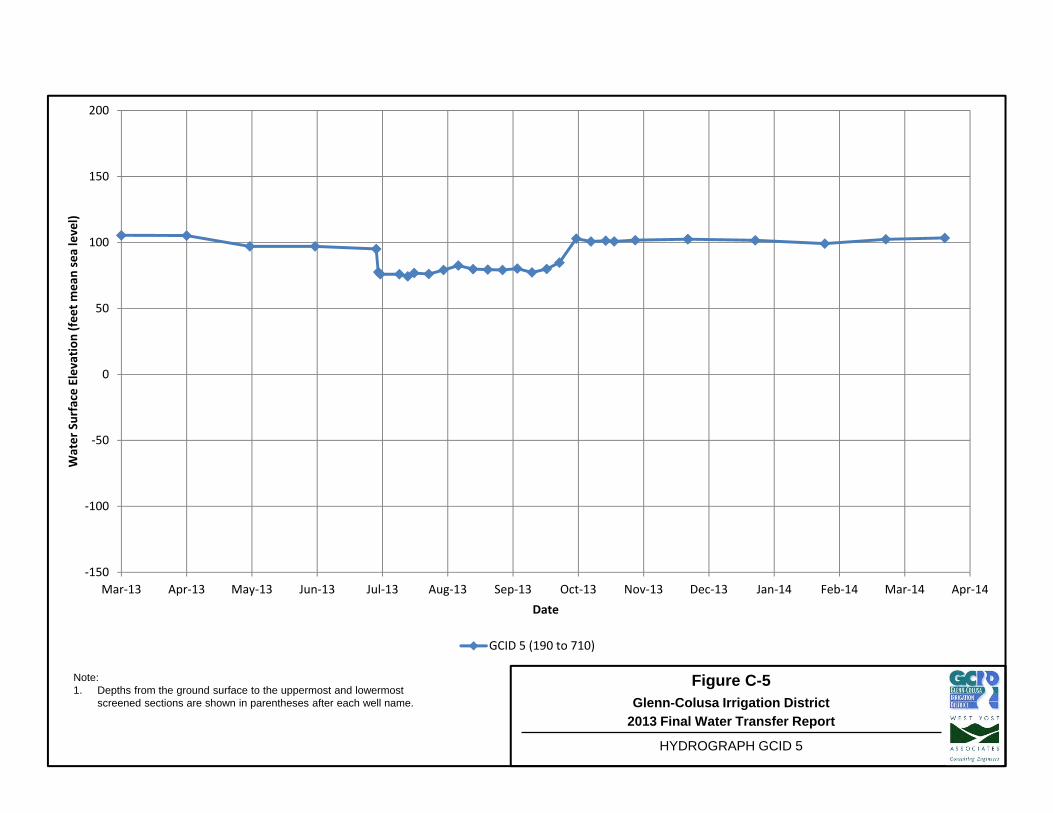
Figure C-5Glenn-Colusa Irrigation District
2013 Final Water Transfer Report
HYDROGRAPH GCID 5
‐150
‐100
‐50
0
50
100
150
200
Mar‐13 Apr‐13 May‐13 Jun‐13 Jul‐13 Aug‐13 Sep‐13 Oct‐13 Nov‐13 Dec‐13 Jan‐14 Feb‐14 Mar‐14 Apr‐14
Water Surface Elevatio
n (feet m
ean sea level)
Date
GCID 5 (190 to 710)
Note:1. Depths from the ground surface to the uppermost and lowermost
screened sections are shown in parentheses after each well name.

Figure C-6Glenn-Colusa Irrigation District
2013 Final Water Transfer Report
HYDROGRAPH 20N02W11A001-3M
40
60
80
100
120
140
160
180
200
Mar‐13 Apr‐13 May‐13 Jun‐13 Jul‐13 Aug‐13 Sep‐13 Oct‐13 Nov‐13 Dec‐13 Jan‐14 Feb‐14 Mar‐14 Apr‐14
Water Surface Elevatio
n (feet m
ean sea level)
Date
20N02W11A003M (490 to 510) 20N02W11A002M (140 to 160) 20N02W11A001M (70 to 90)
Note:1. Depths from the ground surface to the uppermost and lowermost
screened sections are shown in parentheses after each well name.

Figure C-7Glenn-Colusa Irrigation District
2013 Final Water Transfer Report
HYDROGRAPH 21N01W11A001-3M
40
60
80
100
120
140
160
180
200
Mar‐13 Apr‐13 May‐13 Jun‐13 Jul‐13 Aug‐13 Sep‐13 Oct‐13 Nov‐13 Dec‐13 Jan‐14 Feb‐14 Mar‐14 Apr‐14
Water Surface Elevatio
n (feet m
ean sea level)
Date
21N01W11A001M (810 to 1,280) 21N01W11A002M (125 to 185) 21N01W11A003M (30 to 50)
Note:1. Depths from the ground surface to the uppermost and lowermost
screened sections are shown in parentheses after each well name.
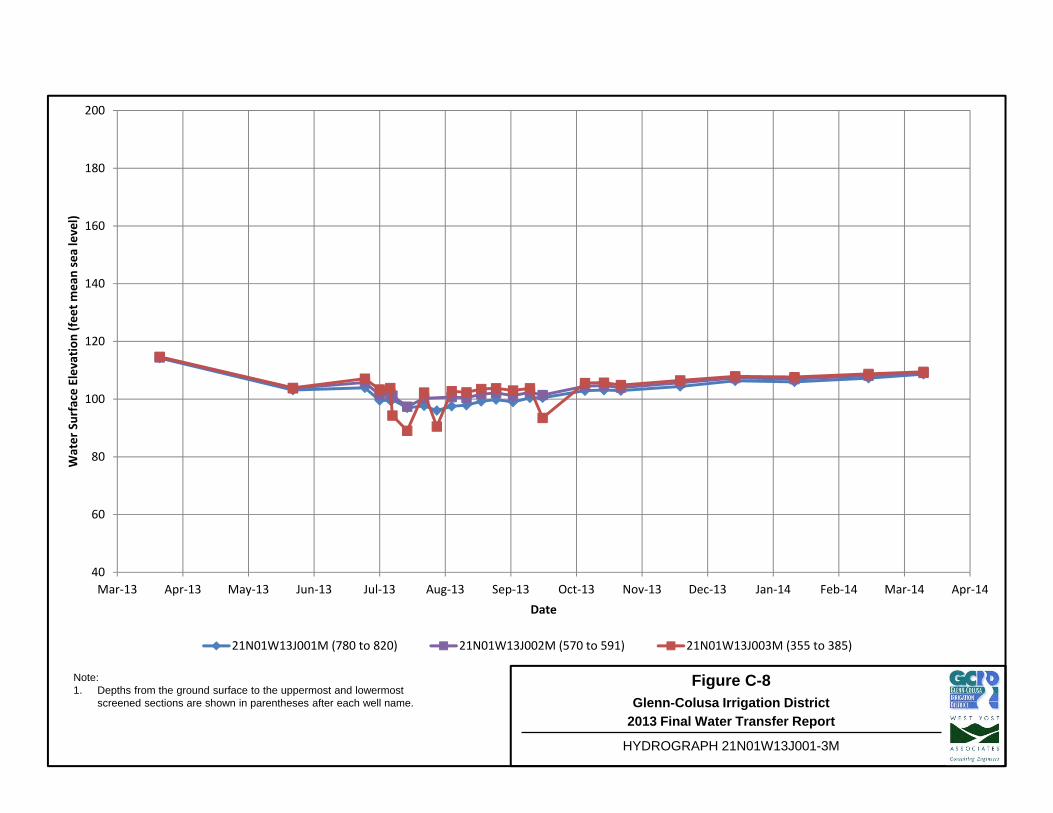
Figure C-8Glenn-Colusa Irrigation District
2013 Final Water Transfer Report
HYDROGRAPH 21N01W13J001-3M
40
60
80
100
120
140
160
180
200
Mar‐13 Apr‐13 May‐13 Jun‐13 Jul‐13 Aug‐13 Sep‐13 Oct‐13 Nov‐13 Dec‐13 Jan‐14 Feb‐14 Mar‐14 Apr‐14
Water Surface Elevatio
n (feet m
ean sea level)
Date
21N01W13J001M (780 to 820) 21N01W13J002M (570 to 591) 21N01W13J003M (355 to 385)
Note:1. Depths from the ground surface to the uppermost and lowermost
screened sections are shown in parentheses after each well name.

Figure C-9Glenn-Colusa Irrigation District
2013 Final Water Transfer Report
HYDROGRAPH 21N02W01F001-4M
40
60
80
100
120
140
160
180
200
Mar‐13 Apr‐13 May‐13 Jun‐13 Jul‐13 Aug‐13 Sep‐13 Oct‐13 Nov‐13 Dec‐13 Jan‐14 Feb‐14 Mar‐14 Apr‐14
Water Surface Elevatio
n (feet m
ean sea level)
Date
21N02W01F001M (547 to 557) 21N02W01F002M (297 to 307) 21N02W01F003M (109 to 119) 21N02W01F004M (55 to 65)
Note:1. Depths from the ground surface to the uppermost and lowermost
screened sections are shown in parentheses after each well name.

Figure C-10Glenn-Colusa Irrigation District
2013 Final Water Transfer Report
HYDROGRAPH 21N02W04G002-5M
40
60
80
100
120
140
160
180
200
Mar‐13 Apr‐13 May‐13 Jun‐13 Jul‐13 Aug‐13 Sep‐13 Oct‐13 Nov‐13 Dec‐13 Jan‐14 Feb‐14 Mar‐14 Apr‐14
Water Surface Elevatio
n (feet m
ean sea level)
Date
21N02W04G002M (928 to 938) 21N02W04G003M (674 to 704) 21N02W04G004M (165 to 279) 21N02W04G005M (57 to 67)
Note:1. Depths from the ground surface to the uppermost and lowermost
screened sections are shown in parentheses after each well name.

Figure C-11Glenn-Colusa Irrigation District
2013 Final Water Transfer Report
HYDROGRAPH 21N02W36A002M
40
60
80
100
120
140
160
180
200
Mar‐13 Apr‐13 May‐13 Jun‐13 Jul‐13 Aug‐13 Sep‐13 Oct‐13 Nov‐13 Dec‐13 Jan‐14 Feb‐14 Mar‐14 Apr‐14
Water Surface Elevatio
n (feet m
ean sea level)
Date
21N02W36A002M (120 to 140)
Note:1. Depths from the ground surface to the uppermost and lowermost
screened sections are shown in parentheses after each well name.
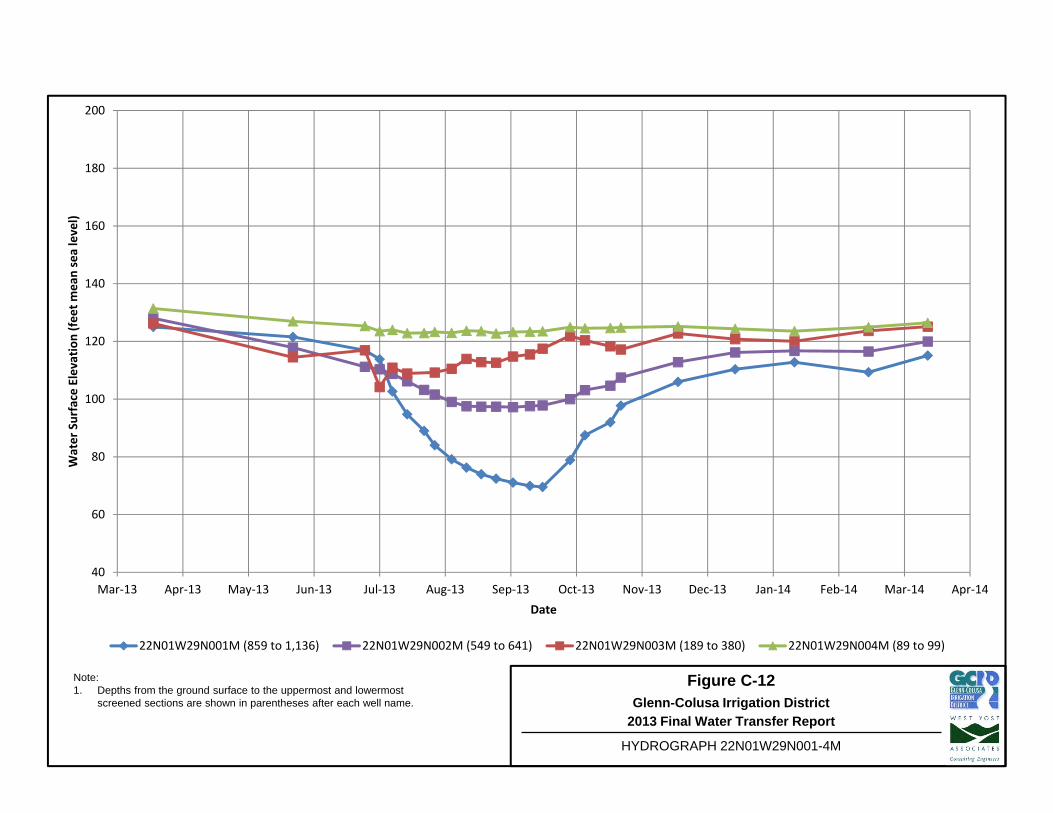
Figure C-12Glenn-Colusa Irrigation District
2013 Final Water Transfer Report
HYDROGRAPH 22N01W29N001-4M
40
60
80
100
120
140
160
180
200
Mar‐13 Apr‐13 May‐13 Jun‐13 Jul‐13 Aug‐13 Sep‐13 Oct‐13 Nov‐13 Dec‐13 Jan‐14 Feb‐14 Mar‐14 Apr‐14
Water Surface Elevatio
n (feet m
ean sea level)
Date
22N01W29N001M (859 to 1,136) 22N01W29N002M (549 to 641) 22N01W29N003M (189 to 380) 22N01W29N004M (89 to 99)
Note:1. Depths from the ground surface to the uppermost and lowermost
screened sections are shown in parentheses after each well name.

Figure C-13Glenn-Colusa Irrigation District
2013 Final Water Transfer Report
HYDROGRAPH 22N02W01N001-4M
40
60
80
100
120
140
160
180
200
Mar‐13 Apr‐13 May‐13 Jun‐13 Jul‐13 Aug‐13 Sep‐13 Oct‐13 Nov‐13 Dec‐13 Jan‐14 Feb‐14 Mar‐14 Apr‐14
Water Surface Elevatio
n (feet m
ean sea level)
Date
22N02W01N001M (810 to 1,050) 22N02W01N002M (700 to 710) 22N02W01N003M (210 to 370) 22N02W01N004M (70 to 80)
Note:1. Depths from the ground surface to the uppermost and lowermost
screened sections are shown in parentheses after each well name.

Figure C-14Glenn-Colusa Irrigation District
2013 Final Water Transfer Report
HYDROGRAPH 22N02W15C002-5M
40
60
80
100
120
140
160
180
200
Mar‐13 Apr‐13 May‐13 Jun‐13 Jul‐13 Aug‐13 Sep‐13 Oct‐13 Nov‐13 Dec‐13 Jan‐14 Feb‐14 Mar‐14 Apr‐14
Water Surface Elevatio
n (feet m
ean sea level)
Date
22N02W15C002M (760 to 781) 22N02W15C003M (370 to 380) 22N02W15C004M (210 to 220) 22N02W15C005M (60 to 70)
Note:1. Depths from the ground surface to the uppermost and lowermost
screened sections are shown in parentheses after each well name.

Figure C-15Glenn-Colusa Irrigation District
2013 Final Water Transfer Report
HYDROGRAPH 23N01W28M002-5M
40
60
80
100
120
140
160
180
200
Mar‐13 Apr‐13 May‐13 Jun‐13 Jul‐13 Aug‐13 Sep‐13 Oct‐13 Nov‐13 Dec‐13 Jan‐14 Feb‐14 Mar‐14 Apr‐14
Water Surface Elevatio
n (feet m
ean sea level)
Date
23N01W28M002M (791 to 1,021) 23N01W28M003M (640 to 670) 23N01W28M004M (120 to 165) 23N01W28M005M (30 to 50)
Note:1. Depths from the ground surface to the uppermost and lowermost
screened sections are shown in parentheses after each well name.

Figure C-16Glenn-Colusa Irrigation District
2013 Final Water Transfer Report
HYDROGRAPH 23N01W31M001-4M
40
60
80
100
120
140
160
180
200
Mar‐13 Apr‐13 May‐13 Jun‐13 Jul‐13 Aug‐13 Sep‐13 Oct‐13 Nov‐13 Dec‐13 Jan‐14 Feb‐14 Mar‐14 Apr‐14
Water Surface Elevatio
n (feet m
ean sea level)
Date
23N01W31M001M (969 to 1,030) 23N01W31M002M (545 to 600) 23N01W31M003M (140 to 201) 23N01W31M004M (66 to 76)
Note:1. Depths from the ground surface to the uppermost and lowermost
screened sections are shown in parentheses after each well name.

APPENDIX D Groundwater Level Contour Maps
Figure D-1 June 2013 Groundwater Elevation Contour Map, Wells 0 to 200 Feet Deep
Figure D-2 September 2013 Groundwater Elevation Contour Map, Wells 0 to 200 Feet Deep
Figure D-3 March 2014 Groundwater Elevation Contour Map, Wells 0 to 200 Feet Deep
Figure D-4 June 2013 Groundwater Elevation Contour Map, Wells 200 to 700 Feet Deep
Figure D-5 September 2013 Groundwater Elevation Contour Map, Wells 200 to 700 Feet Deep
Figure D-6 March 2014 Groundwater Elevation Contour Map, Wells 200 to 700 Feet Deep
Figure D-7 June 2013 Groundwater Elevation Contour Map, Wells 700 to 1,400 Feet Deep
Figure D-8 September 2013 Groundwater Elevation Contour Map, Wells 700 to 1,400 Feet Deep
Figure D-9 March 2014 Groundwater Elevation Contour Map, Wells 700 to 1,400 Feet Deep

@A
@A
@A@A
@A
@A
@A
@A
@A
@A
20N02W11A001M
21N01W11A003M
21N02W01F004M21N02W04G005M
21N02W36A002M
22N01W29N004M
22N02W01N004M
22N02W15C005M
23N01W28M005M
23N01W31M004M
121.24
116.01
126.17135.19
110.00
125.34
135.12
152.73
132.44
134.63
150145
140135
130
125
120
120
135
115
0 21
Miles
¯
LEGEND
GCID Service Area
GCID Main Canal
@A DWR Observation Well
Groundwater Elevation Contour, feet mslContour Interval: 5 feet
Last Saved: 5/6/2014 8:34:40 AM bkaasa; N:\Clients\550 Glenn-Colusa Irrigation District\00-13-03 Wtr Tran Monitor & Report\GIS\Figures\Figure D-1.mxd
Note:1. Groundwater elevation values used for contouringare posted above each well.
FIGURE D-1Glenn-Colusa Irrigation District
2013 Final Water Transfer ReportJUNE 2013 GROUNDWATER ELEVATION CONTOUR MAP,WELLS 0 TO 200 FEET DEEP

@A
@A
@A@A
@A
@A
@A
@A
@A
@A
20N02W11A001M
21N01W11A003M
21N02W01F004M21N02W04G005M
21N02W36A002M
22N01W29N004M
22N02W01N004M
22N02W15C005M
23N01W28M005M
23N01W31M004M
118.74
114.24
123.01131.37
105.41
123.50
134.11
151.11
127.58
132.61
150
145140
135130
125
120130
125
120
130
115
110
115
115
115
LEGEND
GCID Service Area
GCID Main Canal
@A DWR Observation Well
Groundwater Elevation Contour, feet mslContour Interval: 5 feet
Last Saved: 5/6/2014 8:37:28 AM bkaasa; N:\Clients\550 Glenn-Colusa Irrigation District\00-13-03 Wtr Tran Monitor & Report\GIS\Figures\Figure D-2.mxd
FIGURE D-2Glenn-Colusa Irrigation District
2013 Final Water Transfer ReportSEPTEMBER 2013 GROUNDWATER
ELEVATION CONTOUR MAP,WELLS 0 TO 200 FEET DEEP
0 21
Miles
¯
Note:1. Groundwater elevation values used for contouringare posted above each well.

@A
@A
@A@A
@A
@A
@A
@A
@A
@A
20N02W11A001M
21N01W11A003M
21N02W01F004M21N02W04G005M
21N02W36A002M
22N01W29N004M
22N02W01N004M
22N02W15C005M
23N01W28M005M
23N01W31M004M
116.15
114.43
125.66139.57
108.93
126.44
136.84
154.22
130.19
135.98
150145
140135
130
125
120
115
130
115
110
120
125
125
120
LEGEND
GCID Service Area
GCID Main Canal
@A DWR Observation Well
Groundwater Elevation Contour, feet mslContour Interval: 5 feet
Last Saved: 5/6/2014 8:38:55 AM bkaasa; N:\Clients\550 Glenn-Colusa Irrigation District\00-13-03 Wtr Tran Monitor & Report\GIS\Figures\Figure D-3.mxd
FIGURE D-3Glenn-Colusa Irrigation District
2013 Final Water Transfer ReportMARCH 2014 GROUNDWATER
ELEVATION CONTOUR MAP,WELLS 0 TO 200 FEET DEEP
0 21
Miles
¯
Note:1. Groundwater elevation values used for contouringare posted above each well.

@A
@A
@A@A
@A
@A
@A
@A
"/
20N02W11A003M
21N01W13J002M
21N02W01F001M21N02W04G003M
22N01W29N002M
22N02W15C003M
23N01W28M003M
23N01W31M002M
GCID 5
100.26
105.77
109.00110.28
111.21
106.20
132.68
123.45
95.06
125
120115110
105
100
100
130
110
110105
LEGEND
GCID Service Area
GCID Main Canal
"/ GCID Production Well
@A DWR Observation Well
Groundwater Elevation Contour, feet mslContour Interval: 5 feet
Last Saved: 5/6/2014 8:41:36 AM bkaasa; N:\Clients\550 Glenn-Colusa Irrigation District\00-13-03 Wtr Tran Monitor & Report\GIS\Figures\Figure D-4.mxd
FIGURE D-4Glenn-Colusa Irrigation District
2013 Final Water Transfer ReportJUNE 2013 GROUNDWATER ELEVATION CONTOUR MAP,
WELLS 200 TO 700 FEET DEEP
0 21
Miles
¯
Note:1. Groundwater elevation values used for contouringare posted above each well.

@A
@A
@A@A
@A
@A
@A
@A
@A
"/
20N02W11A003M
21N01W13J002M
21N02W01F001M21N02W04G003M
22N01W29N002M
22N02W01N003M
22N02W15C003M
23N01W28M003M
23N01W31M002M
GCID 5
97.66
101.42
105.03101.47
97.82
124.62
114.66
124.79
119.04
79.90
120
115110105
100
100
95
100
120
LEGEND
GCID Service Area
GCID Main Canal
"/ GCID Production Well
@A DWR Observation Well
Groundwater Elevation Contour, feet mslContour Interval: 5 feet
Last Saved: 5/6/2014 9:42:47 AM bkaasa; N:\Clients\550 Glenn-Colusa Irrigation District\00-13-03 Wtr Tran Monitor & Report\GIS\Figures\Figure D-5.mxd
FIGURE D-5Glenn-Colusa Irrigation District
2013 Final Water Transfer ReportSEPTEMBER 2013 GROUNDWATER
ELEVATION CONTOUR MAP,WELLS 200 TO 700 FEET DEEP
0 21
Miles
¯
Notes:1. The groundwater elevation value posted aboveGCID 5 is the pumping water level, and was notused for contouring purposes.2. Groundwater elevations in the vicinity of GCID 5were approximated.

@A
@A
@A@A
@A
@A
@A
@A
@A
"/
20N02W11A003M
21N01W13J002M
21N02W01F001M21N02W04G003M
22N01W29N002M
22N02W01N003M
22N02W15C003M
23N01W28M003M
23N01W31M002M
GCID 5
105.48
109.11
121.87119.53
119.95
138.83
143.07
140.12
136.86
103.40
140
135130
125
120
115110
135
130
125
110
140
115120
110105
LEGEND
GCID Service Area
GCID Main Canal
"/ GCID Production Well
@A DWR Observation Well
Groundwater Elevation Contour, feet mslContour Interval: 5 feet
Last Saved: 5/6/2014 9:22:56 AM bkaasa; N:\Clients\550 Glenn-Colusa Irrigation District\00-13-03 Wtr Tran Monitor & Report\GIS\Figures\Figure D-6.mxd
FIGURE D-6Glenn-Colusa Irrigation District
2013 Final Water Transfer ReportMARCH 2014 GROUNDWATER
ELEVATION CONTOUR MAP,WELLS 200 TO 700 FEET DEEP
0 21
Miles
¯
Note:1. Groundwater elevation values used for contouringare posted above each well.

@A
@A
@A
@A
@A
@A
@A
@A
"/
"/
"/
"/
21N01W11A001M
21N01W13J001M
21N02W04G002M
22N01W29N001M
22N02W01N001M
22N02W15C002M
23N01W28M002M
23N01W31M001M
GCID 1
GCID 2
GCID 3
GCID 4
109.10
103.92
110.82
116.93
129.47
135.89
130.94
129.80
111.44
107.14
130
125
120
115
110
125
120
105
135
130
115
110
110
LEGEND
GCID Service Area
GCID Main Canal
"/ GCID Production Well
@A DWR Observation Well
Groundwater Elevation Contour, feet mslContour Interval: 5 feet
Last Saved: 5/6/2014 9:41:03 AM bkaasa; N:\Clients\550 Glenn-Colusa Irrigation District\00-13-03 Wtr Tran Monitor & Report\GIS\Figures\Figure D-7.mxd
FIGURE D-7Glenn-Colusa Irrigation District
2013 Final Water Transfer ReportJUNE 2013 GROUNDWATER ELEVATION CONTOUR MAP,
WELLS 700 TO 1,400 FEET DEEP
0 10.5
Miles
¯
Notes:1. Groundwater elevation values used for contouringpurposes are posted above each well.2. Wells GCID 2 and 22N02W15C002M were notused for contouring purposes because groundwaterelevation values were not available for June 2013.

@A
@A
@A
@A
@A
@A
@A
@A
"/
"/
"/
"/
21N01W11A001M
21N01W13J001M
21N02W04G002M
22N01W29N001M
22N02W01N001M
22N02W15C002M
23N01W28M002M
23N01W31M001M
GCID 1
GCID 2
GCID 3
GCID 4
101.47
100.50
78.70
69.55
44.27
77.72
122.69
92.92
-49.50
-116.59
-47.80
-70.11
11510595
9085
8075
70
65
7010
09590858075
120
110
100
85
80
75
70
LEGEND
GCID Service Area
GCID Main Canal
"/ GCID Production Well
@A DWR Observation Well
Groundwater Elevation Contour, feet mslContour Interval: 5 feet
Last Saved: 5/9/2014 12:29:19 PM bkaasa; N:\Clients\550 Glenn-Colusa Irrigation District\00-13-03 Wtr Tran Monitor & Report\GIS\Figures\Figure D-8.mxd
FIGURE D-8Glenn-Colusa Irrigation District
2013 Final Water Transfer ReportSEPTEMBER 2013 GROUNDWATER
ELEVATION CONTOUR MAP,WELLS 700 TO 1,400 FEET DEEP
0 10.5
Miles
¯
Notes:1. Groundwater elevation values posted above theGCID production wells are the pumping water levelsand were not used for contouring purposes.2. Groundwater elevations in the vicinity of eachGCID production well were approximated.
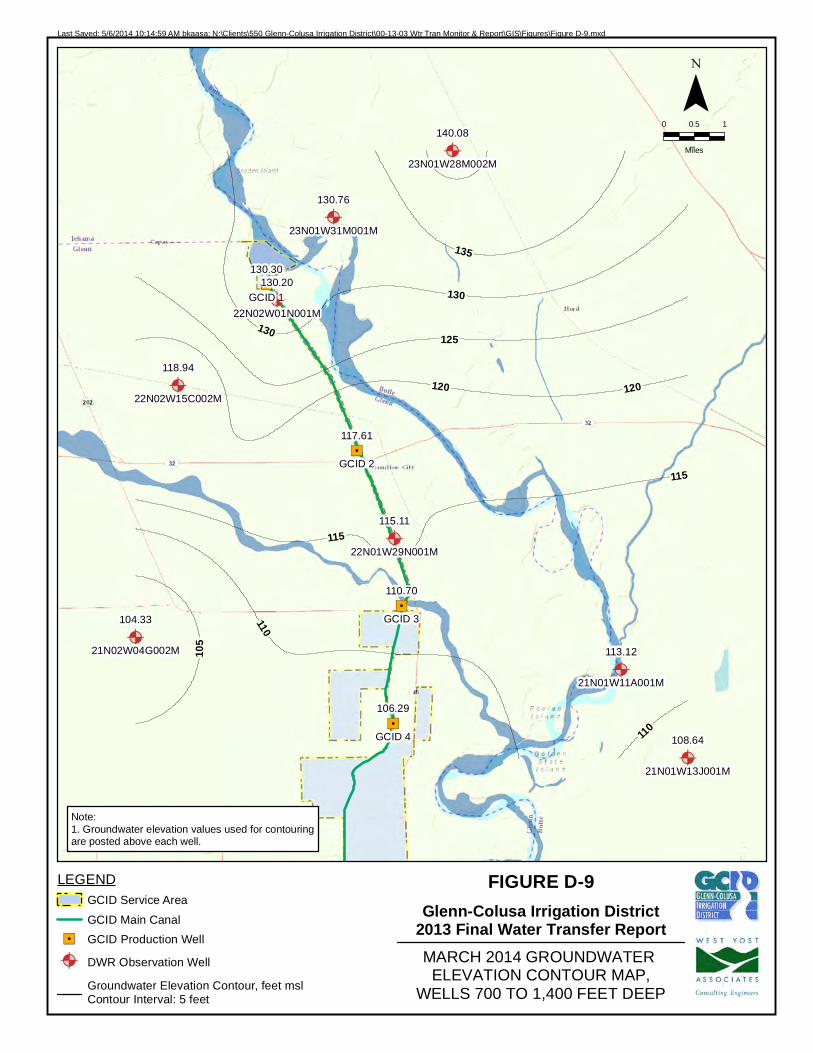
@A
@A
@A
@A
@A
@A
@A
@A
"/
"/
"/
"/
21N01W11A001M
21N01W13J001M
21N02W04G002M
22N01W29N001M
22N02W01N001M
22N02W15C002M
23N01W28M002M
23N01W31M001M
GCID 1
GCID 2
GCID 3
GCID 4
113.12
108.64
104.33
115.11
130.20
118.94
140.08
130.76
130.30
117.61
110.70
106.29
135
130
125
120
110
130
120
115
115110
105
LEGEND
GCID Service Area
GCID Main Canal
"/ GCID Production Well
@A DWR Observation Well
Groundwater Elevation Contour, feet mslContour Interval: 5 feet
Last Saved: 5/6/2014 10:14:59 AM bkaasa; N:\Clients\550 Glenn-Colusa Irrigation District\00-13-03 Wtr Tran Monitor & Report\GIS\Figures\Figure D-9.mxd
FIGURE D-9Glenn-Colusa Irrigation District
2013 Final Water Transfer ReportMARCH 2014 GROUNDWATER
ELEVATION CONTOUR MAP,WELLS 700 TO 1,400 FEET DEEP
0 10.5
Miles
¯
Note:1. Groundwater elevation values used for contouringare posted above each well.

APPENDIX E DWR Change in Groundwater Elevation Maps,
Spring 2013 to Spring 2014
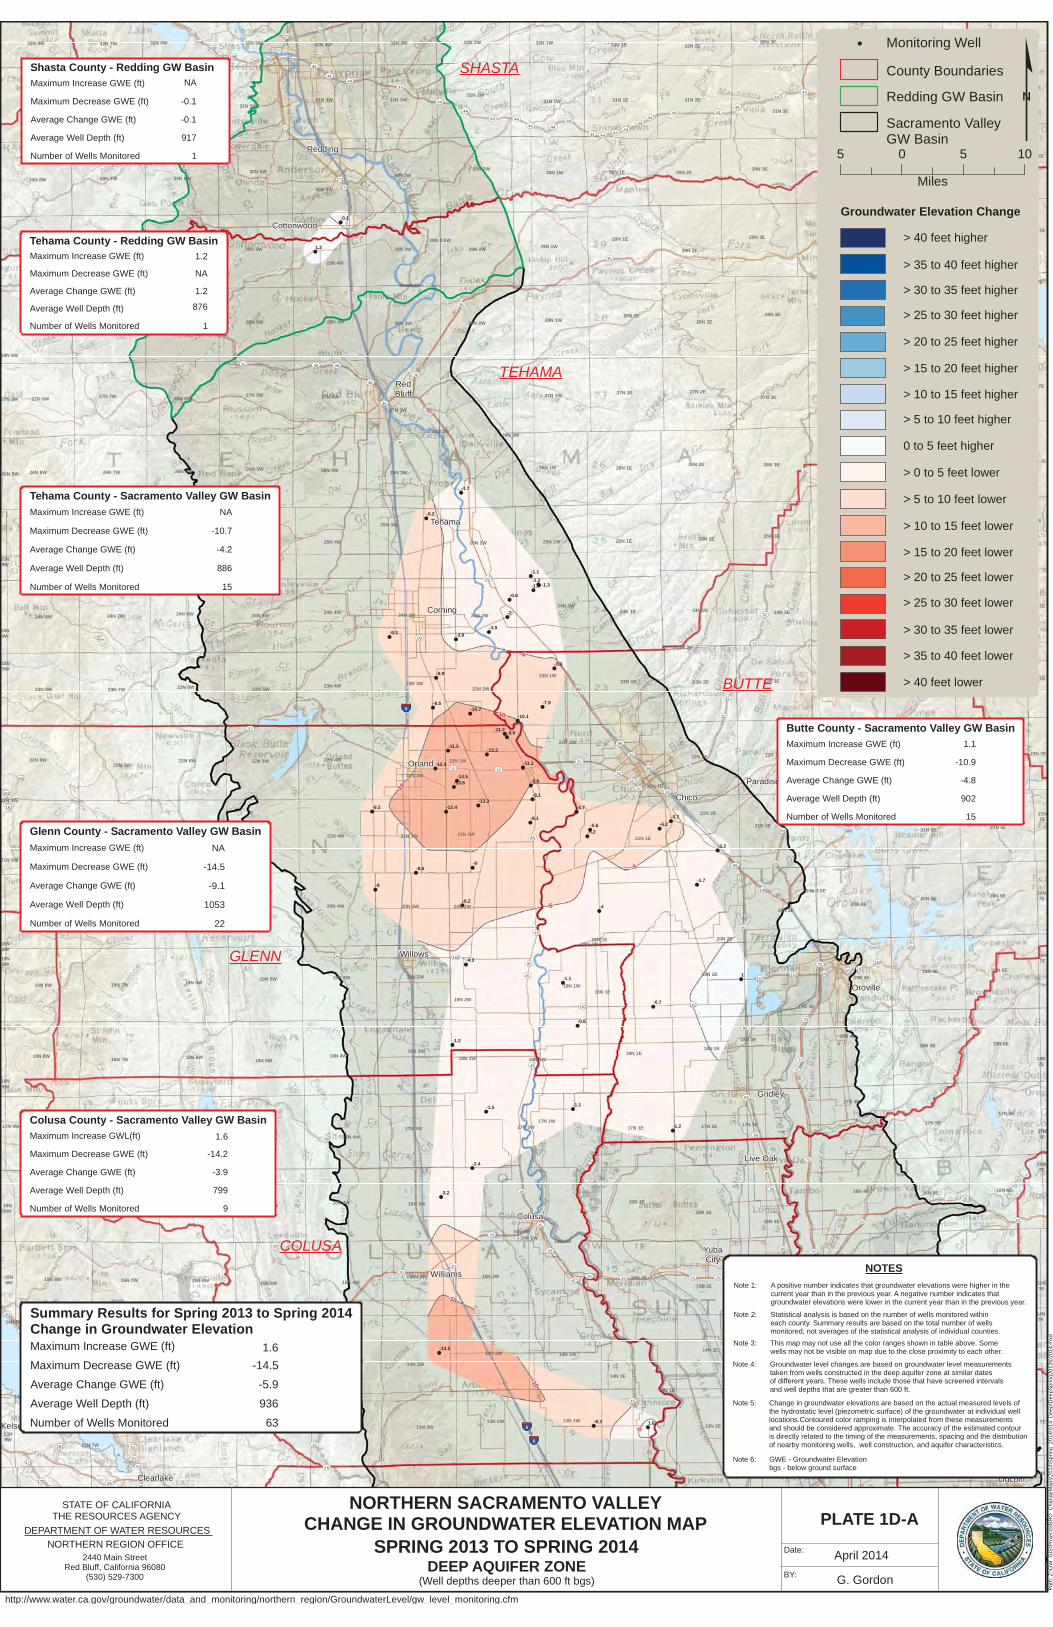
!
!!
! !
!
!
!
!
!
!
!
!
!
!
!
!
!
!
!
!
!
!
!
!
!
!
!!
!
!
!
!
!
!
!
!
!
!
!
!!
!
!
!
!
!
!
!
!
!
!
!
!
!
!
!
!
!
!!
!!
UV20
UV32
UV20
UV70
UV65
UV45
UV99
UV299
UV99
UV45
UV70
UV36
UV53
UV273
UV113
UV20
UV32
UV89
UV99
UV175
UV162
UV175
UV299
UV45
UV113
UV44
UV32
UV44
UV45
UV273
UV45
UV70
UV191
UV299
UV20
UV44
UV20
UV65
UV20
UV20
UV20
UV44
UV20
UV273
UV70
UV70
UV191
UV20
UV273
UV20
UV65
UV16
UV44
UV32
UV16
UV45
UV44
UV32
UV162
UV44
UV65
UV36
UV70
UV191
UV20
UV16
UV65
UV20
UV99
UV70
UV299
UV44
UV36
UV99
UV99
UV65
UV45
UV175
UV175
UV70
UV99
UV65
UV29
UV70
UV193
UV175
UV99
UV113
UV44
UV65
UV162
UV32
UV20
UV44
UV162
UV191
UV20
UV273
UV53
UV175
UV53
UV191
UV29
UV65
UV53
UV32
UV44
UV32
UV299
UV99
UV20
UV299
UV299
UV99
UV53
UV299
UV162
UV191
UV99
UV162
UV36
UV191
UV44
UV32
UV32
UV175
UV44
UV44
UV175
UV65
UV20
UV20
UV65
UV20
UV44
UV162
UV70
UV99
UV65
UV162
UV65
UV20
UV113
UV175
UV162
UV44
UV45
UV162
UV20
UV29
UV299
UV175
UV99
UV45
UV99
UV162
UV99
UV44
UV299
UV175
UV29
UV44
UV20
UV32
UV20
UV99
UV20
UV29
UV44 UV44
UV162
UV70
UV16
UV20
UV45
UV281
UV36
UV20
UV29
UV162
UV32
UV99
UV113
UV191
UV36
UV20
UV36
UV70
UV32
UV16
UV70
UV89
UV20
UV191
UV32
UV44
UV149
UV44
UV20
UV162
UV20
UV70
UV70
UV45
UV32
UV99
UV36
UV162
UV162
UV29
UV44
UV36
UV70
UV172
UV32
UV99
UV36
UV32
UV36
UV36
§̈¦505
§̈¦5
§̈¦5
§̈¦5
§̈¦5
BealeAFB
Chico
Clearlake
Colusa
Corning
Cottonwood
Gridley
Kelseyville
Lincoln
Live Oak
Lucerne
Orland
Oroville
Paradise
RedBluff
Redding
Sacramento
Tehama
Williams
Willows
YubaCity
11N 1E
11N 1W
11N 2E
11N 2W11N3E
11N 3W11N 4E
11N 4W11N 5E
11N 5W11N 6E11N 6W
11N 7E
11N 7W11N 8W11N9W
12N 1E12N 1W
12N 2E
12N 2W 12N 3E
12N3W
12N 4E12N 4W
12N 5E
12N 5W
12N 6E
12N 6W
12N 7E
12N 7W12N 8W12N9W
13N 1E
13N 1W13N 2E
13N 2W13N 3E13N 3W 13N 4E
13N 4W
13N 5E
13N 5W
13N 6E
13N 6W
13N 7E
13N 7W
13N 8W
13N9W
14N 1E
14N 1W14N 2E
14N 2W 14N 3E
14N 3W
14N 4E14N 4W
14N 5E
14N 5W
14N 6E
14N 6W
14N7E
14N 7W14N 8W
14N 9W
15N 1E
15N 1W
15N 2E
15N 2W
15N 3E
15N 3W
15N 4E
15N 4W
15N 5E
15N 5W
15N 6E
15N 6W 15N7E
15N 7W15N 8W15N9W
16N 1E
16N 1W
16N 2E
16N 2W
16N 3E
16N 3W
16N 4E
16N 4W
16N 5E
16N 5W
16N 6E
16N 6W
16N7E
16N 7W
16N 8W16N9W
17N 1E17N 1W
17N 2E17N 2W 17N 3E17N 3W
17N 4E
17N 4W
17N 5E
17N 5W
17N 6E
17N 6W 17N7E
17N 7W17N 8W17N 9W
18N 1E18N 1W
18N 2E
18N 2W
18N 3E
18N 3W
18N 4E
18N 4W
18N 5E
18N 5W
18N 6E
18N 6W 18N7E
18N 7W18N 8W
18N9W
19N 1E19N 1W
19N 2E
19N 2W
19N 3E
19N 3W 19N 4E19N 4W19N 5E
19N 5W
19N 6E
19N 6W
19N7E
19N 7W19N 8W
19N9W
20N 1E20N 1W
20N 2E
20N 2W20N 3E
20N 3W
20N 3.5E
20N 4E20N 4W
20N 5E
20N 5W
20N 6E20N 6W20N7E
20N 7W20N 8W
20N9W
21N 1E
21N 2E
21N 2W
21N 3E
21N 3W
21N 4E
21N 4W21N 5E
21N 5W
21N 6E
21N 6W
21N7E
21N 7W21N 8W
21N 9W
22N 1E
22N 1W
22N 2E22N 2W
22N 3E
22N 3W
22N 4E22N 4W
22N 5E
22N 5W
22N 6E
22N 6W
22N 7E
22N 7W22N 8W
22N 9W
23N 1E23N 1W
23N 2E
23N 2W
23N 3E23N 3W 23N 4E23N 4W 23N 5E23N 5W 23N 6E23N 6W
23N 7E
23N 7W23N 8W
23N9W
23.5N 2E
24N 1E24N 1W
24N 2E24N 2W
24N 3E24N 3W
24N 4E24N 4W 24N 5E
24N 5W
24N 6E24N 6W
24N 7E
24N 7W24N 8W
24N9W
25N 1E25N 1W25N 2E
25N 2W25N 3E
25N 3W
25N 4E25N 4W
25N 5E25N 5W
25N 6E
25N 6W
25N 7E
25N 7W25N 8W
25N9W
26N 1E26N 1W26N 2E
26N 2W
26N 3E
26N 3W
26N 4E
26N 4W
26N 5E
26N 5W
26N 6E
26N 6W
26N 7E
26N 7W26N 8W26N 9W
27N 1E27N 1W
27N 2E
27N 2W
27N 3E
27N 3W
27N 4E27N 4W
27N 5E
27N 5W
27N 6E
27N 6W
27N 7E
27N 7W27N 8W27N 9W
28N 1E28N 1W 28N 2E28N 2W
28N 3E
28N 3W
28N 4E
28N 4W
28N 5E
28N 5W
28N 6E
28N 6W
28N 7E
28N 7W28N 8W
28N 9W
28.5N 3W
29N 1E
29N 1W29N 2E29N 2W
29N 2.5W29N 3E
29N 3W
29N 4E
29N 4W
29N 5E
29N 5W
29N 6E
29N 6W
29N 7E
29N 7W29N 8W
30N 1E30N 1W 30N 2E30N 2W 30N 3E
30N 3W
30N 4E
30N 4W
30N 5E30N 5W
30N 6E
30N 6W
30N 7E
30N 7W30N 8W
31N 1E31N 1W 31N 2E31N 2W
31N 3E
31N 3W 31N 4E31N 4W
31N 5E
31N 5W
31N 6E
31N 6W
31N 7E
31N 7W31N 8W
32N 1E32N 1W32N 2E
32N 2W 32N 3E32N 3W 32N 4E32N 4W
32N 5E32N 5W
32N 6E
32N 6W32N 7E
32N 7W32N 8W
-4
1.6-8.3
-1.1
-1.2-1.3
-0.6
-1.7
-6.2
1
-1.2
1.2
-8.9
-7.9
-3.3
-1.1
-9.9
-0.1
-5.7
-10.1
-1.2
-13.6
-5.7-13.3
-11.5
-9.9-11.3
-12.4
-1.1
-0.6
-2.4
-1.5
-14.5
-12.4
-4.3
-0.7
-8.6
-9.3-3.9
-14.2
-1.7
-5.2
-5.6
-3.2
-3.8
-2
-9
-13.2
-9
-1.3
-9.2
-6.2
-9.1
-8.1
-11.2
-10.7-9.5
-6.2-5.6
0
-10
-10
-5
-5
-5
-10
-10
GLENN
BUTTE
COLUSA
TEHAMA
SHASTA ¢5 0 5 10
Miles
County Boundaries
Redding GW Basin
Sacramento Valley GW Basin
!( Monitoring Well
> 40 feet higher
> 35 to 40 feet higher
> 30 to 35 feet higher
> 25 to 30 feet higher
> 20 to 25 feet higher
> 15 to 20 feet higher
> 10 to 15 feet higher
> 5 to 10 feet higher
0 to 5 feet higher
> 0 to 5 feet lower
> 5 to 10 feet lower
> 10 to 15 feet lower
> 15 to 20 feet lower
> 20 to 25 feet lower
> 25 to 30 feet lower
> 30 to 35 feet lower
> 35 to 40 feet lower
> 40 feet lower
Groundwater Elevation Change
Change in groundwater elevations are based on the actual measured levels ofthe hydrostatic level (piezometric surface) of the groundwater at individual welllocations.Contoured color ramping is interpolated from these measurements and should be considered approximate. The accuracy of the estimated contour is directly related to the timing of the measurements, spacing and the distributionof nearby monitoring wells, well construction, and aquifer characteristics.
Note 5:
NOTES
GWE - Groundwater Elevationbgs - below ground surface
Note 6:
Note 1: A positive number indicates that groundwater elevations were higher in thecurrent year than in the previous year. A negative number indicates that groundwater elevations were lower in the current year than in the previous year.
This map may not use all the color ranges shown in table above. Somewells may not be visible on map due to the close proximity to each other.
Note 3:
Note 2: Statistical analysis is based on the number of wells monitored within each county. Summary results are based on the total number of wellsmonitored, not averages of the statistical analysis of individual counties.
Groundwater level changes are based on groundwater level measurementstaken from wells constructed in the deep aquifer zone at similar datesof different years. These wells include those that have screened intervals and well depths that are greater than 600 ft.
Note 4:
PLATE 1D-A
BY: G. Gordon
Date: April 2014
Pa
th:
Z:\
GW
_G
IS\P
roje
cts\
NR
O_
Ch
an
geM
ap
s\2
014
\Sp
rin
g_2
01
4\S
14_
De
ep
\De
epS
pri
ng
201
3to
201
4.m
xd
http://www.water.ca.gov/groundwater/data_and_monitoring/northern_region/GroundwaterLevel/gw_level_monitoring.cfm
DEPARTMENT OF WATER RESOURCES
STATE OF CALIFORNIATHE RESOURCES AGENCY
NORTHERN REGION OFFICE2440 Main Street
Red Bluff, California 96080(530) 529-7300
NORTHERN SACRAMENTO VALLEYCHANGE IN GROUNDWATER ELEVATION MAP
DEEP AQUIFER ZONE(Well depths deeper than 600 ft bgs)
SPRING 2013 TO SPRING 2014
Shasta County - Redding GW Basin Maximum Increase GWE (ft)
Maximum Decrease GWE (ft)
Average Change GWE (ft)
Average Well Depth (ft)
Number of Wells Monitored
NA
1
917
-0.1
-0.1
Tehama County - Redding GW BasinMaximum Increase GWE (ft)
Maximum Decrease GWE (ft)
Average Change GWE (ft)
Average Well Depth (ft)
Number of Wells Monitored
1.2
1
876
1.2
NA
Tehama County - Sacramento Valley GW Basin
Maximum Increase GWE (ft)
Maximum Decrease GWE (ft)
Average Change GWE (ft)
Average Well Depth (ft)
Number of Wells Monitored
NA
15
886
-4.2
-10.7
Butte County - Sacramento Valley GW Basin
Maximum Increase GWE (ft)
Maximum Decrease GWE (ft)
Average Change GWE (ft)
Average Well Depth (ft)
Number of Wells Monitored
1.1
15
902
-4.8
-10.9
Glenn County - Sacramento Valley GW Basin
Maximum Decrease GWE (ft)
Average Change GWE (ft)
Average Well Depth (ft)
Number of Wells Monitored 22
1053
-9.1
-14.5
Maximum Increase GWE (ft) NA
Colusa County - Sacramento Valley GW BasinMaximum Increase GWL(ft)
Maximum Decrease GWE (ft)
Average Change GWE (ft)
Average Well Depth (ft)
Number of Wells Monitored
1.6
9
799
-3.9
-14.2
Summary Results for Spring 2013 to Spring 2014Change in Groundwater ElevationMaximum Increase GWE (ft)
Maximum Decrease GWE (ft)
Average Change GWE (ft)
Average Well Depth (ft)
Number of Wells Monitored
1.6
63
936
-5.9
-14.5

!
!
!
!
!
!
!
!
!
!
!!
!
!!
!!
!
!
!
!
!
!!
!
!
!
!
!
!
!
!
! !! !
!
! !
!
!
!
!
!
!
!
!!
!
!
!
!
!
!
!
!
!!
!
!
!
!
!
!
!
!
!
!
!
!
!
!
!
!
!
!
!
!
!
!!
!
!
!
!
!
!
!
!
!
!!
!
!
!
!
!
!
!
!
!
!
!
!
!
!
!
!
!
!
!
!
!
!
!
!
!
!
!!
!
!
!
!
!
!
!
!
!
!!
!
!
!
!
!
!
!
!
!
!
!
!!
!
!
!
!!
!
!
!
!
!
!
!
!
!
!
!
!
!
!
!
!
!
!
!
!!
!
!
!
!
!
!!
!!
!
!!!
!!
!!
!!
!
!
!!
!
!
!
!
!!!
!
!
!
!
!
!
!
!
!
UV20
UV32
UV20
UV70
UV65
UV45
UV99
UV299
UV99
UV45
UV70
UV36
UV53
UV273
UV113
UV20
UV32
UV89
UV99
UV175
UV162
UV175
UV299
UV45
UV113
UV44
UV32
UV44
UV45
UV273
UV45
UV70
UV191
UV299
UV20
UV44
UV20
UV65
UV20
UV20
UV20
UV44
UV20
UV273
UV70
UV70
UV191
UV20
UV273
UV20
UV65
UV16
UV44
UV32
UV16
UV45
UV44
UV32
UV162
UV44
UV65
UV36
UV70
UV191
UV20
UV16
UV65
UV20
UV99
UV70
UV299
UV44
UV36
UV99
UV99
UV65
UV45
UV175
UV175
UV99
UV65
UV29
UV162
UV70
UV193
UV175
UV99
UV113
UV44
UV65
UV162
UV32
UV20
UV44
UV162
UV191
UV20
UV273
UV53
UV175
UV53
UV191
UV29
UV65
UV53
UV32
UV44
UV32
UV299
UV99
UV20
UV299
UV299
UV99
UV53
UV299
UV162
UV191
UV99
UV162
UV36
UV191
UV44
UV32
UV32
UV175
UV44
UV44
UV175
UV65
UV20
UV65
UV20
UV44
UV162
UV70
UV99
UV65
UV162
UV65
UV20
UV113
UV175
UV162
UV44
UV45
UV162
UV20
UV29
UV299
UV175
UV99
UV45
UV99
UV162
UV99
UV44
UV299
UV175
UV29
UV44
UV20
UV32
UV20
UV99
UV20
UV29
UV44 UV44
UV162
UV70
UV16
UV20
UV45
UV281
UV36
UV20
UV29
UV162
UV32
UV99
UV113
UV191
UV36
UV20
UV36
UV70
UV32
UV16
UV70
UV89
UV20
UV191
UV32
UV44
UV149
UV44
UV20
UV162
UV20
UV70
UV70
UV45
UV32
UV99
UV36
UV162
UV162
UV29
UV44
UV36
UV70
UV172
UV32
UV99
UV36
UV32
UV36
UV36
§̈¦505
§̈¦5
§̈¦5
§̈¦5
§̈¦5
-2.4
5.6
8.8
-2.6
-0.7
-3.65
-3.3
-0.91
-2.23
-1.68
0.74
-4.51
-1.21
-9.58
-2.06
-5.46
-6.53
12.6
-5.7
-5.7
-18.2
-14.7
-10.7-4.7
8.7
3
0.7
0.2
-5
-10.84
-4.3
-6.3
-5.6 -13.3
-1.05
-0.56
-11.2
-1 -1.4
3.8
-1.16
-8
-0.6
-3.4
-9-9.75
0.60.4
0.6
-1.97
-1.2
-5.15
-4.4
-1.2
-1.7
-1.6
-7-6.2
1
-2.1
-2.2
-4.85
-0.9
7.1-4.1
0.695
-1.68
-6.846
-8.03
-6.724
1.2
0.5
-4.316
-0.89
-5.22
0
2
-3.84
-8.73
3.39
-2.3
-3.15
-3
-1.11
-0.75
-2.93
-4.86
23.25
-5.8
-0.7
0.490.27
0.92
0.03
-4.19
-1.99
0.245
-4.6
-7.17
1.7
-3.55
-2.159
-3.48
-1.589
-3.27
-2.58
0.566
-2.66
1
-0.82
1.37
-5.24
-1.66
0.91
-9.3
0.29
-3.41
4.1
16.611.6
18.6
4.9
-3.5
-3.3
0
1.7
0.4
-5.49
-2.29
-7.8
-3.6
-1.1
-5.1
-8.1
-9.4
-2.7
-7.5
-14.6
4.3
1.09
0.78
-9.94
6.4-0.6
-7.5
11.4
-1.39
-6.631.7
-0.75
-0.3
-1.1
-1.4
-16.5
-0.95
-1.074
-7.58
0.6
-3.77
-2.68
0.77
-2.69
-1.549
-6.2
-8.5
-21
-1.6
-3.5
1.6-10.6
-0.74
-11.965
-4.632
-7.231
-5.74
-2.6
-2.6
-2.07
-1.82
-0.1
-3.1
-2.9-2.8
0.11-4.61
-3.62
-6.57
-6.8-5.2
-5.9
-1.5
-2.7
-5.3
-0.46
-1.424
-14.603
-3.464
4.432.953.03
-4.01
-0.53
-0.3
-4.8
-1.2
-3.2
-4.7
-5.3
0.7
BealeAFB
Chico
Clearlake
Colusa
Corning
Cottonwood
Gridley
Kelseyville
Lincoln
Live Oak
Lucerne
Orland
Oroville
Paradise
RedBluff
Redding
Sacramento
Tehama
Williams
Willows
YubaCity
11N 1E
11N 1W
11N 2E
11N 2W11N3E
11N 3W11N 4E
11N 4W11N 5E
11N 5W11N 6E11N 6W
11N 7E
11N 7W11N 8W11N9W
12N 1E12N 1W
12N 2E
12N 2W 12N 3E
12N3W
12N 4E12N 4W
12N 5E
12N 5W
12N 6E
12N 6W
12N 7E
12N 7W12N 8W12N9W
13N 1E
13N 1W 13N 2E13N 2W
13N 3E13N 3W 13N 4E13N 4W
13N 5E
13N 5W
13N 6E
13N 6W
13N 7E
13N 7W
13N 8W
13N9W
14N 1E
14N 1W14N 2E14N 2W
14N 3E14N 3W 14N 4E14N 4W
14N 5E
14N 5W
14N 6E
14N 6W
14N7E
14N 7W14N 8W
14N 9W
15N 1E
15N 1W
15N 2E
15N 2W
15N 3E
15N 3W
15N 4E
15N 4W
15N 5E
15N 5W
15N 6E
15N 6W 15N7E
15N 7W15N 8W15N9W
16N 1E
16N 1W
16N 2E
16N2W
16N 3E
16N 3W 16N 4E
16N 4W
16N 5E
16N 5W
16N 6E
16N 6W
16N7E
16N 7W
16N 8W16N9W
17N 1E17N 1W
17N 2E17N 2W 17N 3E17N 3W
17N 4E
17N 4W
17N 5E
17N 5W
17N 6E
17N 6W 17N7E
17N 7W17N 8W17N 9W
18N 1E18N 1W
18N 2E
18N 2W
18N 3E
18N 3W
18N 4E
18N 4W
18N 5E
18N 5W
18N 6E
18N 6W 18N7E
18N 7W18N 8W
18N9W
19N 1E19N 1W
19N 2E
19N 2W
19N 3E
19N 3W 19N 4E19N 4W19N 5E
19N 5W
19N 6E
19N 6W
19N7E
19N 7W19N 8W
19N9W
20N 1E20N 1W
20N 2E
20N 2W20N 3E
20N 3W
20N 3.5E
20N 4E20N 4W
20N 5E
20N 5W
20N 6E20N 6W20N7E
20N 7W20N 8W
20N9W
21N 1E
21N 2E
21N 2W
21N 3E
21N 3W
21N 4E
21N 4W21N 5E
21N 5W
21N 6E
21N 6W
21N7E
21N 7W21N 8W
21N 9W
22N 1E
22N 1W
22N 2E
22N 2W
22N 3E
22N 3W
22N 4E22N 4W
22N 5E
22N 5W
22N 6E
22N 6W
22N 7E
22N 7W22N 8W
22N 9W
23N 1E23N 1W
23N 2E
23N 2W
23N 3E
23N 3W23N 4E23N 4W 23N 5E
23N 5W 23N 6E23N 6W
23N 7E
23N 7W23N 8W
23N9W
23.5N 2E
24N 1E24N 1W
24N 2E24N 2W
24N 3E24N 3W
24N 4E24N 4W 24N 5E
24N 5W
24N 6E24N 6W
24N 7E
24N 7W24N 8W
24N9W
25N 1E25N 1W25N 2E
25N 2W25N 3E
25N 3W25N 4E
25N 4W25N 5E
25N 5W
25N 6E
25N 6W
25N 7E
25N 7W25N 8W
25N9W
26N 1E26N 1W26N 2E
26N 2W
26N 3E
26N 3W
26N 4E
26N 4W
26N 5E
26N 5W
26N 6E
26N 6W
26N 7E
26N 7W26N 8W26N 9W
27N 1E27N 1W
27N 2E
27N 2W
27N 3E
27N 3W
27N 4E27N 4W
27N 5E
27N 5W
27N 6E
27N 6W
27N 7E
27N 7W27N 8W27N 9W
28N 1E28N 1W 28N 2E28N 2W
28N 3E
28N 3W
28N 4E
28N 4W
28N 5E
28N 5W
28N 6E
28N 6W
28N 7E
28N 7W28N 8W
28N 9W
28.5N 3W
29N 1E
29N 1W29N 2E29N 2W
29N 2.5W29N 3E
29N 3W
29N 4E
29N 4W
29N 5E
29N 5W
29N 6E
29N 6W
29N 7E
29N 7W29N 8W
30N 1E30N 1W 30N 2E30N 2W 30N 3E
30N 3W
30N 4E30N 4W 30N 5E30N 5W
30N 6E
30N 6W
30N 7E
30N 7W30N 8W
31N 1E31N 1W 31N 2E31N 2W
31N 3E
31N 3W 31N 4E31N 4W
31N 5E
31N 5W
31N 6E
31N 6W
31N 7E
31N 7W31N 8W
32N 1E32N 1W32N 2E
32N 2W 32N 3E32N 3W 32N 4E32N 4W
32N 5E32N 5W
32N 6E
32N 6W32N 7E
32N 7W32N 8W
0
10
0
-5
-5
-15
-10
-10
0
5
-5
-5
-10
0
-5
-5
0
0
0
0
0
0
-5
-10
-5
0
0
0
-5
-5
-5
0
-5
0
GLENN
BUTTE
COLUSA
TEHAMA
SHASTA
NOTES
GWE - Groundwater Elevationbgs - below ground surface
Note 6:
Note 1: A positive number indicates that groundwater elevations were higher in thecurrent year than in the previous year. A negative number indicates that groundwater elevations were lower in the current year than in the previous year.
This map may not use all the color ranges shown in table above. Somewells may not be visible on map due to the close proximity to each other.
Note 3:
Note 2: Statistical analysis is based on the number of wells monitored within each county. Summary results are based on the total number of wellsmonitored, not averages of the statistical analysis of individual counties.
Groundwater level changes are based on groundwater level measurementstaken from wells constructed in the intermediate aquifer zone at similar datesof different years. These wells include those that have screened intervals and well depths that are generally greater than 200 ft and less than 600 ft.
Note 4:
Change in groundwater elevations are based on the actual measured levels ofthe hydrostatic level (piezometric surface) of the groundwater at individual welllocations.Contoured color ramping is interpolated from these measurements and should be considered approximate. The accuracy of the estimated contour is directly related to the timing of the measurements, spacing and the distributionof nearby monitoring wells, well construction, and aquifer characteristics.
Note 5:
Shasta County - Redding GW Basin Maximum Increase GWE (ft)
Maximum Decrease GWE (ft)
Average Change GWE (ft)
Average Well Depth (ft)
Number of Wells Monitored
1
5
387
-0.8
-2.1
Tehama County - Redding GW BasinMaximum Increase GWE (ft)
Maximum Decrease GWE (ft)
Average Change GWE (ft)
Average Well Depth (ft)
Number of Wells Monitored
7.1
4
337
0.1
-4.1
Tehama County - Sacramento Valley GW Basin
Maximum Increase GWE (ft)
Maximum Decrease GWE (ft)
Average Change GWE (ft)
Average Well Depth (ft)
Number of Wells Monitored
6.4
26
420
-2.2
-16.5
Glenn County - Sacramento Valley GW Basin
Maximum Decrease GWE (ft)
Average Change GWE (ft)
Average Well Depth (ft)
Number of Wells Monitored 40
430
-2.0
-9.4
Maximum Increase GWE (ft) 11.4
Colusa County - Sacramento Valley GW BasinMaximum Increase GWL(ft)
Maximum Decrease GWE (ft)
Average Change GWE (ft)
Average Well Depth (ft)
Number of Wells Monitored
2.0
27
415
-4.7
-21.0
Butte County - Sacramento Valley GW Basin
Maximum Increase GWE (ft)
Maximum Decrease GWE (ft)
Average Change GWE (ft)
Average Well Depth (ft)
Number of Wells Monitored
3.8
22
488
-3.5
-14.6
Summary Results for Spring 2013 to Spring 2014Change in Groundwater ElevationMaximum Increase GWE (ft)
Maximum Decrease GWE (ft)
Average Change GWE (ft)
Average Well Depth (ft)
Number of Wells Monitored
11.4
120
431
-2.9
-21.0
PLATE 1I-A
BY: G. Gordon
Date: April 2014
Pa
th:
Z:\
GW
_G
IS\P
roje
cts\
NR
O_
Ch
an
geM
ap
s\2
014
\Sp
rin
g_2
01
4\S
14_
Inte
rme
dia
te\I
nte
rmed
iate
Sp
rin
g20
13
to2
014
.mxd
http://www.water.ca.gov/groundwater/data_and_monitoring/northern_region/GroundwaterLevel/gw_level_monitoring.cfm
DEPARTMENT OF WATER RESOURCES
STATE OF CALIFORNIATHE RESOURCES AGENCY
NORTHERN REGION OFFICE2440 Main Street
Red Bluff, California 96080(530) 529-7300
NORTHERN SACRAMENTO VALLEYCHANGE IN GROUNDWATER ELEVATION MAP
INTERMEDIATE AQUIFER ZONE(Well depths generally greater than 200 ft and less than 600 ft deep bgs)
SPRING 2013 TO SPRING 2014
¢5 0 5 10
Miles
County Boundaries
Redding GW Basin
Sacramento Valley GW Basin
!( Monitoring Well
> 40 feet higher
> 35 to 40 feet higher
> 30 to 35 feet higher
> 25 to 30 feet higher
> 20 to 25 feet higher
> 15 to 20 feet higher
> 10 to 15 feet higher
> 5 to 10 feet higher
0 to 5 feet higher
> 0 to 5 feet lower
> 5 to 10 feet lower
> 10 to 15 feet lower
> 15 to 20 feet lower
> 20 to 25 feet lower
> 25 to 30 feet lower
> 30 to 35 feet lower
> 35 to 40 feet lower
> 40 feet lower
Groundwater Elevation Change

!
!
!
!
!
!
!
!!
!
!
!
! !
!
!
!
!
!
!
!
!
!
!
!
!
!
!
!
!!
!
!
!
!
!!
!
!
!
!
!
!
!
!
!
!!
!
!
!
!
!
!
!!
!!
!
!
!
!
!
!
!
!
!
!
!
!
!
!
! !
!
!!
!
!!
!
!
!!
!
!
!
!!
!
!
!
!
!
!
!
!
!!!
!
!
!
!
!
!
!
!
!
!
!
!
!
!
!
!
!
!
!
!
!
!
!
!
!
!
!!
!
!
!
!
!
!
!
!
!
!
!
!
!
!
!
!
!
!
!!
!
!
!
!
!
!
!
!
!
!
!
!
!
!
!
!
!
!
!
!
!
!
!
!
!
!
!
!
!
!
!
!
!
!
!
!
!
!
!
!
!
!
!
!
!
!
!
!
!
!
!
!
!
!
!
!
!
!
!
!
!
!
!
!
!
!
!
!
!
!
!
!!
!
!
!
!
!
!
!
!!
!
!
!
!
UV20
UV20
UV70
UV65
UV45
UV99
UV299
UV99
UV45
UV70
UV36
UV53
UV36
UV273
UV113
UV20
UV32
UV89
UV99
UV175
UV162
UV175
UV299
UV45
UV113
UV44
UV32
UV44
UV45
UV273
UV45
UV70
UV191
UV299
UV20
UV44
UV44
UV20
UV65
UV20
UV20
UV20
UV44
UV20
UV273
UV70
UV191
UV20
UV273
UV20
UV65
UV16
UV44
UV32
UV16
UV45
UV44
UV32
UV36
UV162
UV44
UV65
UV36
UV70
UV191
UV20
UV16
UV65
UV20
UV99
UV70
UV299
UV44
UV99
UV99
UV65
UV45
UV175
UV175
UV99
UV70
UV99
UV65
UV29
UV162
UV70
UV193
UV175
UV99
UV113
UV44
UV65
UV162
UV32
UV20
UV44
UV162
UV191
UV20
UV273
UV53
UV175
UV53
UV191
UV29
UV65
UV53
UV44
UV32
UV299
UV99
UV20
UV299
UV299
UV53
UV299
UV162
UV191
UV99
UV162
UV36
UV191
UV44
UV32
UV32
UV175
UV44
UV44
UV175
UV65
UV20
UV65
UV20
UV44
UV162
UV70
UV99
UV65
UV162
UV65
UV20
UV113
UV175
UV162
UV44
UV45
UV162
UV20
UV29
UV299
UV175
UV99
UV45
UV99
UV162
UV99
UV44
UV299
UV175
UV29
UV44
UV20
UV32
UV20
UV99
UV20
UV29
UV44 UV44
UV162
UV70
UV16
UV20
UV45
UV281
UV36
UV20
UV29
UV162
UV32
UV99
UV113
UV191
UV36
UV20
UV36
UV70
UV32
UV16
UV70
UV89
UV20
UV191
UV32
UV44
UV149
UV44
UV20
UV162
UV20
UV70
UV70
UV45
UV32
UV99
UV36
UV162
UV162
UV29
UV44
UV36
UV70
UV172
UV32
UV99
UV36
UV32
UV36
UV36
§̈¦505
§̈¦5
§̈¦5
§̈¦5
§̈¦5
BealeAFB
Chico
Clearlake
Colusa
Corning
Cottonwood
Gridley
Kelseyville
Lincoln
Live Oak
Lucerne
Orland
Oroville
Paradise
RedBluff
Redding
Sacramento
Tehama
Williams
Willows
YubaCity
-1.9
1.1-1.1
-3.27
-6.7-1.4
-9.07
-2.1-2.2 -3.4
-3.6
-0.1
0.35
-1.6
1.1
1.1
-4.9
-3.1
-5.8
-4.8
-2.3
-4.33
-1.4
-2.1
0.373.88
2.1
0.5
0.5
3.3
-0.6
-2.4
-13.86
-1.59-1.14
0.66
1.4
0.41.5
-2.5
-0.8
0.4
-8.8
-6
-8
1.9-3.1
-9.2-8.6
-2.78
1.1
0.40.95
-1.7
-2.23
-4.11
-4.35
-1.9
-2.9-1
-1.9
-11.26
-7.71
-3.32 -6.61
-5.45
-22.1
0.5
0-5.8
-5
-7.4
-9.7-16.2
-7.5
-8
-8.3
-4.6-2.47
-7.2
-6.4
-2.8
-1.5
-7.2
-0.4
5.8
-4.65
-1.3-3.1
-1.8-0.9
-2.41
-0.7
-6.5
-1.9
-2.4
-4.8
0.83
-0.08
0.712
-6.4
0.5
0.8
0.7
-0.4
-9.65
0.61
0.35
0.3
1.18
-4.85
-12.26
-0.3
-1.8
1.5
-1 2.2
-0.5
-1.41
-10.1
-1.04
0.635
-0.5
-2.4
-10.74
-4.51
1.11
0.2
0.31
-1.525
-9.662
-0.3
1.56
0.5
1.2
-0.2
-1.7
-0.4
-2.6
0.75
0.4
-2.6
0.3
-3
-16.2
-3.9
-4.9
-7.91
-7.84
-2.35
-0.8
-2.6
0.7
-5.99
0.3
-4.75
-2.19
-5.7
-1.03
-0.5
-1.7
-4.8
-8
-6.64
-4.1
-1.35
-2.5
-11.24
-3.6
-5.4
-6.1
-5
-6.3
-5
-4.72
-2.5
-5.86
-13.41
-0.5
-4.99
-4.879
-5.49
-2.1
-8.25
-3
-4.97
-3
0.3
-2.2
-0.1
1.3
-4.1
-2.2
-6.9
-9.636
-1.2
-1.36
-15.54
-5.79
-5.95
-0.5
-1.1
0.1
0-3.5
-2.3
0.9
-0.2
-0.3
11N 1E
11N 1W
11N 2E
11N 2W11N3E
11N 3W11N 4E
11N 4W11N 5E
11N 5W11N 6E11N 6W
11N 7E
11N 7W11N 8W11N9W
12N 1E12N 1W
12N 2E
12N 2W 12N 3E
12N3W
12N 4E12N 4W
12N 5E
12N 5W
12N 6E
12N 6W
12N 7E
12N 7W12N 8W12N9W
13N 1E
13N 1W 13N 2E13N 2W
13N 3E13N 3W 13N 4E13N 4W
13N 5E
13N 5W
13N 6E
13N 6W
13N 7E
13N 7W
13N 8W
13N9W
14N 1E
14N 1W14N 2E14N 2W
14N 3E14N 3W 14N 4E14N 4W
14N 5E
14N 5W
14N 6E
14N 6W
14N7E
14N 7W14N 8W
14N 9W
15N 1E
15N 1W
15N 2E
15N 2W
15N 3E
15N 3W
15N 4E
15N 4W
15N 5E
15N 5W
15N 6E
15N 6W 15N7E
15N 7W15N 8W15N9W
16N 1E
16N 1W
16N 2E
16N 2W
16N 3E
16N 3W
16N 4E
16N 4W
16N 5E
16N 5W
16N 6E
16N 6W
16N7E
16N 7W
16N 8W16N9W
17N 1E17N 1W
17N 2E17N 2W 17N 3E17N 3W
17N 4E
17N 4W
17N 5E
17N 5W
17N 6E
17N 6W 17N7E
17N 7W17N 8W17N 9W
18N 1E18N 1W
18N 2E
18N 2W
18N 3E
18N 3W
18N 4E
18N 4W
18N 5E
18N 5W
18N 6E
18N 6W 18N7E
18N 7W18N 8W
18N9W
19N 1E19N 1W
19N 2E
19N 2W
19N 3E
19N 3W 19N 4E19N 4W 19N 5E
19N 5W
19N 6E
19N 6W
19N7E
19N 7W19N 8W
19N9W
20N 1E20N 1W
20N 2E
20N 2W20N 3E
20N 3W
20N 3.5E
20N 4E20N 4W
20N 5E
20N 5W
20N 6E20N 6W20N7E
20N 7W20N 8W
20N9W
21N 1E
21N 2E
21N 2W
21N 3E
21N 3W
21N 4E
21N 4W21N 5E
21N 5W
21N 6E
21N 6W
21N7E
21N 7W21N 8W
21N 9W
22N 1E
22N 1W
22N 2E
22N 2W
22N 3E
22N 3W
22N 4E22N 4W
22N 5E
22N 5W
22N 6E
22N 6W
22N 7E
22N 7W22N 8W
22N 9W
23N 1E23N 1W
23N 2E
23N 2W
23N 3E
23N 3W23N 4E23N 4W 23N 5E
23N 5W 23N 6E23N 6W
23N 7E
23N 7W23N 8W
23N9W
23.5N 2E
24N 1E24N 1W24N 2E
24N 2W24N 3E
24N 3W24N 4E
24N 4W24N 5E
24N 5W
24N 6E24N 6W
24N 7E
24N 7W24N 8W
24N9W
25N 1E25N 1W25N 2E
25N 2W25N 3E
25N 3W25N 4E
25N 4W25N 5E
25N 5W
25N 6E
25N 6W
25N 7E
25N 7W25N 8W
25N9W
26N 1E26N 1W26N 2E
26N 2W
26N 3E
26N 3W
26N 4E
26N 4W
26N 5E
26N 5W
26N 6E
26N 6W
26N 7E
26N 7W26N 8W26N 9W
27N 1E27N 1W
27N 2E
27N 2W
27N 3E
27N 3W
27N 4E27N 4W
27N 5E
27N 5W
27N 6E
27N 6W
27N 7E
27N 7W27N 8W27N 9W
28N 1E28N 1W 28N 2E28N 2W
28N 3E
28N 3W
28N 4E
28N 4W
28N 5E
28N 5W
28N 6E
28N 6W
28N 7E
28N 7W28N 8W
28N 9W
28.5N 3W
29N 1E
29N 1W29N 2E29N 2W
29N 2.5W29N 3E
29N 3W
29N 4E
29N 4W
29N 5E
29N 5W
29N 6E
29N 6W
29N 7E
29N 7W29N 8W
30N 1E30N 1W 30N 2E30N 2W 30N 3E
30N 3W
30N 4E30N 4W 30N 5E30N 5W
30N 6E
30N 6W
30N 7E
30N 7W30N 8W
31N 1E31N 1W 31N 2E31N 2W
31N 3E
31N 3W 31N 4E31N 4W
31N 5E
31N 5W
31N 6E
31N 6W
31N 7E
31N 7W31N 8W
32N 1E32N 1W32N 2E
32N 2W 32N 3E32N 3W 32N 4E32N 4W
32N 5E32N 5W
32N 6E
32N 6W32N 7E
32N 7W32N 8W
-10
-10
0
-5
-5
0
-5
5
-5
0
-10
-5
-10
-15
0
-10
0
0
0
0
0
0
0
-5
-5
-5
-5
-5
-5
-5
-5
0
0
0
GLENN
BUTTE
COLUSA
TEHAMA
SHASTA ¢5 0 5 10
Miles
County Boundaries
Redding GW Basin
Sacramento Valley GW Basin
!( Monitoring Well
> 40 feet higher
> 35 to 40 feet higher
> 30 to 35 feet higher
> 25 to 30 feet higher
> 20 to 25 feet higher
> 15 to 20 feet higher
> 10 to 15 feet higher
> 5 to 10 feet higher
0 to 5 feet higher
> 0 to 5 feet lower
> 5 to 10 feet lower
> 10 to 15 feet lower
> 15 to 20 feet lower
> 20 to 25 feet lower
> 25 to 30 feet lower
> 30 to 35 feet lower
> 35 to 40 feet lower
> 40 feet lower
Groundwater Elevation Change
PLATE 1S-A
BY: G. Gordon
Date: April 2014
Pa
th:
Z:\
GW
_G
IS\P
roje
cts\
NR
O_
Ch
an
geM
ap
s\2
014
\Sp
rin
g_2
01
4\S
14_
Sh
allo
w\S
hallo
wS
pri
ng
201
3to
20
14.m
xd
http://www.water.ca.gov/groundwater/data_and_monitoring/northern_region/GroundwaterLevel/gw_level_monitoring.cfm
DEPARTMENT OF WATER RESOURCES
STATE OF CALIFORNIATHE RESOURCES AGENCY
NORTHERN REGION OFFICE2440 Main Street
Red Bluff, California 96080(530) 529-7300
NORTHERN SACRAMENTO VALLEYCHANGE IN GROUNDWATER ELEVATION MAP
SHALLOW AQUIFER ZONE(Well depths less than 200 ft bgs)
SPRING 2013 TO SPRING 2014
Shasta County - Redding GW Basin Maximum Increase GWE (ft)
Maximum Decrease GWE (ft)
Average Change GWE (ft)
Average Well Depth (ft)
Number of Wells Monitored
5.8
13
131
-0.9
-4.9
Tehama County - Redding GW BasinMaximum Increase GWE (ft)
Maximum Decrease GWE (ft)
Average Change GWE (ft)
Average Well Depth (ft)
Number of Wells Monitored
NA
5
129
-2.6
-4.8
Tehama County - Sacramento Valley GW Basin
Maximum Increase GWE (ft)
Maximum Decrease GWE (ft)
Average Change GWE (ft)
Average Well Depth (ft)
Number of Wells Monitored
2.1
50
120
-3.4
-16.2
Glenn County - Sacramento Valley GW Basin
Maximum Decrease GWE (ft)
Average Change GWE (ft)
Average Well Depth (ft)
Number of Wells Monitored 56
115
-4.4
-16.2
Maximum Increase GWE (ft) 3.9
Butte County - Sacramento Valley GW Basin
Maximum Increase GWE (ft)
Maximum Decrease GWE (ft)
Average Change GWE (ft)
Average Well Depth (ft)
Number of Wells Monitored
3.3
42
136
-2.4
-13.4
Colusa County - Sacramento Valley GW BasinMaximum Increase GWL(ft)
Maximum Decrease GWE (ft)
Average Change GWE (ft)
Average Well Depth (ft)
Number of Wells Monitored
1.4
24
132
-1.2
-5.8
Summary Results for Spring 2013 to Spring 2014Change in Groundwater ElevationMaximum Increase GWE (ft)
Maximum Decrease GWE (ft)
Average Change GWE (ft)
Average Well Depth (ft)
Number of Wells Monitored
5.8
190
125
-3.4
-16.2
Change in groundwater elevations are based on the actual measured levels ofthe hydrostatic level (piezometric surface) of the groundwater at individual welllocations.Contoured color ramping is interpolated from these measurements and should be considered approximate. The accuracy of the estimated contour is directly related to the timing of the measurements, spacing and the distributionof nearby monitoring wells, well construction, and aquifer characteristics.
Note 5:
NOTES
GWE - Groundwater Elevationbgs - below ground surface
Note 6:
Note 1: A positive number indicates that groundwater elevations were higher in thecurrent year than in the previous year. A negative number indicates that groundwater elevations were lower in the current year than in the previous year.
This map may not use all the color ranges shown in table above. Somewells may not be visible on map due to the close proximity to each other.
Note 3:
Note 2: Statistical analysis is based on the number of wells monitored within each county. Summary results are based on the total number of wellsmonitored, not averages of the statistical analysis of individual counties.
Groundwater level changes are based on groundwater level measurementstaken from wells constructed in the shallow aquifer zone at similar datesof different years. These wells include those that have screened intervals and well depths that are less than 200 ft.
Note 4:


