
STAR RATINGS REPORT2014
Health insurance

1
September 2014
IN THIS REPORTWe award and rate health insurance providers based on the results of detailed analysis of more than 26,000 quotes from some 707 eligible health insurance products provided by 22 health insurers and measured against 13 demographic profiles.
HEALTH INSURANCE
Looking after our personal health is not cheap – over the last three years, according to data from the Australian Bureau
of Statistics (ABS), health costs in Australia have risen by more than 15%.
This has been a particularly fraught year for the health insurance industry, thanks largely to the government’s federal budget reforms of a Medicare co-payment and the reduction in the amount of premium rebate the government provides.
Debate still rages around whether or not the suggested $7 co-payment for GP visits will be implemented in its current form, but the rebate changes have already come into force.
From April 1 this year, the federal government started applying a weighted average ratio to health insurance premium rebates – primarily to cap its expenses and improve its budgetary bottom line.
The way the weighted ratio works is that average annual health insurance industry premium change is placed against the annual inflation figures.
This provides the ratio, which is then applied against the previous year’s rebate. For example, the average premium increase in 2014 was 6.2% and inflation was 2.75%.
When inflation is then divided by the premium increase we come to a figure of 96.8%. This is applied against the rebate. If we then take the standard rebate of 30% and apply the weighted ratio to it we now have a rebate of 29.04%.
As the following table shows, the actual rebate people are now receiving has so far been reduced by as much as 0.96% and based on the figures for the 2014 adjustments CANSTAR estimates that over the next 10 years we may see rebates reduce by up to 8.33%:
How are we doing?
Projected change over next decade
YearFinancial year Rebate
2013/14 30% 20% 10%
1 2014/15 29.04% 19.36% 9.68%
2 2015/16 28.11% 18.74% 9.37%
3 2016/17 27.21% 18.14% 9.07%
4 2017/18 26.34% 17.56% 8.78%
5 2018/19 25.50% 17.00% 8.50%
6 2019/20 24.68% 16.45% 8.23%
7 2020/21 23.89% 15.93% 7.96%
8 2021/22 23.13% 15.42% 7.71%
9 2022/23 22.39% 14.92% 7.46%
10 2023/24 21.67% 14.45% 7.22%
Maintaining an average premium increase of 6.20% p.a and average inflation of 2.75% p.a

2
The recent changes to the rebate applied will have a marginal impact on the hip pocket of Australians.
On average singles, couples and families will be paying, on an annual basis, an additional $24, $48 and $51 respectively for Packaged cover (Hospital and Extras).
However these changes are only the most recent changes to the health insurance rebate structures.
In July 2012 means testing was introduced to the health insurance rebate with those on higher incomes receiving a reduced benefit and the top income
bracket no longer receiving a rebate on private health insurance at all.
When these fees are coupled with the recent changes, the effects on hip pockets are more profound.
What these changes mean in real terms is that a family with a combined income of $210,001 or more ( “Tier 2” in the scaling, whose rebate was formerly 10%) is set to lose out on the equivalent of 48 cinema tickets* or 180 cups of coffee** in a year!
* At a cost of $15 per cinema ticket ** At a cost of $4 per cup of coffee.!
We’re looking wellMore than half of Australians over the age of 15 have health insurance cover of some kind – with the Private Health Insurance Administration Council (PHIAC) advising that 47.2% have Hospital and 55.2% have Extras cover (a percentage that has remained steady over the last five years).
So what are we getting from our health funds to justify the uptake? Aside from the usual benefits, many providers are now delivering a wealth of alternative offerings, particularly incentives to improve our health.
Our “wellness”, it seems, matters to our health funds. From apps to online calculators, from incentives for diet improvement to interactive (sometimes reward-based) fitness plans, insurance providers are turning to 21st century techniques to try and keep Aussies healthy.
Here are some examples of some of the special health benefits on offer from providers on the CANSTAR database:
Insurer Special health benefits offered
Australian Unity Health Limited
Free Baby+me program (for higher levels of hospital cover), Bone Health program, Diabetes Action Program (Type 2), Healthy Heart program, Vascular Health program, Heart Failure program, Living with COPD (chronic obstructive pulmonary disease) program, Risk Factor Management program (at risk of Type 2 Diabetes), Integrated Care program (for older members).
Bupa Free Genesis Heart Care, The COACH program, Parent and Baby Wellbeing program, integrated osteoarthritis program, Bupa Health Dialog.
GMF Health Discounted eyewear at a range of different providers.
GMHBA Health Insurance
Connect Rewards Plus program, with rewards of up to $180 for someone that has held Gold with Gap Saver cover for 10 years or more.
HBF Health Limited Free outdoor fitness sessions, discounted gym membership, member discounts at events such as “Run for a Reason”.
HCF (The Hospitals Contribution Fund of Australia Limited)
Free Type 2 Diabetes program, Cardiovascular program and Osteoarthritis program.
Medibank Extra Flybuys points for buying fruit and veg at Coles, link Flybuys to FitBit and get 10 points per 10,000 steps, daily.
Westfund Health Online “IN2Health” Program, free vision screening for children, discounted eyewear at a range of different providers.

3
It’s the women versus the boys!It’s always interesting to analyse facts in the never-ending battle of the sexes, and trends in health insurance are no exception! So, how do men and women compare in the sphere of health insurance claims?
PHIAC database figures show that of the total claims made by under-60s over the three months to March 2014, women made more than 60%.
This might make men feel they can shout from the rooftops that women are a bunch of a wimps, but bear in mind that these figures are undoubtedly slanted by such factors as pre- and post-natal requirements – pregnancy
and childbirth can consume a lot of health resources that men will never have to claim.
And if we move to the over-60s segment (60-95+), the numbers change. Whilst claims in this age group are divided fairly evenly between the sexes, it’s the men who are making slightly more, which, considering women tend to live longer, would seem to suggest the female of the species is more hardy than the male!
Another interesting point of note from the figures is the fact that while only 22% of the men insured are over the age of 60, this age group actually accounts for 60% of the claims made among males.
Premiums are a hugely significant element of health insurance policy purchasing decisions, so it’s always good to know where the industry is currently sitting.
Average premium costs have generally risen across the country between 2013 and 2014, but it’s interesting to note that some states are generally paying more than others.
In dollar terms, these are the average annual premium prices for this year (taken from the CANSTAR database):
So, what’s the cost?
Package (Hospital + Extras) NT NSW Qld SA Tas Vic WA
Couples and families – with obstetrics $3,453 $3,986 $4,167 $4,211 $4,273 $4,275 $3,820
Established couples $2,856 $3,628 $3,725 $3,709 $3,678 $3,870 $3,722
Established families $2,949 $3,658 $3,751 $3,744 $3,761 $3,916 $3,784
Established single parent $2,723 $3,285 $3,359 $3,283 $3,425 $3,506 $3,492
Established singles – female $1,469 $1,814 $1,874 $1,883 $1,864 $1,941 $1,892
Established singles – male $1,471 $1,815 $1,874 $1,865 $1,864 $1,941 $1,886
Mature couples $3,518 $4,093 $4,230 $4,259 $4,332 $4,356 $4,190
Mature singles $1,743 $2,050 $2,133 $2,148 $2,178 $2,174 $2,100
Tax $1,255 $1,656 $1,736 $1,663 $1,710 $1,739 $1,704
Young couples – no obstetrics $2,484 $3,356 $3,505 $3,353 $3,410 $3,570 $3,333
Young family – no obstetrics $2,777 $3,460 $3,585 $3,576 $3,649 $3,737 $3,571
Young single parents – no obstetrics $2,531 $3,108 $3,210 $2,976 $3,292 $3,353 $3,300
Young singles – female $1,258 $1,669 $1,748 $1,679 $1,707 $1,768 $1,680
Young singles – male $1,257 $1,668 $1,748 $1,679 $1,706 $1,770 $1,676
The figures show that Victorians are often paying out the highest premiums, on average, for their Package health insurance, with average costs for young single parents (no obstetrics) in South Australia $377 lower than the average costs for the same category in Victoria.
Couples and families (with obstetrics) in NSW also fare better than Victorians, with the averages there being $289 less. It’s interesting to note, however, that average premiums for single males are similar nation-wide.
Source: CANSTAR

4
‘Tax’ – our new profileTo calculate the CANSTAR Health Insurance Star Ratings, our research analysts use a complex system comparing three different insurance product types (Hospital cover, Extras cover and Package cover) across a range of profiles – essentially definitions of people at various stages of their lives – in order to help consumers find the health insurance policy that matches their life stage and needs.
The profiles we include in the ratings are:
Young singles (male and
female)
Young single
parentsEstablished
families
Established single
parents
Established singles
(male and female)
Established couples
Mature singles
Mature couples
(New for this year)
Tax
Young couples
(no obstetrics)
Couples/ families
(with obstetrics)
Young families
(no obstetrics)
The latter has been introduced to include those people who simply want a private health insurance policy in order to avoid the tax implications associated with the Medicare Levy Surcharge (MLS) and the lifetime loading.
A person within the Tax profile is not overly concerned with such issues as features and benefits, although a low-cost plan is still something they will look for.
For further details on the individual profiles, see the methodology document with this report, page 1.

5
How to get great value
• Know what you can afford. Health insurance is important, but you do need to restrict yourself to cover that you can actually afford. Do some calculations before you start looking for a health fund and be realistic. When you’ve come to a figure that you can manage, make sure you stick to it when comparing premiums.
• Learn your family medical history. If you’re susceptible to a particular condition, you need to know about it so you can make sure you’re covered for it in the future. You also need to take stock of your health right now, as well as potential issues in the future, i.e. if you are still active on the sporting field, coverage for physio or even knee reconstructions may be high on the priorities list, or if a baby might be on the horizon, you might need to look for obstetrics (pregnancy) cover.
• Work out whether or not general treatment (Extras) cover is something you’re likely to need, or whether you just want Hospital cover. With such elements as physiotherapy, dental and optical services offered, many people benefit from having at least some extras.
• Work out an appropriate excess on your cover. Excess is what you have to pay each time you are admitted into hospital. While increasing your excess can make your premiums a lot lower, it does mean that you could be left with a hefty, surprise sum to pay at a seriously bad time. Make sure your excess is an amount you’d always be able to find if necessary.
• Keep the coverage focused on your needs. More inclusions translates to higher premiums, so make sure you’re not paying for things you’re not going to need… like obstetrics if there’s no chance of you reproducing any time soon, or hip replacement surgery if you’re a young, active slip of a thing.
• Keep on top of things. Once you’ve honed in on the right policy for you, make sure you keep updating it regularly. Life changes at an alarming rate, so you need to be on top of exactly what sort of health benefits you need, and whether they’re in your current policy or not.
If you’re looking to get the best value from your health insurance cover – and you should be! – here are some things to bear in mind during the decision-making process…
In order to give customers a clear idea of exactly which providers are offering great value health insurance for customers, CANSTAR conducts the yearly star ratings analysis.
But as another great way for us to highlight just which providers are excelling in particular areas, we have awards not only for overall
winners nationally, but also state by state in each of the categories of health insurance offered – Hospital, Extras and Package.
For the 2014 CANSTAR Health Insurance Awards, three providers that have featured prominently in the awards since they began have once more scooped a national award for overall outstanding value. They are:
And the winners are…
Scooping state awards for Extras in Queensland and New South Wales, as well as Package awards in Victoria, Tasmania, and the Northern Territory helped shoot Bupa to the top of the ratings.
Other examples of great performance include Bupa’s Bronze Extras consistently providing lower premiums and Platinum Extras achieving high scores for features.
Across the three categories, Bupa scored a high number of five-star ratings across all of the profiles:
• Hospital – 84
• Extras – 85
• Package – 273
BupaHealth Insurance
Australia
6
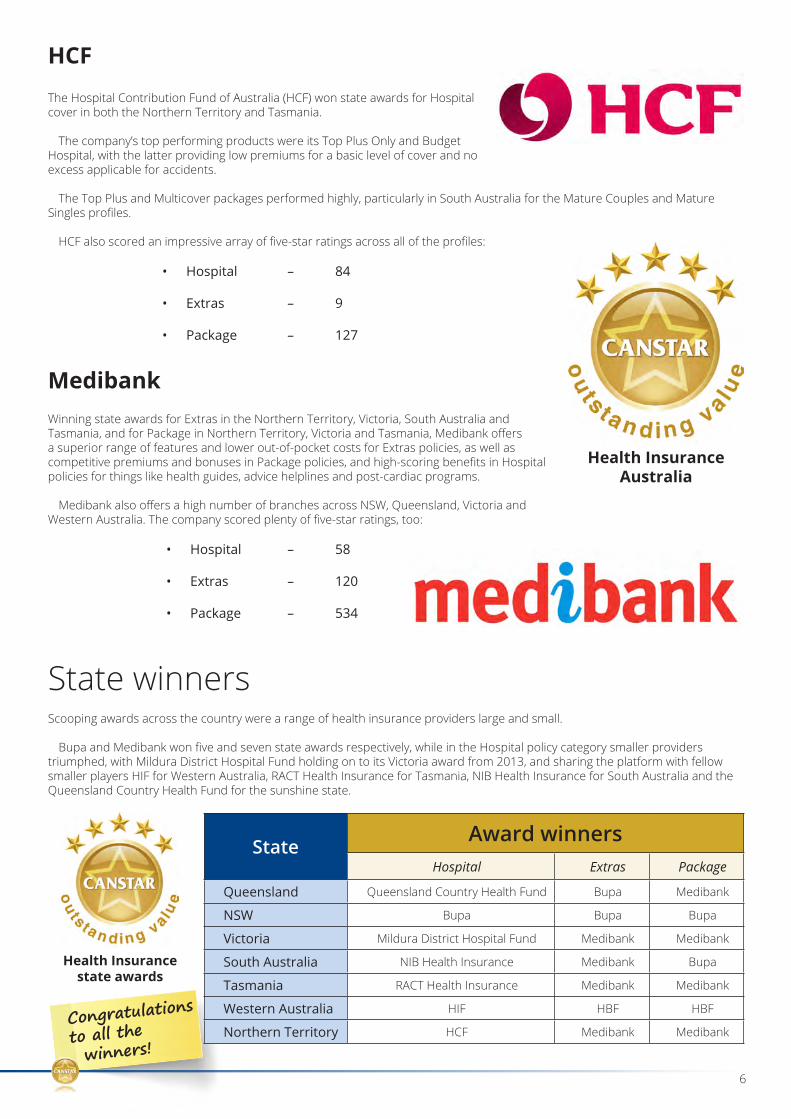
The Hospital Contribution Fund of Australia (HCF) won state awards for Hospital cover in both the Northern Territory and Tasmania.
The company’s top performing products were its Top Plus Only and Budget Hospital, with the latter providing low premiums for a basic level of cover and no excess applicable for accidents.
The Top Plus and Multicover packages performed highly, particularly in South Australia for the Mature Couples and Mature Singles profiles.
HCF also scored an impressive array of five-star ratings across all of the profiles:
• Hospital – 84
• Extras – 9
• Package – 127
HCF
Winning state awards for Extras in the Northern Territory, Victoria, South Australia and Tasmania, and for Package in Northern Territory, Victoria and Tasmania, Medibank offers a superior range of features and lower out-of-pocket costs for Extras policies, as well as competitive premiums and bonuses in Package policies, and high-scoring benefits in Hospital policies for things like health guides, advice helplines and post-cardiac programs.
Medibank also offers a high number of branches across NSW, Queensland, Victoria and Western Australia. The company scored plenty of five-star ratings, too:
• Hospital – 58
• Extras – 120
• Package – 534
Medibank
Scooping awards across the country were a range of health insurance providers large and small.
Bupa and Medibank won five and seven state awards respectively, while in the Hospital policy category smaller providers triumphed, with Mildura District Hospital Fund holding on to its Victoria award from 2013, and sharing the platform with fellow smaller players HIF for Western Australia, RACT Health Insurance for Tasmania, NIB Health Insurance for South Australia and the Queensland Country Health Fund for the sunshine state.
State winners
State Award winnersHospital Extras Package
Queensland Queensland Country Health Fund Bupa Medibank
NSW Bupa Bupa Bupa
Victoria Mildura District Hospital Fund Medibank Medibank
South Australia NIB Health Insurance Medibank Bupa
Tasmania RACT Health Insurance Medibank Medibank
Western Australia HIF HBF HBF
Northern Territory HCF Medibank Medibank
Health Insurance state awards
Health Insurance Australia
Congratulations
to all the
winners!

What are the CANSTAR Private Health Insurance Star Ratings? CANSTAR Private Health Insurance Star Ratings combine three separate health insurance product types (Hospital cover, Extras cover, and Packaged hospital and extras cover). The rating process for each of these product types employs a separate star ratings methodology consistent with the pricing and features model of the CANSTAR star ratings:
TOTAL STAR RATINGS SCORE (T) = W1 x PRICING SCORE (P) + W2 x FEATURES SCORE (F)
Below is a brief overview of the profiles to be rated so that consumers can use the star ratings results to find the most suitable products. The specific areas of need for both the young and mature profiles for both hospital and extras cover are listed under the inclusions heading of the star ratings methodology section of this document. All profiles are assumed to represent the average person from that demographic rather than either ends of the risk aversion spectrum.
YOUNG SINGLES MALE/FEMALE This profile caters to young to middle-aged singles (both male and female), no dependents and no immediate plans for children. While the average young singles do not consider themselves to be invincible, they are mostly concerned about having a safety net for hospital cover if they ever need it. Dental, optical, chiropractic and physiotherapy cover are also important areas of extras cover.
YOUNG COUPLES – NON OBSTETRICS This profile covers young to middle-aged couples who don’t plan to have children or at least are postponing a family. They are looking for all-round cover from their health fund but don’t need to pay for obstetrics and IVF. A good hospital plan with extras like physiotherapy, dental, optical and chiropractic should provide all-round cover for this couple.
COUPLES/FAMILIES – WITH OBSTETRICS This profile covers young to middle-aged couples with a young child or children, as well as couples planning a family. This profile can be seen as growing families but like young singles, they are not yet concerned about cover for hip replacements and multi-focal lenses but are interested in cover for obstetrics and IVF, dental, optical, physiotherapy and chiropractic. Couples planning for children in the short-term should be taking out appropriate family cover now.
YOUNG FAMILIES – NON OBSTETRICS This profile covers young to middle-aged couples with a young child or children, and who will not be extending the family. They are confident that they will not be needing obstetrics or IVF cover. These young families still have a distinct need for a range of hospital and extras cover for both the parents and the growing children.
METHODOLOGY
HEALTH INSURANCE STAR RATINGS
1

.
ESTABLISHED FAMILIES This profile covers mostly middle-aged to mature couples with an older but still dependent child or children. These families have stopped growing so no longer need cover for obstetrics and IVF. The parents are starting to think about cover they might need for growing kids such as orthodontics but are also thinking about other areas of cover they might have ignored when they were younger such as cardio-thoracic surgery. Dental, physiotherapy, optical and chiropractic cover are also important areas of extras cover.
ESTABLISHED SINGLES MALE/FEMALE This profile covers mostly middle-aged to mature singles (both male and female) with no dependents and no immediate plans for children. This profile has started to think about other areas of cover they might have ignored when they were younger such as cardio-thoracic surgery. Dental, optical, physiotherapy and chiropractic cover are also important areas of extras cover.
YOUNG SINGLE PARENTS This profile covers mostly young to middle-aged singles with a young child or children. The young parent is starting to think about cover they might need for their growing kids such as orthodontics but they are also thinking about other areas of cover they might have ignored when they were younger such as cardio-thoracic surgery. Dental, optical, physiotherapy and chiropractic cover are also important areas of extras cover.
ESTABLISHED SINGLE PARENTS This profile covers mostly middle-aged to mature singles with an older but still dependent child or children. These families have stopped growing so no longer need cover for obstetrics and IVF. The parent is starting to think about cover they might need for their growing kids such as orthodontics but they are also thinking about other areas of cover they might have ignored when they were younger such as cardio-thoracic surgery. Dental, optical, physiotherapy and chiropractic cover are also important areas of extras cover.
ESTABLISHED COUPLES This profile covers mostly middle-aged to mature couples who don’t plan to have children or at least are postponing a family. The couple have started to think about cover they might have ignored when they were younger such as cardio-thoracic surgery. Dental, optical, physiotherapy and chiropractic cover are also important areas of extras cover.
MATURE COUPLES This profile caters to mature couples that no longer have or never had dependent children. This profile is more concerned with areas of cover such as cardio-thoracic surgery, hip replacements or multi-focal lenses. Due to the natural processes of aging their health insurance requirements differ from that of young singles. Dental, optical, chiropractic and physiotherapy are also important areas of extras cover.
MATURE SINGLES This profile caters to mature singles (both male and female) that no longer have or never had dependent children. We did not wish to draw a finite line as far as the age where maturity begins but this profile is now more concerned with areas of cover such as cardio-thoracic surgery, hip replacements or multi-focal lenses. Due to the natural processes of aging, their health insurance requirements differ from that of young singles. Dental, optical, chiropractic and physiotherapy are also important areas of extras cover.
TAX PROFILE This profile caters to singles looking for health insurance primarily to avoid tax implications associated with the Medicare Levy Surcharge (MLS) and the lifetime loading. These individuals are not as concerned with the benefits of health insurance compared to those in the other profiles, however would prefer a low-cost hospital plan.
2

State/territory awards
Each fund’s top performing policy per state/territory across all star ratings profiles are then aggregated to come up with the state/territory awards for all three product categories: Hospital, Extras and Packages.
The state/territory awards are awarded in the following states/territories: Queensland, New South Wales/ACT, Victoria, Tasmania, South Australia, Western Australia and Northern Territory.
Each profile is given a weighting towards the state awards.
Young singles male/female – 3.75% each
Young couples – non-obstetrics – 7.5%
Couples/families – with obstetrics – 12.5%
Young families – non obstetrics – 7.5%
Established families – 10%
Established single parents – 5%
Mature singles – 12.5%
Mature couples – 12.5%
Established couples – 10%
Established singles male/female – 5% each
Young single parents – 5%
Hospital Cover Extras Cover
Package Cover
For example:
3
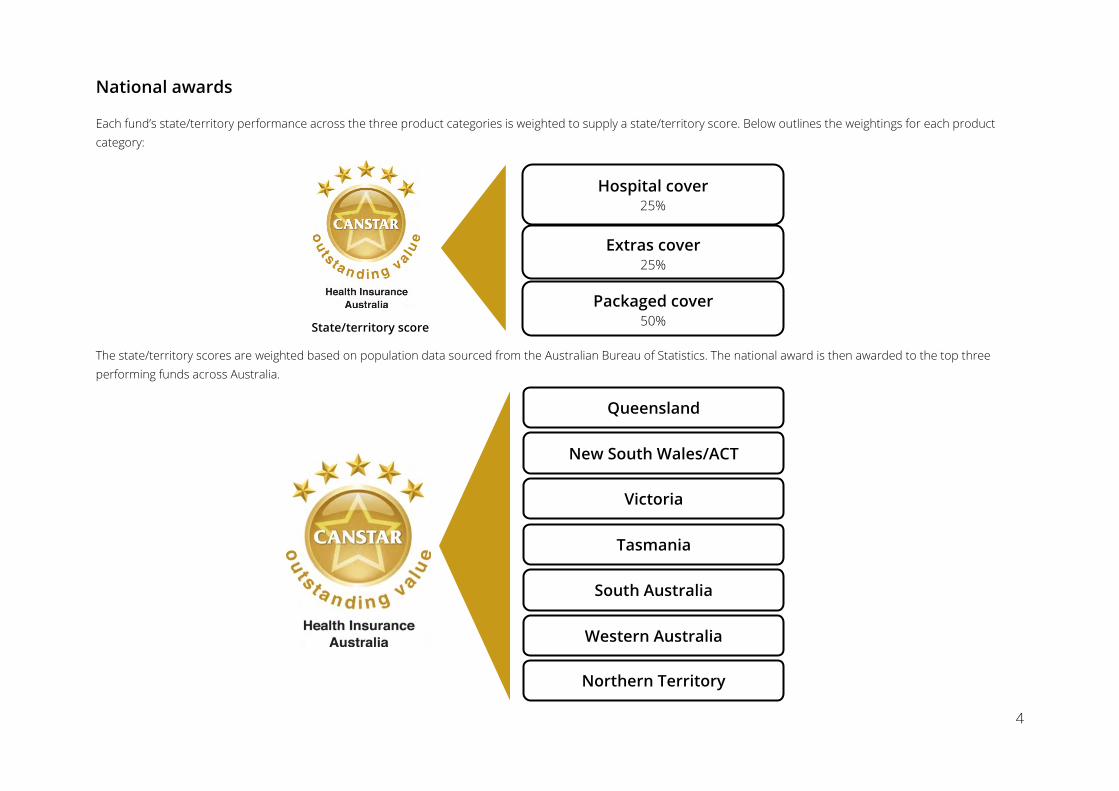
National awards
Each fund’s state/territory performance across the three product categories is weighted to supply a state/territory score. Below outlines the weightings for each product category:
The state/territory scores are weighted based on population data sourced from the Australian Bureau of Statistics. The national award is then awarded to the top three performing funds across Australia.
Queensland
New South Wales/ACT
Victoria
Tasmania
South Australia
Western Australia
Northern Territory
Packaged cover 50%
Extras cover 25%
Hospital cover 25%
State/territory score
4

Hospital cover star ratings Hospital cover products will be rated across seven states/territories and 14 profiles so that consumers from any demographic will be able to identify a shortlist of five-star products that are best suited to their individual needs. Eligibility for each of the 98 state/territory-profile combinations will depend on product availability for the state/territory and whether the insurance cover is for singles, single parents or couples and families. Products nominated for families are also eligible to be compared in the single parent profile in accordance with sales practices of the private health insurance industry.
The methodology can be summarised as follows:
Each profile combination is subject to different weightings depending on preference to price or features. Based on our profile descriptions, the weightings for each of the profiles are as follows:
90% 50% 50% 50% 50% 50% 50%
70% 60%
65% 65%
70%
10% 50% 50% 50% 50% 50% 50%
30% 40%
35% 35%
30%
0% 20% 40% 60% 80% 100%
Tax
Established Couples
Established Families
Established Single Parent
Established Singles
Mature Couples
Mature Singles
Young Couples - Non Obstetrics
Couples/Families - With Obstetrics
Young Families - Non Obstetrics
Young Single Parent
Young Singles
Price Feature
Pricing score
Feature score
Excess & co-payments
Premium
Policy information 80%
Fund information 20%
5

Eligibility requirements For a Hospital policy to be considered in CANSTAR’s ratings it needs to meet the following criteria:
• Not be restricted to certain groups or a corporate policy • Not be a public hospital or public shared policy • Exempt the policy holder of Medicare Levy Surcharge • Available for new policy holders • Be approved by PHIO.
There are seven profiles that have a minimum level of comprehensive cover for a policy to be considered:
Profiles Cardiac Joint replacement
(hip and knee) Obstetric
Established
Mature
Couples/families – with obstetrics
6

Price score The weights applied to the premium and excess and co-payments components are profile specific. The weights for each profile can be summarised below:
Premium The base premium for Hospital cover insurance products will be used as the main point of cost comparison. Peer products will be compared and the product with the lowest cost will be awarded the highest base premium score. All other peer products will be awarded a relative score based on their cost in comparison to the lowest cost policy (e.g. if a product costs twice as much as the cheapest, it will earn half the base premium score of the cheapest product).
7
90% 75%
70% 70%
75% 65% 65%
75% 65%
70% 70%
75%
10% 25%
30% 30%
25% 35% 35%
25% 35%
30% 30%
25%
0% 20% 40% 60% 80% 100%
TaxEstablished CouplesEstablished Families
Established Single ParentEstablished Singles
Mature CouplesMature Singles
Young Couples - Non ObstetricsCouples/Families - With Obstetrics
Young Families - Non ObstetricsYoung Single Parent
Young SinglesPremium Excess & Co-payments

Excess and co-payments This is a scenario based on assessments to assess the amount of excess or co-payment required for each hospitalisation. There are seven scenarios used in the assessment:
Scenario No. of admissions/year Length of stay/admission Weight
1 1 0 nights 25%
2 3 0 nights 20%
3 1 2 nights 15%
4 3 2 nights 10%
5 1 4 nights 15%
6 3 7 nights 10%
7 1 14 nights 5%
8

Feature score The feature score is made up of two assessments based on product-specific features and fund-specific features. These are weighted respectively at 80% and 20%.
Fund information Fund information is made up of the following sections provided by the private health fund. More information on each of the sections is discussed in the following pages. Below summarises the weights of each of the sections:
Feature score
Policy information 80%
Fund information 20%
Fund information 20%
General information 20%
Agreement network 50%
Other service benefits 10%
Accessibility 20%
9

General information This section includes general information relating to the health fund. This includes but is not limited to online application, direct debit payments, payment frequencies and maximum age of dependants. Agreement network The breakdown of agreement network and its relative weightings are outlined as follows:
Agreement private hospitals The number of agreement hospitals available in a state represents the level of choice a patient has in healthcare providers that will not charge a gap fee. For each state-profile combination, the number of no-gap hospitals for the relevant state will be compared against the number for other health funds to determine the no-gap hospital contribution to the star ratings score. The health fund that has the most total no-gap hospitals in that state will earn the maximum score towards all its eligible hospital cover products while all other health funds will be awarded a score based on their number of no-gap hospitals relative to the institution with the most no-gap arrangements. Agreement day hospitals The number of agreement day hospitals available in a state represents the level of choice a patient has in healthcare providers that will not charge a gap fee. For each state-profile combination, the number of no-gap day-hospitals for the relevant state will be compared against the number for other health funds to determine the no-gap day-hospital contribution to the star ratings score. The health fund that has the most no-gap day-hospitals in that state will earn the maximum score towards all its eligible hospital cover products while all other health funds will be awarded a score based on their number of no-gap day-hospitals relative to the institution with the most no-gap arrangements.
Agreement network 50% Day hospitals
40%
Private hospitals 60%
10

Other service benefits This section looks at a number of additional services provided by the provider at a fund level. These additional services include:
• Health/nurses hotline – availability and hours of operation • Home doctor services/after-hours doctor service – availability and hours of operation • Wellness and health guides (electronic or hard copy) • Pre/post-hospital services (e.g. obstetrics and cardiac)
Accessibility Accessibility is measured across the following:
• Branch access: The number of branches per state/territory • Online access: Functionality through the health fund’s online member services • Mobile access: Functionality through the health fund’s mobile application • Phone access: Functionality through the health fund’s phone service
Each access area is weighted as follows:
Accessibility 15%
Branch access 40%
Internet access 40%
Mobile access 10%
Phone access 10%
11

Policy information Hospital cover policies vary in the types of procedures that are insured. The table below lists some of the more common hospital inclusions and their relative importance to the various profiles.
Category Tax
Couple/ family with
obstetrics
Young single, male
Young single, female
Young couple,
non-obstetric
Young family, non-
obstetric
Young single parent
Established family
Established single parent
Established single, male
Established single, female
Established couple
Mature single
Mature couple
Assisted reproductive - 10% - 3% - - - - - - 2% 2% - -
Cardiac 15% 10% 10% 10% 12% 12% 12% 12% 15% 15% 15% 15% 25% 25%
Cataract eye lens 8% 1% 1% 1% 1% 1% 1% 1% 5% 8% 8% 8% 10% 10%
Orthopaedic 18% 15% 28% 20% 25% 25% 25% 25% 20% 18% 15% 15% 18% 18%
Joint replacement
40% 12% 12% 12% 12% 12% 12% 12% 25% 40% 40% 40% 83% 83%
Reconstructions 60% 88% 88% 88% 88% 88% 88% 88% 75% 60% 60% 60% 17% 17%
Obstetric - 25% - 10% - - - - - - 3% 3% - -
Palliative 2% 1% 1% 1% 1% 1% 1% 1% 2% 2% 2% 2% 2% 2%
Plastic non-cosmetic 5% 5% 5% 5% 7% 5% 5% 5% 5% 5% 5% 5% 2% 2%
Psychiatric 11% 14% 16% 16% 14% 12% 12% 15% 10% 11% 12% 10% 13% 13%
Rehabilitation 8% 7% 10% 6% 12% 15% 15% 12% 8% 8% 5% 8% 10% 10%
Renal dialysis 5% 1% 1% 1% 1% 2% 2% 2% 5% 5% 5% 5% 7% 7%
Sterilisation 2% - 1% 1% 1% 1% 1% 1% 2% 2% 2% 2% 1% 1%
Ear, nose and throat 10% 5% 10% 10% 10% 12% 12% 12% 12% 10% 10% 10% 1% 1%
Colonoscopy 10% 1% 5% 4% 4% 9% 9% 10% 10% 10% 10% 10% 9% 9%
Gastric banding 2% 2% 2% 2% 2% 2% 2% 2% 2% 2% 2% 2% 1% 1%
Wisdom teeth 2% 2% 5% 5% 5% 2% 2% 2% 3% 2% 2% 2% - -
Emergency accidental 2% 1% 5% 5% 5% 1% 1% 2% 1% 2% 2% 1% 1% 1%
Total 100% 100% 100% 100% 100% 100% 100% 100% 100% 100% 100% 100% 100% 100%
12
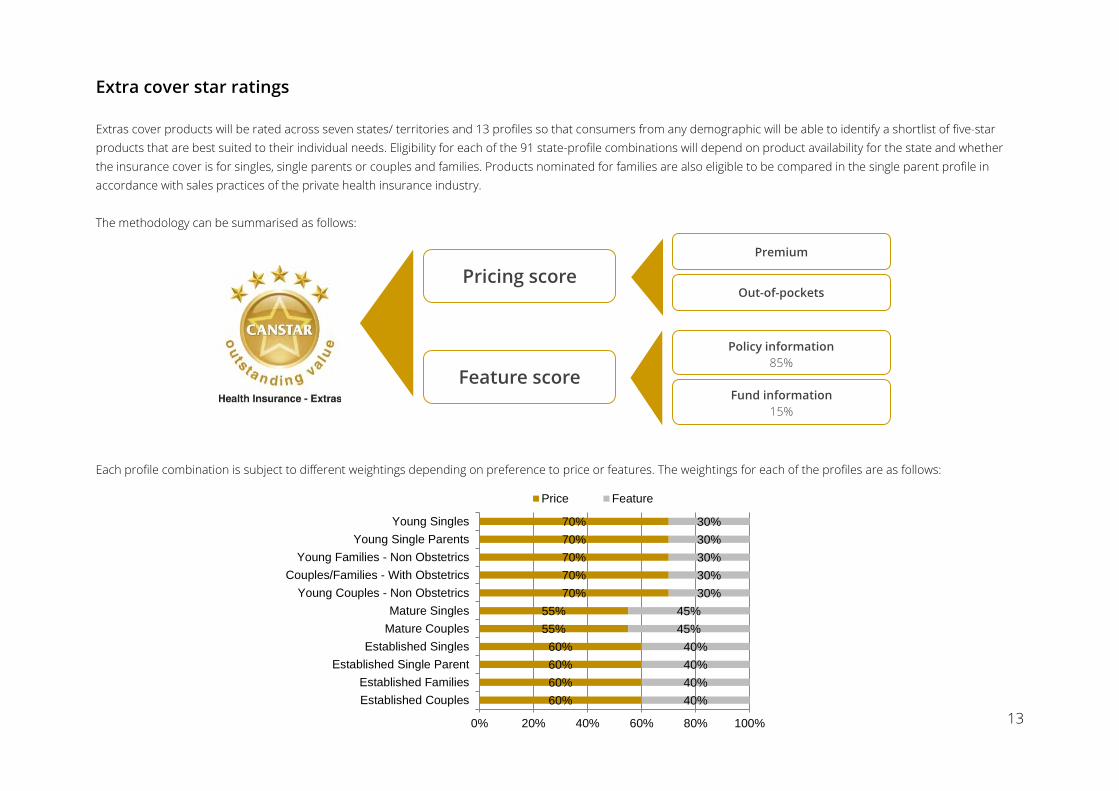
Extra cover star ratings Extras cover products will be rated across seven states/ territories and 13 profiles so that consumers from any demographic will be able to identify a shortlist of five-star products that are best suited to their individual needs. Eligibility for each of the 91 state-profile combinations will depend on product availability for the state and whether the insurance cover is for singles, single parents or couples and families. Products nominated for families are also eligible to be compared in the single parent profile in accordance with sales practices of the private health insurance industry. The methodology can be summarised as follows: Each profile combination is subject to different weightings depending on preference to price or features. The weightings for each of the profiles are as follows:
Pricing score
Feature score
Out-of-pockets
Premium
Policy information 85%
Fund information 15%
13
60% 60% 60% 60%
55% 55%
70% 70% 70% 70% 70%
40% 40% 40% 40%
45% 45%
30% 30% 30% 30% 30%
0% 20% 40% 60% 80% 100%
Established CouplesEstablished Families
Established Single ParentEstablished Singles
Mature CouplesMature Singles
Young Couples - Non ObstetricsCouples/Families - With Obstetrics
Young Families - Non ObstetricsYoung Single Parents
Young Singles
Price Feature

Eligibility requirements For an Extras policy to be considered in CANSTAR ratings it needs to meet the following criteria:
• Not be restricted to certain groups or a corporate policy • Available for new policy holders • Be approved by PHIO.
There are no individual profile eligibility requirements.
Pricing score The weights applied to the premium and out-of-pocket components are profile specific. The weights for each profile can be summarised below:
Premium The base premium for extras cover insurance products will be used as the main point of cost comparison. Peer products will be compared and the product with the lowest cost will be awarded the highest base premium score. All other peer products will be awarded a relative score based on how much more expensive they are (i.e. if a product costs twice as much as the cheapest, it will earn half the base premium score of the cheapest product). Out-of-pockets The out-of-pockets component of the pricing score is a scenario-based calculation. The calculation uses 100 hypothetical new policy holders who have met all the waiting period requirements and their use of dental, optical, physiotherapy and chiropractic over a 12-month period.
50% 50% 50% 50% 50% 50% 50% 50% 50% 50% 50%
50% 50% 50% 50% 50% 50% 50% 50% 50% 50% 50%
0% 20% 40% 60% 80% 100%
Established CouplesEstablished Families
Established Single ParentEstablished Singles
Mature CouplesMature Singles
Young Couples - Non ObstetricsCouples/Families - With Obstetrics
Young Families - Non ObstetricsYoung Single Parents
Young SinglesPremium Out of Pockets
14

The policy holder usage is based on PHIAC data with the min/max usage based on the star ratings profiles. The cost for the services used is based on the national average cost. Where a health fund has network providers, we have used its standard schedule costs for the proportion of policy holders who use a network provider. Where a health fund does not have network providers, the standard costing will be used in the calculations. All limits are incorporated into the calculations including item limits, sub limits, category limits and group limits. The total out-of-pockets is indexed for each of the 100 policy holders per policy. The policy with the lowest out-of-pocket scores will receive the full score. The 100 indexed scores are then averaged to provide a policy out-of-pocket score. The policy with the greatest average out-of-pocket score will receive a full score and all other policies’ scores will be indexed. Feature score The feature score is made up of two assessments based on product-specific features and fund-specific features. These are weighted respectively at 85% and 15%.
Fund information Fund information is made up of the following sections provided by the private health fund. More information on each of the sections is available in the following pages. Below summarises the weights of each of the sections:
Fund information 15%
General information 25%
Agreement network 50%
Accessibility 25%
Feature score
Policy information 85%
Fund information 15%
15

General information
This section includes general information relating to the health fund. This includes but is not limited to online application, direct debit payments, payment frequencies and maximum age of dependants. Agreement network
The Agreement network looks at the number of providers that a health fund has an agreement with. The fund with the greatest amount of agreement providers in a particular speciality will receive a full score and the remainder of funds will be indexed off the greatest amount.
Optical 25%
Physiotherapy 15%
Agreement network 50%
Dental 50%
Chiropractic 10%
16

Accessibility
Accessibility is measured across the following: • Branch access: The number of branches per state/territory • Claim access: The points where a policy holder is able to claim outside of branches including phone, post, online and HICAPS • Internet access: Online functionality including claiming • Mobile access: Functionality through mobile including claiming • Phone access: Functionality through the health fund’s phone service
Each access area is weighted as follows:
Accessibility 25%
Claims access 40%
Branch access 30%
Internet access 10%
Mobile access 10%
Phone access 10%
17

Policy Information
Extras cover policies vary in the types of services that are insured. The table below lists some of the more common extras inclusions and their relative importance to the various profiles.
Category Tax
Couple/ family –
with obstetrics
Young single, male
Young single, female
Young couple –
non obstetrics
Young family –
non obstetrics
Young single
parents
Established family
Established single parent
Established single, male
Established single, female
Established couple
Mature single
Mature couple
General dental 31 32 30 30 31 33 33 31 31 31 31 32 27 27
Major dental 7 7 8 8 8 7 7 8 8 7 7 7 6 6
Orthodontic 1 1 1 1 1 1 1 3 3 1 1 1 0 0
Endodontic 3 3 2 2 2 3 3 3 3 3 3 3 3 3
Optical 15 16 16 16 16 16 16 16 16 15 15 15 18 18
Chiropractic 9 9 8 8 9 8 8 9 9 9 9 9 10 10
Physiotherapy 14 15 16 16 16 15 15 14 14 14 14 14 13 13
Acupuncture 2 2 2 2 2 2 2 1 1 2 2 2 1 1
Podiatry 3 1 2 2 1 1 1 2 2 3 3 3 5 5
Psychology 4 3 5 5 4 3 3 3 3 4 4 3 4 4
Glucose monitor
1 1 1 1 1 1 1 1 1 1 1 1 2 2
Hearing aids 0 0 0 0 0 0 0 0 0 0 0 0 1 1
Ambulance 1 1 1 1 1 1 1 1 1 1 1 1 2 2
NonPBS 2 0 0 0 0 0 0 2 2 2 2 2 2 2
Massage 2 5 5 5 5 5 5 1 1 2 2 2 1 1
Naturopathy 1 1 1 1 1 1 1 1 1 1 1 1 1 1
Speech therapy 1 1 0 0 0 1 1 1 1 1 1 1 1 1
Occup. therapy 1 0 0 0 0 0 0 1 1 1 1 1 1 1
Wellness 2 2 2 2 2 2 2 2 2 2 2 2 2 2
Total 100 100 100 100 100 100 100 100 100 100 100 100 100 100
18

Package cover star ratings Packaged hospital and extras cover products are rated across seven states/territories and 13 profiles so that consumers from any demographic will be able to identify a shortlist of five-star products that are best suited for their individual needs. Eligibility for each of the 91 state-profile combinations depends on product availability for the state and whether the insurance cover is for singles, single parents or couples and families. Products nominated for families are also eligible to be compared in the single parent profile in accordance with sales practices of the private health insurance industry. The methodology can be summarised as follows:
Premium
Excess & co-payments (Hospital)
Out-of-pockets (Extras)
Hospital inclusions
Extras inclusions
Fund information
Pricing score
Feature score

Each profile combination is subject to different weightings depending on preference to price or features. The weightings for each of the profiles are as follows:
Pricing score The weights applied to the premium and out-of-pocket components are profile specific. See below for weights:
20
70% 65%
60% 60%
65% 50% 55%
65% 60% 60%
65% 60%
10% 10%
15% 15%
10% 20% 20%
10% 20%
10% 10%
15%
20% 25% 25% 25% 25% 25% 25% 25%
20% 25%
25% 20%
0% 20% 40% 60% 80% 100%
TaxEstablished CouplesEstablished Families
Established Single ParentEstablished Singles
Mature CouplesMature Singles
Young Couples - Non ObstetricsCouples/Families - With Obstetrics
Young Families - Non ObstetricsYoung Single Parents
Young Singles
Premium Hospital Excess/Co-payment Extras Out of Pocket
85% 60% 60% 60% 60%
50% 50%
70% 65% 65% 65%
70%
15% 40% 40% 40% 40%
50% 50%
30% 35% 35% 35%
30%
0% 20% 40% 60% 80% 100%
TaxEstablished CouplesEstablished Families
Established Single ParentEstablished Singles
Mature CouplesMature Singles
Young Couples - Non ObstetricsCouples/Families - With Obstetrics
Young Families - Non ObstetricsYoung Single Parents
Young SinglesPrice Feature

Premium
The base premium for extras cover insurance products will be used as the main point of cost comparison. Peer products will be compared and the product with the lowest cost will be awarded the highest base premium score. All other peer products will be awarded a relative score based on how much more expensive they are (i.e. if a product costs twice as much as the cheapest, it will earn half the base premium score of the cheapest product).
Out-of-pocket payments The out-of-pockets component of the pricing score is a scenario-based calculation for both hospital and extras cover. For hospital cover, we use six scenarios to calculate the amount of excess or co-payment required for each hospitalisation. See page 10 for more information. For extras cover, the calculation uses 100 hypothetical new policy holders who have met all the waiting period requirements and their use of dental, optical, physiotherapy and chiropractic over a 12-month period. See page 14 for more information.
21

Feature score The feature score is made up of three assessments based on product-specific features of hospital and extras cover and fund-specific features. The weights applied to each of the three assessments are profile specific. Below outlines the weights for each of the profiles:
22
15% 15% 15% 15% 15% 15% 15% 15% 15% 15% 15% 15%
35% 40% 40% 40% 40%
45% 45%
35% 40%
35% 35% 35%
50% 45% 45% 45% 45%
40% 40%
50% 45%
50% 50% 50%
0% 20% 40% 60% 80% 100%
TaxEstablished CouplesEstablished Families
Established Single ParentEstablished Singles
Mature CouplesMature Singles
Young Couples - Non ObstetricsYoung Couples/Families - With Obstetrics
Young Families - Non ObstetricsYoung Single Parents
Young Singles
Fund Information Hospital Inclusions Extras Inclusions
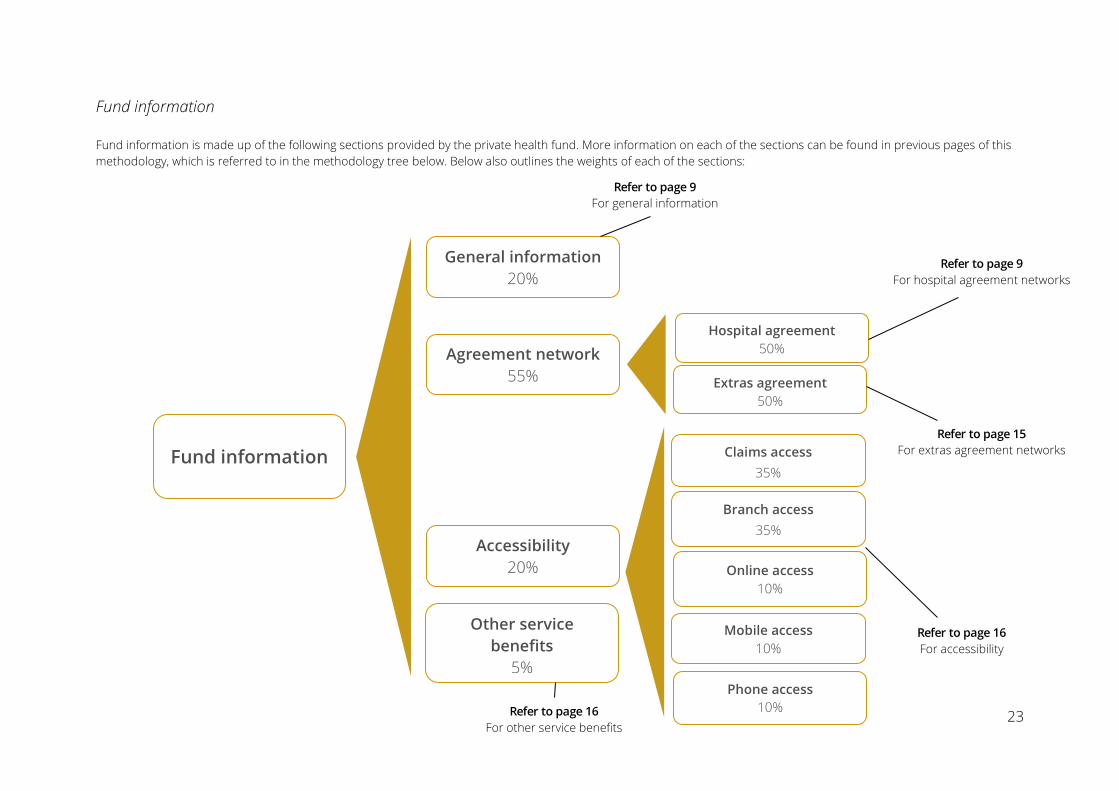
Fund information Fund information is made up of the following sections provided by the private health fund. More information on each of the sections can be found in previous pages of this methodology, which is referred to in the methodology tree below. Below also outlines the weights of each of the sections:
Fund information
General information 20%
Agreement network 55%
Accessibility 20%
Hospital agreement 50%
Extras agreement 50%
Claims access 35%
Branch access 35%
Online access 10%
Mobile access 10%
Other service benefits
5%
Refer to page 9 For general information
Refer to page 9 For hospital agreement networks
Refer to page 15 For extras agreement networks
Refer to page 16 For accessibility
Refer to page 16 For other service benefits
Phone access 10%
23

Policy information Package cover policies vary in the different level of cover for each type of insurance (hospital and extras). To see an outline on how each of the covers are measured, refer to page 12 for hospital inclusions and page 20 for extras inclusions.
Fund eligibility To be included in a states/territory star ratings a health fund (fund) is required to have a minimum market share of 0.4% in that particular state/territory or have a minimum of 5% of its total policies in that particular state/territory. Should a fund not meet either criterion, it will be entered into its “home state” only. To be eligible for a state/territory award, the fund will be required to have a minimum of 0.4% market share. Should a fund not be eligible for a state/territory award, that state/territory will carry a zero score towards the national award.
How many products and financial institutions are analysed? In order to calculate the ratings, CANSTAR analysed 1,177 private health insurance policies from 22 health funds in Australia.
Does CANSTAR rate all products available in the market? We endeavour to include the majority of product providers in the market and to compare the product features most relevant to consumers in our ratings. However, this process is not always possible and it may be that not every product in the market is included in the rating nor every feature compared that is relevant to you.
How often are all the products reviewed for ratings purposes? All ratings are recalculated annually based on the latest features offered by each provider. CANSTAR also monitors changes on an ongoing basis. The results are published in a variety of mediums (newspapers, magazine, television, websites, etc.).
24

How are stars awarded? The products are ranked with each category based on the total score received. The stars are then awarded based on the distribution of the scores with the objective to award the top 5-10% of products with the CANSTAR five-star rating. The results are reflected in a consumer-friendly CANSTAR star rating concept, with five stars denoting outstanding value.
Does CANSTAR rate other product areas? CANSTAR researches, compares and rates the banking and insurance products listed below. These star ratings use similar methodologies to guarantee quality, consistency and transparency. Results are freely available to consumers who use the star ratings as a guide to product excellence. The use of similar star ratings logos also builds consumer recognition of quality products across all categories. Please access the CANSTAR website at www.canstar.com.au if you would like to view the latest star ratings reports of interest.
• Account based pensions • Business life insurance • Deposit accounts • Health insurance • Landlord insurance • Margin lending • Package banking • Reward programs • Travel insurance
• Agribusiness • Car insurance • Direct life insurance • Home & contents • Life insurance • Online banking • Personal loans • Superannuation • Travel money cards
• Business banking • Credit cards • First home buyer • Home loans • Managed investments • Online share trading • Pet insurance • Term deposits • Youth banking
25

COMPLIANCE DISCLOSURE and LIABILITY DISCLAIMER To the extent that the information in this report constitutes general advice, this advice has been prepared by Canstar Research Pty Ltd A.C.N. 114 422 909 AFSL and ACL 437917 (“Canstar”). The information has been prepared without taking into account your individual investment objectives, financial circumstances or needs. Before you decide whether or not to acquire a particular financial product you should assess whether it is appropriate for you in the light of your own personal circumstances, having regard to your own objectives, financial situation and needs. You may wish to obtain financial advice from a suitably qualified adviser before making any decision to acquire a financial product. Canstar provides information about credit products. It is not a credit provider and in giving you information it is not making any suggestion or recommendation to you about a particular credit product. Please refer to Canstar’s FSG for more information. The information in this report must not be copied or otherwise reproduced, repackaged, further transmitted, transferred, disseminated, redistributed or resold, or stored for subsequent use for any purpose, in whole or in part, in any form or manner or by means whatsoever, by any person without CANSTAR’s prior written consent. All information obtained by Canstar from external sources is believed to be accurate and reliable. Under no circumstances shall Canstar have any liability to any person or entity due to error (negligence or otherwise) or other circumstances or contingency within or outside the control of Canstar or any of its directors, officers, employees or agents in connection with the procurement, collection, compilation, analysis, interpretation, communication, publication, or delivery of any such information. Copyright 2014 CANSTAR Research Pty Ltd A.C.N. 114 422 909 The word “CANSTAR", the gold star in a circle logo (with or without surmounting stars), are trademarks or registered trademarks of CANSTAR Pty Ltd. Reference to third party products, services or other information by trade name, trademark or otherwise does not constitute or imply endorsement, sponsorship or recommendation of CANSTAR by the respective trademark owner.
26


![[Whitepaper] How Australians Search for Travel Insurance - SEO](https://cdn.vdocument.in/doc/165x107/55aa0f311a28abca6e8b4836/whitepaper-how-australians-search-for-travel-insurance-seo.jpg)


