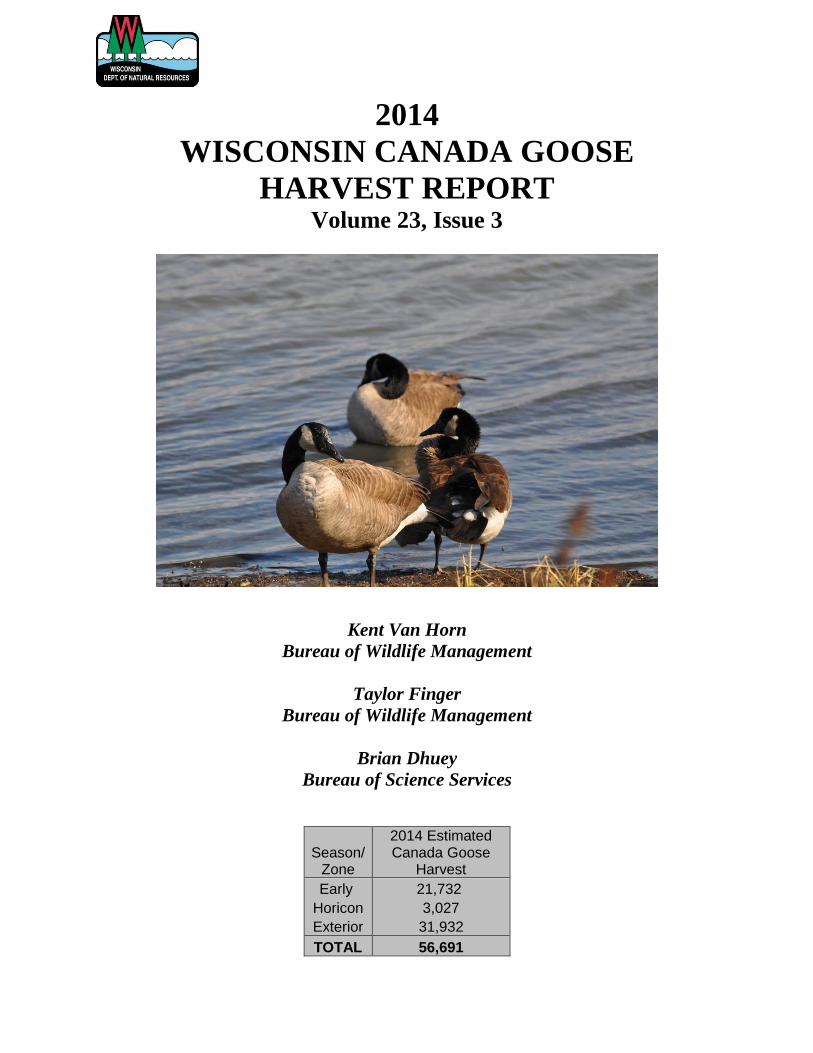
2014
WISCONSIN CANADA GOOSE
HARVEST REPORT Volume 23, Issue 3
Kent Van Horn
Bureau of Wildlife Management
Taylor Finger
Bureau of Wildlife Management
Brian Dhuey
Bureau of Science Services
Season/ Zone
2014 Estimated Canada Goose
Harvest
Early 21,732
Horicon 3,027
Exterior 31,932
TOTAL 56,691

3
Table of Contents
Introduction 5
Changing Canada Goose Harvest Management in the Mississippi Flyway 6
Breeding populations 10
Methods 11
1-800-Reporting System 11
Horicon Mail Survey 11
Results and Discussion 11
Early September Canada goose season hunter participation and harvest 11
Regular season hunter participation and characteristics 13
Exterior Zone 13
Horicon Zone 14
Regular season harvest 16
Statewide 16
Exterior Zone 16
Horicon Zone 19
Management implications 21
Citations 24
Appendix- Harvest and participation data 26
Canada Goose management zone map 44

4

5
WISCONSIN 2014 CANADA GOOSE HARVEST REPORT
INTRODUCTION
The management of Canada goose populations and hunting recreation has been a social and
biological challenge for the state of Wisconsin since the 1950s (Miller 1998). Continental
Canada goose management is based on several different breeding populations. The fall harvest
of Canada geese in Wisconsin consists primarily of two populations. One population is the
Mississippi Valley Population (MVP) that breeds along the southern Hudson Bay Coast in
Ontario and migrates south primarily through Wisconsin and Michigan, and then Illinois, Indiana
and western Ohio. Traditionally, many MVP geese wintered in Kentucky and Tennessee, and
sometimes as far south as Mississippi (Brooke and Luukkonen 2010, Leafloor et al. 2003).
However, in recent years many are wintering as far north as northern Illinois and southern
Wisconsin. A second major population of geese contributing to Wisconsin’s harvest is the
resident or giant race which breeds in WI. Based on banding data, a small percentage of
Wisconsin’s goose harvest (~2%) also comes from the Eastern Prairie, Tall Grass Prairie and
Southern James Bay Populations. The Mississippi Flyway Council (MFC) was established in
1952 to work cooperatively among the states, provinces and federal governments in the
management of migratory birds and in 1956 the MFC established a Canada Goose Committee to
manage the harvest and distribution of several Canada goose populations in the Flyway.
In the 1950s the MVP was the primary population of Canada geese in Wisconsin while the giant
race was considered nearly extinct in the Flyway. During this period, the Horicon National
Wildlife Refuge (NWR) in WI began managing specifically to support migrating MVP during
the fall. Landscape changes, Horicon refuge management and an expanded refuge system in
Illinois all contributed to an increase in fall/winter Canada goose populations and harvest levels
in both states. In 1960 Wisconsin and Illinois agreed to establish a harvest quota system to
cooperatively manage goose harvest and despite a number of changes, a quota system remained
through 2006. During the early 1960s MVP geese steadily increased in numbers at Horicon with
fall numbers exceeding 100,000 geese and harvest near 1,000 geese per day for only a 9 to 11
day season. This growing fall goose population began to cause significant agricultural crop
depredation in WI and complaints by hunters in states to the south that WI was short stopping
geese (Miller 1998). In 1965 agricultural damage payments began as a result of goose
depredation in east central WI. Over a period of several years in the 1960s; social, political and
biological forces surrounded goose management and resulted in actions such as hazing and a
harvest of 30,000 geese in 3 days of shooting in 1966. In 1965 the MFC agreed to a winter
Flyway population objective of 200,000 and in 1969 this was increased to 300,000. Several
states in the Flyway wished to see an increase in the MVP goose population and a greater
distribution of these birds to the south of WI while WI managers continued to express concern
over increased goose concentrations in east central WI.
In the 1970s up to 80% (250,000-300,000 birds) of the MVP winter population stopped at
Horicon and surrounding areas (Miller 1998). Agricultural and biological concerns over this
concentration of birds led to the 1976 management strategy to reduce the peak fall population
and encourage birds to move south. Altering land management in the Horicon NWR, and
6
increased harvest and disturbance helped to move geese out of the refuge but not necessarily to
locations outside of WI. However, many hunters and goose watchers in Wisconsin opposed
these efforts to redistribute goose concentrations. A number of biological and political concerns
complicated management efforts. In 1979 the MFC prepared the first Flyway-wide management
plan for the MVP in an attempt to create a more scientifically based management strategy.
Revisions of this plan continue to guide the management of the MVP population with the most
recent revision in 2010 (Brook and Luukkonen 2010).
Meanwhile, a few small remnants of the giant race of Canada geese were discovered in southern
WI and elsewhere in the Flyway during the 1950s and 1960s. Restoration efforts to increase this
population began in the 1960s and involved the releasing of birds from captive reared
populations, translocation of birds within and among states and provinces and closure of Canada
goose hunting in some areas (MF Giant Canada goose management plan 1996). Now giant
Canada geese are the most abundant subspecies in the Flyway (Leafloor et al. 2003). The
increase in the giant population began in urban and rural areas of southeast WI and this remains
an area of high resident goose densities. Giant Canada geese have adapted well to the urban,
suburban and agricultural landscapes in Wisconsin resulting in an increasing population and
expanding distribution across the state. With this increasing population and distribution come
both problems with agricultural damage and urban nuisance geese as well as increased hunting
and viewing opportunities. Most recent harvest derivations indicate that giants are
approximately 40% of the WI regular season Canada goose harvest and nearly all of the early
September season harvest. The Wisconsin breeding population of giants steadily increased
during the 1980s and 1990s but stabilized from 2005-2008. Since then it has shown a slowly
increasing trend.
The MVP management plan provides the basis for evaluation and management of the MVP
population and harvest. The annual harvest quota was being determined using the breeding
population estimate (breeding adults) produced by the Ontario Ministry of Natural Resources as
a trigger to determine different harvest levels. Based on the total MVP harvest level, the harvest
quota in 2006 was distributed among the major and minor harvest states as follows; WI 35%, IL
33%, MI 20%, KY 12% and the minor harvest states a collective harvest of 80,500 geese.
Annual harvest derivations for each state indicated the percentage of the annual Canada goose
harvest for each state that comes from MVP, resident giants or other populations. The total
harvest quota for the state of Wisconsin was determined by applying more recent derivations to
the MVP harvest limit. This was the system that guided the Canada goose season framework for
Wisconsin up until 2006.
Changing Canada Goose Harvest Management in the Mississippi Flyway
Historically, there has been an emphasis on maintaining a high abundance of MVP geese via
population objectives and harvest restraint. The simultaneous growth of giant Canada goose
populations has provided more harvest opportunities, but has also expanded management
challenges (e.g., human-goose conflict). There is some evidence that the annual regular hunting
season changes intended to reduce harvest on MVP geese in low population years also reduced
harvest on resident giants, allowing greater growth of that population. In addition, in the
7
Mississippi Flyway (14 states) nearly 70% of the total Canada goose harvest now consists of
resident giant Canada geese. Therefore, it is believed that the resident giant population can
“buffer” the MVP and other interior Canada goose populations from harvest impacts in most
locations. In order to test this theory, in 2007 the MVP harvest states in the flyway set stable
seasons for five years. By creating a stable hunting season framework and monitoring outcomes,
the ability of giants to “buffer” the harvest of migrants was tested. On a flyway-wide level, the
effects of this new strategy were predicted to increase overall harvest and harvest rate of giant
Canada geese and thus slow or stabilize their population growth. Predicted effects on migrant
goose populations included either an insignificant increase in harvest rate or an initial larger
increase in harvest rate followed by declining abundance and declining harvest rate.
This 5 year trial of a stable hunting season was agreed to among MVP states in 2007, to
determine if we could simplify hunting regulation changes, increase hunting opportunity and
increase harvest on giant Canada geese without negatively impacting the MVP population. In
Wisconsin, we agreed to a 15 day – 5 bird daily bag limit early September Canada goose season,
an 85 day – 2 bird daily bag Exterior Canada goose season and a 92 day Horicon season with a 6
bird season limit and a 2 bird daily limit.
Wisconsin’s Canada goose harvest system provided excellent tools to monitor harvest as part of
the evaluation of this strategy because of the 1-800 mandatory harvest reporting system. During
the 5-year trial from 2007-2011 Exterior Zone harvest figures ranged from 31,570-43,958 while
under the previous variable season structures of 2003-2006, the harvest ranged from 26,902 –
46,699 (Figure 5). It did not appear that the regulations had a significant impact on total harvest.
Changes in annual goose production and fall weather are likely driving much of the total harvest
variation observed over these years. With harsh, early winters, Wisconsin’s goose hunting
season may effectively end, but this actually has a greater impact on MVP birds as they are
driven south to Illinois where they continue to be hunted. Based on the heavy hunting pressure
in Wisconsin early in the season (Figure 6, Figure 7) and low pressure later in the season, season
length has had little impact on total harvest.
At the February 2012, Mississippi Flyway Council technical meeting, waterfowl biologists from
across the flyway reviewed population status, harvest data and hunter/harvest surveys with the
objective of charting the next step in Canada goose hunting regulations based on the prior 5 year
stable regulations. Wisconsin’s detailed harvest data as reported in this document was important
in the evaluation process. Across the Mississippi Flyway, giant Canada geese were harvested at
a rate of 16% while in Wisconsin we harvested at a rate of 21%. At the same time, the
Wisconsin and the Mississippi Flyway breeding populations of giant or Temperate Breeding
(TBP) Canada geese had shown an increasing population trend. The steady increase observed
from 1993-2000 was at a rate of 7.2% annual growth. However, this rate of increase began to
slow and the average increase from 2001-2014 was only 1.2%. Nonbreeding TBP (1-2 year olds
and failed breeders) often migrate north to Ontario for the summer molt in what is called a molt
migration. These geese return to Wisconsin and Michigan in September just prior to or with the
MVP birds that nest in northern Ontario. Early opening (prior to September 24) regular seasons
help to target harvest of these birds and Wisconsin was recognized by the other states as having
an effective season structure to provide additional harvest on these migrating TBP geese. With
8
regard to TBP geese it was believed that early opening dates (mid-September), additional
hunting days and higher bag limits were all options to increase regular season harvest on TBP
geese across the states. The use of these options would vary by state depending on the goals for
the other Canada nesting populations of Canada geese harvested in that state.
In contrast to the data related to TBP Canada geese which suggested opportunities for
liberalizing hunting season parameters, the MVP data supported a cautious approach. Several
years of low to moderate production, high adult harvest in 2009 and a flat to slightly declining
breeding population trend for the MVP all contribute to a decision to avoid changes that might
result in increased harvest. Wisconsin is most dependent upon the MVP (about 60% of regular
season harvest) to support our Canada goose hunting opportunities with Illinois and Michigan
also somewhat dependent upon the MVP. While breeding ground conditions are the primary
force driving population change, significant harvest during low population cycles could drive the
MVP lower, slow population recovery and reduce hunting opportunity in Wisconsin. In
Wisconsin, most regular season Canada goose hunting pressure and harvest occurs in late
September and October. In the Exterior zone, 78% of the season harvest occurs in the first half of
the season prior to November 1 and 88% of the Horicon harvest occurs during the first period
(Appendix Table 8). As a result, harvest management decisions that change season structure in
September and October have the greatest potential to change harvest rates on Canada geese in
Wisconsin.
With the background of mixed results toward TBP and MVP goals, the MFC agreed to a small
step toward greater liberalization of Canada goose hunting regulations. The states that share the
MVP could increase their regular season Canada goose hunting season length from 85 to 92 days
with a 2 bird bag limit or shorten the season to 78 days with a 3 bird daily bag limit. The
northern states with high MVP harvest (Wisconsin, Michigan and Illinois) agreed to increase the
hunting season length and maintain a 2 bird daily bag limit while the southern MVP states
increased the daily bag limit with a shorter season, recognizing that a greater proportion of their
harvest is TBP geese. While this change provided an extra week of harvest opportunity for
Wisconsin in 2013 and 2014, it had a relatively small impact on overall harvest. Less than 900
geese or 1-2% of total harvest were harvested during these additional 7 days during 2013 and
2014 (Appendix Table 11).
A disproportionate number of Horicon Zone harvested geese are from the MVP, so there has
been a need for special harvest management in this zone. In addition, the Horicon zone provides
a unique hunting opportunity with reduced hunter pressure which has been maintained to control
MVP harvest. However, the county level harvest data also indicated that parts of the Horicon
zone were being underutilized. As a result, we began to evaluate in 2012 the possibility of
reducing the size of the zone to better represent the core around Horicon Marsh. This potential
change was consistent with philosophy of small steps toward liberalization since shifting a
specific area from the more restrictive Horicon Zone to the Exterior zone would allow more
liberal hunting regulations. An analysis of MVP band return data confirmed that MVP harvest is
much higher in and around the marsh. The area of the state with the highest band recoveries for
MVP Canada geese was the eastern portion of the Horicon zone (Dodge, Fond du Lac,
Washington Counties) which is closest to the Horicon marsh. These analyses were presented to
9
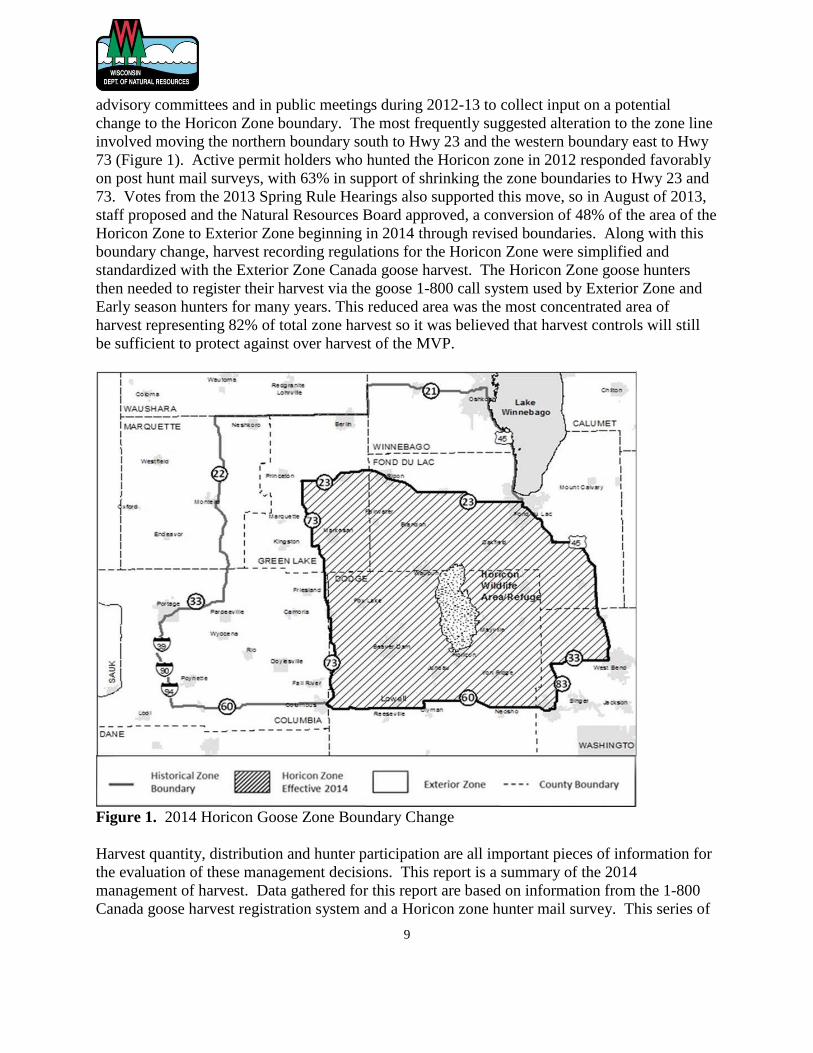
advisory committees and in public meetings during 2012-13 to collect input on a potential
change to the Horicon Zone boundary. The most frequently suggested alteration to the zone line
involved moving the northern boundary south to Hwy 23 and the western boundary east to Hwy
73 (Figure 1). Active permit holders who hunted the Horicon zone in 2012 responded favorably
on post hunt mail surveys, with 63% in support of shrinking the zone boundaries to Hwy 23 and
73. Votes from the 2013 Spring Rule Hearings also supported this move, so in August of 2013,
staff proposed and the Natural Resources Board approved, a conversion of 48% of the area of the
Horicon Zone to Exterior Zone beginning in 2014 through revised boundaries. Along with this
boundary change, harvest recording regulations for the Horicon Zone were simplified and
standardized with the Exterior Zone Canada goose harvest. The Horicon Zone goose hunters
then needed to register their harvest via the goose 1-800 call system used by Exterior Zone and
Early season hunters for many years. This reduced area was the most concentrated area of
harvest representing 82% of total zone harvest so it was believed that harvest controls will still
be sufficient to protect against over harvest of the MVP.
Figure 1. 2014 Horicon Goose Zone Boundary Change
Harvest quantity, distribution and hunter participation are all important pieces of information for
the evaluation of these management decisions. This report is a summary of the 2014
management of harvest. Data gathered for this report are based on information from the 1-800
Canada goose harvest registration system and a Horicon zone hunter mail survey. This series of
10
reports has been and continues to be instrumental in making decisions for the management of
Canada geese in Wisconsin.
BREEDING POPULATIONS
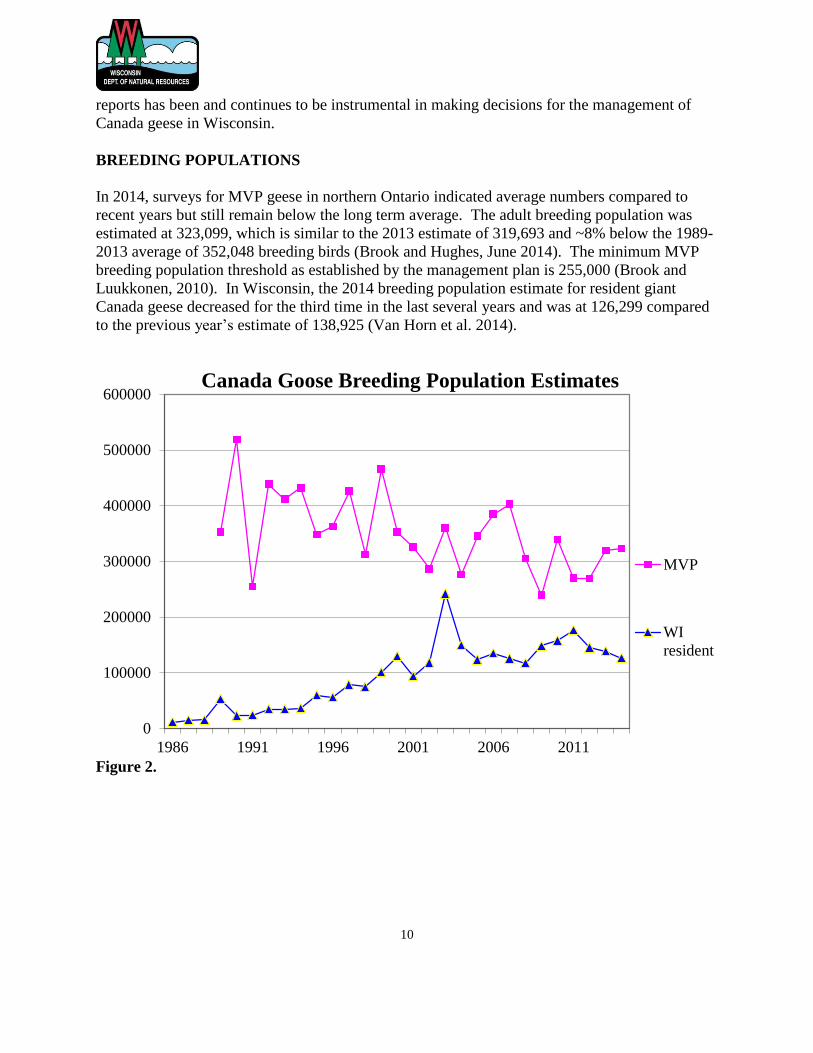
In 2014, surveys for MVP geese in northern Ontario indicated average numbers compared to
recent years but still remain below the long term average. The adult breeding population was
estimated at 323,099, which is similar to the 2013 estimate of 319,693 and ~8% below the 1989-
2013 average of 352,048 breeding birds (Brook and Hughes, June 2014). The minimum MVP
breeding population threshold as established by the management plan is 255,000 (Brook and
Luukkonen, 2010). In Wisconsin, the 2014 breeding population estimate for resident giant
Canada geese decreased for the third time in the last several years and was at 126,299 compared
to the previous year’s estimate of 138,925 (Van Horn et al. 2014).
Figure 2.
0
100000
200000
300000
400000
500000
600000
1986 1991 1996 2001 2006 2011
Canada Goose Breeding Population Estimates
MVP
WI
resident
11
METHODS
The Wisconsin Department of Natural Resources collects Canada goose harvest data for all
zones using call-in reporting; in 2014 the Horicon Zone reporting requirements were changes to
make reporting consistent statewide:
1-800 Reporting System
During the statewide Early September season, Exterior zone and Horicon zone in the regular
season, all Canada goose hunters were required to report their harvest using the 1-800-99-
GOOSE telephone call-in system within 48 hours. The Horicon Zone was added to this system
in 2014 to bring a consistent statewide system of monitoring Canada goose harvest in Wisconsin
and simplify regulations. With this system hunters report the following information: DNR
customer number, date of harvest, county of harvest and number of geese harvested. This
information is electronically recorded and summarized in a harvest database that is reviewed
weekly during the season to track harvest levels. Department law enforcement personnel around
the state conduct field checks of Canada goose hunters to assure compliance with the reporting
requirement. Results of these field checks provide a compliance rate that is used to adjust the
reported harvest to estimate total Canada goose harvest.
Horicon Mail Survey
Canada goose hunters in the Horicon zone were mailed a hunter questionnaire to obtain harvest
information as they have in past years. The questionnaire was sent to 100% of the permit holders
and mailed at the end of each time period. The Horicon hunters were selected randomly in
proportion to the number in each time period. Response rates for questionnaires (Appendix
Table 1) in the Horicon zone this year and historically has been around 50%. We continued the
Horicon mail survey for the 2014 harvest season so that we had overlapping data with the 1-800
harvest registration system newly established for this zone. This allowed us to compare the 2
methods of estimating harvest during the transition from one system to another.
RESULTS AND DISCUSSION
Early September Canada Goose Season Hunter Participation and Harvest
The Early September season is an important part of Wisconsin’s Canada goose management
program. This season offers hunters an additional recreational experience outside of the regular
season and directs harvest pressure onto our resident giant Canada geese. In 2014, the season
was open from September 1-15 with a 5 bird daily bag limit as allowed by federal rule, which
was unchanged from previous years.
The number of applicants for the early season Canada goose permit was 59,017 which was the
third year in a row that permit numbers increased (Appendix Table 19). Prior to 2003, the
number of early permit holders had been steadily increasing. However, in 2004 the Conservation
Patron license increased from $110 to $140 and then to $165 in 2005 and the number of patron
12
licenses began declining. We believe this also triggered a several year decline in Canada goose
permit holders from 2004-2011 since all conservation patron license holders were provided an
early goose permit. We have no data to assess the percent of the total applicants that actively
hunt during this period although the federal HIP data suggests relatively stable overall (early and
regular season) active Canada goose hunter numbers in Wisconsin the last several years.
Conservation patron license customers are offered an early goose permit as part of the combined
license package so some of these permit holders may have had little intent to hunt during this
season even though they had a permit. The harvest figures for this year show that 4,520 hunters
were successful in harvesting one or more geese during the early season, which up slightly from
4,228 in 2013.
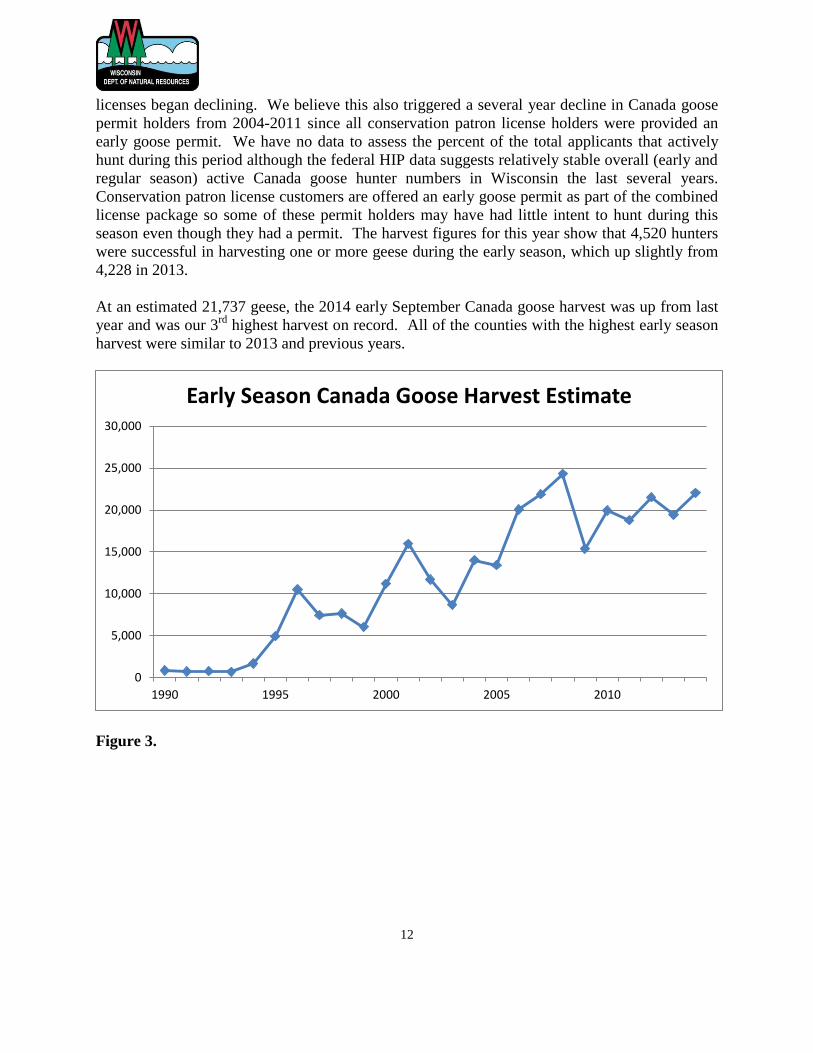
At an estimated 21,737 geese, the 2014 early September Canada goose harvest was up from last
year and was our 3rd
highest harvest on record. All of the counties with the highest early season
harvest were similar to 2013 and previous years.
Figure 3.
0
5,000
10,000
15,000
20,000
25,000
30,000
1990 1995 2000 2005 2010
Early Season Canada Goose Harvest Estimate
13
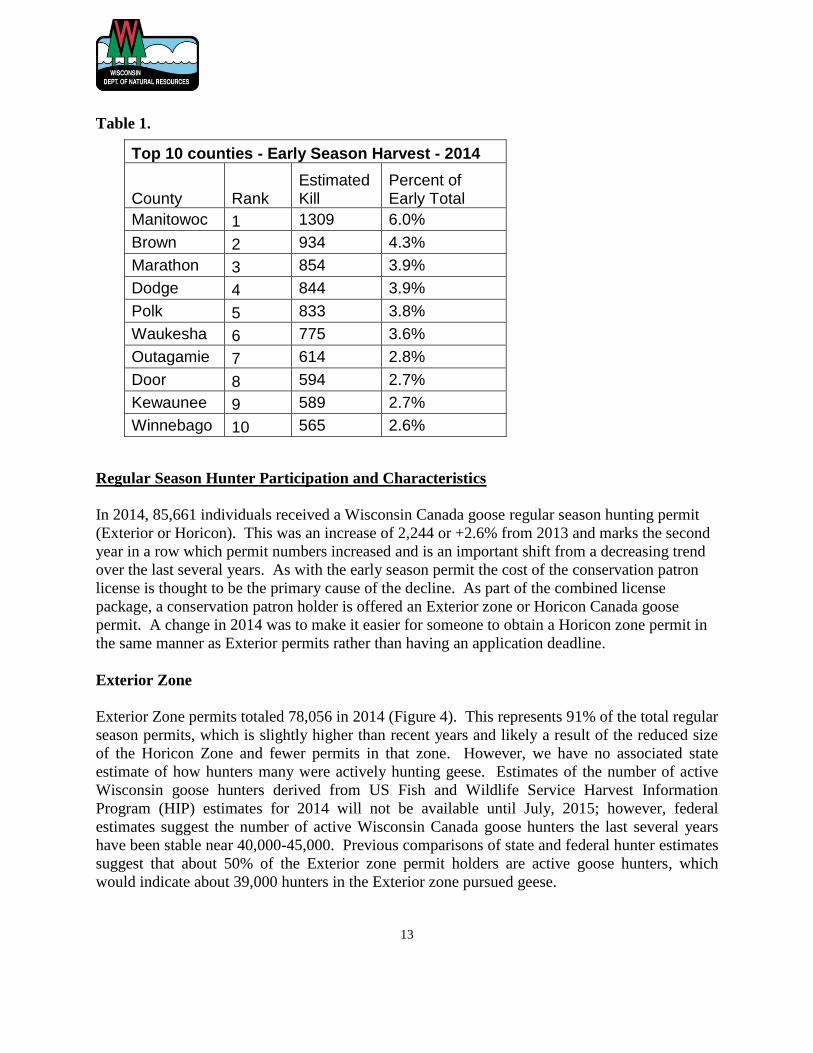
Table 1.
Regular Season Hunter Participation and Characteristics
In 2014, 85,661 individuals received a Wisconsin Canada goose regular season hunting permit
(Exterior or Horicon). This was an increase of 2,244 or +2.6% from 2013 and marks the second
year in a row which permit numbers increased and is an important shift from a decreasing trend
over the last several years. As with the early season permit the cost of the conservation patron
license is thought to be the primary cause of the decline. As part of the combined license
package, a conservation patron holder is offered an Exterior zone or Horicon Canada goose
permit. A change in 2014 was to make it easier for someone to obtain a Horicon zone permit in
the same manner as Exterior permits rather than having an application deadline.
Exterior Zone
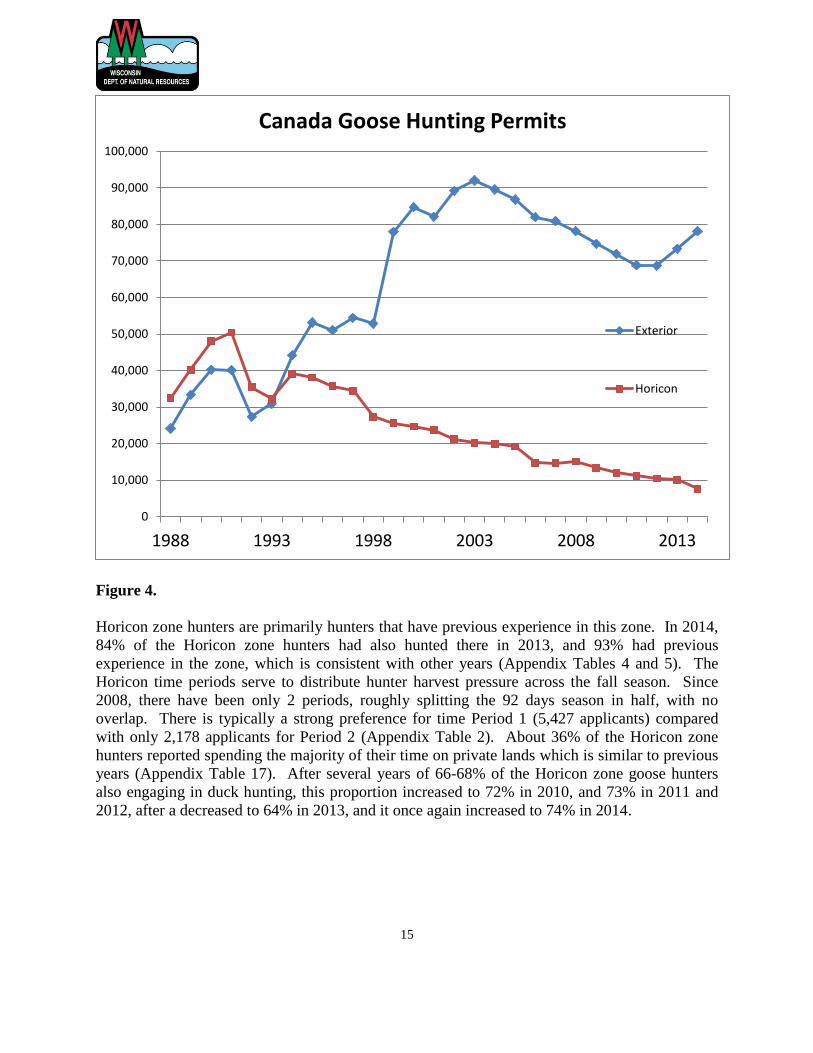
Exterior Zone permits totaled 78,056 in 2014 (Figure 4). This represents 91% of the total regular
season permits, which is slightly higher than recent years and likely a result of the reduced size
of the Horicon Zone and fewer permits in that zone. However, we have no associated state
estimate of how hunters many were actively hunting geese. Estimates of the number of active
Wisconsin goose hunters derived from US Fish and Wildlife Service Harvest Information
Program (HIP) estimates for 2014 will not be available until July, 2015; however, federal
estimates suggest the number of active Wisconsin Canada goose hunters the last several years
have been stable near 40,000-45,000. Previous comparisons of state and federal hunter estimates
suggest that about 50% of the Exterior zone permit holders are active goose hunters, which
would indicate about 39,000 hunters in the Exterior zone pursued geese.
Top 10 counties - Early Season Harvest - 2014
County Rank Estimated Kill
Percent of Early Total
Manitowoc 1 1309 6.0%
Brown 2 934 4.3%
Marathon 3 854 3.9%
Dodge 4 844 3.9%
Polk 5 833 3.8%
Waukesha 6 775 3.6%
Outagamie 7 614 2.8%
Door 8 594 2.7%
Kewaunee 9 589 2.7%
Winnebago 10 565 2.6%

14
The number of Exterior goose permits issued, by county of residence, was similar when
compared to recent years (Appendix Table 3). In descending order, the counties with the highest
number of permits issued were Waukesha, Dane, Outagamie, Winnebago and Brown. These
counties also have some of the highest human populations in the state.
Horicon Zone
The Horicon Zone was a large area that included all of Green Lake and parts of Dodge, Fond du
Lac, Marquette, Washington and Columbia counties. However, in 2014 the zone was reduced to
focus the special Horicon zone harvest management on a small area that supported over 80% of
the hunting in the original area. All of Marquette and Winnebago, nearly all of Columbia, 2/3 of
Green Lake and a portion of Fond du Lac counties were changed from Horicon to Exterior zone.
Horicon zone permit holders received a permit that allows a total season harvest of 12 Canada
geese in 2014 which is up from 6 in 2013. We anticipated a drop in permit holders which
allowed an increase in harvest per permit holder. There has been a gradual decline in the number
of Horicon permits over the last 20 years and the size change in 2014 likely contributed to the
decline of 2,500 to 7,604 (Figure 4). The percentage of total regular season hunters represented
by the Horicon permits in 2014 was 9% which is lower than in recent years (Appendix Table 2).
The percentage of active Horicon zone hunters (those who actually hunted) from all time periods
decreased from 51% in 2013 to 43% in 2014, primarily in Period 1. The mean number of trips
taken by active hunters in Period 1 increased from 4.6 in 2013 to 4.7 in 2014 and during Period
2, the mean number of trips decreased from 4.2 to 4.0 in 2014 (Appendix Table 7). Harvest
success of active hunters in 2014 was below recent years with 39% of Period 1 hunters being
successful and but only 23% of period 2 hunters being successful compared to an average
success rate of the previous 4 years of 48% for Period 1 and 40% for Period 2.
15
Figure 4.
Horicon zone hunters are primarily hunters that have previous experience in this zone. In 2014,
84% of the Horicon zone hunters had also hunted there in 2013, and 93% had previous
experience in the zone, which is consistent with other years (Appendix Tables 4 and 5). The
Horicon time periods serve to distribute hunter harvest pressure across the fall season. Since
2008, there have been only 2 periods, roughly splitting the 92 days season in half, with no
overlap. There is typically a strong preference for time Period 1 (5,427 applicants) compared
with only 2,178 applicants for Period 2 (Appendix Table 2). About 36% of the Horicon zone
hunters reported spending the majority of their time on private lands which is similar to previous
years (Appendix Table 17). After several years of 66-68% of the Horicon zone goose hunters
also engaging in duck hunting, this proportion increased to 72% in 2010, and 73% in 2011 and
2012, after a decreased to 64% in 2013, and it once again increased to 74% in 2014.
0
10,000
20,000
30,000
40,000
50,000
60,000
70,000
80,000
90,000
100,000
1988 1993 1998 2003 2008 2013
Canada Goose Hunting Permits
Exterior
Horicon
16
Regular Season Harvest
Statewide
The statewide regular season Canada goose harvest in 2014 was 34,959 (Appendix Table 8).
Statewide harvest figures suggest that our season structure continues to effectively manage
harvest despite annual changes in production. The 2014 statewide regular season harvest was
22% lower than 2013. This likely reflects an early onset of winter in early November and
considerable acreage of un-harvested corn in southern and central counties. Harvested grain
fields are the most commonly hunted locations for Canada geese and without crop harvest,
hunter opportunity declines. The early onset of winter likely resulted in an early movement of
Canada geese out of Wisconsin and south into Illinois.
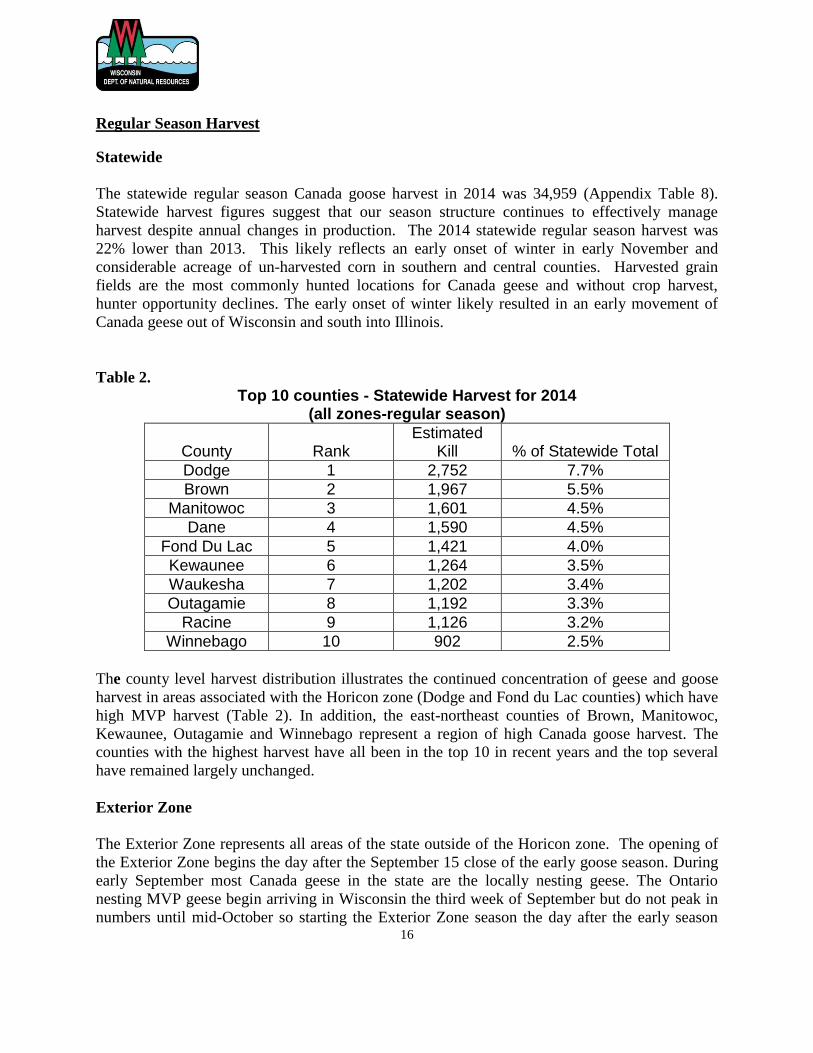
Table 2.
Top 10 counties - Statewide Harvest for 2014 (all zones-regular season)
County Rank Estimated
Kill % of Statewide Total
Dodge 1 2,752 7.7%
Brown 2 1,967 5.5%
Manitowoc 3 1,601 4.5%
Dane 4 1,590 4.5%
Fond Du Lac 5 1,421 4.0%
Kewaunee 6 1,264 3.5%
Waukesha 7 1,202 3.4%
Outagamie 8 1,192 3.3%
Racine 9 1,126 3.2%
Winnebago 10 902 2.5%
The county level harvest distribution illustrates the continued concentration of geese and goose
harvest in areas associated with the Horicon zone (Dodge and Fond du Lac counties) which have
high MVP harvest (Table 2). In addition, the east-northeast counties of Brown, Manitowoc,
Kewaunee, Outagamie and Winnebago represent a region of high Canada goose harvest. The
counties with the highest harvest have all been in the top 10 in recent years and the top several
have remained largely unchanged.
Exterior Zone
The Exterior Zone represents all areas of the state outside of the Horicon zone. The opening of
the Exterior Zone begins the day after the September 15 close of the early goose season. During
early September most Canada geese in the state are the locally nesting geese. The Ontario
nesting MVP geese begin arriving in Wisconsin the third week of September but do not peak in
numbers until mid-October so starting the Exterior Zone season the day after the early season
17
allows higher harvest on locally nesting geese in this season. In addition, hunter participation and
harvest are highest in late September and early October.
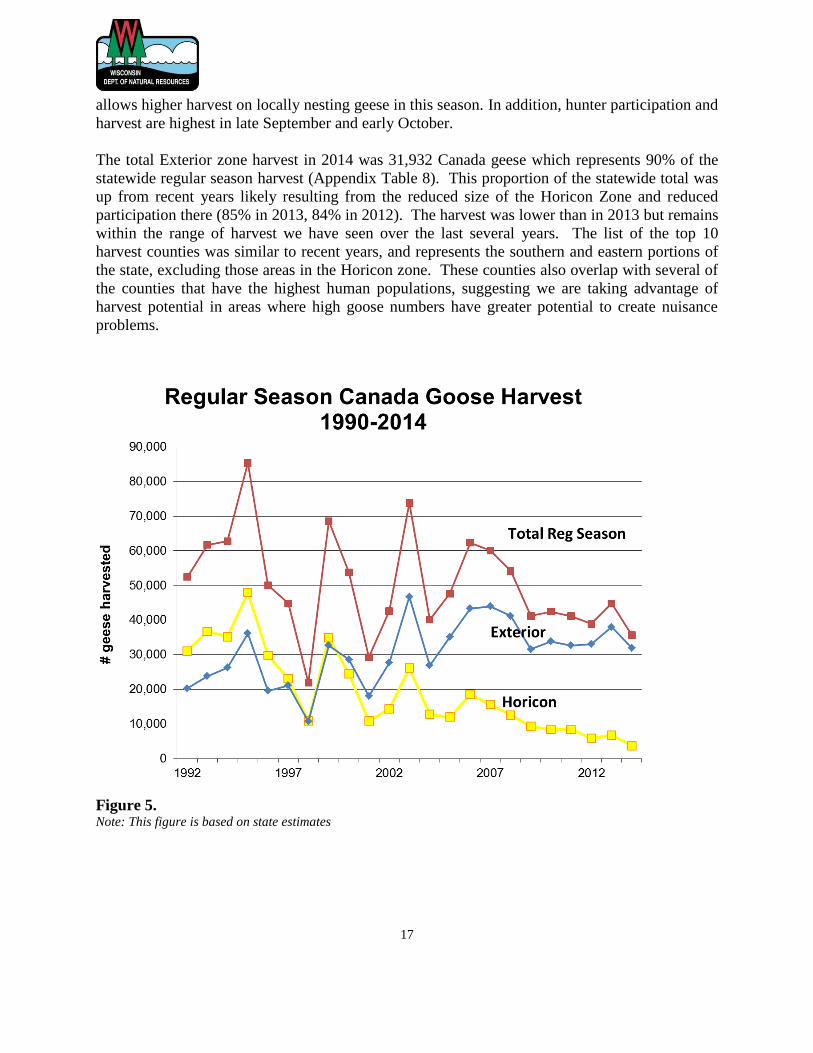
The total Exterior zone harvest in 2014 was 31,932 Canada geese which represents 90% of the
statewide regular season harvest (Appendix Table 8). This proportion of the statewide total was
up from recent years likely resulting from the reduced size of the Horicon Zone and reduced
participation there (85% in 2013, 84% in 2012). The harvest was lower than in 2013 but remains
within the range of harvest we have seen over the last several years. The list of the top 10
harvest counties was similar to recent years, and represents the southern and eastern portions of
the state, excluding those areas in the Horicon zone. These counties also overlap with several of
the counties that have the highest human populations, suggesting we are taking advantage of
harvest potential in areas where high goose numbers have greater potential to create nuisance
problems.
Figure 5. Note: This figure is based on state estimates
Exterior
Horicon
Total
0
20,000
40,000
60,000
80,000
100,000
120,000
1990 1992 1994 1996 1998 2000 2002 2004 2006 2008 2010
# g
ee
se
ha
rve
ste
d
Canada Goose Harvest in All Regular Season Zones, 1990-2011
Exterior
Horicon
Total
0
20,000
40,000
60,000
80,000
100,000
120,000
1990 1992 1994 1996 1998 2000 2002 2004 2006 2008 2010
# g
ee
se
harv
este
d
Canada Goose Harvest in All Regular Season Zones, 1990-2011
18
Table 3.
Top 10 counties - Exterior Harvest - 2014
County Rank Estimated Kill % of Exterior Total
Brown 1 1,967 6.2%
Manitowoc 2 1,601 5.0%
Dane 3 1,590 5.0%
Kewaunee 4 1,264 4.0%
Waukesha 5 1,202 3.8%
Outagamie 6 1,192 3.7%
Racine 7 1,126 3.5%
Winnebago 8 902 2.8%
Marathon 9 868 2.7%
Calumet 10 835 2.6%
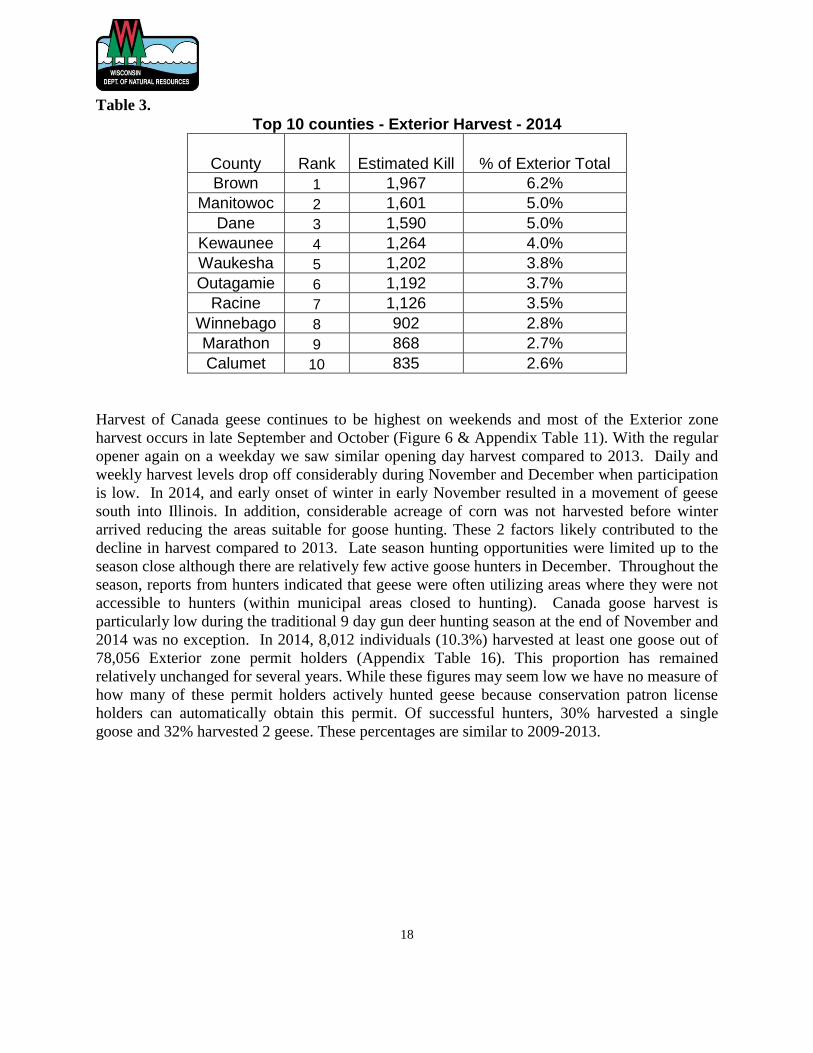
Harvest of Canada geese continues to be highest on weekends and most of the Exterior zone
harvest occurs in late September and October (Figure 6 & Appendix Table 11). With the regular
opener again on a weekday we saw similar opening day harvest compared to 2013. Daily and
weekly harvest levels drop off considerably during November and December when participation
is low. In 2014, and early onset of winter in early November resulted in a movement of geese
south into Illinois. In addition, considerable acreage of corn was not harvested before winter
arrived reducing the areas suitable for goose hunting. These 2 factors likely contributed to the
decline in harvest compared to 2013. Late season hunting opportunities were limited up to the
season close although there are relatively few active goose hunters in December. Throughout the
season, reports from hunters indicated that geese were often utilizing areas where they were not
accessible to hunters (within municipal areas closed to hunting). Canada goose harvest is
particularly low during the traditional 9 day gun deer hunting season at the end of November and
2014 was no exception. In 2014, 8,012 individuals (10.3%) harvested at least one goose out of
78,056 Exterior zone permit holders (Appendix Table 16). This proportion has remained
relatively unchanged for several years. While these figures may seem low we have no measure of
how many of these permit holders actively hunted geese because conservation patron license
holders can automatically obtain this permit. Of successful hunters, 30% harvested a single
goose and 32% harvested 2 geese. These percentages are similar to 2009-2013.
19
Figure 6.
Horicon Zone
The total Canada goose harvest as reported by the 1-800 mandatory harvest monitoring system
for the Horicon Zone in 2014 was 3,027. This made up 9% of the statewide regular season
harvest (Appendix Table 8). Harvest was down from 2013 (6,799) and down from other recent
years, likely reflecting the reduced size of the zone and fewer hunters. The overall number of
Horicon zone permit holders was down from 2013.
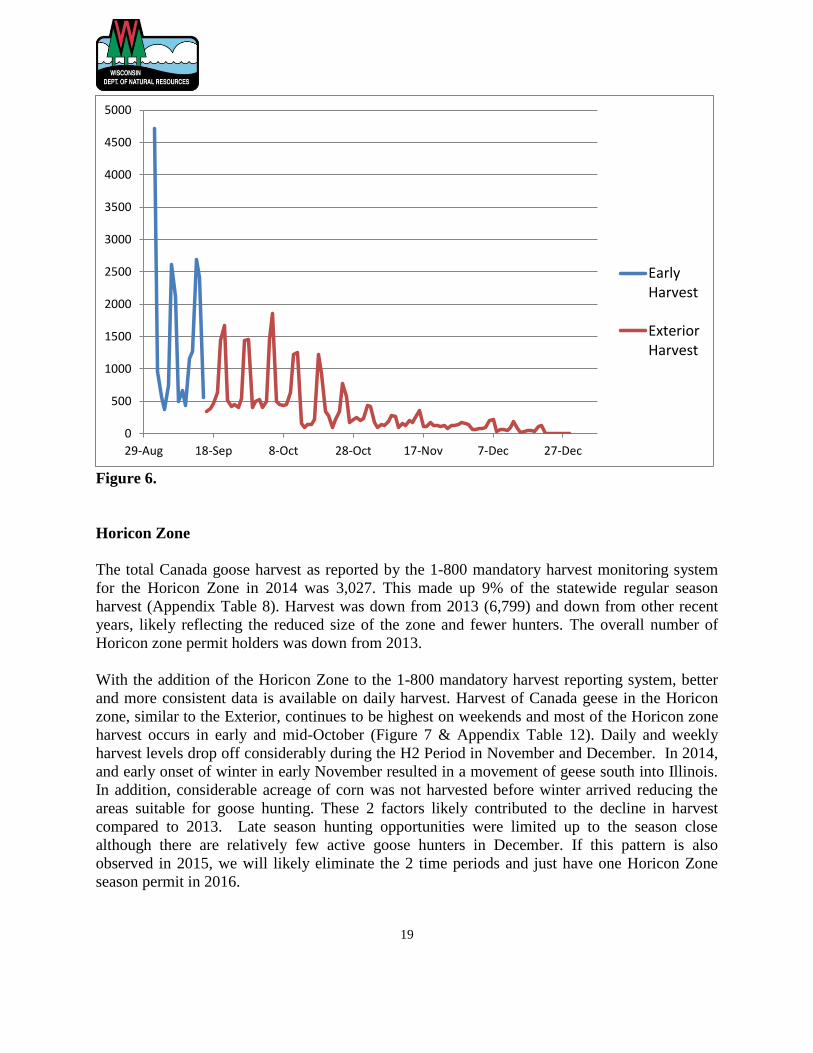
With the addition of the Horicon Zone to the 1-800 mandatory harvest reporting system, better
and more consistent data is available on daily harvest. Harvest of Canada geese in the Horicon
zone, similar to the Exterior, continues to be highest on weekends and most of the Horicon zone
harvest occurs in early and mid-October (Figure 7 & Appendix Table 12). Daily and weekly
harvest levels drop off considerably during the H2 Period in November and December. In 2014,
and early onset of winter in early November resulted in a movement of geese south into Illinois.
In addition, considerable acreage of corn was not harvested before winter arrived reducing the
areas suitable for goose hunting. These 2 factors likely contributed to the decline in harvest
compared to 2013. Late season hunting opportunities were limited up to the season close
although there are relatively few active goose hunters in December. If this pattern is also
observed in 2015, we will likely eliminate the 2 time periods and just have one Horicon Zone
season permit in 2016.
0
500
1000
1500
2000
2500
3000
3500
4000
4500
5000
29-Aug 18-Sep 8-Oct 28-Oct 17-Nov 7-Dec 27-Dec
EarlyHarvest
ExteriorHarvest
20
While we incorporated harvest reporting in the Horicon Zone to the 1-800 system in 2014, we
continued the mail survey for one more year so that we could compare the two harvest estimates.
The mail survey estimated that harvest in the Horicon Zone at 3,590 geese which was 16%
higher than the 1-800 estimate of 3,027. This higher harvest estimate is likely a result of
unsuccessful Horicon hunters not returning their surveys which would bias the estimate high.
Nevertheless the two estimates are similar enough to allow us to compare the future estimates to
our past harvest history.
Figure 7
The areas directly adjacent to the Horicon Marsh National Wildlife Refuge and state Wildlife
Management area (portions of Dodge and Fond du Lac Counties) continue to represent a high
percentage of the Horicon zone harvest, with 93% occurring in these two counties alone. In the
past Winnebago and Columbia counties represent a significant portion of the zone’s area but
contribute relatively little to the harvest. For this reason we removed the area north of Hwy. 23
and west of Hwy 73 from the Horicon zone and designated it as part of the Exterior zone
effective in 2014.
In the first year of the size reduction of the Horicon Zone, it appear that harvest levels in that
area differ little from what was experienced across the state. The harvest success of Wisconsin
Canada goose hunters varies from year to year based on weather, crop harvest timing, migration
and goose populations. The overall statewide Canada goose harvest declined by 21% from 2013,
which is within normal variation, while counties that were part of the old Horicon Zone declined
0
20
40
60
80
100
120
140
160Period 1 Period 2
21
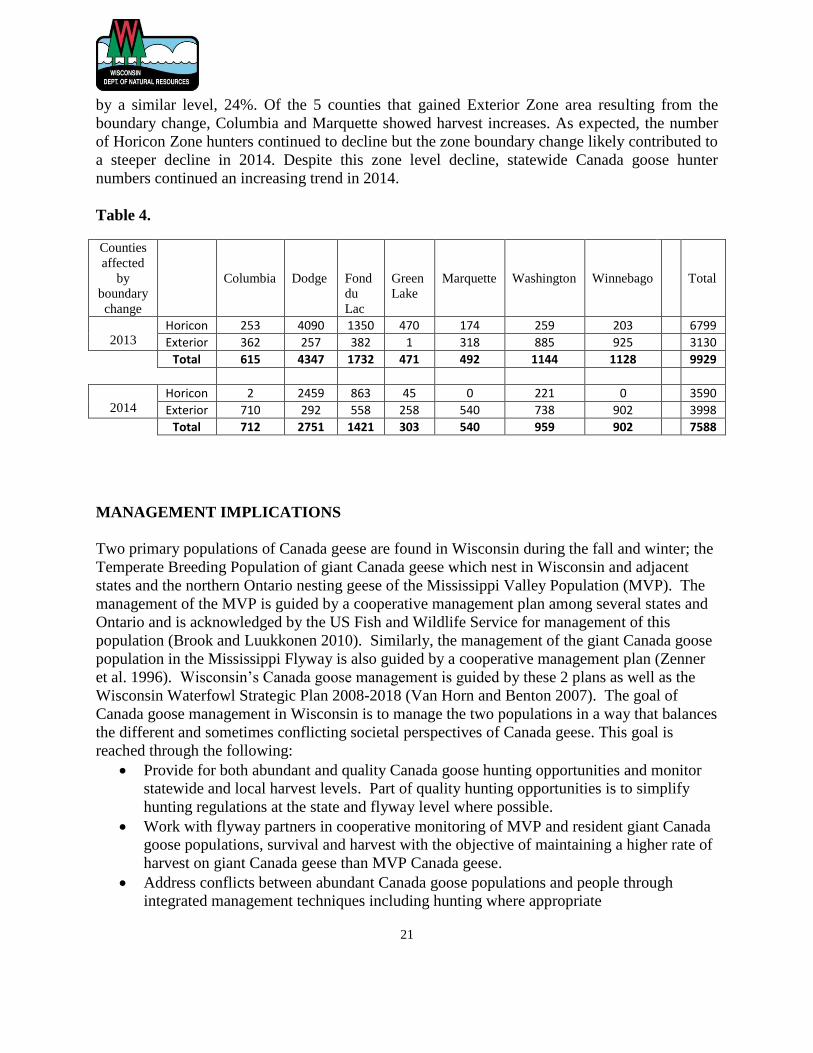
by a similar level, 24%. Of the 5 counties that gained Exterior Zone area resulting from the
boundary change, Columbia and Marquette showed harvest increases. As expected, the number
of Horicon Zone hunters continued to decline but the zone boundary change likely contributed to
a steeper decline in 2014. Despite this zone level decline, statewide Canada goose hunter
numbers continued an increasing trend in 2014.
Table 4.
Counties
affected
by
boundary
change
Columbia
Dodge
Fond
du
Lac
Green
Lake
Marquette
Washington
Winnebago
Total
2013 Horicon 253 4090 1350 470 174 259 203 6799
Exterior 362 257 382 1 318 885 925 3130 Total 615 4347 1732 471 492 1144 1128 9929
2014 Horicon 2 2459 863 45 0 221 0 3590
Exterior 710 292 558 258 540 738 902 3998 Total 712 2751 1421 303 540 959 902 7588
MANAGEMENT IMPLICATIONS
Two primary populations of Canada geese are found in Wisconsin during the fall and winter; the
Temperate Breeding Population of giant Canada geese which nest in Wisconsin and adjacent
states and the northern Ontario nesting geese of the Mississippi Valley Population (MVP). The
management of the MVP is guided by a cooperative management plan among several states and
Ontario and is acknowledged by the US Fish and Wildlife Service for management of this
population (Brook and Luukkonen 2010). Similarly, the management of the giant Canada goose
population in the Mississippi Flyway is also guided by a cooperative management plan (Zenner
et al. 1996). Wisconsin’s Canada goose management is guided by these 2 plans as well as the
Wisconsin Waterfowl Strategic Plan 2008-2018 (Van Horn and Benton 2007). The goal of
Canada goose management in Wisconsin is to manage the two populations in a way that balances
the different and sometimes conflicting societal perspectives of Canada geese. This goal is
reached through the following:
Provide for both abundant and quality Canada goose hunting opportunities and monitor
statewide and local harvest levels. Part of quality hunting opportunities is to simplify
hunting regulations at the state and flyway level where possible.
Work with flyway partners in cooperative monitoring of MVP and resident giant Canada
goose populations, survival and harvest with the objective of maintaining a higher rate of
harvest on giant Canada geese than MVP Canada geese.
Address conflicts between abundant Canada goose populations and people through
integrated management techniques including hunting where appropriate
22
Seek to manage the statewide Wisconsin breeding population of Canada geese near
125,000.
The monitoring of harvest as described in this report is an important part of implementing these
strategies along with annual population surveys, banding efforts and public input.
Mississippi Valley Population:
While giant Canada geese provide about 40% of Wisconsin’s regular Canada goose harvest and
nearly all of the early season harvest, Wisconsin is still dependent upon MVP Canada geese for
about 60% of our annual regular season goose harvest. This is in contrast to most other
Mississippi Flyway states where over 70% of their Canada goose harvest consists of resident
giant Canada geese. For example, Minnesota harvests over 90% resident geese and has a much
larger population of these birds, which is why regulations may vary even among neighboring
states. The MVP breeding population has been generally stable to slightly declining over the last
20 years. The rate of adult MVP harvest (not including crippling loss) was within or below the
targeted range of 8-10% from 2003-2013. However, in years with a late winter and poor nesting
conditions, the harvest rate on adult birds increased above this range because fewer young of the
year were in the fall flight.
To be consistent with the MVP management plan and in the long-term interest of maintaining the
MVP population as a sustainable resource, Wisconsin harvest management decisions need to
continue to take steps to maintain a relatively low harvest rate on MVP geese in the state. The
earlier opening of the Exterior zone Canada goose season provides for the high harvest in the
early part of the season but with a lower proportion of MVP geese. In addition, maintenance of a
2 bird daily bag limit when MVP are present in Wisconsin controls the rate of harvest on this
population. Daily harvest records allow us to document this high early harvest and schedule
season dates which reduce pressure on the MVP while maintaining an abundant harvest
opportunity. The mid-September opening of the Exterior zone season has allowed Wisconsin to
increase harvest but shift it away from the mid-October peak of MVP presence in the state.
Based on the variability of breeding ground conditions and the relatively low and stable harvest
rates, it appears that the MVP population change is driven primarily by breeding conditions and
not by harvest; however, because of periods of low recruitment there is still a need to remain
cautious about MVP harvest management.
The area around the Horicon Marsh contained within the Horicon zone remains a focal area of
MVP migration through Wisconsin, so a shift in harvest pressure from this area to other parts of
the state is helpful in reducing the harvest rate on this population. Over the last several years,
these harvest reports have shown a decline in Horicon zone hunter permits and harvest while
maintaining a quality hunting experience. Further, these reports have shown that few hunters
(~5%) fill the maximum harvest tags during the entire season demonstrating that this regulation
is not the limiting factor affecting harvest opportunity (Appendix Table 14). Despite the
restrictions, about 11.7% of the statewide regular season Canada goose harvest in 2014 came
from the 2 counties (out of 72) containing the Horicon Marsh (Dodge and Fond du Lac) so the
potential for a high Canada goose harvest in this area remains (Appendix Table 10). This

23
proportion was lower than the nearly 20% level observed in recent years because of the zone
boundary change.
Temperate Nesting Goose Population
During the last 20+ years, the Wisconsin nesting population of temperate nesting (also known as
TNP, resident or giant) Canada geese has grown and provided an additional hunting resource that
is more widely distributed around the state than the MVP. However, this increase has also
generated considerable conflict between abundant geese present year round and human outdoor
activities. Many of the same management strategies designed to reduce harvest on MVP are also
intended to provide hunters with an opportunity to harvest the abundant giant Canada goose
resource and help address human-goose conflicts. We have liberalized and simplified Canada
goose harvest regulations over the last several years, eliminated subzone restrictions and now
have the maximum number days (107) of Canada goose hunting allowed by international treaty.
The last five year average harvest rate on giant Canada geese in Wisconsin was over 21%,
indicating that our current season structure has been helping us reach our goal of increased
harvest pressure on locally nesting giant Canada geese. The 15 days of September hunting in
the early season now accounts for roughly 1/3 of the total statewide fall goose harvest. The
county level data shown in this report indicate that our early and Exterior zone Canada goose
hunting are highest in many of the same counties where our human population is highest and
where many Canada goose control operations are requested.
Agricultural crop damage from Canada geese, particularly during the spring continues to be a
concern for farmers in Wisconsin in areas where Canada geese concentrate. Consideration of
agricultural damage issues remains important in our overall approach to managing Wisconsin’s
Canada goose populations. The department can issue a spring agricultural damage permit for
those with eligible claims, which authorizes the removal of Canada geese by shooting from May
15-August 31. Applicants must have (or expect to have) crop damage in excess of $1000 and be
enrolled in the wildlife damage abatement and claims program. In 2014, 66 spring Canada goose
shooting permits were issued and 338 geese were killed.
Similarly, consideration of Canada goose problems in urban areas is another important aspect of
management of goose management in Wisconsin. Initially, many of the Wisconsin breeding
Canada geese were found in more suburban and urban counties, however, resident breeders
continue to increase in distribution across the state. As we monitor breeding populations and
harvest we can evaluate our effectiveness at using recreational harvest to assist in managing
problems that result from concentrations of Canada geese in urban areas. To target these birds in
the fall, the early Canada goose season remains an important part of our management strategy
and contributes a significant proportion of the overall harvest. In addition, site specific Canada
goose control measures (nest and egg control, adult take) will continue to be implemented in
some areas to mitigate nuisance goose problems. The nuisance goose control efforts of US
Department of Agriculture - Wildlife Services staff resulted in the removal of 1,521 adult and
juvenile Canada geese at 27 sites in 2014; with the majority of these removals occurring in urban
centers where hunting does not sufficiently address these urban goose conflicts (Lovell, 2014).
Beginning in 2010, in addition to the federal requirement, Wisconsin added its own mandatory
24
reporting for nest and egg depredation permits to better monitor control efforts around the state.
In 2014, 118 nest and egg depredation permits were issued with 607 nests treated.
CITATIONS
Brook, R. and J. Hughes. June 2014. 2014 Preliminary Spring Survey Results for MVP Canada
Geese. Ontario Ministry of Natural Resources and Canadian Wildlife Service.
Brook, R.W. and D.R. Luukkonen. 2010. A Management Plan for the Mississippi Valley
Population of Canada geese. Mississippi Flyway Council Technical Section. 43pp.
Leafloor, J.O., K. F. Abraham, F. D. Caswell, K. E. Gamble, R. N. Helm, D. D. Humburg, J. S.
Lawerence, D. R. Luukkonen, R. D. Pritchert, E. L. Warr, G. G. Zenner. 2003. Canada
goose management in the Mississippi Flyway. Pages 22-36 in T. J. Moser, R. D. Lien, K.
C. VerCauteren, K. F. Abraham, D. E. Andersen, J. G. Bruggink, J. M. Coluccy, D. A.
Graber, J. O. Leafloor, D. R. Luukkonen, R. E. Trost, editors. Proceedings of the 2003
International Canada Goose Symposium, Madison, WI. USA.
Lovell, C. 2014. Canada Goose Summary Report for Wisconsin Department of Natural
Resources 2014. USDA Wildlife Services. 9pp.
Miller, S.W. 1998. The biopolitics of Mississippi Valley Population Canada geese management:
the Wisconsin perspective. Pages 467-474 in D.H. Rusch, M. D. Samuel, D.D.
Humburg, and B.D. Sullivan, editors. Biology and management of Canada geese.
Proceedings of the international Canada Goose Symposium, Milwaukee, Wisconsin,
USA.
Van Horn, K., T. Finger, and R. Gatti. 2014. Waterfowl Breeding Population Survey for
Wisconsin, 1973-2012. Wisconsin Department of Natural Resources. 31pp.
Van Horn, K. and K. Benton. 2007. Wisconsin Waterfowl Strategic Plan 2008-2018. Wisconsin
Department of Natural Resources publication. Madison, WI. 56pp.
Wisconsin Department of Natural Resources. 1980. Canada Goose Management Plan for East
Central Wisconsin 1980-1990.
Zenner, G., J. Levengood, B. Williamson, R. Marshalla, R. Bielefeld, M. Hartman, M. Morton,
M. Gillespie, J. Johnson, T. Landwehr, D. Graber, G. Tori, K. Abraham, E. Warr, B.
Wheeler, B. Montgomery, and D. Rusch. 1996. Mississippi Flyway Giant Canada
Goose Management Plan. Mississippi Flyway Council Technical Section. 65pp.
25
26
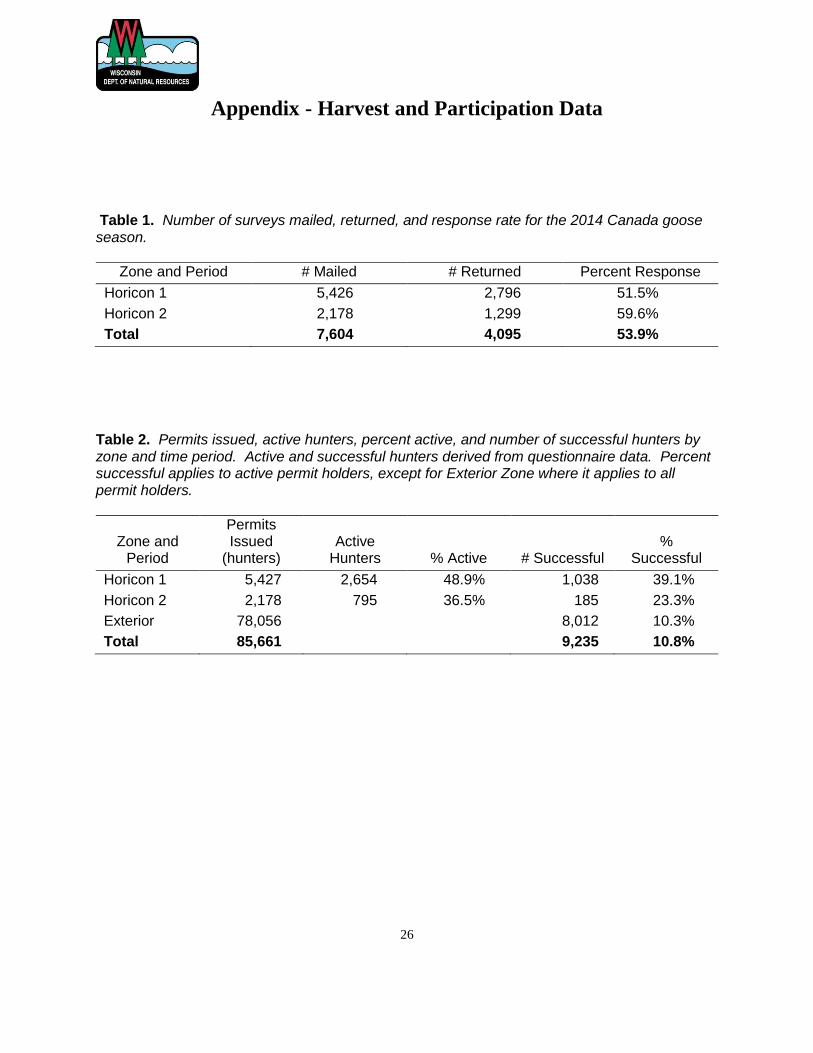
Appendix - Harvest and Participation Data
Table 1. Number of surveys mailed, returned, and response rate for the 2014 Canada goose season.
Zone and Period # Mailed # Returned Percent Response
Horicon 1 5,426 2,796 51.5%
Horicon 2 2,178 1,299 59.6%
Total 7,604 4,095 53.9%
Table 2. Permits issued, active hunters, percent active, and number of successful hunters by zone and time period. Active and successful hunters derived from questionnaire data. Percent successful applies to active permit holders, except for Exterior Zone where it applies to all permit holders.
Zone and Period
Permits Issued
(hunters) Active
Hunters % Active # Successful %
Successful
Horicon 1 5,427 2,654 48.9% 1,038 39.1%
Horicon 2 2,178 795 36.5% 185 23.3%
Exterior 78,056 8,012 10.3%
Total 85,661 9,235 10.8%
27
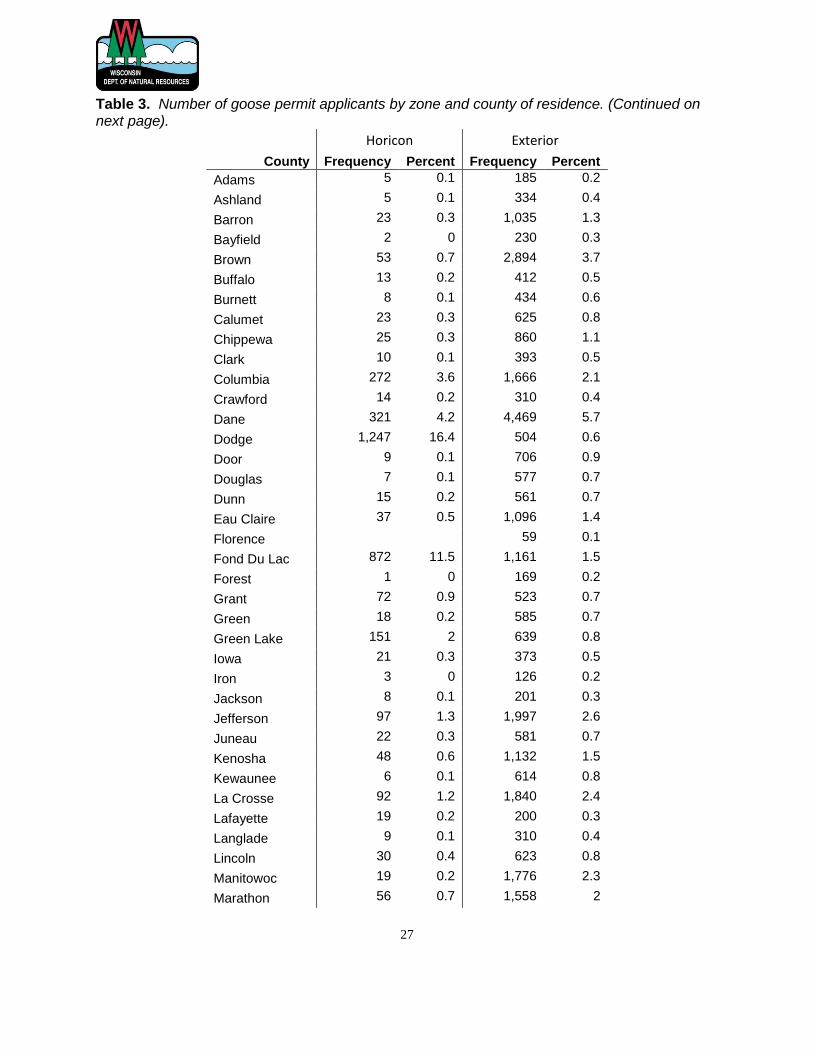
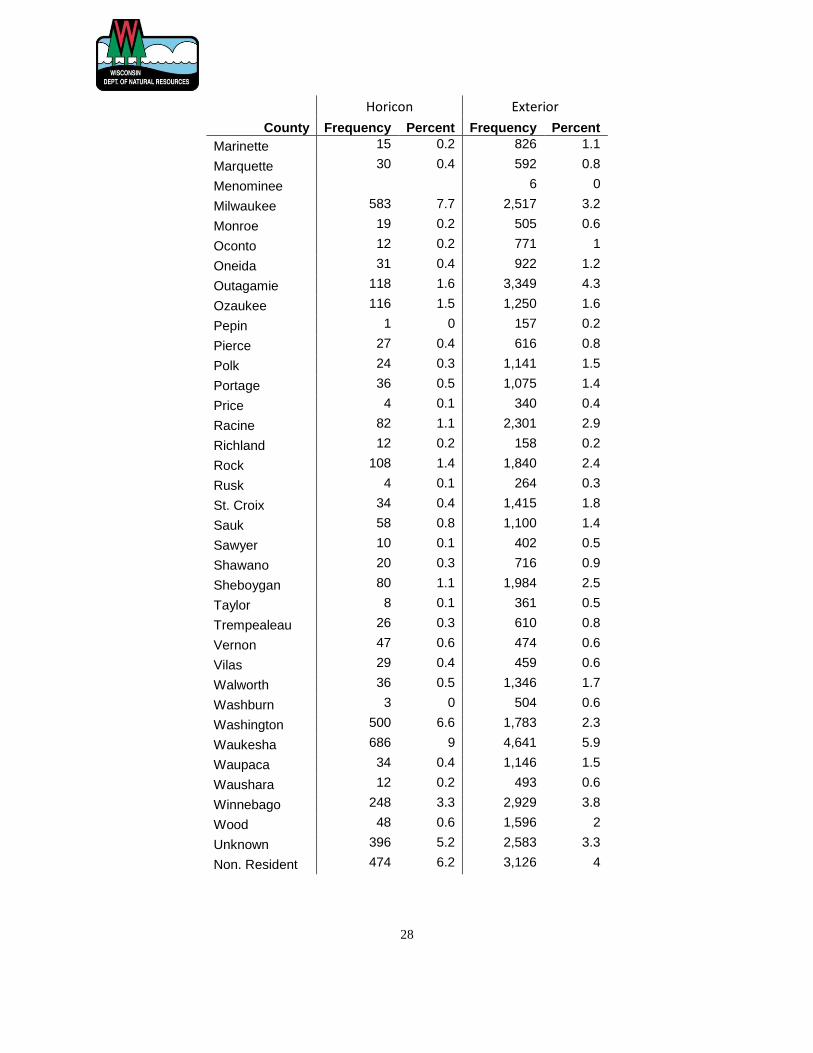
Table 3. Number of goose permit applicants by zone and county of residence. (Continued on next page).
Horicon Exterior
County Frequency Percent Frequency Percent
Adams 5 0.1 185 0.2
Ashland 5 0.1 334 0.4
Barron 23 0.3 1,035 1.3
Bayfield 2 0 230 0.3
Brown 53 0.7 2,894 3.7
Buffalo 13 0.2 412 0.5
Burnett 8 0.1 434 0.6
Calumet 23 0.3 625 0.8
Chippewa 25 0.3 860 1.1
Clark 10 0.1 393 0.5
Columbia 272 3.6 1,666 2.1
Crawford 14 0.2 310 0.4
Dane 321 4.2 4,469 5.7
Dodge 1,247 16.4 504 0.6
Door 9 0.1 706 0.9
Douglas 7 0.1 577 0.7
Dunn 15 0.2 561 0.7
Eau Claire 37 0.5 1,096 1.4
Florence 59 0.1
Fond Du Lac 872 11.5 1,161 1.5
Forest 1 0 169 0.2
Grant 72 0.9 523 0.7
Green 18 0.2 585 0.7
Green Lake 151 2 639 0.8
Iowa 21 0.3 373 0.5
Iron 3 0 126 0.2
Jackson 8 0.1 201 0.3
Jefferson 97 1.3 1,997 2.6
Juneau 22 0.3 581 0.7
Kenosha 48 0.6 1,132 1.5
Kewaunee 6 0.1 614 0.8
La Crosse 92 1.2 1,840 2.4
Lafayette 19 0.2 200 0.3
Langlade 9 0.1 310 0.4
Lincoln 30 0.4 623 0.8
Manitowoc 19 0.2 1,776 2.3
Marathon 56 0.7 1,558 2
28
Horicon Exterior
County Frequency Percent Frequency Percent
Marinette 15 0.2 826 1.1
Marquette 30 0.4 592 0.8
Menominee 6 0
Milwaukee 583 7.7 2,517 3.2
Monroe 19 0.2 505 0.6
Oconto 12 0.2 771 1
Oneida 31 0.4 922 1.2
Outagamie 118 1.6 3,349 4.3
Ozaukee 116 1.5 1,250 1.6
Pepin 1 0 157 0.2
Pierce 27 0.4 616 0.8
Polk 24 0.3 1,141 1.5
Portage 36 0.5 1,075 1.4
Price 4 0.1 340 0.4
Racine 82 1.1 2,301 2.9
Richland 12 0.2 158 0.2
Rock 108 1.4 1,840 2.4
Rusk 4 0.1 264 0.3
St. Croix 34 0.4 1,415 1.8
Sauk 58 0.8 1,100 1.4
Sawyer 10 0.1 402 0.5
Shawano 20 0.3 716 0.9
Sheboygan 80 1.1 1,984 2.5
Taylor 8 0.1 361 0.5
Trempealeau 26 0.3 610 0.8
Vernon 47 0.6 474 0.6
Vilas 29 0.4 459 0.6
Walworth 36 0.5 1,346 1.7
Washburn 3 0 504 0.6
Washington 500 6.6 1,783 2.3
Waukesha 686 9 4,641 5.9
Waupaca 34 0.4 1,146 1.5
Waushara 12 0.2 493 0.6
Winnebago 248 3.3 2,929 3.8
Wood 48 0.6 1,596 2
Unknown 396 5.2 2,583 3.3
Non. Resident 474 6.2 3,126 4

29
Table 4. Goose hunting in past zones.
Current Zone Past Horicon Past Exterior
Horicon 92.7% 7.3%
Table 5. Percent hunting geese in 2014 that also hunted in 2013.
Zone % That Hunted in 2013
Horicon 84.3%
Table 6. Past and present duck hunting by goose permit.
Zone Duck Hunted in 2013 Duck Hunted in 2014
Horicon 60.8% 73.5%
Table 7. Mean number of hunting trips by zone and time period. Applies to active permit holders only.
Zone/Period Mean # of Trips Maximum # of Trips
Horicon 1 4.7 33
Horicon 2 4.0 30
30
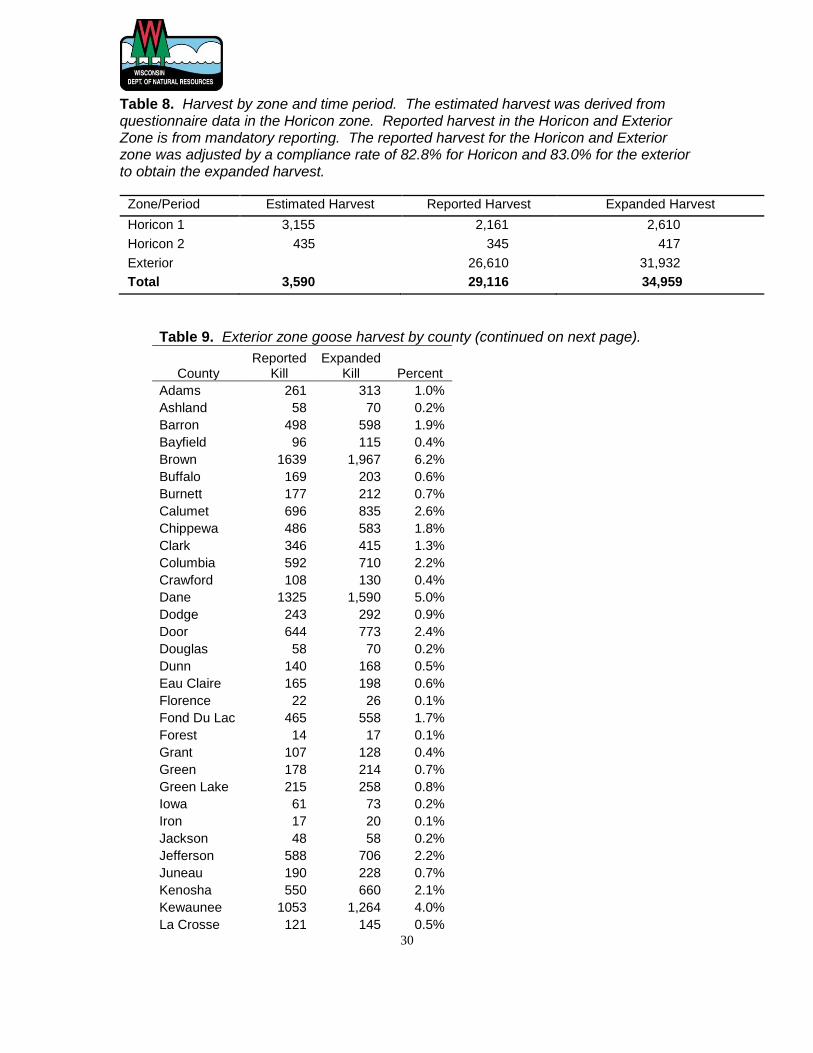
Table 8. Harvest by zone and time period. The estimated harvest was derived from questionnaire data in the Horicon zone. Reported harvest in the Horicon and Exterior Zone is from mandatory reporting. The reported harvest for the Horicon and Exterior zone was adjusted by a compliance rate of 82.8% for Horicon and 83.0% for the exterior to obtain the expanded harvest.
Zone/Period Estimated Harvest Reported Harvest Expanded Harvest
Horicon 1 3,155 2,161 2,610
Horicon 2 435 345 417
Exterior 26,610 31,932
Total 3,590 29,116 34,959
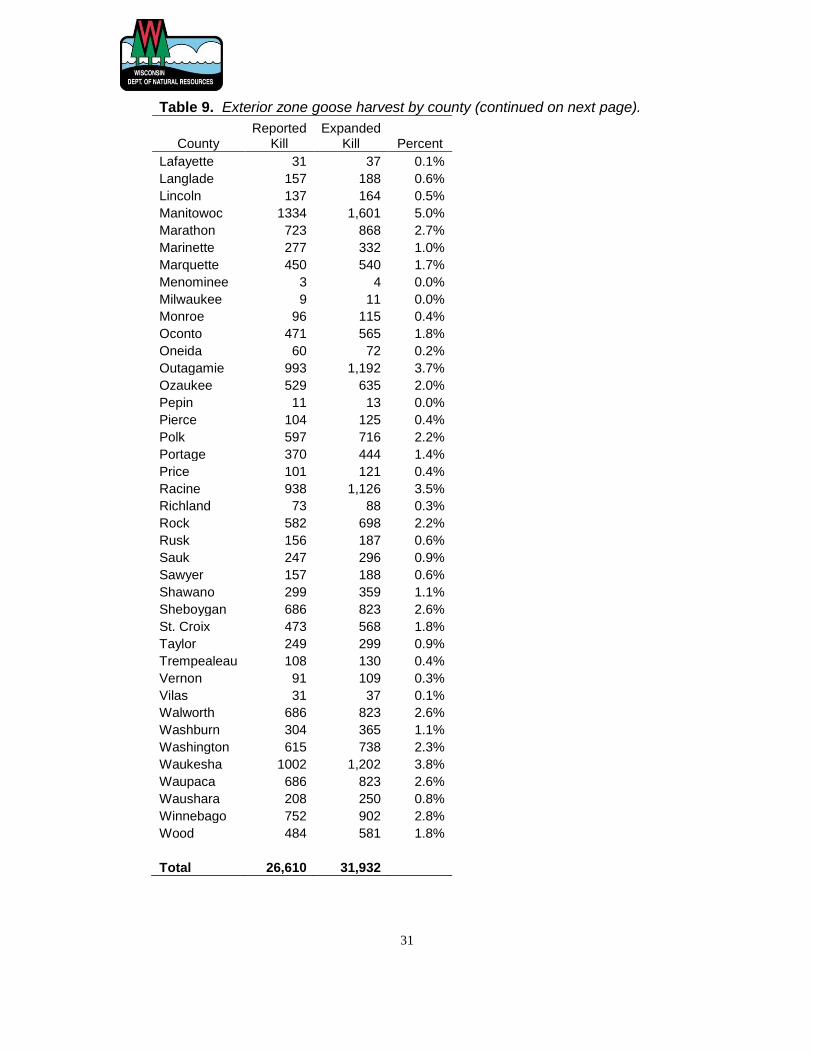
Table 9. Exterior zone goose harvest by county (continued on next page).
County Reported
Kill Expanded
Kill Percent
Adams 261 313 1.0%
Ashland 58 70 0.2%
Barron 498 598 1.9%
Bayfield 96 115 0.4%
Brown 1639 1,967 6.2%
Buffalo 169 203 0.6%
Burnett 177 212 0.7%
Calumet 696 835 2.6%
Chippewa 486 583 1.8%
Clark 346 415 1.3%
Columbia 592 710 2.2%
Crawford 108 130 0.4%
Dane 1325 1,590 5.0%
Dodge 243 292 0.9%
Door 644 773 2.4%
Douglas 58 70 0.2%
Dunn 140 168 0.5%
Eau Claire 165 198 0.6%
Florence 22 26 0.1%
Fond Du Lac 465 558 1.7%
Forest 14 17 0.1%
Grant 107 128 0.4%
Green 178 214 0.7%
Green Lake 215 258 0.8%
Iowa 61 73 0.2%
Iron 17 20 0.1%
Jackson 48 58 0.2%
Jefferson 588 706 2.2%
Juneau 190 228 0.7%
Kenosha 550 660 2.1%
Kewaunee 1053 1,264 4.0%
La Crosse 121 145 0.5%
31
Table 9. Exterior zone goose harvest by county (continued on next page).
County Reported
Kill Expanded
Kill Percent
Lafayette 31 37 0.1%
Langlade 157 188 0.6%
Lincoln 137 164 0.5%
Manitowoc 1334 1,601 5.0%
Marathon 723 868 2.7%
Marinette 277 332 1.0%
Marquette 450 540 1.7%
Menominee 3 4 0.0%
Milwaukee 9 11 0.0%
Monroe 96 115 0.4%
Oconto 471 565 1.8%
Oneida 60 72 0.2%
Outagamie 993 1,192 3.7%
Ozaukee 529 635 2.0%
Pepin 11 13 0.0%
Pierce 104 125 0.4%
Polk 597 716 2.2%
Portage 370 444 1.4%
Price 101 121 0.4%
Racine 938 1,126 3.5%
Richland 73 88 0.3%
Rock 582 698 2.2%
Rusk 156 187 0.6%
Sauk 247 296 0.9%
Sawyer 157 188 0.6%
Shawano 299 359 1.1%
Sheboygan 686 823 2.6%
St. Croix 473 568 1.8%
Taylor 249 299 0.9%
Trempealeau 108 130 0.4%
Vernon 91 109 0.3%
Vilas 31 37 0.1%
Walworth 686 823 2.6%
Washburn 304 365 1.1%
Washington 615 738 2.3%
Waukesha 1002 1,202 3.8%
Waupaca 686 823 2.6%
Waushara 208 250 0.8%
Winnebago 752 902 2.8%
Wood 484 581 1.8%
Total 26,610 31,932
32
Table 10. Horicon Zone goose harvest by county. The estimated harvest was derived from questionnaire data.
County Total Estimated Harvest % of Harvest
Columbia 2 0.1%
Dodge 2,459 68.5%
Fond du lac 863 24.0%
Green Lake 45 1.3%
Washington 221 6.2%
Total 3,590
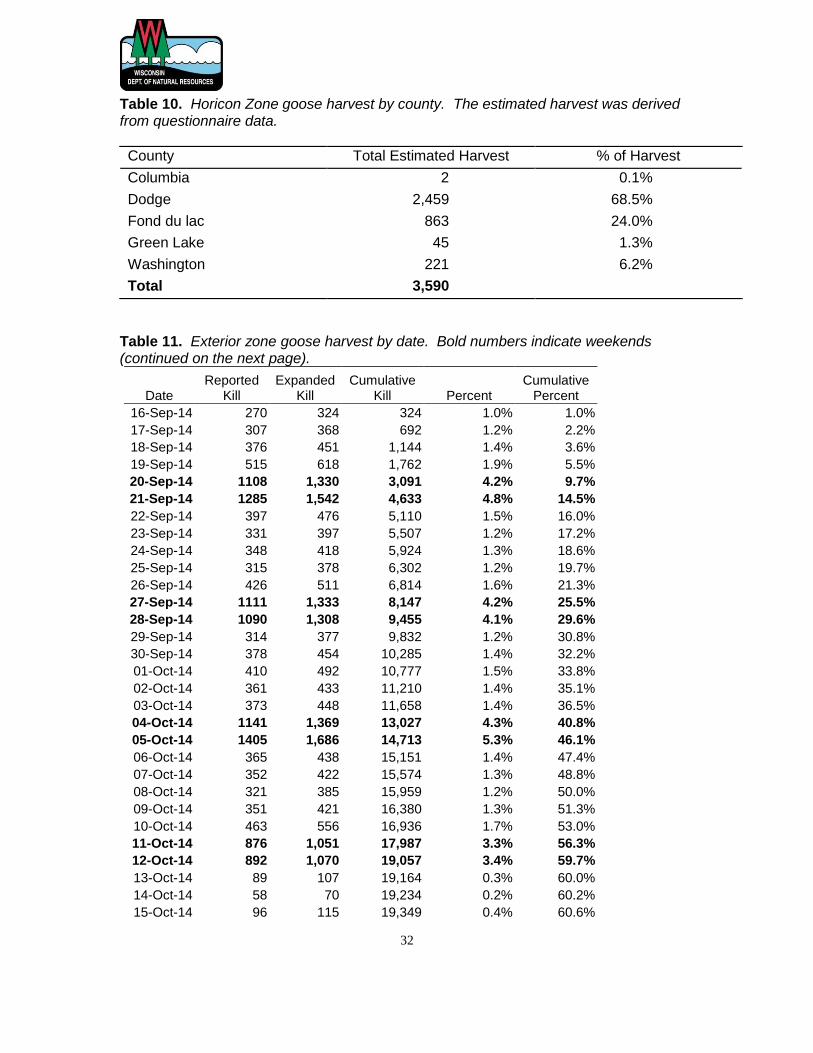
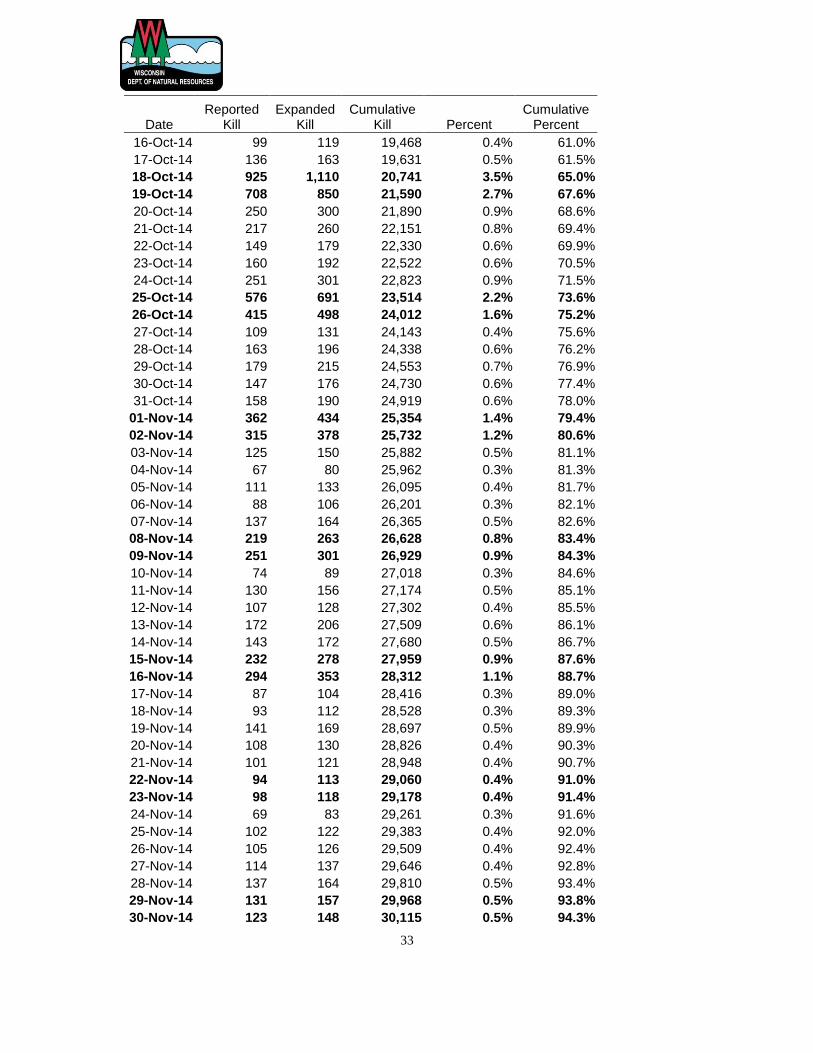
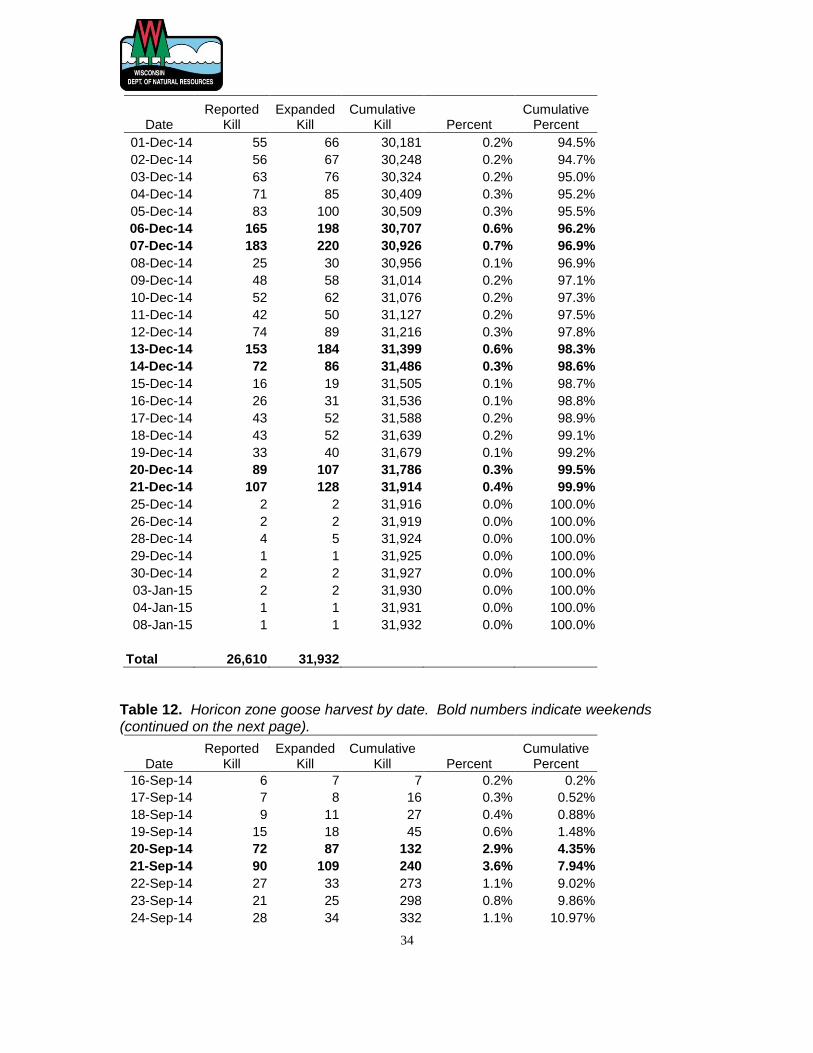
Table 11. Exterior zone goose harvest by date. Bold numbers indicate weekends (continued on the next page).
Date Reported
Kill Expanded
Kill Cumulative
Kill Percent Cumulative
Percent
16-Sep-14 270 324 324 1.0% 1.0%
17-Sep-14 307 368 692 1.2% 2.2%
18-Sep-14 376 451 1,144 1.4% 3.6%
19-Sep-14 515 618 1,762 1.9% 5.5%
20-Sep-14 1108 1,330 3,091 4.2% 9.7%
21-Sep-14 1285 1,542 4,633 4.8% 14.5%
22-Sep-14 397 476 5,110 1.5% 16.0%
23-Sep-14 331 397 5,507 1.2% 17.2%
24-Sep-14 348 418 5,924 1.3% 18.6%
25-Sep-14 315 378 6,302 1.2% 19.7%
26-Sep-14 426 511 6,814 1.6% 21.3%
27-Sep-14 1111 1,333 8,147 4.2% 25.5%
28-Sep-14 1090 1,308 9,455 4.1% 29.6%
29-Sep-14 314 377 9,832 1.2% 30.8%
30-Sep-14 378 454 10,285 1.4% 32.2%
01-Oct-14 410 492 10,777 1.5% 33.8%
02-Oct-14 361 433 11,210 1.4% 35.1%
03-Oct-14 373 448 11,658 1.4% 36.5%
04-Oct-14 1141 1,369 13,027 4.3% 40.8%
05-Oct-14 1405 1,686 14,713 5.3% 46.1%
06-Oct-14 365 438 15,151 1.4% 47.4%
07-Oct-14 352 422 15,574 1.3% 48.8%
08-Oct-14 321 385 15,959 1.2% 50.0%
09-Oct-14 351 421 16,380 1.3% 51.3%
10-Oct-14 463 556 16,936 1.7% 53.0%
11-Oct-14 876 1,051 17,987 3.3% 56.3%
12-Oct-14 892 1,070 19,057 3.4% 59.7%
13-Oct-14 89 107 19,164 0.3% 60.0%
14-Oct-14 58 70 19,234 0.2% 60.2%
15-Oct-14 96 115 19,349 0.4% 60.6%
33
Date Reported
Kill Expanded
Kill Cumulative
Kill Percent Cumulative
Percent
16-Oct-14 99 119 19,468 0.4% 61.0%
17-Oct-14 136 163 19,631 0.5% 61.5%
18-Oct-14 925 1,110 20,741 3.5% 65.0%
19-Oct-14 708 850 21,590 2.7% 67.6%
20-Oct-14 250 300 21,890 0.9% 68.6%
21-Oct-14 217 260 22,151 0.8% 69.4%
22-Oct-14 149 179 22,330 0.6% 69.9%
23-Oct-14 160 192 22,522 0.6% 70.5%
24-Oct-14 251 301 22,823 0.9% 71.5%
25-Oct-14 576 691 23,514 2.2% 73.6%
26-Oct-14 415 498 24,012 1.6% 75.2%
27-Oct-14 109 131 24,143 0.4% 75.6%
28-Oct-14 163 196 24,338 0.6% 76.2%
29-Oct-14 179 215 24,553 0.7% 76.9%
30-Oct-14 147 176 24,730 0.6% 77.4%
31-Oct-14 158 190 24,919 0.6% 78.0%
01-Nov-14 362 434 25,354 1.4% 79.4%
02-Nov-14 315 378 25,732 1.2% 80.6%
03-Nov-14 125 150 25,882 0.5% 81.1%
04-Nov-14 67 80 25,962 0.3% 81.3%
05-Nov-14 111 133 26,095 0.4% 81.7%
06-Nov-14 88 106 26,201 0.3% 82.1%
07-Nov-14 137 164 26,365 0.5% 82.6%
08-Nov-14 219 263 26,628 0.8% 83.4%
09-Nov-14 251 301 26,929 0.9% 84.3%
10-Nov-14 74 89 27,018 0.3% 84.6%
11-Nov-14 130 156 27,174 0.5% 85.1%
12-Nov-14 107 128 27,302 0.4% 85.5%
13-Nov-14 172 206 27,509 0.6% 86.1%
14-Nov-14 143 172 27,680 0.5% 86.7%
15-Nov-14 232 278 27,959 0.9% 87.6%
16-Nov-14 294 353 28,312 1.1% 88.7%
17-Nov-14 87 104 28,416 0.3% 89.0%
18-Nov-14 93 112 28,528 0.3% 89.3%
19-Nov-14 141 169 28,697 0.5% 89.9%
20-Nov-14 108 130 28,826 0.4% 90.3%
21-Nov-14 101 121 28,948 0.4% 90.7%
22-Nov-14 94 113 29,060 0.4% 91.0%
23-Nov-14 98 118 29,178 0.4% 91.4%
24-Nov-14 69 83 29,261 0.3% 91.6%
25-Nov-14 102 122 29,383 0.4% 92.0%
26-Nov-14 105 126 29,509 0.4% 92.4%
27-Nov-14 114 137 29,646 0.4% 92.8%
28-Nov-14 137 164 29,810 0.5% 93.4%
29-Nov-14 131 157 29,968 0.5% 93.8%
30-Nov-14 123 148 30,115 0.5% 94.3%
34
Date Reported
Kill Expanded
Kill Cumulative
Kill Percent Cumulative
Percent
01-Dec-14 55 66 30,181 0.2% 94.5%
02-Dec-14 56 67 30,248 0.2% 94.7%
03-Dec-14 63 76 30,324 0.2% 95.0%
04-Dec-14 71 85 30,409 0.3% 95.2%
05-Dec-14 83 100 30,509 0.3% 95.5%
06-Dec-14 165 198 30,707 0.6% 96.2%
07-Dec-14 183 220 30,926 0.7% 96.9%
08-Dec-14 25 30 30,956 0.1% 96.9%
09-Dec-14 48 58 31,014 0.2% 97.1%
10-Dec-14 52 62 31,076 0.2% 97.3%
11-Dec-14 42 50 31,127 0.2% 97.5%
12-Dec-14 74 89 31,216 0.3% 97.8%
13-Dec-14 153 184 31,399 0.6% 98.3%
14-Dec-14 72 86 31,486 0.3% 98.6%
15-Dec-14 16 19 31,505 0.1% 98.7%
16-Dec-14 26 31 31,536 0.1% 98.8%
17-Dec-14 43 52 31,588 0.2% 98.9%
18-Dec-14 43 52 31,639 0.2% 99.1%
19-Dec-14 33 40 31,679 0.1% 99.2%
20-Dec-14 89 107 31,786 0.3% 99.5%
21-Dec-14 107 128 31,914 0.4% 99.9%
25-Dec-14 2 2 31,916 0.0% 100.0%
26-Dec-14 2 2 31,919 0.0% 100.0%
28-Dec-14 4 5 31,924 0.0% 100.0%
29-Dec-14 1 1 31,925 0.0% 100.0%
30-Dec-14 2 2 31,927 0.0% 100.0%
03-Jan-15 2 2 31,930 0.0% 100.0%
04-Jan-15 1 1 31,931 0.0% 100.0%
08-Jan-15 1 1 31,932 0.0% 100.0%
Total 26,610 31,932
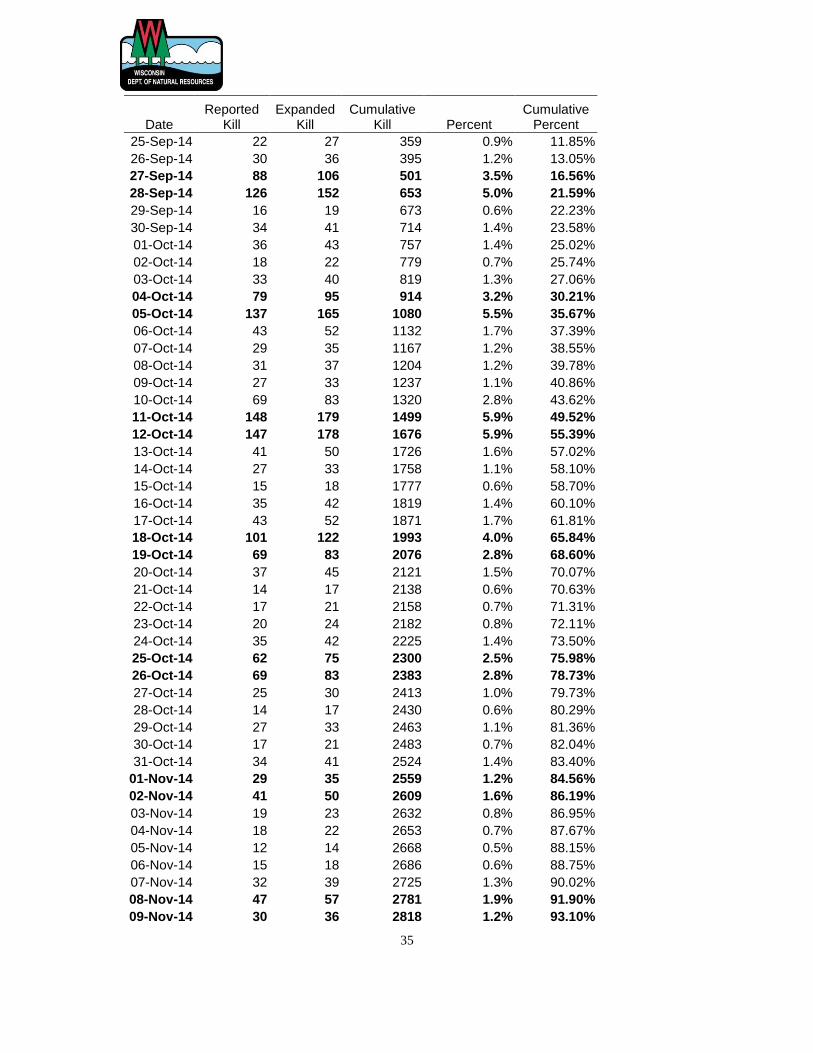
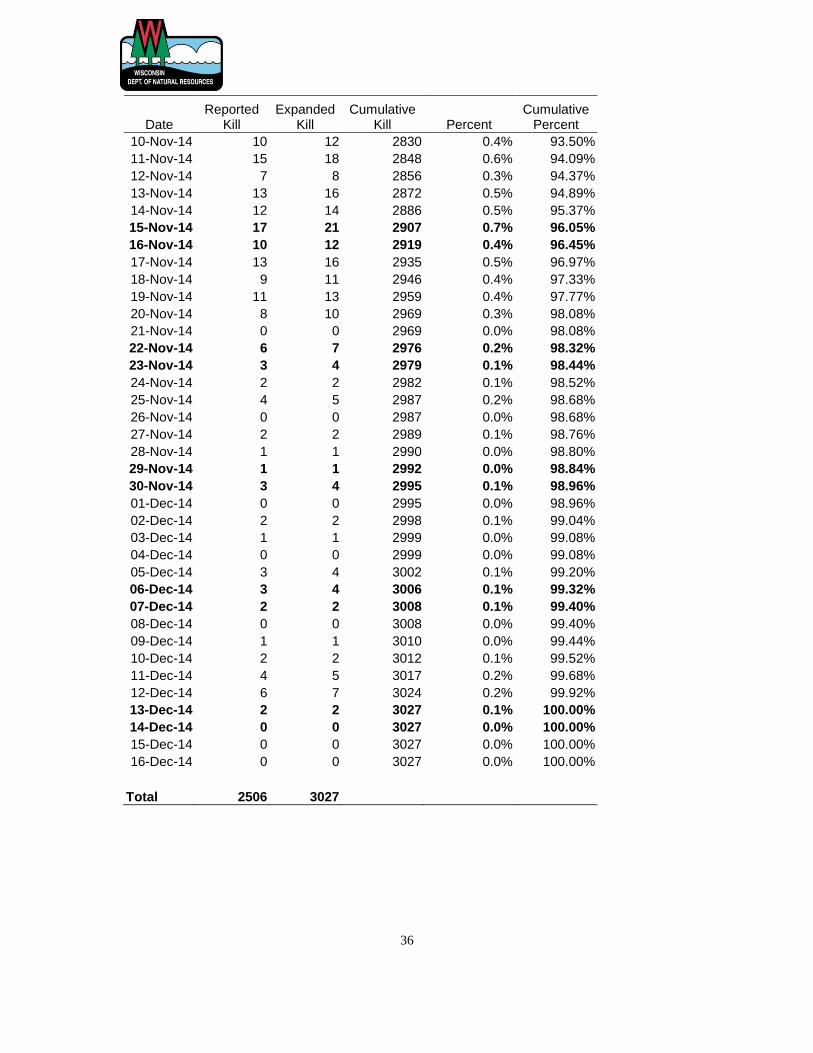
Table 12. Horicon zone goose harvest by date. Bold numbers indicate weekends (continued on the next page).
Date Reported
Kill Expanded
Kill Cumulative
Kill Percent Cumulative
Percent
16-Sep-14 6 7 7 0.2% 0.2%
17-Sep-14 7 8 16 0.3% 0.52%
18-Sep-14 9 11 27 0.4% 0.88%
19-Sep-14 15 18 45 0.6% 1.48%
20-Sep-14 72 87 132 2.9% 4.35%
21-Sep-14 90 109 240 3.6% 7.94%
22-Sep-14 27 33 273 1.1% 9.02%
23-Sep-14 21 25 298 0.8% 9.86%
24-Sep-14 28 34 332 1.1% 10.97%
35
Date Reported
Kill Expanded
Kill Cumulative
Kill Percent Cumulative
Percent
25-Sep-14 22 27 359 0.9% 11.85%
26-Sep-14 30 36 395 1.2% 13.05%
27-Sep-14 88 106 501 3.5% 16.56%
28-Sep-14 126 152 653 5.0% 21.59%
29-Sep-14 16 19 673 0.6% 22.23%
30-Sep-14 34 41 714 1.4% 23.58%
01-Oct-14 36 43 757 1.4% 25.02%
02-Oct-14 18 22 779 0.7% 25.74%
03-Oct-14 33 40 819 1.3% 27.06%
04-Oct-14 79 95 914 3.2% 30.21%
05-Oct-14 137 165 1080 5.5% 35.67%
06-Oct-14 43 52 1132 1.7% 37.39%
07-Oct-14 29 35 1167 1.2% 38.55%
08-Oct-14 31 37 1204 1.2% 39.78%
09-Oct-14 27 33 1237 1.1% 40.86%
10-Oct-14 69 83 1320 2.8% 43.62%
11-Oct-14 148 179 1499 5.9% 49.52%
12-Oct-14 147 178 1676 5.9% 55.39%
13-Oct-14 41 50 1726 1.6% 57.02%
14-Oct-14 27 33 1758 1.1% 58.10%
15-Oct-14 15 18 1777 0.6% 58.70%
16-Oct-14 35 42 1819 1.4% 60.10%
17-Oct-14 43 52 1871 1.7% 61.81%
18-Oct-14 101 122 1993 4.0% 65.84%
19-Oct-14 69 83 2076 2.8% 68.60%
20-Oct-14 37 45 2121 1.5% 70.07%
21-Oct-14 14 17 2138 0.6% 70.63%
22-Oct-14 17 21 2158 0.7% 71.31%
23-Oct-14 20 24 2182 0.8% 72.11%
24-Oct-14 35 42 2225 1.4% 73.50%
25-Oct-14 62 75 2300 2.5% 75.98%
26-Oct-14 69 83 2383 2.8% 78.73%
27-Oct-14 25 30 2413 1.0% 79.73%
28-Oct-14 14 17 2430 0.6% 80.29%
29-Oct-14 27 33 2463 1.1% 81.36%
30-Oct-14 17 21 2483 0.7% 82.04%
31-Oct-14 34 41 2524 1.4% 83.40%
01-Nov-14 29 35 2559 1.2% 84.56%
02-Nov-14 41 50 2609 1.6% 86.19%
03-Nov-14 19 23 2632 0.8% 86.95%
04-Nov-14 18 22 2653 0.7% 87.67%
05-Nov-14 12 14 2668 0.5% 88.15%
06-Nov-14 15 18 2686 0.6% 88.75%
07-Nov-14 32 39 2725 1.3% 90.02%
08-Nov-14 47 57 2781 1.9% 91.90%
09-Nov-14 30 36 2818 1.2% 93.10%
36
Date Reported
Kill Expanded
Kill Cumulative
Kill Percent Cumulative
Percent
10-Nov-14 10 12 2830 0.4% 93.50%
11-Nov-14 15 18 2848 0.6% 94.09%
12-Nov-14 7 8 2856 0.3% 94.37%
13-Nov-14 13 16 2872 0.5% 94.89%
14-Nov-14 12 14 2886 0.5% 95.37%
15-Nov-14 17 21 2907 0.7% 96.05%
16-Nov-14 10 12 2919 0.4% 96.45%
17-Nov-14 13 16 2935 0.5% 96.97%
18-Nov-14 9 11 2946 0.4% 97.33%
19-Nov-14 11 13 2959 0.4% 97.77%
20-Nov-14 8 10 2969 0.3% 98.08%
21-Nov-14 0 0 2969 0.0% 98.08%
22-Nov-14 6 7 2976 0.2% 98.32%
23-Nov-14 3 4 2979 0.1% 98.44%
24-Nov-14 2 2 2982 0.1% 98.52%
25-Nov-14 4 5 2987 0.2% 98.68%
26-Nov-14 0 0 2987 0.0% 98.68%
27-Nov-14 2 2 2989 0.1% 98.76%
28-Nov-14 1 1 2990 0.0% 98.80%
29-Nov-14 1 1 2992 0.0% 98.84%
30-Nov-14 3 4 2995 0.1% 98.96%
01-Dec-14 0 0 2995 0.0% 98.96%
02-Dec-14 2 2 2998 0.1% 99.04%
03-Dec-14 1 1 2999 0.0% 99.08%
04-Dec-14 0 0 2999 0.0% 99.08%
05-Dec-14 3 4 3002 0.1% 99.20%
06-Dec-14 3 4 3006 0.1% 99.32%
07-Dec-14 2 2 3008 0.1% 99.40%
08-Dec-14 0 0 3008 0.0% 99.40%
09-Dec-14 1 1 3010 0.0% 99.44%
10-Dec-14 2 2 3012 0.1% 99.52%
11-Dec-14 4 5 3017 0.2% 99.68%
12-Dec-14 6 7 3024 0.2% 99.92%
13-Dec-14 2 2 3027 0.1% 100.00%
14-Dec-14 0 0 3027 0.0% 100.00%
15-Dec-14 0 0 3027 0.0% 100.00%
16-Dec-14 0 0 3027 0.0% 100.00%
Total 2506 3027
37
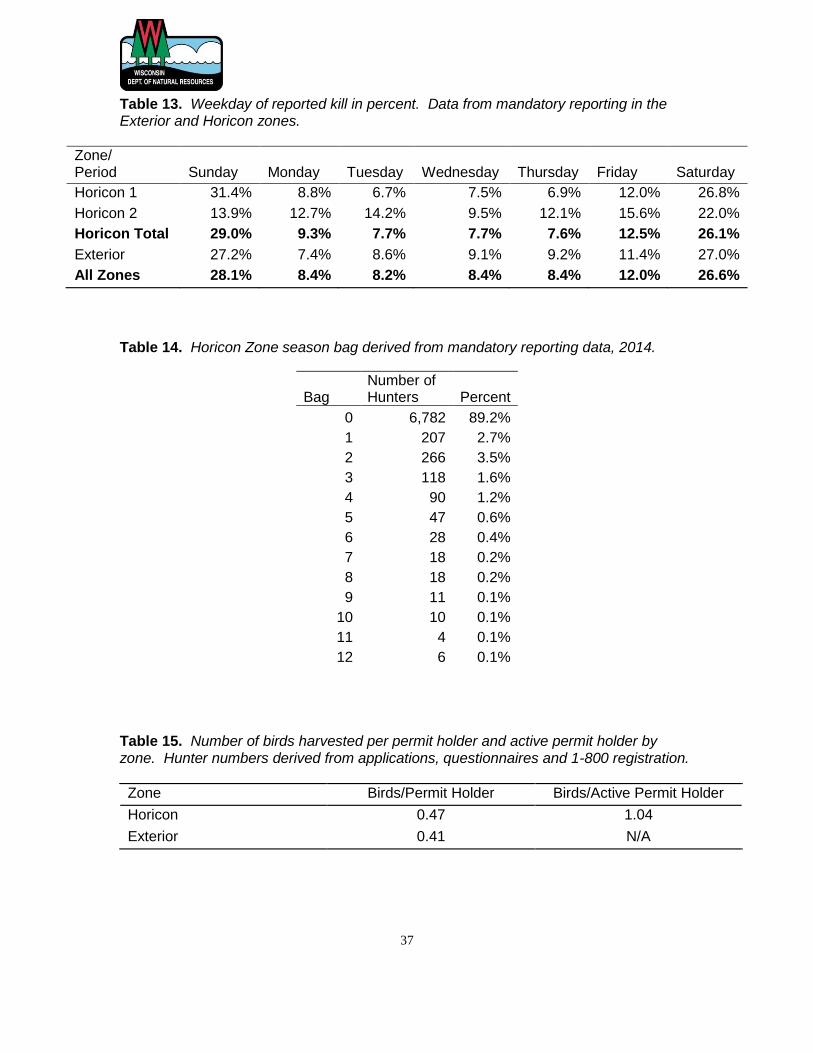
Table 13. Weekday of reported kill in percent. Data from mandatory reporting in the Exterior and Horicon zones.
Zone/ Period Sunday Monday Tuesday Wednesday Thursday Friday Saturday
Horicon 1 31.4% 8.8% 6.7% 7.5% 6.9% 12.0% 26.8%
Horicon 2 13.9% 12.7% 14.2% 9.5% 12.1% 15.6% 22.0%
Horicon Total 29.0% 9.3% 7.7% 7.7% 7.6% 12.5% 26.1%
Exterior 27.2% 7.4% 8.6% 9.1% 9.2% 11.4% 27.0%
All Zones 28.1% 8.4% 8.2% 8.4% 8.4% 12.0% 26.6%
Table 14. Horicon Zone season bag derived from mandatory reporting data, 2014.
Bag Number of Hunters Percent
0 6,782 89.2%
1 207 2.7%
2 266 3.5%
3 118 1.6%
4 90 1.2%
5 47 0.6%
6 28 0.4%
7 18 0.2%
8 18 0.2%
9 11 0.1%
10 10 0.1%
11 4 0.1%
12 6 0.1% Table 15. Number of birds harvested per permit holder and active permit holder by zone. Hunter numbers derived from applications, questionnaires and 1-800 registration.
Zone Birds/Permit Holder Birds/Active Permit Holder
Horicon 0.47 1.04
Exterior 0.41 N/A
38
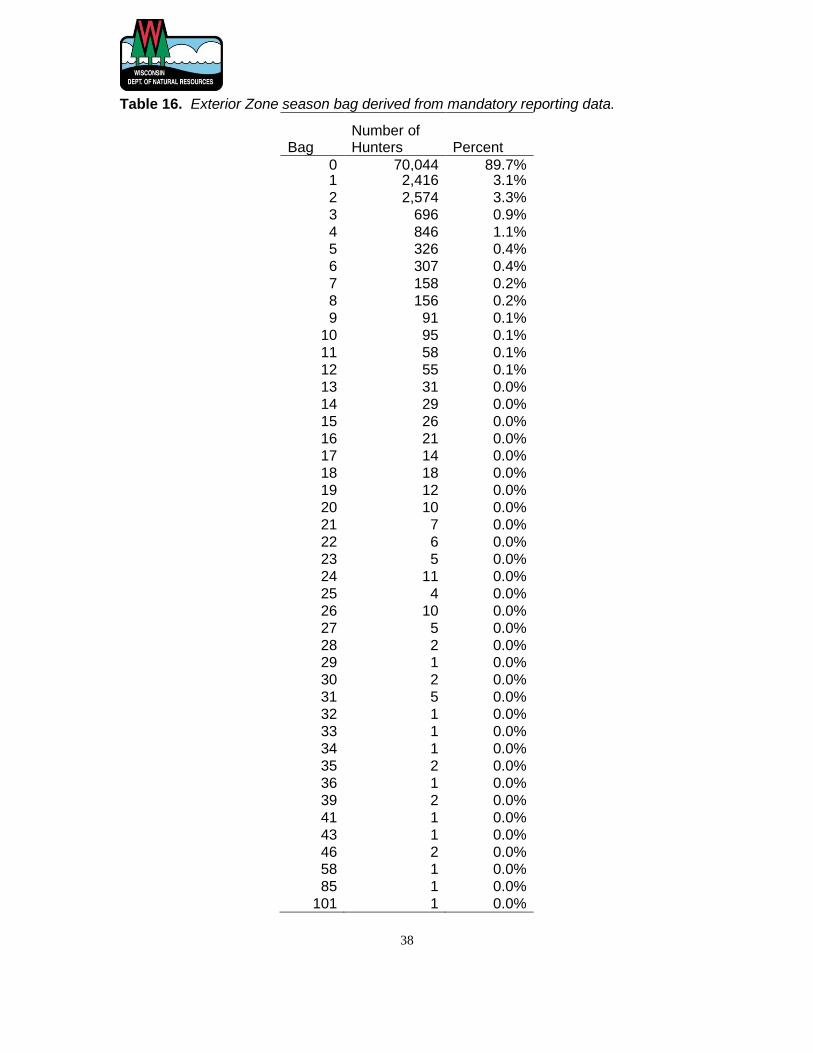
Table 16. Exterior Zone season bag derived from mandatory reporting data.
Bag Number of Hunters Percent
0 70,044 89.7% 1 2,416 3.1%
2 2,574 3.3%
3 696 0.9%
4 846 1.1% 5 326 0.4%
6 307 0.4%
7 158 0.2%
8 156 0.2%
9 91 0.1%
10 95 0.1%
11 58 0.1%
12 55 0.1%
13 31 0.0%
14 29 0.0%
15 26 0.0%
16 21 0.0% 17 14 0.0%
18 18 0.0%
19 12 0.0%
20 10 0.0%
21 7 0.0%
22 6 0.0%
23 5 0.0%
24 11 0.0%
25 4 0.0%
26 10 0.0%
27 5 0.0%
28 2 0.0% 29 1 0.0%
30 2 0.0%
31 5 0.0%
32 1 0.0%
33 1 0.0%
34 1 0.0%
35 2 0.0%
36 1 0.0%
39 2 0.0%
41 1 0.0%
43 1 0.0%
46 2 0.0% 58 1 0.0%
85 1 0.0%
101 1 0.0%
39
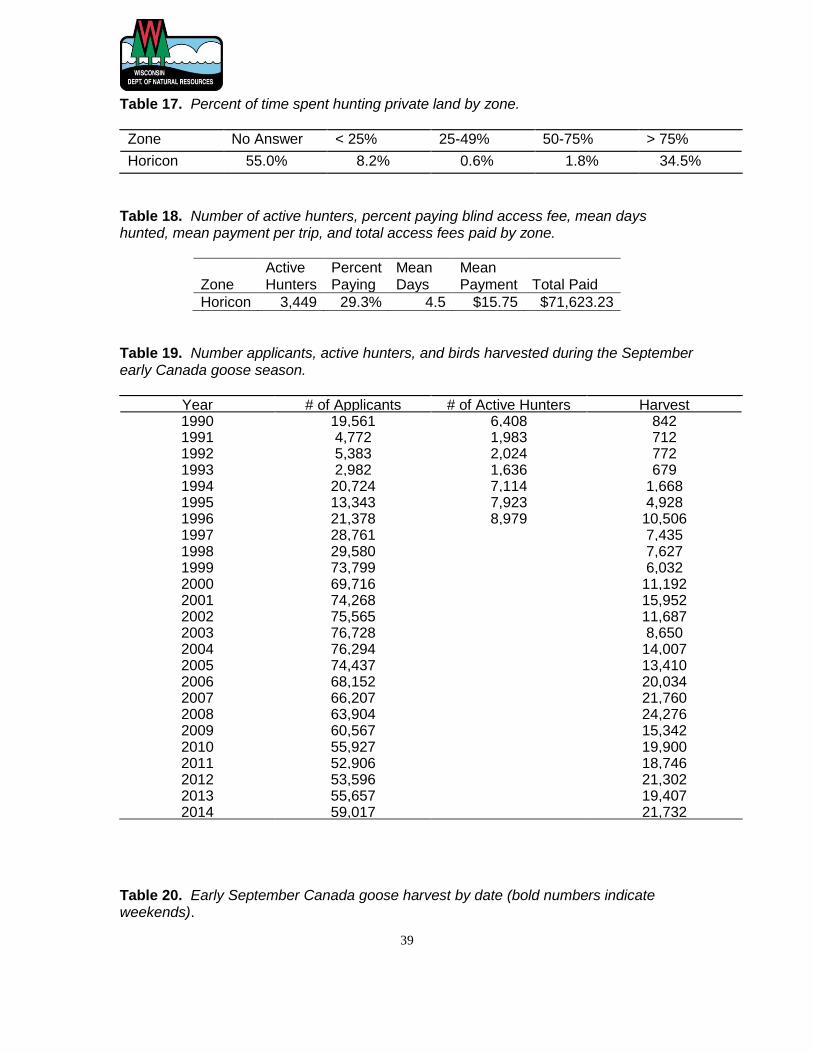
Table 17. Percent of time spent hunting private land by zone.
Zone No Answer < 25% 25-49% 50-75% > 75%
Horicon 55.0% 8.2% 0.6% 1.8% 34.5%
Table 18. Number of active hunters, percent paying blind access fee, mean days hunted, mean payment per trip, and total access fees paid by zone.
Zone Active Hunters
Percent Paying
Mean Days
Mean Payment Total Paid
Horicon 3,449 29.3% 4.5 $15.75 $71,623.23
Table 19. Number applicants, active hunters, and birds harvested during the September early Canada goose season.
Year # of Applicants # of Active Hunters Harvest 1990 19,561 6,408 842 1991 4,772 1,983 712 1992 5,383 2,024 772 1993 2,982 1,636 679 1994 20,724 7,114 1,668 1995 13,343 7,923 4,928 1996 21,378 8,979 10,506 1997 28,761 7,435 1998 29,580 7,627 1999 73,799 6,032 2000 69,716 11,192 2001 74,268 15,952 2002 75,565 11,687 2003 76,728 8,650 2004 76,294 14,007 2005 74,437 13,410 2006 68,152 20,034 2007 66,207 21,760 2008 63,904 24,276 2009 60,567 15,342 2010 55,927 19,900 2011 52,906 18,746 2012 53,596 21,302 2013 55,657 19,407 2014 59,017 21,732
732 Table 20. Early September Canada goose harvest by date (bold numbers indicate weekends).

40
Date Reported
Kill Expanded
Kill Cumulative
Kill Percent Cumulative
Percent
01-Sep-14 3,825 4,705 4,705 21.6% 21.6%
02-Sep-14 779 958 5,663 4.4% 26.1%
03-Sep-14 464 571 6,234 2.6% 28.7%
04-Sep-14 303 373 6,606 1.7% 30.4%
05-Sep-14 603 742 7,348 3.4% 33.8%
06-Sep-14 2,121 2,609 9,957 12.0% 45.8%
07-Sep-14 1,715 2,109 12,066 9.7% 55.5%
08-Sep-14 408 502 12,568 2.3% 57.8%
09-Sep-14 537 661 13,229 3.0% 60.9%
10-Sep-14 354 435 13,664 2.0% 62.9%
11-Sep-14 943 1,160 14,824 5.3% 68.2%
12-Sep-14 1,024 1,260 16,083 5.8% 74.0%
13-Sep-14 2,175 2,675 18,759 12.3% 86.3%
14-Sep-14 1,958 2,408 21,167 11.1% 97.4%
15-Sep-14 459 565 21,732 2.6% 100.0%
Total 17,668 21,732
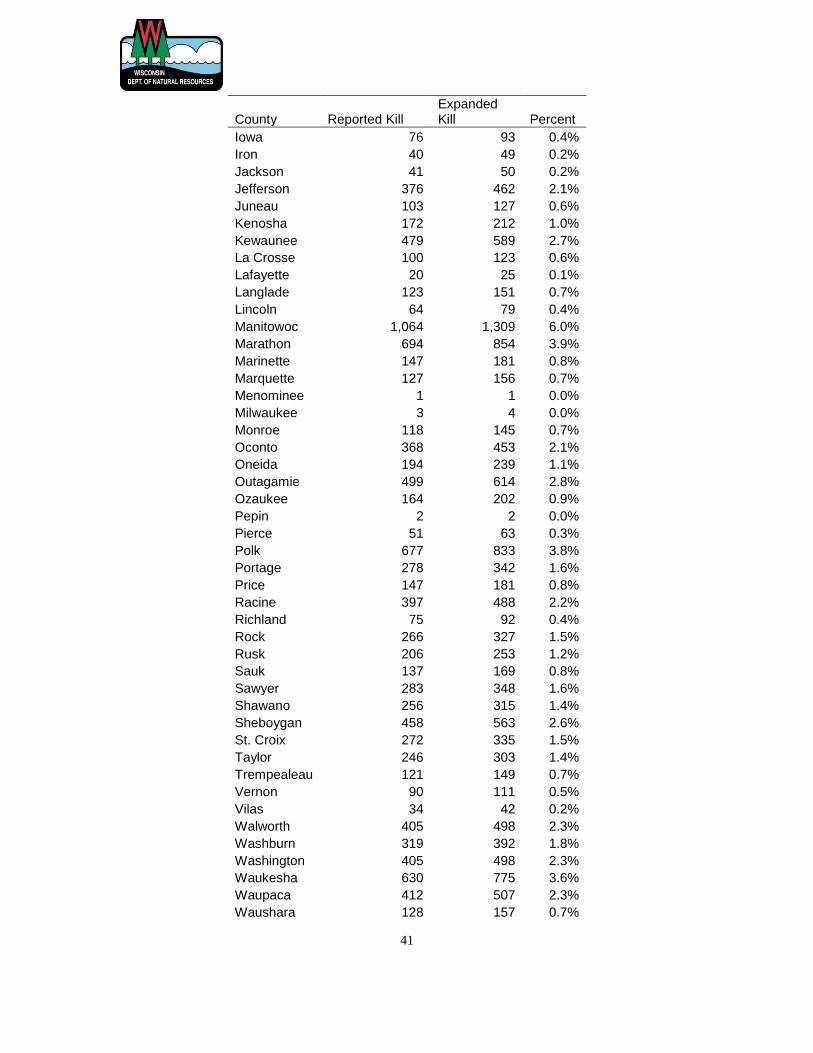
Table 21. Early September Canada goose harvest by county, 2014.
County Reported Kill Expanded Kill Percent
Adams 67 82 0.4%
Ashland 59 73 0.3%
Barron 329 405 1.9%
Bayfield 142 175 0.8%
Brown 759 934 4.3%
Buffalo 185 228 1.0%
Burnett 169 208 1.0%
Calumet 369 454 2.1%
Chippewa 288 354 1.6%
Clark 361 444 2.0%
Columbia 355 437 2.0%
Crawford 149 183 0.8%
Dane 345 424 2.0%
Dodge 686 844 3.9%
Door 483 594 2.7%
Douglas 52 64 0.3%
Dunn 94 116 0.5%
Eau Claire 55 68 0.3%
Florence 19 23 0.1%
Fond Du Lac 326 401 1.8%
Forest 37 46 0.2%
Grant 81 100 0.5%
Green 160 197 0.9%
Green Lake 60 74 0.3%
41
County Reported Kill Expanded Kill Percent
Iowa 76 93 0.4%
Iron 40 49 0.2%
Jackson 41 50 0.2%
Jefferson 376 462 2.1%
Juneau 103 127 0.6%
Kenosha 172 212 1.0%
Kewaunee 479 589 2.7%
La Crosse 100 123 0.6%
Lafayette 20 25 0.1%
Langlade 123 151 0.7%
Lincoln 64 79 0.4%
Manitowoc 1,064 1,309 6.0%
Marathon 694 854 3.9%
Marinette 147 181 0.8%
Marquette 127 156 0.7%
Menominee 1 1 0.0%
Milwaukee 3 4 0.0%
Monroe 118 145 0.7%
Oconto 368 453 2.1%
Oneida 194 239 1.1%
Outagamie 499 614 2.8%
Ozaukee 164 202 0.9%
Pepin 2 2 0.0%
Pierce 51 63 0.3%
Polk 677 833 3.8%
Portage 278 342 1.6%
Price 147 181 0.8%
Racine 397 488 2.2%
Richland 75 92 0.4%
Rock 266 327 1.5%
Rusk 206 253 1.2%
Sauk 137 169 0.8%
Sawyer 283 348 1.6%
Shawano 256 315 1.4%
Sheboygan 458 563 2.6%
St. Croix 272 335 1.5%
Taylor 246 303 1.4%
Trempealeau 121 149 0.7%
Vernon 90 111 0.5%
Vilas 34 42 0.2%
Walworth 405 498 2.3%
Washburn 319 392 1.8%
Washington 405 498 2.3%
Waukesha 630 775 3.6%
Waupaca 412 507 2.3%
Waushara 128 157 0.7%

42
County Reported Kill Expanded Kill Percent
Winnebago 459 565 2.6%
Wood 311 383 1.8%
Total 17,668 21,732
Table 22. Early September season bag derived from mandatory reporting data, 2014.
Bag Number of Hunters Percent
0 54,497 92.3%
1 1,225 2.1%
2 829 1.4%
3 614 1.0%
4 449 0.8%
5 547 0.9%
6 173 0.3%
7 117 0.2%
8 125 0.2%
9 81 0.1%
10 112 0.2%
11 45 0.1%
12 51 0.1%
13 23 0.0%
14 23 0.0%
15 34 0.1%
16 16 0.0%
17 7 0.0%
18 13 0.0%
19 3 0.0%
20 10 0.0%
21 5 0.0%
22 2 0.0%
23 1 0.0%
24 2 0.0%
25 5 0.0%
26 1 0.0%
27 2 0.0%
29 1 0.0%
35 1 0.0%
36 2 0.0%
41 1 0.0%

43
Table 23. Percent of successful bags containing 1 or 2 geese.
Zone Period Percent of 1
Kill Bags Percent of 2
Kill Bags
Horicon 1 51.9% 48.1% 2 53.4% 46.6% All Periods 52.1% 47.9%
44
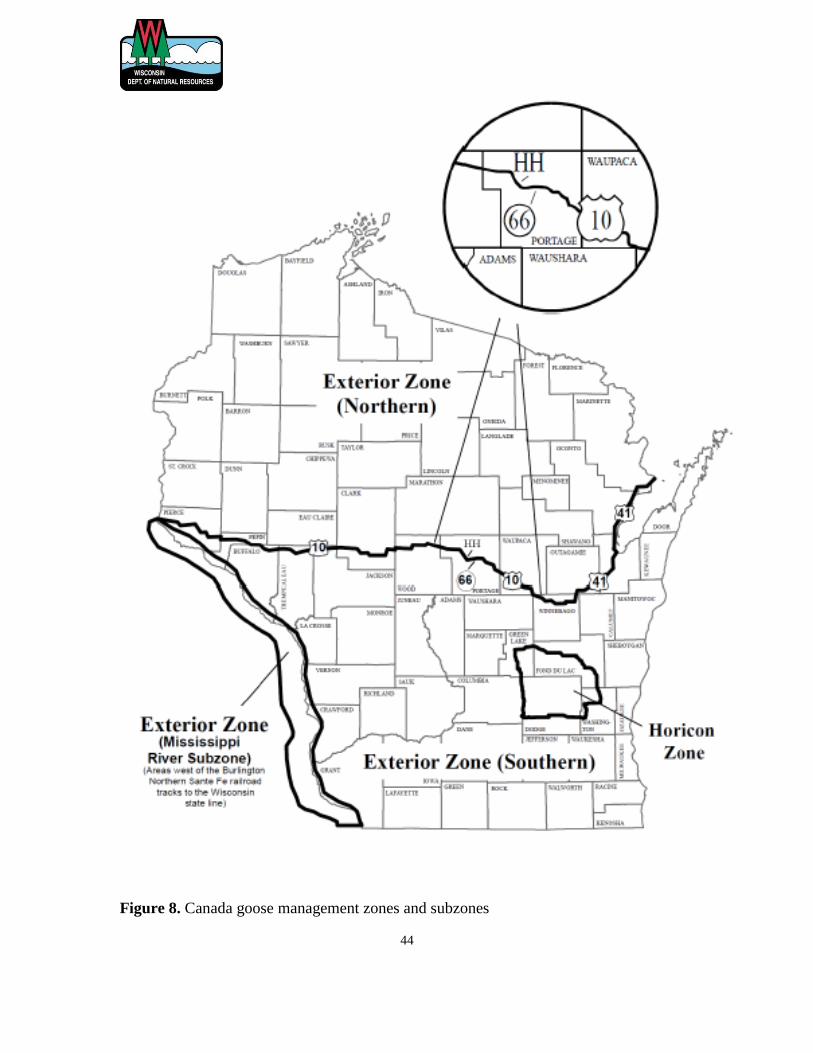
Figure 8. Canada goose management zones and subzones
45
The Wisconsin Department of Natural Resources provides equal opportunity in its employment, programs,
services, and functions under an Affirmative Action Plan. If you have any questions, please write to Equal
Opportunity Office, Department of Interior, Washington, D.C. 20240.
This publication can be made available in alternative formats (large print, Braille, audio tape, etc.) upon
request. Please call (608)266-8204 for more information.
WM-432


