
39-0310-005
Governor Livingston High School
BERKELEY HEIGHTS PUBLIC SCHOOLS
CDS CODE :
DISTRICT :
SCHOOL :
ESEA Waiver - Annual Progress Targets
The tables represent the annual proficiency targets, established for this School under ESEA Waiver
Schools and Subgroups could meet expectations either by meeting the statewide proficiency rate of 90 percent, or reaching their individually
determined progress targets. The statewide proficiency rate will be increased to 95 percent in 2015.
Performance Targets - Language Arts Literacy
Subgroup# of Valid
Test Scores
Baseline
% Proficient
Yearly
Increment
2012-2013
Target (%P)
2011-2012
Target (%P)
2013-2014
Target (%P)
2014-2015
Target (%P)
2015-2016
Target (%P)
2016-2017
Target (%P)
Baseline
year
97.5 - 90 90 90 90 90Schoolwide 242 901011
97.7 - 90 90 90 90 90White 214 901011
- - - - - - -Black - -1011
- - - - - - -Hispanic - -1011
- - - - - - -American Indian - -1011
- - - - - - -Asian - -1011
- - - - - - -Two or More Races - -1011
79 1.8 80.8 82.6 84.4 86.2Students with Disabilities 43 1213
- - - - - - -Limited English Proficiency - -1011
- - - - - - -Economically Disadvantaged - -1011
Performance Targets - Mathematics
Subgroup# of Valid
Test Scores
Baseline
% Proficient
Yearly
Increment
2012-2013
Target (%P)
2011-2012
Target (%P)
2013-2014
Target (%P)
2014-2015
Target (%P)
2015-2016
Target (%P)
2016-2017
Target (%P)
Baseline
year
93.8 - 90 90 90 90 90Schoolwide 242 901011
93.9 - 90 90 90 90 90White 214 901011
- - - - - - -Black - -1011
- - - - - - -Hispanic - -1011
- - - - - - -American Indian - -1011
- - - - - - -Asian - -1011
- - - - - - -Two or More Races - -1011
69.8 2.5 72.3 74.8 77.3 79.8Students with Disabilities 43 1213
- - - - - - -Limited English Proficiency - -1011
- - - - - - -Economically Disadvantaged - -1011
11/5/2014
Only Includes full year students (Time In School < Year students are removed)
'-' Indicates too few students to determine (N<30)
Title I Accountability System

39-0310-020
Thomas P. Hughes School
BERKELEY HEIGHTS PUBLIC SCHOOLS
CDS CODE :
DISTRICT :
SCHOOL :
ESEA Waiver - Annual Progress Targets
The tables represent the annual proficiency targets, established for this School under ESEA Waiver
Schools and Subgroups could meet expectations either by meeting the statewide proficiency rate of 90 percent, or reaching their individually
determined progress targets. The statewide proficiency rate will be increased to 95 percent in 2015.
Performance Targets - Language Arts Literacy
Subgroup# of Valid
Test Scores
Baseline
% Proficient
Yearly
Increment
2012-2013
Target (%P)
2011-2012
Target (%P)
2013-2014
Target (%P)
2014-2015
Target (%P)
2015-2016
Target (%P)
2016-2017
Target (%P)
Baseline
year
86.1 1.2 88.5 89.7 90 90 90Schoolwide 230 87.31011
85.6 1.2 88 89.2 90 90 90White 194 86.81011
- - - - - - -Black - -1011
- - - - - - -Hispanic - -1011
- - - - - - -American Indian - -1011
90.6 - 90 90 90 90Asian 32 1213
- - - - - - -Two or More Races - -1011
- - - - - - -Students with Disabilities - -1011
- - - - - - -Limited English Proficiency - -1011
- - - - - - -Economically Disadvantaged - -1011
Performance Targets - Mathematics
Subgroup# of Valid
Test Scores
Baseline
% Proficient
Yearly
Increment
2012-2013
Target (%P)
2011-2012
Target (%P)
2013-2014
Target (%P)
2014-2015
Target (%P)
2015-2016
Target (%P)
2016-2017
Target (%P)
Baseline
year
91.8 - 90 90 90 90 90Schoolwide 230 901011
92.2 - 90 90 90 90 90White 194 901011
- - - - - - -Black - -1011
- - - - - - -Hispanic - -1011
- - - - - - -American Indian - -1011
100.1 - 90 90 90 90Asian 32 1213
- - - - - - -Two or More Races - -1011
- - - - - - -Students with Disabilities - -1011
- - - - - - -Limited English Proficiency - -1011
- - - - - - -Economically Disadvantaged - -1011
11/5/2014
Only Includes full year students (Time In School < Year students are removed)
'-' Indicates too few students to determine (N<30)
Title I Accountability System

39-0310-030
Columbia Middle School
BERKELEY HEIGHTS PUBLIC SCHOOLS
CDS CODE :
DISTRICT :
SCHOOL :
ESEA Waiver - Annual Progress Targets
The tables represent the annual proficiency targets, established for this School under ESEA Waiver
Schools and Subgroups could meet expectations either by meeting the statewide proficiency rate of 90 percent, or reaching their individually
determined progress targets. The statewide proficiency rate will be increased to 95 percent in 2015.
Performance Targets - Language Arts Literacy
Subgroup# of Valid
Test Scores
Baseline
% Proficient
Yearly
Increment
2012-2013
Target (%P)
2011-2012
Target (%P)
2013-2014
Target (%P)
2014-2015
Target (%P)
2015-2016
Target (%P)
2016-2017
Target (%P)
Baseline
year
92 - 90 90 90 90 90Schoolwide 575 901011
91.3 - 90 90 90 90 90White 490 901011
- - - - - - -Black - -1011
80 1.7 81.7 83.4 85.1 86.8Hispanic 30 1213
- - - - - - -American Indian - -1011
98.4 - 90 90 90 90 90Asian 62 901011
- - - - - - -Two or More Races - -1011
65.3 2.9 71.1 74 76.9 79.8 82.7Students with Disabilities 49 68.21011
- - - - - - -Limited English Proficiency - -1011
- - - - - - -Economically Disadvantaged - -1011
Performance Targets - Mathematics
Subgroup# of Valid
Test Scores
Baseline
% Proficient
Yearly
Increment
2012-2013
Target (%P)
2011-2012
Target (%P)
2013-2014
Target (%P)
2014-2015
Target (%P)
2015-2016
Target (%P)
2016-2017
Target (%P)
Baseline
year
89.8 .9 90 90 90 90 90Schoolwide 575 901011
88.6 1 90 90 90 90 90White 490 89.61011
- - - - - - -Black - -1011
76.6 2 78.6 80.6 82.6 84.6Hispanic 30 1213
- - - - - - -American Indian - -1011
98.4 - 90 90 90 90 90Asian 62 901011
- - - - - - -Two or More Races - -1011
55.1 3.8 62.7 66.5 70.3 74.1 77.9Students with Disabilities 49 58.91011
- - - - - - -Limited English Proficiency - -1011
- - - - - - -Economically Disadvantaged - -1011
11/5/2014
Only Includes full year students (Time In School < Year students are removed)
'-' Indicates too few students to determine (N<30)
Title I Accountability System

39-0310-040
Mountain Park School
BERKELEY HEIGHTS PUBLIC SCHOOLS
CDS CODE :
DISTRICT :
SCHOOL :
ESEA Waiver - Annual Progress Targets
The tables represent the annual proficiency targets, established for this School under ESEA Waiver
Schools and Subgroups could meet expectations either by meeting the statewide proficiency rate of 90 percent, or reaching their individually
determined progress targets. The statewide proficiency rate will be increased to 95 percent in 2015.
Performance Targets - Language Arts Literacy
Subgroup# of Valid
Test Scores
Baseline
% Proficient
Yearly
Increment
2012-2013
Target (%P)
2011-2012
Target (%P)
2013-2014
Target (%P)
2014-2015
Target (%P)
2015-2016
Target (%P)
2016-2017
Target (%P)
Baseline
year
87.4 1.1 89.6 90 90 90 90Schoolwide 199 88.51011
87.3 1.1 89.5 90 90 90 90White 173 88.41011
- - - - - - -Black - -1011
- - - - - - -Hispanic - -1011
- - - - - - -American Indian - -1011
- - - - - - -Asian - -1011
- - - - - - -Two or More Races - -1011
- - - - - - -Students with Disabilities - -1011
- - - - - - -Limited English Proficiency - -1011
- - - - - - -Economically Disadvantaged - -1011
Performance Targets - Mathematics
Subgroup# of Valid
Test Scores
Baseline
% Proficient
Yearly
Increment
2012-2013
Target (%P)
2011-2012
Target (%P)
2013-2014
Target (%P)
2014-2015
Target (%P)
2015-2016
Target (%P)
2016-2017
Target (%P)
Baseline
year
93.5 - 90 90 90 90 90Schoolwide 199 901011
93.7 - 90 90 90 90 90White 173 901011
- - - - - - -Black - -1011
- - - - - - -Hispanic - -1011
- - - - - - -American Indian - -1011
- - - - - - -Asian - -1011
- - - - - - -Two or More Races - -1011
- - - - - - -Students with Disabilities - -1011
- - - - - - -Limited English Proficiency - -1011
- - - - - - -Economically Disadvantaged - -1011
11/5/2014
Only Includes full year students (Time In School < Year students are removed)
'-' Indicates too few students to determine (N<30)
Title I Accountability System

39-0310-050
William Woodruff School
BERKELEY HEIGHTS PUBLIC SCHOOLS
CDS CODE :
DISTRICT :
SCHOOL :
ESEA Waiver - Annual Progress Targets
The tables represent the annual proficiency targets, established for this School under ESEA Waiver
Schools and Subgroups could meet expectations either by meeting the statewide proficiency rate of 90 percent, or reaching their individually
determined progress targets. The statewide proficiency rate will be increased to 95 percent in 2015.
Performance Targets - Language Arts Literacy
Subgroup# of Valid
Test Scores
Baseline
% Proficient
Yearly
Increment
2012-2013
Target (%P)
2011-2012
Target (%P)
2013-2014
Target (%P)
2014-2015
Target (%P)
2015-2016
Target (%P)
2016-2017
Target (%P)
Baseline
year
79.7 1.7 83.1 84.8 86.5 88.2 89.9Schoolwide 177 81.41011
80.7 1.6 83.9 85.5 87.1 88.7 90White 135 82.31011
- - - - - - -Black - -1011
- - - - - - -Hispanic - -1011
- - - - - - -American Indian - -1011
90 - 90 90 90 90Asian 30 1213
- - - - - - -Two or More Races - -1011
- - - - - - -Students with Disabilities - -1011
- - - - - - -Limited English Proficiency - -1011
- - - - - - -Economically Disadvantaged - -1011
Performance Targets - Mathematics
Subgroup# of Valid
Test Scores
Baseline
% Proficient
Yearly
Increment
2012-2013
Target (%P)
2011-2012
Target (%P)
2013-2014
Target (%P)
2014-2015
Target (%P)
2015-2016
Target (%P)
2016-2017
Target (%P)
Baseline
year
93.2 - 90 90 90 90 90Schoolwide 177 901011
95.5 - 90 90 90 90 90White 135 901011
- - - - - - -Black - -1011
- - - - - - -Hispanic - -1011
- - - - - - -American Indian - -1011
93.4 - 90 90 90 90Asian 30 1213
- - - - - - -Two or More Races - -1011
- - - - - - -Students with Disabilities - -1011
- - - - - - -Limited English Proficiency - -1011
- - - - - - -Economically Disadvantaged - -1011
11/5/2014
Only Includes full year students (Time In School < Year students are removed)
'-' Indicates too few students to determine (N<30)
Title I Accountability System

39-0850-005
Arthur L. Johnson High School
Clark Township Public Schools
CDS CODE :
DISTRICT :
SCHOOL :
ESEA Waiver - Annual Progress Targets
The tables represent the annual proficiency targets, established for this School under ESEA Waiver
Schools and Subgroups could meet expectations either by meeting the statewide proficiency rate of 90 percent, or reaching their individually
determined progress targets. The statewide proficiency rate will be increased to 95 percent in 2015.
Performance Targets - Language Arts Literacy
Subgroup# of Valid
Test Scores
Baseline
% Proficient
Yearly
Increment
2012-2013
Target (%P)
2011-2012
Target (%P)
2013-2014
Target (%P)
2014-2015
Target (%P)
2015-2016
Target (%P)
2016-2017
Target (%P)
Baseline
year
95.9 - 90 90 90 90 90Schoolwide 217 901011
95.8 - 90 90 90 90 90White 193 901011
- - - - - - -Black - -1011
- - - - - - -Hispanic - -1011
- - - - - - -American Indian - -1011
- - - - - - -Asian - -1011
- - - - - - -Two or More Races - -1011
- - - - - - -Students with Disabilities - -1011
- - - - - - -Limited English Proficiency - -1011
- - - - - - -Economically Disadvantaged - -1011
Performance Targets - Mathematics
Subgroup# of Valid
Test Scores
Baseline
% Proficient
Yearly
Increment
2012-2013
Target (%P)
2011-2012
Target (%P)
2013-2014
Target (%P)
2014-2015
Target (%P)
2015-2016
Target (%P)
2016-2017
Target (%P)
Baseline
year
90.3 - 90 90 90 90 90Schoolwide 217 901011
90.6 - 90 90 90 90 90White 193 901011
- - - - - - -Black - -1011
- - - - - - -Hispanic - -1011
- - - - - - -American Indian - -1011
- - - - - - -Asian - -1011
- - - - - - -Two or More Races - -1011
- - - - - - -Students with Disabilities - -1011
- - - - - - -Limited English Proficiency - -1011
- - - - - - -Economically Disadvantaged - -1011
11/5/2014
Only Includes full year students (Time In School < Year students are removed)
'-' Indicates too few students to determine (N<30)
Title I Accountability System

39-0850-030
Frank K. Hehnly
Clark Township Public Schools
CDS CODE :
DISTRICT :
SCHOOL :
ESEA Waiver - Annual Progress Targets
The tables represent the annual proficiency targets, established for this School under ESEA Waiver
Schools and Subgroups could meet expectations either by meeting the statewide proficiency rate of 90 percent, or reaching their individually
determined progress targets. The statewide proficiency rate will be increased to 95 percent in 2015.
Performance Targets - Language Arts Literacy
Subgroup# of Valid
Test Scores
Baseline
% Proficient
Yearly
Increment
2012-2013
Target (%P)
2011-2012
Target (%P)
2013-2014
Target (%P)
2014-2015
Target (%P)
2015-2016
Target (%P)
2016-2017
Target (%P)
Baseline
year
79.1 1.8 82.7 84.5 86.3 88.1 89.9Schoolwide 267 80.91011
80 1.7 83.4 85.1 86.8 88.5 90White 245 81.71011
- - - - - - -Black - -1011
- - - - - - -Hispanic - -1011
- - - - - - -American Indian - -1011
- - - - - - -Asian - -1011
- - - - - - -Two or More Races - -1011
41.9 4.9 51.7 56.6 61.5 66.4 71.3Students with Disabilities 31 46.81011
- - - - - - -Limited English Proficiency - -1011
- - - - - - -Economically Disadvantaged - -1011
Performance Targets - Mathematics
Subgroup# of Valid
Test Scores
Baseline
% Proficient
Yearly
Increment
2012-2013
Target (%P)
2011-2012
Target (%P)
2013-2014
Target (%P)
2014-2015
Target (%P)
2015-2016
Target (%P)
2016-2017
Target (%P)
Baseline
year
91.7 - 90 90 90 90 90Schoolwide 267 901011
92.7 - 90 90 90 90 90White 245 901011
- - - - - - -Black - -1011
- - - - - - -Hispanic - -1011
- - - - - - -American Indian - -1011
- - - - - - -Asian - -1011
- - - - - - -Two or More Races - -1011
64.6 3 70.6 73.6 76.6 79.6 82.6Students with Disabilities 31 67.61011
- - - - - - -Limited English Proficiency - -1011
- - - - - - -Economically Disadvantaged - -1011
11/5/2014
Only Includes full year students (Time In School < Year students are removed)
'-' Indicates too few students to determine (N<30)
Title I Accountability System

39-0850-035
Carl H. Kumpf School
Clark Township Public Schools
CDS CODE :
DISTRICT :
SCHOOL :
ESEA Waiver - Annual Progress Targets
The tables represent the annual proficiency targets, established for this School under ESEA Waiver
Schools and Subgroups could meet expectations either by meeting the statewide proficiency rate of 90 percent, or reaching their individually
determined progress targets. The statewide proficiency rate will be increased to 95 percent in 2015.
Performance Targets - Language Arts Literacy
Subgroup# of Valid
Test Scores
Baseline
% Proficient
Yearly
Increment
2012-2013
Target (%P)
2011-2012
Target (%P)
2013-2014
Target (%P)
2014-2015
Target (%P)
2015-2016
Target (%P)
2016-2017
Target (%P)
Baseline
year
84.7 1.3 87.3 88.6 89.9 90 90Schoolwide 511 861011
84.9 1.3 87.5 88.8 90 90 90White 457 86.21011
- - - - - - -Black - -1011
82.4 1.5 85.4 86.9 88.4 89.9 90Hispanic 34 83.91011
- - - - - - -American Indian - -1011
- - - - - - -Asian - -1011
- - - - - - -Two or More Races - -1011
47.5 4.4 56.3 60.7 65.1 69.5 73.9Students with Disabilities 59 51.91011
- - - - - - -Limited English Proficiency - -1011
72.8 2.3 77.4 79.7 82 84.3 86.6Economically Disadvantaged 33 75.11011
Performance Targets - Mathematics
Subgroup# of Valid
Test Scores
Baseline
% Proficient
Yearly
Increment
2012-2013
Target (%P)
2011-2012
Target (%P)
2013-2014
Target (%P)
2014-2015
Target (%P)
2015-2016
Target (%P)
2016-2017
Target (%P)
Baseline
year
74.3 2.2 78.7 80.9 83.1 85.3 87.5Schoolwide 510 76.51011
74.8 2.1 79 81.1 83.2 85.3 87.4White 456 76.91011
- - - - - - -Black - -1011
64.7 3 70.7 73.7 76.7 79.7 82.7Hispanic 34 67.71011
- - - - - - -American Indian - -1011
- - - - - - -Asian - -1011
- - - - - - -Two or More Races - -1011
28.8 5.9 40.6 46.5 52.4 58.3 64.2Students with Disabilities 59 34.71011
- - - - - - -Limited English Proficiency - -1011
57.6 3.5 64.6 68.1 71.6 75.1 78.6Economically Disadvantaged 33 61.11011
11/5/2014
Only Includes full year students (Time In School < Year students are removed)
'-' Indicates too few students to determine (N<30)
Title I Accountability System
39-0850-040
Valley Road School
Clark Township Public Schools
CDS CODE :
DISTRICT :
SCHOOL :
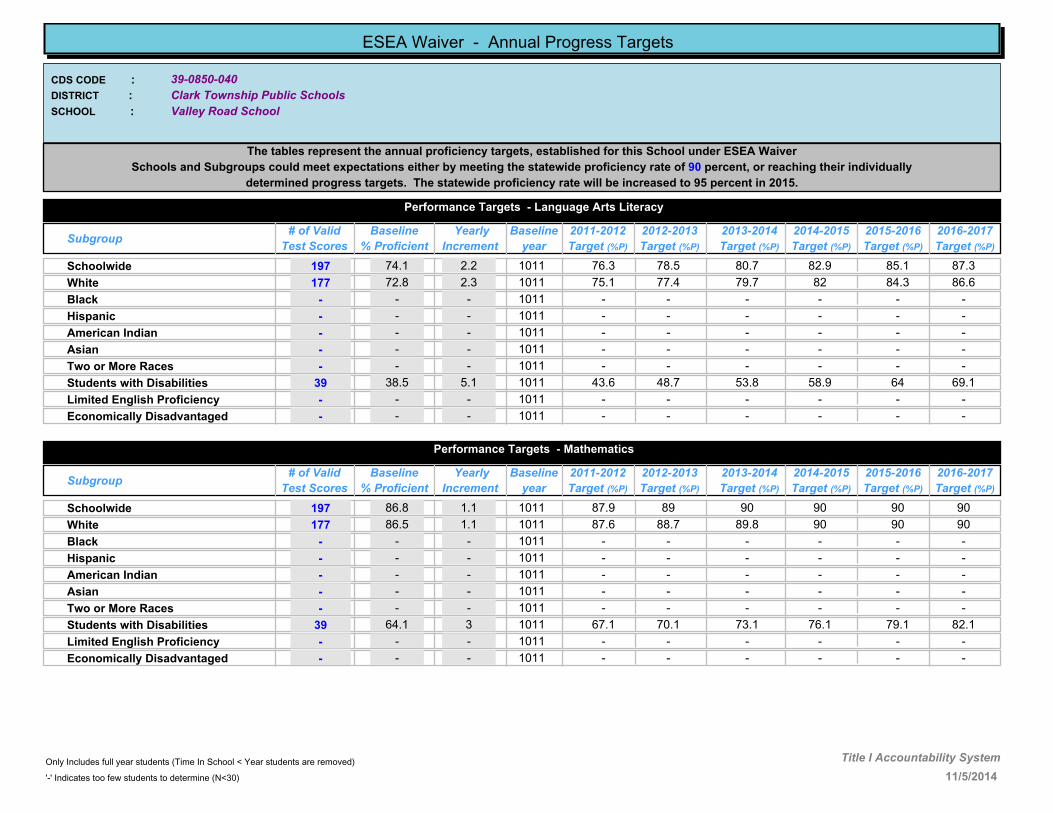
ESEA Waiver - Annual Progress Targets
The tables represent the annual proficiency targets, established for this School under ESEA Waiver
Schools and Subgroups could meet expectations either by meeting the statewide proficiency rate of 90 percent, or reaching their individually
determined progress targets. The statewide proficiency rate will be increased to 95 percent in 2015.
Performance Targets - Language Arts Literacy
Subgroup# of Valid
Test Scores
Baseline
% Proficient
Yearly
Increment
2012-2013
Target (%P)
2011-2012
Target (%P)
2013-2014
Target (%P)
2014-2015
Target (%P)
2015-2016
Target (%P)
2016-2017
Target (%P)
Baseline
year
74.1 2.2 78.5 80.7 82.9 85.1 87.3Schoolwide 197 76.31011
72.8 2.3 77.4 79.7 82 84.3 86.6White 177 75.11011
- - - - - - -Black - -1011
- - - - - - -Hispanic - -1011
- - - - - - -American Indian - -1011
- - - - - - -Asian - -1011
- - - - - - -Two or More Races - -1011
38.5 5.1 48.7 53.8 58.9 64 69.1Students with Disabilities 39 43.61011
- - - - - - -Limited English Proficiency - -1011
- - - - - - -Economically Disadvantaged - -1011
Performance Targets - Mathematics
Subgroup# of Valid
Test Scores
Baseline
% Proficient
Yearly
Increment
2012-2013
Target (%P)
2011-2012
Target (%P)
2013-2014
Target (%P)
2014-2015
Target (%P)
2015-2016
Target (%P)
2016-2017
Target (%P)
Baseline
year
86.8 1.1 89 90 90 90 90Schoolwide 197 87.91011
86.5 1.1 88.7 89.8 90 90 90White 177 87.61011
- - - - - - -Black - -1011
- - - - - - -Hispanic - -1011
- - - - - - -American Indian - -1011
- - - - - - -Asian - -1011
- - - - - - -Two or More Races - -1011
64.1 3 70.1 73.1 76.1 79.1 82.1Students with Disabilities 39 67.11011
- - - - - - -Limited English Proficiency - -1011
- - - - - - -Economically Disadvantaged - -1011
11/5/2014
Only Includes full year students (Time In School < Year students are removed)
'-' Indicates too few students to determine (N<30)
Title I Accountability System

39-0980-030
Cranford High School
Cranford Public School District
CDS CODE :
DISTRICT :
SCHOOL :
ESEA Waiver - Annual Progress Targets
The tables represent the annual proficiency targets, established for this School under ESEA Waiver
Schools and Subgroups could meet expectations either by meeting the statewide proficiency rate of 90 percent, or reaching their individually
determined progress targets. The statewide proficiency rate will be increased to 95 percent in 2015.
Performance Targets - Language Arts Literacy
Subgroup# of Valid
Test Scores
Baseline
% Proficient
Yearly
Increment
2012-2013
Target (%P)
2011-2012
Target (%P)
2013-2014
Target (%P)
2014-2015
Target (%P)
2015-2016
Target (%P)
2016-2017
Target (%P)
Baseline
year
97.8 - 90 90 90 90 90Schoolwide 276 901011
97.6 - 90 90 90 90 90White 248 901011
- - - - - - -Black - -1011
- - - - - - -Hispanic - -1011
- - - - - - -American Indian - -1011
- - - - - - -Asian - -1011
- - - - - - -Two or More Races - -1011
86.6 1.1 88.8 89.9 90 90 90Students with Disabilities 45 87.71011
- - - - - - -Limited English Proficiency - -1011
- - - - - - -Economically Disadvantaged - -1011
Performance Targets - Mathematics
Subgroup# of Valid
Test Scores
Baseline
% Proficient
Yearly
Increment
2012-2013
Target (%P)
2011-2012
Target (%P)
2013-2014
Target (%P)
2014-2015
Target (%P)
2015-2016
Target (%P)
2016-2017
Target (%P)
Baseline
year
87.6 1 89.6 90 90 90 90Schoolwide 276 88.61011
89.9 .9 90 90 90 90 90White 248 901011
- - - - - - -Black - -1011
- - - - - - -Hispanic - -1011
- - - - - - -American Indian - -1011
- - - - - - -Asian - -1011
- - - - - - -Two or More Races - -1011
35.5 5.4 46.3 51.7 57.1 62.5 67.9Students with Disabilities 45 40.91011
- - - - - - -Limited English Proficiency - -1011
- - - - - - -Economically Disadvantaged - -1011
11/5/2014
Only Includes full year students (Time In School < Year students are removed)
'-' Indicates too few students to determine (N<30)
Title I Accountability System

39-0980-033
Hillside Avenue School
Cranford Public School District
CDS CODE :
DISTRICT :
SCHOOL :
ESEA Waiver - Annual Progress Targets
The tables represent the annual proficiency targets, established for this School under ESEA Waiver
Schools and Subgroups could meet expectations either by meeting the statewide proficiency rate of 90 percent, or reaching their individually
determined progress targets. The statewide proficiency rate will be increased to 95 percent in 2015.
Performance Targets - Language Arts Literacy
Subgroup# of Valid
Test Scores
Baseline
% Proficient
Yearly
Increment
2012-2013
Target (%P)
2011-2012
Target (%P)
2013-2014
Target (%P)
2014-2015
Target (%P)
2015-2016
Target (%P)
2016-2017
Target (%P)
Baseline
year
81.7 1.5 84.7 86.2 87.7 89.2 90Schoolwide 512 83.21011
82.7 1.5 85.7 87.2 88.7 90 90White 427 84.21011
- - - - - - -Black - -1011
82.2 1.5 85.2 86.7 88.2 89.7 90Hispanic 45 83.71011
- - - - - - -American Indian - -1011
- - - - - - -Asian - -1011
- - - - - - -Two or More Races - -1011
47.5 4.4 56.3 60.7 65.1 69.5 73.9Students with Disabilities 101 51.91011
- - - - - - -Limited English Proficiency - -1011
68.4 2.6 73.6 76.2 78.8 81.4 84Economically Disadvantaged 38 711011
Performance Targets - Mathematics
Subgroup# of Valid
Test Scores
Baseline
% Proficient
Yearly
Increment
2012-2013
Target (%P)
2011-2012
Target (%P)
2013-2014
Target (%P)
2014-2015
Target (%P)
2015-2016
Target (%P)
2016-2017
Target (%P)
Baseline
year
85.5 1.2 87.9 89.1 90 90 90Schoolwide 511 86.71011
85.2 1.2 87.6 88.8 90 90 90White 426 86.41011
- - - - - - -Black - -1011
84.4 1.3 87 88.3 89.6 90 90Hispanic 45 85.71011
- - - - - - -American Indian - -1011
- - - - - - -Asian - -1011
- - - - - - -Two or More Races - -1011
51 4.1 59.2 63.3 67.4 71.5 75.6Students with Disabilities 100 55.11011
- - - - - - -Limited English Proficiency - -1011
76.3 2 80.3 82.3 84.3 86.3 88.3Economically Disadvantaged 38 78.31011
11/5/2014
Only Includes full year students (Time In School < Year students are removed)
'-' Indicates too few students to determine (N<30)
Title I Accountability System

39-0980-037
Orange Avenue School
Cranford Public School District
CDS CODE :
DISTRICT :
SCHOOL :
ESEA Waiver - Annual Progress Targets
The tables represent the annual proficiency targets, established for this School under ESEA Waiver
Schools and Subgroups could meet expectations either by meeting the statewide proficiency rate of 90 percent, or reaching their individually
determined progress targets. The statewide proficiency rate will be increased to 95 percent in 2015.
Performance Targets - Language Arts Literacy
Subgroup# of Valid
Test Scores
Baseline
% Proficient
Yearly
Increment
2012-2013
Target (%P)
2011-2012
Target (%P)
2013-2014
Target (%P)
2014-2015
Target (%P)
2015-2016
Target (%P)
2016-2017
Target (%P)
Baseline
year
87.2 1.1 89.4 90 90 90 90Schoolwide 732 88.31011
87.8 1 89.8 90 90 90 90White 682 88.81011
- - - - - - -Black - -1011
82.5 1.5 84 85.5 87 88.5Hispanic 40 1213
- - - - - - -American Indian - -1011
- - - - - - -Asian - -1011
- - - - - - -Two or More Races - -1011
60.5 3.3 67.1 70.4 73.7 77 80.3Students with Disabilities 124 63.81011
- - - - - - -Limited English Proficiency - -1011
- - - - - - -Economically Disadvantaged - -1011
Performance Targets - Mathematics
Subgroup# of Valid
Test Scores
Baseline
% Proficient
Yearly
Increment
2012-2013
Target (%P)
2011-2012
Target (%P)
2013-2014
Target (%P)
2014-2015
Target (%P)
2015-2016
Target (%P)
2016-2017
Target (%P)
Baseline
year
89.7 .9 90 90 90 90 90Schoolwide 731 901011
89.7 .9 90 90 90 90 90White 681 901011
- - - - - - -Black - -1011
92.5 - 90 90 90 90Hispanic 40 1213
- - - - - - -American Indian - -1011
- - - - - - -Asian - -1011
- - - - - - -Two or More Races - -1011
66.1 2.8 71.7 74.5 77.3 80.1 82.9Students with Disabilities 124 68.91011
- - - - - - -Limited English Proficiency - -1011
- - - - - - -Economically Disadvantaged - -1011
11/5/2014
Only Includes full year students (Time In School < Year students are removed)
'-' Indicates too few students to determine (N<30)
Title I Accountability System

39-0980-050
Brookside Place School
Cranford Public School District
CDS CODE :
DISTRICT :
SCHOOL :
ESEA Waiver - Annual Progress Targets
The tables represent the annual proficiency targets, established for this School under ESEA Waiver
Schools and Subgroups could meet expectations either by meeting the statewide proficiency rate of 90 percent, or reaching their individually
determined progress targets. The statewide proficiency rate will be increased to 95 percent in 2015.
Performance Targets - Language Arts Literacy
Subgroup# of Valid
Test Scores
Baseline
% Proficient
Yearly
Increment
2012-2013
Target (%P)
2011-2012
Target (%P)
2013-2014
Target (%P)
2014-2015
Target (%P)
2015-2016
Target (%P)
2016-2017
Target (%P)
Baseline
year
87.3 1.1 89.5 90 90 90 90Schoolwide 219 88.41011
87.2 1.1 89.4 90 90 90 90White 211 88.31011
- - - - - - -Black - -1011
- - - - - - -Hispanic - -1011
- - - - - - -American Indian - -1011
- - - - - - -Asian - -1011
- - - - - - -Two or More Races - -1011
65 2.9 70.8 73.7 76.6 79.5 82.4Students with Disabilities 40 67.91011
- - - - - - -Limited English Proficiency - -1011
- - - - - - -Economically Disadvantaged - -1011
Performance Targets - Mathematics
Subgroup# of Valid
Test Scores
Baseline
% Proficient
Yearly
Increment
2012-2013
Target (%P)
2011-2012
Target (%P)
2013-2014
Target (%P)
2014-2015
Target (%P)
2015-2016
Target (%P)
2016-2017
Target (%P)
Baseline
year
92.7 - 90 90 90 90 90Schoolwide 219 901011
93.3 - 90 90 90 90 90White 211 901011
- - - - - - -Black - -1011
- - - - - - -Hispanic - -1011
- - - - - - -American Indian - -1011
- - - - - - -Asian - -1011
- - - - - - -Two or More Races - -1011
77.5 1.9 81.3 83.2 85.1 87 88.9Students with Disabilities 40 79.41011
- - - - - - -Limited English Proficiency - -1011
- - - - - - -Economically Disadvantaged - -1011
11/5/2014
Only Includes full year students (Time In School < Year students are removed)
'-' Indicates too few students to determine (N<30)
Title I Accountability System

39-0980-080
Livingston Avenue School
Cranford Public School District
CDS CODE :
DISTRICT :
SCHOOL :
ESEA Waiver - Annual Progress Targets
The tables represent the annual proficiency targets, established for this School under ESEA Waiver
Schools and Subgroups could meet expectations either by meeting the statewide proficiency rate of 90 percent, or reaching their individually
determined progress targets. The statewide proficiency rate will be increased to 95 percent in 2015.
Performance Targets - Language Arts Literacy
Subgroup# of Valid
Test Scores
Baseline
% Proficient
Yearly
Increment
2012-2013
Target (%P)
2011-2012
Target (%P)
2013-2014
Target (%P)
2014-2015
Target (%P)
2015-2016
Target (%P)
2016-2017
Target (%P)
Baseline
year
81 1.6 84.2 85.8 87.4 89 90Schoolwide 216 82.61011
82.8 1.4 85.6 87 88.4 89.8 90White 192 84.21011
- - - - - - -Black - -1011
- - - - - - -Hispanic - -1011
- - - - - - -American Indian - -1011
- - - - - - -Asian - -1011
- - - - - - -Two or More Races - -1011
59.6 3.4 66.4 69.8 73.2 76.6 80Students with Disabilities 52 631011
- - - - - - -Limited English Proficiency - -1011
- - - - - - -Economically Disadvantaged - -1011
Performance Targets - Mathematics
Subgroup# of Valid
Test Scores
Baseline
% Proficient
Yearly
Increment
2012-2013
Target (%P)
2011-2012
Target (%P)
2013-2014
Target (%P)
2014-2015
Target (%P)
2015-2016
Target (%P)
2016-2017
Target (%P)
Baseline
year
93.1 - 90 90 90 90 90Schoolwide 216 901011
93.8 - 90 90 90 90 90White 192 901011
- - - - - - -Black - -1011
- - - - - - -Hispanic - -1011
- - - - - - -American Indian - -1011
- - - - - - -Asian - -1011
- - - - - - -Two or More Races - -1011
80.8 1.6 84 85.6 87.2 88.8 90Students with Disabilities 52 82.41011
- - - - - - -Limited English Proficiency - -1011
- - - - - - -Economically Disadvantaged - -1011
11/5/2014
Only Includes full year students (Time In School < Year students are removed)
'-' Indicates too few students to determine (N<30)
Title I Accountability System

39-1320-025
Elizabeth High School
Elizabeth Public Schools
CDS CODE :
DISTRICT :
SCHOOL :
ESEA Waiver - Annual Progress Targets
The tables represent the annual proficiency targets, established for this School under ESEA Waiver
Schools and Subgroups could meet expectations either by meeting the statewide proficiency rate of 90 percent, or reaching their individually
determined progress targets. The statewide proficiency rate will be increased to 95 percent in 2015.
Performance Targets - Language Arts Literacy
Subgroup# of Valid
Test Scores
Baseline
% Proficient
Yearly
Increment
2012-2013
Target (%P)
2011-2012
Target (%P)
2013-2014
Target (%P)
2014-2015
Target (%P)
2015-2016
Target (%P)
2016-2017
Target (%P)
Baseline
year
99.2 - 90 90 90 90 90Schoolwide 140 901011
100 - 90 90 90 90White 37 1213
- - - - - - -Black - -1011
100 - 90 90 90 90 90Hispanic 87 901011
- - - - - - -American Indian - -1011
- - - - - - -Asian - -1011
- - - - - - -Two or More Races - -1011
- - - - - - -Students with Disabilities - -1011
- - - - - - -Limited English Proficiency - -1011
100 - 90 90 90 90 90Economically Disadvantaged 105 901011
Performance Targets - Mathematics
Subgroup# of Valid
Test Scores
Baseline
% Proficient
Yearly
Increment
2012-2013
Target (%P)
2011-2012
Target (%P)
2013-2014
Target (%P)
2014-2015
Target (%P)
2015-2016
Target (%P)
2016-2017
Target (%P)
Baseline
year
98.5 - 90 90 90 90 90Schoolwide 140 901011
100 - 90 90 90 90White 37 1213
- - - - - - -Black - -1011
98.8 - 90 90 90 90 90Hispanic 87 901011
- - - - - - -American Indian - -1011
- - - - - - -Asian - -1011
- - - - - - -Two or More Races - -1011
- - - - - - -Students with Disabilities - -1011
- - - - - - -Limited English Proficiency - -1011
99.1 - 90 90 90 90 90Economically Disadvantaged 105 901011
11/5/2014
Only Includes full year students (Time In School < Year students are removed)
'-' Indicates too few students to determine (N<30)
Title I Accountability System

39-1320-030
Terence C. Reilly School # 7
Elizabeth Public Schools
CDS CODE :
DISTRICT :
SCHOOL :
ESEA Waiver - Annual Progress Targets
The tables represent the annual proficiency targets, established for this School under ESEA Waiver
Schools and Subgroups could meet expectations either by meeting the statewide proficiency rate of 90 percent, or reaching their individually
determined progress targets. The statewide proficiency rate will be increased to 95 percent in 2015.
Performance Targets - Language Arts Literacy
Subgroup# of Valid
Test Scores
Baseline
% Proficient
Yearly
Increment
2012-2013
Target (%P)
2011-2012
Target (%P)
2013-2014
Target (%P)
2014-2015
Target (%P)
2015-2016
Target (%P)
2016-2017
Target (%P)
Baseline
year
90.6 - 90 90 90 90 90Schoolwide 425 901011
92.9 - 90 90 90 90 90White 71 901011
90.6 - 90 90 90 90 90Black 64 901011
89.7 .9 90 90 90 90 90Hispanic 270 901011
- - - - - - -American Indian - -1011
- - - - - - -Asian - -1011
- - - - - - -Two or More Races - -1011
- - - - - - -Students with Disabilities - -1011
- - - - - - -Limited English Proficiency - -1011
90.1 - 90 90 90 90 90Economically Disadvantaged 374 901011
Performance Targets - Mathematics
Subgroup# of Valid
Test Scores
Baseline
% Proficient
Yearly
Increment
2012-2013
Target (%P)
2011-2012
Target (%P)
2013-2014
Target (%P)
2014-2015
Target (%P)
2015-2016
Target (%P)
2016-2017
Target (%P)
Baseline
year
98.6 - 90 90 90 90 90Schoolwide 425 901011
100 - 90 90 90 90 90White 71 901011
98.4 - 90 90 90 90 90Black 64 901011
98.5 - 90 90 90 90 90Hispanic 270 901011
- - - - - - -American Indian - -1011
- - - - - - -Asian - -1011
- - - - - - -Two or More Races - -1011
- - - - - - -Students with Disabilities - -1011
- - - - - - -Limited English Proficiency - -1011
98.7 - 90 90 90 90 90Economically Disadvantaged 374 901011
11/5/2014
Only Includes full year students (Time In School < Year students are removed)
'-' Indicates too few students to determine (N<30)
Title I Accountability System

39-1320-035
Joseph Battin School No. 4
Elizabeth Public Schools
CDS CODE :
DISTRICT :
SCHOOL :
ESEA Waiver - Annual Progress Targets
The tables represent the annual proficiency targets, established for this School under ESEA Waiver
Schools and Subgroups could meet expectations either by meeting the statewide proficiency rate of 90 percent, or reaching their individually
determined progress targets. The statewide proficiency rate will be increased to 95 percent in 2015.
Performance Targets - Language Arts Literacy
Subgroup# of Valid
Test Scores
Baseline
% Proficient
Yearly
Increment
2012-2013
Target (%P)
2011-2012
Target (%P)
2013-2014
Target (%P)
2014-2015
Target (%P)
2015-2016
Target (%P)
2016-2017
Target (%P)
Baseline
year
43 4.8 52.6 57.4 62.2 67 71.8Schoolwide 337 47.81011
- - - - - - -White - -1011
40.8 4.9 50.6 55.5 60.4 65.3 70.2Black 76 45.71011
42.4 4.8 52 56.8 61.6 66.4 71.2Hispanic 231 47.21011
- - - - - - -American Indian - -1011
- - - - - - -Asian - -1011
- - - - - - -Two or More Races - -1011
31.7 5.7 43.1 48.8 54.5 60.2 65.9Students with Disabilities 41 37.41011
16.2 7 23.2 30.2 37.2 44.2 51.2Limited English Proficiency 37 1112
42.1 4.8 51.7 56.5 61.3 66.1 70.9Economically Disadvantaged 306 46.91011
Performance Targets - Mathematics
Subgroup# of Valid
Test Scores
Baseline
% Proficient
Yearly
Increment
2012-2013
Target (%P)
2011-2012
Target (%P)
2013-2014
Target (%P)
2014-2015
Target (%P)
2015-2016
Target (%P)
2016-2017
Target (%P)
Baseline
year
60.2 3.3 66.8 70.1 73.4 76.7 80Schoolwide 337 63.51011
- - - - - - -White - -1011
56.6 3.6 63.8 67.4 71 74.6 78.2Black 76 60.21011
58.9 3.4 65.7 69.1 72.5 75.9 79.3Hispanic 231 62.31011
- - - - - - -American Indian - -1011
- - - - - - -Asian - -1011
- - - - - - -Two or More Races - -1011
48.8 4.3 57.4 61.7 66 70.3 74.6Students with Disabilities 41 53.11011
32.4 5.6 38 43.6 49.2 54.8 60.4Limited English Proficiency 37 1112
60.8 3.3 67.4 70.7 74 77.3 80.6Economically Disadvantaged 306 64.11011
11/5/2014
Only Includes full year students (Time In School < Year students are removed)
'-' Indicates too few students to determine (N<30)
Title I Accountability System

39-1320-090
George Washington School No. 1
Elizabeth Public Schools
CDS CODE :
DISTRICT :
SCHOOL :
ESEA Waiver - Annual Progress Targets
The tables represent the annual proficiency targets, established for this School under ESEA Waiver
Schools and Subgroups could meet expectations either by meeting the statewide proficiency rate of 90 percent, or reaching their individually
determined progress targets. The statewide proficiency rate will be increased to 95 percent in 2015.
Performance Targets - Language Arts Literacy
Subgroup# of Valid
Test Scores
Baseline
% Proficient
Yearly
Increment
2012-2013
Target (%P)
2011-2012
Target (%P)
2013-2014
Target (%P)
2014-2015
Target (%P)
2015-2016
Target (%P)
2016-2017
Target (%P)
Baseline
year
31.8 5.7 43.2 48.9 54.6 60.3 66Schoolwide 400 37.51011
- - - - - - -White - -1011
25.5 6.2 37.9 44.1 50.3 56.5 62.7Black 153 31.71011
34.5 5.5 45.5 51 56.5 62 67.5Hispanic 223 401011
- - - - - - -American Indian - -1011
- - - - - - -Asian - -1011
- - - - - - -Two or More Races - -1011
13.6 7.2 28 35.2 42.4 49.6 56.8Students with Disabilities 44 20.81011
17.6 6.9 31.4 38.3 45.2 52.1 59Limited English Proficiency 34 24.51011
31.2 5.7 42.6 48.3 54 59.7 65.4Economically Disadvantaged 391 36.91011
Performance Targets - Mathematics
Subgroup# of Valid
Test Scores
Baseline
% Proficient
Yearly
Increment
2012-2013
Target (%P)
2011-2012
Target (%P)
2013-2014
Target (%P)
2014-2015
Target (%P)
2015-2016
Target (%P)
2016-2017
Target (%P)
Baseline
year
39.1 5.1 49.3 54.4 59.5 64.6 69.7Schoolwide 399 44.21011
- - - - - - -White - -1011
31.6 5.7 43 48.7 54.4 60.1 65.8Black 152 37.31011
43.5 4.7 52.9 57.6 62.3 67 71.7Hispanic 223 48.21011
- - - - - - -American Indian - -1011
- - - - - - -Asian - -1011
- - - - - - -Two or More Races - -1011
14 7.2 28.4 35.6 42.8 50 57.2Students with Disabilities 43 21.21011
20.6 6.6 33.8 40.4 47 53.6 60.2Limited English Proficiency 34 27.21011
38.9 5.1 49.1 54.2 59.3 64.4 69.5Economically Disadvantaged 390 441011
11/5/2014
Only Includes full year students (Time In School < Year students are removed)
'-' Indicates too few students to determine (N<30)
Title I Accountability System

39-1320-100
Winfield Scott School No. 2
Elizabeth Public Schools
CDS CODE :
DISTRICT :
SCHOOL :
ESEA Waiver - Annual Progress Targets
The tables represent the annual proficiency targets, established for this School under ESEA Waiver
Schools and Subgroups could meet expectations either by meeting the statewide proficiency rate of 90 percent, or reaching their individually
determined progress targets. The statewide proficiency rate will be increased to 95 percent in 2015.
Performance Targets - Language Arts Literacy
Subgroup# of Valid
Test Scores
Baseline
% Proficient
Yearly
Increment
2012-2013
Target (%P)
2011-2012
Target (%P)
2013-2014
Target (%P)
2014-2015
Target (%P)
2015-2016
Target (%P)
2016-2017
Target (%P)
Baseline
year
47.4 4.4 56.2 60.6 65 69.4 73.8Schoolwide 213 51.81011
- - - - - - -White - -1011
38.7 5.1 48.9 54 59.1 64.2 69.3Black 124 43.81011
57.3 3.6 64.5 68.1 71.7 75.3 78.9Hispanic 82 60.91011
- - - - - - -American Indian - -1011
- - - - - - -Asian - -1011
- - - - - - -Two or More Races - -1011
12.9 7.3 27.5 34.8 42.1 49.4 56.7Students with Disabilities 31 20.21011
- - - - - - -Limited English Proficiency - -1011
46.2 4.5 55.2 59.7 64.2 68.7 73.2Economically Disadvantaged 199 50.71011
Performance Targets - Mathematics
Subgroup# of Valid
Test Scores
Baseline
% Proficient
Yearly
Increment
2012-2013
Target (%P)
2011-2012
Target (%P)
2013-2014
Target (%P)
2014-2015
Target (%P)
2015-2016
Target (%P)
2016-2017
Target (%P)
Baseline
year
58.2 3.5 65.2 68.7 72.2 75.7 79.2Schoolwide 213 61.71011
- - - - - - -White - -1011
48.4 4.3 57 61.3 65.6 69.9 74.2Black 124 52.71011
72 2.3 76.6 78.9 81.2 83.5 85.8Hispanic 82 74.31011
- - - - - - -American Indian - -1011
- - - - - - -Asian - -1011
- - - - - - -Two or More Races - -1011
25.8 6.2 38.2 44.4 50.6 56.8 63Students with Disabilities 31 321011
- - - - - - -Limited English Proficiency - -1011
57.8 3.5 64.8 68.3 71.8 75.3 78.8Economically Disadvantaged 199 61.31011
11/5/2014
Only Includes full year students (Time In School < Year students are removed)
'-' Indicates too few students to determine (N<30)
Title I Accountability System

39-1320-110
Nicholas S. Lacorte-Peterstown School No. 3
Elizabeth Public Schools
CDS CODE :
DISTRICT :
SCHOOL :
ESEA Waiver - Annual Progress Targets
The tables represent the annual proficiency targets, established for this School under ESEA Waiver
Schools and Subgroups could meet expectations either by meeting the statewide proficiency rate of 90 percent, or reaching their individually
determined progress targets. The statewide proficiency rate will be increased to 95 percent in 2015.
Performance Targets - Language Arts Literacy
Subgroup# of Valid
Test Scores
Baseline
% Proficient
Yearly
Increment
2012-2013
Target (%P)
2011-2012
Target (%P)
2013-2014
Target (%P)
2014-2015
Target (%P)
2015-2016
Target (%P)
2016-2017
Target (%P)
Baseline
year
39.3 5.1 49.5 54.6 59.7 64.8 69.9Schoolwide 272 44.41011
- - - - - - -White - -1011
32.1 5.7 43.5 49.2 54.9 60.6 66.3Black 56 37.81011
39.3 5.1 49.5 54.6 59.7 64.8 69.9Hispanic 201 44.41011
- - - - - - -American Indian - -1011
- - - - - - -Asian - -1011
- - - - - - -Two or More Races - -1011
23.3 6.4 29.7 36.1 42.5 48.9 55.3Students with Disabilities 30 1112
- - - - - - -Limited English Proficiency - -1011
38.9 5.1 49.1 54.2 59.3 64.4 69.5Economically Disadvantaged 247 441011
Performance Targets - Mathematics
Subgroup# of Valid
Test Scores
Baseline
% Proficient
Yearly
Increment
2012-2013
Target (%P)
2011-2012
Target (%P)
2013-2014
Target (%P)
2014-2015
Target (%P)
2015-2016
Target (%P)
2016-2017
Target (%P)
Baseline
year
59 3.4 65.8 69.2 72.6 76 79.4Schoolwide 273 62.41011
- - - - - - -White - -1011
43.8 4.7 53.2 57.9 62.6 67.3 72Black 57 48.51011
61.7 3.2 68.1 71.3 74.5 77.7 80.9Hispanic 201 64.91011
- - - - - - -American Indian - -1011
- - - - - - -Asian - -1011
- - - - - - -Two or More Races - -1011
13.4 7.2 20.6 27.8 35 42.2 49.4Students with Disabilities 30 1112
- - - - - - -Limited English Proficiency - -1011
59.3 3.4 66.1 69.5 72.9 76.3 79.7Economically Disadvantaged 248 62.71011
11/5/2014
Only Includes full year students (Time In School < Year students are removed)
'-' Indicates too few students to determine (N<30)
Title I Accountability System

39-1320-120
Louverture-Lafayette School No. 6
Elizabeth Public Schools
CDS CODE :
DISTRICT :
SCHOOL :
ESEA Waiver - Annual Progress Targets
The tables represent the annual proficiency targets, established for this School under ESEA Waiver
Schools and Subgroups could meet expectations either by meeting the statewide proficiency rate of 90 percent, or reaching their individually
determined progress targets. The statewide proficiency rate will be increased to 95 percent in 2015.
Performance Targets - Language Arts Literacy
Subgroup# of Valid
Test Scores
Baseline
% Proficient
Yearly
Increment
2012-2013
Target (%P)
2011-2012
Target (%P)
2013-2014
Target (%P)
2014-2015
Target (%P)
2015-2016
Target (%P)
2016-2017
Target (%P)
Baseline
year
33.3 5.6 44.5 50.1 55.7 61.3 66.9Schoolwide 369 38.91011
- - - - - - -White - -1011
29.9 5.9 41.7 47.6 53.5 59.4 65.3Black 144 35.81011
36.3 5.3 46.9 52.2 57.5 62.8 68.1Hispanic 201 41.61011
- - - - - - -American Indian - -1011
- - - - - - -Asian - -1011
- - - - - - -Two or More Races - -1011
15 7.1 29.2 36.3 43.4 50.5 57.6Students with Disabilities 40 22.11011
- - - - - - -Limited English Proficiency - -1011
33.1 5.6 44.3 49.9 55.5 61.1 66.7Economically Disadvantaged 350 38.71011
Performance Targets - Mathematics
Subgroup# of Valid
Test Scores
Baseline
% Proficient
Yearly
Increment
2012-2013
Target (%P)
2011-2012
Target (%P)
2013-2014
Target (%P)
2014-2015
Target (%P)
2015-2016
Target (%P)
2016-2017
Target (%P)
Baseline
year
44.6 4.6 53.8 58.4 63 67.6 72.2Schoolwide 366 49.21011
- - - - - - -White - -1011
38 5.2 48.4 53.6 58.8 64 69.2Black 142 43.21011
49.3 4.2 57.7 61.9 66.1 70.3 74.5Hispanic 201 53.51011
- - - - - - -American Indian - -1011
- - - - - - -Asian - -1011
- - - - - - -Two or More Races - -1011
30.7 5.8 42.3 48.1 53.9 59.7 65.5Students with Disabilities 39 36.51011
- - - - - - -Limited English Proficiency - -1011
45 4.6 54.2 58.8 63.4 68 72.6Economically Disadvantaged 347 49.61011
11/5/2014
Only Includes full year students (Time In School < Year students are removed)
'-' Indicates too few students to determine (N<30)
Title I Accountability System
39-1320-150
Elmora School No. 12
Elizabeth Public Schools
CDS CODE :
DISTRICT :
SCHOOL :
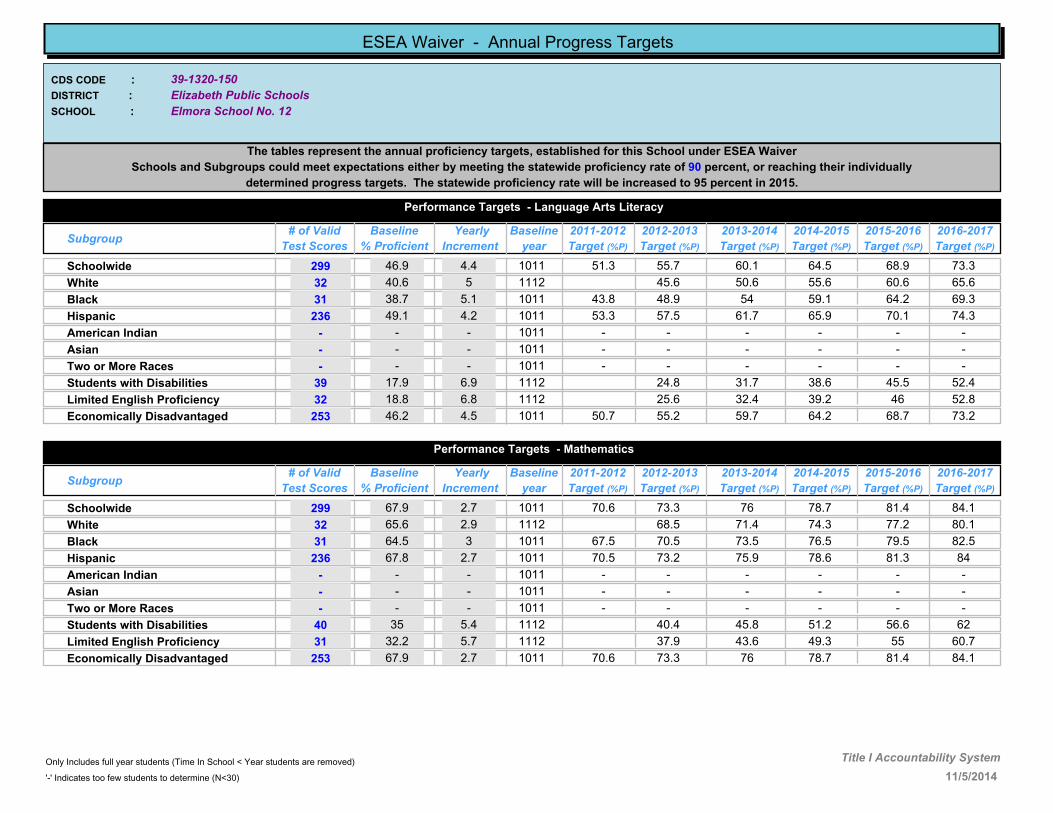
ESEA Waiver - Annual Progress Targets
The tables represent the annual proficiency targets, established for this School under ESEA Waiver
Schools and Subgroups could meet expectations either by meeting the statewide proficiency rate of 90 percent, or reaching their individually
determined progress targets. The statewide proficiency rate will be increased to 95 percent in 2015.
Performance Targets - Language Arts Literacy
Subgroup# of Valid
Test Scores
Baseline
% Proficient
Yearly
Increment
2012-2013
Target (%P)
2011-2012
Target (%P)
2013-2014
Target (%P)
2014-2015
Target (%P)
2015-2016
Target (%P)
2016-2017
Target (%P)
Baseline
year
46.9 4.4 55.7 60.1 64.5 68.9 73.3Schoolwide 299 51.31011
40.6 5 45.6 50.6 55.6 60.6 65.6White 32 1112
38.7 5.1 48.9 54 59.1 64.2 69.3Black 31 43.81011
49.1 4.2 57.5 61.7 65.9 70.1 74.3Hispanic 236 53.31011
- - - - - - -American Indian - -1011
- - - - - - -Asian - -1011
- - - - - - -Two or More Races - -1011
17.9 6.9 24.8 31.7 38.6 45.5 52.4Students with Disabilities 39 1112
18.8 6.8 25.6 32.4 39.2 46 52.8Limited English Proficiency 32 1112
46.2 4.5 55.2 59.7 64.2 68.7 73.2Economically Disadvantaged 253 50.71011
Performance Targets - Mathematics
Subgroup# of Valid
Test Scores
Baseline
% Proficient
Yearly
Increment
2012-2013
Target (%P)
2011-2012
Target (%P)
2013-2014
Target (%P)
2014-2015
Target (%P)
2015-2016
Target (%P)
2016-2017
Target (%P)
Baseline
year
67.9 2.7 73.3 76 78.7 81.4 84.1Schoolwide 299 70.61011
65.6 2.9 68.5 71.4 74.3 77.2 80.1White 32 1112
64.5 3 70.5 73.5 76.5 79.5 82.5Black 31 67.51011
67.8 2.7 73.2 75.9 78.6 81.3 84Hispanic 236 70.51011
- - - - - - -American Indian - -1011
- - - - - - -Asian - -1011
- - - - - - -Two or More Races - -1011
35 5.4 40.4 45.8 51.2 56.6 62Students with Disabilities 40 1112
32.2 5.7 37.9 43.6 49.3 55 60.7Limited English Proficiency 31 1112
67.9 2.7 73.3 76 78.7 81.4 84.1Economically Disadvantaged 253 70.61011
11/5/2014
Only Includes full year students (Time In School < Year students are removed)
'-' Indicates too few students to determine (N<30)
Title I Accountability System

39-1320-160
Benjamin Franklin School No. 13
Elizabeth Public Schools
CDS CODE :
DISTRICT :
SCHOOL :
ESEA Waiver - Annual Progress Targets
The tables represent the annual proficiency targets, established for this School under ESEA Waiver
Schools and Subgroups could meet expectations either by meeting the statewide proficiency rate of 90 percent, or reaching their individually
determined progress targets. The statewide proficiency rate will be increased to 95 percent in 2015.
Performance Targets - Language Arts Literacy
Subgroup# of Valid
Test Scores
Baseline
% Proficient
Yearly
Increment
2012-2013
Target (%P)
2011-2012
Target (%P)
2013-2014
Target (%P)
2014-2015
Target (%P)
2015-2016
Target (%P)
2016-2017
Target (%P)
Baseline
year
40.3 5 50.3 55.3 60.3 65.3 70.3Schoolwide 186 45.31011
- - - - - - -White - -1011
29.2 5.9 41 46.9 52.8 58.7 64.6Black 48 35.11011
41.7 4.9 51.5 56.4 61.3 66.2 71.1Hispanic 108 46.61011
- - - - - - -American Indian - -1011
- - - - - - -Asian - -1011
- - - - - - -Two or More Races - -1011
- - - - - - -Students with Disabilities - -1011
- - - - - - -Limited English Proficiency - -1011
39.4 5.1 49.6 54.7 59.8 64.9 70Economically Disadvantaged 180 44.51011
Performance Targets - Mathematics
Subgroup# of Valid
Test Scores
Baseline
% Proficient
Yearly
Increment
2012-2013
Target (%P)
2011-2012
Target (%P)
2013-2014
Target (%P)
2014-2015
Target (%P)
2015-2016
Target (%P)
2016-2017
Target (%P)
Baseline
year
66.1 2.8 71.7 74.5 77.3 80.1 82.9Schoolwide 186 68.91011
- - - - - - -White - -1011
50 4.2 58.4 62.6 66.8 71 75.2Black 48 54.21011
69.5 2.6 74.7 77.3 79.9 82.5 85.1Hispanic 108 72.11011
- - - - - - -American Indian - -1011
- - - - - - -Asian - -1011
- - - - - - -Two or More Races - -1011
- - - - - - -Students with Disabilities - -1011
- - - - - - -Limited English Proficiency - -1011
65.5 2.9 71.3 74.2 77.1 80 82.9Economically Disadvantaged 180 68.41011
11/5/2014
Only Includes full year students (Time In School < Year students are removed)
'-' Indicates too few students to determine (N<30)
Title I Accountability System

39-1320-170
Abraham Lincoln School No. 14
Elizabeth Public Schools
CDS CODE :
DISTRICT :
SCHOOL :
ESEA Waiver - Annual Progress Targets
The tables represent the annual proficiency targets, established for this School under ESEA Waiver
Schools and Subgroups could meet expectations either by meeting the statewide proficiency rate of 90 percent, or reaching their individually
determined progress targets. The statewide proficiency rate will be increased to 95 percent in 2015.
Performance Targets - Language Arts Literacy
Subgroup# of Valid
Test Scores
Baseline
% Proficient
Yearly
Increment
2012-2013
Target (%P)
2011-2012
Target (%P)
2013-2014
Target (%P)
2014-2015
Target (%P)
2015-2016
Target (%P)
2016-2017
Target (%P)
Baseline
year
48.9 4.3 57.5 61.8 66.1 70.4 74.7Schoolwide 319 53.21011
65.6 2.9 71.4 74.3 77.2 80.1 83White 32 68.51011
61.3 3.2 64.5 67.7 70.9 74.1 77.3Black 31 1112
46.4 4.5 55.4 59.9 64.4 68.9 73.4Hispanic 252 50.91011
- - - - - - -American Indian - -1011
- - - - - - -Asian - -1011
- - - - - - -Two or More Races - -1011
42.4 4.8 47.2 52 56.8 61.6 66.4Students with Disabilities 33 1112
70.6 2.5 73.1 75.6 78.1 80.6 83.1Limited English Proficiency 34 1112
48.2 4.3 56.8 61.1 65.4 69.7 74Economically Disadvantaged 274 52.51011
Performance Targets - Mathematics
Subgroup# of Valid
Test Scores
Baseline
% Proficient
Yearly
Increment
2012-2013
Target (%P)
2011-2012
Target (%P)
2013-2014
Target (%P)
2014-2015
Target (%P)
2015-2016
Target (%P)
2016-2017
Target (%P)
Baseline
year
68.7 2.6 73.9 76.5 79.1 81.7 84.3Schoolwide 320 71.31011
84.4 1.3 87 88.3 89.6 90 90White 32 85.71011
61.3 3.2 64.5 67.7 70.9 74.1 77.3Black 31 1112
69.2 2.6 74.4 77 79.6 82.2 84.8Hispanic 253 71.81011
- - - - - - -American Indian - -1011
- - - - - - -Asian - -1011
- - - - - - -Two or More Races - -1011
57.6 3.5 61.1 64.6 68.1 71.6 75.1Students with Disabilities 33 1112
82.3 1.5 83.8 85.3 86.8 88.3 89.8Limited English Proficiency 34 1112
68 2.7 73.4 76.1 78.8 81.5 84.2Economically Disadvantaged 275 70.71011
11/5/2014
Only Includes full year students (Time In School < Year students are removed)
'-' Indicates too few students to determine (N<30)
Title I Accountability System

39-1320-180
Christopher Columbus School No. 15
Elizabeth Public Schools
CDS CODE :
DISTRICT :
SCHOOL :
ESEA Waiver - Annual Progress Targets
The tables represent the annual proficiency targets, established for this School under ESEA Waiver
Schools and Subgroups could meet expectations either by meeting the statewide proficiency rate of 90 percent, or reaching their individually
determined progress targets. The statewide proficiency rate will be increased to 95 percent in 2015.
Performance Targets - Language Arts Literacy
Subgroup# of Valid
Test Scores
Baseline
% Proficient
Yearly
Increment
2012-2013
Target (%P)
2011-2012
Target (%P)
2013-2014
Target (%P)
2014-2015
Target (%P)
2015-2016
Target (%P)
2016-2017
Target (%P)
Baseline
year
66.9 2.8 72.5 75.3 78.1 80.9 83.7Schoolwide 245 69.71011
- - - - - - -White - -1011
36.1 5.3 41.4 46.7 52 57.3 62.6Black 36 1112
65.8 2.9 71.6 74.5 77.4 80.3 83.2Hispanic 213 68.71011
- - - - - - -American Indian - -1011
- - - - - - -Asian - -1011
- - - - - - -Two or More Races - -1011
26.2 6.2 32.4 38.6 44.8 51 57.2Students with Disabilities 42 1112
- - - - - - -Limited English Proficiency - -1011
66.4 2.8 72 74.8 77.6 80.4 83.2Economically Disadvantaged 226 69.21011
Performance Targets - Mathematics
Subgroup# of Valid
Test Scores
Baseline
% Proficient
Yearly
Increment
2012-2013
Target (%P)
2011-2012
Target (%P)
2013-2014
Target (%P)
2014-2015
Target (%P)
2015-2016
Target (%P)
2016-2017
Target (%P)
Baseline
year
82.4 1.5 85.4 86.9 88.4 89.9 90Schoolwide 245 83.91011
- - - - - - -White - -1011
66.7 2.8 69.5 72.3 75.1 77.9 80.7Black 36 1112
81.7 1.5 84.7 86.2 87.7 89.2 90Hispanic 213 83.21011
- - - - - - -American Indian - -1011
- - - - - - -Asian - -1011
- - - - - - -Two or More Races - -1011
47.6 4.4 52 56.4 60.8 65.2 69.6Students with Disabilities 42 1112
- - - - - - -Limited English Proficiency - -1011
83.2 1.4 86 87.4 88.8 90 90Economically Disadvantaged 226 84.61011
11/5/2014
Only Includes full year students (Time In School < Year students are removed)
'-' Indicates too few students to determine (N<30)
Title I Accountability System

39-1320-190
Madison Monroe School No. 16
Elizabeth Public Schools
CDS CODE :
DISTRICT :
SCHOOL :
ESEA Waiver - Annual Progress Targets
The tables represent the annual proficiency targets, established for this School under ESEA Waiver
Schools and Subgroups could meet expectations either by meeting the statewide proficiency rate of 90 percent, or reaching their individually
determined progress targets. The statewide proficiency rate will be increased to 95 percent in 2015.
Performance Targets - Language Arts Literacy
Subgroup# of Valid
Test Scores
Baseline
% Proficient
Yearly
Increment
2012-2013
Target (%P)
2011-2012
Target (%P)
2013-2014
Target (%P)
2014-2015
Target (%P)
2015-2016
Target (%P)
2016-2017
Target (%P)
Baseline
year
49.6 4.2 58 62.2 66.4 70.6 74.8Schoolwide 268 53.81011
62.7 3.1 68.9 72 75.1 78.2 81.3White 59 65.81011
58.1 3.5 65.1 68.6 72.1 75.6 79.1Black 31 61.61011
43.4 4.7 52.8 57.5 62.2 66.9 71.6Hispanic 175 48.11011
- - - - - - -American Indian - -1011
- - - - - - -Asian - -1011
- - - - - - -Two or More Races - -1011
- - - - - - -Students with Disabilities - -1011
23 6.4 29.4 35.8 42.2 48.6Limited English Proficiency 65 1213
47.7 4.4 56.5 60.9 65.3 69.7 74.1Economically Disadvantaged 239 52.11011
Performance Targets - Mathematics
Subgroup# of Valid
Test Scores
Baseline
% Proficient
Yearly
Increment
2012-2013
Target (%P)
2011-2012
Target (%P)
2013-2014
Target (%P)
2014-2015
Target (%P)
2015-2016
Target (%P)
2016-2017
Target (%P)
Baseline
year
66.5 2.8 72.1 74.9 77.7 80.5 83.3Schoolwide 269 69.31011
80 1.7 83.4 85.1 86.8 88.5 90White 60 81.71011
54.8 3.8 62.4 66.2 70 73.8 77.6Black 31 58.61011
63.4 3.1 69.6 72.7 75.8 78.9 82Hispanic 175 66.51011
- - - - - - -American Indian - -1011
- - - - - - -Asian - -1011
- - - - - - -Two or More Races - -1011
- - - - - - -Students with Disabilities - -1011
44.6 4.6 49.2 53.8 58.4 63Limited English Proficiency 65 1213
66.2 2.8 71.8 74.6 77.4 80.2 83Economically Disadvantaged 240 691011
11/5/2014
Only Includes full year students (Time In School < Year students are removed)
'-' Indicates too few students to determine (N<30)
Title I Accountability System
39-1320-210
Robert Morris School No. 18
Elizabeth Public Schools
CDS CODE :
DISTRICT :
SCHOOL :
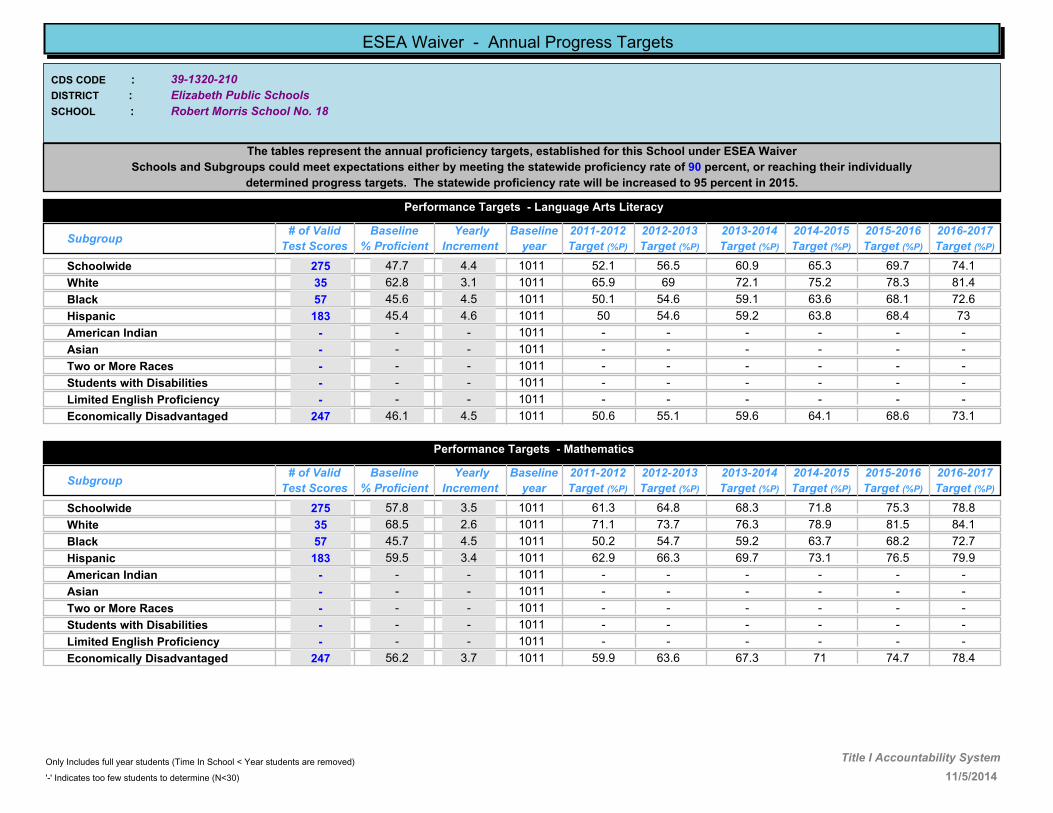
ESEA Waiver - Annual Progress Targets
The tables represent the annual proficiency targets, established for this School under ESEA Waiver
Schools and Subgroups could meet expectations either by meeting the statewide proficiency rate of 90 percent, or reaching their individually
determined progress targets. The statewide proficiency rate will be increased to 95 percent in 2015.
Performance Targets - Language Arts Literacy
Subgroup# of Valid
Test Scores
Baseline
% Proficient
Yearly
Increment
2012-2013
Target (%P)
2011-2012
Target (%P)
2013-2014
Target (%P)
2014-2015
Target (%P)
2015-2016
Target (%P)
2016-2017
Target (%P)
Baseline
year
47.7 4.4 56.5 60.9 65.3 69.7 74.1Schoolwide 275 52.11011
62.8 3.1 69 72.1 75.2 78.3 81.4White 35 65.91011
45.6 4.5 54.6 59.1 63.6 68.1 72.6Black 57 50.11011
45.4 4.6 54.6 59.2 63.8 68.4 73Hispanic 183 501011
- - - - - - -American Indian - -1011
- - - - - - -Asian - -1011
- - - - - - -Two or More Races - -1011
- - - - - - -Students with Disabilities - -1011
- - - - - - -Limited English Proficiency - -1011
46.1 4.5 55.1 59.6 64.1 68.6 73.1Economically Disadvantaged 247 50.61011
Performance Targets - Mathematics
Subgroup# of Valid
Test Scores
Baseline
% Proficient
Yearly
Increment
2012-2013
Target (%P)
2011-2012
Target (%P)
2013-2014
Target (%P)
2014-2015
Target (%P)
2015-2016
Target (%P)
2016-2017
Target (%P)
Baseline
year
57.8 3.5 64.8 68.3 71.8 75.3 78.8Schoolwide 275 61.31011
68.5 2.6 73.7 76.3 78.9 81.5 84.1White 35 71.11011
45.7 4.5 54.7 59.2 63.7 68.2 72.7Black 57 50.21011
59.5 3.4 66.3 69.7 73.1 76.5 79.9Hispanic 183 62.91011
- - - - - - -American Indian - -1011
- - - - - - -Asian - -1011
- - - - - - -Two or More Races - -1011
- - - - - - -Students with Disabilities - -1011
- - - - - - -Limited English Proficiency - -1011
56.2 3.7 63.6 67.3 71 74.7 78.4Economically Disadvantaged 247 59.91011
11/5/2014
Only Includes full year students (Time In School < Year students are removed)
'-' Indicates too few students to determine (N<30)
Title I Accountability System

39-1320-220
Woodrow Wilson School No. 19
Elizabeth Public Schools
CDS CODE :
DISTRICT :
SCHOOL :
ESEA Waiver - Annual Progress Targets
The tables represent the annual proficiency targets, established for this School under ESEA Waiver
Schools and Subgroups could meet expectations either by meeting the statewide proficiency rate of 90 percent, or reaching their individually
determined progress targets. The statewide proficiency rate will be increased to 95 percent in 2015.
Performance Targets - Language Arts Literacy
Subgroup# of Valid
Test Scores
Baseline
% Proficient
Yearly
Increment
2012-2013
Target (%P)
2011-2012
Target (%P)
2013-2014
Target (%P)
2014-2015
Target (%P)
2015-2016
Target (%P)
2016-2017
Target (%P)
Baseline
year
39 5.1 49.2 54.3 59.4 64.5 69.6Schoolwide 302 44.11011
34.1 5.5 45.1 50.6 56.1 61.6 67.1White 41 39.61011
37.2 5.3 47.8 53.1 58.4 63.7 69Black 35 42.51011
39.3 5.1 49.5 54.6 59.7 64.8 69.9Hispanic 214 44.41011
- - - - - - -American Indian - -1011
- - - - - - -Asian - -1011
- - - - - - -Two or More Races - -1011
27.5 6.1 39.7 45.8 51.9 58 64.1Students with Disabilities 40 33.61011
- - - - - - -Limited English Proficiency - -1011
38.5 5.1 48.7 53.8 58.9 64 69.1Economically Disadvantaged 278 43.61011
Performance Targets - Mathematics
Subgroup# of Valid
Test Scores
Baseline
% Proficient
Yearly
Increment
2012-2013
Target (%P)
2011-2012
Target (%P)
2013-2014
Target (%P)
2014-2015
Target (%P)
2015-2016
Target (%P)
2016-2017
Target (%P)
Baseline
year
51.5 4.1 59.7 63.8 67.9 72 76.1Schoolwide 301 55.61011
39 5.1 49.2 54.3 59.4 64.5 69.6White 41 44.11011
44.1 4.7 53.5 58.2 62.9 67.6 72.3Black 34 48.81011
54.2 3.8 61.8 65.6 69.4 73.2 77Hispanic 214 581011
- - - - - - -American Indian - -1011
- - - - - - -Asian - -1011
- - - - - - -Two or More Races - -1011
30 5.8 41.6 47.4 53.2 59 64.8Students with Disabilities 40 35.81011
- - - - - - -Limited English Proficiency - -1011
52.7 4 60.7 64.7 68.7 72.7 76.7Economically Disadvantaged 277 56.71011
11/5/2014
Only Includes full year students (Time In School < Year students are removed)
'-' Indicates too few students to determine (N<30)
Title I Accountability System

39-1320-230
John Marshal School No. 20
Elizabeth Public Schools
CDS CODE :
DISTRICT :
SCHOOL :
ESEA Waiver - Annual Progress Targets
The tables represent the annual proficiency targets, established for this School under ESEA Waiver
Schools and Subgroups could meet expectations either by meeting the statewide proficiency rate of 90 percent, or reaching their individually
determined progress targets. The statewide proficiency rate will be increased to 95 percent in 2015.
Performance Targets - Language Arts Literacy
Subgroup# of Valid
Test Scores
Baseline
% Proficient
Yearly
Increment
2012-2013
Target (%P)
2011-2012
Target (%P)
2013-2014
Target (%P)
2014-2015
Target (%P)
2015-2016
Target (%P)
2016-2017
Target (%P)
Baseline
year
50 4.2 58.4 62.6 66.8 71 75.2Schoolwide 154 54.21011
- - - - - - -White - -1011
41 4.9 50.8 55.7 60.6 65.5 70.4Black 83 45.91011
61.2 3.2 67.6 70.8 74 77.2 80.4Hispanic 67 64.41011
- - - - - - -American Indian - -1011
- - - - - - -Asian - -1011
- - - - - - -Two or More Races - -1011
16.7 7 23.7 30.7 37.7 44.7 51.7Students with Disabilities 30 1112
- - - - - - -Limited English Proficiency - -1011
50 4.2 58.4 62.6 66.8 71 75.2Economically Disadvantaged 148 54.21011
Performance Targets - Mathematics
Subgroup# of Valid
Test Scores
Baseline
% Proficient
Yearly
Increment
2012-2013
Target (%P)
2011-2012
Target (%P)
2013-2014
Target (%P)
2014-2015
Target (%P)
2015-2016
Target (%P)
2016-2017
Target (%P)
Baseline
year
61.7 3.2 68.1 71.3 74.5 77.7 80.9Schoolwide 154 64.91011
- - - - - - -White - -1011
50.6 4.1 58.8 62.9 67 71.1 75.2Black 83 54.71011
74.6 2.1 78.8 80.9 83 85.1 87.2Hispanic 67 76.71011
- - - - - - -American Indian - -1011
- - - - - - -Asian - -1011
- - - - - - -Two or More Races - -1011
30 5.8 35.8 41.6 47.4 53.2 59Students with Disabilities 30 1112
- - - - - - -Limited English Proficiency - -1011
62.9 3.1 69.1 72.2 75.3 78.4 81.5Economically Disadvantaged 148 661011
11/5/2014
Only Includes full year students (Time In School < Year students are removed)
'-' Indicates too few students to determine (N<30)
Title I Accountability System

39-1320-240
Victor Mravlag School No. 21
Elizabeth Public Schools
CDS CODE :
DISTRICT :
SCHOOL :
ESEA Waiver - Annual Progress Targets
The tables represent the annual proficiency targets, established for this School under ESEA Waiver
Schools and Subgroups could meet expectations either by meeting the statewide proficiency rate of 90 percent, or reaching their individually
determined progress targets. The statewide proficiency rate will be increased to 95 percent in 2015.
Performance Targets - Language Arts Literacy
Subgroup# of Valid
Test Scores
Baseline
% Proficient
Yearly
Increment
2012-2013
Target (%P)
2011-2012
Target (%P)
2013-2014
Target (%P)
2014-2015
Target (%P)
2015-2016
Target (%P)
2016-2017
Target (%P)
Baseline
year
60.8 3.3 67.4 70.7 74 77.3 80.6Schoolwide 51 64.11011
- - - - - - -White - -1011
- - - - - - -Black - -1011
61.7 3.2 68.1 71.3 74.5 77.7 80.9Hispanic 34 64.91011
- - - - - - -American Indian - -1011
- - - - - - -Asian - -1011
- - - - - - -Two or More Races - -1011
- - - - - - -Students with Disabilities - -1011
- - - - - - -Limited English Proficiency - -1011
66.6 2.8 72.2 75 77.8 80.6 83.4Economically Disadvantaged 30 69.41011
Performance Targets - Mathematics
Subgroup# of Valid
Test Scores
Baseline
% Proficient
Yearly
Increment
2012-2013
Target (%P)
2011-2012
Target (%P)
2013-2014
Target (%P)
2014-2015
Target (%P)
2015-2016
Target (%P)
2016-2017
Target (%P)
Baseline
year
84.3 1.3 86.9 88.2 89.5 90 90Schoolwide 51 85.61011
- - - - - - -White - -1011
- - - - - - -Black - -1011
88.2 1 90 90 90 90 90Hispanic 34 89.21011
- - - - - - -American Indian - -1011
- - - - - - -Asian - -1011
- - - - - - -Two or More Races - -1011
- - - - - - -Students with Disabilities - -1011
- - - - - - -Limited English Proficiency - -1011
86.7 1.1 88.9 90 90 90 90Economically Disadvantaged 30 87.81011
11/5/2014
Only Includes full year students (Time In School < Year students are removed)
'-' Indicates too few students to determine (N<30)
Title I Accountability System

39-1320-250
William F. Halloran School No.22
Elizabeth Public Schools
CDS CODE :
DISTRICT :
SCHOOL :
ESEA Waiver - Annual Progress Targets
The tables represent the annual proficiency targets, established for this School under ESEA Waiver
Schools and Subgroups could meet expectations either by meeting the statewide proficiency rate of 90 percent, or reaching their individually
determined progress targets. The statewide proficiency rate will be increased to 95 percent in 2015.
Performance Targets - Language Arts Literacy
Subgroup# of Valid
Test Scores
Baseline
% Proficient
Yearly
Increment
2012-2013
Target (%P)
2011-2012
Target (%P)
2013-2014
Target (%P)
2014-2015
Target (%P)
2015-2016
Target (%P)
2016-2017
Target (%P)
Baseline
year
95.2 - 90 90 90 90 90Schoolwide 502 901011
95.6 - 90 90 90 90 90White 91 901011
92.6 - 90 90 90 90 90Black 81 901011
95.7 - 90 90 90 90 90Hispanic 302 901011
- - - - - - -American Indian - -1011
97.2 - 90 90 90 90 90Asian 36 1112
- - - - - - -Two or More Races - -1011
- - - - - - -Students with Disabilities - -1011
- - - - - - -Limited English Proficiency - -1011
94.5 - 90 90 90 90 90Economically Disadvantaged 360 901011
Performance Targets - Mathematics
Subgroup# of Valid
Test Scores
Baseline
% Proficient
Yearly
Increment
2012-2013
Target (%P)
2011-2012
Target (%P)
2013-2014
Target (%P)
2014-2015
Target (%P)
2015-2016
Target (%P)
2016-2017
Target (%P)
Baseline
year
98.2 - 90 90 90 90 90Schoolwide 502 901011
98.9 - 90 90 90 90 90White 91 901011
96.3 - 90 90 90 90 90Black 81 901011
98.7 - 90 90 90 90 90Hispanic 302 901011
- - - - - - -American Indian - -1011
100 - 90 90 90 90 90Asian 36 1112
- - - - - - -Two or More Races - -1011
- - - - - - -Students with Disabilities - -1011
- - - - - - -Limited English Proficiency - -1011
98.4 - 90 90 90 90 90Economically Disadvantaged 360 901011
11/5/2014
Only Includes full year students (Time In School < Year students are removed)
'-' Indicates too few students to determine (N<30)
Title I Accountability System

39-1320-260
Nicholas Murray Butler School No. 23
Elizabeth Public Schools
CDS CODE :
DISTRICT :
SCHOOL :
ESEA Waiver - Annual Progress Targets
The tables represent the annual proficiency targets, established for this School under ESEA Waiver
Schools and Subgroups could meet expectations either by meeting the statewide proficiency rate of 90 percent, or reaching their individually
determined progress targets. The statewide proficiency rate will be increased to 95 percent in 2015.
Performance Targets - Language Arts Literacy
Subgroup# of Valid
Test Scores
Baseline
% Proficient
Yearly
Increment
2012-2013
Target (%P)
2011-2012
Target (%P)
2013-2014
Target (%P)
2014-2015
Target (%P)
2015-2016
Target (%P)
2016-2017
Target (%P)
Baseline
year
37.8 5.2 48.2 53.4 58.6 63.8 69Schoolwide 299 431011
- - - - - - -White - -1011
33.3 5.6 44.5 50.1 55.7 61.3 66.9Black 183 38.91011
46.8 4.5 55.8 60.3 64.8 69.3 73.8Hispanic 92 51.31011
- - - - - - -American Indian - -1011
- - - - - - -Asian - -1011
- - - - - - -Two or More Races - -1011
17 6.9 30.8 37.7 44.6 51.5 58.4Students with Disabilities 47 23.91011
- - - - - - -Limited English Proficiency - -1011
37.2 5.2 47.6 52.8 58 63.2 68.4Economically Disadvantaged 274 42.41011
Performance Targets - Mathematics
Subgroup# of Valid
Test Scores
Baseline
% Proficient
Yearly
Increment
2012-2013
Target (%P)
2011-2012
Target (%P)
2013-2014
Target (%P)
2014-2015
Target (%P)
2015-2016
Target (%P)
2016-2017
Target (%P)
Baseline
year
55.3 3.7 62.7 66.4 70.1 73.8 77.5Schoolwide 298 591011
- - - - - - -White - -1011
52.2 4 60.2 64.2 68.2 72.2 76.2Black 182 56.21011
58.7 3.5 65.7 69.2 72.7 76.2 79.7Hispanic 92 62.21011
- - - - - - -American Indian - -1011
- - - - - - -Asian - -1011
- - - - - - -Two or More Races - -1011
30.4 5.8 42 47.8 53.6 59.4 65.2Students with Disabilities 46 36.21011
- - - - - - -Limited English Proficiency - -1011
55 3.8 62.6 66.4 70.2 74 77.8Economically Disadvantaged 273 58.81011
11/5/2014
Only Includes full year students (Time In School < Year students are removed)
'-' Indicates too few students to determine (N<30)
Title I Accountability System
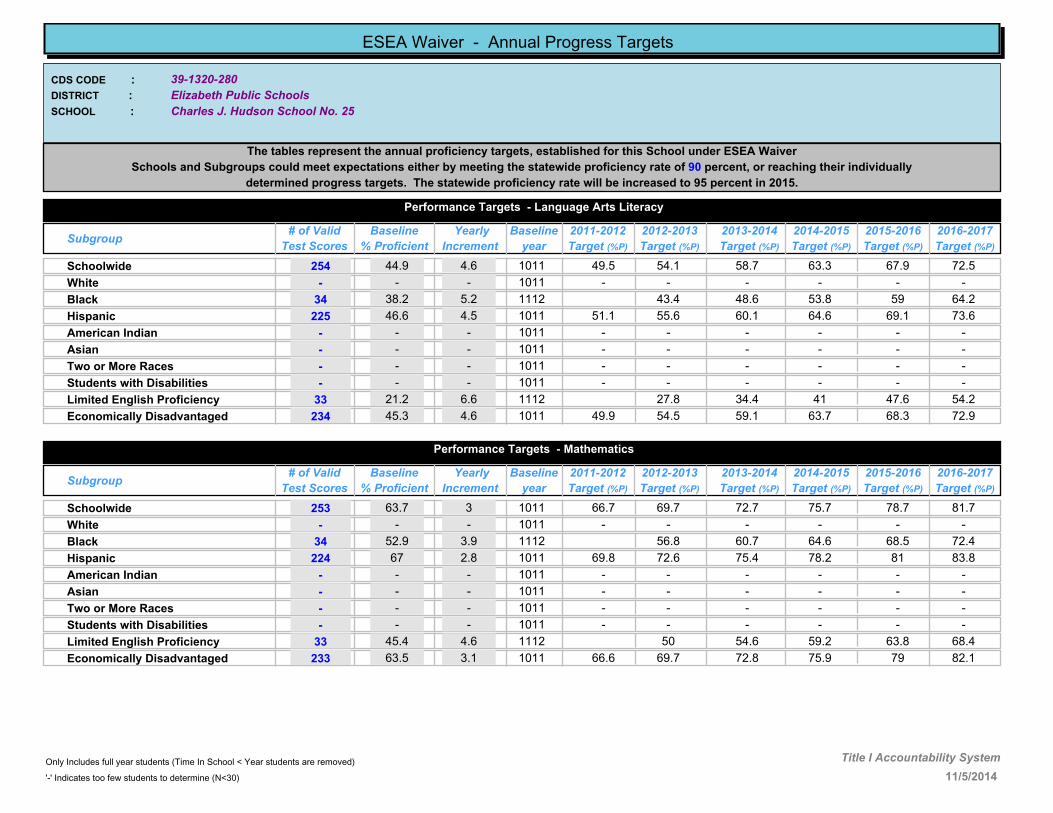
39-1320-280
Charles J. Hudson School No. 25
Elizabeth Public Schools
CDS CODE :
DISTRICT :
SCHOOL :
ESEA Waiver - Annual Progress Targets
The tables represent the annual proficiency targets, established for this School under ESEA Waiver
Schools and Subgroups could meet expectations either by meeting the statewide proficiency rate of 90 percent, or reaching their individually
determined progress targets. The statewide proficiency rate will be increased to 95 percent in 2015.
Performance Targets - Language Arts Literacy
Subgroup# of Valid
Test Scores
Baseline
% Proficient
Yearly
Increment
2012-2013
Target (%P)
2011-2012
Target (%P)
2013-2014
Target (%P)
2014-2015
Target (%P)
2015-2016
Target (%P)
2016-2017
Target (%P)
Baseline
year
44.9 4.6 54.1 58.7 63.3 67.9 72.5Schoolwide 254 49.51011
- - - - - - -White - -1011
38.2 5.2 43.4 48.6 53.8 59 64.2Black 34 1112
46.6 4.5 55.6 60.1 64.6 69.1 73.6Hispanic 225 51.11011
- - - - - - -American Indian - -1011
- - - - - - -Asian - -1011
- - - - - - -Two or More Races - -1011
- - - - - - -Students with Disabilities - -1011
21.2 6.6 27.8 34.4 41 47.6 54.2Limited English Proficiency 33 1112
45.3 4.6 54.5 59.1 63.7 68.3 72.9Economically Disadvantaged 234 49.91011
Performance Targets - Mathematics
Subgroup# of Valid
Test Scores
Baseline
% Proficient
Yearly
Increment
2012-2013
Target (%P)
2011-2012
Target (%P)
2013-2014
Target (%P)
2014-2015
Target (%P)
2015-2016
Target (%P)
2016-2017
Target (%P)
Baseline
year
63.7 3 69.7 72.7 75.7 78.7 81.7Schoolwide 253 66.71011
- - - - - - -White - -1011
52.9 3.9 56.8 60.7 64.6 68.5 72.4Black 34 1112
67 2.8 72.6 75.4 78.2 81 83.8Hispanic 224 69.81011
- - - - - - -American Indian - -1011
- - - - - - -Asian - -1011
- - - - - - -Two or More Races - -1011
- - - - - - -Students with Disabilities - -1011
45.4 4.6 50 54.6 59.2 63.8 68.4Limited English Proficiency 33 1112
63.5 3.1 69.7 72.8 75.9 79 82.1Economically Disadvantaged 233 66.61011
11/5/2014
Only Includes full year students (Time In School < Year students are removed)
'-' Indicates too few students to determine (N<30)
Title I Accountability System

39-1320-290
Dr. Orlando Edreira Academy School No. 26
Elizabeth Public Schools
CDS CODE :
DISTRICT :
SCHOOL :
ESEA Waiver - Annual Progress Targets
The tables represent the annual proficiency targets, established for this School under ESEA Waiver
Schools and Subgroups could meet expectations either by meeting the statewide proficiency rate of 90 percent, or reaching their individually
determined progress targets. The statewide proficiency rate will be increased to 95 percent in 2015.
Performance Targets - Language Arts Literacy
Subgroup# of Valid
Test Scores
Baseline
% Proficient
Yearly
Increment
2012-2013
Target (%P)
2011-2012
Target (%P)
2013-2014
Target (%P)
2014-2015
Target (%P)
2015-2016
Target (%P)
2016-2017
Target (%P)
Baseline
year
64.8 2.9 70.6 73.5 76.4 79.3 82.2Schoolwide 273 67.71011
- - - - - - -White - -1011
51.1 4.1 59.3 63.4 67.5 71.6 75.7Black 45 55.21011
67.8 2.7 73.2 75.9 78.6 81.3 84Hispanic 208 70.51011
- - - - - - -American Indian - -1011
- - - - - - -Asian - -1011
- - - - - - -Two or More Races - -1011
- - - - - - -Students with Disabilities - -1011
- - - - - - -Limited English Proficiency - -1011
64.7 3 70.7 73.7 76.7 79.7 82.7Economically Disadvantaged 235 67.71011
Performance Targets - Mathematics
Subgroup# of Valid
Test Scores
Baseline
% Proficient
Yearly
Increment
2012-2013
Target (%P)
2011-2012
Target (%P)
2013-2014
Target (%P)
2014-2015
Target (%P)
2015-2016
Target (%P)
2016-2017
Target (%P)
Baseline
year
86.1 1.2 88.5 89.7 90 90 90Schoolwide 273 87.31011
- - - - - - -White - -1011
82.2 1.5 85.2 86.7 88.2 89.7 90Black 45 83.71011
86.6 1.1 88.8 89.9 90 90 90Hispanic 208 87.71011
- - - - - - -American Indian - -1011
- - - - - - -Asian - -1011
- - - - - - -Two or More Races - -1011
- - - - - - -Students with Disabilities - -1011
- - - - - - -Limited English Proficiency - -1011
85.6 1.2 88 89.2 90 90 90Economically Disadvantaged 235 86.81011
11/5/2014
Only Includes full year students (Time In School < Year students are removed)
'-' Indicates too few students to determine (N<30)
Title I Accountability System

39-1320-295
Dr. Albert Einstein Academy School No. 29
Elizabeth Public Schools
CDS CODE :
DISTRICT :
SCHOOL :
ESEA Waiver - Annual Progress Targets
The tables represent the annual proficiency targets, established for this School under ESEA Waiver
Schools and Subgroups could meet expectations either by meeting the statewide proficiency rate of 90 percent, or reaching their individually
determined progress targets. The statewide proficiency rate will be increased to 95 percent in 2015.
Performance Targets - Language Arts Literacy
Subgroup# of Valid
Test Scores
Baseline
% Proficient
Yearly
Increment
2012-2013
Target (%P)
2011-2012
Target (%P)
2013-2014
Target (%P)
2014-2015
Target (%P)
2015-2016
Target (%P)
2016-2017
Target (%P)
Baseline
year
60.4 3.3 67 70.3 73.6 76.9 80.2Schoolwide 401 63.71011
- - - - - - -White - -1011
53.1 3.9 60.9 64.8 68.7 72.6 76.5Black 81 571011
61.7 3.2 68.1 71.3 74.5 77.7 80.9Hispanic 290 64.91011
- - - - - - -American Indian - -1011
- - - - - - -Asian - -1011
- - - - - - -Two or More Races - -1011
31.4 5.7 42.8 48.5 54.2 59.9 65.6Students with Disabilities 35 37.11011
- - - - - - -Limited English Proficiency - -1011
57.7 3.5 64.7 68.2 71.7 75.2 78.7Economically Disadvantaged 345 61.21011
Performance Targets - Mathematics
Subgroup# of Valid
Test Scores
Baseline
% Proficient
Yearly
Increment
2012-2013
Target (%P)
2011-2012
Target (%P)
2013-2014
Target (%P)
2014-2015
Target (%P)
2015-2016
Target (%P)
2016-2017
Target (%P)
Baseline
year
81.1 1.6 84.3 85.9 87.5 89.1 90Schoolwide 401 82.71011
- - - - - - -White - -1011
75.3 2.1 79.5 81.6 83.7 85.8 87.9Black 81 77.41011
82.1 1.5 85.1 86.6 88.1 89.6 90Hispanic 290 83.61011
- - - - - - -American Indian - -1011
- - - - - - -Asian - -1011
- - - - - - -Two or More Races - -1011
57.2 3.6 64.4 68 71.6 75.2 78.8Students with Disabilities 35 60.81011
- - - - - - -Limited English Proficiency - -1011
79.4 1.7 82.8 84.5 86.2 87.9 89.6Economically Disadvantaged 345 81.11011
11/5/2014
Only Includes full year students (Time In School < Year students are removed)
'-' Indicates too few students to determine (N<30)
Title I Accountability System

39-1320-300
Mabel G. Homes School No. 5
Elizabeth Public Schools
CDS CODE :
DISTRICT :
SCHOOL :
ESEA Waiver - Annual Progress Targets
The tables represent the annual proficiency targets, established for this School under ESEA Waiver
Schools and Subgroups could meet expectations either by meeting the statewide proficiency rate of 90 percent, or reaching their individually
determined progress targets. The statewide proficiency rate will be increased to 95 percent in 2015.
Performance Targets - Language Arts Literacy
Subgroup# of Valid
Test Scores
Baseline
% Proficient
Yearly
Increment
2012-2013
Target (%P)
2011-2012
Target (%P)
2013-2014
Target (%P)
2014-2015
Target (%P)
2015-2016
Target (%P)
2016-2017
Target (%P)
Baseline
year
42.4 4.8 52 56.8 61.6 66.4 71.2Schoolwide 264 47.21011
- - - - - - -White - -1011
39.2 5.1 49.4 54.5 59.6 64.7 69.8Black 79 44.31011
42.3 4.8 51.9 56.7 61.5 66.3 71.1Hispanic 168 47.11011
- - - - - - -American Indian - -1011
- - - - - - -Asian - -1011
- - - - - - -Two or More Races - -1011
30.8 5.8 42.4 48.2 54 59.8 65.6Students with Disabilities 39 36.61011
57.9 3.5 61.4 64.9 68.4 71.9Limited English Proficiency 38 1213
42.2 4.8 51.8 56.6 61.4 66.2 71Economically Disadvantaged 246 471011
Performance Targets - Mathematics
Subgroup# of Valid
Test Scores
Baseline
% Proficient
Yearly
Increment
2012-2013
Target (%P)
2011-2012
Target (%P)
2013-2014
Target (%P)
2014-2015
Target (%P)
2015-2016
Target (%P)
2016-2017
Target (%P)
Baseline
year
60.4 3.3 67 70.3 73.6 76.9 80.2Schoolwide 263 63.71011
- - - - - - -White - -1011
46.2 4.5 55.2 59.7 64.2 68.7 73.2Black 78 50.71011
66.1 2.8 71.7 74.5 77.3 80.1 82.9Hispanic 168 68.91011
- - - - - - -American Indian - -1011
- - - - - - -Asian - -1011
- - - - - - -Two or More Races - -1011
39.4 5.1 49.6 54.7 59.8 64.9 70Students with Disabilities 38 44.51011
60.6 3.3 63.9 67.2 70.5 73.8Limited English Proficiency 38 1213
59.6 3.4 66.4 69.8 73.2 76.6 80Economically Disadvantaged 245 631011
11/5/2014
Only Includes full year students (Time In School < Year students are removed)
'-' Indicates too few students to determine (N<30)
Title I Accountability System

39-1320-305
Ronald Reagan Academy School No. 30
Elizabeth Public Schools
CDS CODE :
DISTRICT :
SCHOOL :
ESEA Waiver - Annual Progress Targets
The tables represent the annual proficiency targets, established for this School under ESEA Waiver
Schools and Subgroups could meet expectations either by meeting the statewide proficiency rate of 90 percent, or reaching their individually
determined progress targets. The statewide proficiency rate will be increased to 95 percent in 2015.
Performance Targets - Language Arts Literacy
Subgroup# of Valid
Test Scores
Baseline
% Proficient
Yearly
Increment
2012-2013
Target (%P)
2011-2012
Target (%P)
2013-2014
Target (%P)
2014-2015
Target (%P)
2015-2016
Target (%P)
2016-2017
Target (%P)
Baseline
year
57.4 3.6 64.6 68.2 71.8 75.4 79Schoolwide 369 611011
57.5 3.6 64.7 68.3 71.9 75.5 79.1White 40 61.11011
46.8 4.4 55.6 60 64.4 68.8 73.2Black 62 51.21011
59.7 3.4 66.5 69.9 73.3 76.7 80.1Hispanic 263 63.11011
- - - - - - -American Indian - -1011
- - - - - - -Asian - -1011
- - - - - - -Two or More Races - -1011
17 6.9 30.8 37.7 44.6 51.5 58.4Students with Disabilities 47 23.91011
- - - - - - -Limited English Proficiency - -1011
58.7 3.4 65.5 68.9 72.3 75.7 79.1Economically Disadvantaged 325 62.11011
Performance Targets - Mathematics
Subgroup# of Valid
Test Scores
Baseline
% Proficient
Yearly
Increment
2012-2013
Target (%P)
2011-2012
Target (%P)
2013-2014
Target (%P)
2014-2015
Target (%P)
2015-2016
Target (%P)
2016-2017
Target (%P)
Baseline
year
73.5 2.2 77.9 80.1 82.3 84.5 86.7Schoolwide 369 75.71011
75 2.1 79.2 81.3 83.4 85.5 87.6White 40 77.11011
61.3 3.2 67.7 70.9 74.1 77.3 80.5Black 62 64.51011
76 2 80 82 84 86 88Hispanic 263 781011
- - - - - - -American Indian - -1011
- - - - - - -Asian - -1011
- - - - - - -Two or More Races - -1011
46.8 4.4 55.6 60 64.4 68.8 73.2Students with Disabilities 47 51.21011
- - - - - - -Limited English Proficiency - -1011
73.8 2.2 78.2 80.4 82.6 84.8 87Economically Disadvantaged 325 761011
11/5/2014
Only Includes full year students (Time In School < Year students are removed)
'-' Indicates too few students to determine (N<30)
Title I Accountability System

39-1320-310
Dr. Antonia Pantoja School No. 27
Elizabeth Public Schools
CDS CODE :
DISTRICT :
SCHOOL :
ESEA Waiver - Annual Progress Targets
The tables represent the annual proficiency targets, established for this School under ESEA Waiver
Schools and Subgroups could meet expectations either by meeting the statewide proficiency rate of 90 percent, or reaching their individually
determined progress targets. The statewide proficiency rate will be increased to 95 percent in 2015.
Performance Targets - Language Arts Literacy
Subgroup# of Valid
Test Scores
Baseline
% Proficient
Yearly
Increment
2012-2013
Target (%P)
2011-2012
Target (%P)
2013-2014
Target (%P)
2014-2015
Target (%P)
2015-2016
Target (%P)
2016-2017
Target (%P)
Baseline
year
48.1 4.3 56.7 61 65.3 69.6 73.9Schoolwide 401 52.41011
- - - - - - -White - -1011
40.5 5 50.5 55.5 60.5 65.5 70.5Black 84 45.51011
50 4.2 58.4 62.6 66.8 71 75.2Hispanic 288 54.21011
- - - - - - -American Indian - -1011
- - - - - - -Asian - -1011
- - - - - - -Two or More Races - -1011
30.3 5.8 41.9 47.7 53.5 59.3 65.1Students with Disabilities 33 36.11011
37 5.3 47.6 52.9 58.2 63.5 68.8Limited English Proficiency 46 42.31011
47.4 4.4 56.2 60.6 65 69.4 73.8Economically Disadvantaged 369 51.81011
Performance Targets - Mathematics
Subgroup# of Valid
Test Scores
Baseline
% Proficient
Yearly
Increment
2012-2013
Target (%P)
2011-2012
Target (%P)
2013-2014
Target (%P)
2014-2015
Target (%P)
2015-2016
Target (%P)
2016-2017
Target (%P)
Baseline
year
70.4 2.5 75.4 77.9 80.4 82.9 85.4Schoolwide 402 72.91011
- - - - - - -White - -1011
59.5 3.4 66.3 69.7 73.1 76.5 79.9Black 84 62.91011
73.1 2.3 77.7 80 82.3 84.6 86.9Hispanic 289 75.41011
- - - - - - -American Indian - -1011
- - - - - - -Asian - -1011
- - - - - - -Two or More Races - -1011
41.2 4.9 51 55.9 60.8 65.7 70.6Students with Disabilities 34 46.11011
69.6 2.5 74.6 77.1 79.6 82.1 84.6Limited English Proficiency 46 72.11011
69.5 2.6 74.7 77.3 79.9 82.5 85.1Economically Disadvantaged 370 72.11011
11/5/2014
Only Includes full year students (Time In School < Year students are removed)
'-' Indicates too few students to determine (N<30)
Title I Accountability System

39-1320-315
Juan Pablo Duarte - Jose Julian Marti #28
Elizabeth Public Schools
CDS CODE :
DISTRICT :
SCHOOL :
ESEA Waiver - Annual Progress Targets
The tables represent the annual proficiency targets, established for this School under ESEA Waiver
Schools and Subgroups could meet expectations either by meeting the statewide proficiency rate of 90 percent, or reaching their individually
determined progress targets. The statewide proficiency rate will be increased to 95 percent in 2015.
Performance Targets - Language Arts Literacy
Subgroup# of Valid
Test Scores
Baseline
% Proficient
Yearly
Increment
2012-2013
Target (%P)
2011-2012
Target (%P)
2013-2014
Target (%P)
2014-2015
Target (%P)
2015-2016
Target (%P)
2016-2017
Target (%P)
Baseline
year
33.6 5.5 44.6 50.1 55.6 61.1 66.6Schoolwide 357 39.11011
- - - - - - -White - -1011
34.8 5.4 45.6 51 56.4 61.8 67.2Black 69 40.21011
32.8 5.6 44 49.6 55.2 60.8 66.4Hispanic 268 38.41011
- - - - - - -American Indian - -1011
- - - - - - -Asian - -1011
- - - - - - -Two or More Races - -1011
17.9 6.9 31.7 38.6 45.5 52.4 59.3Students with Disabilities 39 24.81011
12.2 7.3 19.5 26.8 34.1 41.4 48.7Limited English Proficiency 49 1112
34.1 5.5 45.1 50.6 56.1 61.6 67.1Economically Disadvantaged 334 39.61011
Performance Targets - Mathematics
Subgroup# of Valid
Test Scores
Baseline
% Proficient
Yearly
Increment
2012-2013
Target (%P)
2011-2012
Target (%P)
2013-2014
Target (%P)
2014-2015
Target (%P)
2015-2016
Target (%P)
2016-2017
Target (%P)
Baseline
year
48.5 4.3 57.1 61.4 65.7 70 74.3Schoolwide 357 52.81011
- - - - - - -White - -1011
44.9 4.6 54.1 58.7 63.3 67.9 72.5Black 69 49.51011
49.2 4.2 57.6 61.8 66 70.2 74.4Hispanic 268 53.41011
- - - - - - -American Indian - -1011
- - - - - - -Asian - -1011
- - - - - - -Two or More Races - -1011
33.3 5.6 44.5 50.1 55.7 61.3 66.9Students with Disabilities 39 38.91011
40.9 4.9 45.8 50.7 55.6 60.5 65.4Limited English Proficiency 49 1112
49.1 4.3 57.7 62 66.3 70.6 74.9Economically Disadvantaged 334 53.41011
11/5/2014
Only Includes full year students (Time In School < Year students are removed)
'-' Indicates too few students to determine (N<30)
Title I Accountability System

39-1320-401
John E. Dwyer Technology Academy
Elizabeth Public Schools
CDS CODE :
DISTRICT :
SCHOOL :
ESEA Waiver - Annual Progress Targets
The tables represent the annual proficiency targets, established for this School under ESEA Waiver
Schools and Subgroups could meet expectations either by meeting the statewide proficiency rate of 90 percent, or reaching their individually
determined progress targets. The statewide proficiency rate will be increased to 95 percent in 2015.
Performance Targets - Language Arts Literacy
Subgroup# of Valid
Test Scores
Baseline
% Proficient
Yearly
Increment
2012-2013
Target (%P)
2011-2012
Target (%P)
2013-2014
Target (%P)
2014-2015
Target (%P)
2015-2016
Target (%P)
2016-2017
Target (%P)
Baseline
year
56.7 3.6 63.9 67.5 71.1 74.7 78.3Schoolwide 97 60.31011
- - - - - - -White - -1011
75 2.1 77.1 79.2 81.3 83.4 85.5Black 36 1112
63 3.1 69.2 72.3 75.4 78.5 81.6Hispanic 65 66.11011
- - - - - - -American Indian - -1011
- - - - - - -Asian - -1011
- - - - - - -Two or More Races - -1011
- - - - - - -Students with Disabilities - -1011
35.3 5.4 40.7 46.1 51.5 56.9 62.3Limited English Proficiency 34 1112
57.2 3.6 64.4 68 71.6 75.2 78.8Economically Disadvantaged 84 60.81011
Performance Targets - Mathematics
Subgroup# of Valid
Test Scores
Baseline
% Proficient
Yearly
Increment
2012-2013
Target (%P)
2011-2012
Target (%P)
2013-2014
Target (%P)
2014-2015
Target (%P)
2015-2016
Target (%P)
2016-2017
Target (%P)
Baseline
year
42.8 4.8 52.4 57.2 62 66.8 71.6Schoolwide 98 47.61011
- - - - - - -White - -1011
40.5 5 45.5 50.5 55.5 60.5 65.5Black 37 1112
50 4.2 58.4 62.6 66.8 71 75.2Hispanic 66 54.21011
- - - - - - -American Indian - -1011
- - - - - - -Asian - -1011
- - - - - - -Two or More Races - -1011
- - - - - - -Students with Disabilities - -1011
35.3 5.4 40.7 46.1 51.5 56.9 62.3Limited English Proficiency 34 1112
38.9 5.1 49.1 54.2 59.3 64.4 69.5Economically Disadvantaged 85 441011
11/5/2014
Only Includes full year students (Time In School < Year students are removed)
'-' Indicates too few students to determine (N<30)
Title I Accountability System
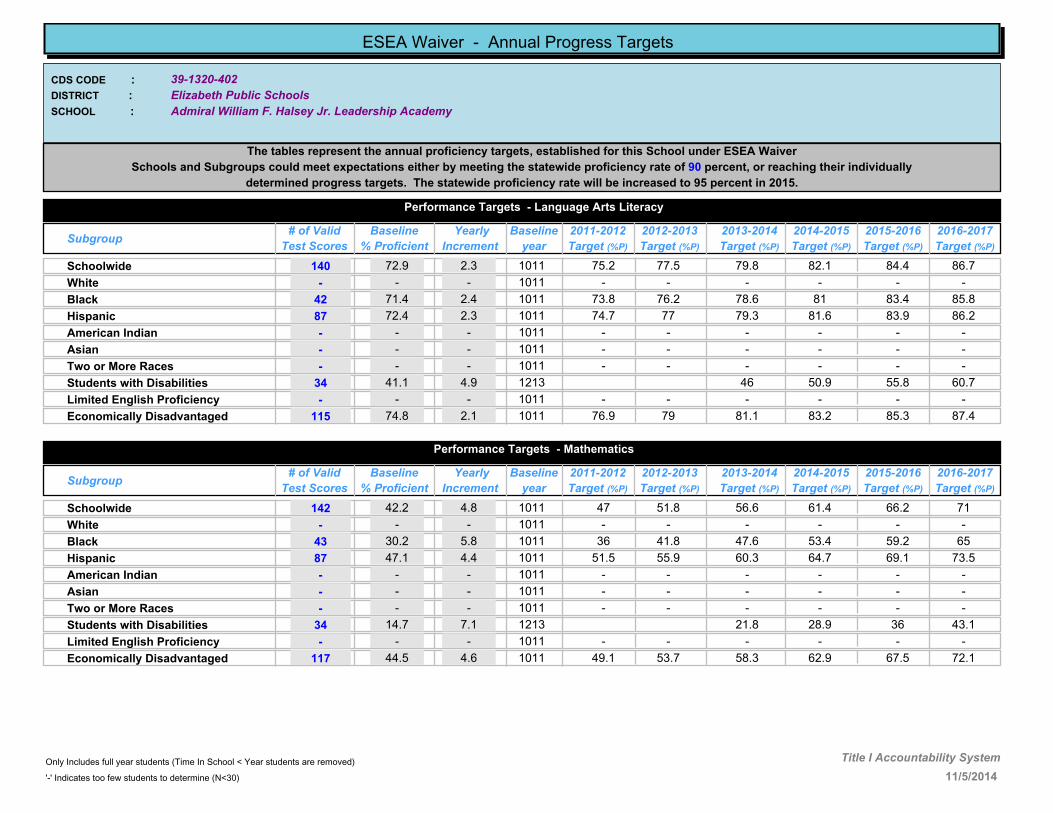
39-1320-402
Admiral William F. Halsey Jr. Leadership Academy
Elizabeth Public Schools
CDS CODE :
DISTRICT :
SCHOOL :
ESEA Waiver - Annual Progress Targets
The tables represent the annual proficiency targets, established for this School under ESEA Waiver
Schools and Subgroups could meet expectations either by meeting the statewide proficiency rate of 90 percent, or reaching their individually
determined progress targets. The statewide proficiency rate will be increased to 95 percent in 2015.
Performance Targets - Language Arts Literacy
Subgroup# of Valid
Test Scores
Baseline
% Proficient
Yearly
Increment
2012-2013
Target (%P)
2011-2012
Target (%P)
2013-2014
Target (%P)
2014-2015
Target (%P)
2015-2016
Target (%P)
2016-2017
Target (%P)
Baseline
year
72.9 2.3 77.5 79.8 82.1 84.4 86.7Schoolwide 140 75.21011
- - - - - - -White - -1011
71.4 2.4 76.2 78.6 81 83.4 85.8Black 42 73.81011
72.4 2.3 77 79.3 81.6 83.9 86.2Hispanic 87 74.71011
- - - - - - -American Indian - -1011
- - - - - - -Asian - -1011
- - - - - - -Two or More Races - -1011
41.1 4.9 46 50.9 55.8 60.7Students with Disabilities 34 1213
- - - - - - -Limited English Proficiency - -1011
74.8 2.1 79 81.1 83.2 85.3 87.4Economically Disadvantaged 115 76.91011
Performance Targets - Mathematics
Subgroup# of Valid
Test Scores
Baseline
% Proficient
Yearly
Increment
2012-2013
Target (%P)
2011-2012
Target (%P)
2013-2014
Target (%P)
2014-2015
Target (%P)
2015-2016
Target (%P)
2016-2017
Target (%P)
Baseline
year
42.2 4.8 51.8 56.6 61.4 66.2 71Schoolwide 142 471011
- - - - - - -White - -1011
30.2 5.8 41.8 47.6 53.4 59.2 65Black 43 361011
47.1 4.4 55.9 60.3 64.7 69.1 73.5Hispanic 87 51.51011
- - - - - - -American Indian - -1011
- - - - - - -Asian - -1011
- - - - - - -Two or More Races - -1011
14.7 7.1 21.8 28.9 36 43.1Students with Disabilities 34 1213
- - - - - - -Limited English Proficiency - -1011
44.5 4.6 53.7 58.3 62.9 67.5 72.1Economically Disadvantaged 117 49.11011
11/5/2014
Only Includes full year students (Time In School < Year students are removed)
'-' Indicates too few students to determine (N<30)
Title I Accountability System
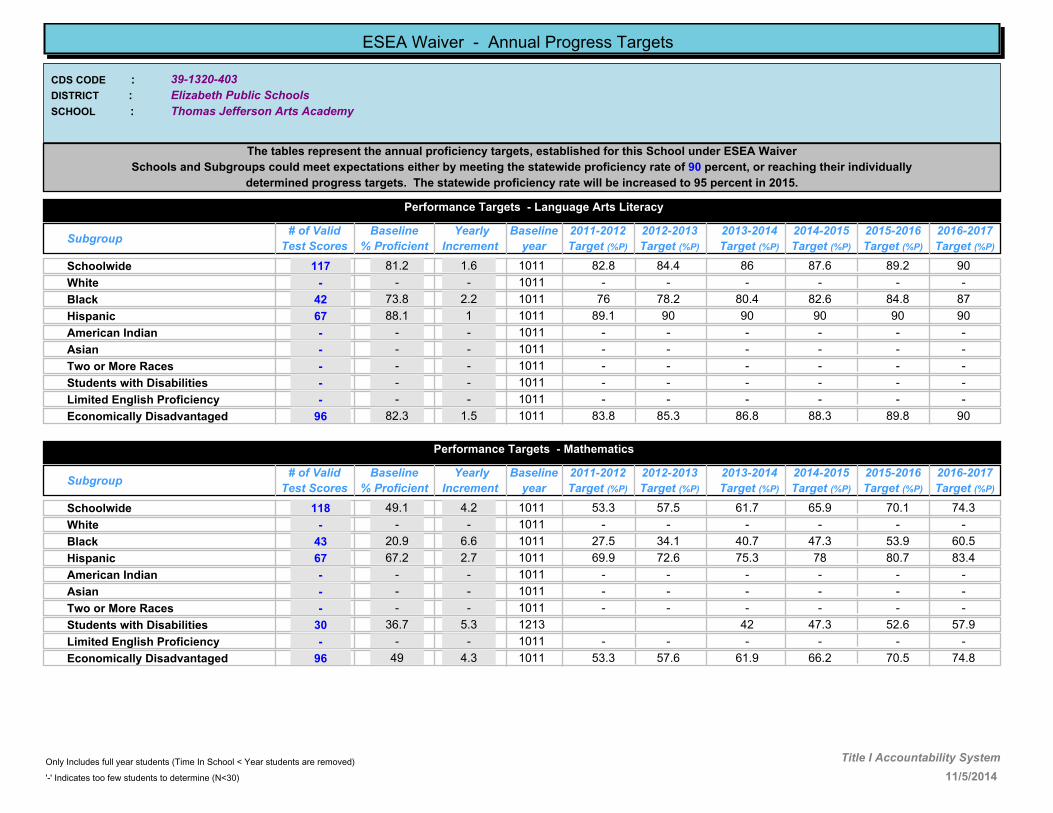
39-1320-403
Thomas Jefferson Arts Academy
Elizabeth Public Schools
CDS CODE :
DISTRICT :
SCHOOL :
ESEA Waiver - Annual Progress Targets
The tables represent the annual proficiency targets, established for this School under ESEA Waiver
Schools and Subgroups could meet expectations either by meeting the statewide proficiency rate of 90 percent, or reaching their individually
determined progress targets. The statewide proficiency rate will be increased to 95 percent in 2015.
Performance Targets - Language Arts Literacy
Subgroup# of Valid
Test Scores
Baseline
% Proficient
Yearly
Increment
2012-2013
Target (%P)
2011-2012
Target (%P)
2013-2014
Target (%P)
2014-2015
Target (%P)
2015-2016
Target (%P)
2016-2017
Target (%P)
Baseline
year
81.2 1.6 84.4 86 87.6 89.2 90Schoolwide 117 82.81011
- - - - - - -White - -1011
73.8 2.2 78.2 80.4 82.6 84.8 87Black 42 761011
88.1 1 90 90 90 90 90Hispanic 67 89.11011
- - - - - - -American Indian - -1011
- - - - - - -Asian - -1011
- - - - - - -Two or More Races - -1011
- - - - - - -Students with Disabilities - -1011
- - - - - - -Limited English Proficiency - -1011
82.3 1.5 85.3 86.8 88.3 89.8 90Economically Disadvantaged 96 83.81011
Performance Targets - Mathematics
Subgroup# of Valid
Test Scores
Baseline
% Proficient
Yearly
Increment
2012-2013
Target (%P)
2011-2012
Target (%P)
2013-2014
Target (%P)
2014-2015
Target (%P)
2015-2016
Target (%P)
2016-2017
Target (%P)
Baseline
year
49.1 4.2 57.5 61.7 65.9 70.1 74.3Schoolwide 118 53.31011
- - - - - - -White - -1011
20.9 6.6 34.1 40.7 47.3 53.9 60.5Black 43 27.51011
67.2 2.7 72.6 75.3 78 80.7 83.4Hispanic 67 69.91011
- - - - - - -American Indian - -1011
- - - - - - -Asian - -1011
- - - - - - -Two or More Races - -1011
36.7 5.3 42 47.3 52.6 57.9Students with Disabilities 30 1213
- - - - - - -Limited English Proficiency - -1011
49 4.3 57.6 61.9 66.2 70.5 74.8Economically Disadvantaged 96 53.31011
11/5/2014
Only Includes full year students (Time In School < Year students are removed)
'-' Indicates too few students to determine (N<30)
Title I Accountability System

39-1320-404
Thomas A. Edison Career and Technical Academy
Elizabeth Public Schools
CDS CODE :
DISTRICT :
SCHOOL :
ESEA Waiver - Annual Progress Targets
The tables represent the annual proficiency targets, established for this School under ESEA Waiver
Schools and Subgroups could meet expectations either by meeting the statewide proficiency rate of 90 percent, or reaching their individually
determined progress targets. The statewide proficiency rate will be increased to 95 percent in 2015.
Performance Targets - Language Arts Literacy
Subgroup# of Valid
Test Scores
Baseline
% Proficient
Yearly
Increment
2012-2013
Target (%P)
2011-2012
Target (%P)
2013-2014
Target (%P)
2014-2015
Target (%P)
2015-2016
Target (%P)
2016-2017
Target (%P)
Baseline
year
73.6 2.2 78 80.2 82.4 84.6 86.8Schoolwide 159 75.81011
- - - - - - -White - -1011
56.4 3.6 63.6 67.2 70.8 74.4 78Black 39 601011
79.3 1.7 82.7 84.4 86.1 87.8 89.5Hispanic 111 811011
- - - - - - -American Indian - -1011
- - - - - - -Asian - -1011
- - - - - - -Two or More Races - -1011
8.1 7.7 23.5 31.2 38.9 46.6 54.3Students with Disabilities 37 15.81011
- - - - - - -Limited English Proficiency - -1011
74.6 2.1 78.8 80.9 83 85.1 87.2Economically Disadvantaged 130 76.71011
Performance Targets - Mathematics
Subgroup# of Valid
Test Scores
Baseline
% Proficient
Yearly
Increment
2012-2013
Target (%P)
2011-2012
Target (%P)
2013-2014
Target (%P)
2014-2015
Target (%P)
2015-2016
Target (%P)
2016-2017
Target (%P)
Baseline
year
56.4 3.6 63.6 67.2 70.8 74.4 78Schoolwide 156 601011
- - - - - - -White - -1011
38.5 5.1 48.7 53.8 58.9 64 69.1Black 39 43.61011
62.1 3.2 68.5 71.7 74.9 78.1 81.3Hispanic 108 65.31011
- - - - - - -American Indian - -1011
- - - - - - -Asian - -1011
- - - - - - -Two or More Races - -1011
8.4 7.7 23.8 31.5 39.2 46.9 54.6Students with Disabilities 36 16.11011
- - - - - - -Limited English Proficiency - -1011
57.1 3.6 64.3 67.9 71.5 75.1 78.7Economically Disadvantaged 128 60.71011
11/5/2014
Only Includes full year students (Time In School < Year students are removed)
'-' Indicates too few students to determine (N<30)
Title I Accountability System
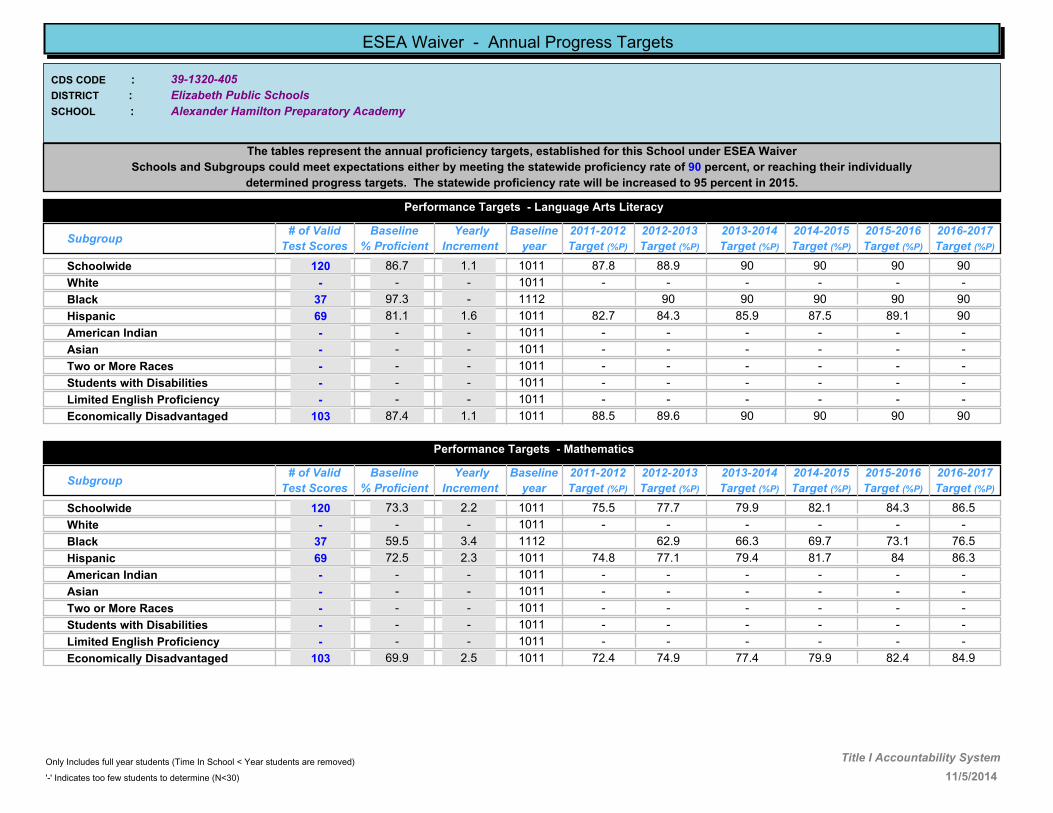
39-1320-405
Alexander Hamilton Preparatory Academy
Elizabeth Public Schools
CDS CODE :
DISTRICT :
SCHOOL :
ESEA Waiver - Annual Progress Targets
The tables represent the annual proficiency targets, established for this School under ESEA Waiver
Schools and Subgroups could meet expectations either by meeting the statewide proficiency rate of 90 percent, or reaching their individually
determined progress targets. The statewide proficiency rate will be increased to 95 percent in 2015.
Performance Targets - Language Arts Literacy
Subgroup# of Valid
Test Scores
Baseline
% Proficient
Yearly
Increment
2012-2013
Target (%P)
2011-2012
Target (%P)
2013-2014
Target (%P)
2014-2015
Target (%P)
2015-2016
Target (%P)
2016-2017
Target (%P)
Baseline
year
86.7 1.1 88.9 90 90 90 90Schoolwide 120 87.81011
- - - - - - -White - -1011
97.3 - 90 90 90 90 90Black 37 1112
81.1 1.6 84.3 85.9 87.5 89.1 90Hispanic 69 82.71011
- - - - - - -American Indian - -1011
- - - - - - -Asian - -1011
- - - - - - -Two or More Races - -1011
- - - - - - -Students with Disabilities - -1011
- - - - - - -Limited English Proficiency - -1011
87.4 1.1 89.6 90 90 90 90Economically Disadvantaged 103 88.51011
Performance Targets - Mathematics
Subgroup# of Valid
Test Scores
Baseline
% Proficient
Yearly
Increment
2012-2013
Target (%P)
2011-2012
Target (%P)
2013-2014
Target (%P)
2014-2015
Target (%P)
2015-2016
Target (%P)
2016-2017
Target (%P)
Baseline
year
73.3 2.2 77.7 79.9 82.1 84.3 86.5Schoolwide 120 75.51011
- - - - - - -White - -1011
59.5 3.4 62.9 66.3 69.7 73.1 76.5Black 37 1112
72.5 2.3 77.1 79.4 81.7 84 86.3Hispanic 69 74.81011
- - - - - - -American Indian - -1011
- - - - - - -Asian - -1011
- - - - - - -Two or More Races - -1011
- - - - - - -Students with Disabilities - -1011
- - - - - - -Limited English Proficiency - -1011
69.9 2.5 74.9 77.4 79.9 82.4 84.9Economically Disadvantaged 103 72.41011
11/5/2014
Only Includes full year students (Time In School < Year students are removed)
'-' Indicates too few students to determine (N<30)
Title I Accountability System

39-1710-050
Lincoln
Garwood Boro
CDS CODE :
DISTRICT :
SCHOOL :
ESEA Waiver - Annual Progress Targets
The tables represent the annual proficiency targets, established for this School under ESEA Waiver
Schools and Subgroups could meet expectations either by meeting the statewide proficiency rate of 90 percent, or reaching their individually
determined progress targets. The statewide proficiency rate will be increased to 95 percent in 2015.
Performance Targets - Language Arts Literacy
Subgroup# of Valid
Test Scores
Baseline
% Proficient
Yearly
Increment
2012-2013
Target (%P)
2011-2012
Target (%P)
2013-2014
Target (%P)
2014-2015
Target (%P)
2015-2016
Target (%P)
2016-2017
Target (%P)
Baseline
year
70.8 2.5 75.8 78.3 80.8 83.3 85.8Schoolwide 229 73.31011
73.3 2.2 77.7 79.9 82.1 84.3 86.5White 202 75.51011
- - - - - - -Black - -1011
- - - - - - -Hispanic - -1011
- - - - - - -American Indian - -1011
- - - - - - -Asian - -1011
- - - - - - -Two or More Races - -1011
27.3 6.1 39.5 45.6 51.7 57.8 63.9Students with Disabilities 44 33.41011
- - - - - - -Limited English Proficiency - -1011
50 4.2 58.4 62.6 66.8 71 75.2Economically Disadvantaged 40 54.21011
Performance Targets - Mathematics
Subgroup# of Valid
Test Scores
Baseline
% Proficient
Yearly
Increment
2012-2013
Target (%P)
2011-2012
Target (%P)
2013-2014
Target (%P)
2014-2015
Target (%P)
2015-2016
Target (%P)
2016-2017
Target (%P)
Baseline
year
76.8 1.9 80.6 82.5 84.4 86.3 88.2Schoolwide 229 78.71011
80.1 1.7 83.5 85.2 86.9 88.6 90White 202 81.81011
- - - - - - -Black - -1011
- - - - - - -Hispanic - -1011
- - - - - - -American Indian - -1011
- - - - - - -Asian - -1011
- - - - - - -Two or More Races - -1011
31.8 5.7 43.2 48.9 54.6 60.3 66Students with Disabilities 44 37.51011
- - - - - - -Limited English Proficiency - -1011
62.5 3.1 68.7 71.8 74.9 78 81.1Economically Disadvantaged 40 65.61011
11/5/2014
Only Includes full year students (Time In School < Year students are removed)
'-' Indicates too few students to determine (N<30)
Title I Accountability System

39-2190-050
Hillside High School
Hillside Board of Education
CDS CODE :
DISTRICT :
SCHOOL :
ESEA Waiver - Annual Progress Targets
The tables represent the annual proficiency targets, established for this School under ESEA Waiver
Schools and Subgroups could meet expectations either by meeting the statewide proficiency rate of 90 percent, or reaching their individually
determined progress targets. The statewide proficiency rate will be increased to 95 percent in 2015.
Performance Targets - Language Arts Literacy
Subgroup# of Valid
Test Scores
Baseline
% Proficient
Yearly
Increment
2012-2013
Target (%P)
2011-2012
Target (%P)
2013-2014
Target (%P)
2014-2015
Target (%P)
2015-2016
Target (%P)
2016-2017
Target (%P)
Baseline
year
82 1.5 85 86.5 88 89.5 90Schoolwide 178 83.51011
- - - - - - -White - -1011
79.7 1.7 83.1 84.8 86.5 88.2 89.9Black 118 81.41011
83.3 1.4 86.1 87.5 88.9 90 90Hispanic 36 84.71011
- - - - - - -American Indian - -1011
- - - - - - -Asian - -1011
- - - - - - -Two or More Races - -1011
34.4 5.5 45.4 50.9 56.4 61.9 67.4Students with Disabilities 32 39.91011
- - - - - - -Limited English Proficiency - -1011
76.7 2 80.7 82.7 84.7 86.7 88.7Economically Disadvantaged 60 78.71011
Performance Targets - Mathematics
Subgroup# of Valid
Test Scores
Baseline
% Proficient
Yearly
Increment
2012-2013
Target (%P)
2011-2012
Target (%P)
2013-2014
Target (%P)
2014-2015
Target (%P)
2015-2016
Target (%P)
2016-2017
Target (%P)
Baseline
year
62.4 3.1 68.6 71.7 74.8 77.9 81Schoolwide 178 65.51011
- - - - - - -White - -1011
61 3.3 67.6 70.9 74.2 77.5 80.8Black 118 64.31011
61.1 3.3 67.7 71 74.3 77.6 80.9Hispanic 36 64.41011
- - - - - - -American Indian - -1011
- - - - - - -Asian - -1011
- - - - - - -Two or More Races - -1011
31.3 5.7 42.7 48.4 54.1 59.8 65.5Students with Disabilities 32 371011
- - - - - - -Limited English Proficiency - -1011
66.7 2.8 72.3 75.1 77.9 80.7 83.5Economically Disadvantaged 60 69.51011
11/5/2014
Only Includes full year students (Time In School < Year students are removed)
'-' Indicates too few students to determine (N<30)
Title I Accountability System

39-2190-080
Hurden Looker School
Hillside Board of Education
CDS CODE :
DISTRICT :
SCHOOL :
ESEA Waiver - Annual Progress Targets
The tables represent the annual proficiency targets, established for this School under ESEA Waiver
Schools and Subgroups could meet expectations either by meeting the statewide proficiency rate of 90 percent, or reaching their individually
determined progress targets. The statewide proficiency rate will be increased to 95 percent in 2015.
Performance Targets - Language Arts Literacy
Subgroup# of Valid
Test Scores
Baseline
% Proficient
Yearly
Increment
2012-2013
Target (%P)
2011-2012
Target (%P)
2013-2014
Target (%P)
2014-2015
Target (%P)
2015-2016
Target (%P)
2016-2017
Target (%P)
Baseline
year
47.2 4.4 56 60.4 64.8 69.2 73.6Schoolwide 411 51.61011
41.4 4.9 51.2 56.1 61 65.9 70.8White 58 46.31011
46.6 4.5 55.6 60.1 64.6 69.1 73.6Black 221 51.11011
51.2 4.1 59.4 63.5 67.6 71.7 75.8Hispanic 123 55.31011
- - - - - - -American Indian - -1011
- - - - - - -Asian - -1011
- - - - - - -Two or More Races - -1011
15 7.1 29.2 36.3 43.4 50.5 57.6Students with Disabilities 40 22.11011
23.3 6.4 29.7 36.1 42.5 48.9 55.3Limited English Proficiency 30 1112
42.4 4.8 52 56.8 61.6 66.4 71.2Economically Disadvantaged 236 47.21011
Performance Targets - Mathematics
Subgroup# of Valid
Test Scores
Baseline
% Proficient
Yearly
Increment
2012-2013
Target (%P)
2011-2012
Target (%P)
2013-2014
Target (%P)
2014-2015
Target (%P)
2015-2016
Target (%P)
2016-2017
Target (%P)
Baseline
year
73.2 2.2 77.6 79.8 82 84.2 86.4Schoolwide 411 75.41011
74.1 2.2 78.5 80.7 82.9 85.1 87.3White 58 76.31011
70.1 2.5 75.1 77.6 80.1 82.6 85.1Black 221 72.61011
77.3 1.9 81.1 83 84.9 86.8 88.7Hispanic 123 79.21011
- - - - - - -American Indian - -1011
- - - - - - -Asian - -1011
- - - - - - -Two or More Races - -1011
30 5.8 41.6 47.4 53.2 59 64.8Students with Disabilities 40 35.81011
60 3.3 63.3 66.6 69.9 73.2 76.5Limited English Proficiency 30 1112
72.5 2.3 77.1 79.4 81.7 84 86.3Economically Disadvantaged 236 74.81011
11/5/2014
Only Includes full year students (Time In School < Year students are removed)
'-' Indicates too few students to determine (N<30)
Title I Accountability System
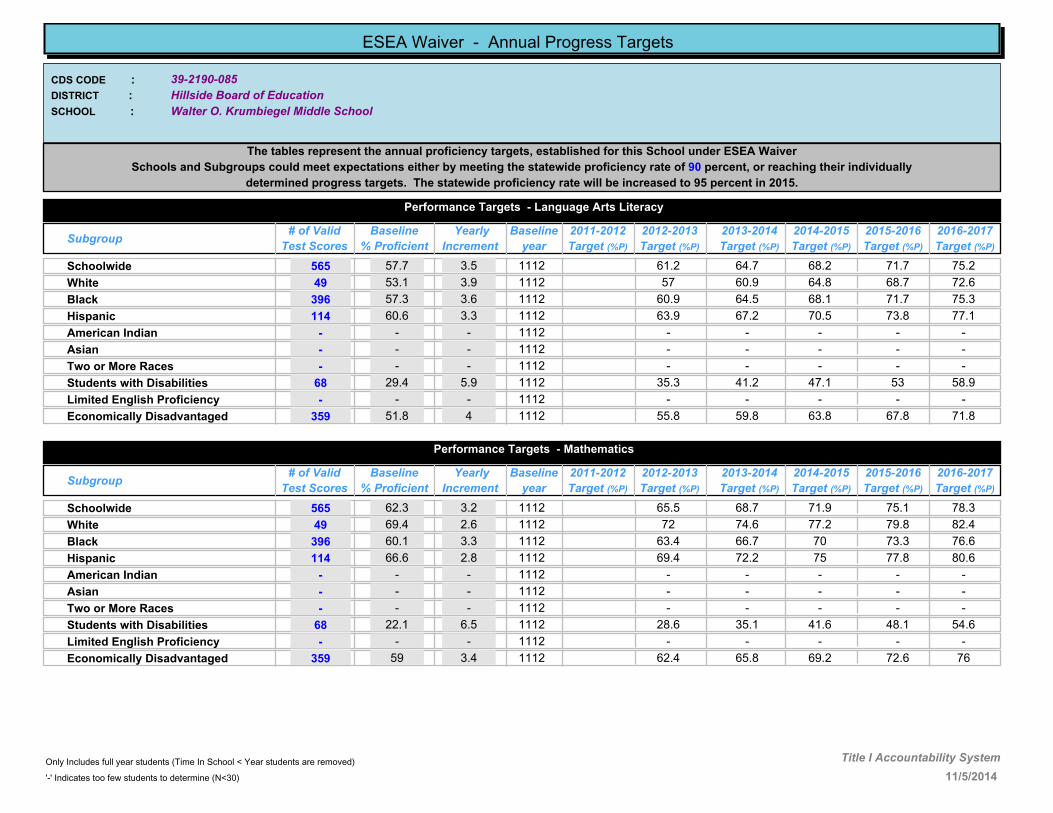
39-2190-085
Walter O. Krumbiegel Middle School
Hillside Board of Education
CDS CODE :
DISTRICT :
SCHOOL :
ESEA Waiver - Annual Progress Targets
The tables represent the annual proficiency targets, established for this School under ESEA Waiver
Schools and Subgroups could meet expectations either by meeting the statewide proficiency rate of 90 percent, or reaching their individually
determined progress targets. The statewide proficiency rate will be increased to 95 percent in 2015.
Performance Targets - Language Arts Literacy
Subgroup# of Valid
Test Scores
Baseline
% Proficient
Yearly
Increment
2012-2013
Target (%P)
2011-2012
Target (%P)
2013-2014
Target (%P)
2014-2015
Target (%P)
2015-2016
Target (%P)
2016-2017
Target (%P)
Baseline
year
57.7 3.5 61.2 64.7 68.2 71.7 75.2Schoolwide 565 1112
53.1 3.9 57 60.9 64.8 68.7 72.6White 49 1112
57.3 3.6 60.9 64.5 68.1 71.7 75.3Black 396 1112
60.6 3.3 63.9 67.2 70.5 73.8 77.1Hispanic 114 1112
- - - - - - -American Indian - 1112
- - - - - - -Asian - 1112
- - - - - - -Two or More Races - 1112
29.4 5.9 35.3 41.2 47.1 53 58.9Students with Disabilities 68 1112
- - - - - - -Limited English Proficiency - 1112
51.8 4 55.8 59.8 63.8 67.8 71.8Economically Disadvantaged 359 1112
Performance Targets - Mathematics
Subgroup# of Valid
Test Scores
Baseline
% Proficient
Yearly
Increment
2012-2013
Target (%P)
2011-2012
Target (%P)
2013-2014
Target (%P)
2014-2015
Target (%P)
2015-2016
Target (%P)
2016-2017
Target (%P)
Baseline
year
62.3 3.2 65.5 68.7 71.9 75.1 78.3Schoolwide 565 1112
69.4 2.6 72 74.6 77.2 79.8 82.4White 49 1112
60.1 3.3 63.4 66.7 70 73.3 76.6Black 396 1112
66.6 2.8 69.4 72.2 75 77.8 80.6Hispanic 114 1112
- - - - - - -American Indian - 1112
- - - - - - -Asian - 1112
- - - - - - -Two or More Races - 1112
22.1 6.5 28.6 35.1 41.6 48.1 54.6Students with Disabilities 68 1112
- - - - - - -Limited English Proficiency - 1112
59 3.4 62.4 65.8 69.2 72.6 76Economically Disadvantaged 359 1112
11/5/2014
Only Includes full year students (Time In School < Year students are removed)
'-' Indicates too few students to determine (N<30)
Title I Accountability System

39-2190-110
George Washington School
Hillside Board of Education
CDS CODE :
DISTRICT :
SCHOOL :
ESEA Waiver - Annual Progress Targets
The tables represent the annual proficiency targets, established for this School under ESEA Waiver
Schools and Subgroups could meet expectations either by meeting the statewide proficiency rate of 90 percent, or reaching their individually
determined progress targets. The statewide proficiency rate will be increased to 95 percent in 2015.
Performance Targets - Language Arts Literacy
Subgroup# of Valid
Test Scores
Baseline
% Proficient
Yearly
Increment
2012-2013
Target (%P)
2011-2012
Target (%P)
2013-2014
Target (%P)
2014-2015
Target (%P)
2015-2016
Target (%P)
2016-2017
Target (%P)
Baseline
year
55.4 3.7 62.8 66.5 70.2 73.9 77.6Schoolwide 231 59.11011
- - - - - - -White - -1011
53.7 3.9 61.5 65.4 69.3 73.2 77.1Black 205 57.61011
64.7 3 67.7 70.7 73.7 76.7 79.7Hispanic 51 1112
- - - - - - -American Indian - -1011
- - - - - - -Asian - -1011
- - - - - - -Two or More Races - -1011
- - - - - - -Students with Disabilities - -1011
- - - - - - -Limited English Proficiency - -1011
56.1 3.7 63.5 67.2 70.9 74.6 78.3Economically Disadvantaged 173 59.81011
Performance Targets - Mathematics
Subgroup# of Valid
Test Scores
Baseline
% Proficient
Yearly
Increment
2012-2013
Target (%P)
2011-2012
Target (%P)
2013-2014
Target (%P)
2014-2015
Target (%P)
2015-2016
Target (%P)
2016-2017
Target (%P)
Baseline
year
75.3 2.1 79.5 81.6 83.7 85.8 87.9Schoolwide 231 77.41011
- - - - - - -White - -1011
75.1 2.1 79.3 81.4 83.5 85.6 87.7Black 205 77.21011
90.2 - 90 90 90 90 90Hispanic 51 1112
- - - - - - -American Indian - -1011
- - - - - - -Asian - -1011
- - - - - - -Two or More Races - -1011
- - - - - - -Students with Disabilities - -1011
- - - - - - -Limited English Proficiency - -1011
76.9 1.9 80.7 82.6 84.5 86.4 88.3Economically Disadvantaged 173 78.81011
11/5/2014
Only Includes full year students (Time In School < Year students are removed)
'-' Indicates too few students to determine (N<30)
Title I Accountability System

39-2420-010
David Brearley Middle/High School
KENILWORTH SCHOOL DISTRICT
CDS CODE :
DISTRICT :
SCHOOL :
ESEA Waiver - Annual Progress Targets
The tables represent the annual proficiency targets, established for this School under ESEA Waiver
Schools and Subgroups could meet expectations either by meeting the statewide proficiency rate of 90 percent, or reaching their individually
determined progress targets. The statewide proficiency rate will be increased to 95 percent in 2015.
Performance Targets - Language Arts Literacy
Subgroup# of Valid
Test Scores
Baseline
% Proficient
Yearly
Increment
2012-2013
Target (%P)
2011-2012
Target (%P)
2013-2014
Target (%P)
2014-2015
Target (%P)
2015-2016
Target (%P)
2016-2017
Target (%P)
Baseline
year
79.4 1.7 82.8 84.5 86.2 87.9 89.6Schoolwide 307 81.11011
82.2 1.5 85.2 86.7 88.2 89.7 90White 202 83.71011
89.8 .9 90 90 90 90 90Black 39 1112
71.7 2.4 76.5 78.9 81.3 83.7 86.1Hispanic 67 74.11011
- - - - - - -American Indian - -1011
- - - - - - -Asian - -1011
- - - - - - -Two or More Races - -1011
36.6 5.3 47.2 52.5 57.8 63.1 68.4Students with Disabilities 41 41.91011
- - - - - - -Limited English Proficiency - -1011
70.6 2.5 75.6 78.1 80.6 83.1 85.6Economically Disadvantaged 68 73.11011
Performance Targets - Mathematics
Subgroup# of Valid
Test Scores
Baseline
% Proficient
Yearly
Increment
2012-2013
Target (%P)
2011-2012
Target (%P)
2013-2014
Target (%P)
2014-2015
Target (%P)
2015-2016
Target (%P)
2016-2017
Target (%P)
Baseline
year
79.2 1.7 82.6 84.3 86 87.7 89.4Schoolwide 308 80.91011
80.3 1.7 83.7 85.4 87.1 88.8 90White 203 821011
61.6 3.2 64.8 68 71.2 74.4 77.6Black 39 1112
71.6 2.4 76.4 78.8 81.2 83.6 86Hispanic 67 741011
- - - - - - -American Indian - -1011
- - - - - - -Asian - -1011
- - - - - - -Two or More Races - -1011
34.1 5.5 45.1 50.6 56.1 61.6 67.1Students with Disabilities 41 39.61011
- - - - - - -Limited English Proficiency - -1011
69.2 2.6 74.4 77 79.6 82.2 84.8Economically Disadvantaged 68 71.81011
11/5/2014
Only Includes full year students (Time In School < Year students are removed)
'-' Indicates too few students to determine (N<30)
Title I Accountability System

39-2420-050
Warren G. Harding Elementary School
KENILWORTH SCHOOL DISTRICT
CDS CODE :
DISTRICT :
SCHOOL :
ESEA Waiver - Annual Progress Targets
The tables represent the annual proficiency targets, established for this School under ESEA Waiver
Schools and Subgroups could meet expectations either by meeting the statewide proficiency rate of 90 percent, or reaching their individually
determined progress targets. The statewide proficiency rate will be increased to 95 percent in 2015.
Performance Targets - Language Arts Literacy
Subgroup# of Valid
Test Scores
Baseline
% Proficient
Yearly
Increment
2012-2013
Target (%P)
2011-2012
Target (%P)
2013-2014
Target (%P)
2014-2015
Target (%P)
2015-2016
Target (%P)
2016-2017
Target (%P)
Baseline
year
62 3.2 68.4 71.6 74.8 78 81.2Schoolwide 334 65.21011
62.6 3.1 68.8 71.9 75 78.1 81.2White 262 65.71011
- - - - - - -Black - -1011
57.4 3.6 64.6 68.2 71.8 75.4 79Hispanic 54 611011
- - - - - - -American Indian - -1011
- - - - - - -Asian - -1011
- - - - - - -Two or More Races - -1011
36.1 5.3 46.7 52 57.3 62.6 67.9Students with Disabilities 47 41.41011
- - - - - - -Limited English Proficiency - -1011
57.7 3.5 64.7 68.2 71.7 75.2 78.7Economically Disadvantaged 78 61.21011
Performance Targets - Mathematics
Subgroup# of Valid
Test Scores
Baseline
% Proficient
Yearly
Increment
2012-2013
Target (%P)
2011-2012
Target (%P)
2013-2014
Target (%P)
2014-2015
Target (%P)
2015-2016
Target (%P)
2016-2017
Target (%P)
Baseline
year
73.4 2.2 77.8 80 82.2 84.4 86.6Schoolwide 334 75.61011
74.4 2.1 78.6 80.7 82.8 84.9 87White 262 76.51011
- - - - - - -Black - -1011
66.7 2.8 72.3 75.1 77.9 80.7 83.5Hispanic 54 69.51011
- - - - - - -American Indian - -1011
- - - - - - -Asian - -1011
- - - - - - -Two or More Races - -1011
44.7 4.6 53.9 58.5 63.1 67.7 72.3Students with Disabilities 47 49.31011
- - - - - - -Limited English Proficiency - -1011
71.8 2.4 76.6 79 81.4 83.8 86.2Economically Disadvantaged 78 74.21011
11/5/2014
Only Includes full year students (Time In School < Year students are removed)
'-' Indicates too few students to determine (N<30)
Title I Accountability System

39-2660-050
Linden High School
Linden City Board of Education
CDS CODE :
DISTRICT :
SCHOOL :
ESEA Waiver - Annual Progress Targets
The tables represent the annual proficiency targets, established for this School under ESEA Waiver
Schools and Subgroups could meet expectations either by meeting the statewide proficiency rate of 90 percent, or reaching their individually
determined progress targets. The statewide proficiency rate will be increased to 95 percent in 2015.
Performance Targets - Language Arts Literacy
Subgroup# of Valid
Test Scores
Baseline
% Proficient
Yearly
Increment
2012-2013
Target (%P)
2011-2012
Target (%P)
2013-2014
Target (%P)
2014-2015
Target (%P)
2015-2016
Target (%P)
2016-2017
Target (%P)
Baseline
year
83.3 1.4 86.1 87.5 88.9 90 90Schoolwide 400 84.71011
94.3 - 90 90 90 90 90White 105 901011
77.4 1.9 81.2 83.1 85 86.9 88.8Black 133 79.31011
80 1.7 83.4 85.1 86.8 88.5 90Hispanic 145 81.71011
- - - - - - -American Indian - -1011
- - - - - - -Asian - -1011
- - - - - - -Two or More Races - -1011
38.6 5.1 48.8 53.9 59 64.1 69.2Students with Disabilities 70 43.71011
- - - - - - -Limited English Proficiency - -1011
79.8 1.7 83.2 84.9 86.6 88.3 90Economically Disadvantaged 183 81.51011
Performance Targets - Mathematics
Subgroup# of Valid
Test Scores
Baseline
% Proficient
Yearly
Increment
2012-2013
Target (%P)
2011-2012
Target (%P)
2013-2014
Target (%P)
2014-2015
Target (%P)
2015-2016
Target (%P)
2016-2017
Target (%P)
Baseline
year
67.1 2.8 72.7 75.5 78.3 81.1 83.9Schoolwide 398 69.91011
79.1 1.8 82.7 84.5 86.3 88.1 89.9White 105 80.91011
58.8 3.4 65.6 69 72.4 75.8 79.2Black 131 62.21011
64.8 2.9 70.6 73.5 76.4 79.3 82.2Hispanic 145 67.71011
- - - - - - -American Indian - -1011
- - - - - - -Asian - -1011
- - - - - - -Two or More Races - -1011
21.1 6.6 34.3 40.9 47.5 54.1 60.7Students with Disabilities 71 27.71011
- - - - - - -Limited English Proficiency - -1011
64.5 3 70.5 73.5 76.5 79.5 82.5Economically Disadvantaged 180 67.51011
11/5/2014
Only Includes full year students (Time In School < Year students are removed)
'-' Indicates too few students to determine (N<30)
Title I Accountability System

39-2660-060
Myles J. McManus MIddle School
Linden City Board of Education
CDS CODE :
DISTRICT :
SCHOOL :
ESEA Waiver - Annual Progress Targets
The tables represent the annual proficiency targets, established for this School under ESEA Waiver
Schools and Subgroups could meet expectations either by meeting the statewide proficiency rate of 90 percent, or reaching their individually
determined progress targets. The statewide proficiency rate will be increased to 95 percent in 2015.
Performance Targets - Language Arts Literacy
Subgroup# of Valid
Test Scores
Baseline
% Proficient
Yearly
Increment
2012-2013
Target (%P)
2011-2012
Target (%P)
2013-2014
Target (%P)
2014-2015
Target (%P)
2015-2016
Target (%P)
2016-2017
Target (%P)
Baseline
year
53.1 3.9 60.9 64.8 68.7 72.6 76.5Schoolwide 646 571011
65.4 2.9 71.2 74.1 77 79.9 82.8White 217 68.31011
42.2 4.8 51.8 56.6 61.4 66.2 71Black 199 471011
50 4.2 58.4 62.6 66.8 71 75.2Hispanic 196 54.21011
- - - - - - -American Indian - -1011
- - - - - - -Asian - -1011
- - - - - - -Two or More Races - -1011
19.9 6.7 33.3 40 46.7 53.4 60.1Students with Disabilities 116 26.61011
- - - - - - -Limited English Proficiency - -1011
48.6 4.3 57.2 61.5 65.8 70.1 74.4Economically Disadvantaged 315 52.91011
Performance Targets - Mathematics
Subgroup# of Valid
Test Scores
Baseline
% Proficient
Yearly
Increment
2012-2013
Target (%P)
2011-2012
Target (%P)
2013-2014
Target (%P)
2014-2015
Target (%P)
2015-2016
Target (%P)
2016-2017
Target (%P)
Baseline
year
59.2 3.4 66 69.4 72.8 76.2 79.6Schoolwide 645 62.61011
75.6 2 79.6 81.6 83.6 85.6 87.6White 217 77.61011
43.4 4.7 52.8 57.5 62.2 66.9 71.6Black 198 48.11011
56.1 3.7 63.5 67.2 70.9 74.6 78.3Hispanic 196 59.81011
- - - - - - -American Indian - -1011
- - - - - - -Asian - -1011
- - - - - - -Two or More Races - -1011
19.9 6.7 33.3 40 46.7 53.4 60.1Students with Disabilities 116 26.61011
- - - - - - -Limited English Proficiency - -1011
50.3 4.2 58.7 62.9 67.1 71.3 75.5Economically Disadvantaged 314 54.51011
11/5/2014
Only Includes full year students (Time In School < Year students are removed)
'-' Indicates too few students to determine (N<30)
Title I Accountability System

39-2660-070
Joseph E. Soehl Middle School
Linden City Board of Education
CDS CODE :
DISTRICT :
SCHOOL :
ESEA Waiver - Annual Progress Targets
The tables represent the annual proficiency targets, established for this School under ESEA Waiver
Schools and Subgroups could meet expectations either by meeting the statewide proficiency rate of 90 percent, or reaching their individually
determined progress targets. The statewide proficiency rate will be increased to 95 percent in 2015.
Performance Targets - Language Arts Literacy
Subgroup# of Valid
Test Scores
Baseline
% Proficient
Yearly
Increment
2012-2013
Target (%P)
2011-2012
Target (%P)
2013-2014
Target (%P)
2014-2015
Target (%P)
2015-2016
Target (%P)
2016-2017
Target (%P)
Baseline
year
56.1 3.7 63.5 67.2 70.9 74.6 78.3Schoolwide 639 59.81011
66.1 2.8 71.7 74.5 77.3 80.1 82.9White 118 68.91011
50.2 4.2 58.6 62.8 67 71.2 75.4Black 261 54.41011
55.2 3.7 62.6 66.3 70 73.7 77.4Hispanic 241 58.91011
- - - - - - -American Indian - -1011
- - - - - - -Asian - -1011
- - - - - - -Two or More Races - -1011
23 6.4 35.8 42.2 48.6 55 61.4Students with Disabilities 139 29.41011
- - - - - - -Limited English Proficiency - -1011
52.2 4 60.2 64.2 68.2 72.2 76.2Economically Disadvantaged 418 56.21011
Performance Targets - Mathematics
Subgroup# of Valid
Test Scores
Baseline
% Proficient
Yearly
Increment
2012-2013
Target (%P)
2011-2012
Target (%P)
2013-2014
Target (%P)
2014-2015
Target (%P)
2015-2016
Target (%P)
2016-2017
Target (%P)
Baseline
year
55.2 3.7 62.6 66.3 70 73.7 77.4Schoolwide 643 58.91011
67.8 2.7 73.2 75.9 78.6 81.3 84White 118 70.51011
43.9 4.7 53.3 58 62.7 67.4 72.1Black 264 48.61011
60 3.4 66.8 70.2 73.6 77 80.4Hispanic 242 63.41011
- - - - - - -American Indian - -1011
- - - - - - -Asian - -1011
- - - - - - -Two or More Races - -1011
25.9 6.2 38.3 44.5 50.7 56.9 63.1Students with Disabilities 143 32.11011
- - - - - - -Limited English Proficiency - -1011
53.6 3.9 61.4 65.3 69.2 73.1 77Economically Disadvantaged 420 57.51011
11/5/2014
Only Includes full year students (Time In School < Year students are removed)
'-' Indicates too few students to determine (N<30)
Title I Accountability System
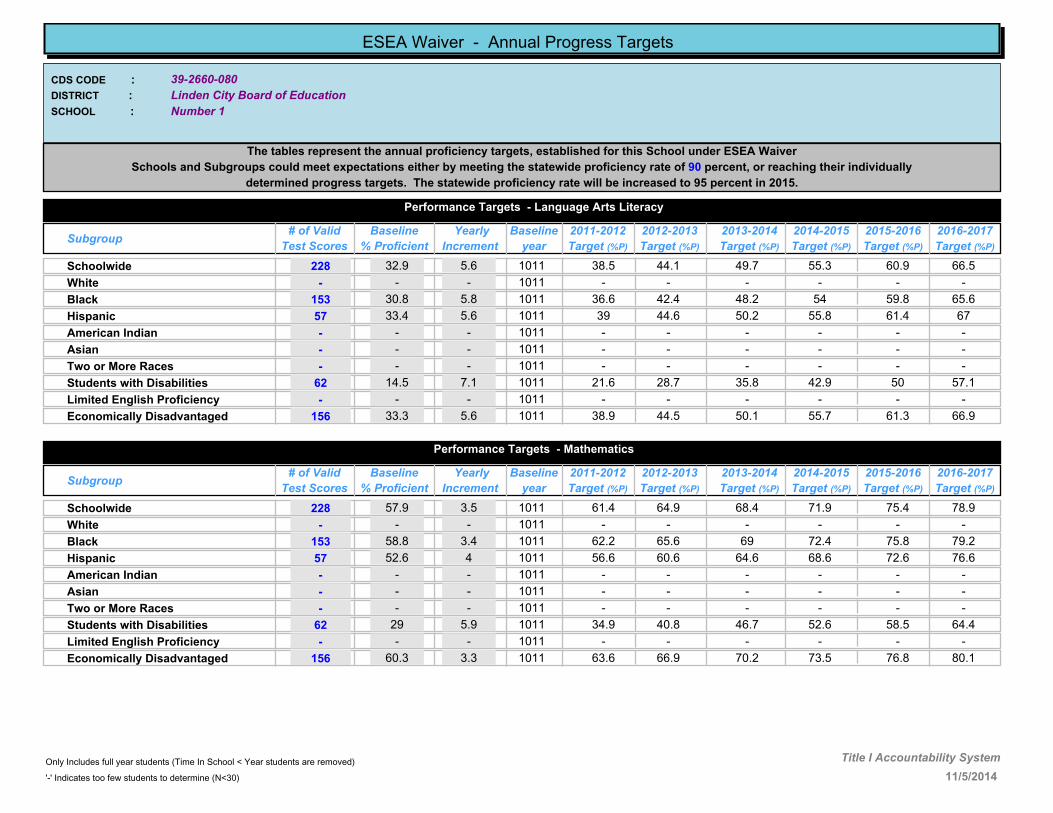
39-2660-080
Number 1
Linden City Board of Education
CDS CODE :
DISTRICT :
SCHOOL :
ESEA Waiver - Annual Progress Targets
The tables represent the annual proficiency targets, established for this School under ESEA Waiver
Schools and Subgroups could meet expectations either by meeting the statewide proficiency rate of 90 percent, or reaching their individually
determined progress targets. The statewide proficiency rate will be increased to 95 percent in 2015.
Performance Targets - Language Arts Literacy
Subgroup# of Valid
Test Scores
Baseline
% Proficient
Yearly
Increment
2012-2013
Target (%P)
2011-2012
Target (%P)
2013-2014
Target (%P)
2014-2015
Target (%P)
2015-2016
Target (%P)
2016-2017
Target (%P)
Baseline
year
32.9 5.6 44.1 49.7 55.3 60.9 66.5Schoolwide 228 38.51011
- - - - - - -White - -1011
30.8 5.8 42.4 48.2 54 59.8 65.6Black 153 36.61011
33.4 5.6 44.6 50.2 55.8 61.4 67Hispanic 57 391011
- - - - - - -American Indian - -1011
- - - - - - -Asian - -1011
- - - - - - -Two or More Races - -1011
14.5 7.1 28.7 35.8 42.9 50 57.1Students with Disabilities 62 21.61011
- - - - - - -Limited English Proficiency - -1011
33.3 5.6 44.5 50.1 55.7 61.3 66.9Economically Disadvantaged 156 38.91011
Performance Targets - Mathematics
Subgroup# of Valid
Test Scores
Baseline
% Proficient
Yearly
Increment
2012-2013
Target (%P)
2011-2012
Target (%P)
2013-2014
Target (%P)
2014-2015
Target (%P)
2015-2016
Target (%P)
2016-2017
Target (%P)
Baseline
year
57.9 3.5 64.9 68.4 71.9 75.4 78.9Schoolwide 228 61.41011
- - - - - - -White - -1011
58.8 3.4 65.6 69 72.4 75.8 79.2Black 153 62.21011
52.6 4 60.6 64.6 68.6 72.6 76.6Hispanic 57 56.61011
- - - - - - -American Indian - -1011
- - - - - - -Asian - -1011
- - - - - - -Two or More Races - -1011
29 5.9 40.8 46.7 52.6 58.5 64.4Students with Disabilities 62 34.91011
- - - - - - -Limited English Proficiency - -1011
60.3 3.3 66.9 70.2 73.5 76.8 80.1Economically Disadvantaged 156 63.61011
11/5/2014
Only Includes full year students (Time In School < Year students are removed)
'-' Indicates too few students to determine (N<30)
Title I Accountability System

39-2660-090
Number 2
Linden City Board of Education
CDS CODE :
DISTRICT :
SCHOOL :
ESEA Waiver - Annual Progress Targets
The tables represent the annual proficiency targets, established for this School under ESEA Waiver
Schools and Subgroups could meet expectations either by meeting the statewide proficiency rate of 90 percent, or reaching their individually
determined progress targets. The statewide proficiency rate will be increased to 95 percent in 2015.
Performance Targets - Language Arts Literacy
Subgroup# of Valid
Test Scores
Baseline
% Proficient
Yearly
Increment
2012-2013
Target (%P)
2011-2012
Target (%P)
2013-2014
Target (%P)
2014-2015
Target (%P)
2015-2016
Target (%P)
2016-2017
Target (%P)
Baseline
year
45.3 4.6 54.5 59.1 63.7 68.3 72.9Schoolwide 108 49.91011
- - - - - - -White - -1011
44.9 4.6 54.1 58.7 63.3 67.9 72.5Black 49 49.51011
38.9 5.1 49.1 54.2 59.3 64.4 69.5Hispanic 36 441011
- - - - - - -American Indian - -1011
- - - - - - -Asian - -1011
- - - - - - -Two or More Races - -1011
- - - - - - -Students with Disabilities - -1011
- - - - - - -Limited English Proficiency - -1011
44.6 4.6 53.8 58.4 63 67.6 72.2Economically Disadvantaged 65 49.21011
Performance Targets - Mathematics
Subgroup# of Valid
Test Scores
Baseline
% Proficient
Yearly
Increment
2012-2013
Target (%P)
2011-2012
Target (%P)
2013-2014
Target (%P)
2014-2015
Target (%P)
2015-2016
Target (%P)
2016-2017
Target (%P)
Baseline
year
65.7 2.9 71.5 74.4 77.3 80.2 83.1Schoolwide 108 68.61011
- - - - - - -White - -1011
63.2 3.1 69.4 72.5 75.6 78.7 81.8Black 49 66.31011
63.9 3 69.9 72.9 75.9 78.9 81.9Hispanic 36 66.91011
- - - - - - -American Indian - -1011
- - - - - - -Asian - -1011
- - - - - - -Two or More Races - -1011
- - - - - - -Students with Disabilities - -1011
- - - - - - -Limited English Proficiency - -1011
66.1 2.8 71.7 74.5 77.3 80.1 82.9Economically Disadvantaged 65 68.91011
11/5/2014
Only Includes full year students (Time In School < Year students are removed)
'-' Indicates too few students to determine (N<30)
Title I Accountability System

39-2660-115
Number 4
Linden City Board of Education
CDS CODE :
DISTRICT :
SCHOOL :
ESEA Waiver - Annual Progress Targets
The tables represent the annual proficiency targets, established for this School under ESEA Waiver
Schools and Subgroups could meet expectations either by meeting the statewide proficiency rate of 90 percent, or reaching their individually
determined progress targets. The statewide proficiency rate will be increased to 95 percent in 2015.
Performance Targets - Language Arts Literacy
Subgroup# of Valid
Test Scores
Baseline
% Proficient
Yearly
Increment
2012-2013
Target (%P)
2011-2012
Target (%P)
2013-2014
Target (%P)
2014-2015
Target (%P)
2015-2016
Target (%P)
2016-2017
Target (%P)
Baseline
year
48.5 4.3 57.1 61.4 65.7 70 74.3Schoolwide 136 52.81011
- - - - - - -White - -1011
42.4 4.8 52 56.8 61.6 66.4 71.2Black 59 47.21011
55.6 3.7 63 66.7 70.4 74.1 77.8Hispanic 63 59.31011
- - - - - - -American Indian - -1011
- - - - - - -Asian - -1011
- - - - - - -Two or More Races - -1011
- - - - - - -Students with Disabilities - -1011
- - - - - - -Limited English Proficiency - -1011
46 4.5 55 59.5 64 68.5 73Economically Disadvantaged 89 50.51011
Performance Targets - Mathematics
Subgroup# of Valid
Test Scores
Baseline
% Proficient
Yearly
Increment
2012-2013
Target (%P)
2011-2012
Target (%P)
2013-2014
Target (%P)
2014-2015
Target (%P)
2015-2016
Target (%P)
2016-2017
Target (%P)
Baseline
year
60 3.3 66.6 69.9 73.2 76.5 79.8Schoolwide 135 63.31011
- - - - - - -White - -1011
55.9 3.7 63.3 67 70.7 74.4 78.1Black 59 59.61011
69.3 2.6 74.5 77.1 79.7 82.3 84.9Hispanic 62 71.91011
- - - - - - -American Indian - -1011
- - - - - - -Asian - -1011
- - - - - - -Two or More Races - -1011
- - - - - - -Students with Disabilities - -1011
- - - - - - -Limited English Proficiency - -1011
56.1 3.7 63.5 67.2 70.9 74.6 78.3Economically Disadvantaged 89 59.81011
11/5/2014
Only Includes full year students (Time In School < Year students are removed)
'-' Indicates too few students to determine (N<30)
Title I Accountability System
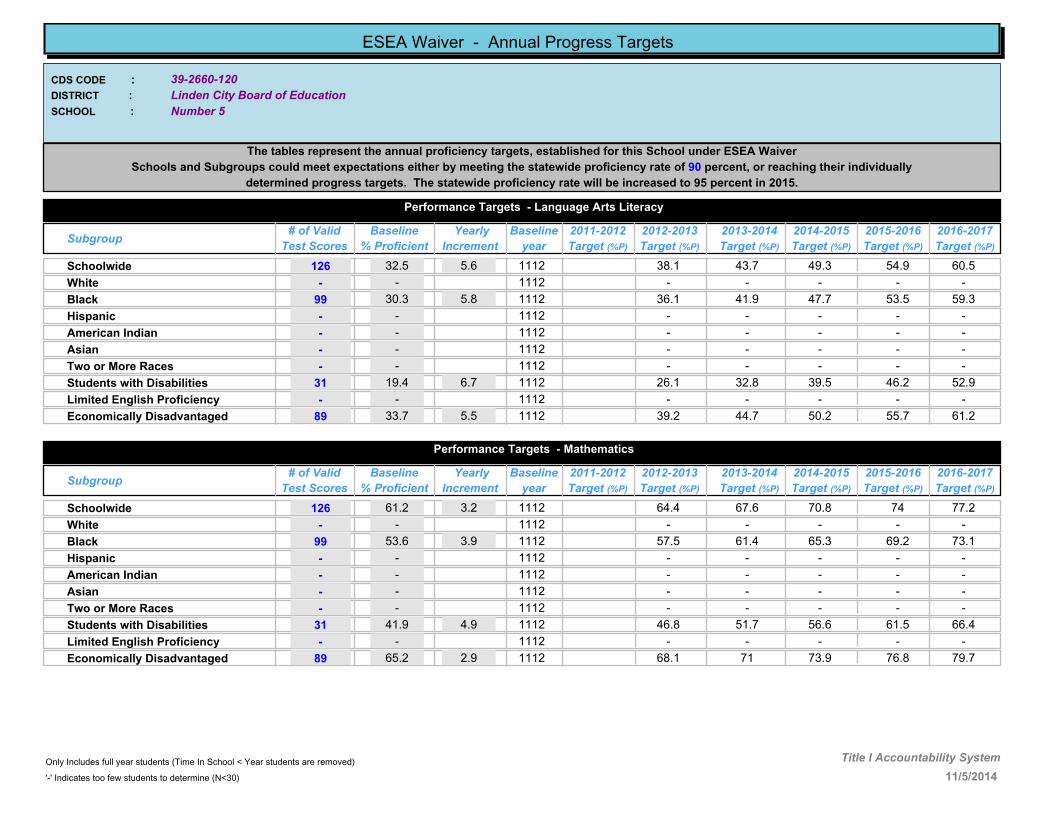
39-2660-120
Number 5
Linden City Board of Education
CDS CODE :
DISTRICT :
SCHOOL :
ESEA Waiver - Annual Progress Targets
The tables represent the annual proficiency targets, established for this School under ESEA Waiver
Schools and Subgroups could meet expectations either by meeting the statewide proficiency rate of 90 percent, or reaching their individually
determined progress targets. The statewide proficiency rate will be increased to 95 percent in 2015.
Performance Targets - Language Arts Literacy
Subgroup# of Valid
Test Scores
Baseline
% Proficient
Yearly
Increment
2012-2013
Target (%P)
2011-2012
Target (%P)
2013-2014
Target (%P)
2014-2015
Target (%P)
2015-2016
Target (%P)
2016-2017
Target (%P)
Baseline
year
32.5 5.6 38.1 43.7 49.3 54.9 60.5Schoolwide 126 1112
- - - - - -White - 1112
30.3 5.8 36.1 41.9 47.7 53.5 59.3Black 99 1112
- - - - - -Hispanic - 1112
- - - - - -American Indian - 1112
- - - - - -Asian - 1112
- - - - - -Two or More Races - 1112
19.4 6.7 26.1 32.8 39.5 46.2 52.9Students with Disabilities 31 1112
- - - - - -Limited English Proficiency - 1112
33.7 5.5 39.2 44.7 50.2 55.7 61.2Economically Disadvantaged 89 1112
Performance Targets - Mathematics
Subgroup# of Valid
Test Scores
Baseline
% Proficient
Yearly
Increment
2012-2013
Target (%P)
2011-2012
Target (%P)
2013-2014
Target (%P)
2014-2015
Target (%P)
2015-2016
Target (%P)
2016-2017
Target (%P)
Baseline
year
61.2 3.2 64.4 67.6 70.8 74 77.2Schoolwide 126 1112
- - - - - -White - 1112
53.6 3.9 57.5 61.4 65.3 69.2 73.1Black 99 1112
- - - - - -Hispanic - 1112
- - - - - -American Indian - 1112
- - - - - -Asian - 1112
- - - - - -Two or More Races - 1112
41.9 4.9 46.8 51.7 56.6 61.5 66.4Students with Disabilities 31 1112
- - - - - -Limited English Proficiency - 1112
65.2 2.9 68.1 71 73.9 76.8 79.7Economically Disadvantaged 89 1112
11/5/2014
Only Includes full year students (Time In School < Year students are removed)
'-' Indicates too few students to determine (N<30)
Title I Accountability System

39-2660-130
Number 6
Linden City Board of Education
CDS CODE :
DISTRICT :
SCHOOL :
ESEA Waiver - Annual Progress Targets
The tables represent the annual proficiency targets, established for this School under ESEA Waiver
Schools and Subgroups could meet expectations either by meeting the statewide proficiency rate of 90 percent, or reaching their individually
determined progress targets. The statewide proficiency rate will be increased to 95 percent in 2015.
Performance Targets - Language Arts Literacy
Subgroup# of Valid
Test Scores
Baseline
% Proficient
Yearly
Increment
2012-2013
Target (%P)
2011-2012
Target (%P)
2013-2014
Target (%P)
2014-2015
Target (%P)
2015-2016
Target (%P)
2016-2017
Target (%P)
Baseline
year
46.6 4.5 55.6 60.1 64.6 69.1 73.6Schoolwide 129 51.11011
61.9 3.2 68.3 71.5 74.7 77.9 81.1White 42 65.11011
44.4 4.6 53.6 58.2 62.8 67.4 72Black 36 491011
34.1 5.5 45.1 50.6 56.1 61.6 67.1Hispanic 44 39.61011
- - - - - - -American Indian - -1011
- - - - - - -Asian - -1011
- - - - - - -Two or More Races - -1011
- - - - - - -Students with Disabilities - -1011
- - - - - - -Limited English Proficiency - -1011
46.3 4.5 55.3 59.8 64.3 68.8 73.3Economically Disadvantaged 80 50.81011
Performance Targets - Mathematics
Subgroup# of Valid
Test Scores
Baseline
% Proficient
Yearly
Increment
2012-2013
Target (%P)
2011-2012
Target (%P)
2013-2014
Target (%P)
2014-2015
Target (%P)
2015-2016
Target (%P)
2016-2017
Target (%P)
Baseline
year
76.6 2 80.6 82.6 84.6 86.6 88.6Schoolwide 128 78.61011
92.8 - 90 90 90 90 90White 42 901011
68.5 2.6 73.7 76.3 78.9 81.5 84.1Black 35 71.11011
65.9 2.9 71.7 74.6 77.5 80.4 83.3Hispanic 44 68.81011
- - - - - - -American Indian - -1011
- - - - - - -Asian - -1011
- - - - - - -Two or More Races - -1011
- - - - - - -Students with Disabilities - -1011
- - - - - - -Limited English Proficiency - -1011
71.3 2.4 76.1 78.5 80.9 83.3 85.7Economically Disadvantaged 80 73.71011
11/5/2014
Only Includes full year students (Time In School < Year students are removed)
'-' Indicates too few students to determine (N<30)
Title I Accountability System

39-2660-150
Number 8
Linden City Board of Education
CDS CODE :
DISTRICT :
SCHOOL :
ESEA Waiver - Annual Progress Targets
The tables represent the annual proficiency targets, established for this School under ESEA Waiver
Schools and Subgroups could meet expectations either by meeting the statewide proficiency rate of 90 percent, or reaching their individually
determined progress targets. The statewide proficiency rate will be increased to 95 percent in 2015.
Performance Targets - Language Arts Literacy
Subgroup# of Valid
Test Scores
Baseline
% Proficient
Yearly
Increment
2012-2013
Target (%P)
2011-2012
Target (%P)
2013-2014
Target (%P)
2014-2015
Target (%P)
2015-2016
Target (%P)
2016-2017
Target (%P)
Baseline
year
45.8 4.5 54.8 59.3 63.8 68.3 72.8Schoolwide 142 50.31011
54.1 3.8 61.7 65.5 69.3 73.1 76.9White 61 57.91011
- - - - - - -Black - -1011
40 5 50 55 60 65 70Hispanic 55 451011
- - - - - - -American Indian - -1011
- - - - - - -Asian - -1011
- - - - - - -Two or More Races - -1011
- - - - - - -Students with Disabilities - -1011
- - - - - - -Limited English Proficiency - -1011
38.7 5.1 48.9 54 59.1 64.2 69.3Economically Disadvantaged 62 43.81011
Performance Targets - Mathematics
Subgroup# of Valid
Test Scores
Baseline
% Proficient
Yearly
Increment
2012-2013
Target (%P)
2011-2012
Target (%P)
2013-2014
Target (%P)
2014-2015
Target (%P)
2015-2016
Target (%P)
2016-2017
Target (%P)
Baseline
year
66.2 2.8 71.8 74.6 77.4 80.2 83Schoolwide 142 691011
70.4 2.5 75.4 77.9 80.4 82.9 85.4White 61 72.91011
- - - - - - -Black - -1011
67.2 2.7 72.6 75.3 78 80.7 83.4Hispanic 55 69.91011
- - - - - - -American Indian - -1011
- - - - - - -Asian - -1011
- - - - - - -Two or More Races - -1011
- - - - - - -Students with Disabilities - -1011
- - - - - - -Limited English Proficiency - -1011
61.3 3.2 67.7 70.9 74.1 77.3 80.5Economically Disadvantaged 62 64.51011
11/5/2014
Only Includes full year students (Time In School < Year students are removed)
'-' Indicates too few students to determine (N<30)
Title I Accountability System

39-2660-160
Number 9
Linden City Board of Education
CDS CODE :
DISTRICT :
SCHOOL :
ESEA Waiver - Annual Progress Targets
The tables represent the annual proficiency targets, established for this School under ESEA Waiver
Schools and Subgroups could meet expectations either by meeting the statewide proficiency rate of 90 percent, or reaching their individually
determined progress targets. The statewide proficiency rate will be increased to 95 percent in 2015.
Performance Targets - Language Arts Literacy
Subgroup# of Valid
Test Scores
Baseline
% Proficient
Yearly
Increment
2012-2013
Target (%P)
2011-2012
Target (%P)
2013-2014
Target (%P)
2014-2015
Target (%P)
2015-2016
Target (%P)
2016-2017
Target (%P)
Baseline
year
60.1 3.3 66.7 70 73.3 76.6 79.9Schoolwide 168 63.41011
68.1 2.7 73.5 76.2 78.9 81.6 84.3White 91 70.81011
42.4 4.8 52 56.8 61.6 66.4 71.2Black 33 47.21011
52.8 3.9 60.6 64.5 68.4 72.3 76.2Hispanic 36 56.71011
- - - - - - -American Indian - -1011
- - - - - - -Asian - -1011
- - - - - - -Two or More Races - -1011
- - - - - - -Students with Disabilities - -1011
- - - - - - -Limited English Proficiency - -1011
51.8 4 59.8 63.8 67.8 71.8 75.8Economically Disadvantaged 56 55.81011
Performance Targets - Mathematics
Subgroup# of Valid
Test Scores
Baseline
% Proficient
Yearly
Increment
2012-2013
Target (%P)
2011-2012
Target (%P)
2013-2014
Target (%P)
2014-2015
Target (%P)
2015-2016
Target (%P)
2016-2017
Target (%P)
Baseline
year
81.5 1.6 84.7 86.3 87.9 89.5 90Schoolwide 168 83.11011
88 1 90 90 90 90 90White 91 891011
63.7 3 69.7 72.7 75.7 78.7 81.7Black 33 66.71011
83.3 1.4 86.1 87.5 88.9 90 90Hispanic 36 84.71011
- - - - - - -American Indian - -1011
- - - - - - -Asian - -1011
- - - - - - -Two or More Races - -1011
- - - - - - -Students with Disabilities - -1011
- - - - - - -Limited English Proficiency - -1011
76.8 1.9 80.6 82.5 84.4 86.3 88.2Economically Disadvantaged 56 78.71011
11/5/2014
Only Includes full year students (Time In School < Year students are removed)
'-' Indicates too few students to determine (N<30)
Title I Accountability System

39-2660-170
Number 10
Linden City Board of Education
CDS CODE :
DISTRICT :
SCHOOL :
ESEA Waiver - Annual Progress Targets
The tables represent the annual proficiency targets, established for this School under ESEA Waiver
Schools and Subgroups could meet expectations either by meeting the statewide proficiency rate of 90 percent, or reaching their individually
determined progress targets. The statewide proficiency rate will be increased to 95 percent in 2015.
Performance Targets - Language Arts Literacy
Subgroup# of Valid
Test Scores
Baseline
% Proficient
Yearly
Increment
2012-2013
Target (%P)
2011-2012
Target (%P)
2013-2014
Target (%P)
2014-2015
Target (%P)
2015-2016
Target (%P)
2016-2017
Target (%P)
Baseline
year
48.2 4.3 56.8 61.1 65.4 69.7 74Schoolwide 110 52.51011
56.3 3.6 63.5 67.1 70.7 74.3 77.9White 55 59.91011
- - - - - - -Black - -1011
36.6 5.3 47.2 52.5 57.8 63.1 68.4Hispanic 41 41.91011
- - - - - - -American Indian - -1011
- - - - - - -Asian - -1011
- - - - - - -Two or More Races - -1011
- - - - - - -Students with Disabilities - -1011
- - - - - - -Limited English Proficiency - -1011
35.5 5.4 46.3 51.7 57.1 62.5 67.9Economically Disadvantaged 31 40.91011
Performance Targets - Mathematics
Subgroup# of Valid
Test Scores
Baseline
% Proficient
Yearly
Increment
2012-2013
Target (%P)
2011-2012
Target (%P)
2013-2014
Target (%P)
2014-2015
Target (%P)
2015-2016
Target (%P)
2016-2017
Target (%P)
Baseline
year
70.9 2.4 75.7 78.1 80.5 82.9 85.3Schoolwide 110 73.31011
80 1.7 83.4 85.1 86.8 88.5 90White 55 81.71011
- - - - - - -Black - -1011
61 3.3 67.6 70.9 74.2 77.5 80.8Hispanic 41 64.31011
- - - - - - -American Indian - -1011
- - - - - - -Asian - -1011
- - - - - - -Two or More Races - -1011
- - - - - - -Students with Disabilities - -1011
- - - - - - -Limited English Proficiency - -1011
61.3 3.2 67.7 70.9 74.1 77.3 80.5Economically Disadvantaged 31 64.51011
11/5/2014
Only Includes full year students (Time In School < Year students are removed)
'-' Indicates too few students to determine (N<30)
Title I Accountability System

39-3470-030
DEERFIELD ELEMENTARY SCHOOL
MOUNTAINSIDE SCHOOL DISTRICT
CDS CODE :
DISTRICT :
SCHOOL :
ESEA Waiver - Annual Progress Targets
The tables represent the annual proficiency targets, established for this School under ESEA Waiver
Schools and Subgroups could meet expectations either by meeting the statewide proficiency rate of 90 percent, or reaching their individually
determined progress targets. The statewide proficiency rate will be increased to 95 percent in 2015.
Performance Targets - Language Arts Literacy
Subgroup# of Valid
Test Scores
Baseline
% Proficient
Yearly
Increment
2012-2013
Target (%P)
2011-2012
Target (%P)
2013-2014
Target (%P)
2014-2015
Target (%P)
2015-2016
Target (%P)
2016-2017
Target (%P)
Baseline
year
85.3 1.2 87.7 88.9 90 90 90Schoolwide 523 86.51011
85.2 1.2 87.6 88.8 90 90 90White 482 86.41011
- - - - - - -Black - -1011
- - - - - - -Hispanic - -1011
- - - - - - -American Indian - -1011
- - - - - - -Asian - -1011
- - - - - - -Two or More Races - -1011
53.3 3.9 61.1 65 68.9 72.8 76.7Students with Disabilities 60 57.21011
- - - - - - -Limited English Proficiency - -1011
- - - - - - -Economically Disadvantaged - -1011
Performance Targets - Mathematics
Subgroup# of Valid
Test Scores
Baseline
% Proficient
Yearly
Increment
2012-2013
Target (%P)
2011-2012
Target (%P)
2013-2014
Target (%P)
2014-2015
Target (%P)
2015-2016
Target (%P)
2016-2017
Target (%P)
Baseline
year
91.6 - 90 90 90 90 90Schoolwide 524 901011
92.1 - 90 90 90 90 90White 482 901011
- - - - - - -Black - -1011
- - - - - - -Hispanic - -1011
- - - - - - -American Indian - -1011
- - - - - - -Asian - -1011
- - - - - - -Two or More Races - -1011
66.7 2.8 72.3 75.1 77.9 80.7 83.5Students with Disabilities 60 69.51011
- - - - - - -Limited English Proficiency - -1011
- - - - - - -Economically Disadvantaged - -1011
11/5/2014
Only Includes full year students (Time In School < Year students are removed)
'-' Indicates too few students to determine (N<30)
Title I Accountability System

39-3560-050
New Providence High School
New Providence Board of Education
CDS CODE :
DISTRICT :
SCHOOL :
ESEA Waiver - Annual Progress Targets
The tables represent the annual proficiency targets, established for this School under ESEA Waiver
Schools and Subgroups could meet expectations either by meeting the statewide proficiency rate of 90 percent, or reaching their individually
determined progress targets. The statewide proficiency rate will be increased to 95 percent in 2015.
Performance Targets - Language Arts Literacy
Subgroup# of Valid
Test Scores
Baseline
% Proficient
Yearly
Increment
2012-2013
Target (%P)
2011-2012
Target (%P)
2013-2014
Target (%P)
2014-2015
Target (%P)
2015-2016
Target (%P)
2016-2017
Target (%P)
Baseline
year
95.3 - 90 90 90 90 90Schoolwide 169 901011
95.1 - 90 90 90 90 90White 142 901011
- - - - - - -Black - -1011
- - - - - - -Hispanic - -1011
- - - - - - -American Indian - -1011
- - - - - - -Asian - -1011
- - - - - - -Two or More Races - -1011
- - - - - - -Students with Disabilities - -1011
- - - - - - -Limited English Proficiency - -1011
- - - - - - -Economically Disadvantaged - -1011
Performance Targets - Mathematics
Subgroup# of Valid
Test Scores
Baseline
% Proficient
Yearly
Increment
2012-2013
Target (%P)
2011-2012
Target (%P)
2013-2014
Target (%P)
2014-2015
Target (%P)
2015-2016
Target (%P)
2016-2017
Target (%P)
Baseline
year
91.1 - 90 90 90 90 90Schoolwide 169 901011
91.6 - 90 90 90 90 90White 142 901011
- - - - - - -Black - -1011
- - - - - - -Hispanic - -1011
- - - - - - -American Indian - -1011
- - - - - - -Asian - -1011
- - - - - - -Two or More Races - -1011
- - - - - - -Students with Disabilities - -1011
- - - - - - -Limited English Proficiency - -1011
- - - - - - -Economically Disadvantaged - -1011
11/5/2014
Only Includes full year students (Time In School < Year students are removed)
'-' Indicates too few students to determine (N<30)
Title I Accountability System
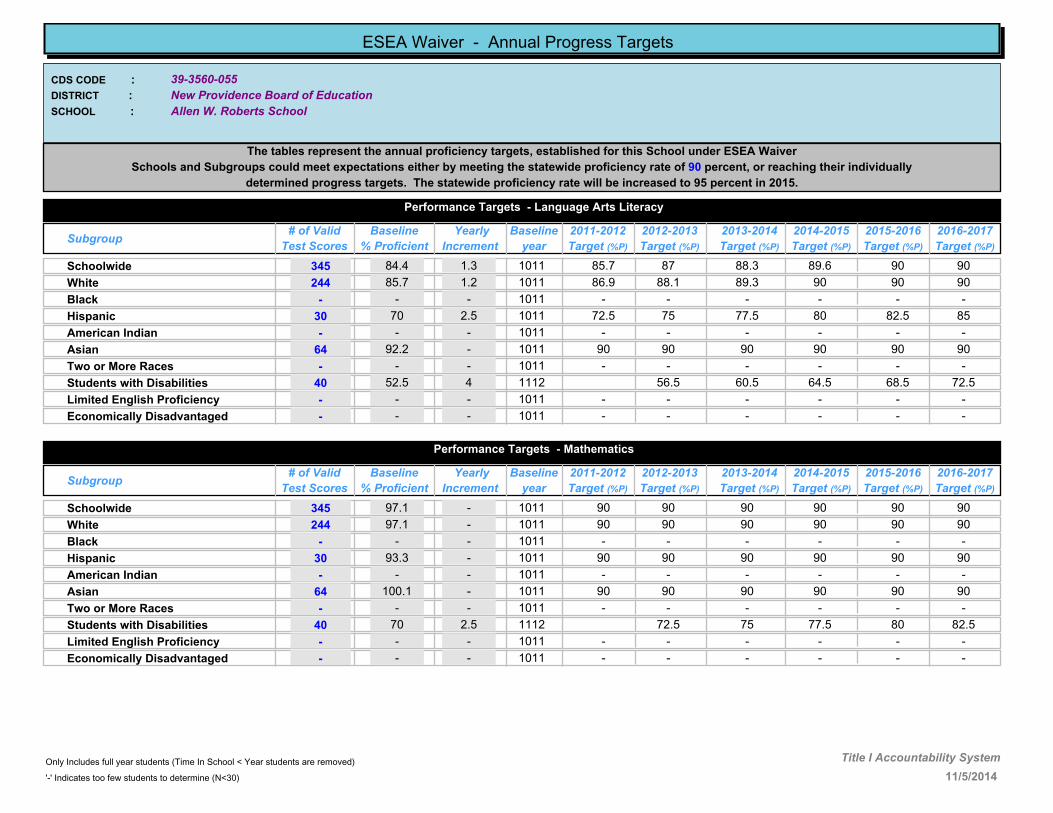
39-3560-055
Allen W. Roberts School
New Providence Board of Education
CDS CODE :
DISTRICT :
SCHOOL :
ESEA Waiver - Annual Progress Targets
The tables represent the annual proficiency targets, established for this School under ESEA Waiver
Schools and Subgroups could meet expectations either by meeting the statewide proficiency rate of 90 percent, or reaching their individually
determined progress targets. The statewide proficiency rate will be increased to 95 percent in 2015.
Performance Targets - Language Arts Literacy
Subgroup# of Valid
Test Scores
Baseline
% Proficient
Yearly
Increment
2012-2013
Target (%P)
2011-2012
Target (%P)
2013-2014
Target (%P)
2014-2015
Target (%P)
2015-2016
Target (%P)
2016-2017
Target (%P)
Baseline
year
84.4 1.3 87 88.3 89.6 90 90Schoolwide 345 85.71011
85.7 1.2 88.1 89.3 90 90 90White 244 86.91011
- - - - - - -Black - -1011
70 2.5 75 77.5 80 82.5 85Hispanic 30 72.51011
- - - - - - -American Indian - -1011
92.2 - 90 90 90 90 90Asian 64 901011
- - - - - - -Two or More Races - -1011
52.5 4 56.5 60.5 64.5 68.5 72.5Students with Disabilities 40 1112
- - - - - - -Limited English Proficiency - -1011
- - - - - - -Economically Disadvantaged - -1011
Performance Targets - Mathematics
Subgroup# of Valid
Test Scores
Baseline
% Proficient
Yearly
Increment
2012-2013
Target (%P)
2011-2012
Target (%P)
2013-2014
Target (%P)
2014-2015
Target (%P)
2015-2016
Target (%P)
2016-2017
Target (%P)
Baseline
year
97.1 - 90 90 90 90 90Schoolwide 345 901011
97.1 - 90 90 90 90 90White 244 901011
- - - - - - -Black - -1011
93.3 - 90 90 90 90 90Hispanic 30 901011
- - - - - - -American Indian - -1011
100.1 - 90 90 90 90 90Asian 64 901011
- - - - - - -Two or More Races - -1011
70 2.5 72.5 75 77.5 80 82.5Students with Disabilities 40 1112
- - - - - - -Limited English Proficiency - -1011
- - - - - - -Economically Disadvantaged - -1011
11/5/2014
Only Includes full year students (Time In School < Year students are removed)
'-' Indicates too few students to determine (N<30)
Title I Accountability System

39-3560-080
New Providence Middle School
New Providence Board of Education
CDS CODE :
DISTRICT :
SCHOOL :
ESEA Waiver - Annual Progress Targets
The tables represent the annual proficiency targets, established for this School under ESEA Waiver
Schools and Subgroups could meet expectations either by meeting the statewide proficiency rate of 90 percent, or reaching their individually
determined progress targets. The statewide proficiency rate will be increased to 95 percent in 2015.
Performance Targets - Language Arts Literacy
Subgroup# of Valid
Test Scores
Baseline
% Proficient
Yearly
Increment
2012-2013
Target (%P)
2011-2012
Target (%P)
2013-2014
Target (%P)
2014-2015
Target (%P)
2015-2016
Target (%P)
2016-2017
Target (%P)
Baseline
year
92.2 - 90 90 90 90 90Schoolwide 333 901011
91.8 - 90 90 90 90 90White 256 901011
- - - - - - -Black - -1011
- - - - - - -Hispanic - -1011
- - - - - - -American Indian - -1011
97.6 - 90 90 90 90 90Asian 43 901011
- - - - - - -Two or More Races - -1011
75.6 2 79.6 81.6 83.6 85.6 87.6Students with Disabilities 41 77.61011
- - - - - - -Limited English Proficiency - -1011
- - - - - - -Economically Disadvantaged - -1011
Performance Targets - Mathematics
Subgroup# of Valid
Test Scores
Baseline
% Proficient
Yearly
Increment
2012-2013
Target (%P)
2011-2012
Target (%P)
2013-2014
Target (%P)
2014-2015
Target (%P)
2015-2016
Target (%P)
2016-2017
Target (%P)
Baseline
year
92.8 - 90 90 90 90 90Schoolwide 334 901011
92.9 - 90 90 90 90 90White 256 901011
- - - - - - -Black - -1011
- - - - - - -Hispanic - -1011
- - - - - - -American Indian - -1011
100 - 90 90 90 90 90Asian 44 901011
- - - - - - -Two or More Races - -1011
85.4 1.2 87.8 89 90 90 90Students with Disabilities 41 86.61011
- - - - - - -Limited English Proficiency - -1011
- - - - - - -Economically Disadvantaged - -1011
11/5/2014
Only Includes full year students (Time In School < Year students are removed)
'-' Indicates too few students to determine (N<30)
Title I Accountability System

39-3560-090
Salt Brook School
New Providence Board of Education
CDS CODE :
DISTRICT :
SCHOOL :
ESEA Waiver - Annual Progress Targets
The tables represent the annual proficiency targets, established for this School under ESEA Waiver
Schools and Subgroups could meet expectations either by meeting the statewide proficiency rate of 90 percent, or reaching their individually
determined progress targets. The statewide proficiency rate will be increased to 95 percent in 2015.
Performance Targets - Language Arts Literacy
Subgroup# of Valid
Test Scores
Baseline
% Proficient
Yearly
Increment
2012-2013
Target (%P)
2011-2012
Target (%P)
2013-2014
Target (%P)
2014-2015
Target (%P)
2015-2016
Target (%P)
2016-2017
Target (%P)
Baseline
year
91.1 - 90 90 90 90 90Schoolwide 336 901011
90.9 - 90 90 90 90 90White 286 901011
- - - - - - -Black - -1011
- - - - - - -Hispanic - -1011
- - - - - - -American Indian - -1011
97 - 90 90 90 90 90Asian 33 901011
- - - - - - -Two or More Races - -1011
55.9 3.7 63.3 67 70.7 74.4 78.1Students with Disabilities 34 59.61011
- - - - - - -Limited English Proficiency - -1011
- - - - - - -Economically Disadvantaged - -1011
Performance Targets - Mathematics
Subgroup# of Valid
Test Scores
Baseline
% Proficient
Yearly
Increment
2012-2013
Target (%P)
2011-2012
Target (%P)
2013-2014
Target (%P)
2014-2015
Target (%P)
2015-2016
Target (%P)
2016-2017
Target (%P)
Baseline
year
97.6 - 90 90 90 90 90Schoolwide 336 901011
97.2 - 90 90 90 90 90White 286 901011
- - - - - - -Black - -1011
- - - - - - -Hispanic - -1011
- - - - - - -American Indian - -1011
100 - 90 90 90 90 90Asian 33 901011
- - - - - - -Two or More Races - -1011
85.3 1.2 87.7 88.9 90 90 90Students with Disabilities 34 86.51011
- - - - - - -Limited English Proficiency - -1011
- - - - - - -Economically Disadvantaged - -1011
11/5/2014
Only Includes full year students (Time In School < Year students are removed)
'-' Indicates too few students to determine (N<30)
Title I Accountability System

39-4160-050
Plainfield High School
Plainfield Public Schools
CDS CODE :
DISTRICT :
SCHOOL :
ESEA Waiver - Annual Progress Targets
The tables represent the annual proficiency targets, established for this School under ESEA Waiver
Schools and Subgroups could meet expectations either by meeting the statewide proficiency rate of 90 percent, or reaching their individually
determined progress targets. The statewide proficiency rate will be increased to 95 percent in 2015.
Performance Targets - Language Arts Literacy
Subgroup# of Valid
Test Scores
Baseline
% Proficient
Yearly
Increment
2012-2013
Target (%P)
2011-2012
Target (%P)
2013-2014
Target (%P)
2014-2015
Target (%P)
2015-2016
Target (%P)
2016-2017
Target (%P)
Baseline
year
71.1 2.4 75.9 78.3 80.7 83.1 85.5Schoolwide 266 73.51011
- - - - - - -White - -1011
68 2.7 73.4 76.1 78.8 81.5 84.2Black 156 70.71011
76.2 2 80.2 82.2 84.2 86.2 88.2Hispanic 105 78.21011
- - - - - - -American Indian - -1011
- - - - - - -Asian - -1011
- - - - - - -Two or More Races - -1011
18.8 6.8 32.4 39.2 46 52.8 59.6Students with Disabilities 64 25.61011
- - - - - - -Limited English Proficiency - -1011
80 1.7 83.4 85.1 86.8 88.5 90Economically Disadvantaged 110 81.71011
Performance Targets - Mathematics
Subgroup# of Valid
Test Scores
Baseline
% Proficient
Yearly
Increment
2012-2013
Target (%P)
2011-2012
Target (%P)
2013-2014
Target (%P)
2014-2015
Target (%P)
2015-2016
Target (%P)
2016-2017
Target (%P)
Baseline
year
47.5 4.4 56.3 60.7 65.1 69.5 73.9Schoolwide 263 51.91011
- - - - - - -White - -1011
43.2 4.7 52.6 57.3 62 66.7 71.4Black 155 47.91011
54.3 3.8 61.9 65.7 69.5 73.3 77.1Hispanic 103 58.11011
- - - - - - -American Indian - -1011
- - - - - - -Asian - -1011
- - - - - - -Two or More Races - -1011
11.3 7.4 26.1 33.5 40.9 48.3 55.7Students with Disabilities 62 18.71011
- - - - - - -Limited English Proficiency - -1011
57.3 3.6 64.5 68.1 71.7 75.3 78.9Economically Disadvantaged 110 60.91011
11/5/2014
Only Includes full year students (Time In School < Year students are removed)
'-' Indicates too few students to determine (N<30)
Title I Accountability System

39-4160-052
PLAINFIELD ACADEMY FOR THE ARTS & ADVANCED STUDIES
Plainfield Public Schools
CDS CODE :
DISTRICT :
SCHOOL :
ESEA Waiver - Annual Progress Targets
The tables represent the annual proficiency targets, established for this School under ESEA Waiver
Schools and Subgroups could meet expectations either by meeting the statewide proficiency rate of 90 percent, or reaching their individually
determined progress targets. The statewide proficiency rate will be increased to 95 percent in 2015.
Performance Targets - Language Arts Literacy
Subgroup# of Valid
Test Scores
Baseline
% Proficient
Yearly
Increment
2012-2013
Target (%P)
2011-2012
Target (%P)
2013-2014
Target (%P)
2014-2015
Target (%P)
2015-2016
Target (%P)
2016-2017
Target (%P)
Baseline
year
64.2 3 70.2 73.2 76.2 79.2 82.2Schoolwide 106 67.21011
- - - - - - -White - -1011
61 3.3 67.6 70.9 74.2 77.5 80.8Black 64 64.31011
69 2.6 74.2 76.8 79.4 82 84.6Hispanic 42 71.61011
- - - - - - -American Indian - -1011
- - - - - - -Asian - -1011
- - - - - - -Two or More Races - -1011
- - - - - - -Students with Disabilities - -1011
- - - - - - -Limited English Proficiency - -1011
61.6 3.2 68 71.2 74.4 77.6 80.8Economically Disadvantaged 73 64.81011
Performance Targets - Mathematics
Subgroup# of Valid
Test Scores
Baseline
% Proficient
Yearly
Increment
2012-2013
Target (%P)
2011-2012
Target (%P)
2013-2014
Target (%P)
2014-2015
Target (%P)
2015-2016
Target (%P)
2016-2017
Target (%P)
Baseline
year
55.6 3.7 63 66.7 70.4 74.1 77.8Schoolwide 106 59.31011
- - - - - - -White - -1011
51.6 4 59.6 63.6 67.6 71.6 75.6Black 64 55.61011
61.9 3.2 68.3 71.5 74.7 77.9 81.1Hispanic 42 65.11011
- - - - - - -American Indian - -1011
- - - - - - -Asian - -1011
- - - - - - -Two or More Races - -1011
- - - - - - -Students with Disabilities - -1011
- - - - - - -Limited English Proficiency - -1011
54.8 3.8 62.4 66.2 70 73.8 77.6Economically Disadvantaged 73 58.61011
11/5/2014
Only Includes full year students (Time In School < Year students are removed)
'-' Indicates too few students to determine (N<30)
Title I Accountability System

39-4160-060
Hubbard Middle School
Plainfield Public Schools
CDS CODE :
DISTRICT :
SCHOOL :
ESEA Waiver - Annual Progress Targets
The tables represent the annual proficiency targets, established for this School under ESEA Waiver
Schools and Subgroups could meet expectations either by meeting the statewide proficiency rate of 90 percent, or reaching their individually
determined progress targets. The statewide proficiency rate will be increased to 95 percent in 2015.
Performance Targets - Language Arts Literacy
Subgroup# of Valid
Test Scores
Baseline
% Proficient
Yearly
Increment
2012-2013
Target (%P)
2011-2012
Target (%P)
2013-2014
Target (%P)
2014-2015
Target (%P)
2015-2016
Target (%P)
2016-2017
Target (%P)
Baseline
year
32.3 5.7 43.7 49.4 55.1 60.8 66.5Schoolwide 291 381011
- - - - - - -White - -1011
30.1 5.8 41.7 47.5 53.3 59.1 64.9Black 113 35.91011
34.1 5.5 45.1 50.6 56.1 61.6 67.1Hispanic 176 39.61011
- - - - - - -American Indian - -1011
- - - - - - -Asian - -1011
- - - - - - -Two or More Races - -1011
13.2 7.2 27.6 34.8 42 49.2 56.4Students with Disabilities 68 20.41011
10.8 7.4 25.6 33 40.4 47.8 55.2Limited English Proficiency 37 18.21011
31.8 5.7 43.2 48.9 54.6 60.3 66Economically Disadvantaged 261 37.51011
Performance Targets - Mathematics
Subgroup# of Valid
Test Scores
Baseline
% Proficient
Yearly
Increment
2012-2013
Target (%P)
2011-2012
Target (%P)
2013-2014
Target (%P)
2014-2015
Target (%P)
2015-2016
Target (%P)
2016-2017
Target (%P)
Baseline
year
23.1 6.4 35.9 42.3 48.7 55.1 61.5Schoolwide 290 29.51011
- - - - - - -White - -1011
20.4 6.6 33.6 40.2 46.8 53.4 60Black 113 271011
25 6.3 37.6 43.9 50.2 56.5 62.8Hispanic 176 31.31011
- - - - - - -American Indian - -1011
- - - - - - -Asian - -1011
- - - - - - -Two or More Races - -1011
10.3 7.5 25.3 32.8 40.3 47.8 55.3Students with Disabilities 68 17.81011
8.1 7.7 23.5 31.2 38.9 46.6 54.3Limited English Proficiency 37 15.81011
22.7 6.5 35.7 42.2 48.7 55.2 61.7Economically Disadvantaged 260 29.21011
11/5/2014
Only Includes full year students (Time In School < Year students are removed)
'-' Indicates too few students to determine (N<30)
Title I Accountability System

39-4160-070
Maxson Middle School
Plainfield Public Schools
CDS CODE :
DISTRICT :
SCHOOL :
ESEA Waiver - Annual Progress Targets
The tables represent the annual proficiency targets, established for this School under ESEA Waiver
Schools and Subgroups could meet expectations either by meeting the statewide proficiency rate of 90 percent, or reaching their individually
determined progress targets. The statewide proficiency rate will be increased to 95 percent in 2015.
Performance Targets - Language Arts Literacy
Subgroup# of Valid
Test Scores
Baseline
% Proficient
Yearly
Increment
2012-2013
Target (%P)
2011-2012
Target (%P)
2013-2014
Target (%P)
2014-2015
Target (%P)
2015-2016
Target (%P)
2016-2017
Target (%P)
Baseline
year
43.6 4.7 53 57.7 62.4 67.1 71.8Schoolwide 278 48.31011
- - - - - - -White - -1011
42.2 4.8 51.8 56.6 61.4 66.2 71Black 135 471011
45 4.6 54.2 58.8 63.4 68 72.6Hispanic 140 49.61011
- - - - - - -American Indian - -1011
- - - - - - -Asian - -1011
- - - - - - -Two or More Races - -1011
13.5 7.2 27.9 35.1 42.3 49.5 56.7Students with Disabilities 52 20.71011
5.1 7.9 13 20.9 28.8 36.7 44.6Limited English Proficiency 39 1112
42.7 4.8 52.3 57.1 61.9 66.7 71.5Economically Disadvantaged 239 47.51011
Performance Targets - Mathematics
Subgroup# of Valid
Test Scores
Baseline
% Proficient
Yearly
Increment
2012-2013
Target (%P)
2011-2012
Target (%P)
2013-2014
Target (%P)
2014-2015
Target (%P)
2015-2016
Target (%P)
2016-2017
Target (%P)
Baseline
year
34.1 5.5 45.1 50.6 56.1 61.6 67.1Schoolwide 275 39.61011
- - - - - - -White - -1011
28 6 40 46 52 58 64Black 132 341011
40 5 50 55 60 65 70Hispanic 140 451011
- - - - - - -American Indian - -1011
- - - - - - -Asian - -1011
- - - - - - -Two or More Races - -1011
15.7 7 29.7 36.7 43.7 50.7 57.7Students with Disabilities 51 22.71011
15.4 7.1 22.5 29.6 36.7 43.8 50.9Limited English Proficiency 39 1112
34.2 5.5 45.2 50.7 56.2 61.7 67.2Economically Disadvantaged 237 39.71011
11/5/2014
Only Includes full year students (Time In School < Year students are removed)
'-' Indicates too few students to determine (N<30)
Title I Accountability System

39-4160-080
Dewitt D. Barlow Elementary School
Plainfield Public Schools
CDS CODE :
DISTRICT :
SCHOOL :
ESEA Waiver - Annual Progress Targets
The tables represent the annual proficiency targets, established for this School under ESEA Waiver
Schools and Subgroups could meet expectations either by meeting the statewide proficiency rate of 90 percent, or reaching their individually
determined progress targets. The statewide proficiency rate will be increased to 95 percent in 2015.
Performance Targets - Language Arts Literacy
Subgroup# of Valid
Test Scores
Baseline
% Proficient
Yearly
Increment
2012-2013
Target (%P)
2011-2012
Target (%P)
2013-2014
Target (%P)
2014-2015
Target (%P)
2015-2016
Target (%P)
2016-2017
Target (%P)
Baseline
year
32.7 5.6 43.9 49.5 55.1 60.7 66.3Schoolwide 147 38.31011
- - - - - - -White - -1011
32.7 5.6 43.9 49.5 55.1 60.7 66.3Black 49 38.31011
33 5.6 44.2 49.8 55.4 61 66.6Hispanic 97 38.61011
- - - - - - -American Indian - -1011
- - - - - - -Asian - -1011
- - - - - - -Two or More Races - -1011
- - - - - - -Students with Disabilities - -1011
27.8 6 39.8 45.8 51.8 57.8 63.8Limited English Proficiency 36 33.81011
29.7 5.9 41.5 47.4 53.3 59.2 65.1Economically Disadvantaged 128 35.61011
Performance Targets - Mathematics
Subgroup# of Valid
Test Scores
Baseline
% Proficient
Yearly
Increment
2012-2013
Target (%P)
2011-2012
Target (%P)
2013-2014
Target (%P)
2014-2015
Target (%P)
2015-2016
Target (%P)
2016-2017
Target (%P)
Baseline
year
52 4 60 64 68 72 76Schoolwide 148 561011
- - - - - - -White - -1011
46.9 4.4 55.7 60.1 64.5 68.9 73.3Black 49 51.31011
54.1 3.8 61.7 65.5 69.3 73.1 76.9Hispanic 98 57.91011
- - - - - - -American Indian - -1011
- - - - - - -Asian - -1011
- - - - - - -Two or More Races - -1011
- - - - - - -Students with Disabilities - -1011
50 4.2 58.4 62.6 66.8 71 75.2Limited English Proficiency 36 54.21011
52 4 60 64 68 72 76Economically Disadvantaged 129 561011
11/5/2014
Only Includes full year students (Time In School < Year students are removed)
'-' Indicates too few students to determine (N<30)
Title I Accountability System

39-4160-100
Cedarbrook Elementary School
Plainfield Public Schools
CDS CODE :
DISTRICT :
SCHOOL :
ESEA Waiver - Annual Progress Targets
The tables represent the annual proficiency targets, established for this School under ESEA Waiver
Schools and Subgroups could meet expectations either by meeting the statewide proficiency rate of 90 percent, or reaching their individually
determined progress targets. The statewide proficiency rate will be increased to 95 percent in 2015.
Performance Targets - Language Arts Literacy
Subgroup# of Valid
Test Scores
Baseline
% Proficient
Yearly
Increment
2012-2013
Target (%P)
2011-2012
Target (%P)
2013-2014
Target (%P)
2014-2015
Target (%P)
2015-2016
Target (%P)
2016-2017
Target (%P)
Baseline
year
56.8 3.6 64 67.6 71.2 74.8 78.4Schoolwide 308 60.41011
- - - - - - -White - -1011
56.6 3.6 63.8 67.4 71 74.6 78.2Black 219 60.21011
56.3 3.7 63.7 67.4 71.1 74.8 78.5Hispanic 87 601011
- - - - - - -American Indian - -1011
- - - - - - -Asian - -1011
- - - - - - -Two or More Races - -1011
15.4 7.1 29.6 36.7 43.8 50.9 58Students with Disabilities 39 22.51011
- - - - - - -Limited English Proficiency - -1011
51.6 4.1 59.8 63.9 68 72.1 76.2Economically Disadvantaged 194 55.71011
Performance Targets - Mathematics
Subgroup# of Valid
Test Scores
Baseline
% Proficient
Yearly
Increment
2012-2013
Target (%P)
2011-2012
Target (%P)
2013-2014
Target (%P)
2014-2015
Target (%P)
2015-2016
Target (%P)
2016-2017
Target (%P)
Baseline
year
64.6 3 70.6 73.6 76.6 79.6 82.6Schoolwide 308 67.61011
- - - - - - -White - -1011
63.5 3.1 69.7 72.8 75.9 79 82.1Black 219 66.61011
66.7 2.8 72.3 75.1 77.9 80.7 83.5Hispanic 87 69.51011
- - - - - - -American Indian - -1011
- - - - - - -Asian - -1011
- - - - - - -Two or More Races - -1011
41 4.9 50.8 55.7 60.6 65.5 70.4Students with Disabilities 39 45.91011
- - - - - - -Limited English Proficiency - -1011
59.8 3.4 66.6 70 73.4 76.8 80.2Economically Disadvantaged 194 63.21011
11/5/2014
Only Includes full year students (Time In School < Year students are removed)
'-' Indicates too few students to determine (N<30)
Title I Accountability System

39-4160-110
Clinton Elementary School
Plainfield Public Schools
CDS CODE :
DISTRICT :
SCHOOL :
ESEA Waiver - Annual Progress Targets
The tables represent the annual proficiency targets, established for this School under ESEA Waiver
Schools and Subgroups could meet expectations either by meeting the statewide proficiency rate of 90 percent, or reaching their individually
determined progress targets. The statewide proficiency rate will be increased to 95 percent in 2015.
Performance Targets - Language Arts Literacy
Subgroup# of Valid
Test Scores
Baseline
% Proficient
Yearly
Increment
2012-2013
Target (%P)
2011-2012
Target (%P)
2013-2014
Target (%P)
2014-2015
Target (%P)
2015-2016
Target (%P)
2016-2017
Target (%P)
Baseline
year
40.8 4.9 50.6 55.5 60.4 65.3 70.2Schoolwide 125 45.71011
- - - - - - -White - -1011
35.5 5.4 46.3 51.7 57.1 62.5 67.9Black 62 40.91011
45.2 4.6 54.4 59 63.6 68.2 72.8Hispanic 62 49.81011
- - - - - - -American Indian - -1011
- - - - - - -Asian - -1011
- - - - - - -Two or More Races - -1011
- - - - - - -Students with Disabilities - -1011
16.7 7 23.7 30.7 37.7 44.7Limited English Proficiency 30 1213
39 5.1 49.2 54.3 59.4 64.5 69.6Economically Disadvantaged 100 44.11011
Performance Targets - Mathematics
Subgroup# of Valid
Test Scores
Baseline
% Proficient
Yearly
Increment
2012-2013
Target (%P)
2011-2012
Target (%P)
2013-2014
Target (%P)
2014-2015
Target (%P)
2015-2016
Target (%P)
2016-2017
Target (%P)
Baseline
year
55.2 3.7 62.6 66.3 70 73.7 77.4Schoolwide 125 58.91011
- - - - - - -White - -1011
51.6 4 59.6 63.6 67.6 71.6 75.6Black 62 55.61011
58.1 3.5 65.1 68.6 72.1 75.6 79.1Hispanic 62 61.61011
- - - - - - -American Indian - -1011
- - - - - - -Asian - -1011
- - - - - - -Two or More Races - -1011
- - - - - - -Students with Disabilities - -1011
56.6 3.6 60.2 63.8 67.4 71Limited English Proficiency 30 1213
53 3.9 60.8 64.7 68.6 72.5 76.4Economically Disadvantaged 100 56.91011
11/5/2014
Only Includes full year students (Time In School < Year students are removed)
'-' Indicates too few students to determine (N<30)
Title I Accountability System

39-4160-120
Frederic W. Cook Elementary School
Plainfield Public Schools
CDS CODE :
DISTRICT :
SCHOOL :
ESEA Waiver - Annual Progress Targets
The tables represent the annual proficiency targets, established for this School under ESEA Waiver
Schools and Subgroups could meet expectations either by meeting the statewide proficiency rate of 90 percent, or reaching their individually
determined progress targets. The statewide proficiency rate will be increased to 95 percent in 2015.
Performance Targets - Language Arts Literacy
Subgroup# of Valid
Test Scores
Baseline
% Proficient
Yearly
Increment
2012-2013
Target (%P)
2011-2012
Target (%P)
2013-2014
Target (%P)
2014-2015
Target (%P)
2015-2016
Target (%P)
2016-2017
Target (%P)
Baseline
year
47.1 4.4 55.9 60.3 64.7 69.1 73.5Schoolwide 172 51.51011
- - - - - - -White - -1011
48.1 4.3 56.7 61 65.3 69.6 73.9Black 131 52.41011
38.7 5.1 48.9 54 59.1 64.2 69.3Hispanic 31 43.81011
- - - - - - -American Indian - -1011
- - - - - - -Asian - -1011
- - - - - - -Two or More Races - -1011
20 6.7 26.7 33.4 40.1 46.8 53.5Students with Disabilities 30 1112
- - - - - - -Limited English Proficiency - -1011
35.6 5.4 46.4 51.8 57.2 62.6 68Economically Disadvantaged 104 411011
Performance Targets - Mathematics
Subgroup# of Valid
Test Scores
Baseline
% Proficient
Yearly
Increment
2012-2013
Target (%P)
2011-2012
Target (%P)
2013-2014
Target (%P)
2014-2015
Target (%P)
2015-2016
Target (%P)
2016-2017
Target (%P)
Baseline
year
63.4 3.1 69.6 72.7 75.8 78.9 82Schoolwide 172 66.51011
- - - - - - -White - -1011
61.1 3.3 67.7 71 74.3 77.6 80.9Black 131 64.41011
61.3 3.2 67.7 70.9 74.1 77.3 80.5Hispanic 31 64.51011
- - - - - - -American Indian - -1011
- - - - - - -Asian - -1011
- - - - - - -Two or More Races - -1011
40 5 45 50 55 60 65Students with Disabilities 30 1112
- - - - - - -Limited English Proficiency - -1011
56.7 3.6 63.9 67.5 71.1 74.7 78.3Economically Disadvantaged 104 60.31011
11/5/2014
Only Includes full year students (Time In School < Year students are removed)
'-' Indicates too few students to determine (N<30)
Title I Accountability System

39-4160-130
Emerson Elementary School
Plainfield Public Schools
CDS CODE :
DISTRICT :
SCHOOL :
ESEA Waiver - Annual Progress Targets
The tables represent the annual proficiency targets, established for this School under ESEA Waiver
Schools and Subgroups could meet expectations either by meeting the statewide proficiency rate of 90 percent, or reaching their individually
determined progress targets. The statewide proficiency rate will be increased to 95 percent in 2015.
Performance Targets - Language Arts Literacy
Subgroup# of Valid
Test Scores
Baseline
% Proficient
Yearly
Increment
2012-2013
Target (%P)
2011-2012
Target (%P)
2013-2014
Target (%P)
2014-2015
Target (%P)
2015-2016
Target (%P)
2016-2017
Target (%P)
Baseline
year
31.9 5.7 43.3 49 54.7 60.4 66.1Schoolwide 204 37.61011
- - - - - - -White - -1011
35.4 5.4 46.2 51.6 57 62.4 67.8Black 116 40.81011
26.4 6.1 38.6 44.7 50.8 56.9 63Hispanic 87 32.51011
- - - - - - -American Indian - -1011
- - - - - - -Asian - -1011
- - - - - - -Two or More Races - -1011
11.4 7.4 26.2 33.6 41 48.4 55.8Students with Disabilities 44 18.81011
38.2 5.2 43.4 48.6 53.8 59 64.2Limited English Proficiency 34 1112
28.5 6 40.5 46.5 52.5 58.5 64.5Economically Disadvantaged 151 34.51011
Performance Targets - Mathematics
Subgroup# of Valid
Test Scores
Baseline
% Proficient
Yearly
Increment
2012-2013
Target (%P)
2011-2012
Target (%P)
2013-2014
Target (%P)
2014-2015
Target (%P)
2015-2016
Target (%P)
2016-2017
Target (%P)
Baseline
year
59.8 3.4 66.6 70 73.4 76.8 80.2Schoolwide 204 63.21011
- - - - - - -White - -1011
54.3 3.8 61.9 65.7 69.5 73.3 77.1Black 116 58.11011
66.6 2.8 72.2 75 77.8 80.6 83.4Hispanic 87 69.41011
- - - - - - -American Indian - -1011
- - - - - - -Asian - -1011
- - - - - - -Two or More Races - -1011
37.2 5.2 47.6 52.8 58 63.2 68.4Students with Disabilities 43 42.41011
70.6 2.5 73.1 75.6 78.1 80.6 83.1Limited English Proficiency 34 1112
60.3 3.3 66.9 70.2 73.5 76.8 80.1Economically Disadvantaged 151 63.61011
11/5/2014
Only Includes full year students (Time In School < Year students are removed)
'-' Indicates too few students to determine (N<30)
Title I Accountability System

39-4160-140
Evergreen Elementary School
Plainfield Public Schools
CDS CODE :
DISTRICT :
SCHOOL :
ESEA Waiver - Annual Progress Targets
The tables represent the annual proficiency targets, established for this School under ESEA Waiver
Schools and Subgroups could meet expectations either by meeting the statewide proficiency rate of 90 percent, or reaching their individually
determined progress targets. The statewide proficiency rate will be increased to 95 percent in 2015.
Performance Targets - Language Arts Literacy
Subgroup# of Valid
Test Scores
Baseline
% Proficient
Yearly
Increment
2012-2013
Target (%P)
2011-2012
Target (%P)
2013-2014
Target (%P)
2014-2015
Target (%P)
2015-2016
Target (%P)
2016-2017
Target (%P)
Baseline
year
35.1 5.4 45.9 51.3 56.7 62.1 67.5Schoolwide 225 40.51011
- - - - - - -White - -1011
48.8 4.3 57.4 61.7 66 70.3 74.6Black 84 53.11011
27.1 6.1 39.3 45.4 51.5 57.6 63.7Hispanic 140 33.21011
- - - - - - -American Indian - -1011
- - - - - - -Asian - -1011
- - - - - - -Two or More Races - -1011
- - - - - - -Students with Disabilities - -1011
17.9 6.9 31.7 38.6 45.5 52.4 59.3Limited English Proficiency 67 24.81011
31.6 5.7 43 48.7 54.4 60.1 65.8Economically Disadvantaged 183 37.31011
Performance Targets - Mathematics
Subgroup# of Valid
Test Scores
Baseline
% Proficient
Yearly
Increment
2012-2013
Target (%P)
2011-2012
Target (%P)
2013-2014
Target (%P)
2014-2015
Target (%P)
2015-2016
Target (%P)
2016-2017
Target (%P)
Baseline
year
59.1 3.4 65.9 69.3 72.7 76.1 79.5Schoolwide 225 62.51011
- - - - - - -White - -1011
64.3 3 70.3 73.3 76.3 79.3 82.3Black 84 67.31011
55.7 3.7 63.1 66.8 70.5 74.2 77.9Hispanic 140 59.41011
- - - - - - -American Indian - -1011
- - - - - - -Asian - -1011
- - - - - - -Two or More Races - -1011
- - - - - - -Students with Disabilities - -1011
40.3 5 50.3 55.3 60.3 65.3 70.3Limited English Proficiency 67 45.31011
55.2 3.7 62.6 66.3 70 73.7 77.4Economically Disadvantaged 183 58.91011
11/5/2014
Only Includes full year students (Time In School < Year students are removed)
'-' Indicates too few students to determine (N<30)
Title I Accountability System

39-4160-150
Jefferson Elementary School
Plainfield Public Schools
CDS CODE :
DISTRICT :
SCHOOL :
ESEA Waiver - Annual Progress Targets
The tables represent the annual proficiency targets, established for this School under ESEA Waiver
Schools and Subgroups could meet expectations either by meeting the statewide proficiency rate of 90 percent, or reaching their individually
determined progress targets. The statewide proficiency rate will be increased to 95 percent in 2015.
Performance Targets - Language Arts Literacy
Subgroup# of Valid
Test Scores
Baseline
% Proficient
Yearly
Increment
2012-2013
Target (%P)
2011-2012
Target (%P)
2013-2014
Target (%P)
2014-2015
Target (%P)
2015-2016
Target (%P)
2016-2017
Target (%P)
Baseline
year
32.5 5.6 43.7 49.3 54.9 60.5 66.1Schoolwide 148 38.11011
- - - - - - -White - -1011
25.6 6.2 38 44.2 50.4 56.6 62.8Black 43 31.81011
35.3 5.4 46.1 51.5 56.9 62.3 67.7Hispanic 105 40.71011
- - - - - - -American Indian - -1011
- - - - - - -Asian - -1011
- - - - - - -Two or More Races - -1011
13.5 7.2 27.9 35.1 42.3 49.5 56.7Students with Disabilities 37 20.71011
20 6.7 33.4 40.1 46.8 53.5 60.2Limited English Proficiency 50 26.71011
30.3 5.8 41.9 47.7 53.5 59.3 65.1Economically Disadvantaged 132 36.11011
Performance Targets - Mathematics
Subgroup# of Valid
Test Scores
Baseline
% Proficient
Yearly
Increment
2012-2013
Target (%P)
2011-2012
Target (%P)
2013-2014
Target (%P)
2014-2015
Target (%P)
2015-2016
Target (%P)
2016-2017
Target (%P)
Baseline
year
39.6 5 49.6 54.6 59.6 64.6 69.6Schoolwide 149 44.61011
- - - - - - -White - -1011
34.9 5.4 45.7 51.1 56.5 61.9 67.3Black 43 40.31011
41.5 4.9 51.3 56.2 61.1 66 70.9Hispanic 106 46.41011
- - - - - - -American Indian - -1011
- - - - - - -Asian - -1011
- - - - - - -Two or More Races - -1011
29.7 5.9 41.5 47.4 53.3 59.2 65.1Students with Disabilities 37 35.61011
27.5 6.1 39.7 45.8 51.9 58 64.1Limited English Proficiency 51 33.61011
39.8 5 49.8 54.8 59.8 64.8 69.8Economically Disadvantaged 133 44.81011
11/5/2014
Only Includes full year students (Time In School < Year students are removed)
'-' Indicates too few students to determine (N<30)
Title I Accountability System

39-4160-170
Charles H. Stillman Elementary School
Plainfield Public Schools
CDS CODE :
DISTRICT :
SCHOOL :
ESEA Waiver - Annual Progress Targets
The tables represent the annual proficiency targets, established for this School under ESEA Waiver
Schools and Subgroups could meet expectations either by meeting the statewide proficiency rate of 90 percent, or reaching their individually
determined progress targets. The statewide proficiency rate will be increased to 95 percent in 2015.
Performance Targets - Language Arts Literacy
Subgroup# of Valid
Test Scores
Baseline
% Proficient
Yearly
Increment
2012-2013
Target (%P)
2011-2012
Target (%P)
2013-2014
Target (%P)
2014-2015
Target (%P)
2015-2016
Target (%P)
2016-2017
Target (%P)
Baseline
year
28.4 6 40.4 46.4 52.4 58.4 64.4Schoolwide 116 34.41011
- - - - - - -White - -1011
20 6.7 33.4 40.1 46.8 53.5 60.2Black 45 26.71011
34.3 5.5 45.3 50.8 56.3 61.8 67.3Hispanic 70 39.81011
- - - - - - -American Indian - -1011
- - - - - - -Asian - -1011
- - - - - - -Two or More Races - -1011
3.3 8.1 11.4 19.5 27.6 35.7 43.8Students with Disabilities 30 1112
26.5 6.1 38.7 44.8 50.9 57 63.1Limited English Proficiency 34 32.61011
27.9 6 39.9 45.9 51.9 57.9 63.9Economically Disadvantaged 104 33.91011
Performance Targets - Mathematics
Subgroup# of Valid
Test Scores
Baseline
% Proficient
Yearly
Increment
2012-2013
Target (%P)
2011-2012
Target (%P)
2013-2014
Target (%P)
2014-2015
Target (%P)
2015-2016
Target (%P)
2016-2017
Target (%P)
Baseline
year
39.7 5 49.7 54.7 59.7 64.7 69.7Schoolwide 116 44.71011
- - - - - - -White - -1011
28.9 5.9 40.7 46.6 52.5 58.4 64.3Black 45 34.81011
47.2 4.4 56 60.4 64.8 69.2 73.6Hispanic 70 51.61011
- - - - - - -American Indian - -1011
- - - - - - -Asian - -1011
- - - - - - -Two or More Races - -1011
26.7 6.1 32.8 38.9 45 51.1 57.2Students with Disabilities 30 1112
32.3 5.6 43.5 49.1 54.7 60.3 65.9Limited English Proficiency 34 37.91011
40.4 5 50.4 55.4 60.4 65.4 70.4Economically Disadvantaged 104 45.41011
11/5/2014
Only Includes full year students (Time In School < Year students are removed)
'-' Indicates too few students to determine (N<30)
Title I Accountability System
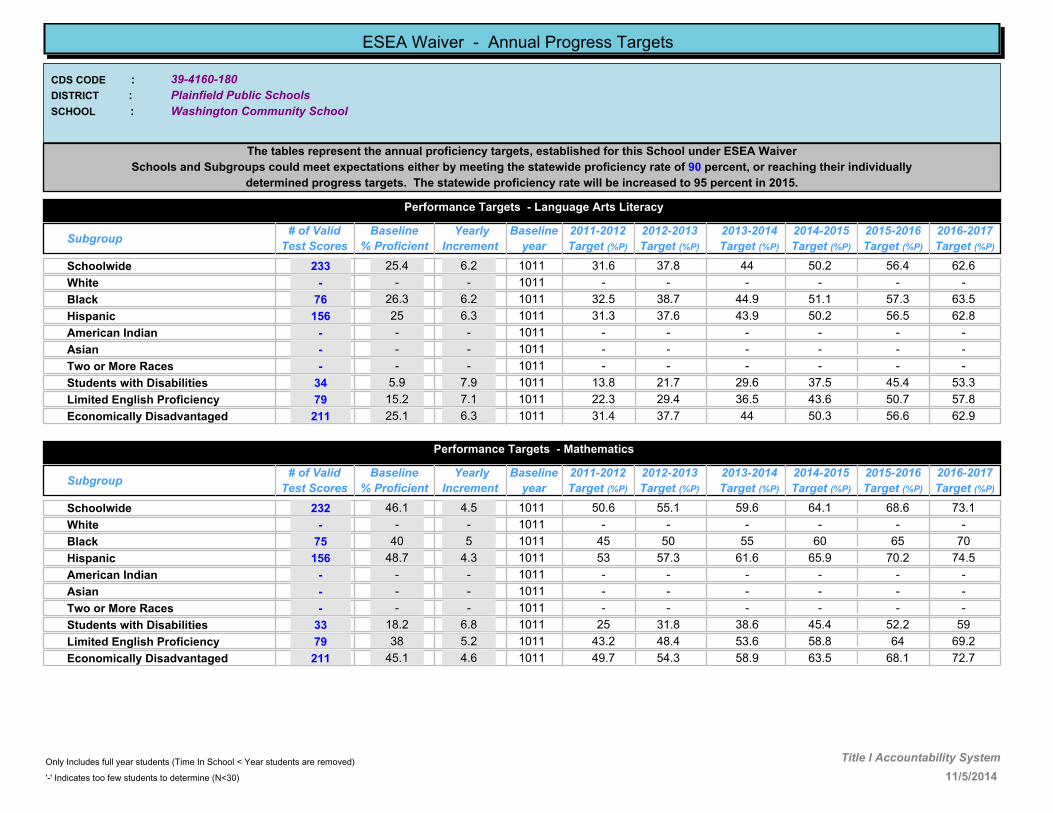
39-4160-180
Washington Community School
Plainfield Public Schools
CDS CODE :
DISTRICT :
SCHOOL :
ESEA Waiver - Annual Progress Targets
The tables represent the annual proficiency targets, established for this School under ESEA Waiver
Schools and Subgroups could meet expectations either by meeting the statewide proficiency rate of 90 percent, or reaching their individually
determined progress targets. The statewide proficiency rate will be increased to 95 percent in 2015.
Performance Targets - Language Arts Literacy
Subgroup# of Valid
Test Scores
Baseline
% Proficient
Yearly
Increment
2012-2013
Target (%P)
2011-2012
Target (%P)
2013-2014
Target (%P)
2014-2015
Target (%P)
2015-2016
Target (%P)
2016-2017
Target (%P)
Baseline
year
25.4 6.2 37.8 44 50.2 56.4 62.6Schoolwide 233 31.61011
- - - - - - -White - -1011
26.3 6.2 38.7 44.9 51.1 57.3 63.5Black 76 32.51011
25 6.3 37.6 43.9 50.2 56.5 62.8Hispanic 156 31.31011
- - - - - - -American Indian - -1011
- - - - - - -Asian - -1011
- - - - - - -Two or More Races - -1011
5.9 7.9 21.7 29.6 37.5 45.4 53.3Students with Disabilities 34 13.81011
15.2 7.1 29.4 36.5 43.6 50.7 57.8Limited English Proficiency 79 22.31011
25.1 6.3 37.7 44 50.3 56.6 62.9Economically Disadvantaged 211 31.41011
Performance Targets - Mathematics
Subgroup# of Valid
Test Scores
Baseline
% Proficient
Yearly
Increment
2012-2013
Target (%P)
2011-2012
Target (%P)
2013-2014
Target (%P)
2014-2015
Target (%P)
2015-2016
Target (%P)
2016-2017
Target (%P)
Baseline
year
46.1 4.5 55.1 59.6 64.1 68.6 73.1Schoolwide 232 50.61011
- - - - - - -White - -1011
40 5 50 55 60 65 70Black 75 451011
48.7 4.3 57.3 61.6 65.9 70.2 74.5Hispanic 156 531011
- - - - - - -American Indian - -1011
- - - - - - -Asian - -1011
- - - - - - -Two or More Races - -1011
18.2 6.8 31.8 38.6 45.4 52.2 59Students with Disabilities 33 251011
38 5.2 48.4 53.6 58.8 64 69.2Limited English Proficiency 79 43.21011
45.1 4.6 54.3 58.9 63.5 68.1 72.7Economically Disadvantaged 211 49.71011
11/5/2014
Only Includes full year students (Time In School < Year students are removed)
'-' Indicates too few students to determine (N<30)
Title I Accountability System

39-4160-190
Woodland Elementary School
Plainfield Public Schools
CDS CODE :
DISTRICT :
SCHOOL :
ESEA Waiver - Annual Progress Targets
The tables represent the annual proficiency targets, established for this School under ESEA Waiver
Schools and Subgroups could meet expectations either by meeting the statewide proficiency rate of 90 percent, or reaching their individually
determined progress targets. The statewide proficiency rate will be increased to 95 percent in 2015.
Performance Targets - Language Arts Literacy
Subgroup# of Valid
Test Scores
Baseline
% Proficient
Yearly
Increment
2012-2013
Target (%P)
2011-2012
Target (%P)
2013-2014
Target (%P)
2014-2015
Target (%P)
2015-2016
Target (%P)
2016-2017
Target (%P)
Baseline
year
44.4 4.6 53.6 58.2 62.8 67.4 72Schoolwide 108 491011
- - - - - - -White - -1011
48.4 4.3 57 61.3 65.6 69.9 74.2Black 64 52.71011
34.1 5.5 45.1 50.6 56.1 61.6 67.1Hispanic 41 39.61011
- - - - - - -American Indian - -1011
- - - - - - -Asian - -1011
- - - - - - -Two or More Races - -1011
- - - - - - -Students with Disabilities - -1011
- - - - - - -Limited English Proficiency - -1011
41.6 4.9 51.4 56.3 61.2 66.1 71Economically Disadvantaged 89 46.51011
Performance Targets - Mathematics
Subgroup# of Valid
Test Scores
Baseline
% Proficient
Yearly
Increment
2012-2013
Target (%P)
2011-2012
Target (%P)
2013-2014
Target (%P)
2014-2015
Target (%P)
2015-2016
Target (%P)
2016-2017
Target (%P)
Baseline
year
55.6 3.7 63 66.7 70.4 74.1 77.8Schoolwide 108 59.31011
- - - - - - -White - -1011
45.3 4.6 54.5 59.1 63.7 68.3 72.9Black 64 49.91011
68.3 2.7 73.7 76.4 79.1 81.8 84.5Hispanic 41 711011
- - - - - - -American Indian - -1011
- - - - - - -Asian - -1011
- - - - - - -Two or More Races - -1011
- - - - - - -Students with Disabilities - -1011
- - - - - - -Limited English Proficiency - -1011
53.9 3.9 61.7 65.6 69.5 73.4 77.3Economically Disadvantaged 89 57.81011
11/5/2014
Only Includes full year students (Time In School < Year students are removed)
'-' Indicates too few students to determine (N<30)
Title I Accountability System

39-4290-050
Rahway High School
Rahway Public School District
CDS CODE :
DISTRICT :
SCHOOL :
ESEA Waiver - Annual Progress Targets
The tables represent the annual proficiency targets, established for this School under ESEA Waiver
Schools and Subgroups could meet expectations either by meeting the statewide proficiency rate of 90 percent, or reaching their individually
determined progress targets. The statewide proficiency rate will be increased to 95 percent in 2015.
Performance Targets - Language Arts Literacy
Subgroup# of Valid
Test Scores
Baseline
% Proficient
Yearly
Increment
2012-2013
Target (%P)
2011-2012
Target (%P)
2013-2014
Target (%P)
2014-2015
Target (%P)
2015-2016
Target (%P)
2016-2017
Target (%P)
Baseline
year
81.2 1.6 84.4 86 87.6 89.2 90Schoolwide 282 82.81011
91.7 - 90 90 90 90 90White 60 901011
77.7 1.9 81.5 83.4 85.3 87.2 89.1Black 121 79.61011
84 1.3 86.6 87.9 89.2 90 90Hispanic 69 85.31011
- - - - - - -American Indian - -1011
- - - - - - -Asian - -1011
- - - - - - -Two or More Races - -1011
37.2 5.2 47.6 52.8 58 63.2 68.4Students with Disabilities 51 42.41011
- - - - - - -Limited English Proficiency - -1011
80.3 1.7 83.7 85.4 87.1 88.8 90Economically Disadvantaged 117 821011
Performance Targets - Mathematics
Subgroup# of Valid
Test Scores
Baseline
% Proficient
Yearly
Increment
2012-2013
Target (%P)
2011-2012
Target (%P)
2013-2014
Target (%P)
2014-2015
Target (%P)
2015-2016
Target (%P)
2016-2017
Target (%P)
Baseline
year
67.6 2.7 73 75.7 78.4 81.1 83.8Schoolwide 281 70.31011
86.7 1.1 88.9 90 90 90 90White 60 87.81011
67.5 2.7 72.9 75.6 78.3 81 83.7Black 120 70.21011
65.2 2.9 71 73.9 76.8 79.7 82.6Hispanic 69 68.11011
- - - - - - -American Indian - -1011
- - - - - - -Asian - -1011
- - - - - - -Two or More Races - -1011
24 6.3 36.6 42.9 49.2 55.5 61.8Students with Disabilities 50 30.31011
- - - - - - -Limited English Proficiency - -1011
63 3.1 69.2 72.3 75.4 78.5 81.6Economically Disadvantaged 116 66.11011
11/5/2014
Only Includes full year students (Time In School < Year students are removed)
'-' Indicates too few students to determine (N<30)
Title I Accountability System

39-4290-060
Rahway 7th & 8th Grade Academy
Rahway Public School District
CDS CODE :
DISTRICT :
SCHOOL :
ESEA Waiver - Annual Progress Targets
The tables represent the annual proficiency targets, established for this School under ESEA Waiver
Schools and Subgroups could meet expectations either by meeting the statewide proficiency rate of 90 percent, or reaching their individually
determined progress targets. The statewide proficiency rate will be increased to 95 percent in 2015.
Performance Targets - Language Arts Literacy
Subgroup# of Valid
Test Scores
Baseline
% Proficient
Yearly
Increment
2012-2013
Target (%P)
2011-2012
Target (%P)
2013-2014
Target (%P)
2014-2015
Target (%P)
2015-2016
Target (%P)
2016-2017
Target (%P)
Baseline
year
58.1 3.5 65.1 68.6 72.1 75.6 79.1Schoolwide 797 61.61011
75.5 2.1 79.7 81.8 83.9 86 88.1White 159 77.61011
52.2 4 60.2 64.2 68.2 72.2 76.2Black 362 56.21011
54.8 3.8 62.4 66.2 70 73.8 77.6Hispanic 248 58.61011
- - - - - - -American Indian - -1011
- - - - - - -Asian - -1011
- - - - - - -Two or More Races - -1011
20.5 6.6 33.7 40.3 46.9 53.5 60.1Students with Disabilities 141 27.11011
- - - - - - -Limited English Proficiency - -1011
51.7 4 59.7 63.7 67.7 71.7 75.7Economically Disadvantaged 470 55.71011
Performance Targets - Mathematics
Subgroup# of Valid
Test Scores
Baseline
% Proficient
Yearly
Increment
2012-2013
Target (%P)
2011-2012
Target (%P)
2013-2014
Target (%P)
2014-2015
Target (%P)
2015-2016
Target (%P)
2016-2017
Target (%P)
Baseline
year
61 3.3 67.6 70.9 74.2 77.5 80.8Schoolwide 798 64.31011
74.9 2.1 79.1 81.2 83.3 85.4 87.5White 159 771011
54.8 3.8 62.4 66.2 70 73.8 77.6Black 363 58.61011
59.9 3.4 66.7 70.1 73.5 76.9 80.3Hispanic 247 63.31011
- - - - - - -American Indian - -1011
- - - - - - -Asian - -1011
- - - - - - -Two or More Races - -1011
20.8 6.6 34 40.6 47.2 53.8 60.4Students with Disabilities 140 27.41011
- - - - - - -Limited English Proficiency - -1011
57.6 3.5 64.6 68.1 71.6 75.1 78.6Economically Disadvantaged 469 61.11011
11/5/2014
Only Includes full year students (Time In School < Year students are removed)
'-' Indicates too few students to determine (N<30)
Title I Accountability System

39-4290-080
Franklin Elementary School
Rahway Public School District
CDS CODE :
DISTRICT :
SCHOOL :
ESEA Waiver - Annual Progress Targets
The tables represent the annual proficiency targets, established for this School under ESEA Waiver
Schools and Subgroups could meet expectations either by meeting the statewide proficiency rate of 90 percent, or reaching their individually
determined progress targets. The statewide proficiency rate will be increased to 95 percent in 2015.
Performance Targets - Language Arts Literacy
Subgroup# of Valid
Test Scores
Baseline
% Proficient
Yearly
Increment
2012-2013
Target (%P)
2011-2012
Target (%P)
2013-2014
Target (%P)
2014-2015
Target (%P)
2015-2016
Target (%P)
2016-2017
Target (%P)
Baseline
year
56.5 3.6 63.7 67.3 70.9 74.5 78.1Schoolwide 223 60.11011
65.9 2.9 71.7 74.6 77.5 80.4 83.3White 44 68.81011
49.3 4.2 57.7 61.9 66.1 70.3 74.5Black 73 53.51011
55.5 3.7 62.9 66.6 70.3 74 77.7Hispanic 90 59.21011
- - - - - - -American Indian - -1011
- - - - - - -Asian - -1011
- - - - - - -Two or More Races - -1011
46.3 4.5 55.3 59.8 64.3 68.8 73.3Students with Disabilities 41 50.81011
- - - - - - -Limited English Proficiency - -1011
53 3.9 60.8 64.7 68.6 72.5 76.4Economically Disadvantaged 132 56.91011
Performance Targets - Mathematics
Subgroup# of Valid
Test Scores
Baseline
% Proficient
Yearly
Increment
2012-2013
Target (%P)
2011-2012
Target (%P)
2013-2014
Target (%P)
2014-2015
Target (%P)
2015-2016
Target (%P)
2016-2017
Target (%P)
Baseline
year
81.7 1.5 84.7 86.2 87.7 89.2 90Schoolwide 224 83.21011
90.9 - 90 90 90 90 90White 44 901011
69.9 2.5 74.9 77.4 79.9 82.4 84.9Black 73 72.41011
86.8 1.1 89 90 90 90 90Hispanic 91 87.91011
- - - - - - -American Indian - -1011
- - - - - - -Asian - -1011
- - - - - - -Two or More Races - -1011
75.6 2 79.6 81.6 83.6 85.6 87.6Students with Disabilities 41 77.61011
- - - - - - -Limited English Proficiency - -1011
78.9 1.8 82.5 84.3 86.1 87.9 89.7Economically Disadvantaged 133 80.71011
11/5/2014
Only Includes full year students (Time In School < Year students are removed)
'-' Indicates too few students to determine (N<30)
Title I Accountability System

39-4290-090
Grover Cleveland Elementary School
Rahway Public School District
CDS CODE :
DISTRICT :
SCHOOL :
ESEA Waiver - Annual Progress Targets
The tables represent the annual proficiency targets, established for this School under ESEA Waiver
Schools and Subgroups could meet expectations either by meeting the statewide proficiency rate of 90 percent, or reaching their individually
determined progress targets. The statewide proficiency rate will be increased to 95 percent in 2015.
Performance Targets - Language Arts Literacy
Subgroup# of Valid
Test Scores
Baseline
% Proficient
Yearly
Increment
2012-2013
Target (%P)
2011-2012
Target (%P)
2013-2014
Target (%P)
2014-2015
Target (%P)
2015-2016
Target (%P)
2016-2017
Target (%P)
Baseline
year
48.3 4.3 56.9 61.2 65.5 69.8 74.1Schoolwide 114 52.61011
- - - - - - -White - -1011
50.9 4.1 59.1 63.2 67.3 71.4 75.5Black 59 551011
45.7 4.5 54.7 59.2 63.7 68.2 72.7Hispanic 46 50.21011
- - - - - - -American Indian - -1011
- - - - - - -Asian - -1011
- - - - - - -Two or More Races - -1011
17.8 6.9 24.7 31.6 38.5 45.4Students with Disabilities 45 1213
- - - - - - -Limited English Proficiency - -1011
48.7 4.3 57.3 61.6 65.9 70.2 74.5Economically Disadvantaged 78 531011
Performance Targets - Mathematics
Subgroup# of Valid
Test Scores
Baseline
% Proficient
Yearly
Increment
2012-2013
Target (%P)
2011-2012
Target (%P)
2013-2014
Target (%P)
2014-2015
Target (%P)
2015-2016
Target (%P)
2016-2017
Target (%P)
Baseline
year
80.7 1.6 83.9 85.5 87.1 88.7 90Schoolwide 114 82.31011
- - - - - - -White - -1011
83.1 1.4 85.9 87.3 88.7 90 90Black 59 84.51011
80.4 1.6 83.6 85.2 86.8 88.4 90Hispanic 46 821011
- - - - - - -American Indian - -1011
- - - - - - -Asian - -1011
- - - - - - -Two or More Races - -1011
44.5 4.6 49.1 53.7 58.3 62.9Students with Disabilities 45 1213
- - - - - - -Limited English Proficiency - -1011
76.9 1.9 80.7 82.6 84.5 86.4 88.3Economically Disadvantaged 78 78.81011
11/5/2014
Only Includes full year students (Time In School < Year students are removed)
'-' Indicates too few students to determine (N<30)
Title I Accountability System

39-4290-110
Madison Elementary
Rahway Public School District
CDS CODE :
DISTRICT :
SCHOOL :
ESEA Waiver - Annual Progress Targets
The tables represent the annual proficiency targets, established for this School under ESEA Waiver
Schools and Subgroups could meet expectations either by meeting the statewide proficiency rate of 90 percent, or reaching their individually
determined progress targets. The statewide proficiency rate will be increased to 95 percent in 2015.
Performance Targets - Language Arts Literacy
Subgroup# of Valid
Test Scores
Baseline
% Proficient
Yearly
Increment
2012-2013
Target (%P)
2011-2012
Target (%P)
2013-2014
Target (%P)
2014-2015
Target (%P)
2015-2016
Target (%P)
2016-2017
Target (%P)
Baseline
year
52.3 4 60.3 64.3 68.3 72.3 76.3Schoolwide 132 56.31011
68 2.7 73.4 76.1 78.8 81.5 84.2White 50 70.71011
- - - - - - -Black - -1011
41.3 4.9 51.1 56 60.9 65.8 70.7Hispanic 46 46.21011
- - - - - - -American Indian - -1011
- - - - - - -Asian - -1011
- - - - - - -Two or More Races - -1011
- - - - - - -Students with Disabilities - -1011
- - - - - - -Limited English Proficiency - -1011
44.3 4.7 53.7 58.4 63.1 67.8 72.5Economically Disadvantaged 61 491011
Performance Targets - Mathematics
Subgroup# of Valid
Test Scores
Baseline
% Proficient
Yearly
Increment
2012-2013
Target (%P)
2011-2012
Target (%P)
2013-2014
Target (%P)
2014-2015
Target (%P)
2015-2016
Target (%P)
2016-2017
Target (%P)
Baseline
year
75.8 2 79.8 81.8 83.8 85.8 87.8Schoolwide 132 77.81011
84 1.3 86.6 87.9 89.2 90 90White 50 85.31011
- - - - - - -Black - -1011
69.6 2.5 74.6 77.1 79.6 82.1 84.6Hispanic 46 72.11011
- - - - - - -American Indian - -1011
- - - - - - -Asian - -1011
- - - - - - -Two or More Races - -1011
- - - - - - -Students with Disabilities - -1011
- - - - - - -Limited English Proficiency - -1011
77.1 1.9 80.9 82.8 84.7 86.6 88.5Economically Disadvantaged 61 791011
11/5/2014
Only Includes full year students (Time In School < Year students are removed)
'-' Indicates too few students to determine (N<30)
Title I Accountability System
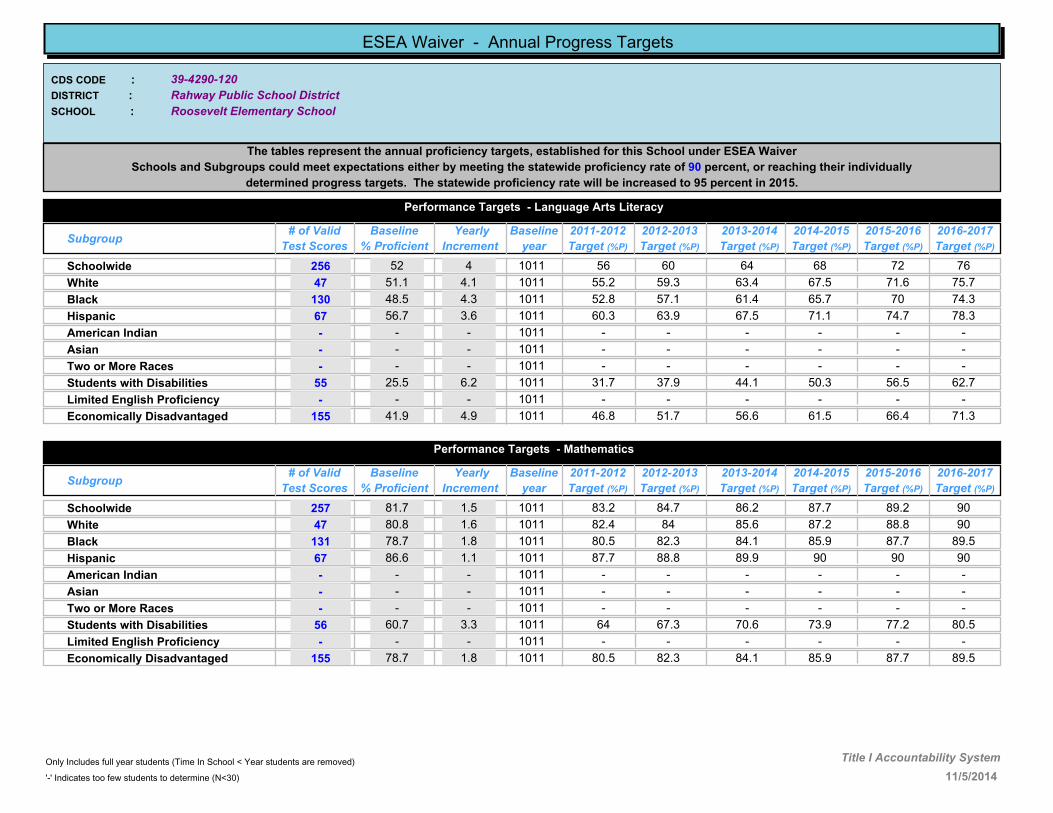
39-4290-120
Roosevelt Elementary School
Rahway Public School District
CDS CODE :
DISTRICT :
SCHOOL :
ESEA Waiver - Annual Progress Targets
The tables represent the annual proficiency targets, established for this School under ESEA Waiver
Schools and Subgroups could meet expectations either by meeting the statewide proficiency rate of 90 percent, or reaching their individually
determined progress targets. The statewide proficiency rate will be increased to 95 percent in 2015.
Performance Targets - Language Arts Literacy
Subgroup# of Valid
Test Scores
Baseline
% Proficient
Yearly
Increment
2012-2013
Target (%P)
2011-2012
Target (%P)
2013-2014
Target (%P)
2014-2015
Target (%P)
2015-2016
Target (%P)
2016-2017
Target (%P)
Baseline
year
52 4 60 64 68 72 76Schoolwide 256 561011
51.1 4.1 59.3 63.4 67.5 71.6 75.7White 47 55.21011
48.5 4.3 57.1 61.4 65.7 70 74.3Black 130 52.81011
56.7 3.6 63.9 67.5 71.1 74.7 78.3Hispanic 67 60.31011
- - - - - - -American Indian - -1011
- - - - - - -Asian - -1011
- - - - - - -Two or More Races - -1011
25.5 6.2 37.9 44.1 50.3 56.5 62.7Students with Disabilities 55 31.71011
- - - - - - -Limited English Proficiency - -1011
41.9 4.9 51.7 56.6 61.5 66.4 71.3Economically Disadvantaged 155 46.81011
Performance Targets - Mathematics
Subgroup# of Valid
Test Scores
Baseline
% Proficient
Yearly
Increment
2012-2013
Target (%P)
2011-2012
Target (%P)
2013-2014
Target (%P)
2014-2015
Target (%P)
2015-2016
Target (%P)
2016-2017
Target (%P)
Baseline
year
81.7 1.5 84.7 86.2 87.7 89.2 90Schoolwide 257 83.21011
80.8 1.6 84 85.6 87.2 88.8 90White 47 82.41011
78.7 1.8 82.3 84.1 85.9 87.7 89.5Black 131 80.51011
86.6 1.1 88.8 89.9 90 90 90Hispanic 67 87.71011
- - - - - - -American Indian - -1011
- - - - - - -Asian - -1011
- - - - - - -Two or More Races - -1011
60.7 3.3 67.3 70.6 73.9 77.2 80.5Students with Disabilities 56 641011
- - - - - - -Limited English Proficiency - -1011
78.7 1.8 82.3 84.1 85.9 87.7 89.5Economically Disadvantaged 155 80.51011
11/5/2014
Only Includes full year students (Time In School < Year students are removed)
'-' Indicates too few students to determine (N<30)
Title I Accountability System

39-4540-010
ABRAHAM CLARK HIGH SCHOOL
ROSELLE PUBLIC SCHOOLS
CDS CODE :
DISTRICT :
SCHOOL :
ESEA Waiver - Annual Progress Targets
The tables represent the annual proficiency targets, established for this School under ESEA Waiver
Schools and Subgroups could meet expectations either by meeting the statewide proficiency rate of 90 percent, or reaching their individually
determined progress targets. The statewide proficiency rate will be increased to 95 percent in 2015.
Performance Targets - Language Arts Literacy
Subgroup# of Valid
Test Scores
Baseline
% Proficient
Yearly
Increment
2012-2013
Target (%P)
2011-2012
Target (%P)
2013-2014
Target (%P)
2014-2015
Target (%P)
2015-2016
Target (%P)
2016-2017
Target (%P)
Baseline
year
68.9 2.6 74.1 76.7 79.3 81.9 84.5Schoolwide 354 71.51011
- - - - - - -White - -1011
71.1 2.4 75.9 78.3 80.7 83.1 85.5Black 235 73.51011
64.4 3 70.4 73.4 76.4 79.4 82.4Hispanic 104 67.41011
- - - - - - -American Indian - -1011
- - - - - - -Asian - -1011
- - - - - - -Two or More Races - -1011
30.1 5.8 41.7 47.5 53.3 59.1 64.9Students with Disabilities 73 35.91011
- - - - - - -Limited English Proficiency - -1011
65.9 2.8 71.5 74.3 77.1 79.9 82.7Economically Disadvantaged 235 68.71011
Performance Targets - Mathematics
Subgroup# of Valid
Test Scores
Baseline
% Proficient
Yearly
Increment
2012-2013
Target (%P)
2011-2012
Target (%P)
2013-2014
Target (%P)
2014-2015
Target (%P)
2015-2016
Target (%P)
2016-2017
Target (%P)
Baseline
year
48.6 4.3 57.2 61.5 65.8 70.1 74.4Schoolwide 352 52.91011
- - - - - - -White - -1011
47 4.4 55.8 60.2 64.6 69 73.4Black 232 51.41011
51.5 4.1 59.7 63.8 67.9 72 76.1Hispanic 105 55.61011
- - - - - - -American Indian - -1011
- - - - - - -Asian - -1011
- - - - - - -Two or More Races - -1011
13.9 7.2 28.3 35.5 42.7 49.9 57.1Students with Disabilities 72 21.11011
- - - - - - -Limited English Proficiency - -1011
47.4 4.4 56.2 60.6 65 69.4 73.8Economically Disadvantaged 234 51.81011
11/5/2014
Only Includes full year students (Time In School < Year students are removed)
'-' Indicates too few students to determine (N<30)
Title I Accountability System
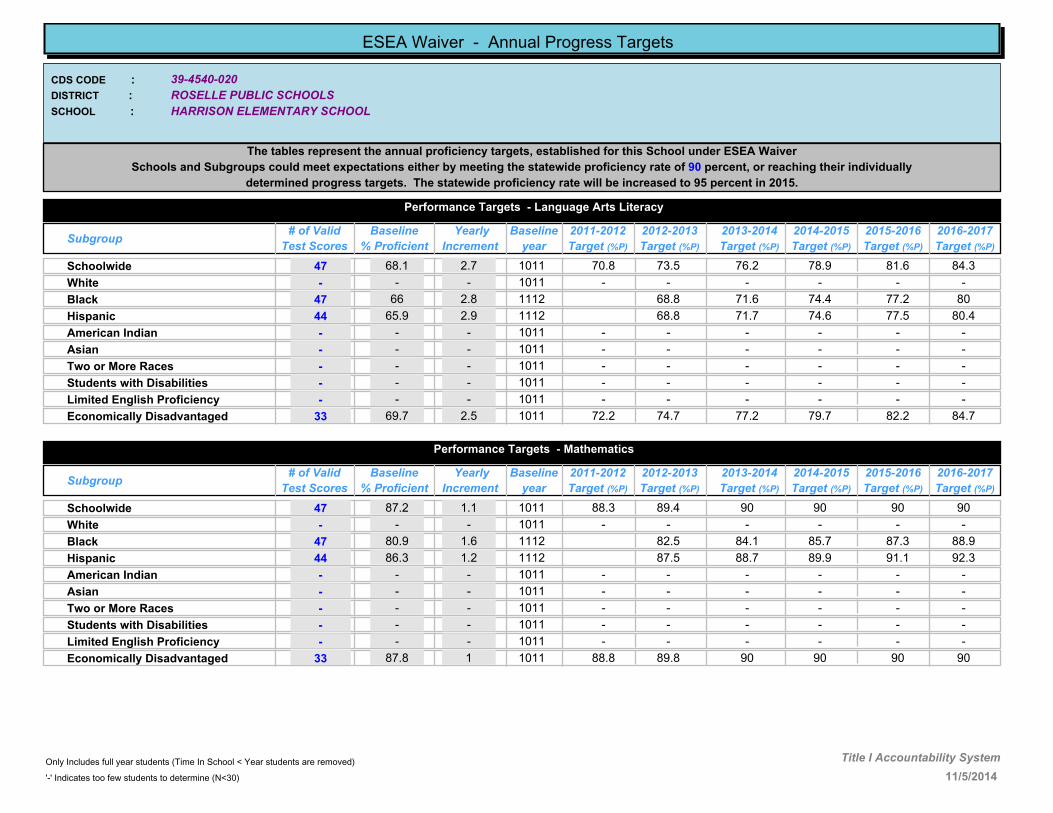
39-4540-020
HARRISON ELEMENTARY SCHOOL
ROSELLE PUBLIC SCHOOLS
CDS CODE :
DISTRICT :
SCHOOL :
ESEA Waiver - Annual Progress Targets
The tables represent the annual proficiency targets, established for this School under ESEA Waiver
Schools and Subgroups could meet expectations either by meeting the statewide proficiency rate of 90 percent, or reaching their individually
determined progress targets. The statewide proficiency rate will be increased to 95 percent in 2015.
Performance Targets - Language Arts Literacy
Subgroup# of Valid
Test Scores
Baseline
% Proficient
Yearly
Increment
2012-2013
Target (%P)
2011-2012
Target (%P)
2013-2014
Target (%P)
2014-2015
Target (%P)
2015-2016
Target (%P)
2016-2017
Target (%P)
Baseline
year
68.1 2.7 73.5 76.2 78.9 81.6 84.3Schoolwide 47 70.81011
- - - - - - -White - -1011
66 2.8 68.8 71.6 74.4 77.2 80Black 47 1112
65.9 2.9 68.8 71.7 74.6 77.5 80.4Hispanic 44 1112
- - - - - - -American Indian - -1011
- - - - - - -Asian - -1011
- - - - - - -Two or More Races - -1011
- - - - - - -Students with Disabilities - -1011
- - - - - - -Limited English Proficiency - -1011
69.7 2.5 74.7 77.2 79.7 82.2 84.7Economically Disadvantaged 33 72.21011
Performance Targets - Mathematics
Subgroup# of Valid
Test Scores
Baseline
% Proficient
Yearly
Increment
2012-2013
Target (%P)
2011-2012
Target (%P)
2013-2014
Target (%P)
2014-2015
Target (%P)
2015-2016
Target (%P)
2016-2017
Target (%P)
Baseline
year
87.2 1.1 89.4 90 90 90 90Schoolwide 47 88.31011
- - - - - - -White - -1011
80.9 1.6 82.5 84.1 85.7 87.3 88.9Black 47 1112
86.3 1.2 87.5 88.7 89.9 91.1 92.3Hispanic 44 1112
- - - - - - -American Indian - -1011
- - - - - - -Asian - -1011
- - - - - - -Two or More Races - -1011
- - - - - - -Students with Disabilities - -1011
- - - - - - -Limited English Proficiency - -1011
87.8 1 89.8 90 90 90 90Economically Disadvantaged 33 88.81011
11/5/2014
Only Includes full year students (Time In School < Year students are removed)
'-' Indicates too few students to determine (N<30)
Title I Accountability System

39-4540-030
DR. CHARLES C. POLK SCHOOL
ROSELLE PUBLIC SCHOOLS
CDS CODE :
DISTRICT :
SCHOOL :
ESEA Waiver - Annual Progress Targets
The tables represent the annual proficiency targets, established for this School under ESEA Waiver
Schools and Subgroups could meet expectations either by meeting the statewide proficiency rate of 90 percent, or reaching their individually
determined progress targets. The statewide proficiency rate will be increased to 95 percent in 2015.
Performance Targets - Language Arts Literacy
Subgroup# of Valid
Test Scores
Baseline
% Proficient
Yearly
Increment
2012-2013
Target (%P)
2011-2012
Target (%P)
2013-2014
Target (%P)
2014-2015
Target (%P)
2015-2016
Target (%P)
2016-2017
Target (%P)
Baseline
year
63.3 3.1 69.5 72.6 75.7 78.8 81.9Schoolwide 60 66.41011
- - - - - - -White - -1011
63.1 3.1 69.3 72.4 75.5 78.6 81.7Black 38 66.21011
54.8 3.8 58.6 62.4 66.2 70 73.8Hispanic 31 1112
- - - - - - -American Indian - -1011
- - - - - - -Asian - -1011
- - - - - - -Two or More Races - -1011
- - - - - - -Students with Disabilities - -1011
- - - - - - -Limited English Proficiency - -1011
61.7 3.2 68.1 71.3 74.5 77.7 80.9Economically Disadvantaged 47 64.91011
Performance Targets - Mathematics
Subgroup# of Valid
Test Scores
Baseline
% Proficient
Yearly
Increment
2012-2013
Target (%P)
2011-2012
Target (%P)
2013-2014
Target (%P)
2014-2015
Target (%P)
2015-2016
Target (%P)
2016-2017
Target (%P)
Baseline
year
78.3 1.8 81.9 83.7 85.5 87.3 89.1Schoolwide 60 80.11011
- - - - - - -White - -1011
79 1.8 82.6 84.4 86.2 88 89.8Black 38 80.81011
61.3 3.2 64.5 67.7 70.9 74.1 77.3Hispanic 31 1112
- - - - - - -American Indian - -1011
- - - - - - -Asian - -1011
- - - - - - -Two or More Races - -1011
- - - - - - -Students with Disabilities - -1011
- - - - - - -Limited English Proficiency - -1011
76.6 2 80.6 82.6 84.6 86.6 88.6Economically Disadvantaged 47 78.61011
11/5/2014
Only Includes full year students (Time In School < Year students are removed)
'-' Indicates too few students to determine (N<30)
Title I Accountability System

39-4540-040
LEONARD V. MOORE MIDDLE SCHOOL
ROSELLE PUBLIC SCHOOLS
CDS CODE :
DISTRICT :
SCHOOL :
ESEA Waiver - Annual Progress Targets
The tables represent the annual proficiency targets, established for this School under ESEA Waiver
Schools and Subgroups could meet expectations either by meeting the statewide proficiency rate of 90 percent, or reaching their individually
determined progress targets. The statewide proficiency rate will be increased to 95 percent in 2015.
Performance Targets - Language Arts Literacy
Subgroup# of Valid
Test Scores
Baseline
% Proficient
Yearly
Increment
2012-2013
Target (%P)
2011-2012
Target (%P)
2013-2014
Target (%P)
2014-2015
Target (%P)
2015-2016
Target (%P)
2016-2017
Target (%P)
Baseline
year
35.9 5.4 46.7 52.1 57.5 62.9 68.3Schoolwide 348 41.31011
- - - - - - -White - -1011
33.5 5.6 44.7 50.3 55.9 61.5 67.1Black 224 39.11011
39.4 5.1 49.6 54.7 59.8 64.9 70Hispanic 117 44.51011
- - - - - - -American Indian - -1011
- - - - - - -Asian - -1011
- - - - - - -Two or More Races - -1011
17.9 6.9 31.7 38.6 45.5 52.4 59.3Students with Disabilities 56 24.81011
21.1 6.6 34.3 40.9 47.5 54.1 60.7Limited English Proficiency 38 27.71011
35 5.4 45.8 51.2 56.6 62 67.4Economically Disadvantaged 274 40.41011
Performance Targets - Mathematics
Subgroup# of Valid
Test Scores
Baseline
% Proficient
Yearly
Increment
2012-2013
Target (%P)
2011-2012
Target (%P)
2013-2014
Target (%P)
2014-2015
Target (%P)
2015-2016
Target (%P)
2016-2017
Target (%P)
Baseline
year
67.4 2.7 72.8 75.5 78.2 80.9 83.6Schoolwide 349 70.11011
- - - - - - -White - -1011
64.7 3 70.7 73.7 76.7 79.7 82.7Black 224 67.71011
71.1 2.4 75.9 78.3 80.7 83.1 85.5Hispanic 118 73.51011
- - - - - - -American Indian - -1011
- - - - - - -Asian - -1011
- - - - - - -Two or More Races - -1011
33.9 5.5 44.9 50.4 55.9 61.4 66.9Students with Disabilities 56 39.41011
52.7 4 60.7 64.7 68.7 72.7 76.7Limited English Proficiency 38 56.71011
66.9 2.8 72.5 75.3 78.1 80.9 83.7Economically Disadvantaged 275 69.71011
11/5/2014
Only Includes full year students (Time In School < Year students are removed)
'-' Indicates too few students to determine (N<30)
Title I Accountability System

39-4540-050
WASHINGTON ELEMENTARY SCHOOL
ROSELLE PUBLIC SCHOOLS
CDS CODE :
DISTRICT :
SCHOOL :
ESEA Waiver - Annual Progress Targets
The tables represent the annual proficiency targets, established for this School under ESEA Waiver
Schools and Subgroups could meet expectations either by meeting the statewide proficiency rate of 90 percent, or reaching their individually
determined progress targets. The statewide proficiency rate will be increased to 95 percent in 2015.
Performance Targets - Language Arts Literacy
Subgroup# of Valid
Test Scores
Baseline
% Proficient
Yearly
Increment
2012-2013
Target (%P)
2011-2012
Target (%P)
2013-2014
Target (%P)
2014-2015
Target (%P)
2015-2016
Target (%P)
2016-2017
Target (%P)
Baseline
year
45.5 4.6 54.7 59.3 63.9 68.5 73.1Schoolwide 66 50.11011
- - - - - - -White - -1011
41.5 4.9 51.3 56.2 61.1 66 70.9Black 41 46.41011
48.9 4.3 53.2 57.5 61.8 66.1 70.4Hispanic 45 1112
- - - - - - -American Indian - -1011
- - - - - - -Asian - -1011
- - - - - - -Two or More Races - -1011
- - - - - - -Students with Disabilities - -1011
- - - - - - -Limited English Proficiency - -1011
47.5 4.4 56.3 60.7 65.1 69.5 73.9Economically Disadvantaged 59 51.91011
Performance Targets - Mathematics
Subgroup# of Valid
Test Scores
Baseline
% Proficient
Yearly
Increment
2012-2013
Target (%P)
2011-2012
Target (%P)
2013-2014
Target (%P)
2014-2015
Target (%P)
2015-2016
Target (%P)
2016-2017
Target (%P)
Baseline
year
87.9 1 89.9 90 90 90 90Schoolwide 66 88.91011
- - - - - - -White - -1011
83 1.4 85.8 87.2 88.6 90 90Black 41 84.41011
71.1 2.4 73.5 75.9 78.3 80.7 83.1Hispanic 45 1112
- - - - - - -American Indian - -1011
- - - - - - -Asian - -1011
- - - - - - -Two or More Races - -1011
- - - - - - -Students with Disabilities - -1011
- - - - - - -Limited English Proficiency - -1011
86.4 1.1 88.6 89.7 90 90 90Economically Disadvantaged 59 87.51011
11/5/2014
Only Includes full year students (Time In School < Year students are removed)
'-' Indicates too few students to determine (N<30)
Title I Accountability System

39-4540-060
GRACE WILDAY JUNIOR HIGH SCHOOL
ROSELLE PUBLIC SCHOOLS
CDS CODE :
DISTRICT :
SCHOOL :
ESEA Waiver - Annual Progress Targets
The tables represent the annual proficiency targets, established for this School under ESEA Waiver
Schools and Subgroups could meet expectations either by meeting the statewide proficiency rate of 90 percent, or reaching their individually
determined progress targets. The statewide proficiency rate will be increased to 95 percent in 2015.
Performance Targets - Language Arts Literacy
Subgroup# of Valid
Test Scores
Baseline
% Proficient
Yearly
Increment
2012-2013
Target (%P)
2011-2012
Target (%P)
2013-2014
Target (%P)
2014-2015
Target (%P)
2015-2016
Target (%P)
2016-2017
Target (%P)
Baseline
year
38.7 5.1 48.9 54 59.1 64.2 69.3Schoolwide 292 43.81011
- - - - - - -White - -1011
39.6 5 49.6 54.6 59.6 64.6 69.6Black 207 44.61011
36.4 5.3 47 52.3 57.6 62.9 68.2Hispanic 77 41.71011
- - - - - - -American Indian - -1011
- - - - - - -Asian - -1011
- - - - - - -Two or More Races - -1011
12.7 7.3 27.3 34.6 41.9 49.2 56.5Students with Disabilities 63 201011
- - - - - - -Limited English Proficiency - -1011
35.8 5.4 46.6 52 57.4 62.8 68.2Economically Disadvantaged 204 41.21011
Performance Targets - Mathematics
Subgroup# of Valid
Test Scores
Baseline
% Proficient
Yearly
Increment
2012-2013
Target (%P)
2011-2012
Target (%P)
2013-2014
Target (%P)
2014-2015
Target (%P)
2015-2016
Target (%P)
2016-2017
Target (%P)
Baseline
year
48 4.3 56.6 60.9 65.2 69.5 73.8Schoolwide 294 52.31011
- - - - - - -White - -1011
45 4.6 54.2 58.8 63.4 68 72.6Black 209 49.61011
53.3 3.9 61.1 65 68.9 72.8 76.7Hispanic 77 57.21011
- - - - - - -American Indian - -1011
- - - - - - -Asian - -1011
- - - - - - -Two or More Races - -1011
24.6 6.3 37.2 43.5 49.8 56.1 62.4Students with Disabilities 65 30.91011
- - - - - - -Limited English Proficiency - -1011
43.2 4.7 52.6 57.3 62 66.7 71.4Economically Disadvantaged 206 47.91011
11/5/2014
Only Includes full year students (Time In School < Year students are removed)
'-' Indicates too few students to determine (N<30)
Title I Accountability System

39-4550-050
Roselle Park High School
Roselle Park Board of Education
CDS CODE :
DISTRICT :
SCHOOL :
ESEA Waiver - Annual Progress Targets
The tables represent the annual proficiency targets, established for this School under ESEA Waiver
Schools and Subgroups could meet expectations either by meeting the statewide proficiency rate of 90 percent, or reaching their individually
determined progress targets. The statewide proficiency rate will be increased to 95 percent in 2015.
Performance Targets - Language Arts Literacy
Subgroup# of Valid
Test Scores
Baseline
% Proficient
Yearly
Increment
2012-2013
Target (%P)
2011-2012
Target (%P)
2013-2014
Target (%P)
2014-2015
Target (%P)
2015-2016
Target (%P)
2016-2017
Target (%P)
Baseline
year
89.1 .9 90 90 90 90 90Schoolwide 156 901011
91.8 - 90 90 90 90 90White 73 901011
- - - - - - -Black - -1011
83 1.4 85.8 87.2 88.6 90 90Hispanic 53 84.41011
- - - - - - -American Indian - -1011
- - - - - - -Asian - -1011
- - - - - - -Two or More Races - -1011
- - - - - - -Students with Disabilities - -1011
- - - - - - -Limited English Proficiency - -1011
79.2 1.7 82.6 84.3 86 87.7 89.4Economically Disadvantaged 48 80.91011
Performance Targets - Mathematics
Subgroup# of Valid
Test Scores
Baseline
% Proficient
Yearly
Increment
2012-2013
Target (%P)
2011-2012
Target (%P)
2013-2014
Target (%P)
2014-2015
Target (%P)
2015-2016
Target (%P)
2016-2017
Target (%P)
Baseline
year
85.9 1.2 88.3 89.5 90 90 90Schoolwide 156 87.11011
90.4 - 90 90 90 90 90White 73 901011
- - - - - - -Black - -1011
77.3 1.9 81.1 83 84.9 86.8 88.7Hispanic 53 79.21011
- - - - - - -American Indian - -1011
- - - - - - -Asian - -1011
- - - - - - -Two or More Races - -1011
- - - - - - -Students with Disabilities - -1011
- - - - - - -Limited English Proficiency - -1011
77.1 1.9 80.9 82.8 84.7 86.6 88.5Economically Disadvantaged 48 791011
11/5/2014
Only Includes full year students (Time In School < Year students are removed)
'-' Indicates too few students to determine (N<30)
Title I Accountability System

39-4550-060
Ernest J. Finizio Jr. - Aldene School
Roselle Park Board of Education
CDS CODE :
DISTRICT :
SCHOOL :
ESEA Waiver - Annual Progress Targets
The tables represent the annual proficiency targets, established for this School under ESEA Waiver
Schools and Subgroups could meet expectations either by meeting the statewide proficiency rate of 90 percent, or reaching their individually
determined progress targets. The statewide proficiency rate will be increased to 95 percent in 2015.
Performance Targets - Language Arts Literacy
Subgroup# of Valid
Test Scores
Baseline
% Proficient
Yearly
Increment
2012-2013
Target (%P)
2011-2012
Target (%P)
2013-2014
Target (%P)
2014-2015
Target (%P)
2015-2016
Target (%P)
2016-2017
Target (%P)
Baseline
year
80.7 1.6 83.9 85.5 87.1 88.7 90Schoolwide 114 82.31011
90 - 90 90 90 90 90White 40 901011
- - - - - - -Black - -1011
72.1 2.3 76.7 79 81.3 83.6 85.9Hispanic 43 74.41011
- - - - - - -American Indian - -1011
- - - - - - -Asian - -1011
- - - - - - -Two or More Races - -1011
- - - - - - -Students with Disabilities - -1011
- - - - - - -Limited English Proficiency - -1011
68.7 2.6 73.9 76.5 79.1 81.7 84.3Economically Disadvantaged 32 71.31011
Performance Targets - Mathematics
Subgroup# of Valid
Test Scores
Baseline
% Proficient
Yearly
Increment
2012-2013
Target (%P)
2011-2012
Target (%P)
2013-2014
Target (%P)
2014-2015
Target (%P)
2015-2016
Target (%P)
2016-2017
Target (%P)
Baseline
year
95.6 - 90 90 90 90 90Schoolwide 114 901011
97.5 - 90 90 90 90 90White 40 901011
- - - - - - -Black - -1011
90.7 - 90 90 90 90 90Hispanic 43 901011
- - - - - - -American Indian - -1011
- - - - - - -Asian - -1011
- - - - - - -Two or More Races - -1011
- - - - - - -Students with Disabilities - -1011
- - - - - - -Limited English Proficiency - -1011
90.6 - 90 90 90 90 90Economically Disadvantaged 32 901011
11/5/2014
Only Includes full year students (Time In School < Year students are removed)
'-' Indicates too few students to determine (N<30)
Title I Accountability System

39-4550-080
Robert Gordon Elementary School
Roselle Park Board of Education
CDS CODE :
DISTRICT :
SCHOOL :
ESEA Waiver - Annual Progress Targets
The tables represent the annual proficiency targets, established for this School under ESEA Waiver
Schools and Subgroups could meet expectations either by meeting the statewide proficiency rate of 90 percent, or reaching their individually
determined progress targets. The statewide proficiency rate will be increased to 95 percent in 2015.
Performance Targets - Language Arts Literacy
Subgroup# of Valid
Test Scores
Baseline
% Proficient
Yearly
Increment
2012-2013
Target (%P)
2011-2012
Target (%P)
2013-2014
Target (%P)
2014-2015
Target (%P)
2015-2016
Target (%P)
2016-2017
Target (%P)
Baseline
year
69.2 2.6 74.4 77 79.6 82.2 84.8Schoolwide 127 71.81011
78.7 1.8 82.3 84.1 85.9 87.7 89.5White 61 80.51011
- - - - - - -Black - -1011
52 4 60 64 68 72 76Hispanic 52 561011
- - - - - - -American Indian - -1011
- - - - - - -Asian - -1011
- - - - - - -Two or More Races - -1011
41.7 4.9 46.6 51.5 56.4 61.3 66.2Students with Disabilities 36 1112
- - - - - - -Limited English Proficiency - -1011
57.7 3.5 64.7 68.2 71.7 75.2 78.7Economically Disadvantaged 52 61.21011
Performance Targets - Mathematics
Subgroup# of Valid
Test Scores
Baseline
% Proficient
Yearly
Increment
2012-2013
Target (%P)
2011-2012
Target (%P)
2013-2014
Target (%P)
2014-2015
Target (%P)
2015-2016
Target (%P)
2016-2017
Target (%P)
Baseline
year
80.3 1.7 83.7 85.4 87.1 88.8 90Schoolwide 127 821011
88.6 1 90 90 90 90 90White 61 89.61011
- - - - - - -Black - -1011
65.4 2.9 71.2 74.1 77 79.9 82.8Hispanic 52 68.31011
- - - - - - -American Indian - -1011
- - - - - - -Asian - -1011
- - - - - - -Two or More Races - -1011
52.7 4 56.7 60.7 64.7 68.7 72.7Students with Disabilities 36 1112
- - - - - - -Limited English Proficiency - -1011
67.4 2.7 72.8 75.5 78.2 80.9 83.6Economically Disadvantaged 52 70.11011
11/5/2014
Only Includes full year students (Time In School < Year students are removed)
'-' Indicates too few students to determine (N<30)
Title I Accountability System

39-4550-085
Roselle Park Middle School
Roselle Park Board of Education
CDS CODE :
DISTRICT :
SCHOOL :
ESEA Waiver - Annual Progress Targets
The tables represent the annual proficiency targets, established for this School under ESEA Waiver
Schools and Subgroups could meet expectations either by meeting the statewide proficiency rate of 90 percent, or reaching their individually
determined progress targets. The statewide proficiency rate will be increased to 95 percent in 2015.
Performance Targets - Language Arts Literacy
Subgroup# of Valid
Test Scores
Baseline
% Proficient
Yearly
Increment
2012-2013
Target (%P)
2011-2012
Target (%P)
2013-2014
Target (%P)
2014-2015
Target (%P)
2015-2016
Target (%P)
2016-2017
Target (%P)
Baseline
year
75.3 2.1 79.5 81.6 83.7 85.8 87.9Schoolwide 453 77.41011
78.7 1.8 82.3 84.1 85.9 87.7 89.5White 206 80.51011
66.7 2.8 72.3 75.1 77.9 80.7 83.5Black 33 69.51011
69.7 2.5 74.7 77.2 79.7 82.2 84.7Hispanic 165 72.21011
- - - - - - -American Indian - -1011
85.1 1.3 87.7 89 90 90 90Asian 47 86.41011
- - - - - - -Two or More Races - -1011
24.6 6.3 37.2 43.5 49.8 56.1 62.4Students with Disabilities 57 30.91011
- - - - - - -Limited English Proficiency - -1011
63.4 3.1 69.6 72.7 75.8 78.9 82Economically Disadvantaged 153 66.51011
Performance Targets - Mathematics
Subgroup# of Valid
Test Scores
Baseline
% Proficient
Yearly
Increment
2012-2013
Target (%P)
2011-2012
Target (%P)
2013-2014
Target (%P)
2014-2015
Target (%P)
2015-2016
Target (%P)
2016-2017
Target (%P)
Baseline
year
78.8 1.8 82.4 84.2 86 87.8 89.6Schoolwide 453 80.61011
81.1 1.6 84.3 85.9 87.5 89.1 90White 206 82.71011
63.6 3 69.6 72.6 75.6 78.6 81.6Black 33 66.61011
75.2 2.1 79.4 81.5 83.6 85.7 87.8Hispanic 165 77.31011
- - - - - - -American Indian - -1011
91.4 - 90 90 90 90 90Asian 47 901011
- - - - - - -Two or More Races - -1011
26.3 6.2 38.7 44.9 51.1 57.3 63.5Students with Disabilities 57 32.51011
- - - - - - -Limited English Proficiency - -1011
70.6 2.5 75.6 78.1 80.6 83.1 85.6Economically Disadvantaged 153 73.11011
11/5/2014
Only Includes full year students (Time In School < Year students are removed)
'-' Indicates too few students to determine (N<30)
Title I Accountability System

39-4550-090
Sherman Elementary School
Roselle Park Board of Education
CDS CODE :
DISTRICT :
SCHOOL :
ESEA Waiver - Annual Progress Targets
The tables represent the annual proficiency targets, established for this School under ESEA Waiver
Schools and Subgroups could meet expectations either by meeting the statewide proficiency rate of 90 percent, or reaching their individually
determined progress targets. The statewide proficiency rate will be increased to 95 percent in 2015.
Performance Targets - Language Arts Literacy
Subgroup# of Valid
Test Scores
Baseline
% Proficient
Yearly
Increment
2012-2013
Target (%P)
2011-2012
Target (%P)
2013-2014
Target (%P)
2014-2015
Target (%P)
2015-2016
Target (%P)
2016-2017
Target (%P)
Baseline
year
70.9 2.4 75.7 78.1 80.5 82.9 85.3Schoolwide 186 73.31011
76.1 2 80.1 82.1 84.1 86.1 88.1White 92 78.11011
- - - - - - -Black - -1011
60 3.3 66.6 69.9 73.2 76.5 79.8Hispanic 75 63.31011
- - - - - - -American Indian - -1011
- - - - - - -Asian - -1011
- - - - - - -Two or More Races - -1011
42.4 4.8 52 56.8 61.6 66.4 71.2Students with Disabilities 33 47.21011
- - - - - - -Limited English Proficiency - -1011
56 3.7 63.4 67.1 70.8 74.5 78.2Economically Disadvantaged 50 59.71011
Performance Targets - Mathematics
Subgroup# of Valid
Test Scores
Baseline
% Proficient
Yearly
Increment
2012-2013
Target (%P)
2011-2012
Target (%P)
2013-2014
Target (%P)
2014-2015
Target (%P)
2015-2016
Target (%P)
2016-2017
Target (%P)
Baseline
year
82.8 1.4 85.6 87 88.4 89.8 90Schoolwide 186 84.21011
84.7 1.3 87.3 88.6 89.9 90 90White 92 861011
- - - - - - -Black - -1011
77.4 1.9 81.2 83.1 85 86.9 88.8Hispanic 75 79.31011
- - - - - - -American Indian - -1011
- - - - - - -Asian - -1011
- - - - - - -Two or More Races - -1011
63.6 3 69.6 72.6 75.6 78.6 81.6Students with Disabilities 33 66.61011
- - - - - - -Limited English Proficiency - -1011
78 1.8 81.6 83.4 85.2 87 88.8Economically Disadvantaged 50 79.81011
11/5/2014
Only Includes full year students (Time In School < Year students are removed)
'-' Indicates too few students to determine (N<30)
Title I Accountability System

39-4670-050
Scotch Plains-Fanwood High School
Scotch Plains-Fanwood School District
CDS CODE :
DISTRICT :
SCHOOL :
ESEA Waiver - Annual Progress Targets
The tables represent the annual proficiency targets, established for this School under ESEA Waiver
Schools and Subgroups could meet expectations either by meeting the statewide proficiency rate of 90 percent, or reaching their individually
determined progress targets. The statewide proficiency rate will be increased to 95 percent in 2015.
Performance Targets - Language Arts Literacy
Subgroup# of Valid
Test Scores
Baseline
% Proficient
Yearly
Increment
2012-2013
Target (%P)
2011-2012
Target (%P)
2013-2014
Target (%P)
2014-2015
Target (%P)
2015-2016
Target (%P)
2016-2017
Target (%P)
Baseline
year
95.5 - 90 90 90 90 90Schoolwide 354 901011
95.8 - 90 90 90 90 90White 260 901011
100 - 90 90 90 90 90Black 43 901011
- - - - - - -Hispanic - -1011
- - - - - - -American Indian - -1011
- - - - - - -Asian - -1011
- - - - - - -Two or More Races - -1011
70.6 2.5 75.6 78.1 80.6 83.1 85.6Students with Disabilities 51 73.11011
- - - - - - -Limited English Proficiency - -1011
- - - - - - -Economically Disadvantaged - -1011
Performance Targets - Mathematics
Subgroup# of Valid
Test Scores
Baseline
% Proficient
Yearly
Increment
2012-2013
Target (%P)
2011-2012
Target (%P)
2013-2014
Target (%P)
2014-2015
Target (%P)
2015-2016
Target (%P)
2016-2017
Target (%P)
Baseline
year
92.4 - 90 90 90 90 90Schoolwide 353 901011
93.8 - 90 90 90 90 90White 260 901011
85.7 1.2 88.1 89.3 90 90 90Black 42 86.91011
- - - - - - -Hispanic - -1011
- - - - - - -American Indian - -1011
- - - - - - -Asian - -1011
- - - - - - -Two or More Races - -1011
56 3.7 63.4 67.1 70.8 74.5 78.2Students with Disabilities 50 59.71011
- - - - - - -Limited English Proficiency - -1011
- - - - - - -Economically Disadvantaged - -1011
11/5/2014
Only Includes full year students (Time In School < Year students are removed)
'-' Indicates too few students to determine (N<30)
Title I Accountability System

39-4670-060
Park Middle School
Scotch Plains-Fanwood School District
CDS CODE :
DISTRICT :
SCHOOL :
ESEA Waiver - Annual Progress Targets
The tables represent the annual proficiency targets, established for this School under ESEA Waiver
Schools and Subgroups could meet expectations either by meeting the statewide proficiency rate of 90 percent, or reaching their individually
determined progress targets. The statewide proficiency rate will be increased to 95 percent in 2015.
Performance Targets - Language Arts Literacy
Subgroup# of Valid
Test Scores
Baseline
% Proficient
Yearly
Increment
2012-2013
Target (%P)
2011-2012
Target (%P)
2013-2014
Target (%P)
2014-2015
Target (%P)
2015-2016
Target (%P)
2016-2017
Target (%P)
Baseline
year
83.5 1.4 86.3 87.7 89.1 90 90Schoolwide 892 84.91011
87.1 1.1 89.3 90 90 90 90White 640 88.21011
65.4 2.9 71.2 74.1 77 79.9 82.8Black 107 68.31011
73.2 2.2 77.6 79.8 82 84.2 86.4Hispanic 56 75.41011
- - - - - - -American Indian - -1011
94.7 - 90 90 90 90 90Asian 75 901011
- - - - - - -Two or More Races - -1011
41.4 4.9 51.2 56.1 61 65.9 70.8Students with Disabilities 140 46.31011
- - - - - - -Limited English Proficiency - -1011
59.6 3.4 66.4 69.8 73.2 76.6 80Economically Disadvantaged 47 631011
Performance Targets - Mathematics
Subgroup# of Valid
Test Scores
Baseline
% Proficient
Yearly
Increment
2012-2013
Target (%P)
2011-2012
Target (%P)
2013-2014
Target (%P)
2014-2015
Target (%P)
2015-2016
Target (%P)
2016-2017
Target (%P)
Baseline
year
85 1.3 87.6 88.9 90 90 90Schoolwide 892 86.31011
88.3 1 90 90 90 90 90White 640 89.31011
69.2 2.6 74.4 77 79.6 82.2 84.8Black 107 71.81011
69.6 2.5 74.6 77.1 79.6 82.1 84.6Hispanic 56 72.11011
- - - - - - -American Indian - -1011
96 - 90 90 90 90 90Asian 75 901011
- - - - - - -Two or More Races - -1011
47.9 4.4 56.7 61.1 65.5 69.9 74.3Students with Disabilities 140 52.31011
- - - - - - -Limited English Proficiency - -1011
70.2 2.5 75.2 77.7 80.2 82.7 85.2Economically Disadvantaged 47 72.71011
11/5/2014
Only Includes full year students (Time In School < Year students are removed)
'-' Indicates too few students to determine (N<30)
Title I Accountability System

39-4670-065
Terrill Middle School
Scotch Plains-Fanwood School District
CDS CODE :
DISTRICT :
SCHOOL :
ESEA Waiver - Annual Progress Targets
The tables represent the annual proficiency targets, established for this School under ESEA Waiver
Schools and Subgroups could meet expectations either by meeting the statewide proficiency rate of 90 percent, or reaching their individually
determined progress targets. The statewide proficiency rate will be increased to 95 percent in 2015.
Performance Targets - Language Arts Literacy
Subgroup# of Valid
Test Scores
Baseline
% Proficient
Yearly
Increment
2012-2013
Target (%P)
2011-2012
Target (%P)
2013-2014
Target (%P)
2014-2015
Target (%P)
2015-2016
Target (%P)
2016-2017
Target (%P)
Baseline
year
87.4 1.1 89.6 90 90 90 90Schoolwide 843 88.51011
89.2 .9 90 90 90 90 90White 648 901011
68.4 2.7 73.8 76.5 79.2 81.9 84.6Black 60 71.11011
81.5 1.6 84.7 86.3 87.9 89.5 90Hispanic 54 83.11011
- - - - - - -American Indian - -1011
93.6 - 90 90 90 90 90Asian 62 901011
- - - - - - -Two or More Races - -1011
45.9 4.5 54.9 59.4 63.9 68.4 72.9Students with Disabilities 109 50.41011
- - - - - - -Limited English Proficiency - -1011
65.6 2.9 71.4 74.3 77.2 80.1 83Economically Disadvantaged 32 68.51011
Performance Targets - Mathematics
Subgroup# of Valid
Test Scores
Baseline
% Proficient
Yearly
Increment
2012-2013
Target (%P)
2011-2012
Target (%P)
2013-2014
Target (%P)
2014-2015
Target (%P)
2015-2016
Target (%P)
2016-2017
Target (%P)
Baseline
year
89.9 .9 90 90 90 90 90Schoolwide 843 901011
91.4 - 90 90 90 90 90White 648 901011
73.3 2.2 77.7 79.9 82.1 84.3 86.5Black 60 75.51011
81.5 1.6 84.7 86.3 87.9 89.5 90Hispanic 54 83.11011
- - - - - - -American Indian - -1011
100 - 90 90 90 90 90Asian 62 901011
- - - - - - -Two or More Races - -1011
53.2 3.9 61 64.9 68.8 72.7 76.6Students with Disabilities 109 57.11011
- - - - - - -Limited English Proficiency - -1011
71.9 2.4 76.7 79.1 81.5 83.9 86.3Economically Disadvantaged 32 74.31011
11/5/2014
Only Includes full year students (Time In School < Year students are removed)
'-' Indicates too few students to determine (N<30)
Title I Accountability System

39-4670-070
School One
Scotch Plains-Fanwood School District
CDS CODE :
DISTRICT :
SCHOOL :
ESEA Waiver - Annual Progress Targets
The tables represent the annual proficiency targets, established for this School under ESEA Waiver
Schools and Subgroups could meet expectations either by meeting the statewide proficiency rate of 90 percent, or reaching their individually
determined progress targets. The statewide proficiency rate will be increased to 95 percent in 2015.
Performance Targets - Language Arts Literacy
Subgroup# of Valid
Test Scores
Baseline
% Proficient
Yearly
Increment
2012-2013
Target (%P)
2011-2012
Target (%P)
2013-2014
Target (%P)
2014-2015
Target (%P)
2015-2016
Target (%P)
2016-2017
Target (%P)
Baseline
year
79.8 1.7 83.2 84.9 86.6 88.3 90Schoolwide 153 81.51011
82.2 1.5 85.2 86.7 88.2 89.7 90White 101 83.71011
- - - - - - -Black - -1011
- - - - - - -Hispanic - -1011
- - - - - - -American Indian - -1011
- - - - - - -Asian - -1011
- - - - - - -Two or More Races - -1011
66.6 2.8 72.2 75 77.8 80.6 83.4Students with Disabilities 39 69.41011
- - - - - - -Limited English Proficiency - -1011
- - - - - - -Economically Disadvantaged - -1011
Performance Targets - Mathematics
Subgroup# of Valid
Test Scores
Baseline
% Proficient
Yearly
Increment
2012-2013
Target (%P)
2011-2012
Target (%P)
2013-2014
Target (%P)
2014-2015
Target (%P)
2015-2016
Target (%P)
2016-2017
Target (%P)
Baseline
year
92.8 - 90 90 90 90 90Schoolwide 153 901011
96 - 90 90 90 90 90White 101 901011
- - - - - - -Black - -1011
- - - - - - -Hispanic - -1011
- - - - - - -American Indian - -1011
- - - - - - -Asian - -1011
- - - - - - -Two or More Races - -1011
82.1 1.5 85.1 86.6 88.1 89.6 90Students with Disabilities 39 83.61011
- - - - - - -Limited English Proficiency - -1011
- - - - - - -Economically Disadvantaged - -1011
11/5/2014
Only Includes full year students (Time In School < Year students are removed)
'-' Indicates too few students to determine (N<30)
Title I Accountability System

39-4670-080
Howard B. Brunner
Scotch Plains-Fanwood School District
CDS CODE :
DISTRICT :
SCHOOL :
ESEA Waiver - Annual Progress Targets
The tables represent the annual proficiency targets, established for this School under ESEA Waiver
Schools and Subgroups could meet expectations either by meeting the statewide proficiency rate of 90 percent, or reaching their individually
determined progress targets. The statewide proficiency rate will be increased to 95 percent in 2015.
Performance Targets - Language Arts Literacy
Subgroup# of Valid
Test Scores
Baseline
% Proficient
Yearly
Increment
2012-2013
Target (%P)
2011-2012
Target (%P)
2013-2014
Target (%P)
2014-2015
Target (%P)
2015-2016
Target (%P)
2016-2017
Target (%P)
Baseline
year
77.7 1.9 81.5 83.4 85.3 87.2 89.1Schoolwide 139 79.61011
81 1.6 84.2 85.8 87.4 89 90White 105 82.61011
- - - - - - -Black - -1011
- - - - - - -Hispanic - -1011
- - - - - - -American Indian - -1011
- - - - - - -Asian - -1011
- - - - - - -Two or More Races - -1011
48.5 4.3 52.8 57.1 61.4 65.7 70Students with Disabilities 33 1112
- - - - - - -Limited English Proficiency - -1011
- - - - - - -Economically Disadvantaged - -1011
Performance Targets - Mathematics
Subgroup# of Valid
Test Scores
Baseline
% Proficient
Yearly
Increment
2012-2013
Target (%P)
2011-2012
Target (%P)
2013-2014
Target (%P)
2014-2015
Target (%P)
2015-2016
Target (%P)
2016-2017
Target (%P)
Baseline
year
91.3 - 90 90 90 90 90Schoolwide 139 901011
92.4 - 90 90 90 90 90White 105 901011
- - - - - - -Black - -1011
- - - - - - -Hispanic - -1011
- - - - - - -American Indian - -1011
- - - - - - -Asian - -1011
- - - - - - -Two or More Races - -1011
69.7 2.5 72.2 74.7 77.2 79.7 82.2Students with Disabilities 33 1112
- - - - - - -Limited English Proficiency - -1011
- - - - - - -Economically Disadvantaged - -1011
11/5/2014
Only Includes full year students (Time In School < Year students are removed)
'-' Indicates too few students to determine (N<30)
Title I Accountability System

39-4670-085
J. Ackerman Coles
Scotch Plains-Fanwood School District
CDS CODE :
DISTRICT :
SCHOOL :
ESEA Waiver - Annual Progress Targets
The tables represent the annual proficiency targets, established for this School under ESEA Waiver
Schools and Subgroups could meet expectations either by meeting the statewide proficiency rate of 90 percent, or reaching their individually
determined progress targets. The statewide proficiency rate will be increased to 95 percent in 2015.
Performance Targets - Language Arts Literacy
Subgroup# of Valid
Test Scores
Baseline
% Proficient
Yearly
Increment
2012-2013
Target (%P)
2011-2012
Target (%P)
2013-2014
Target (%P)
2014-2015
Target (%P)
2015-2016
Target (%P)
2016-2017
Target (%P)
Baseline
year
86 1.2 88.4 89.6 90 90 90Schoolwide 200 87.21011
88.8 .9 90 90 90 90 90White 143 89.71011
- - - - - - -Black - -1011
- - - - - - -Hispanic - -1011
- - - - - - -American Indian - -1011
- - - - - - -Asian - -1011
- - - - - - -Two or More Races - -1011
57.5 3.5 64.5 68 71.5 75 78.5Students with Disabilities 33 611011
- - - - - - -Limited English Proficiency - -1011
- - - - - - -Economically Disadvantaged - -1011
Performance Targets - Mathematics
Subgroup# of Valid
Test Scores
Baseline
% Proficient
Yearly
Increment
2012-2013
Target (%P)
2011-2012
Target (%P)
2013-2014
Target (%P)
2014-2015
Target (%P)
2015-2016
Target (%P)
2016-2017
Target (%P)
Baseline
year
93.5 - 90 90 90 90 90Schoolwide 200 901011
95.1 - 90 90 90 90 90White 143 901011
- - - - - - -Black - -1011
- - - - - - -Hispanic - -1011
- - - - - - -American Indian - -1011
- - - - - - -Asian - -1011
- - - - - - -Two or More Races - -1011
81.8 1.5 84.8 86.3 87.8 89.3 90Students with Disabilities 33 83.31011
- - - - - - -Limited English Proficiency - -1011
- - - - - - -Economically Disadvantaged - -1011
11/5/2014
Only Includes full year students (Time In School < Year students are removed)
'-' Indicates too few students to determine (N<30)
Title I Accountability System
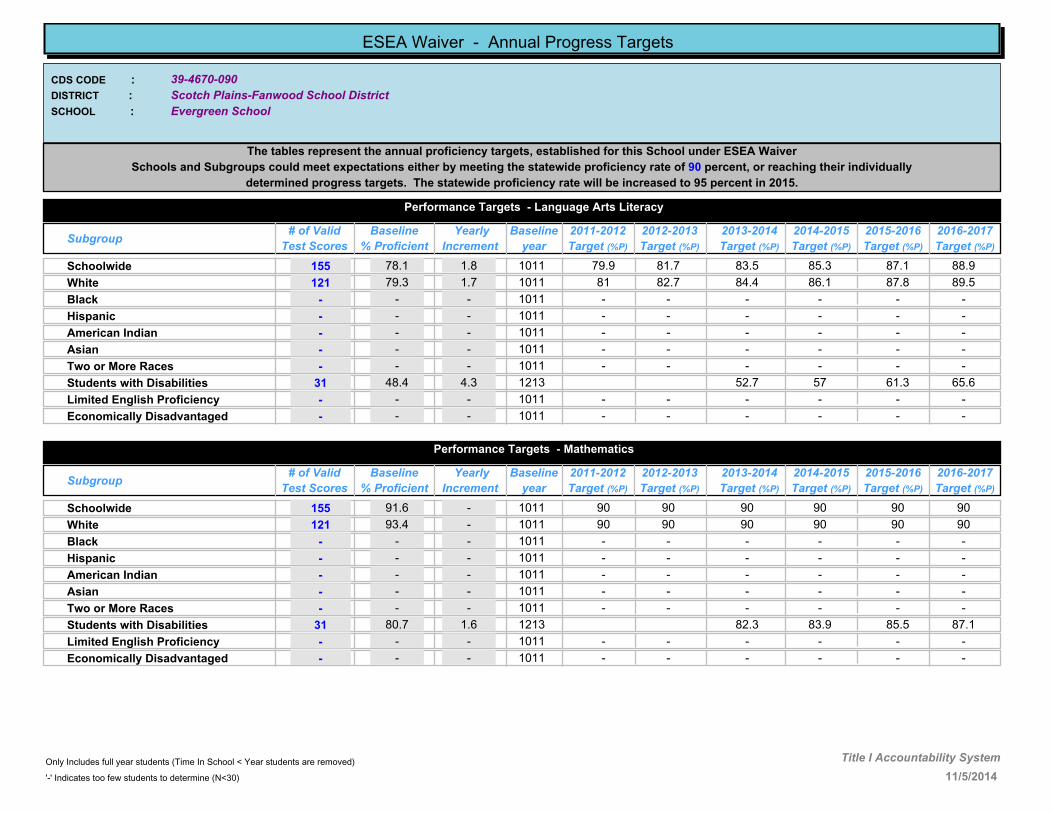
39-4670-090
Evergreen School
Scotch Plains-Fanwood School District
CDS CODE :
DISTRICT :
SCHOOL :
ESEA Waiver - Annual Progress Targets
The tables represent the annual proficiency targets, established for this School under ESEA Waiver
Schools and Subgroups could meet expectations either by meeting the statewide proficiency rate of 90 percent, or reaching their individually
determined progress targets. The statewide proficiency rate will be increased to 95 percent in 2015.
Performance Targets - Language Arts Literacy
Subgroup# of Valid
Test Scores
Baseline
% Proficient
Yearly
Increment
2012-2013
Target (%P)
2011-2012
Target (%P)
2013-2014
Target (%P)
2014-2015
Target (%P)
2015-2016
Target (%P)
2016-2017
Target (%P)
Baseline
year
78.1 1.8 81.7 83.5 85.3 87.1 88.9Schoolwide 155 79.91011
79.3 1.7 82.7 84.4 86.1 87.8 89.5White 121 811011
- - - - - - -Black - -1011
- - - - - - -Hispanic - -1011
- - - - - - -American Indian - -1011
- - - - - - -Asian - -1011
- - - - - - -Two or More Races - -1011
48.4 4.3 52.7 57 61.3 65.6Students with Disabilities 31 1213
- - - - - - -Limited English Proficiency - -1011
- - - - - - -Economically Disadvantaged - -1011
Performance Targets - Mathematics
Subgroup# of Valid
Test Scores
Baseline
% Proficient
Yearly
Increment
2012-2013
Target (%P)
2011-2012
Target (%P)
2013-2014
Target (%P)
2014-2015
Target (%P)
2015-2016
Target (%P)
2016-2017
Target (%P)
Baseline
year
91.6 - 90 90 90 90 90Schoolwide 155 901011
93.4 - 90 90 90 90 90White 121 901011
- - - - - - -Black - -1011
- - - - - - -Hispanic - -1011
- - - - - - -American Indian - -1011
- - - - - - -Asian - -1011
- - - - - - -Two or More Races - -1011
80.7 1.6 82.3 83.9 85.5 87.1Students with Disabilities 31 1213
- - - - - - -Limited English Proficiency - -1011
- - - - - - -Economically Disadvantaged - -1011
11/5/2014
Only Includes full year students (Time In School < Year students are removed)
'-' Indicates too few students to determine (N<30)
Title I Accountability System

39-4670-105
William J. McGinn
Scotch Plains-Fanwood School District
CDS CODE :
DISTRICT :
SCHOOL :
ESEA Waiver - Annual Progress Targets
The tables represent the annual proficiency targets, established for this School under ESEA Waiver
Schools and Subgroups could meet expectations either by meeting the statewide proficiency rate of 90 percent, or reaching their individually
determined progress targets. The statewide proficiency rate will be increased to 95 percent in 2015.
Performance Targets - Language Arts Literacy
Subgroup# of Valid
Test Scores
Baseline
% Proficient
Yearly
Increment
2012-2013
Target (%P)
2011-2012
Target (%P)
2013-2014
Target (%P)
2014-2015
Target (%P)
2015-2016
Target (%P)
2016-2017
Target (%P)
Baseline
year
82 1.5 85 86.5 88 89.5 90Schoolwide 194 83.51011
83.6 1.4 86.4 87.8 89.2 90 90White 152 851011
- - - - - - -Black - -1011
- - - - - - -Hispanic - -1011
- - - - - - -American Indian - -1011
- - - - - - -Asian - -1011
- - - - - - -Two or More Races - -1011
48.6 4.3 57.2 61.5 65.8 70.1 74.4Students with Disabilities 35 52.91011
- - - - - - -Limited English Proficiency - -1011
- - - - - - -Economically Disadvantaged - -1011
Performance Targets - Mathematics
Subgroup# of Valid
Test Scores
Baseline
% Proficient
Yearly
Increment
2012-2013
Target (%P)
2011-2012
Target (%P)
2013-2014
Target (%P)
2014-2015
Target (%P)
2015-2016
Target (%P)
2016-2017
Target (%P)
Baseline
year
96.4 - 90 90 90 90 90Schoolwide 194 901011
97.4 - 90 90 90 90 90White 152 901011
- - - - - - -Black - -1011
- - - - - - -Hispanic - -1011
- - - - - - -American Indian - -1011
- - - - - - -Asian - -1011
- - - - - - -Two or More Races - -1011
80 1.7 83.4 85.1 86.8 88.5 90Students with Disabilities 35 81.71011
- - - - - - -Limited English Proficiency - -1011
- - - - - - -Economically Disadvantaged - -1011
11/5/2014
Only Includes full year students (Time In School < Year students are removed)
'-' Indicates too few students to determine (N<30)
Title I Accountability System

39-5000-010
Jonathan Dayton High School
Springfield Public Schools
CDS CODE :
DISTRICT :
SCHOOL :
ESEA Waiver - Annual Progress Targets
The tables represent the annual proficiency targets, established for this School under ESEA Waiver
Schools and Subgroups could meet expectations either by meeting the statewide proficiency rate of 90 percent, or reaching their individually
determined progress targets. The statewide proficiency rate will be increased to 95 percent in 2015.
Performance Targets - Language Arts Literacy
Subgroup# of Valid
Test Scores
Baseline
% Proficient
Yearly
Increment
2012-2013
Target (%P)
2011-2012
Target (%P)
2013-2014
Target (%P)
2014-2015
Target (%P)
2015-2016
Target (%P)
2016-2017
Target (%P)
Baseline
year
89.8 .9 90 90 90 90 90Schoolwide 157 901011
93.1 - 90 90 90 90 90White 117 901011
- - - - - - -Black - -1011
- - - - - - -Hispanic - -1011
- - - - - - -American Indian - -1011
- - - - - - -Asian - -1011
- - - - - - -Two or More Races - -1011
53.3 3.9 61.1 65 68.9 72.8 76.7Students with Disabilities 30 57.21011
- - - - - - -Limited English Proficiency - -1011
- - - - - - -Economically Disadvantaged - -1011
Performance Targets - Mathematics
Subgroup# of Valid
Test Scores
Baseline
% Proficient
Yearly
Increment
2012-2013
Target (%P)
2011-2012
Target (%P)
2013-2014
Target (%P)
2014-2015
Target (%P)
2015-2016
Target (%P)
2016-2017
Target (%P)
Baseline
year
82.9 1.4 85.7 87.1 88.5 89.9 90Schoolwide 157 84.31011
86.3 1.2 88.7 89.9 90 90 90White 117 87.51011
- - - - - - -Black - -1011
- - - - - - -Hispanic - -1011
- - - - - - -American Indian - -1011
- - - - - - -Asian - -1011
- - - - - - -Two or More Races - -1011
23.4 6.4 36.2 42.6 49 55.4 61.8Students with Disabilities 30 29.81011
- - - - - - -Limited English Proficiency - -1011
- - - - - - -Economically Disadvantaged - -1011
11/5/2014
Only Includes full year students (Time In School < Year students are removed)
'-' Indicates too few students to determine (N<30)
Title I Accountability System

39-5000-060
Florence M. Gaudineer Middle School
Springfield Public Schools
CDS CODE :
DISTRICT :
SCHOOL :
ESEA Waiver - Annual Progress Targets
The tables represent the annual proficiency targets, established for this School under ESEA Waiver
Schools and Subgroups could meet expectations either by meeting the statewide proficiency rate of 90 percent, or reaching their individually
determined progress targets. The statewide proficiency rate will be increased to 95 percent in 2015.
Performance Targets - Language Arts Literacy
Subgroup# of Valid
Test Scores
Baseline
% Proficient
Yearly
Increment
2012-2013
Target (%P)
2011-2012
Target (%P)
2013-2014
Target (%P)
2014-2015
Target (%P)
2015-2016
Target (%P)
2016-2017
Target (%P)
Baseline
year
76.5 2 80.5 82.5 84.5 86.5 88.5Schoolwide 429 78.51011
77.4 1.9 81.2 83.1 85 86.9 88.8White 287 79.31011
64.3 3 70.3 73.3 76.3 79.3 82.3Black 42 67.31011
76.6 2 80.6 82.6 84.6 86.6 88.6Hispanic 64 78.61011
- - - - - - -American Indian - -1011
84.6 1.3 85.9 87.2 88.5 89.8Asian 39 1213
- - - - - - -Two or More Races - -1011
35.5 5.4 46.3 51.7 57.1 62.5 67.9Students with Disabilities 76 40.91011
- - - - - - -Limited English Proficiency - -1011
65.8 2.9 71.6 74.5 77.4 80.3 83.2Economically Disadvantaged 38 68.71011
Performance Targets - Mathematics
Subgroup# of Valid
Test Scores
Baseline
% Proficient
Yearly
Increment
2012-2013
Target (%P)
2011-2012
Target (%P)
2013-2014
Target (%P)
2014-2015
Target (%P)
2015-2016
Target (%P)
2016-2017
Target (%P)
Baseline
year
72.9 2.3 77.5 79.8 82.1 84.4 86.7Schoolwide 431 75.21011
73.6 2.2 78 80.2 82.4 84.6 86.8White 287 75.81011
50 4.2 58.4 62.6 66.8 71 75.2Black 42 54.21011
75 2.1 79.2 81.3 83.4 85.5 87.6Hispanic 64 77.11011
- - - - - - -American Indian - -1011
90.3 - 90 90 90 90 90Asian 31 901011
- - - - - - -Two or More Races - -1011
42.1 4.8 51.7 56.5 61.3 66.1 70.9Students with Disabilities 76 46.91011
- - - - - - -Limited English Proficiency - -1011
68.4 2.6 73.6 76.2 78.8 81.4 84Economically Disadvantaged 38 711011
11/5/2014
Only Includes full year students (Time In School < Year students are removed)
'-' Indicates too few students to determine (N<30)
Title I Accountability System
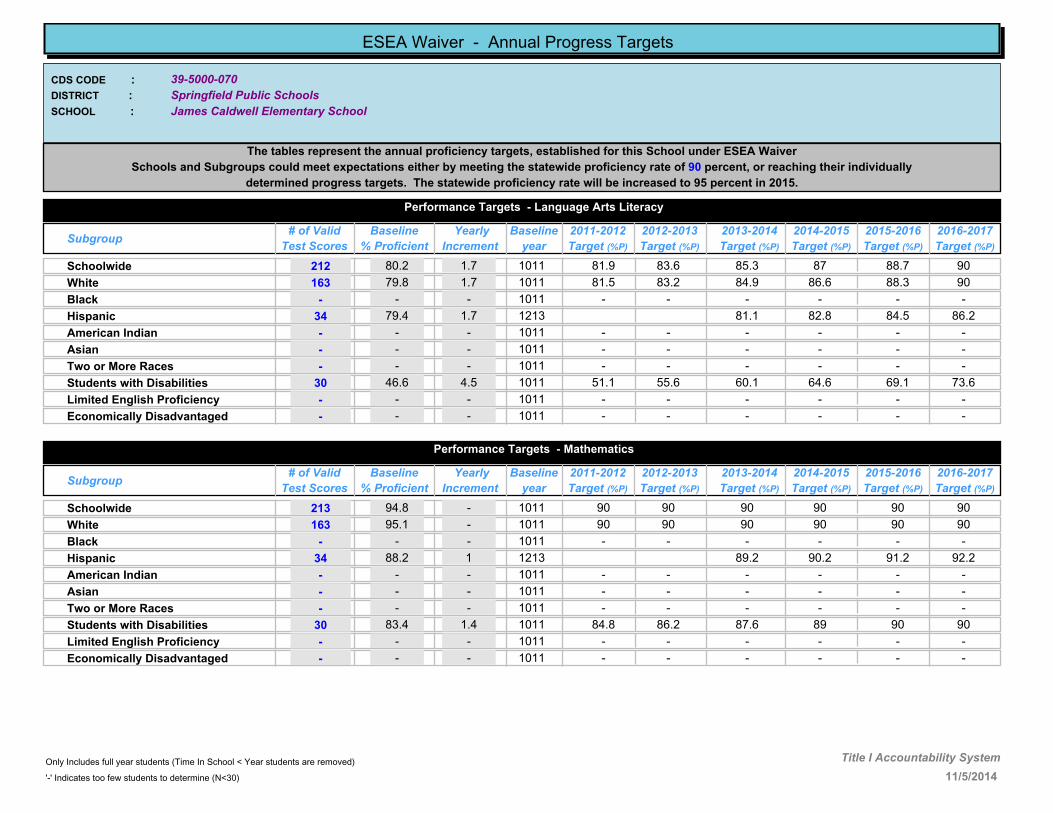
39-5000-070
James Caldwell Elementary School
Springfield Public Schools
CDS CODE :
DISTRICT :
SCHOOL :
ESEA Waiver - Annual Progress Targets
The tables represent the annual proficiency targets, established for this School under ESEA Waiver
Schools and Subgroups could meet expectations either by meeting the statewide proficiency rate of 90 percent, or reaching their individually
determined progress targets. The statewide proficiency rate will be increased to 95 percent in 2015.
Performance Targets - Language Arts Literacy
Subgroup# of Valid
Test Scores
Baseline
% Proficient
Yearly
Increment
2012-2013
Target (%P)
2011-2012
Target (%P)
2013-2014
Target (%P)
2014-2015
Target (%P)
2015-2016
Target (%P)
2016-2017
Target (%P)
Baseline
year
80.2 1.7 83.6 85.3 87 88.7 90Schoolwide 212 81.91011
79.8 1.7 83.2 84.9 86.6 88.3 90White 163 81.51011
- - - - - - -Black - -1011
79.4 1.7 81.1 82.8 84.5 86.2Hispanic 34 1213
- - - - - - -American Indian - -1011
- - - - - - -Asian - -1011
- - - - - - -Two or More Races - -1011
46.6 4.5 55.6 60.1 64.6 69.1 73.6Students with Disabilities 30 51.11011
- - - - - - -Limited English Proficiency - -1011
- - - - - - -Economically Disadvantaged - -1011
Performance Targets - Mathematics
Subgroup# of Valid
Test Scores
Baseline
% Proficient
Yearly
Increment
2012-2013
Target (%P)
2011-2012
Target (%P)
2013-2014
Target (%P)
2014-2015
Target (%P)
2015-2016
Target (%P)
2016-2017
Target (%P)
Baseline
year
94.8 - 90 90 90 90 90Schoolwide 213 901011
95.1 - 90 90 90 90 90White 163 901011
- - - - - - -Black - -1011
88.2 1 89.2 90.2 91.2 92.2Hispanic 34 1213
- - - - - - -American Indian - -1011
- - - - - - -Asian - -1011
- - - - - - -Two or More Races - -1011
83.4 1.4 86.2 87.6 89 90 90Students with Disabilities 30 84.81011
- - - - - - -Limited English Proficiency - -1011
- - - - - - -Economically Disadvantaged - -1011
11/5/2014
Only Includes full year students (Time In School < Year students are removed)
'-' Indicates too few students to determine (N<30)
Title I Accountability System

39-5000-090
Thelma L. Sandmeier Elementary School
Springfield Public Schools
CDS CODE :
DISTRICT :
SCHOOL :
ESEA Waiver - Annual Progress Targets
The tables represent the annual proficiency targets, established for this School under ESEA Waiver
Schools and Subgroups could meet expectations either by meeting the statewide proficiency rate of 90 percent, or reaching their individually
determined progress targets. The statewide proficiency rate will be increased to 95 percent in 2015.
Performance Targets - Language Arts Literacy
Subgroup# of Valid
Test Scores
Baseline
% Proficient
Yearly
Increment
2012-2013
Target (%P)
2011-2012
Target (%P)
2013-2014
Target (%P)
2014-2015
Target (%P)
2015-2016
Target (%P)
2016-2017
Target (%P)
Baseline
year
66.1 2.8 71.7 74.5 77.3 80.1 82.9Schoolwide 206 68.91011
65.9 2.8 71.5 74.3 77.1 79.9 82.7White 147 68.71011
- - - - - - -Black - -1011
- - - - - - -Hispanic - -1011
- - - - - - -American Indian - -1011
- - - - - - -Asian - -1011
- - - - - - -Two or More Races - -1011
42.9 4.8 52.5 57.3 62.1 66.9 71.7Students with Disabilities 49 47.71011
- - - - - - -Limited English Proficiency - -1011
- - - - - - -Economically Disadvantaged - -1011
Performance Targets - Mathematics
Subgroup# of Valid
Test Scores
Baseline
% Proficient
Yearly
Increment
2012-2013
Target (%P)
2011-2012
Target (%P)
2013-2014
Target (%P)
2014-2015
Target (%P)
2015-2016
Target (%P)
2016-2017
Target (%P)
Baseline
year
89.3 .9 90 90 90 90 90Schoolwide 206 901011
90.5 - 90 90 90 90 90White 147 901011
- - - - - - -Black - -1011
- - - - - - -Hispanic - -1011
- - - - - - -American Indian - -1011
- - - - - - -Asian - -1011
- - - - - - -Two or More Races - -1011
73.5 2.2 77.9 80.1 82.3 84.5 86.7Students with Disabilities 49 75.71011
- - - - - - -Limited English Proficiency - -1011
- - - - - - -Economically Disadvantaged - -1011
11/5/2014
Only Includes full year students (Time In School < Year students are removed)
'-' Indicates too few students to determine (N<30)
Title I Accountability System

39-5090-050
Summit Senior High School
Summit Public Schools
CDS CODE :
DISTRICT :
SCHOOL :
ESEA Waiver - Annual Progress Targets
The tables represent the annual proficiency targets, established for this School under ESEA Waiver
Schools and Subgroups could meet expectations either by meeting the statewide proficiency rate of 90 percent, or reaching their individually
determined progress targets. The statewide proficiency rate will be increased to 95 percent in 2015.
Performance Targets - Language Arts Literacy
Subgroup# of Valid
Test Scores
Baseline
% Proficient
Yearly
Increment
2012-2013
Target (%P)
2011-2012
Target (%P)
2013-2014
Target (%P)
2014-2015
Target (%P)
2015-2016
Target (%P)
2016-2017
Target (%P)
Baseline
year
96.9 - 90 90 90 90 90Schoolwide 222 901011
98.1 - 90 90 90 90 90White 159 901011
- - - - - - -Black - -1011
92.1 - 90 90 90 90 90Hispanic 38 901011
- - - - - - -American Indian - -1011
- - - - - - -Asian - -1011
- - - - - - -Two or More Races - -1011
81.4 1.6 83 84.6 86.2 87.8 89.4Students with Disabilities 43 1112
- - - - - - -Limited English Proficiency - -1011
97.2 - 90 90 90 90 90Economically Disadvantaged 36 1112
Performance Targets - Mathematics
Subgroup# of Valid
Test Scores
Baseline
% Proficient
Yearly
Increment
2012-2013
Target (%P)
2011-2012
Target (%P)
2013-2014
Target (%P)
2014-2015
Target (%P)
2015-2016
Target (%P)
2016-2017
Target (%P)
Baseline
year
92.3 - 90 90 90 90 90Schoolwide 222 901011
96.2 - 90 90 90 90 90White 159 901011
- - - - - - -Black - -1011
84.2 1.3 86.8 88.1 89.4 90 90Hispanic 38 85.51011
- - - - - - -American Indian - -1011
- - - - - - -Asian - -1011
- - - - - - -Two or More Races - -1011
58.1 3.5 61.6 65.1 68.6 72.1 75.6Students with Disabilities 43 1112
- - - - - - -Limited English Proficiency - -1011
80.5 1.6 82.1 83.7 85.3 86.9 88.5Economically Disadvantaged 36 1112
11/5/2014
Only Includes full year students (Time In School < Year students are removed)
'-' Indicates too few students to determine (N<30)
Title I Accountability System

39-5090-060
Lawton C. Johnson Summit Middle School
Summit Public Schools
CDS CODE :
DISTRICT :
SCHOOL :
ESEA Waiver - Annual Progress Targets
The tables represent the annual proficiency targets, established for this School under ESEA Waiver
Schools and Subgroups could meet expectations either by meeting the statewide proficiency rate of 90 percent, or reaching their individually
determined progress targets. The statewide proficiency rate will be increased to 95 percent in 2015.
Performance Targets - Language Arts Literacy
Subgroup# of Valid
Test Scores
Baseline
% Proficient
Yearly
Increment
2012-2013
Target (%P)
2011-2012
Target (%P)
2013-2014
Target (%P)
2014-2015
Target (%P)
2015-2016
Target (%P)
2016-2017
Target (%P)
Baseline
year
89.3 .9 90 90 90 90 90Schoolwide 909 901011
94.1 - 90 90 90 90 90White 662 901011
63.6 3 69.6 72.6 75.6 78.6 81.6Black 33 66.61011
67.9 2.7 73.3 76 78.7 81.4 84.1Hispanic 128 70.61011
- - - - - - -American Indian - -1011
96.4 - 90 90 90 90 90Asian 55 901011
87.1 1.1 89.3 90 90 90 90Two or More Races 31 88.21011
64 3 70 73 76 79 82Students with Disabilities 111 671011
- - - - - - -Limited English Proficiency - -1011
65.9 2.9 71.7 74.6 77.5 80.4 83.3Economically Disadvantaged 123 68.81011
Performance Targets - Mathematics
Subgroup# of Valid
Test Scores
Baseline
% Proficient
Yearly
Increment
2012-2013
Target (%P)
2011-2012
Target (%P)
2013-2014
Target (%P)
2014-2015
Target (%P)
2015-2016
Target (%P)
2016-2017
Target (%P)
Baseline
year
87.9 1 89.9 90 90 90 90Schoolwide 909 88.91011
93.1 - 90 90 90 90 90White 662 901011
57.5 3.5 64.5 68 71.5 75 78.5Black 33 611011
68 2.7 73.4 76.1 78.8 81.5 84.2Hispanic 128 70.71011
- - - - - - -American Indian - -1011
92.7 - 90 90 90 90 90Asian 55 901011
83.9 1.4 86.7 88.1 89.5 90 90Two or More Races 31 85.31011
54.9 3.8 62.5 66.3 70.1 73.9 77.7Students with Disabilities 111 58.71011
- - - - - - -Limited English Proficiency - -1011
61 3.3 67.6 70.9 74.2 77.5 80.8Economically Disadvantaged 123 64.31011
11/5/2014
Only Includes full year students (Time In School < Year students are removed)
'-' Indicates too few students to determine (N<30)
Title I Accountability System

39-5090-070
Brayton Elementary School
Summit Public Schools
CDS CODE :
DISTRICT :
SCHOOL :
ESEA Waiver - Annual Progress Targets
The tables represent the annual proficiency targets, established for this School under ESEA Waiver
Schools and Subgroups could meet expectations either by meeting the statewide proficiency rate of 90 percent, or reaching their individually
determined progress targets. The statewide proficiency rate will be increased to 95 percent in 2015.
Performance Targets - Language Arts Literacy
Subgroup# of Valid
Test Scores
Baseline
% Proficient
Yearly
Increment
2012-2013
Target (%P)
2011-2012
Target (%P)
2013-2014
Target (%P)
2014-2015
Target (%P)
2015-2016
Target (%P)
2016-2017
Target (%P)
Baseline
year
85.2 1.2 87.6 88.8 90 90 90Schoolwide 229 86.41011
90.2 - 90 90 90 90 90White 184 901011
- - - - - - -Black - -1011
- - - - - - -Hispanic - -1011
- - - - - - -American Indian - -1011
- - - - - - -Asian - -1011
- - - - - - -Two or More Races - -1011
51.6 4 55.6 59.6 63.6 67.6 71.6Students with Disabilities 31 1112
- - - - - - -Limited English Proficiency - -1011
- - - - - - -Economically Disadvantaged - -1011
Performance Targets - Mathematics
Subgroup# of Valid
Test Scores
Baseline
% Proficient
Yearly
Increment
2012-2013
Target (%P)
2011-2012
Target (%P)
2013-2014
Target (%P)
2014-2015
Target (%P)
2015-2016
Target (%P)
2016-2017
Target (%P)
Baseline
year
93.5 - 90 90 90 90 90Schoolwide 229 901011
96.2 - 90 90 90 90 90White 184 901011
- - - - - - -Black - -1011
- - - - - - -Hispanic - -1011
- - - - - - -American Indian - -1011
- - - - - - -Asian - -1011
- - - - - - -Two or More Races - -1011
74.2 2.2 76.4 78.6 80.8 83 85.2Students with Disabilities 31 1112
- - - - - - -Limited English Proficiency - -1011
- - - - - - -Economically Disadvantaged - -1011
11/5/2014
Only Includes full year students (Time In School < Year students are removed)
'-' Indicates too few students to determine (N<30)
Title I Accountability System

39-5090-080
Franklin Elementary School
Summit Public Schools
CDS CODE :
DISTRICT :
SCHOOL :
ESEA Waiver - Annual Progress Targets
The tables represent the annual proficiency targets, established for this School under ESEA Waiver
Schools and Subgroups could meet expectations either by meeting the statewide proficiency rate of 90 percent, or reaching their individually
determined progress targets. The statewide proficiency rate will be increased to 95 percent in 2015.
Performance Targets - Language Arts Literacy
Subgroup# of Valid
Test Scores
Baseline
% Proficient
Yearly
Increment
2012-2013
Target (%P)
2011-2012
Target (%P)
2013-2014
Target (%P)
2014-2015
Target (%P)
2015-2016
Target (%P)
2016-2017
Target (%P)
Baseline
year
85.5 1.2 87.9 89.1 90 90 90Schoolwide 207 86.71011
87 1.1 89.2 90 90 90 90White 169 88.11011
- - - - - - -Black - -1011
- - - - - - -Hispanic - -1011
- - - - - - -American Indian - -1011
- - - - - - -Asian - -1011
- - - - - - -Two or More Races - -1011
62.5 3.1 68.7 71.8 74.9 78 81.1Students with Disabilities 40 65.61011
- - - - - - -Limited English Proficiency - -1011
- - - - - - -Economically Disadvantaged - -1011
Performance Targets - Mathematics
Subgroup# of Valid
Test Scores
Baseline
% Proficient
Yearly
Increment
2012-2013
Target (%P)
2011-2012
Target (%P)
2013-2014
Target (%P)
2014-2015
Target (%P)
2015-2016
Target (%P)
2016-2017
Target (%P)
Baseline
year
93.8 - 90 90 90 90 90Schoolwide 207 901011
95.3 - 90 90 90 90 90White 169 901011
- - - - - - -Black - -1011
- - - - - - -Hispanic - -1011
- - - - - - -American Indian - -1011
- - - - - - -Asian - -1011
- - - - - - -Two or More Races - -1011
77.5 1.9 81.3 83.2 85.1 87 88.9Students with Disabilities 40 79.41011
- - - - - - -Limited English Proficiency - -1011
- - - - - - -Economically Disadvantaged - -1011
11/5/2014
Only Includes full year students (Time In School < Year students are removed)
'-' Indicates too few students to determine (N<30)
Title I Accountability System

39-5090-090
Jefferson Elementary School
Summit Public Schools
CDS CODE :
DISTRICT :
SCHOOL :
ESEA Waiver - Annual Progress Targets
The tables represent the annual proficiency targets, established for this School under ESEA Waiver
Schools and Subgroups could meet expectations either by meeting the statewide proficiency rate of 90 percent, or reaching their individually
determined progress targets. The statewide proficiency rate will be increased to 95 percent in 2015.
Performance Targets - Language Arts Literacy
Subgroup# of Valid
Test Scores
Baseline
% Proficient
Yearly
Increment
2012-2013
Target (%P)
2011-2012
Target (%P)
2013-2014
Target (%P)
2014-2015
Target (%P)
2015-2016
Target (%P)
2016-2017
Target (%P)
Baseline
year
64.9 2.9 70.7 73.6 76.5 79.4 82.3Schoolwide 111 67.81011
75.5 2.1 79.7 81.8 83.9 86 88.1White 49 77.61011
- - - - - - -Black - -1011
50 4.2 58.4 62.6 66.8 71 75.2Hispanic 38 54.21011
- - - - - - -American Indian - -1011
- - - - - - -Asian - -1011
- - - - - - -Two or More Races - -1011
- - - - - - -Students with Disabilities - -1011
- - - - - - -Limited English Proficiency - -1011
39.6 5 49.6 54.6 59.6 64.6 69.6Economically Disadvantaged 48 44.61011
Performance Targets - Mathematics
Subgroup# of Valid
Test Scores
Baseline
% Proficient
Yearly
Increment
2012-2013
Target (%P)
2011-2012
Target (%P)
2013-2014
Target (%P)
2014-2015
Target (%P)
2015-2016
Target (%P)
2016-2017
Target (%P)
Baseline
year
80.1 1.7 83.5 85.2 86.9 88.6 90Schoolwide 111 81.81011
91.8 - 90 90 90 90 90White 49 901011
- - - - - - -Black - -1011
76.3 2 80.3 82.3 84.3 86.3 88.3Hispanic 38 78.31011
- - - - - - -American Indian - -1011
- - - - - - -Asian - -1011
- - - - - - -Two or More Races - -1011
- - - - - - -Students with Disabilities - -1011
- - - - - - -Limited English Proficiency - -1011
64.6 3 70.6 73.6 76.6 79.6 82.6Economically Disadvantaged 48 67.61011
11/5/2014
Only Includes full year students (Time In School < Year students are removed)
'-' Indicates too few students to determine (N<30)
Title I Accountability System

39-5090-100
Lincoln-Hubbard Elementary School
Summit Public Schools
CDS CODE :
DISTRICT :
SCHOOL :
ESEA Waiver - Annual Progress Targets
The tables represent the annual proficiency targets, established for this School under ESEA Waiver
Schools and Subgroups could meet expectations either by meeting the statewide proficiency rate of 90 percent, or reaching their individually
determined progress targets. The statewide proficiency rate will be increased to 95 percent in 2015.
Performance Targets - Language Arts Literacy
Subgroup# of Valid
Test Scores
Baseline
% Proficient
Yearly
Increment
2012-2013
Target (%P)
2011-2012
Target (%P)
2013-2014
Target (%P)
2014-2015
Target (%P)
2015-2016
Target (%P)
2016-2017
Target (%P)
Baseline
year
88.9 .9 90 90 90 90 90Schoolwide 189 89.81011
93.5 - 90 90 90 90 90White 153 901011
- - - - - - -Black - -1011
- - - - - - -Hispanic - -1011
- - - - - - -American Indian - -1011
- - - - - - -Asian - -1011
- - - - - - -Two or More Races - -1011
70 2.5 75 77.5 80 82.5 85Students with Disabilities 30 72.51011
- - - - - - -Limited English Proficiency - -1011
- - - - - - -Economically Disadvantaged - -1011
Performance Targets - Mathematics
Subgroup# of Valid
Test Scores
Baseline
% Proficient
Yearly
Increment
2012-2013
Target (%P)
2011-2012
Target (%P)
2013-2014
Target (%P)
2014-2015
Target (%P)
2015-2016
Target (%P)
2016-2017
Target (%P)
Baseline
year
96.9 - 90 90 90 90 90Schoolwide 189 901011
98.7 - 90 90 90 90 90White 153 901011
- - - - - - -Black - -1011
- - - - - - -Hispanic - -1011
- - - - - - -American Indian - -1011
- - - - - - -Asian - -1011
- - - - - - -Two or More Races - -1011
86.6 1.1 88.8 89.9 90 90 90Students with Disabilities 30 87.71011
- - - - - - -Limited English Proficiency - -1011
- - - - - - -Economically Disadvantaged - -1011
11/5/2014
Only Includes full year students (Time In School < Year students are removed)
'-' Indicates too few students to determine (N<30)
Title I Accountability System

39-5090-120
Washington Elementary School
Summit Public Schools
CDS CODE :
DISTRICT :
SCHOOL :
ESEA Waiver - Annual Progress Targets
The tables represent the annual proficiency targets, established for this School under ESEA Waiver
Schools and Subgroups could meet expectations either by meeting the statewide proficiency rate of 90 percent, or reaching their individually
determined progress targets. The statewide proficiency rate will be increased to 95 percent in 2015.
Performance Targets - Language Arts Literacy
Subgroup# of Valid
Test Scores
Baseline
% Proficient
Yearly
Increment
2012-2013
Target (%P)
2011-2012
Target (%P)
2013-2014
Target (%P)
2014-2015
Target (%P)
2015-2016
Target (%P)
2016-2017
Target (%P)
Baseline
year
82.5 1.5 85.5 87 88.5 90 90Schoolwide 189 841011
84.8 1.3 87.4 88.7 90 90 90White 125 86.11011
- - - - - - -Black - -1011
- - - - - - -Hispanic - -1011
- - - - - - -American Indian - -1011
- - - - - - -Asian - -1011
- - - - - - -Two or More Races - -1011
55.9 3.7 63.3 67 70.7 74.4 78.1Students with Disabilities 34 59.61011
- - - - - - -Limited English Proficiency - -1011
65.7 2.9 71.5 74.4 77.3 80.2 83.1Economically Disadvantaged 35 68.61011
Performance Targets - Mathematics
Subgroup# of Valid
Test Scores
Baseline
% Proficient
Yearly
Increment
2012-2013
Target (%P)
2011-2012
Target (%P)
2013-2014
Target (%P)
2014-2015
Target (%P)
2015-2016
Target (%P)
2016-2017
Target (%P)
Baseline
year
90.4 - 90 90 90 90 90Schoolwide 189 901011
92 - 90 90 90 90 90White 125 901011
- - - - - - -Black - -1011
- - - - - - -Hispanic - -1011
- - - - - - -American Indian - -1011
- - - - - - -Asian - -1011
- - - - - - -Two or More Races - -1011
76.4 2 80.4 82.4 84.4 86.4 88.4Students with Disabilities 34 78.41011
- - - - - - -Limited English Proficiency - -1011
82.8 1.4 85.6 87 88.4 89.8 90Economically Disadvantaged 35 84.21011
11/5/2014
Only Includes full year students (Time In School < Year students are removed)
'-' Indicates too few students to determine (N<30)
Title I Accountability System

39-5260-020
Academy For Allied Health Sciences
Union County Vocational-Technical School District
CDS CODE :
DISTRICT :
SCHOOL :
ESEA Waiver - Annual Progress Targets
The tables represent the annual proficiency targets, established for this School under ESEA Waiver
Schools and Subgroups could meet expectations either by meeting the statewide proficiency rate of 90 percent, or reaching their individually
determined progress targets. The statewide proficiency rate will be increased to 95 percent in 2015.
Performance Targets - Language Arts Literacy
Subgroup# of Valid
Test Scores
Baseline
% Proficient
Yearly
Increment
2012-2013
Target (%P)
2011-2012
Target (%P)
2013-2014
Target (%P)
2014-2015
Target (%P)
2015-2016
Target (%P)
2016-2017
Target (%P)
Baseline
year
100 - 90 90 90 90 90Schoolwide 60 901011
100 - 90 90 90 90White 30 1213
- - - - - - -Black - -1011
- - - - - - -Hispanic - -1011
- - - - - - -American Indian - -1011
- - - - - - -Asian - -1011
- - - - - - -Two or More Races - -1011
- - - - - - -Students with Disabilities - -1011
- - - - - - -Limited English Proficiency - -1011
- - - - - - -Economically Disadvantaged - -1011
Performance Targets - Mathematics
Subgroup# of Valid
Test Scores
Baseline
% Proficient
Yearly
Increment
2012-2013
Target (%P)
2011-2012
Target (%P)
2013-2014
Target (%P)
2014-2015
Target (%P)
2015-2016
Target (%P)
2016-2017
Target (%P)
Baseline
year
100 - 90 90 90 90 90Schoolwide 60 901011
100 - 90 90 90 90White 30 1213
- - - - - - -Black - -1011
- - - - - - -Hispanic - -1011
- - - - - - -American Indian - -1011
- - - - - - -Asian - -1011
- - - - - - -Two or More Races - -1011
- - - - - - -Students with Disabilities - -1011
- - - - - - -Limited English Proficiency - -1011
- - - - - - -Economically Disadvantaged - -1011
11/5/2014
Only Includes full year students (Time In School < Year students are removed)
'-' Indicates too few students to determine (N<30)
Title I Accountability System

39-5260-030
Academy For Information Technology
Union County Vocational-Technical School District
CDS CODE :
DISTRICT :
SCHOOL :
ESEA Waiver - Annual Progress Targets
The tables represent the annual proficiency targets, established for this School under ESEA Waiver
Schools and Subgroups could meet expectations either by meeting the statewide proficiency rate of 90 percent, or reaching their individually
determined progress targets. The statewide proficiency rate will be increased to 95 percent in 2015.
Performance Targets - Language Arts Literacy
Subgroup# of Valid
Test Scores
Baseline
% Proficient
Yearly
Increment
2012-2013
Target (%P)
2011-2012
Target (%P)
2013-2014
Target (%P)
2014-2015
Target (%P)
2015-2016
Target (%P)
2016-2017
Target (%P)
Baseline
year
100 - 90 90 90 90 90Schoolwide 61 901011
100 - 90 90 90 90 90White 34 901011
- - - - - - -Black - -1011
- - - - - - -Hispanic - -1011
- - - - - - -American Indian - -1011
- - - - - - -Asian - -1011
- - - - - - -Two or More Races - -1011
- - - - - - -Students with Disabilities - -1011
- - - - - - -Limited English Proficiency - -1011
- - - - - - -Economically Disadvantaged - -1011
Performance Targets - Mathematics
Subgroup# of Valid
Test Scores
Baseline
% Proficient
Yearly
Increment
2012-2013
Target (%P)
2011-2012
Target (%P)
2013-2014
Target (%P)
2014-2015
Target (%P)
2015-2016
Target (%P)
2016-2017
Target (%P)
Baseline
year
100 - 90 90 90 90 90Schoolwide 61 901011
100 - 90 90 90 90 90White 34 901011
- - - - - - -Black - -1011
- - - - - - -Hispanic - -1011
- - - - - - -American Indian - -1011
- - - - - - -Asian - -1011
- - - - - - -Two or More Races - -1011
- - - - - - -Students with Disabilities - -1011
- - - - - - -Limited English Proficiency - -1011
- - - - - - -Economically Disadvantaged - -1011
11/5/2014
Only Includes full year students (Time In School < Year students are removed)
'-' Indicates too few students to determine (N<30)
Title I Accountability System

39-5260-035
Academy For Performing Arts
Union County Vocational-Technical School District
CDS CODE :
DISTRICT :
SCHOOL :
ESEA Waiver - Annual Progress Targets
The tables represent the annual proficiency targets, established for this School under ESEA Waiver
Schools and Subgroups could meet expectations either by meeting the statewide proficiency rate of 90 percent, or reaching their individually
determined progress targets. The statewide proficiency rate will be increased to 95 percent in 2015.
Performance Targets - Language Arts Literacy
Subgroup# of Valid
Test Scores
Baseline
% Proficient
Yearly
Increment
2012-2013
Target (%P)
2011-2012
Target (%P)
2013-2014
Target (%P)
2014-2015
Target (%P)
2015-2016
Target (%P)
2016-2017
Target (%P)
Baseline
year
100 - 90 90 90 90 90Schoolwide 51 1112
- - - - - -White - 1112
- - - - - -Black - 1112
- - - - - -Hispanic - 1112
- - - - - -American Indian - 1112
- - - - - -Asian - 1112
- - - - - -Two or More Races - 1112
- - - - - -Students with Disabilities - 1112
- - - - - -Limited English Proficiency - 1112
- - - - - -Economically Disadvantaged - 1112
Performance Targets - Mathematics
Subgroup# of Valid
Test Scores
Baseline
% Proficient
Yearly
Increment
2012-2013
Target (%P)
2011-2012
Target (%P)
2013-2014
Target (%P)
2014-2015
Target (%P)
2015-2016
Target (%P)
2016-2017
Target (%P)
Baseline
year
100 - 90 90 90 90 90Schoolwide 51 1112
- - - - - -White - 1112
- - - - - -Black - 1112
- - - - - -Hispanic - 1112
- - - - - -American Indian - 1112
- - - - - -Asian - 1112
- - - - - -Two or More Races - 1112
- - - - - -Students with Disabilities - 1112
- - - - - -Limited English Proficiency - 1112
- - - - - -Economically Disadvantaged - 1112
11/5/2014
Only Includes full year students (Time In School < Year students are removed)
'-' Indicates too few students to determine (N<30)
Title I Accountability System

39-5260-040
Union County Magnet High School
Union County Vocational-Technical School District
CDS CODE :
DISTRICT :
SCHOOL :
ESEA Waiver - Annual Progress Targets
The tables represent the annual proficiency targets, established for this School under ESEA Waiver
Schools and Subgroups could meet expectations either by meeting the statewide proficiency rate of 90 percent, or reaching their individually
determined progress targets. The statewide proficiency rate will be increased to 95 percent in 2015.
Performance Targets - Language Arts Literacy
Subgroup# of Valid
Test Scores
Baseline
% Proficient
Yearly
Increment
2012-2013
Target (%P)
2011-2012
Target (%P)
2013-2014
Target (%P)
2014-2015
Target (%P)
2015-2016
Target (%P)
2016-2017
Target (%P)
Baseline
year
100 - 90 90 90 90 90Schoolwide 66 901011
100 - 90 90 90 90 90White 41 901011
- - - - - - -Black - -1011
- - - - - - -Hispanic - -1011
- - - - - - -American Indian - -1011
- - - - - - -Asian - -1011
- - - - - - -Two or More Races - -1011
- - - - - - -Students with Disabilities - -1011
- - - - - - -Limited English Proficiency - -1011
- - - - - - -Economically Disadvantaged - -1011
Performance Targets - Mathematics
Subgroup# of Valid
Test Scores
Baseline
% Proficient
Yearly
Increment
2012-2013
Target (%P)
2011-2012
Target (%P)
2013-2014
Target (%P)
2014-2015
Target (%P)
2015-2016
Target (%P)
2016-2017
Target (%P)
Baseline
year
100 - 90 90 90 90 90Schoolwide 66 901011
100 - 90 90 90 90 90White 41 901011
- - - - - - -Black - -1011
- - - - - - -Hispanic - -1011
- - - - - - -American Indian - -1011
- - - - - - -Asian - -1011
- - - - - - -Two or More Races - -1011
- - - - - - -Students with Disabilities - -1011
- - - - - - -Limited English Proficiency - -1011
- - - - - - -Economically Disadvantaged - -1011
11/5/2014
Only Includes full year students (Time In School < Year students are removed)
'-' Indicates too few students to determine (N<30)
Title I Accountability System

39-5260-050
Union County Tech
Union County Vocational-Technical School District
CDS CODE :
DISTRICT :
SCHOOL :
ESEA Waiver - Annual Progress Targets
The tables represent the annual proficiency targets, established for this School under ESEA Waiver
Schools and Subgroups could meet expectations either by meeting the statewide proficiency rate of 90 percent, or reaching their individually
determined progress targets. The statewide proficiency rate will be increased to 95 percent in 2015.
Performance Targets - Language Arts Literacy
Subgroup# of Valid
Test Scores
Baseline
% Proficient
Yearly
Increment
2012-2013
Target (%P)
2011-2012
Target (%P)
2013-2014
Target (%P)
2014-2015
Target (%P)
2015-2016
Target (%P)
2016-2017
Target (%P)
Baseline
year
100 - 90 90 90 90 90Schoolwide 59 901011
- - - - - - -White - -1011
- - - - - - -Black - -1011
- - - - - - -Hispanic - -1011
- - - - - - -American Indian - -1011
- - - - - - -Asian - -1011
- - - - - - -Two or More Races - -1011
- - - - - - -Students with Disabilities - -1011
- - - - - - -Limited English Proficiency - -1011
- - - - - - -Economically Disadvantaged - -1011
Performance Targets - Mathematics
Subgroup# of Valid
Test Scores
Baseline
% Proficient
Yearly
Increment
2012-2013
Target (%P)
2011-2012
Target (%P)
2013-2014
Target (%P)
2014-2015
Target (%P)
2015-2016
Target (%P)
2016-2017
Target (%P)
Baseline
year
100 - 90 90 90 90 90Schoolwide 59 901011
- - - - - - -White - -1011
- - - - - - -Black - -1011
- - - - - - -Hispanic - -1011
- - - - - - -American Indian - -1011
- - - - - - -Asian - -1011
- - - - - - -Two or More Races - -1011
- - - - - - -Students with Disabilities - -1011
- - - - - - -Limited English Proficiency - -1011
- - - - - - -Economically Disadvantaged - -1011
11/5/2014
Only Includes full year students (Time In School < Year students are removed)
'-' Indicates too few students to determine (N<30)
Title I Accountability System

39-5290-050
UNION SENIOR HIGH
Twp of Union Board of Education
CDS CODE :
DISTRICT :
SCHOOL :
ESEA Waiver - Annual Progress Targets
The tables represent the annual proficiency targets, established for this School under ESEA Waiver
Schools and Subgroups could meet expectations either by meeting the statewide proficiency rate of 90 percent, or reaching their individually
determined progress targets. The statewide proficiency rate will be increased to 95 percent in 2015.
Performance Targets - Language Arts Literacy
Subgroup# of Valid
Test Scores
Baseline
% Proficient
Yearly
Increment
2012-2013
Target (%P)
2011-2012
Target (%P)
2013-2014
Target (%P)
2014-2015
Target (%P)
2015-2016
Target (%P)
2016-2017
Target (%P)
Baseline
year
88.8 .9 90 90 90 90 90Schoolwide 600 89.71011
92.4 - 90 90 90 90 90White 170 901011
84.2 1.3 86.8 88.1 89.4 90 90Black 260 85.51011
89.9 .9 90 90 90 90 90Hispanic 99 901011
- - - - - - -American Indian - -1011
95.8 - 90 90 90 90 90Asian 71 901011
- - - - - - -Two or More Races - -1011
54.8 3.8 62.4 66.2 70 73.8 77.6Students with Disabilities 104 58.61011
- - - - - - -Limited English Proficiency - -1011
85.6 1.2 88 89.2 90 90 90Economically Disadvantaged 181 86.81011
Performance Targets - Mathematics
Subgroup# of Valid
Test Scores
Baseline
% Proficient
Yearly
Increment
2012-2013
Target (%P)
2011-2012
Target (%P)
2013-2014
Target (%P)
2014-2015
Target (%P)
2015-2016
Target (%P)
2016-2017
Target (%P)
Baseline
year
73.1 2.3 77.7 80 82.3 84.6 86.9Schoolwide 602 75.41011
82.9 1.4 85.7 87.1 88.5 89.9 90White 170 84.31011
62.7 3.1 68.9 72 75.1 78.2 81.3Black 263 65.81011
71.4 2.4 76.2 78.6 81 83.4 85.8Hispanic 98 73.81011
- - - - - - -American Indian - -1011
90.1 - 90 90 90 90 90Asian 71 901011
- - - - - - -Two or More Races - -1011
23.8 6.4 36.6 43 49.4 55.8 62.2Students with Disabilities 105 30.21011
- - - - - - -Limited English Proficiency - -1011
67.8 2.7 73.2 75.9 78.6 81.3 84Economically Disadvantaged 183 70.51011
11/5/2014
Only Includes full year students (Time In School < Year students are removed)
'-' Indicates too few students to determine (N<30)
Title I Accountability System

39-5290-060
BURNET MIDDLE SCHOOL
Twp of Union Board of Education
CDS CODE :
DISTRICT :
SCHOOL :
ESEA Waiver - Annual Progress Targets
The tables represent the annual proficiency targets, established for this School under ESEA Waiver
Schools and Subgroups could meet expectations either by meeting the statewide proficiency rate of 90 percent, or reaching their individually
determined progress targets. The statewide proficiency rate will be increased to 95 percent in 2015.
Performance Targets - Language Arts Literacy
Subgroup# of Valid
Test Scores
Baseline
% Proficient
Yearly
Increment
2012-2013
Target (%P)
2011-2012
Target (%P)
2013-2014
Target (%P)
2014-2015
Target (%P)
2015-2016
Target (%P)
2016-2017
Target (%P)
Baseline
year
66.2 2.8 71.8 74.6 77.4 80.2 83Schoolwide 987 691011
68.3 2.7 73.7 76.4 79.1 81.8 84.5White 205 711011
61.8 3.2 68.2 71.4 74.6 77.8 81Black 526 651011
68.3 2.6 73.5 76.1 78.7 81.3 83.9Hispanic 158 70.91011
- - - - - - -American Indian - -1011
81.6 1.5 84.6 86.1 87.6 89.1 90Asian 98 83.11011
- - - - - - -Two or More Races - -1011
15.7 7 29.7 36.7 43.7 50.7 57.7Students with Disabilities 140 22.71011
- - - - - - -Limited English Proficiency - -1011
59.2 3.4 66 69.4 72.8 76.2 79.6Economically Disadvantaged 395 62.61011
Performance Targets - Mathematics
Subgroup# of Valid
Test Scores
Baseline
% Proficient
Yearly
Increment
2012-2013
Target (%P)
2011-2012
Target (%P)
2013-2014
Target (%P)
2014-2015
Target (%P)
2015-2016
Target (%P)
2016-2017
Target (%P)
Baseline
year
69.4 2.6 74.6 77.2 79.8 82.4 85Schoolwide 986 721011
73.6 2.2 78 80.2 82.4 84.6 86.8White 205 75.81011
63.6 3 69.6 72.6 75.6 78.6 81.6Black 525 66.61011
72.8 2.3 77.4 79.7 82 84.3 86.6Hispanic 158 75.11011
- - - - - - -American Indian - -1011
85.7 1.2 88.1 89.3 90 90 90Asian 98 86.91011
- - - - - - -Two or More Races - -1011
17.9 6.9 31.7 38.6 45.5 52.4 59.3Students with Disabilities 140 24.81011
- - - - - - -Limited English Proficiency - -1011
63.9 3 69.9 72.9 75.9 78.9 81.9Economically Disadvantaged 394 66.91011
11/5/2014
Only Includes full year students (Time In School < Year students are removed)
'-' Indicates too few students to determine (N<30)
Title I Accountability System

39-5290-070
KAWAMEEH MIDDLE SCHOOL
Twp of Union Board of Education
CDS CODE :
DISTRICT :
SCHOOL :
ESEA Waiver - Annual Progress Targets
The tables represent the annual proficiency targets, established for this School under ESEA Waiver
Schools and Subgroups could meet expectations either by meeting the statewide proficiency rate of 90 percent, or reaching their individually
determined progress targets. The statewide proficiency rate will be increased to 95 percent in 2015.
Performance Targets - Language Arts Literacy
Subgroup# of Valid
Test Scores
Baseline
% Proficient
Yearly
Increment
2012-2013
Target (%P)
2011-2012
Target (%P)
2013-2014
Target (%P)
2014-2015
Target (%P)
2015-2016
Target (%P)
2016-2017
Target (%P)
Baseline
year
70.9 2.4 75.7 78.1 80.5 82.9 85.3Schoolwide 656 73.31011
78.5 1.8 82.1 83.9 85.7 87.5 89.3White 228 80.31011
58.4 3.5 65.4 68.9 72.4 75.9 79.4Black 221 61.91011
71.5 2.4 76.3 78.7 81.1 83.5 85.9Hispanic 126 73.91011
- - - - - - -American Indian - -1011
82.7 1.5 85.7 87.2 88.7 90 90Asian 81 84.21011
- - - - - - -Two or More Races - -1011
30.1 5.8 41.7 47.5 53.3 59.1 64.9Students with Disabilities 106 35.91011
- - - - - - -Limited English Proficiency - -1011
58.9 3.4 65.7 69.1 72.5 75.9 79.3Economically Disadvantaged 192 62.31011
Performance Targets - Mathematics
Subgroup# of Valid
Test Scores
Baseline
% Proficient
Yearly
Increment
2012-2013
Target (%P)
2011-2012
Target (%P)
2013-2014
Target (%P)
2014-2015
Target (%P)
2015-2016
Target (%P)
2016-2017
Target (%P)
Baseline
year
62.3 3.2 68.7 71.9 75.1 78.3 81.5Schoolwide 655 65.51011
72.3 2.3 76.9 79.2 81.5 83.8 86.1White 228 74.61011
49.1 4.3 57.7 62 66.3 70.6 74.9Black 220 53.41011
54.8 3.8 62.4 66.2 70 73.8 77.6Hispanic 126 58.61011
- - - - - - -American Indian - -1011
81.5 1.6 84.7 86.3 87.9 89.5 90Asian 81 83.11011
- - - - - - -Two or More Races - -1011
22.9 6.4 35.7 42.1 48.5 54.9 61.3Students with Disabilities 105 29.31011
- - - - - - -Limited English Proficiency - -1011
47.7 4.4 56.5 60.9 65.3 69.7 74.1Economically Disadvantaged 191 52.11011
11/5/2014
Only Includes full year students (Time In School < Year students are removed)
'-' Indicates too few students to determine (N<30)
Title I Accountability System
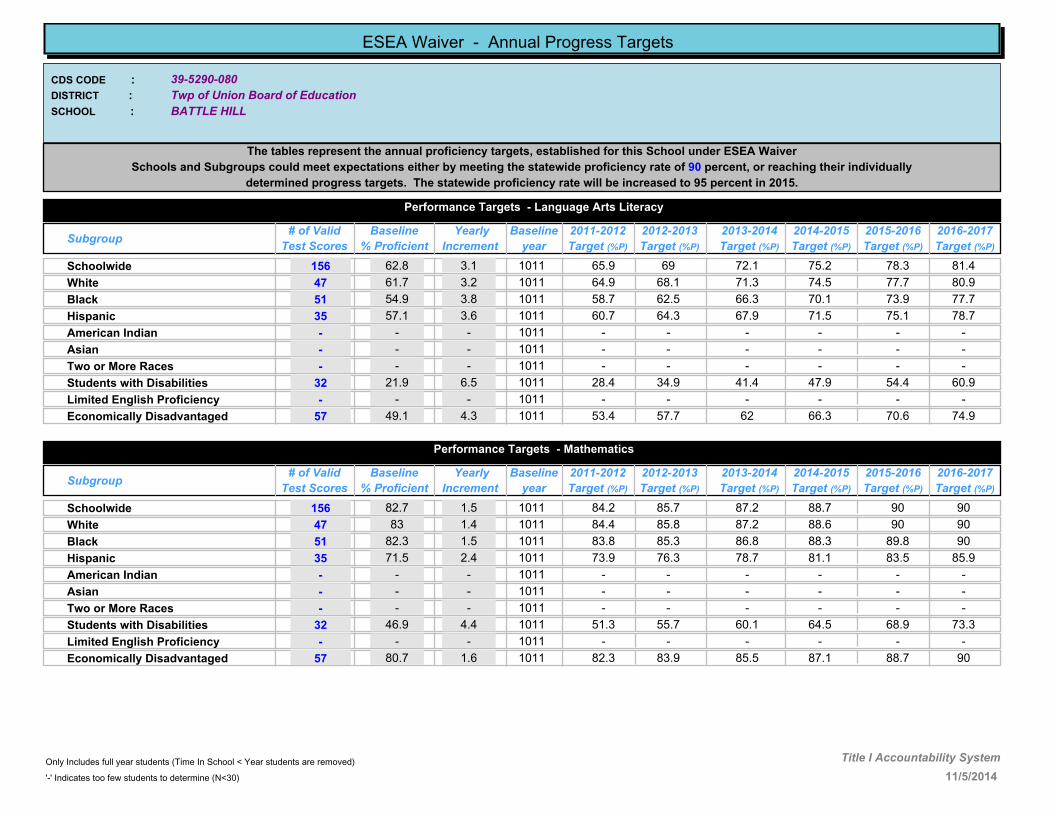
39-5290-080
BATTLE HILL
Twp of Union Board of Education
CDS CODE :
DISTRICT :
SCHOOL :
ESEA Waiver - Annual Progress Targets
The tables represent the annual proficiency targets, established for this School under ESEA Waiver
Schools and Subgroups could meet expectations either by meeting the statewide proficiency rate of 90 percent, or reaching their individually
determined progress targets. The statewide proficiency rate will be increased to 95 percent in 2015.
Performance Targets - Language Arts Literacy
Subgroup# of Valid
Test Scores
Baseline
% Proficient
Yearly
Increment
2012-2013
Target (%P)
2011-2012
Target (%P)
2013-2014
Target (%P)
2014-2015
Target (%P)
2015-2016
Target (%P)
2016-2017
Target (%P)
Baseline
year
62.8 3.1 69 72.1 75.2 78.3 81.4Schoolwide 156 65.91011
61.7 3.2 68.1 71.3 74.5 77.7 80.9White 47 64.91011
54.9 3.8 62.5 66.3 70.1 73.9 77.7Black 51 58.71011
57.1 3.6 64.3 67.9 71.5 75.1 78.7Hispanic 35 60.71011
- - - - - - -American Indian - -1011
- - - - - - -Asian - -1011
- - - - - - -Two or More Races - -1011
21.9 6.5 34.9 41.4 47.9 54.4 60.9Students with Disabilities 32 28.41011
- - - - - - -Limited English Proficiency - -1011
49.1 4.3 57.7 62 66.3 70.6 74.9Economically Disadvantaged 57 53.41011
Performance Targets - Mathematics
Subgroup# of Valid
Test Scores
Baseline
% Proficient
Yearly
Increment
2012-2013
Target (%P)
2011-2012
Target (%P)
2013-2014
Target (%P)
2014-2015
Target (%P)
2015-2016
Target (%P)
2016-2017
Target (%P)
Baseline
year
82.7 1.5 85.7 87.2 88.7 90 90Schoolwide 156 84.21011
83 1.4 85.8 87.2 88.6 90 90White 47 84.41011
82.3 1.5 85.3 86.8 88.3 89.8 90Black 51 83.81011
71.5 2.4 76.3 78.7 81.1 83.5 85.9Hispanic 35 73.91011
- - - - - - -American Indian - -1011
- - - - - - -Asian - -1011
- - - - - - -Two or More Races - -1011
46.9 4.4 55.7 60.1 64.5 68.9 73.3Students with Disabilities 32 51.31011
- - - - - - -Limited English Proficiency - -1011
80.7 1.6 83.9 85.5 87.1 88.7 90Economically Disadvantaged 57 82.31011
11/5/2014
Only Includes full year students (Time In School < Year students are removed)
'-' Indicates too few students to determine (N<30)
Title I Accountability System

39-5290-083
HANNAH CALDWELL ELEM SCH
Twp of Union Board of Education
CDS CODE :
DISTRICT :
SCHOOL :
ESEA Waiver - Annual Progress Targets
The tables represent the annual proficiency targets, established for this School under ESEA Waiver
Schools and Subgroups could meet expectations either by meeting the statewide proficiency rate of 90 percent, or reaching their individually
determined progress targets. The statewide proficiency rate will be increased to 95 percent in 2015.
Performance Targets - Language Arts Literacy
Subgroup# of Valid
Test Scores
Baseline
% Proficient
Yearly
Increment
2012-2013
Target (%P)
2011-2012
Target (%P)
2013-2014
Target (%P)
2014-2015
Target (%P)
2015-2016
Target (%P)
2016-2017
Target (%P)
Baseline
year
67.1 2.8 72.7 75.5 78.3 81.1 83.9Schoolwide 188 69.91011
71.9 2.4 74.3 76.7 79.1 81.5 83.9White 64 1112
62.5 3.1 68.7 71.8 74.9 78 81.1Black 104 65.61011
74.2 2.2 78.6 80.8 83 85.2 87.4Hispanic 31 76.41011
- - - - - - -American Indian - -1011
79.5 1.7 81.2 82.9 84.6 86.3 88Asian 44 1112
- - - - - - -Two or More Races - -1011
35.9 5.4 41.3 46.7 52.1 57.5Students with Disabilities 39 1213
- - - - - - -Limited English Proficiency - -1011
58.9 3.4 65.7 69.1 72.5 75.9 79.3Economically Disadvantaged 90 62.31011
Performance Targets - Mathematics
Subgroup# of Valid
Test Scores
Baseline
% Proficient
Yearly
Increment
2012-2013
Target (%P)
2011-2012
Target (%P)
2013-2014
Target (%P)
2014-2015
Target (%P)
2015-2016
Target (%P)
2016-2017
Target (%P)
Baseline
year
86.7 1.1 88.9 90 90 90 90Schoolwide 188 87.81011
87.5 1.1 88.6 89.7 90.8 91.9 93White 64 1112
84.6 1.3 87.2 88.5 89.8 90 90Black 104 85.91011
80.6 1.6 83.8 85.4 87 88.6 90Hispanic 31 82.21011
- - - - - - -American Indian - -1011
95.4 - 90 90 90 90 90Asian 44 1112
- - - - - - -Two or More Races - -1011
58.9 3.4 62.3 65.7 69.1 72.5Students with Disabilities 39 1213
- - - - - - -Limited English Proficiency - -1011
82.2 1.5 85.2 86.7 88.2 89.7 90Economically Disadvantaged 90 83.71011
11/5/2014
Only Includes full year students (Time In School < Year students are removed)
'-' Indicates too few students to determine (N<30)
Title I Accountability System

39-5290-085CDS CODE :
DISTRICT :
SCHOOL :
ESEA Waiver - Annual Progress Targets
The tables represent the annual proficiency targets, established for this School under ESEA Waiver
Schools and Subgroups could meet expectations either by meeting the statewide proficiency rate of 90 percent, or reaching their individually
determined progress targets. The statewide proficiency rate will be increased to 95 percent in 2015.
Performance Targets - Language Arts Literacy
Subgroup# of Valid
Test Scores
Baseline
% Proficient
Yearly
Increment
2012-2013
Target (%P)
2011-2012
Target (%P)
2013-2014
Target (%P)
2014-2015
Target (%P)
2015-2016
Target (%P)
2016-2017
Target (%P)
Baseline
year
54.9 3.8 62.5 66.3 70.1 73.9 77.7Schoolwide 501 58.71011
61.4 3.2 67.8 71 74.2 77.4 80.6White 145 64.61011
49.4 4.2 57.8 62 66.2 70.4 74.6Black 219 53.61011
45.8 4.5 54.8 59.3 63.8 68.3 72.8Hispanic 83 50.31011
- - - - - - -American Indian - -1011
75.5 2.1 79.7 81.8 83.9 86 88.1Asian 53 77.61011
- - - - - - -Two or More Races - -1011
12.7 7.3 27.3 34.6 41.9 49.2 56.5Students with Disabilities 63 201011
- - - - - - -Limited English Proficiency - -1011
42 4.8 51.6 56.4 61.2 66 70.8Economically Disadvantaged 174 46.81011
Performance Targets - Mathematics
Subgroup# of Valid
Test Scores
Baseline
% Proficient
Yearly
Increment
2012-2013
Target (%P)
2011-2012
Target (%P)
2013-2014
Target (%P)
2014-2015
Target (%P)
2015-2016
Target (%P)
2016-2017
Target (%P)
Baseline
year
80 1.7 83.4 85.1 86.8 88.5 90Schoolwide 501 81.71011
83.5 1.4 86.3 87.7 89.1 90 90White 145 84.91011
75.3 2.1 79.5 81.6 83.7 85.8 87.9Black 219 77.41011
77.1 1.9 80.9 82.8 84.7 86.6 88.5Hispanic 83 791011
- - - - - - -American Indian - -1011
96.2 - 90 90 90 90 90Asian 53 901011
- - - - - - -Two or More Races - -1011
41.2 4.9 51 55.9 60.8 65.7 70.6Students with Disabilities 63 46.11011
- - - - - - -Limited English Proficiency - -1011
74.1 2.2 78.5 80.7 82.9 85.1 87.3Economically Disadvantaged 174 76.31011
11/5/2014
Only Includes full year students (Time In School < Year students are removed)
'-' Indicates too few students to determine (N<30)
Title I Accountability System

39-5290-090
CONNECTICUT FARMS
Twp of Union Board of Education
CDS CODE :
DISTRICT :
SCHOOL :
ESEA Waiver - Annual Progress Targets
The tables represent the annual proficiency targets, established for this School under ESEA Waiver
Schools and Subgroups could meet expectations either by meeting the statewide proficiency rate of 90 percent, or reaching their individually
determined progress targets. The statewide proficiency rate will be increased to 95 percent in 2015.
Performance Targets - Language Arts Literacy
Subgroup# of Valid
Test Scores
Baseline
% Proficient
Yearly
Increment
2012-2013
Target (%P)
2011-2012
Target (%P)
2013-2014
Target (%P)
2014-2015
Target (%P)
2015-2016
Target (%P)
2016-2017
Target (%P)
Baseline
year
63.6 3 69.6 72.6 75.6 78.6 81.6Schoolwide 165 66.61011
60.4 3.3 67 70.3 73.6 76.9 80.2White 43 63.71011
64.6 3 70.6 73.6 76.6 79.6 82.6Black 65 67.61011
61 3.3 67.6 70.9 74.2 77.5 80.8Hispanic 41 64.31011
- - - - - - -American Indian - -1011
- - - - - - -Asian - -1011
- - - - - - -Two or More Races - -1011
- - - - - - -Students with Disabilities - -1011
- - - - - - -Limited English Proficiency - -1011
47.4 4.4 56.2 60.6 65 69.4 73.8Economically Disadvantaged 57 51.81011
Performance Targets - Mathematics
Subgroup# of Valid
Test Scores
Baseline
% Proficient
Yearly
Increment
2012-2013
Target (%P)
2011-2012
Target (%P)
2013-2014
Target (%P)
2014-2015
Target (%P)
2015-2016
Target (%P)
2016-2017
Target (%P)
Baseline
year
84.3 1.3 86.9 88.2 89.5 90 90Schoolwide 165 85.61011
88.4 1 90 90 90 90 90White 43 89.41011
78.5 1.8 82.1 83.9 85.7 87.5 89.3Black 65 80.31011
85.4 1.2 87.8 89 90 90 90Hispanic 41 86.61011
- - - - - - -American Indian - -1011
- - - - - - -Asian - -1011
- - - - - - -Two or More Races - -1011
- - - - - - -Students with Disabilities - -1011
- - - - - - -Limited English Proficiency - -1011
82.5 1.5 85.5 87 88.5 90 90Economically Disadvantaged 57 841011
11/5/2014
Only Includes full year students (Time In School < Year students are removed)
'-' Indicates too few students to determine (N<30)
Title I Accountability System

39-5290-100
FRANKLIN ELEMENTARY
Twp of Union Board of Education
CDS CODE :
DISTRICT :
SCHOOL :
ESEA Waiver - Annual Progress Targets
The tables represent the annual proficiency targets, established for this School under ESEA Waiver
Schools and Subgroups could meet expectations either by meeting the statewide proficiency rate of 90 percent, or reaching their individually
determined progress targets. The statewide proficiency rate will be increased to 95 percent in 2015.
Performance Targets - Language Arts Literacy
Subgroup# of Valid
Test Scores
Baseline
% Proficient
Yearly
Increment
2012-2013
Target (%P)
2011-2012
Target (%P)
2013-2014
Target (%P)
2014-2015
Target (%P)
2015-2016
Target (%P)
2016-2017
Target (%P)
Baseline
year
59.7 3.4 66.5 69.9 73.3 76.7 80.1Schoolwide 159 63.11011
- - - - - - -White - -1011
59.7 3.4 66.5 69.9 73.3 76.7 80.1Black 119 63.11011
- - - - - - -Hispanic - -1011
- - - - - - -American Indian - -1011
- - - - - - -Asian - -1011
- - - - - - -Two or More Races - -1011
- - - - - - -Students with Disabilities - -1011
- - - - - - -Limited English Proficiency - -1011
58.7 3.5 65.7 69.2 72.7 76.2 79.7Economically Disadvantaged 75 62.21011
Performance Targets - Mathematics
Subgroup# of Valid
Test Scores
Baseline
% Proficient
Yearly
Increment
2012-2013
Target (%P)
2011-2012
Target (%P)
2013-2014
Target (%P)
2014-2015
Target (%P)
2015-2016
Target (%P)
2016-2017
Target (%P)
Baseline
year
79.9 1.7 83.3 85 86.7 88.4 90Schoolwide 159 81.61011
- - - - - - -White - -1011
81.6 1.6 84.8 86.4 88 89.6 90Black 119 83.21011
- - - - - - -Hispanic - -1011
- - - - - - -American Indian - -1011
- - - - - - -Asian - -1011
- - - - - - -Two or More Races - -1011
- - - - - - -Students with Disabilities - -1011
- - - - - - -Limited English Proficiency - -1011
81.4 1.6 84.6 86.2 87.8 89.4 90Economically Disadvantaged 75 831011
11/5/2014
Only Includes full year students (Time In School < Year students are removed)
'-' Indicates too few students to determine (N<30)
Title I Accountability System

39-5290-130
LIVINGSTON
Twp of Union Board of Education
CDS CODE :
DISTRICT :
SCHOOL :
ESEA Waiver - Annual Progress Targets
The tables represent the annual proficiency targets, established for this School under ESEA Waiver
Schools and Subgroups could meet expectations either by meeting the statewide proficiency rate of 90 percent, or reaching their individually
determined progress targets. The statewide proficiency rate will be increased to 95 percent in 2015.
Performance Targets - Language Arts Literacy
Subgroup# of Valid
Test Scores
Baseline
% Proficient
Yearly
Increment
2012-2013
Target (%P)
2011-2012
Target (%P)
2013-2014
Target (%P)
2014-2015
Target (%P)
2015-2016
Target (%P)
2016-2017
Target (%P)
Baseline
year
68.3 2.7 73.7 76.4 79.1 81.8 84.5Schoolwide 142 711011
71.7 2.4 76.5 78.9 81.3 83.7 86.1White 46 74.11011
59.6 3.4 66.4 69.8 73.2 76.6 80Black 52 631011
56.7 3.6 60.3 63.9 67.5 71.1Hispanic 30 1213
- - - - - - -American Indian - -1011
- - - - - - -Asian - -1011
- - - - - - -Two or More Races - -1011
- - - - - - -Students with Disabilities - -1011
- - - - - - -Limited English Proficiency - -1011
47.2 4.4 56 60.4 64.8 69.2 73.6Economically Disadvantaged 36 51.61011
Performance Targets - Mathematics
Subgroup# of Valid
Test Scores
Baseline
% Proficient
Yearly
Increment
2012-2013
Target (%P)
2011-2012
Target (%P)
2013-2014
Target (%P)
2014-2015
Target (%P)
2015-2016
Target (%P)
2016-2017
Target (%P)
Baseline
year
85.2 1.2 87.6 88.8 90 90 90Schoolwide 142 86.41011
91.3 - 90 90 90 90 90White 46 901011
77 1.9 80.8 82.7 84.6 86.5 88.4Black 52 78.91011
83.3 1.4 84.7 86.1 87.5 88.9Hispanic 30 1213
- - - - - - -American Indian - -1011
- - - - - - -Asian - -1011
- - - - - - -Two or More Races - -1011
- - - - - - -Students with Disabilities - -1011
- - - - - - -Limited English Proficiency - -1011
75 2.1 79.2 81.3 83.4 85.5 87.6Economically Disadvantaged 36 77.11011
11/5/2014
Only Includes full year students (Time In School < Year students are removed)
'-' Indicates too few students to determine (N<30)
Title I Accountability System

39-5290-140
WASHINGTON
Twp of Union Board of Education
CDS CODE :
DISTRICT :
SCHOOL :
ESEA Waiver - Annual Progress Targets
The tables represent the annual proficiency targets, established for this School under ESEA Waiver
Schools and Subgroups could meet expectations either by meeting the statewide proficiency rate of 90 percent, or reaching their individually
determined progress targets. The statewide proficiency rate will be increased to 95 percent in 2015.
Performance Targets - Language Arts Literacy
Subgroup# of Valid
Test Scores
Baseline
% Proficient
Yearly
Increment
2012-2013
Target (%P)
2011-2012
Target (%P)
2013-2014
Target (%P)
2014-2015
Target (%P)
2015-2016
Target (%P)
2016-2017
Target (%P)
Baseline
year
71.8 2.4 76.6 79 81.4 83.8 86.2Schoolwide 184 74.21011
76.1 2 80.1 82.1 84.1 86.1 88.1White 96 78.11011
54.3 3.8 61.9 65.7 69.5 73.3 77.1Black 35 58.11011
67.6 2.7 73 75.7 78.4 81.1 83.8Hispanic 34 70.31011
- - - - - - -American Indian - -1011
- - - - - - -Asian - -1011
- - - - - - -Two or More Races - -1011
42.9 4.8 47.7 52.5 57.3 62.1Students with Disabilities 35 1213
- - - - - - -Limited English Proficiency - -1011
43.8 4.7 53.2 57.9 62.6 67.3 72Economically Disadvantaged 32 48.51011
Performance Targets - Mathematics
Subgroup# of Valid
Test Scores
Baseline
% Proficient
Yearly
Increment
2012-2013
Target (%P)
2011-2012
Target (%P)
2013-2014
Target (%P)
2014-2015
Target (%P)
2015-2016
Target (%P)
2016-2017
Target (%P)
Baseline
year
90.8 - 90 90 90 90 90Schoolwide 185 901011
92.7 - 90 90 90 90 90White 96 901011
80.6 1.6 83.8 85.4 87 88.6 90Black 36 82.21011
91.1 - 90 90 90 90 90Hispanic 34 901011
- - - - - - -American Indian - -1011
- - - - - - -Asian - -1011
- - - - - - -Two or More Races - -1011
54.3 3.8 58.1 61.9 65.7 69.5Students with Disabilities 35 1213
- - - - - - -Limited English Proficiency - -1011
78.2 1.8 81.8 83.6 85.4 87.2 89Economically Disadvantaged 32 801011
11/5/2014
Only Includes full year students (Time In School < Year students are removed)
'-' Indicates too few students to determine (N<30)
Title I Accountability System

39-5730-050
WESTFIELD SENIOR HIGH SCHOOL
WESTFIELD PUBLIC SCHOOLS
CDS CODE :
DISTRICT :
SCHOOL :
ESEA Waiver - Annual Progress Targets
The tables represent the annual proficiency targets, established for this School under ESEA Waiver
Schools and Subgroups could meet expectations either by meeting the statewide proficiency rate of 90 percent, or reaching their individually
determined progress targets. The statewide proficiency rate will be increased to 95 percent in 2015.
Performance Targets - Language Arts Literacy
Subgroup# of Valid
Test Scores
Baseline
% Proficient
Yearly
Increment
2012-2013
Target (%P)
2011-2012
Target (%P)
2013-2014
Target (%P)
2014-2015
Target (%P)
2015-2016
Target (%P)
2016-2017
Target (%P)
Baseline
year
96.7 - 90 90 90 90 90Schoolwide 451 901011
97.6 - 90 90 90 90 90White 388 901011
- - - - - - -Black - -1011
- - - - - - -Hispanic - -1011
- - - - - - -American Indian - -1011
100 - 90 90 90 90 90Asian 31 901011
- - - - - - -Two or More Races - -1011
83.8 1.4 86.6 88 89.4 90 90Students with Disabilities 80 85.21011
- - - - - - -Limited English Proficiency - -1011
- - - - - - -Economically Disadvantaged - -1011
Performance Targets - Mathematics
Subgroup# of Valid
Test Scores
Baseline
% Proficient
Yearly
Increment
2012-2013
Target (%P)
2011-2012
Target (%P)
2013-2014
Target (%P)
2014-2015
Target (%P)
2015-2016
Target (%P)
2016-2017
Target (%P)
Baseline
year
93.5 - 90 90 90 90 90Schoolwide 450 901011
94.6 - 90 90 90 90 90White 388 901011
- - - - - - -Black - -1011
- - - - - - -Hispanic - -1011
- - - - - - -American Indian - -1011
100 - 90 90 90 90 90Asian 31 901011
- - - - - - -Two or More Races - -1011
66.3 2.8 71.9 74.7 77.5 80.3 83.1Students with Disabilities 80 69.11011
- - - - - - -Limited English Proficiency - -1011
- - - - - - -Economically Disadvantaged - -1011
11/5/2014
Only Includes full year students (Time In School < Year students are removed)
'-' Indicates too few students to determine (N<30)
Title I Accountability System

39-5730-060
ROOSEVELT INTERMEDIATE SCHOOL
WESTFIELD PUBLIC SCHOOLS
CDS CODE :
DISTRICT :
SCHOOL :
ESEA Waiver - Annual Progress Targets
The tables represent the annual proficiency targets, established for this School under ESEA Waiver
Schools and Subgroups could meet expectations either by meeting the statewide proficiency rate of 90 percent, or reaching their individually
determined progress targets. The statewide proficiency rate will be increased to 95 percent in 2015.
Performance Targets - Language Arts Literacy
Subgroup# of Valid
Test Scores
Baseline
% Proficient
Yearly
Increment
2012-2013
Target (%P)
2011-2012
Target (%P)
2013-2014
Target (%P)
2014-2015
Target (%P)
2015-2016
Target (%P)
2016-2017
Target (%P)
Baseline
year
90.8 - 90 90 90 90 90Schoolwide 739 901011
91.9 - 90 90 90 90 90White 690 901011
- - - - - - -Black - -1011
- - - - - - -Hispanic - -1011
- - - - - - -American Indian - -1011
- - - - - - -Asian - -1011
- - - - - - -Two or More Races - -1011
70.9 2.4 75.7 78.1 80.5 82.9 85.3Students with Disabilities 134 73.31011
- - - - - - -Limited English Proficiency - -1011
- - - - - - -Economically Disadvantaged - -1011
Performance Targets - Mathematics
Subgroup# of Valid
Test Scores
Baseline
% Proficient
Yearly
Increment
2012-2013
Target (%P)
2011-2012
Target (%P)
2013-2014
Target (%P)
2014-2015
Target (%P)
2015-2016
Target (%P)
2016-2017
Target (%P)
Baseline
year
90.8 - 90 90 90 90 90Schoolwide 737 901011
91.3 - 90 90 90 90 90White 688 901011
- - - - - - -Black - -1011
- - - - - - -Hispanic - -1011
- - - - - - -American Indian - -1011
- - - - - - -Asian - -1011
- - - - - - -Two or More Races - -1011
67.4 2.7 72.8 75.5 78.2 80.9 83.6Students with Disabilities 132 70.11011
- - - - - - -Limited English Proficiency - -1011
- - - - - - -Economically Disadvantaged - -1011
11/5/2014
Only Includes full year students (Time In School < Year students are removed)
'-' Indicates too few students to determine (N<30)
Title I Accountability System

39-5730-070
THOMAS EDISON INTERMEDIATE SCHOOL
WESTFIELD PUBLIC SCHOOLS
CDS CODE :
DISTRICT :
SCHOOL :
ESEA Waiver - Annual Progress Targets
The tables represent the annual proficiency targets, established for this School under ESEA Waiver
Schools and Subgroups could meet expectations either by meeting the statewide proficiency rate of 90 percent, or reaching their individually
determined progress targets. The statewide proficiency rate will be increased to 95 percent in 2015.
Performance Targets - Language Arts Literacy
Subgroup# of Valid
Test Scores
Baseline
% Proficient
Yearly
Increment
2012-2013
Target (%P)
2011-2012
Target (%P)
2013-2014
Target (%P)
2014-2015
Target (%P)
2015-2016
Target (%P)
2016-2017
Target (%P)
Baseline
year
86.4 1.1 88.6 89.7 90 90 90Schoolwide 744 87.51011
88.1 1 90 90 90 90 90White 596 89.11011
53.1 3.9 60.9 64.8 68.7 72.6 76.5Black 32 571011
73 2.3 77.6 79.9 82.2 84.5 86.8Hispanic 37 75.31011
- - - - - - -American Indian - -1011
96 - 90 90 90 90 90Asian 74 901011
- - - - - - -Two or More Races - -1011
49.5 4.2 57.9 62.1 66.3 70.5 74.7Students with Disabilities 111 53.71011
- - - - - - -Limited English Proficiency - -1011
59.4 3.4 66.2 69.6 73 76.4 79.8Economically Disadvantaged 32 62.81011
Performance Targets - Mathematics
Subgroup# of Valid
Test Scores
Baseline
% Proficient
Yearly
Increment
2012-2013
Target (%P)
2011-2012
Target (%P)
2013-2014
Target (%P)
2014-2015
Target (%P)
2015-2016
Target (%P)
2016-2017
Target (%P)
Baseline
year
88.1 1 90 90 90 90 90Schoolwide 745 89.11011
89.9 .9 90 90 90 90 90White 596 901011
50 4.2 58.4 62.6 66.8 71 75.2Black 32 54.21011
73 2.3 77.6 79.9 82.2 84.5 86.8Hispanic 37 75.31011
- - - - - - -American Indian - -1011
98.6 - 90 90 90 90 90Asian 74 901011
- - - - - - -Two or More Races - -1011
51.3 4.1 59.5 63.6 67.7 71.8 75.9Students with Disabilities 111 55.41011
- - - - - - -Limited English Proficiency - -1011
59.4 3.4 66.2 69.6 73 76.4 79.8Economically Disadvantaged 32 62.81011
11/5/2014
Only Includes full year students (Time In School < Year students are removed)
'-' Indicates too few students to determine (N<30)
Title I Accountability System

39-5730-100
FRANKLIN ELEMENTARY SCHOOL
WESTFIELD PUBLIC SCHOOLS
CDS CODE :
DISTRICT :
SCHOOL :
ESEA Waiver - Annual Progress Targets
The tables represent the annual proficiency targets, established for this School under ESEA Waiver
Schools and Subgroups could meet expectations either by meeting the statewide proficiency rate of 90 percent, or reaching their individually
determined progress targets. The statewide proficiency rate will be increased to 95 percent in 2015.
Performance Targets - Language Arts Literacy
Subgroup# of Valid
Test Scores
Baseline
% Proficient
Yearly
Increment
2012-2013
Target (%P)
2011-2012
Target (%P)
2013-2014
Target (%P)
2014-2015
Target (%P)
2015-2016
Target (%P)
2016-2017
Target (%P)
Baseline
year
88 1 90 90 90 90 90Schoolwide 390 891011
88.5 1 90 90 90 90 90White 364 89.51011
- - - - - - -Black - -1011
- - - - - - -Hispanic - -1011
- - - - - - -American Indian - -1011
- - - - - - -Asian - -1011
- - - - - - -Two or More Races - -1011
62.1 3.2 68.5 71.7 74.9 78.1 81.3Students with Disabilities 66 65.31011
- - - - - - -Limited English Proficiency - -1011
- - - - - - -Economically Disadvantaged - -1011
Performance Targets - Mathematics
Subgroup# of Valid
Test Scores
Baseline
% Proficient
Yearly
Increment
2012-2013
Target (%P)
2011-2012
Target (%P)
2013-2014
Target (%P)
2014-2015
Target (%P)
2015-2016
Target (%P)
2016-2017
Target (%P)
Baseline
year
94.4 - 90 90 90 90 90Schoolwide 390 901011
95 - 90 90 90 90 90White 364 901011
- - - - - - -Black - -1011
- - - - - - -Hispanic - -1011
- - - - - - -American Indian - -1011
- - - - - - -Asian - -1011
- - - - - - -Two or More Races - -1011
78.8 1.8 82.4 84.2 86 87.8 89.6Students with Disabilities 66 80.61011
- - - - - - -Limited English Proficiency - -1011
- - - - - - -Economically Disadvantaged - -1011
11/5/2014
Only Includes full year students (Time In School < Year students are removed)
'-' Indicates too few students to determine (N<30)
Title I Accountability System

39-5730-120
JEFFERSON ELEMENTARY SCHOOL
WESTFIELD PUBLIC SCHOOLS
CDS CODE :
DISTRICT :
SCHOOL :
ESEA Waiver - Annual Progress Targets
The tables represent the annual proficiency targets, established for this School under ESEA Waiver
Schools and Subgroups could meet expectations either by meeting the statewide proficiency rate of 90 percent, or reaching their individually
determined progress targets. The statewide proficiency rate will be increased to 95 percent in 2015.
Performance Targets - Language Arts Literacy
Subgroup# of Valid
Test Scores
Baseline
% Proficient
Yearly
Increment
2012-2013
Target (%P)
2011-2012
Target (%P)
2013-2014
Target (%P)
2014-2015
Target (%P)
2015-2016
Target (%P)
2016-2017
Target (%P)
Baseline
year
81.4 1.6 84.6 86.2 87.8 89.4 90Schoolwide 275 831011
84.4 1.3 87 88.3 89.6 90 90White 217 85.71011
- - - - - - -Black - -1011
- - - - - - -Hispanic - -1011
- - - - - - -American Indian - -1011
81.9 1.5 84.9 86.4 87.9 89.4 90Asian 33 83.41011
- - - - - - -Two or More Races - -1011
65.4 2.9 71.2 74.1 77 79.9 82.8Students with Disabilities 52 68.31011
- - - - - - -Limited English Proficiency - -1011
- - - - - - -Economically Disadvantaged - -1011
Performance Targets - Mathematics
Subgroup# of Valid
Test Scores
Baseline
% Proficient
Yearly
Increment
2012-2013
Target (%P)
2011-2012
Target (%P)
2013-2014
Target (%P)
2014-2015
Target (%P)
2015-2016
Target (%P)
2016-2017
Target (%P)
Baseline
year
93.8 - 90 90 90 90 90Schoolwide 275 901011
96.8 - 90 90 90 90 90White 217 901011
- - - - - - -Black - -1011
- - - - - - -Hispanic - -1011
- - - - - - -American Indian - -1011
97 - 90 90 90 90 90Asian 33 901011
- - - - - - -Two or More Races - -1011
82.7 1.5 85.7 87.2 88.7 90 90Students with Disabilities 52 84.21011
- - - - - - -Limited English Proficiency - -1011
- - - - - - -Economically Disadvantaged - -1011
11/5/2014
Only Includes full year students (Time In School < Year students are removed)
'-' Indicates too few students to determine (N<30)
Title I Accountability System

39-5730-140
MCKINLEY ELEMENTARY SCHOOL
WESTFIELD PUBLIC SCHOOLS
CDS CODE :
DISTRICT :
SCHOOL :
ESEA Waiver - Annual Progress Targets
The tables represent the annual proficiency targets, established for this School under ESEA Waiver
Schools and Subgroups could meet expectations either by meeting the statewide proficiency rate of 90 percent, or reaching their individually
determined progress targets. The statewide proficiency rate will be increased to 95 percent in 2015.
Performance Targets - Language Arts Literacy
Subgroup# of Valid
Test Scores
Baseline
% Proficient
Yearly
Increment
2012-2013
Target (%P)
2011-2012
Target (%P)
2013-2014
Target (%P)
2014-2015
Target (%P)
2015-2016
Target (%P)
2016-2017
Target (%P)
Baseline
year
82.9 1.4 85.7 87.1 88.5 89.9 90Schoolwide 222 84.31011
83.9 1.4 86.7 88.1 89.5 90 90White 186 85.31011
- - - - - - -Black - -1011
- - - - - - -Hispanic - -1011
- - - - - - -American Indian - -1011
- - - - - - -Asian - -1011
- - - - - - -Two or More Races - -1011
65.9 2.9 71.7 74.6 77.5 80.4 83.3Students with Disabilities 44 68.81011
- - - - - - -Limited English Proficiency - -1011
- - - - - - -Economically Disadvantaged - -1011
Performance Targets - Mathematics
Subgroup# of Valid
Test Scores
Baseline
% Proficient
Yearly
Increment
2012-2013
Target (%P)
2011-2012
Target (%P)
2013-2014
Target (%P)
2014-2015
Target (%P)
2015-2016
Target (%P)
2016-2017
Target (%P)
Baseline
year
93.2 - 90 90 90 90 90Schoolwide 222 901011
93.5 - 90 90 90 90 90White 186 901011
- - - - - - -Black - -1011
- - - - - - -Hispanic - -1011
- - - - - - -American Indian - -1011
- - - - - - -Asian - -1011
- - - - - - -Two or More Races - -1011
86.4 1.1 88.6 89.7 90 90 90Students with Disabilities 44 87.51011
- - - - - - -Limited English Proficiency - -1011
- - - - - - -Economically Disadvantaged - -1011
11/5/2014
Only Includes full year students (Time In School < Year students are removed)
'-' Indicates too few students to determine (N<30)
Title I Accountability System

39-5730-145
TAMAQUES ELEMENTARY SCHOOL
WESTFIELD PUBLIC SCHOOLS
CDS CODE :
DISTRICT :
SCHOOL :
ESEA Waiver - Annual Progress Targets
The tables represent the annual proficiency targets, established for this School under ESEA Waiver
Schools and Subgroups could meet expectations either by meeting the statewide proficiency rate of 90 percent, or reaching their individually
determined progress targets. The statewide proficiency rate will be increased to 95 percent in 2015.
Performance Targets - Language Arts Literacy
Subgroup# of Valid
Test Scores
Baseline
% Proficient
Yearly
Increment
2012-2013
Target (%P)
2011-2012
Target (%P)
2013-2014
Target (%P)
2014-2015
Target (%P)
2015-2016
Target (%P)
2016-2017
Target (%P)
Baseline
year
85.4 1.2 87.8 89 90 90 90Schoolwide 253 86.61011
89.5 .9 90 90 90 90 90White 208 901011
- - - - - - -Black - -1011
- - - - - - -Hispanic - -1011
- - - - - - -American Indian - -1011
- - - - - - -Asian - -1011
- - - - - - -Two or More Races - -1011
52.4 4 60.4 64.4 68.4 72.4 76.4Students with Disabilities 42 56.41011
- - - - - - -Limited English Proficiency - -1011
- - - - - - -Economically Disadvantaged - -1011
Performance Targets - Mathematics
Subgroup# of Valid
Test Scores
Baseline
% Proficient
Yearly
Increment
2012-2013
Target (%P)
2011-2012
Target (%P)
2013-2014
Target (%P)
2014-2015
Target (%P)
2015-2016
Target (%P)
2016-2017
Target (%P)
Baseline
year
91.7 - 90 90 90 90 90Schoolwide 253 901011
94.3 - 90 90 90 90 90White 208 901011
- - - - - - -Black - -1011
- - - - - - -Hispanic - -1011
- - - - - - -American Indian - -1011
- - - - - - -Asian - -1011
- - - - - - -Two or More Races - -1011
69 2.6 74.2 76.8 79.4 82 84.6Students with Disabilities 42 71.61011
- - - - - - -Limited English Proficiency - -1011
- - - - - - -Economically Disadvantaged - -1011
11/5/2014
Only Includes full year students (Time In School < Year students are removed)
'-' Indicates too few students to determine (N<30)
Title I Accountability System

39-5730-150
WASHINGTON ELEMENTARY SCHOOL
WESTFIELD PUBLIC SCHOOLS
CDS CODE :
DISTRICT :
SCHOOL :
ESEA Waiver - Annual Progress Targets
The tables represent the annual proficiency targets, established for this School under ESEA Waiver
Schools and Subgroups could meet expectations either by meeting the statewide proficiency rate of 90 percent, or reaching their individually
determined progress targets. The statewide proficiency rate will be increased to 95 percent in 2015.
Performance Targets - Language Arts Literacy
Subgroup# of Valid
Test Scores
Baseline
% Proficient
Yearly
Increment
2012-2013
Target (%P)
2011-2012
Target (%P)
2013-2014
Target (%P)
2014-2015
Target (%P)
2015-2016
Target (%P)
2016-2017
Target (%P)
Baseline
year
80.1 1.7 83.5 85.2 86.9 88.6 90Schoolwide 196 81.81011
79.5 1.7 82.9 84.6 86.3 88 89.7White 180 81.21011
- - - - - - -Black - -1011
- - - - - - -Hispanic - -1011
- - - - - - -American Indian - -1011
- - - - - - -Asian - -1011
- - - - - - -Two or More Races - -1011
51.2 4.1 59.4 63.5 67.6 71.7 75.8Students with Disabilities 41 55.31011
- - - - - - -Limited English Proficiency - -1011
- - - - - - -Economically Disadvantaged - -1011
Performance Targets - Mathematics
Subgroup# of Valid
Test Scores
Baseline
% Proficient
Yearly
Increment
2012-2013
Target (%P)
2011-2012
Target (%P)
2013-2014
Target (%P)
2014-2015
Target (%P)
2015-2016
Target (%P)
2016-2017
Target (%P)
Baseline
year
93.8 - 90 90 90 90 90Schoolwide 196 901011
93.9 - 90 90 90 90 90White 180 901011
- - - - - - -Black - -1011
- - - - - - -Hispanic - -1011
- - - - - - -American Indian - -1011
- - - - - - -Asian - -1011
- - - - - - -Two or More Races - -1011
75.6 2 79.6 81.6 83.6 85.6 87.6Students with Disabilities 41 77.61011
- - - - - - -Limited English Proficiency - -1011
- - - - - - -Economically Disadvantaged - -1011
11/5/2014
Only Includes full year students (Time In School < Year students are removed)
'-' Indicates too few students to determine (N<30)
Title I Accountability System

39-5730-160
WILSON ELEMENTARY SCHOOL
WESTFIELD PUBLIC SCHOOLS
CDS CODE :
DISTRICT :
SCHOOL :
ESEA Waiver - Annual Progress Targets
The tables represent the annual proficiency targets, established for this School under ESEA Waiver
Schools and Subgroups could meet expectations either by meeting the statewide proficiency rate of 90 percent, or reaching their individually
determined progress targets. The statewide proficiency rate will be increased to 95 percent in 2015.
Performance Targets - Language Arts Literacy
Subgroup# of Valid
Test Scores
Baseline
% Proficient
Yearly
Increment
2012-2013
Target (%P)
2011-2012
Target (%P)
2013-2014
Target (%P)
2014-2015
Target (%P)
2015-2016
Target (%P)
2016-2017
Target (%P)
Baseline
year
90.2 - 90 90 90 90 90Schoolwide 257 901011
89.5 .9 90 90 90 90 90White 239 901011
- - - - - - -Black - -1011
- - - - - - -Hispanic - -1011
- - - - - - -American Indian - -1011
- - - - - - -Asian - -1011
- - - - - - -Two or More Races - -1011
81.3 1.6 84.5 86.1 87.7 89.3 90Students with Disabilities 48 82.91011
- - - - - - -Limited English Proficiency - -1011
- - - - - - -Economically Disadvantaged - -1011
Performance Targets - Mathematics
Subgroup# of Valid
Test Scores
Baseline
% Proficient
Yearly
Increment
2012-2013
Target (%P)
2011-2012
Target (%P)
2013-2014
Target (%P)
2014-2015
Target (%P)
2015-2016
Target (%P)
2016-2017
Target (%P)
Baseline
year
96.5 - 90 90 90 90 90Schoolwide 257 901011
96.2 - 90 90 90 90 90White 239 901011
- - - - - - -Black - -1011
- - - - - - -Hispanic - -1011
- - - - - - -American Indian - -1011
- - - - - - -Asian - -1011
- - - - - - -Two or More Races - -1011
91.7 - 90 90 90 90 90Students with Disabilities 48 901011
- - - - - - -Limited English Proficiency - -1011
- - - - - - -Economically Disadvantaged - -1011
11/5/2014
Only Includes full year students (Time In School < Year students are removed)
'-' Indicates too few students to determine (N<30)
Title I Accountability System
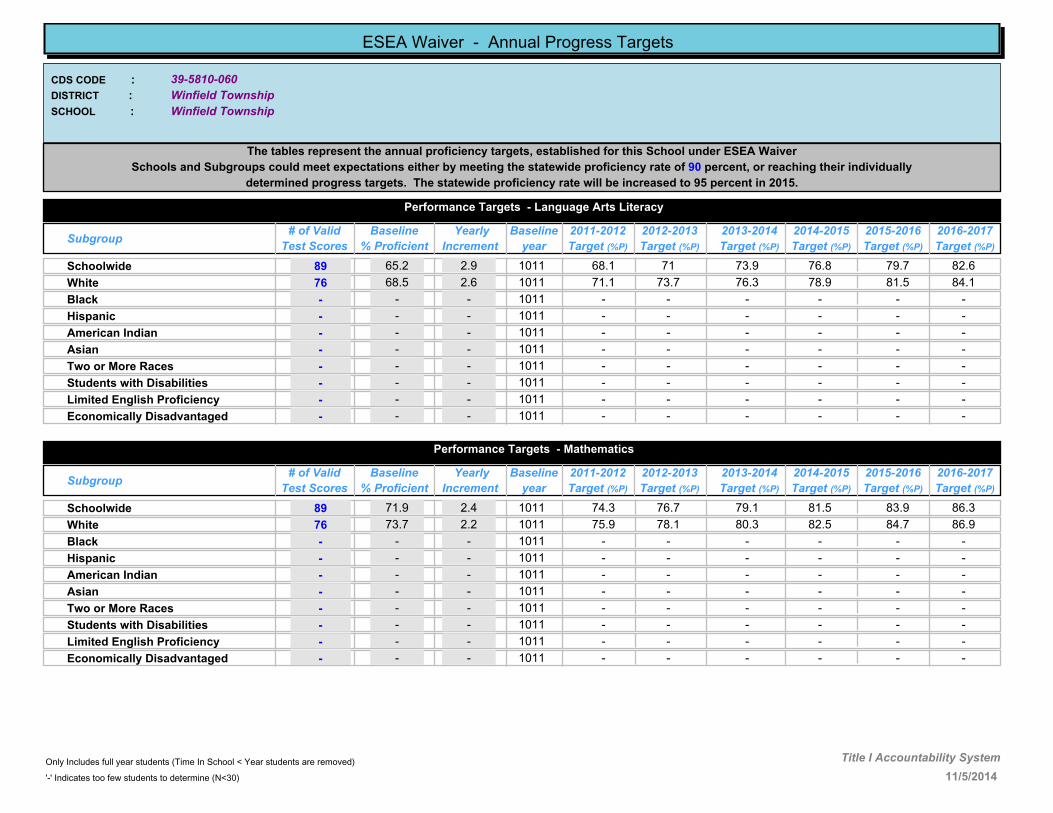
39-5810-060
Winfield Township
Winfield Township
CDS CODE :
DISTRICT :
SCHOOL :
ESEA Waiver - Annual Progress Targets
The tables represent the annual proficiency targets, established for this School under ESEA Waiver
Schools and Subgroups could meet expectations either by meeting the statewide proficiency rate of 90 percent, or reaching their individually
determined progress targets. The statewide proficiency rate will be increased to 95 percent in 2015.
Performance Targets - Language Arts Literacy
Subgroup# of Valid
Test Scores
Baseline
% Proficient
Yearly
Increment
2012-2013
Target (%P)
2011-2012
Target (%P)
2013-2014
Target (%P)
2014-2015
Target (%P)
2015-2016
Target (%P)
2016-2017
Target (%P)
Baseline
year
65.2 2.9 71 73.9 76.8 79.7 82.6Schoolwide 89 68.11011
68.5 2.6 73.7 76.3 78.9 81.5 84.1White 76 71.11011
- - - - - - -Black - -1011
- - - - - - -Hispanic - -1011
- - - - - - -American Indian - -1011
- - - - - - -Asian - -1011
- - - - - - -Two or More Races - -1011
- - - - - - -Students with Disabilities - -1011
- - - - - - -Limited English Proficiency - -1011
- - - - - - -Economically Disadvantaged - -1011
Performance Targets - Mathematics
Subgroup# of Valid
Test Scores
Baseline
% Proficient
Yearly
Increment
2012-2013
Target (%P)
2011-2012
Target (%P)
2013-2014
Target (%P)
2014-2015
Target (%P)
2015-2016
Target (%P)
2016-2017
Target (%P)
Baseline
year
71.9 2.4 76.7 79.1 81.5 83.9 86.3Schoolwide 89 74.31011
73.7 2.2 78.1 80.3 82.5 84.7 86.9White 76 75.91011
- - - - - - -Black - -1011
- - - - - - -Hispanic - -1011
- - - - - - -American Indian - -1011
- - - - - - -Asian - -1011
- - - - - - -Two or More Races - -1011
- - - - - - -Students with Disabilities - -1011
- - - - - - -Limited English Proficiency - -1011
- - - - - - -Economically Disadvantaged - -1011
11/5/2014
Only Includes full year students (Time In School < Year students are removed)
'-' Indicates too few students to determine (N<30)
Title I Accountability System


