
Full Stack Monitoring in a
Container &
Microservices w
orld

Driving
Container A
doption
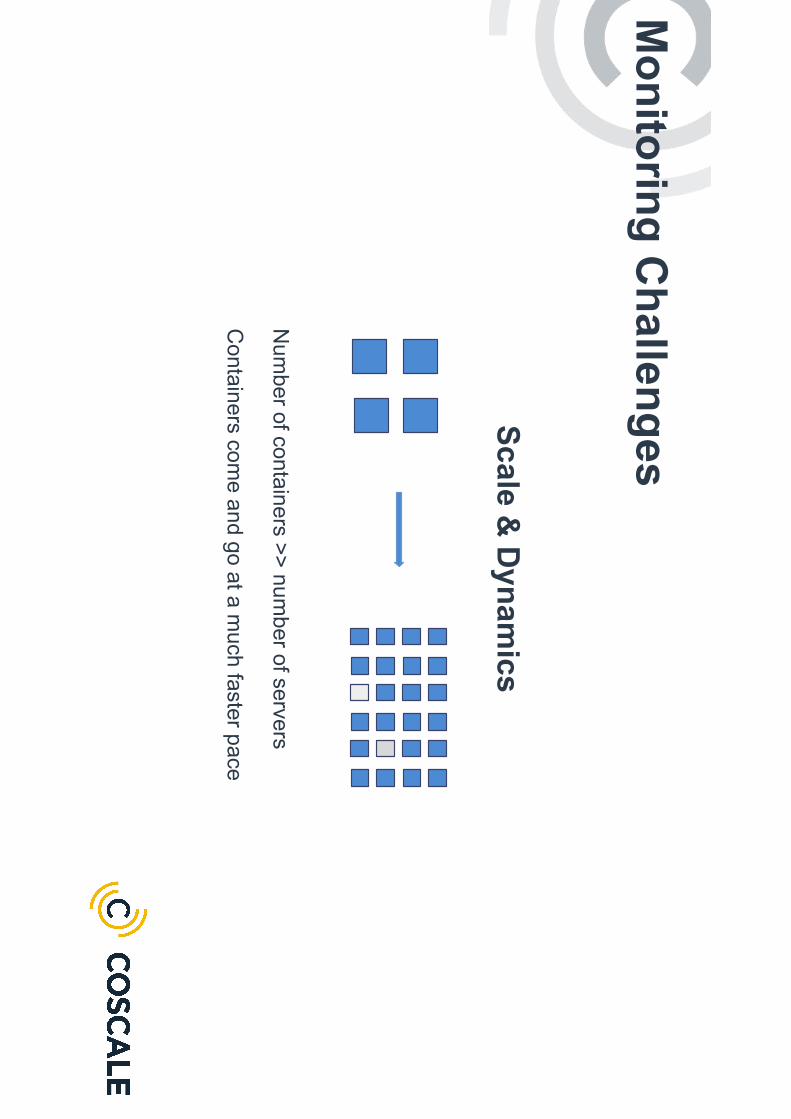
Scale & D
ynamics
Monitoring C
hallenges
Num
ber of containers >> number of servers
Containers com
e and go at a much faster pace

Monitoring C
hallengesTechnology diversity
100s of application technologies
Open-source and proprietary w
orkloads
Overload of m
etrics to monitor and alert on

Monitoring C
hallenges
Com
ponent# M
etrics
OS
100
Application
50
Com
ponent# M
etrics
OS
100
Orchestrator
50
Container
50 per container
Application
50 per container
150 metrics per host
1000+ metrics per host
(average 10 containers per host)
vs
Metrics Explosion

Anom
aly detection: definition

Static alerts
TOD
O : m
ore realistic business examples
!!
!

?seasonality
correlations
changing or dynamic
environment
Static alert limitations

Performance
is key
Keep control of your
production environment
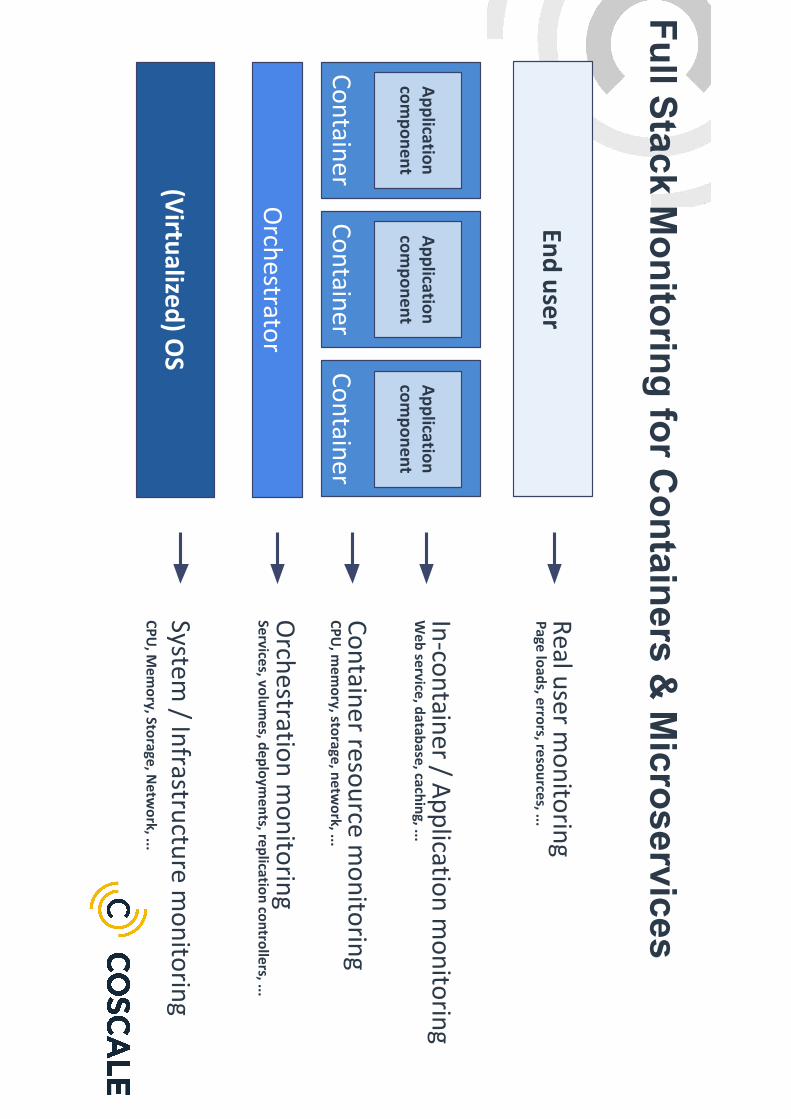
Full Stack Monitoring for C
ontainers & M
icroservices
(Virtu
alized) O
S
End
user
System / In
frastructu
re mo
nito
ring
Co
ntain
er resou
rce mo
nito
ring
Real u
ser mo
nito
ring
Co
ntain
er
Ap
plicatio
nco
mp
on
ent
Co
ntain
er
Ap
plicatio
nco
mp
on
ent
Co
ntain
er
Ap
plicatio
nco
mp
on
ent
CP
U, M
emo
ry, Storage, N
etwo
rk, ...
Orch
estration
mo
nito
ring
Services, volu
mes, d
eplo
ymen
ts, replicatio
n co
ntro
llers, ...
CP
U, m
emo
ry, storage, n
etwo
rk, ...
In-co
ntain
er / Ap
plicatio
n m
on
itorin
gW
eb service, d
atabase, cach
ing, ...
Page lo
ads, erro
rs, resou
rces, ...
Orch
estrator

METR
ICS &
EVENTS
AU
TOM
ATIC A
NO
MA
LY D
ETECTION
MICRO
SERVICES, CON
TAIN
ER, A
ND
CLUSTER M
ON
ITORIN
GIN
TUITIVE CLICK-TH
ROU
GH
DA
SHBO
ARD
SIM
PACT O
N CU
STOM
AN
D
BUSIN
ESS METRICS

Why C
oScale?
An
om
aly detectio
nEven
ts for co
ntext
Full stack + R
UM
+ B
usin
ess metrics
Lightw
eight agen
t Scalab
le Platform
Easy to u
seQ
uick d
eplo
ymen
tSaaS
or o
n-p
remise

Scalable C
oScale A
rchitectu
re
AP
PAP
PAP
P
AP
PAP
PAP
I
AP
PAP
PR
UM
PostgresqlM
etadata
Cassandra
Metric data
ElasticsearchE
vent data
HaProxy
LoadbalancerH
TTPS
handling
Analysis w
orkers
Alerting w
orkers
Data w
orkers
RU
M
Boom
erang.js
Agent
Log & api parsing
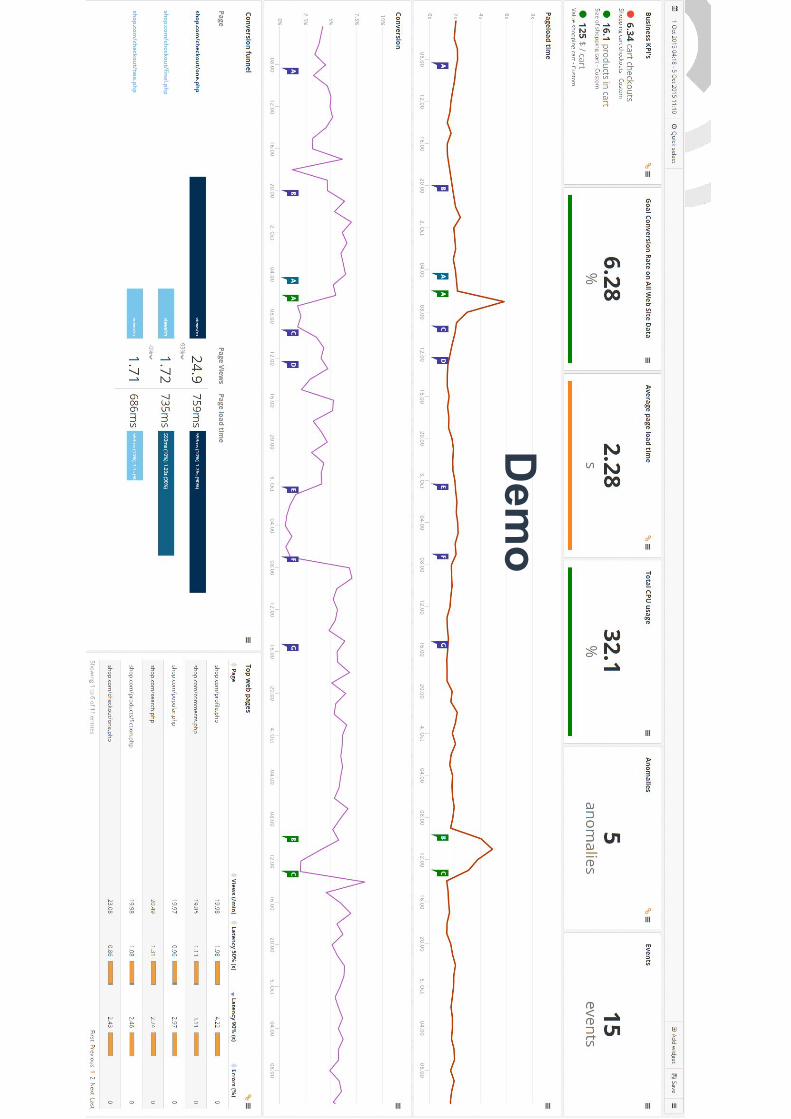
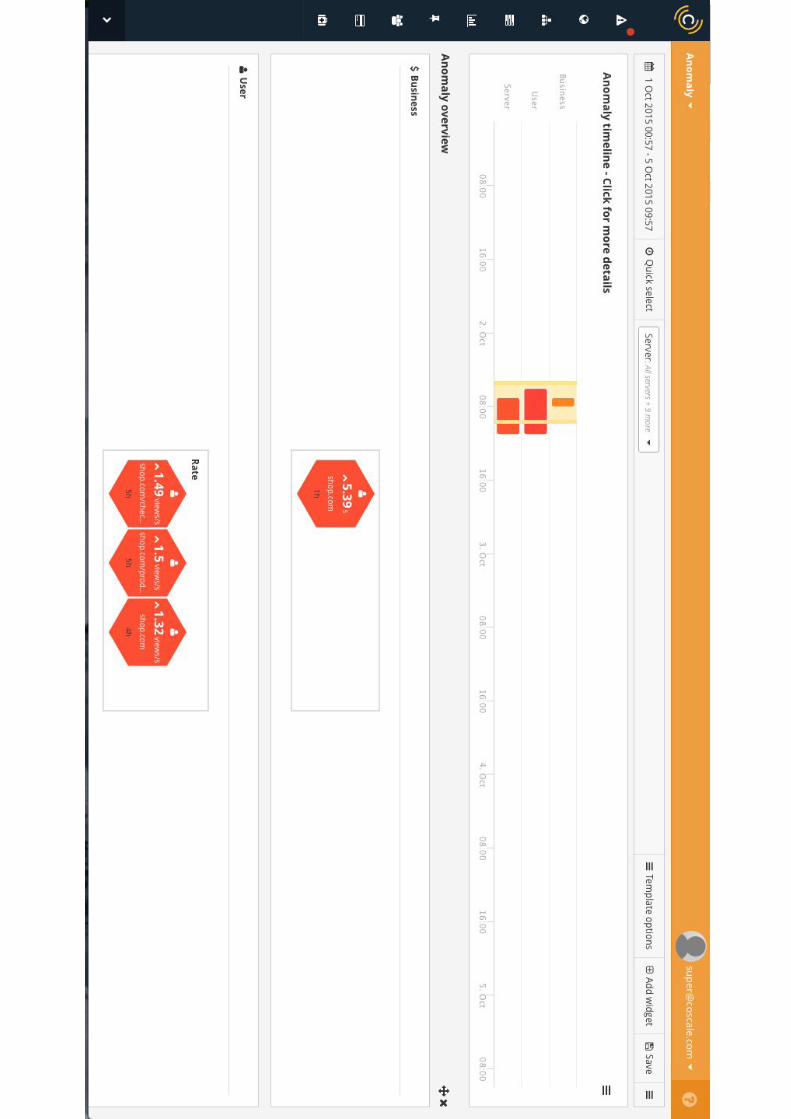
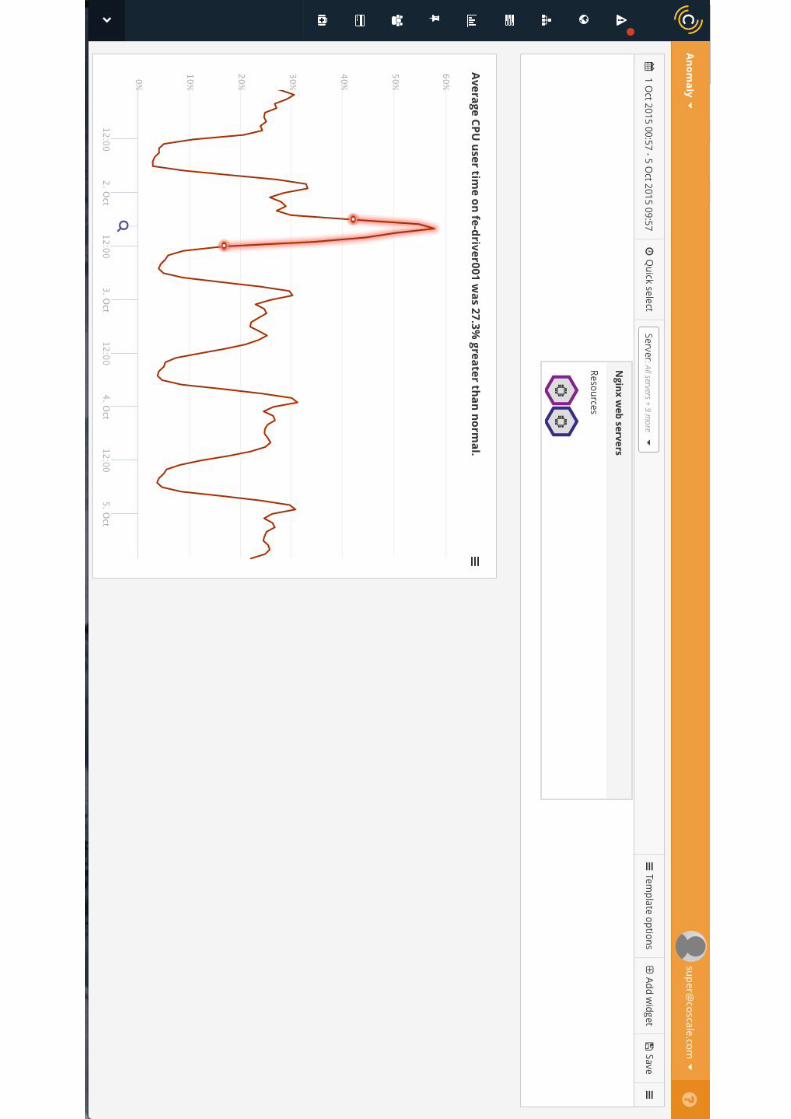
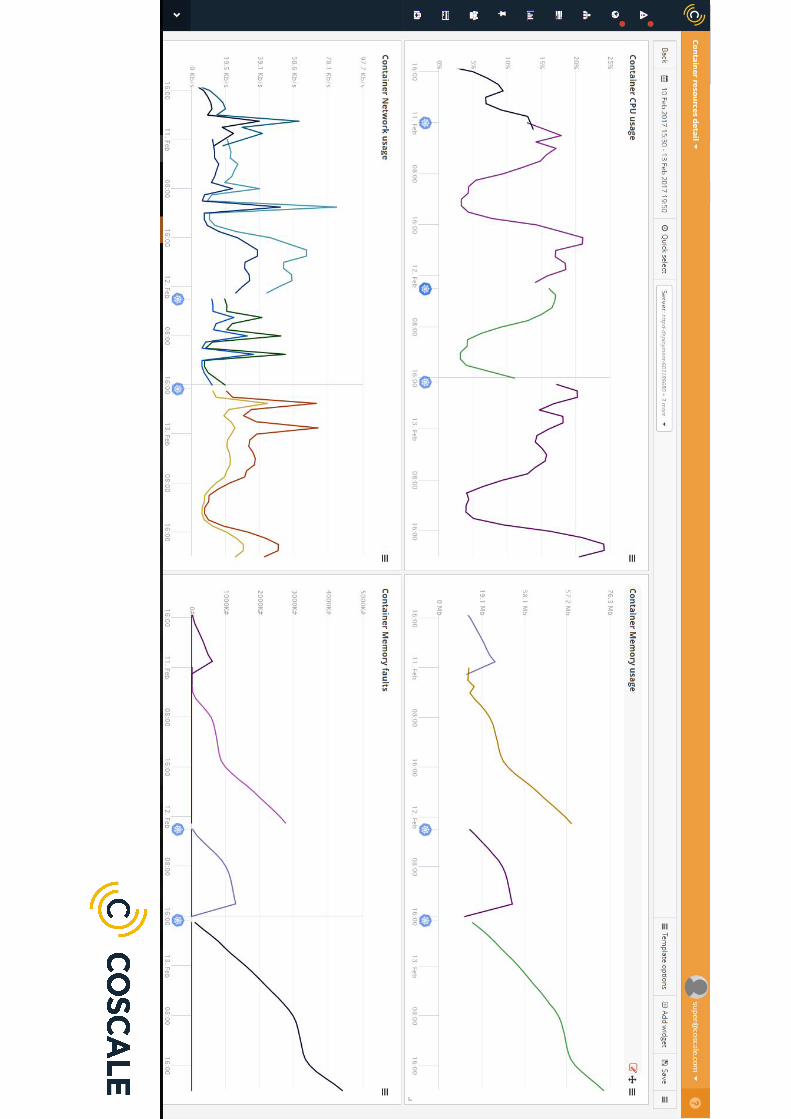
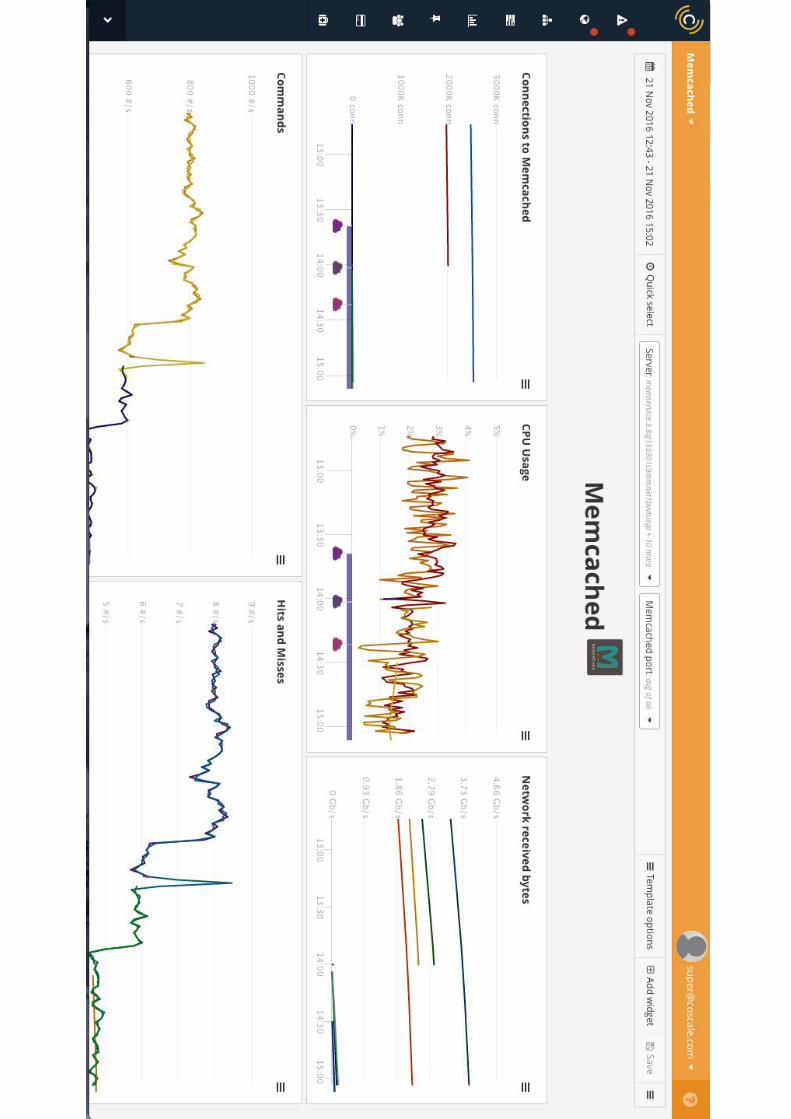
CoScale
Dem
o

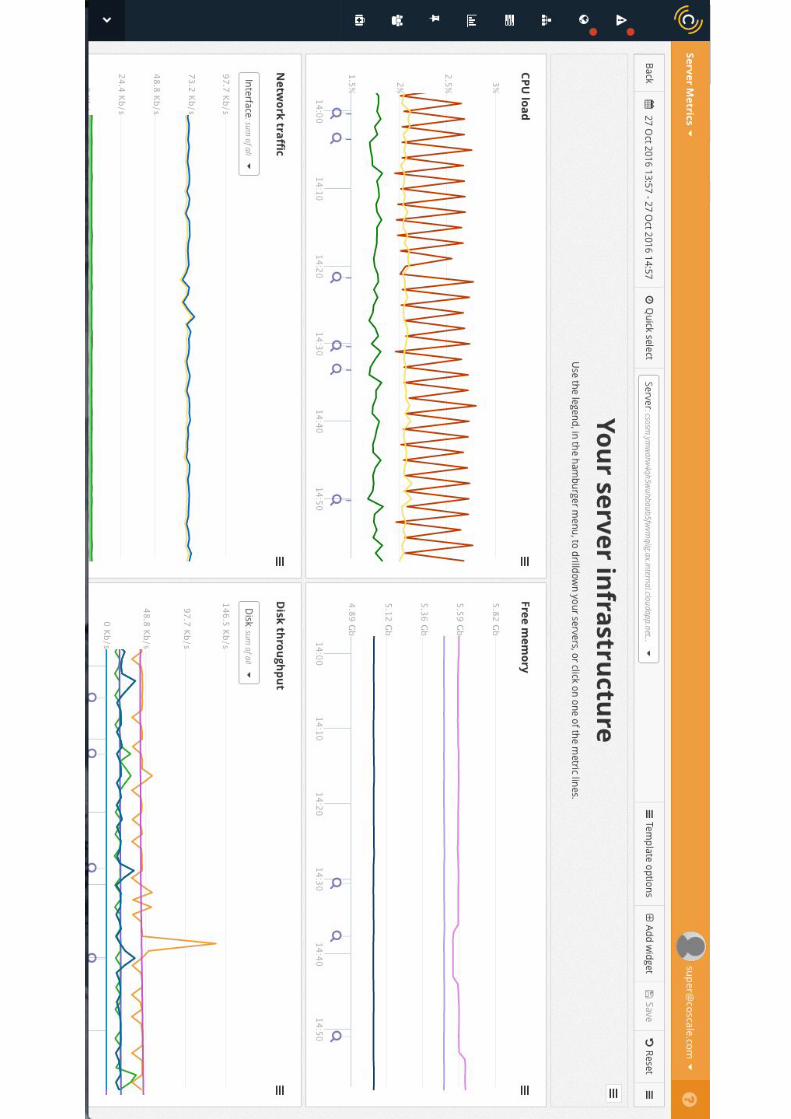
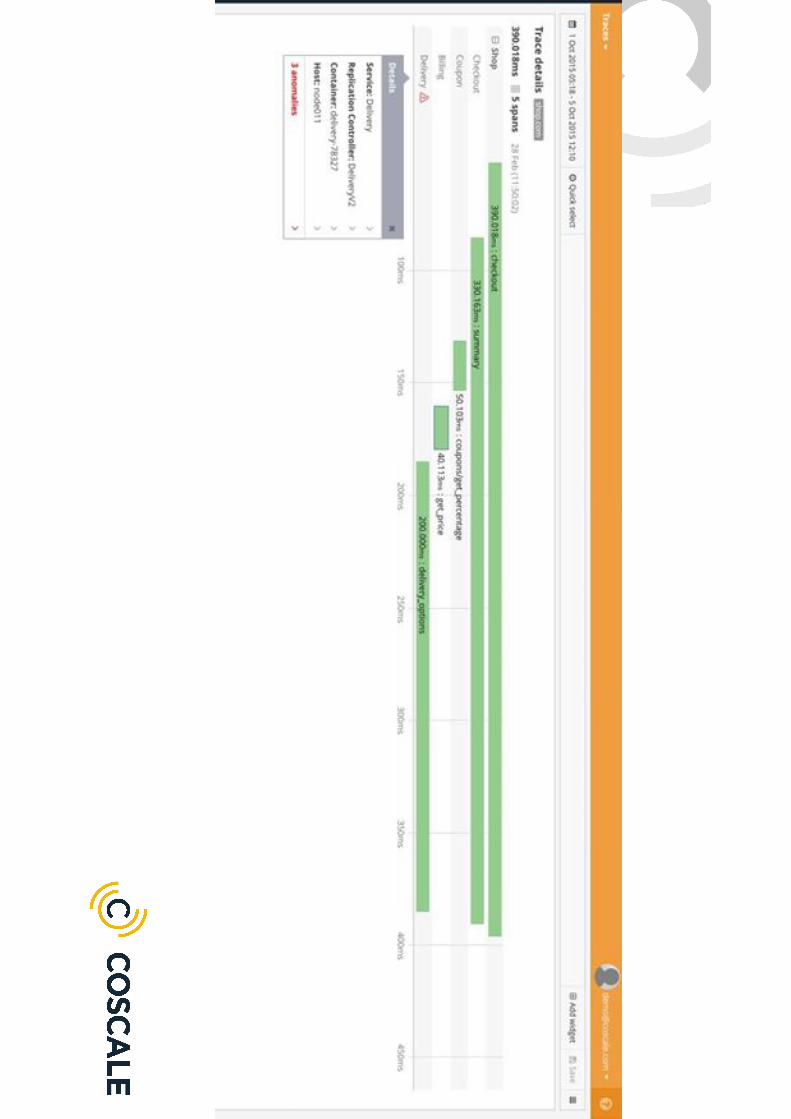
Full Stack Monitoring of
Containers and M
icroservicesD
emo screenshots


●A
PM
tools were designed for m
onolithic applications
●C
ontainers run a large variety of smaller-sized m
icroservices
●C
ontainers are lightweight, so m
onitoring should also be lightweight
●P
utting an agent inside a container is an anti-pattern
●Too m
any dynamic m
etrics to handle with static alerts
Monitoring m
icroservices with traditional A
PM

●E
asy to start with, large com
munity
●Y
ou need comm
ercial support / features to bring it to production
●C
hallenges around managing large production environm
ents
●G
eneric tools, no specific container or cluster visualizations
●N
o Real U
ser Monitoring
●N
o out-of-the-box anomaly detection and predictive analytics
Prometheus
Monitoring m
icroservices with open source tools


