CONSOLIDATION REPORTING GROUP DEPARTMENT
2017 CONSOLIDATED
FINANCIAL
STATEMENTS AND
NOTES
COMPAGNIE DE SAINT-GOBAIN
STATUTORY AUDITORS’ REPORT
ON THE CONSOLIDATED FINANCIAL STATEMENTS
For the year ended December 31, 2017
The Statutory Auditors
PricewaterhouseCoopers Audit
Crystal Park
63, rue de Villiers
92208 Neuilly-sur-Seine Cedex
France
KPMG Audit
Tour Eqho
2, avenue Gambetta
CS 60055
92066 Paris La Défense Cedex
France

PricewaterhouseCoopers Audit
Crystal Park
63, rue de Villiers
92208 Neuilly-sur-Seine Cedex
France
KPMG Audit
Tour Eqho
2, avenue Gambetta
CS 60055
92066 Paris La Défense Cedex
France
STATUTORY AUDITORS' REPORT
ON THE CONSOLIDATED FINANCIAL STATEMENTS
For the year ended December 31, 2017
This is a free translation into English of the Statutory Auditors’ report on the consolidated financial statements issued in
French and is provided solely for the convenience of English-speaking users. This report includes information
specifically required by European regulations and French law, such as information about the appointment of Statutory
Auditors or verification of the management report. This report should be read in conjunction with, and construed in
accordance with, French law and professional auditing standards applicable in France.
Compagnie de Saint-Gobain S.A.
Les Miroirs
18 avenue d’Alsace
92400 Courbevoie
France
To the Shareholders,
1. Opinion
In compliance with the engagement entrusted to us by your Annual General Meetings, we have audited the accompanying
consolidated financial statements of Compagnie de Saint-Gobain for the year ended December 31, 2017.
In our opinion, the consolidated financial statements give a true and fair view of the assets and liabilities and of the
financial position of the Group as of December 31, 2017 and of the results of its operations for the year then ended in
accordance with International Financial Reporting Standards as adopted by the European Union.
The audit opinion expressed above is consistent with our report to the Audit and Risk Committee.
2. Basis for opinion
Audit framework
We conducted our audit in accordance with professional standards applicable in France. We believe that the audit
evidence we have obtained is sufficient and appropriate to provide a basis for our opinion.
Our responsibilities under those standards are further described in the “Responsibilities of the Statutory Auditors relating
to the audit of the consolidated financial statements” section of our report.
Independence
We conducted our audit engagement in compliance with the independence rules applicable to us, for the period from
January 1, 2017 to the date of our report and in particular we did not provide any prohibited non-audit services prohibited
by article 5(1) of Regulation (EU) No 537/2014 or the French Code of Ethics (Code de déontologie) for Statutory
Auditors.

COMPAGNIE DE SAINT-GOBAIN
STATUTORY AUDITORS' REPORT ON THE FINANCIAL STATEMENTS
For the year ended December 31, 2017
Page 2
3. Justification of our assessments – Key audit matters
In accordance with the requirements of articles L.823-9 and R.823-7 of the French Commercial Code (Code de
commerce) relating to the justification of our assessments, we inform you of the key audit matters relating to the risks of
material misstatement that, in our professional judgment, were of most significance in our audit of the consolidated
financial statements of the current period, as well as how we addressed those risks.
These matters were addressed in the context of our audit of the consolidated financial statements as a whole, and in
forming our opinion thereon. We do not provide a separate opinion on specific items of the consolidated financial
statements.
Measurement of provisions for liabilities and litigation
Description of risk
The Group is exposed to various legal risks, including asbestos-related litigation in the United States and Brazil.
As indicated in Note 7 to the consolidated financial statements, provisions amounting to €1,327 million were recognized
at December 31, 2017 for contingent liabilities and litigation. Significant contingent liabilities, whose amount or timing
cannot be estimated with sufficient reliability, are disclosed in the notes to the consolidated financial statements.
Determining and measuring the provisions recognized for contingent liabilities and litigation and assessing the
appropriateness of information provided thereon in the notes to the consolidated financial statements are a key audit
matter given the amounts involved, the importance of estimates and the level of judgment required by Management in
determining those provisions.
How our audit addressed this risk
To obtain an understanding of contingent liabilities and litigation and the related matters of judgment, we held
discussions with Management at Group, Sector and Delegation level as well as at the main subsidiaries. We also
contacted the main law firms involved. We reviewed the minutes of the Board of Directors’ meetings and the Group’s
risk mapping prepared by Management and presented to the Audit and Risk Committee.
For each of the main contingent liabilities and items of litigation identified, we:
- familiarized ourselves with the procedures implemented by Management when measuring the corresponding
provisions and determining the disclosures thereon in the notes to the consolidated financial statements;
- carried out a critical review of internal analyses relating to the probability and possible impact of each liability and
item of litigation, examining the available information relating to the proceedings (correspondence, claims,
judgments, notifications, etc.). We also reviewed the legal or technical opinions of the law firms or external
specialists chosen by Management. We used our professional judgment, with the help of our own specialists where
necessary, to assess the positions adopted by Management, to see where they fell within risk assessment ranges, and
the consistency of those positions over time.
To measure the provisions relating to asbestos-related litigation, based on a statistical model, we verified that the
consistency principle was complied with and checked the relevance and reliability of the source data and calculation
formulas used. Where applicable, we compared the amounts paid with previously recognized provisions in order to form
an opinion on the quality of Management’s estimates.
We assessed the appropriateness of information provided in the notes to the consolidated financial statements regarding
the main items of litigation and contingent liabilities identified.
COMPAGNIE DE SAINT-GOBAIN
STATUTORY AUDITORS' REPORT ON THE FINANCIAL STATEMENTS
For the year ended December 31, 2017
Page 3
Measurement of goodwill, intangible assets and property, plant & equipment
Description of risk
The carrying amounts of goodwill, intangible assets and property, plant & equipment were significant at December 31,
2017, amounting to €10,575 million, €2,603 million and €11,590 million, respectively. The assets may be impaired due to
internal or external factors, including a decline in Group performance, changes in competition, unfavorable market
conditions and changes in legislation or regulations. These changes are likely to have an impact on the Group’s forecast
cash flow and, consequently, the assets’ recoverable amount.
The impairment tests performed by Management using the method described in Note 5.5 to the consolidated financial
statements led to the recognition of impairment losses of €237 million in the fiscal year ended December 31, 2017, as
indicated in Note 3 to the consolidated financial statements.
Determining the assets’ recoverable amount is a key audit matter given the potentially significant nature of impairment,
the importance of estimates and the level of judgment required by Management in measuring impairment loss.
Management exercises judgment when making assumptions regarding future changes in sales (in both volume and value
terms), profitability, investments and the other cash flows required to operate the assets, and when determining an
appropriate discount rate to apply to future cash flows.
How our audit addressed this risk
We familiarized ourselves with the procedures implemented by Group Management for impairment testing, verified that
the consistency principle had been complied with and tested the effectiveness of the controls performed by Management
to ensure the quality and reliability of the impairment testing process and its consistency with budget data and the
strategic plan prepared by General Management and presented to the Board of Directors.
We also assessed the consistency and relevance of Management’s approach to determine the cash generating units for
asset impairment testing. We adapted our audit approach to the risk of impairment loss which varies depending on the
cash generating unit.
Our valuation specialists performed an independent analysis of certain key assumptions used by Management for
impairment testing, in particular the discount rate and average annual growth rate to infinity of future cash flows, by
referring to both external market data and comparable company analyses.
For a selection of cash generating units, we analyzed the consistency of future cash flow projections with regard to past
performance, our knowledge of the business, confirmed by interviews with the Heads of the relevant Sectors and
Activities and, where available, external market or competition data. We carefully reviewed the calculation of the
normalized amount of the terminal cash flows projected until perpetuity. We performed our own sensitivity analyses of
certain key variables of the measurement model to assess the materiality of their potential impact on the recoverable
amount of the most high-risk assets.
We verified that the information provided in the notes to the consolidated financial statements on the measurement of
goodwill, intangible assets and property, plant & equipment, the underlying assumptions and sensitivity analyses was
appropriate.
Planned acquisition of a controlling interest in Sika
Description of risk
As indicated in Notes 2.2, 2.4 and 8.4 to the consolidated financial statements, the Saint-Gobain Group announced, on
December 8, 2014, its plan to acquire a controlling interest in Sika. The project consists in acquiring, for CHF 2.83
billion, Schenker Winkler Holding AG (SWH), which controls Sika and is currently held by the Burkard family.
The transaction is subject to a favorable outcome for SWH in the case it brought before the Swiss courts against Sika’s
Board of Directors’ decision of April 2015 to restrict SWH’s voting rights for certain resolutions at Sika’s General
Shareholders’ Meetings. Saint-Gobain had foreseen the situation by allowing itself the option of extending the term of the
purchase agreement with the Burkard family relating to the disposal of SWH shares. Saint-Gobain exercised its rights,
COMPAGNIE DE SAINT-GOBAIN
STATUTORY AUDITORS' REPORT ON THE FINANCIAL STATEMENTS
For the year ended December 31, 2017
Page 4
extending the agreement several times, with the most recent extension in October 2017 taking its term to June 30, 2018.
At this date, Saint-Gobain will once again have the option of extending the term of the agreement until December 31,
2018.
The Group’s commitment to acquire SWH shares exposes it to currency risk, which was hedged using financial
instruments measured in accordance with IAS 39. Assessing the transaction’s likelihood of occurrence, which affects the
accounting treatment of the hedging transaction, is a key audit matter, as the Group’s Senior Management considers that
the acquisition is “highly probable”.
How our audit addressed this risk
To obtain a clear understanding of this transaction, including its terms, conditions and likelihood of occurrence, we
analyzed the various contracts between the Group and the Burkard family, and contacted the main Group departments
involved. We also reviewed the Board of Directors’ minutes relating to the planned transaction, court rulings, and the
attorneys’ opinions on the procedure underway before the Swiss courts.
We also analyzed the currency hedges taken out by the Group in connection with its commitment to acquire the SWH
shares and checked the appropriateness of their accounting treatment in accordance with IFRS.
We assessed the appropriateness of information provided in the notes to the consolidated financial statements regarding
the planned acquisition and its accounting impact.
Measurement of supplier discounts in the Building Distribution Sector
Description of risk
The Building Distribution Sector accounted for 46% of the Group’s sales for fiscal year 2017. The profitability of the
Sector’s business activities varies depending on supplier discounts received, which lower the cost price of negotiated
goods. As indicated in Notes 3.1.2, 3.5.1 and 3.5.2 to the consolidated financial statements, the recognition of supplier
discounts specifically affects “Cost of sales” in the consolidated income statement as well as “Inventories” and “Other
receivables” in the consolidated balance sheet.
Given the diversity of products and suppliers in the Building Distribution Sector, supplier contracts are numerous,
complex and varied. They give rise to several supplier discounts, some of which are subject to volume conditions or
targets, granted at various Sector levels (local, regional, national and international). Measuring accrued supplier discounts
is a key audit matter as it is complex and requires significant estimates made by Management. Determining the amounts
of supplier discounts to be taken into account when measuring inventories for brands in the Building Distribution Sector
is also a significant audit matter.
How our audit addressed this risk
We gained an understanding of the process used by the Sales and Finance Departments of the Building Distribution
Sector to estimate accrued supplier discounts at the reporting date and performed tests on the effectiveness of the controls
performed by Management.
We also assessed, on a multi-year basis, the consistency of the supplier discount rates obtained per brand and country,
confirmed by interviews with the Sales and Finance Departments at various levels within the Sector. Using a sample, we
remeasured the supplier discounts obtained based on the terms and conditions of the relevant agreements and volumes
purchased. We also retrospectively cross-checked cash and credit notes received after the reporting date against the
receivables recognized and asked a sample of suppliers to directly confirm the discount amounts due for the fiscal year.
With regard to the accuracy of the supplier discounts taken into account when measuring inventories for brands in the
Building Distribution Sector, we verified that the accounting methods were applied consistently across all the brands.
Using sampling techniques, we cross-checked the measurement of certain inventory items against supplier invoices,
estimating supplier discounts granted subsequently.
We verified that the information provided in the notes to the consolidated financial statements regarding supplier
discounts was appropriate.
COMPAGNIE DE SAINT-GOBAIN
STATUTORY AUDITORS' REPORT ON THE FINANCIAL STATEMENTS
For the year ended December 31, 2017
Page 5
4. Verification of the information pertaining to the Group presented in the management report
As required by law we have also verified in accordance with professional standards applicable in France the information
pertaining to the Group presented in the management report of the Board of Directors.
We have no matters to report as to its fair presentation and its consistency with the consolidated financial statements.
5. Report on other legal and regulatory requirements
Appointment of the Statutory Auditors
We were appointed Statutory Auditors of Compagnie de Saint-Gobain by the Annual General Meetings of June 26, 1986
for Petiteau Scacchi and subsequently PricewaterhouseCoopers Audit and June 10, 2004 for KPMG Audit.
As of December 31, 2017, PricewaterhouseCoopers Audit and KPMG Audit were in the thirty-second year and the
fourteenth year of total uninterrupted engagement, respectively.
6. Responsibilities of management and those charged with governance for the consolidated financial
statements
Management is responsible for the preparing consolidated financial statements presenting a true and fair view in
accordance with International Financial Reporting Standards as adopted by the European Union, and for implementing
the internal control procedures it deems necessary for the preparation of consolidated financial statements free of material
misstatement, whether due to fraud or error.
In preparing the consolidated financial statements, management is responsible for assessing the Company's ability to
continue as a going concern, disclosing, as applicable, matters related to going concern and using the going concern basis
of accounting, unless it expects to liquidate the Company or to cease operations.
The Audit and Risk Committee is responsible for monitoring the financial reporting process and the effectiveness of
internal control and risk management systems, as well as, where applicable, any internal audit systems, relating to
accounting and financial reporting procedures.
The consolidated financial statements were approved by the Board of Directors.
7. Responsibilities of the Statutory Auditors relating to the audit of the consolidated financial statements
Objective and audit approach
Our role is to issue a report on the consolidated financial statements. Our objective is to obtain reasonable assurance
about whether the consolidated financial statements as a whole are free of material misstatement. Reasonable assurance is
a high level of assurance, but is not a guarantee that an audit conducted in accordance with professional standards will
always detect a material misstatement when it exists. Misstatements can arise from fraud or error and are considered
material if, individually or in the aggregate, they could reasonably be expected to influence the economic decisions of
users taken on the basis of these consolidated financial statements.
As specified in article L.823-10-1 of the French Commercial Code (Code de commerce), our audit does not include
assurance on the viability or quality of management of the Company.

COMPAGNIE DE SAINT-GOBAIN
STATUTORY AUDITORS' REPORT ON THE FINANCIAL STATEMENTS
For the year ended December 31, 2017
Page 6
As part of an audit conducted in accordance with professional standards applicable in France, the Statutory Auditor
exercises professional judgment throughout the audit. He also:
identifies and assesses the risks of material misstatement of the consolidated financial statements, whether due to
fraud or error, designs and performs audit procedures responsive to those risks, and obtains audit evidence
considered to be sufficient and appropriate to provide a basis for his opinion. The risk of not detecting a material
misstatement resulting from fraud is higher than for one resulting from error, as fraud may involve collusion,
forgery, intentional omissions, misrepresentations, or the override of internal control;
obtains an understanding of internal control relevant to the audit in order to design audit procedures that are
appropriate in the circumstances, but not for the purpose of expressing an opinion on the effectiveness of the
internal control;
evaluates the appropriateness of accounting policies used and the reasonableness of accounting estimates made by
management and the related disclosures in the notes to the consolidated financial statements;
assesses the appropriateness of management’s use of the going concern basis of accounting and, based on the audit
evidence obtained, whether a material uncertainty exists related to events or conditions that may cast significant
doubt on the Company’s ability to continue as a going concern. This assessment is based on the audit evidence
obtained up to the date of the audit report. However, future events or conditions may cause the Company to cease
to continue as a going concern. If the Statutory Auditor concludes that a material uncertainty exists, he is required
to draw attention in the audit report to the related disclosures in the consolidated financial statements or, if such
disclosures are not provided or are inadequate, to issue a qualified opinion or a disclaimer of opinion;
evaluates the overall presentation of the consolidated financial statements and assesses whether these statements
represent the underlying transactions and events in a manner that achieves fair presentation;
Obtains sufficient appropriate audit evidence regarding the financial information of the entities or business
activities within the Group to express an opinion on the consolidated financial statements. The Statutory Auditor is
responsible for the direction, supervision and performance of the audit of the consolidated financial statements and
for the opinion expressed on these consolidated financial statements.
Report to the Audit and Risk Committee
We submit a report to the Audit and Risk Committee which includes in particular a description of the scope of the audit
and the audit program implemented, as well as the results of our audit. We also report any significant deficiencies in
internal control that we have identified regarding the accounting and financial reporting procedures.
Our report to the Audit and Risk Committee includes the risks of material misstatement that, in our professional
judgment, were of most significance in the audit of the consolidated financial statements and which constitute the key
audit matters that we are required to describe in this report.
We also provide the Audit and Risk Committee with the declaration provided for in article 6 of
Regulation (EU) No 537/2014, confirming our independence within the meaning of the rules applicable in France, as
defined in particular in articles L.822-10 to L.822-14 of the French Commercial Code (Code de commerce) and in the
French Code of Ethics for Statutory Auditors (Code de déontologie). Where appropriate, we discuss any risks to our
independence and the related safeguard measures with the Audit and Risk Committee.

COMPAGNIE DE SAINT-GOBAIN
STATUTORY AUDITORS' REPORT ON THE FINANCIAL STATEMENTS
For the year ended December 31, 2017
Page 7
Neuilly-sur-Seine and Paris La Défense, February 22, 2018
The Statutory Auditors
PricewaterhouseCoopers Audit
Edouard Sattler Cécile Saint-Martin
KPMG Audit
Department of KPMG S.A .
Jean-Paul Thill Bertrand Pruvost
Consolidated financial statements of the Saint-Gobain Group
1
CONTENTS
2017 CONSOLIDATED FINANCIAL STATEMENTS ............................................................................... 3
CONSOLIDATED BALANCE SHEET ..................................................................................................................... 3
CONSOLIDATED INCOME STATEMENT ............................................................................................................. 4
CONSOLIDATED STATEMENT OF RECOGNIZED INCOME AND EXPENSE ......................................................... 5
CONSOLIDATED STATEMENT OF CASH FLOWS ................................................................................................ 6
CONSOLIDATED STATEMENT OF CHANGES IN EQUITY .................................................................................. 7
NOTES TO THE CONSOLIDATED FINANCIAL STATEMENTS ......................................................... 8
NOTE 1 Accounting principles and policies .................................................................................................. 8
1.1. Standards applied ........................................................................................................................ 8
1.2. Estimates and assumptions ......................................................................................................... 9
NOTE 2 Scope of consolidation ..................................................................................................................... 10
2.1. Accounting principles related to consolidation ....................................................................... 10
2.2. Changes in Group structure ...................................................................................................... 12
2.3. Changes in the number of consolidated companies ................................................................ 13
2.4. Off-balance sheet commitments related to companies within the scope of
consolidation ............................................................................................................................... 13
NOTE 3 Information concerning the Group’s operating activities ........................................................... 13
3.1. Income statement items ............................................................................................................. 13
3.2. Segment information ................................................................................................................. 15
3.3. Information by geographic area ............................................................................................... 16
3.4. Performance indicators ............................................................................................................. 17
3.5. Working capital .......................................................................................................................... 18
3.6. Off-balance sheet commitments related to operating activities ............................................. 21
NOTE 4 Employees, personnel expenses and employee benefit obligations ............................................. 23
4.1. Employees of fully consolidated companies ............................................................................. 23
4.2. Management compensation ....................................................................................................... 23
4.3. Provisions for pensions and other employee benefits ............................................................. 23
4.4. Share-based payments ............................................................................................................... 29
NOTE 5 Intangible assets and property, plant and equipment .................................................................. 33
5.1. Goodwill ...................................................................................................................................... 33
5.2. Other intangible assets............................................................................................................... 34
5.3. Property, plant and equipment ................................................................................................. 35
5.4. Finance leases and operating leases .......................................................................................... 37
5.5. Impairment review ..................................................................................................................... 37
NOTE 6 Investments in equity-accounted companies and other non-current assets ............................... 39
6.1. Changes in investments in equity-accounted companies ........................................................ 39
6.2. Transactions with equity-accounted companies – related-parties ......................................... 40
6.3. Transactions with key shareholders ......................................................................................... 40
6.4. Other non-current assets ........................................................................................................... 41
NOTE 7 Other current and non-current liabilities and provisions, contingent liabilities and
litigation ...................................................................................................................................... 41
7.1. Provisions for other liabilities and charges .............................................................................. 42
7.2. Contingent liabilities and litigation .......................................................................................... 43
NOTE 8 Financing and financial instruments ............................................................................................. 47
8.1. Risk factors: financial risks ....................................................................................................... 47

Consolidated financial statements of the Saint-Gobain Group
2
8.2. Net financial expense ................................................................................................................. 50
8.3. Net debt ....................................................................................................................................... 50
8.4. Financial instruments ................................................................................................................ 54
8.5. Financial assets and liabilities ................................................................................................... 57
NOTE 9 Shareholders’ equity and earnings per share ............................................................................... 58
9.1. Equity .......................................................................................................................................... 58
9.2. Earnings per share ..................................................................................................................... 58
NOTE 10 Taxes ............................................................................................................................................... 59
10.1. Income taxes ............................................................................................................................... 59
10.2. Deferred tax ................................................................................................................................ 60
10.3. Tax loss carry-forwards............................................................................................................. 61
NOTE 11 Subsequent events ......................................................................................................................... 61
NOTE 12 Fees paid to the Statutory Auditors ............................................................................................. 61
NOTE 13 Principal consolidated companies ................................................................................................ 62
Consolidated financial statements of the Saint-Gobain Group
3
2017 CONSOLIDATED FINANCIAL STATEMENTS
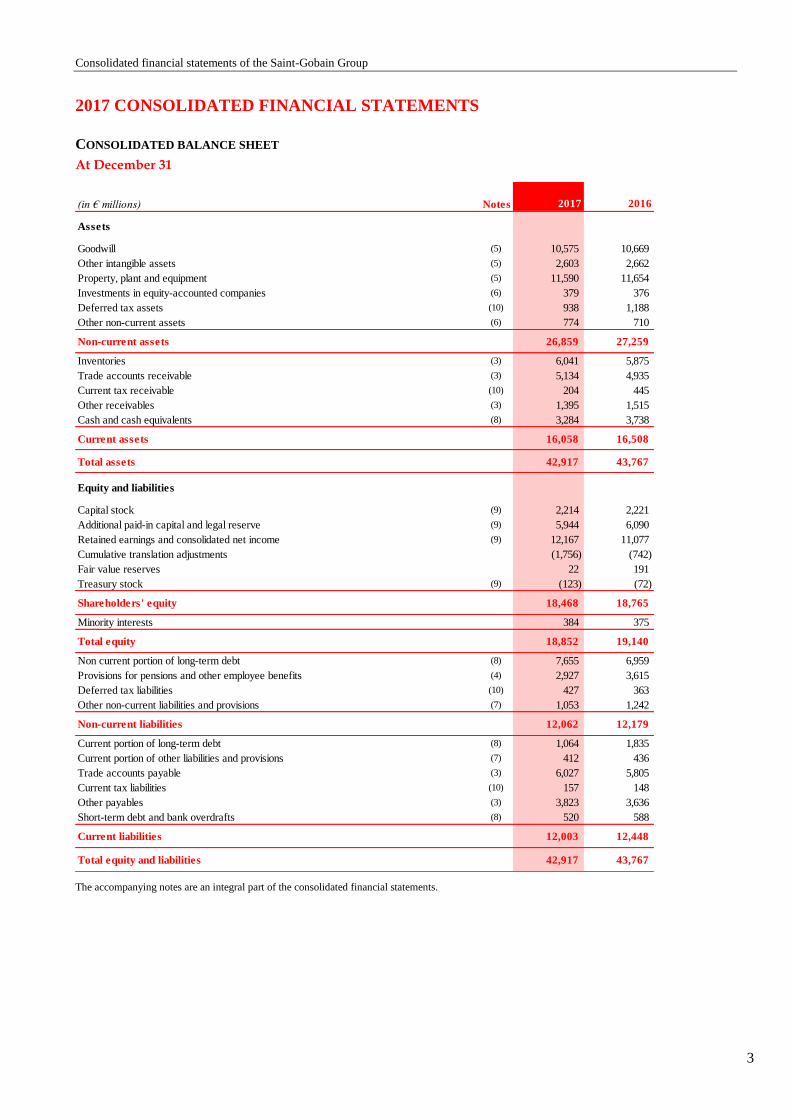
CONSOLIDATED BALANCE SHEET
At December 31
The accompanying notes are an integral part of the consolidated financial statements.
(in € millions) Notes 2017 2016
Assets
Goodwill (5) 10,575 10,669
Other intangible assets (5) 2,603 2,662
Property, plant and equipment (5) 11,590 11,654
Investments in equity-accounted companies (6) 379 376
Deferred tax assets (10) 938 1,188
Other non-current assets (6) 774 710
Non-current assets 26,859 27,259
Inventories (3) 6,041 5,875
Trade accounts receivable (3) 5,134 4,935
Current tax receivable (10) 204 445
Other receivables (3) 1,395 1,515
Cash and cash equivalents (8) 3,284 3,738
Current assets 16,058 16,508
Total assets 42,917 43,767
Equity and liabilities
Capital stock (9) 2,214 2,221
Additional paid-in capital and legal reserve (9) 5,944 6,090
Retained earnings and consolidated net income (9) 12,167 11,077
Cumulative translation adjustments (1,756) (742)
Fair value reserves 22 191
Treasury stock (9) (123) (72)
Shareholders' equity 18,468 18,765
Minority interests 384 375
Total equity 18,852 19,140
Non current portion of long-term debt (8) 7,655 6,959
Provisions for pensions and other employee benefits (4) 2,927 3,615
Deferred tax liabilities (10) 427 363
Other non-current liabilities and provisions (7) 1,053 1,242
Non-current liabilities 12,062 12,179
Current portion of long-term debt (8) 1,064 1,835
Current portion of other liabilities and provisions (7) 412 436
Trade accounts payable (3) 6,027 5,805
Current tax liabilities (10) 157 148
Other payables (3) 3,823 3,636
Short-term debt and bank overdrafts (8) 520 588
Current liabilities 12,003 12,448
Total equity and liabilities 42,917 43,767
Consolidated financial statements of the Saint-Gobain Group
4
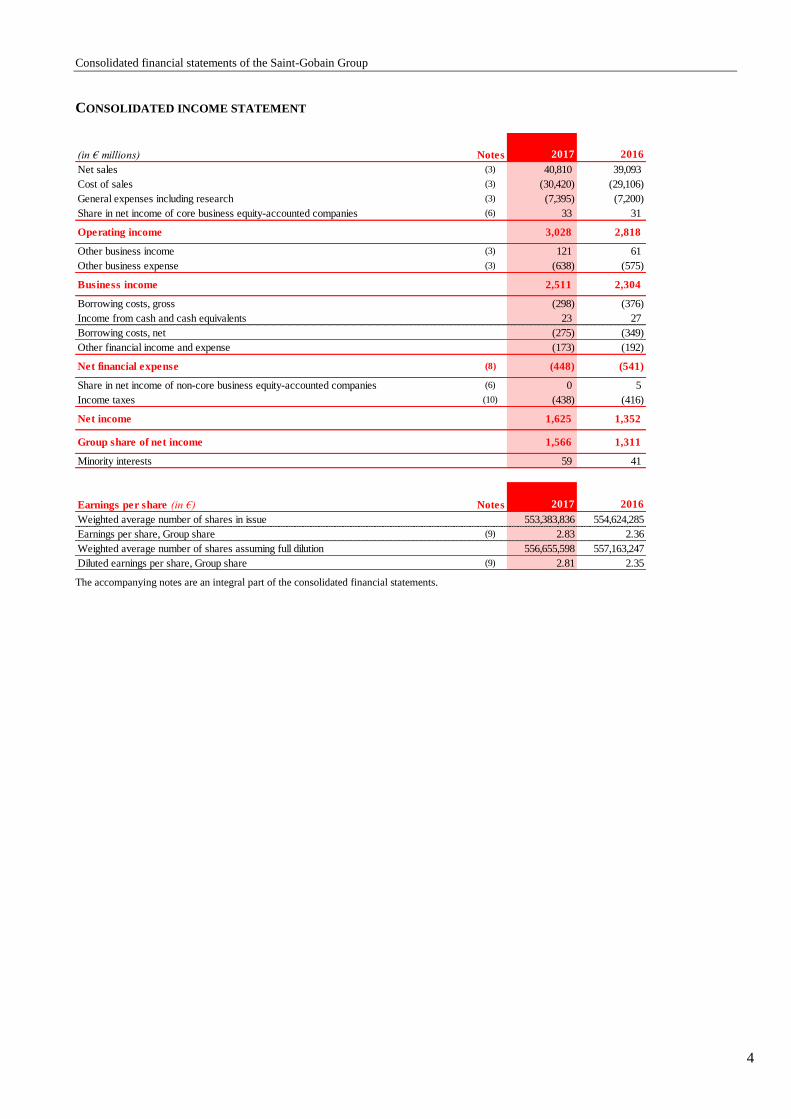
CONSOLIDATED INCOME STATEMENT
The accompanying notes are an integral part of the consolidated financial statements.
(in € millions) Notes 2017 2016
Net sales (3) 40,810 39,093
Cost of sales (3) (30,420) (29,106)
General expenses including research (3) (7,395) (7,200)
Share in net income of core business equity-accounted companies (6) 33 31
Operating income 3,028 2,818
Other business income (3) 121 61
Other business expense (3) (638) (575)
Business income 2,511 2,304
Borrowing costs, gross (298) (376)
Income from cash and cash equivalents 23 27
Borrowing costs, net (275) (349)
Other financial income and expense (173) (192)
Net financial expense (8) (448) (541)
Share in net income of non-core business equity-accounted companies (6) 0 5
Income taxes (10) (438) (416)
Net income 1,625 1,352
Group share of net income 1,566 1,311
Minority interests 59 41
Earnings per share (in €) Notes 2017 2016
Weighted average number of shares in issue 553,383,836 554,624,285
Earnings per share, Group share (9) 2.83 2.36
Weighted average number of shares assuming full dilution 556,655,598 557,163,247
Diluted earnings per share, Group share (9) 2.81 2.35
Consolidated financial statements of the Saint-Gobain Group
5
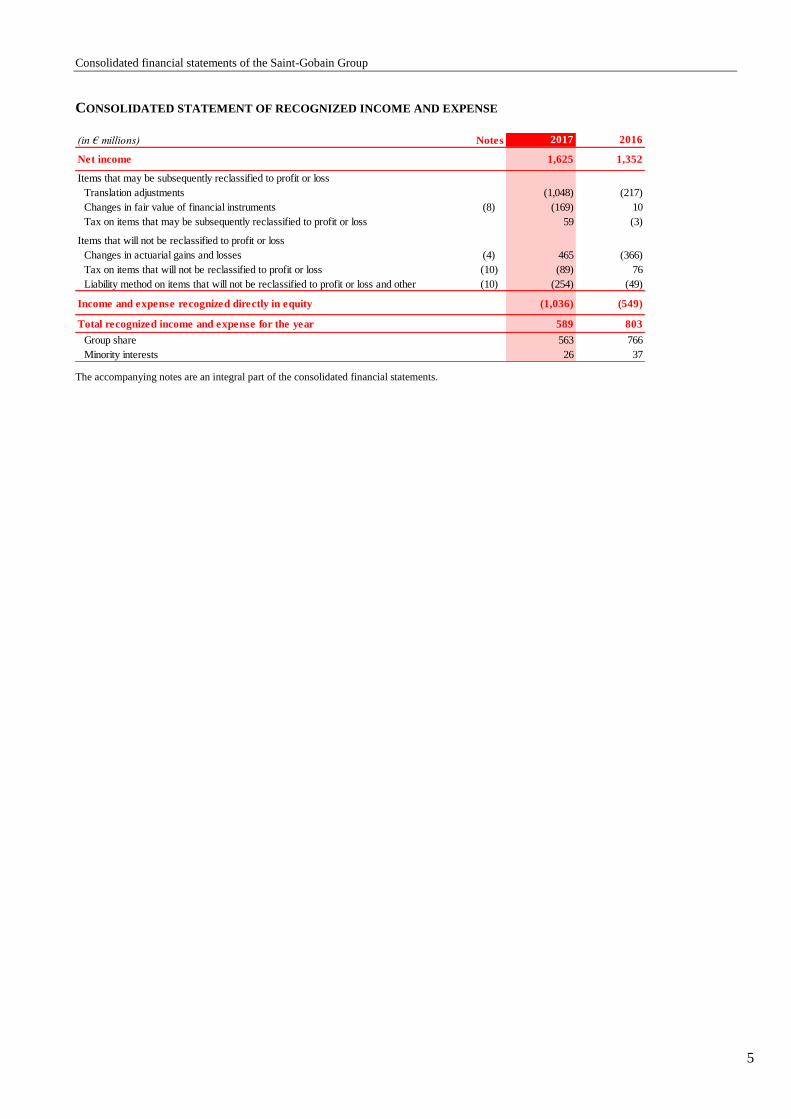
CONSOLIDATED STATEMENT OF RECOGNIZED INCOME AND EXPENSE
The accompanying notes are an integral part of the consolidated financial statements.
(in € millions) Notes 2017 2016
Net income 1,625 1,352
Items that may be subsequently reclassified to profit or loss
Translation adjustments (1,048) (217)
Changes in fair value of financial instruments (8) (169) 10
Tax on items that may be subsequently reclassified to profit or loss 59 (3)
Items that will not be reclassified to profit or loss
Changes in actuarial gains and losses (4) 465 (366)
Tax on items that will not be reclassified to profit or loss (10) (89) 76
Liability method on items that will not be reclassified to profit or loss and other (10) (254) (49)
Income and expense recognized directly in equity (1,036) (549)
Total recognized income and expense for the year 589 803
Group share 563 766
Minority interests 26 37

Consolidated financial statements of the Saint-Gobain Group
6
CONSOLIDATED STATEMENT OF CASH FLOWS
(a) Please refer to the consolidated statement of changes in equity.
(b) Including bond premiums, prepaid interest and issue costs.
In 2017, income tax paid amounted to €209 million (2016: €460 million) and interest paid net of interest received totaled €308 million (2016:
€369 million).
The accompanying notes are an integral part of the consolidated financial statements.
(in € millions) Notes 2017 2016
Group share of net income 1,566 1,311
Minority interests in net income (a) 59 41
Share in net income of equity-accounted companies, net of dividends received (6) (13) (20)
Depreciation, amortization and impairment of assets (3) 1,442 1,369
Gains and losses on disposals of assets (3) (46) 2
Unrealized gains and losses arising from changes in fair value and share-based payments 16 42
Changes in inventory (3) (348) (173)
Changes in trade accounts receivable and payable, and other accounts receivable and payable (3) 139 72
Changes in tax receivable and payable (3) 236 (135)
Changes in deferred taxes and provisions for other liabilities and charges (4)(7)(10) (286) (544)
Net cash from operating activities 2,765 1,965
Acquisitions of property, plant and equipment [2017: (1,538), 2016: (1,370)] and intangible assets (5) (1,722) (1,521)
Increase (decrease) in amounts due to suppliers of fixed assets (3) 99 24
Acquisitions of shares in consolidated companies [2017: (553), 2016: (252)], net of cash acquired (492) (233)
Acquisitions of other investments (6) (84) (110)
Increase in investment-related liabilities (7) 17 15
Decrease in investment-related liabilities (7) (42) (9)
Investments (2,224) (1,834)
Disposals of property, plant and equipment and intangible assets (5) 183 85
Disposals of shares in consolidated companies, net of cash divested 4 49
Disposals of other investments (6) 1 1
Divestments 188 135
Increase in loans, deposits and short-term loans (6) (183) (144)
Decrease in loans, deposits and short-term loans (6) 186 150
Changes in loans, deposits and short-term loans 3 6
Net cash FROM (used in) investment and divestment activities (2,033) (1,693)
Issues of capital stock (a) 187 149
(Increase) decrease in treasury stock (a) (406) (418)
Dividends paid (a) (693) (680)
Transactions with shareholders of the parent company (912) (949)
Minority interests' share in capital increases of subsidiaries (a) 7 2
Acquisitions of minority interests without gain of control (6) (4) 0
Disposals of minority interests without loss of control (6) 25 0
Changes in investment-related liabilities following the exercise of put options of minority shareholders (7) (36) (13)
Dividends paid to minority shareholders of consolidated subsidiaries (a) (27) (31)
Change in dividends payable (11) 0
Transactions with minority interests (46) (42)
Increase (decrease) in bank overdrafts and other short-term debt (107) (138)
Increase in long-term debt (b)(8) 1,603 1,322
Decrease in long-term debt (b)(8) (1,655) (2,104)
Changes in gross debt (159) (920)
Net cash from (used in) financing activities (1,117) (1,911)
Increase (decrease) in cash and cash equivalents (385) (1,639)
Net effect of exchange rate changes on cash and cash equivalents (70) (1)
Net effect of changes in fair value on cash and cash equivalents 1 (2)
Cash and cash equivalents at beginning of year 3,738 5,380
Cash and cash equivalents at end of year 3,284 3,738
Consolidated financial statements of the Saint-Gobain Group
7
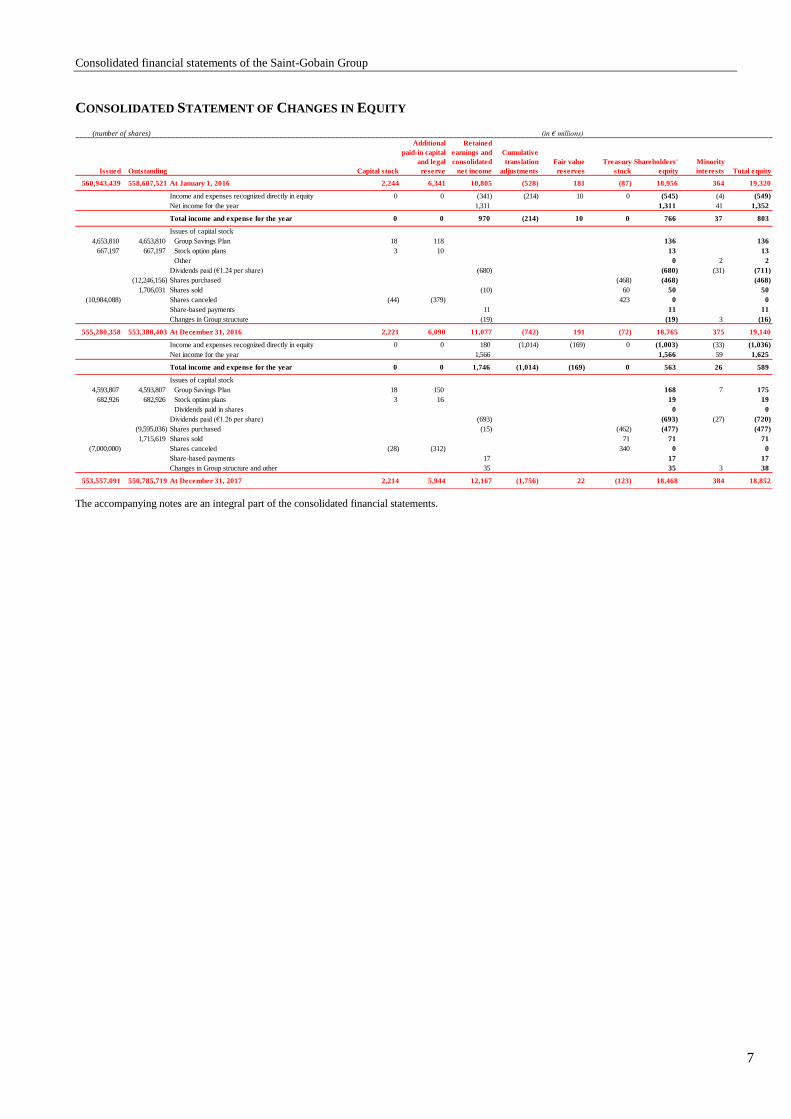
CONSOLIDATED STATEMENT OF CHANGES IN EQUITY
The accompanying notes are an integral part of the consolidated financial statements.
Issued Outstanding Capital stock
Additional
paid-in capital
and legal
reserve
Retained
earnings and
consolidated
net income
Cumulative
translation
adjustments
Fair value
reserves
Treasury
stock
Shareholders'
equity
Minority
interests Total equity
560,943,439 558,607,521 At January 1, 2016 2,244 6,341 10,805 (528) 181 (87) 18,956 364 19,320
Income and expenses recognized directly in equity 0 0 (341) (214) 10 0 (545) (4) (549)
Net income for the year 1,311 1,311 41 1,352
Total income and expense for the year 0 0 970 (214) 10 0 766 37 803
Issues of capital stock
4,653,810 4,653,810 Group Savings Plan 18 118 136 136
667,197 667,197 Stock option plans 3 10 13 13
Other 0 2 2
Dividends paid (€1.24 per share) (680) (680) (31) (711)
(12,246,156) Shares purchased (468) (468) (468)
1,706,031 Shares sold (10) 60 50 50
(10,984,088) Shares canceled (44) (379) 423 0 0
Share-based payments 11 11 11
Changes in Group structure (19) (19) 3 (16)
555,280,358 553,388,403 At December 31, 2016 2,221 6,090 11,077 (742) 191 (72) 18,765 375 19,140
Income and expenses recognized directly in equity 0 0 180 (1,014) (169) 0 (1,003) (33) (1,036)
Net income for the year 1,566 1,566 59 1,625
Total income and expense for the year 0 0 1,746 (1,014) (169) 0 563 26 589
Issues of capital stock
4,593,807 4,593,807 Group Savings Plan 18 150 168 7 175
682,926 682,926 Stock option plans 3 16 19 19
Dividends paid in shares 0 0
Dividends paid (€1.26 per share) (693) (693) (27) (720)
(9,595,036) Shares purchased (15) (462) (477) (477)
1,715,619 Shares sold 71 71 71
(7,000,000) Shares canceled (28) (312) 340 0 0
Share-based payments 17 17 17
Changes in Group structure and other 35 35 3 38
553,557,091 550,785,719 At December 31, 2017 2,214 5,944 12,167 (1,756) 22 (123) 18,468 384 18,852
(number of shares) (in € millions)
Consolidated financial statements of the Saint-Gobain Group
8
NOTES TO THE CONSOLIDATED FINANCIAL STATEMENTS
The consolidated financial statements reflect the accounting position of Compagnie de Saint-Gobain and its subsidiaries
("the Group"), as well as the Group’s interests in associate companies and joint ventures. They are expressed in euros rounded to
the nearest million.
These consolidated financial statements were adopted on February 22, 2018 by the Board of Directors and will be
submitted to the Shareholders' Meeting of June 7, 2018 for approval.
Accounting principles and policies are highlighted in red.
NOTE 1 ACCOUNTING PRINCIPLES AND POLICIES
The accounting policies applied are consistent with those used to prepare the financial statements for the year ended
December 31, 2016, except for the application of the new standards and interpretations described below. The consolidated
financial statements have been prepared using the historical cost convention, except for certain assets and liabilities that have
been measured using the fair value model as explained in these notes.
1.1. Standards applied
The consolidated financial statements have been prepared in accordance with the International Financial Reporting
Standards (IFRS) and interpretations adopted for use in the European Union at December 31, 2017. These financial
statements have also been prepared in accordance with the IFRS issued by the International Accounting Standards Board
(IASB), with the exception of those standards not yet adopted by the European Union, namely IAS 40, “Transfers of
Investment Property” amendments, IFRIC 22, “Foreign Currency Transactions and Advance Consideration”, IFRIC 23,
“Uncertainty over Income Tax Treatments” and the Annual Improvements to IFRS (2014-2016 Cycle). Standards adopted
by the European Union may be consulted on the European Commission website, at
http://ec.europa.eu/finance/accounting/ias/index_en.htm.
1.1.1. Standards, interpretations and amendments to existing standards applicable for reporting periods beginning on or
after January 1, 2017
The standards, interpretations and amendments to published standards applicable for the first time for reporting periods
beginning on or after January 1, 2017 do not have a material impact on the consolidated financial statements:
amendment to IAS 7, “Disclosure Initiative”;
amendment to IAS 12, “Recognition of Deferred Tax Assets for Unrealized Losses”.
1.1.2. Standards, interpretations and amendments to existing standards available for early adoption in reporting periods
beginning on or after January 1, 2017
The new standards, interpretations and amendments to existing standards applicable to accounting periods starting on or
after January 1, 2018 were not early adopted by the Group at December 31, 2017.
IFRS 9, “Financial Instruments” is applicable as of January 1, 2018 and supersedes IAS 39, “Financial Instruments:
Recognition and Measurement”. It sets out new principles for recognizing financial instruments and in particular requires
entities to apply an impairment model for trade accounts receivable based on expected losses.
The Group carried out a project to determine the impacts of IFRS 9 on the financial statements of its different entities and to
bring its trade accounts receivable impairment policy into line with the impairment rules under the new standard as from
January 1, 2018.
At December 31, 2017, the additional impairment recognized against trade accounts receivable in accordance with IFRS 9
is not material with regard to the trade receivables line.

Consolidated financial statements of the Saint-Gobain Group
9
IFRS 15,” Revenue from Contracts with Customers” supersedes IAS 18 “Revenue” and IAS 11, “Construction Contracts”,
along with the related interpretations. IFRS 15 is applicable as of January 1, 2018 and sets out new principles for
recognizing revenue and for identifying performance obligations contained in contracts.
Saint-Gobain develops innovative products and solutions for the construction and renovation industries, promoting
buildings that are energy efficient, comfortable, healthy and esthetically superior, while at the same time protecting natural
resources.
Owing to the nature of its business activities, Saint-Gobain did not expect IFRS 15 to have a material impact on its financial
statements.
However, it launched an in-depth review which was rolled down to all Group entities with the aim of identifying and
quantifying the potential impacts of the standard. This review confirmed that IFRS 15 would not have a material impact on
the Group’s consolidated financial statements.
IFRS 16, “Leases” was identified by the Group from the outset as potentially having a material impact on its financial
statements, particularly due to the scale of the Building Distribution Sector.
The Group launched a series of IFRS 16 projects very early on (as soon as the standard was first published at the beginning
of 2016), including awareness-raising, training initiatives and technical documentation. Following an impact assessment
carried out in 2016, data was compiled on all leases and Group employees were confronted with the issues raised by the
standard. This process also helped the Group in its decision to adopt the ‘full retrospective’ transition method.
In 2017, a central project team was set up consisting of experienced employees along with external consultants. The project
team relies on a network of IFRS 16 officers in the Group’s General Delegations and regularly reports on progress to the
steering committee, comprising key finance personnel from the Group’s Business Sectors.
In 2017 Saint-Gobain also selected the software it would use in this respect. Training sessions and data preparation
workshops were organized, helping to guarantee a smooth transition to IFRS 16 at January 1, 2019.
Amendments to IFRS 4, “Applying IFRS 9 with IFRS 4”.
1.2. Estimates and assumptions
The preparation of consolidated financial statements in compliance with IFRS requires management to make estimates and
assumptions that affect the amounts of assets and liabilities reported in the balance sheet and the disclosure of contingent
assets and liabilities in the notes to the financial statements, as well as the reported amounts of income and expenses during
the period. These estimates and assumptions are based on past experience and on various other factors seen in the
prevailing economic and financial environment, which makes it difficult to predict future business performance. Actual
amounts may differ from those obtained through the use of these estimates and assumptions.
The main estimates and assumptions described in these notes concern the measurement of employee benefit obligations and
share-based payment (Note 4 "Employees, personnel expenses and employee benefit obligations"), asset impairment tests
(Note 5 "Intangible assets and property, plant and equipment"), provisions for other liabilities and charges (Note 7 "Other
current and non-current liabilities and provisions, contingent liabilities and litigation"), the measurement of financial
instruments (Note 8 "Financing and financial instruments"), and taxes (Note 10 "Taxes").

Consolidated financial statements of the Saint-Gobain Group
10
NOTE 2 SCOPE OF CONSOLIDATION
2.1. Accounting principles related to consolidation
The Group’s consolidated financial statements include the accounts of Compagnie de Saint-Gobain and of all companies
controlled by the Group, as well as those of jointly controlled companies and companies over which the Group exercises
significant influence.
2.1.1. Consolidation methods
a) Full consolidation
Companies over which the Group exercises exclusive control, either directly or indirectly, are fully consolidated.
b) Joint arrangements
Joint arrangements that meet the definition of joint ventures are accounted for by the equity method. Balance sheet and
income statement items relating to joint arrangements that meet the definition of joint operations are consolidated line-by-
line based on the amount actually contributed by the Group.
c) Equity accounting
Companies over which the Group directly or indirectly exercises significant influence are accounted for by the equity
method.
The Group’s share of the income of equity-accounted companies is shown on two separate lines of the income statement.
The income of equity-accounted companies whose main business activity is in keeping with the Group’s core operational
business is presented in business income under “Share in net income of core business equity-accounted companies” while
the income of other equity-accounted companies is shown under “Share in net income of non-core business equity-
accounted companies” in pre-tax income.
2.1.2. Business combinations
a) Step acquisitions and partial disposals
When the Group acquires control of an entity in which it already holds an equity interest, the transaction is treated as a step
acquisition (an acquisition in stages), as follows: (i) as a disposal of the previously-held interest, with recognition of any
resulting gain or loss in the consolidated financial statements, and (ii) as an acquisition of all of the shares, with recognition
of the corresponding goodwill on the entire interest (previous and new acquisitions).
When the Group disposes of a portion of an equity interest leading to the loss of control (but retains a minority interest), the
transaction is also treated as both a disposal and an acquisition, as follows: (i) as a disposal of the entire interest, with
recognition of any resulting gain or loss in the consolidated financial statements, and (ii) as an acquisition of a minority
interest, measured at fair value.
b) Potential voting rights and share purchase commitments
Potential voting rights conferred by call options on minority interests are taken into account in determining whether the
Group exclusively controls an entity only when the Group has control.
When calculating its percentage interest in controlled companies, the Group considers the impact of cross put and call
options on minority interests in the companies concerned. This approach gives rise to the recognition in the financial
statements of an investment-related liability, included within other provisions and non-current liabilities, corresponding to
the present value of the estimated exercise price of the put option, with a corresponding reduction in minority interests and
equity attributable to equity holders of the parent. Any subsequent changes in the fair value of the liability are recognized
by adjusting equity.

Consolidated financial statements of the Saint-Gobain Group
11
c) Minority interests
Under IFRS 10, minority interests (referred to as “non-controlling interests” in IFRS 3R) are considered as a shareholder
category (single economic entity approach). As a result, changes in minority interests with no loss of control continue to be
recorded in the statement of changes in equity and have no impact on the income statement or balance sheet, except for
changes in cash and cash equivalents.
2.1.3. Non-current assets and liabilities held for sale – Discontinued operations
Assets and liabilities that are immediately available for sale and for which a sale is highly probable are classified as non-
current assets and liabilities held for sale. When several assets are held for sale in a single transaction, they are accounted
for as a disposal group, which also includes any liabilities directly associated with those assets. The assets or disposal
groups held for sale are measured at the lower of carrying amount and fair value less costs to sell.
Depreciation/amortization ceases when non-current assets are classified as held for sale. Non-current assets and liabilities
held for sale are presented separately on two lines of the consolidated balance sheet, and income and expenses continue to
be recognized in the consolidated income statement on a line-by-line basis. At the end of each reporting period, the value of
the assets and liabilities held for sale is reviewed to determine whether any provision adjustments should be recorded due to
a change in their fair value less costs to sell.
An operation is classified as discontinued when it represents a separate major line of business for the Group, and when the
criteria for classification as an asset held for sale have been met, or when the Group has sold the asset. Discontinued
operations are reported on a single line in the Group’s income statement. This line shows the after-tax net income from
discontinued operations until the date of disposal and the gains or losses net of taxes realized on the disposals of these
operations. In addition, cash flows generated by the discontinued operations are reported, by type of operation, on a
separate line in the consolidated statement of cash flows for the relevant periods.
2.1.4. Intragroup transactions
All intragroup balances and transactions are eliminated in consolidation.
2.1.5. Translation of the financial statements of foreign companies
The consolidated financial statements are presented in euros, which is Compagnie de Saint-Gobain’s functional and
presentation currency.
Assets and liabilities of subsidiaries outside the Eurozone are translated into euros at the closing exchange rate, while
income and expense items are translated using the average exchange rate for the period, except in the case of significant
exchange rate volatility.
The Group’s share of any translation gains or losses is included in equity under “Cumulative translation adjustments” until
the assets or liabilities and all foreign operations to which they relate are sold or liquidated. In this case, these translation
differences are either taken to the income statement, if the transaction results in a loss of control, or recognized directly in
the statement of changes in equity, if the change in minority interests does not result in a loss of control.
2.1.6. Foreign currency transactions
Expenses and income from operations in currencies other than the Company’s functional currency are translated at the
exchange rates prevailing at the transaction date. Assets and liabilities denominated in foreign currencies are translated at
the closing rate and any exchange differences are recorded in the income statement. However, exchange differences
relating to loans and borrowings between consolidated Group companies are recorded in equity net of tax under
“Cumulative translation adjustments”, as they are in substance an integral part of the net investment in a foreign subsidiary.
Consolidated financial statements of the Saint-Gobain Group
12
2.2. Changes in Group structure
Significant changes in the Group’s structure during 2017 and 2016 are presented below and a list of the main consolidated
companies at December 31, 2017 is provided in Note 13 "Principal consolidated companies".
2.2.1. Transactions carried out in 2017
In 2017, Saint-Gobain continued to actively manage its portfolio of businesses, fully in line with its strategy. Various
operations were completed in order to strengthen the Group’s profile in high added-value businesses and growing markets.
Further, Saint-Gobain is continuing its plan to acquire a controlling interest in Sika, a leading construction chemicals
company. The plan consists of the acquisition by Saint-Gobain, for 2.83 billion Swiss francs (an amount fully hedged in
euros), of Schenker Winkler Holding AG (SWH) which, at December 31, 2017, held 16.97% of Sika’s share capital and
52.92% of its voting rights. After the acquisition, the Saint-Gobain Group will be able to incorporate Sika into its financial
statements by global consolidation, with a positive impact on net income from year one.
Completion of this deal is subject to clearance from the competent anti-trust authorities, which were all obtained on
December 2, 2015. Further, on August 27, 2015, the Swiss Federal Administrative Court confirmed in last resort the
validity of the opt-out clause provided in Sika’s bylaws exempting Saint-Gobain from launching a mandatory takeover bid
following the acquisition of the SWH shares.
Saint-Gobain and its Board of Directors took note of the ruling handed down by the Cantonal Court of Zug on October 28,
2016, which rejected SWH’s demand for cancellation of the resolutions passed by the Annual General Meeting of Sika on
April 14, 2015 for which SWH's voting rights had been restricted, and SWH’s appeal to the Zug Supreme Court against
this decision. Saint-Gobain had anticipated these decisions by being granted the option to extend the term of the purchase
agreement with the Burkard family relating to the disposal of SWH shares. Saint-Gobain exercised its rights, extending the
agreement several times, with the most recent extension, in October 2017, taking its term to June 30, 2018. As of this date,
Saint-Gobain will once again have the option to extend the term of the agreement until December 31, 2018. These
successive extensions of the purchase agreement demonstrate the alignment between the Burkard family and Saint-Gobain
and their unwavering determination.
With the support of its Board of Directors, Saint-Gobain is determined to successfully complete its plan to acquire a
controlling stake in Sika, an industrial project that will create value for all stakeholders. Pending the decision of the Zug
Supreme Court, which is expected early 2018, Saint-Gobain is confident that the Swiss justice system will restore SWH’s
ownership rights.
2.2.2. Transactions carried out in 2016
In 2016, Saint-Gobain continued to actively manage its portfolio of businesses, fully in line with its strategy. Various
operations were completed in order to strengthen the Group’s profile in high added-value businesses and growing markets.
Consolidated financial statements of the Saint-Gobain Group
13
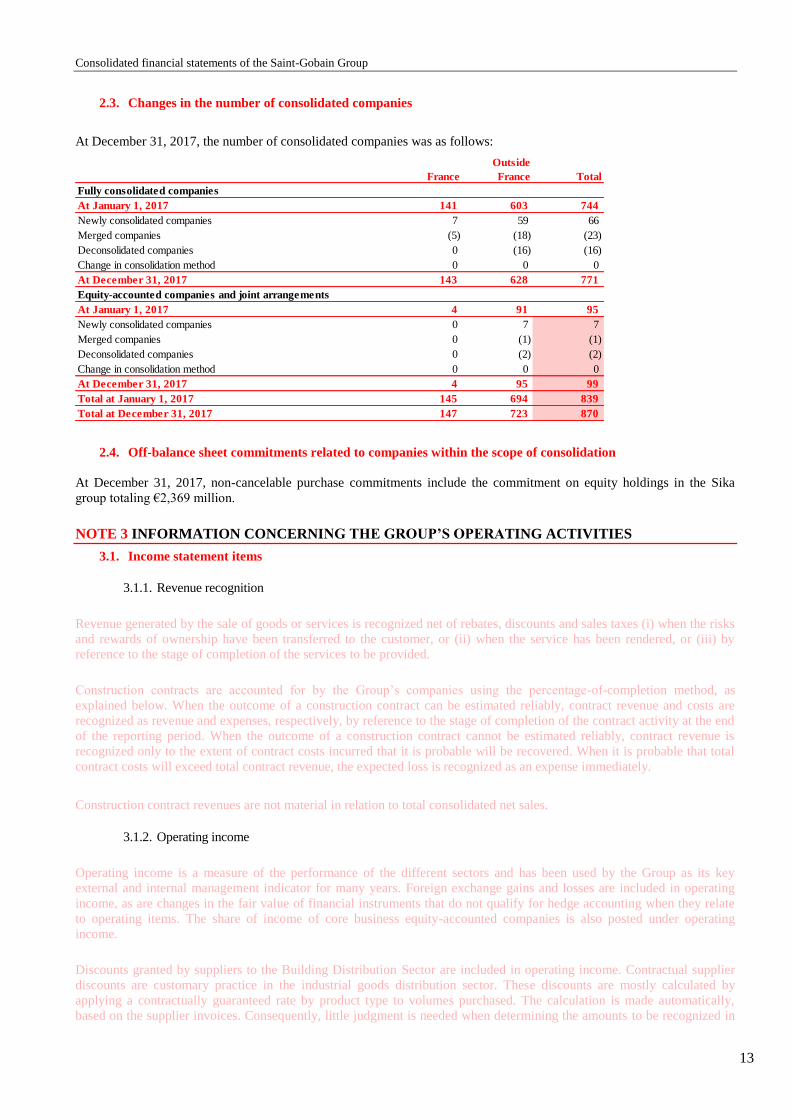
2.3. Changes in the number of consolidated companies
At December 31, 2017, the number of consolidated companies was as follows:
2.4. Off-balance sheet commitments related to companies within the scope of consolidation
At December 31, 2017, non-cancelable purchase commitments include the commitment on equity holdings in the Sika
group totaling €2,369 million.
NOTE 3 INFORMATION CONCERNING THE GROUP’S OPERATING ACTIVITIES
3.1. Income statement items
3.1.1. Revenue recognition
Revenue generated by the sale of goods or services is recognized net of rebates, discounts and sales taxes (i) when the risks
and rewards of ownership have been transferred to the customer, or (ii) when the service has been rendered, or (iii) by
reference to the stage of completion of the services to be provided.
Construction contracts are accounted for by the Group’s companies using the percentage-of-completion method, as
explained below. When the outcome of a construction contract can be estimated reliably, contract revenue and costs are
recognized as revenue and expenses, respectively, by reference to the stage of completion of the contract activity at the end
of the reporting period. When the outcome of a construction contract cannot be estimated reliably, contract revenue is
recognized only to the extent of contract costs incurred that it is probable will be recovered. When it is probable that total
contract costs will exceed total contract revenue, the expected loss is recognized as an expense immediately.
Construction contract revenues are not material in relation to total consolidated net sales.
3.1.2. Operating income
Operating income is a measure of the performance of the different sectors and has been used by the Group as its key
external and internal management indicator for many years. Foreign exchange gains and losses are included in operating
income, as are changes in the fair value of financial instruments that do not qualify for hedge accounting when they relate
to operating items. The share of income of core business equity-accounted companies is also posted under operating
income.
Discounts granted by suppliers to the Building Distribution Sector are included in operating income. Contractual supplier
discounts are customary practice in the industrial goods distribution sector. These discounts are mostly calculated by
applying a contractually guaranteed rate by product type to volumes purchased. The calculation is made automatically,
based on the supplier invoices. Consequently, little judgment is needed when determining the amounts to be recognized in
France
Outside
France Total
Fully consolidated companies
At January 1, 2017 141 603 744
Newly consolidated companies 7 59 66
Merged companies (5) (18) (23)
Deconsolidated companies 0 (16) (16)
Change in consolidation method 0 0 0
At December 31, 2017 143 628 771
Equity-accounted companies and joint arrangements
At January 1, 2017 4 91 95
Newly consolidated companies 0 7 7
Merged companies 0 (1) (1)
Deconsolidated companies 0 (2) (2)
Change in consolidation method 0 0 0
At December 31, 2017 4 95 99
Total at January 1, 2017 145 694 839
Total at December 31, 2017 147 723 870

Consolidated financial statements of the Saint-Gobain Group
14
the income statement for these discounts. Other discounts are calculated based on a step mechanism linked to specified
targets, whereby the percentage discount increases as the entity achieves the various targets over a given period. In this
case, judgment is required based on historical data, past performance and future trends in order to determine the discount to
be recognized in the income statement. Such judgment is exercised in a prudent manner and consistently from one period to
the next.
3.1.3. Other business income and expense
Other business income and expense mainly include movements in provisions for claims and litigation and environmental
matters, disposal gains and losses, asset impairment, restructuring costs incurred upon the disposal or discontinuation of
operations and the costs of workforce reduction measures.
Other business income and expense can be analyzed as follows:
(a) Restructuring costs in 2017 mainly consist of retirement benefits totaling €65 million (2016: €76 million).
(b) In both 2017 and 2016, movements in provisions and expenses relating to litigation as detailed and explained in Note 7 “Other current and non-
current liabilities and provisions, contingent liabilities and litigation" chiefly concern asbestos-related litigation.
(c) In 2017, the "Other" line mainly relates to the cost of environmental litigation and the June 27, 2017 cyber-attack.
(d) The “Impairment of assets and other business expense” line essentially includes impairment of goodwill and other intangible assets and property,
plant and equipment for €237 million in 2017 (2016: €189 million) and acquisition fees and contingent consideration incurred in connection with business combinations, representing net income of €11 million in 2017 (net expense of €11 million in 2016).
(e) Other business expense in both 2017 and 2016 relates primarily to capital losses on assets divested or scrapped.
(in € millions) 2017 2016
Restructuring costs(a)
(120) (144)
Provisions and expenses relating to claims and litigation(b)
(150) (134)
Other(c)
(67) (34)
Non-operating income and expense (337) (312)
Impairment of assets and other(d)
(226) (200)
Other business expense(e)
(75) (63)
Impairment of assets and other business expenses (301) (263)
Gains on disposals of property, plant and equipment and intangible assets 121 61
Capital gains and losses on disposals, asset impairment, acquisition fees
and contingent consideration(180) (202)
Other business income and expense (517) (514)
Consolidated financial statements of the Saint-Gobain Group
15
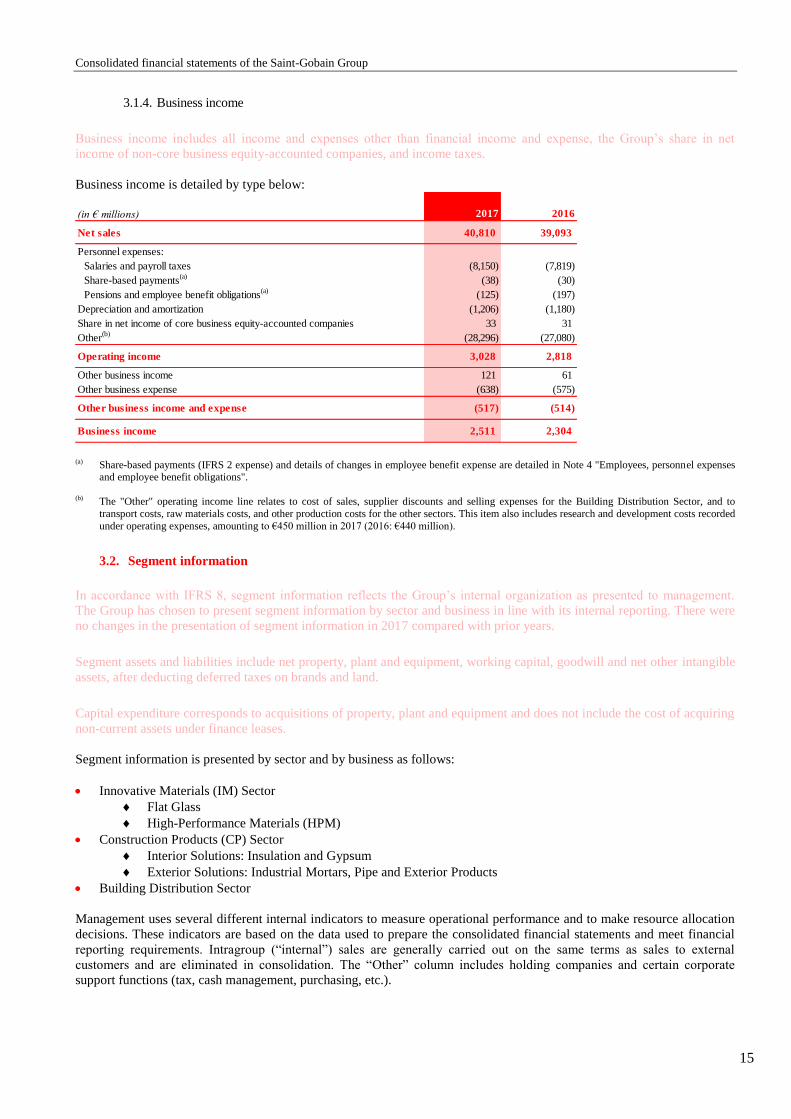
3.1.4. Business income
Business income includes all income and expenses other than financial income and expense, the Group’s share in net
income of non-core business equity-accounted companies, and income taxes.
Business income is detailed by type below:
(a) Share-based payments (IFRS 2 expense) and details of changes in employee benefit expense are detailed in Note 4 "Employees, personnel expenses
and employee benefit obligations".
(b) The "Other" operating income line relates to cost of sales, supplier discounts and selling expenses for the Building Distribution Sector, and to
transport costs, raw materials costs, and other production costs for the other sectors. This item also includes research and development costs recorded
under operating expenses, amounting to €450 million in 2017 (2016: €440 million).
3.2. Segment information
In accordance with IFRS 8, segment information reflects the Group’s internal organization as presented to management.
The Group has chosen to present segment information by sector and business in line with its internal reporting. There were
no changes in the presentation of segment information in 2017 compared with prior years.
Segment assets and liabilities include net property, plant and equipment, working capital, goodwill and net other intangible
assets, after deducting deferred taxes on brands and land.
Capital expenditure corresponds to acquisitions of property, plant and equipment and does not include the cost of acquiring
non-current assets under finance leases.
Segment information is presented by sector and by business as follows:
Innovative Materials (IM) Sector
Flat Glass
High-Performance Materials (HPM)
Construction Products (CP) Sector
Interior Solutions: Insulation and Gypsum
Exterior Solutions: Industrial Mortars, Pipe and Exterior Products
Building Distribution Sector
Management uses several different internal indicators to measure operational performance and to make resource allocation
decisions. These indicators are based on the data used to prepare the consolidated financial statements and meet financial
reporting requirements. Intragroup (“internal”) sales are generally carried out on the same terms as sales to external
customers and are eliminated in consolidation. The “Other” column includes holding companies and certain corporate
support functions (tax, cash management, purchasing, etc.).
(in € millions) 2017 2016
Net sales 40,810 39,093
Personnel expenses:
Salaries and payroll taxes (8,150) (7,819)
Share-based payments(a)
(38) (30)
Pensions and employee benefit obligations(a)
(125) (197)
Depreciation and amortization (1,206) (1,180)
Share in net income of core business equity-accounted companies 33 31
Other(b)
(28,296) (27,080)
Operating income 3,028 2,818
Other business income 121 61
Other business expense (638) (575)
Other business income and expense (517) (514)
Business income 2,511 2,304

Consolidated financial statements of the Saint-Gobain Group
16
Segment information for 2017 and 2016 by sector and by business is as follows:
2017
* “Other” corresponds to the elimination of intragroup transactions for internal sales, and holding company transactions for the other captions.
2016
* “Other” corresponds to the elimination of intragroup transactions for internal sales, and holding company transactions for the other captions.
3.3. Information by geographic area
Segment information for 2017 and 2016 by geographic area is as follows:
2017
Building
DistributionOther
* Total
(in € millions)
Flat
Glass
High-
Performance
Materials
Intra-
segment
elimi-
nations Total
Interior
Solutions
Exterior
Solutions
Intra-
segment
elimi-
nations Total
External sales 5,633 4,588 10,221 6,246 5,527 11,773 18,797 19 40,810
Internal sales 39 150 (27) 162 638 307 (94) 851 3 (1,016) 0
Net sales 5,672 4,738 (27) 10,383 6,884 5,834 (94) 12,624 18,800 (997) 40,810
Operating income 571 715 1,286 652 491 1,143 631 (32) 3,028
Business income 580 608 1,188 556 394 950 493 (120) 2,511
Share in net income of equity-accounted companies 22 2 24 3 5 8 0 1 33
Depreciation and amortization 280 167 447 301 165 466 261 32 1,206
Impairment of assets 48 1 49 47 37 84 103 0 236
EBITDA 851 882 1,733 953 656 1,609 892 0 4,234
Capital expenditure 468 192 660 374 208 582 251 45 1,538
Cash flow from operations 1,188 1,015 653 164 3,020
Goodwill, net 189 1,602 1,791 3,615 2,399 6,014 2,770 0 10,575
Non-amortizable brands 0 0 0 735 89 824 1,191 0 2,015
Total segment assets and liabilities 7,389 12,209 7,645 120 27,363
Innovative Materials Construction Products
Building
DistributionOther
* Total
(in € millions)
Flat
Glass
High-
Performance
Materials
Intra-
segment
elimi-
nations Total
Interior
Solutions
Exterior
Solutions
Intra-
segment
elimi-
nations Total
External sales 5,338 4,385 9,723 5,978 5,126 11,104 18,245 21 39,093
Internal sales 26 122 (14) 134 605 297 (85) 817 3 (954) 0
Net sales 5,364 4,507 (14) 9,857 6,583 5,423 (85) 11,921 18,248 (933) 39,093
Operating income 490 616 1,106 675 431 1,106 616 (10) 2,818
Business income 426 475 901 555 386 941 552 (90) 2,304
Share in net income of equity-accounted companies 17 2 19 12 3 15 1 1 36
Depreciation and amortization 272 161 433 307 154 461 254 32 1,180
Impairment of assets 19 75 94 88 3 91 4 189
EBITDA 762 777 1,539 982 585 1,567 870 22 3,998
Capital expenditure 375 198 573 337 178 515 245 37 1,370
Cash flow from operations 1,031 899 519 300 2,749
Goodwill, net 240 1,679 1,919 3,631 2,293 5,924 2,826 0 10,669
Non-amortizable brands 0 0 0 749 90 839 1,305 0 2,144
Total segment assets and liabilities 7,553 12,225 7,501 659 27,938
Innovative Materials Construction Products
(in € millions)
France
Other
Western
European
countries
North
America
Emerging
countries
and Asia
Internal
salesTotal
Net sales 10,600 17,611 5,418 9,166 (1,985) 40,810
Operating income 331 1,034 611 1,052 3,028
Business income 187 865 388 1,071 2,511
EBITDA 624 1,398 777 1,435 4,234
Capital expenditure 293 431 201 613 1,538
Cash flow from operations 397 1,026 554 1,043 3,020

Consolidated financial statements of the Saint-Gobain Group
17
2016
3.4. Performance indicators
3.4.1. EBITDA
EBITDA corresponds to operating income plus depreciation and amortization of property, plant and equipment and
intangible assets.
EBITDA amounted to €4,234 million in 2017 (2016: €3,998 million), calculated as follows:
3.4.2. Return on capital employed
Return on capital employed (ROCE) corresponds to annualized operating income adjusted for changes in the scope of
consolidation, expressed as a percentage of total assets at year-end. Total assets include net property, plant and equipment,
working capital, net goodwill and other intangible assets, but exclude deferred tax assets arising on non-amortizable brands
and land.
3.4.3. Recurring net income
Recurring net income corresponds to income after tax and minority interests but before disposal gains or losses, asset
impairment, material non-recurring provisions and the related tax and minority interests.
Recurring net income totaled €1,631 million in 2017 (2016: €1,398 million). Based on the weighted average number of
shares outstanding at December 31 (553,383,836 shares in 2017 and 554,624,285 shares in 2016), recurring earnings per
share amounted to €2.95 in 2017 and €2.52 in 2016.
(in € millions)
France
Other
Western
European
countries
North
America
Emerging
countries
and Asia
Internal
salesTotal
Net sales 10,225 17,292 5,198 8,281 (1,903) 39,093
Operating income 301 1,072 544 901 2,818
Business income 252 980 249 823 2,304
EBITDA 587 1,438 717 1,256 3,998
Capital expenditure 262 387 203 518 1,370
Cash flow from operations 316 1,060 412 961 2,749
(in € millions) 2017 2016
Operating income 3,028 2,818
Depreciation/amortization of property, plant and equipment and
intangible assets1,206 1,180
EBITDA 4,234 3,998
Consolidated financial statements of the Saint-Gobain Group
18
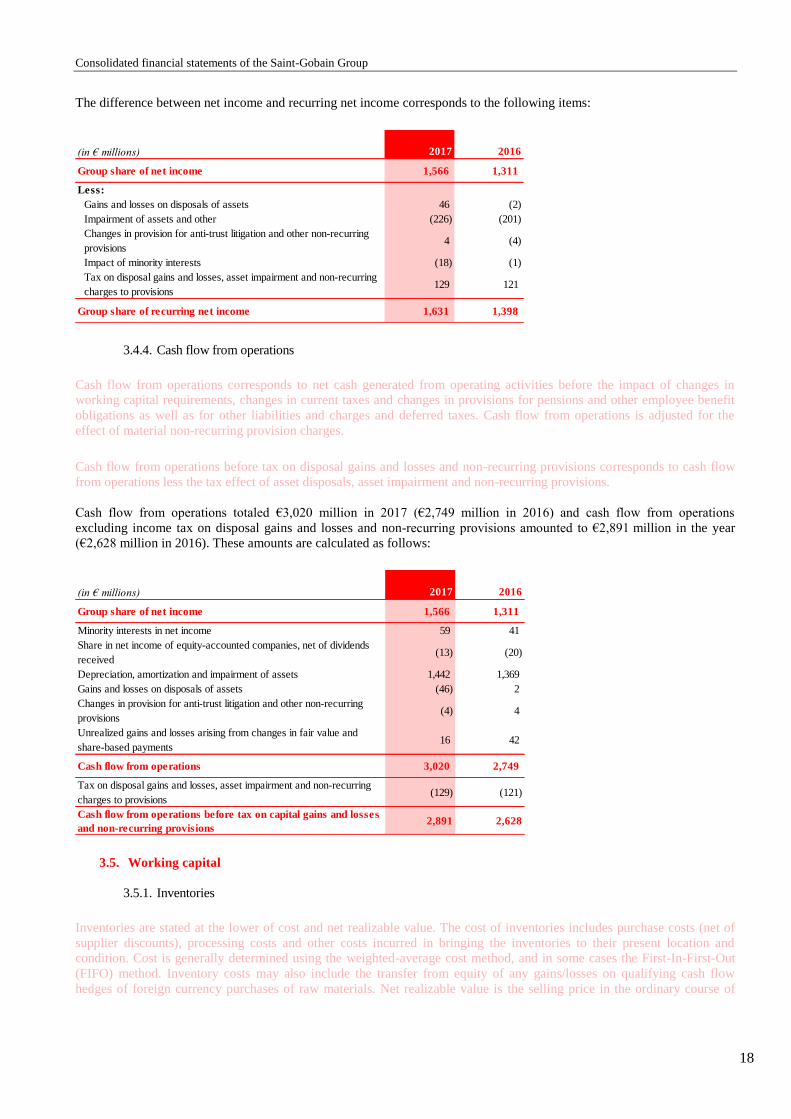
The difference between net income and recurring net income corresponds to the following items:
3.4.4. Cash flow from operations
Cash flow from operations corresponds to net cash generated from operating activities before the impact of changes in
working capital requirements, changes in current taxes and changes in provisions for pensions and other employee benefit
obligations as well as for other liabilities and charges and deferred taxes. Cash flow from operations is adjusted for the
effect of material non-recurring provision charges.
Cash flow from operations before tax on disposal gains and losses and non-recurring provisions corresponds to cash flow
from operations less the tax effect of asset disposals, asset impairment and non-recurring provisions.
Cash flow from operations totaled €3,020 million in 2017 (€2,749 million in 2016) and cash flow from operations
excluding income tax on disposal gains and losses and non-recurring provisions amounted to €2,891 million in the year
(€2,628 million in 2016). These amounts are calculated as follows:
3.5. Working capital
3.5.1. Inventories
Inventories are stated at the lower of cost and net realizable value. The cost of inventories includes purchase costs (net of
supplier discounts), processing costs and other costs incurred in bringing the inventories to their present location and
condition. Cost is generally determined using the weighted-average cost method, and in some cases the First-In-First-Out
(FIFO) method. Inventory costs may also include the transfer from equity of any gains/losses on qualifying cash flow
hedges of foreign currency purchases of raw materials. Net realizable value is the selling price in the ordinary course of
(in € millions) 2017 2016
Group share of net income 1,566 1,311
Less:
Gains and losses on disposals of assets 46 (2)
Impairment of assets and other (226) (201)
Changes in provision for anti-trust litigation and other non-recurring
provisions4 (4)
Impact of minority interests (18) (1)
Tax on disposal gains and losses, asset impairment and non-recurring
charges to provisions129 121
Group share of recurring net income 1,631 1,398
(in € millions) 2017 2016
Group share of net income 1,566 1,311
Minority interests in net income 59 41
Share in net income of equity-accounted companies, net of dividends
received(13) (20)
Depreciation, amortization and impairment of assets 1,442 1,369
Gains and losses on disposals of assets (46) 2
Changes in provision for anti-trust litigation and other non-recurring
provisions(4) 4
Unrealized gains and losses arising from changes in fair value and
share-based payments16 42
Cash flow from operations 3,020 2,749
Tax on disposal gains and losses, asset impairment and non-recurring
charges to provisions(129) (121)
Cash flow from operations before tax on capital gains and losses
and non-recurring provisions2,891 2,628
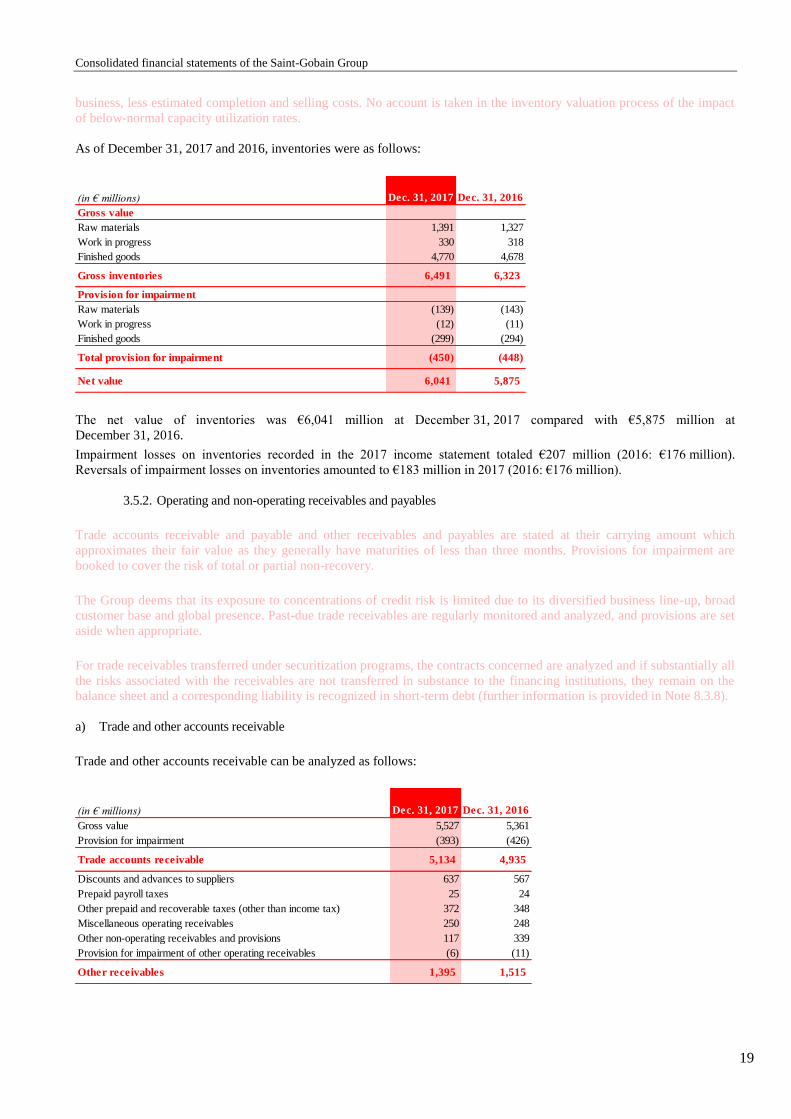
Consolidated financial statements of the Saint-Gobain Group
19
business, less estimated completion and selling costs. No account is taken in the inventory valuation process of the impact
of below-normal capacity utilization rates.
As of December 31, 2017 and 2016, inventories were as follows:
The net value of inventories was €6,041 million at December 31, 2017 compared with €5,875 million at
December 31, 2016.
Impairment losses on inventories recorded in the 2017 income statement totaled €207 million (2016: €176 million).
Reversals of impairment losses on inventories amounted to €183 million in 2017 (2016: €176 million).
3.5.2. Operating and non-operating receivables and payables
Trade accounts receivable and payable and other receivables and payables are stated at their carrying amount which
approximates their fair value as they generally have maturities of less than three months. Provisions for impairment are
booked to cover the risk of total or partial non-recovery.
The Group deems that its exposure to concentrations of credit risk is limited due to its diversified business line-up, broad
customer base and global presence. Past-due trade receivables are regularly monitored and analyzed, and provisions are set
aside when appropriate.
For trade receivables transferred under securitization programs, the contracts concerned are analyzed and if substantially all
the risks associated with the receivables are not transferred in substance to the financing institutions, they remain on the
balance sheet and a corresponding liability is recognized in short-term debt (further information is provided in Note 8.3.8).
a) Trade and other accounts receivable
Trade and other accounts receivable can be analyzed as follows:
(in € millions) Dec. 31, 2017 Dec. 31, 2016
Gross value
Raw materials 1,391 1,327
Work in progress 330 318
Finished goods 4,770 4,678
Gross inventories 6,491 6,323
Provision for impairment
Raw materials (139) (143)
Work in progress (12) (11)
Finished goods (299) (294)
Total provision for impairment (450) (448)
Net value 6,041 5,875
(in € millions) Dec. 31, 2017 Dec. 31, 2016
Gross value 5,527 5,361
Provision for impairment (393) (426)
Trade accounts receivable 5,134 4,935
Discounts and advances to suppliers 637 567
Prepaid payroll taxes 25 24
Other prepaid and recoverable taxes (other than income tax) 372 348
Miscellaneous operating receivables 250 248
Other non-operating receivables and provisions 117 339
Provision for impairment of other operating receivables (6) (11)
Other receivables 1,395 1,515
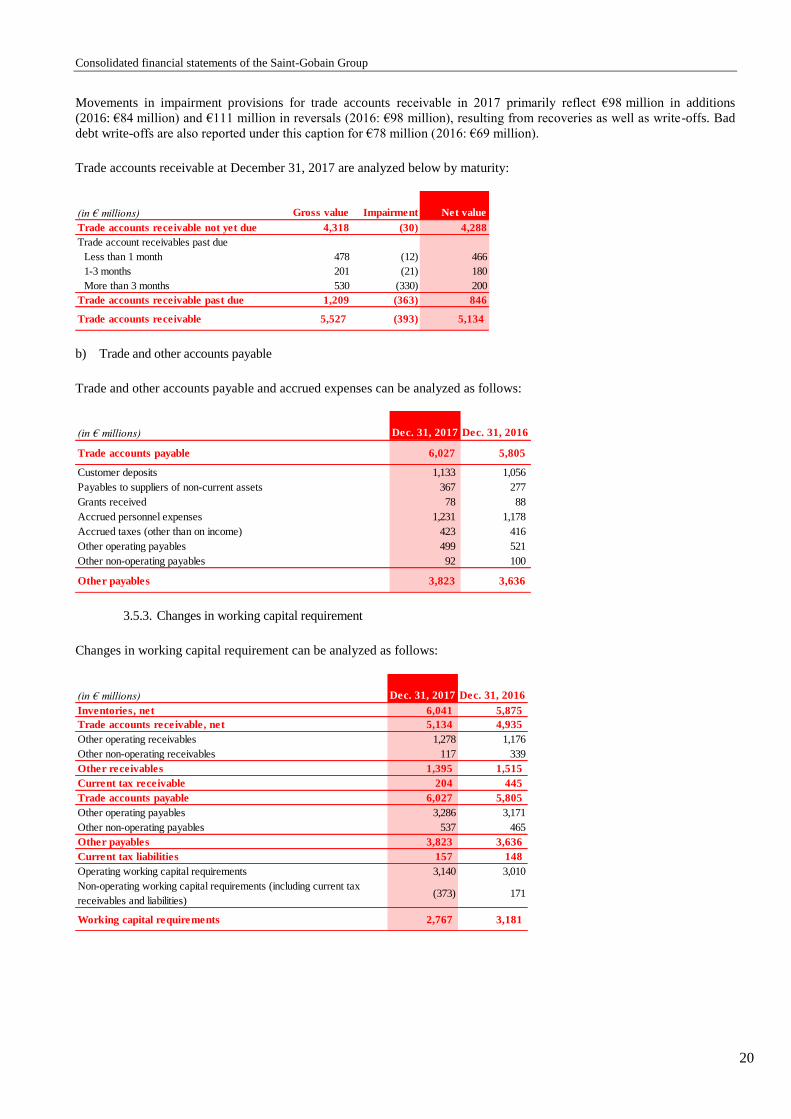
Consolidated financial statements of the Saint-Gobain Group
20
Movements in impairment provisions for trade accounts receivable in 2017 primarily reflect €98 million in additions
(2016: €84 million) and €111 million in reversals (2016: €98 million), resulting from recoveries as well as write-offs. Bad
debt write-offs are also reported under this caption for €78 million (2016: €69 million).
Trade accounts receivable at December 31, 2017 are analyzed below by maturity:
b) Trade and other accounts payable
Trade and other accounts payable and accrued expenses can be analyzed as follows:
3.5.3. Changes in working capital requirement
Changes in working capital requirement can be analyzed as follows:
(in € millions) Gross value Impairment Net value
Trade accounts receivable not yet due 4,318 (30) 4,288
Trade account receivables past due
Less than 1 month 478 (12) 466
1-3 months 201 (21) 180
More than 3 months 530 (330) 200
Trade accounts receivable past due 1,209 (363) 846
Trade accounts receivable 5,527 (393) 5,134
(in € millions) Dec. 31, 2017 Dec. 31, 2016
Trade accounts payable 6,027 5,805
Customer deposits 1,133 1,056
Payables to suppliers of non-current assets 367 277
Grants received 78 88
Accrued personnel expenses 1,231 1,178
Accrued taxes (other than on income) 423 416
Other operating payables 499 521
Other non-operating payables 92 100
Other payables 3,823 3,636
(in € millions) Dec. 31, 2017 Dec. 31, 2016
Inventories, net 6,041 5,875
Trade accounts receivable, net 5,134 4,935
Other operating receivables 1,278 1,176
Other non-operating receivables 117 339
Other receivables 1,395 1,515
Current tax receivable 204 445
Trade accounts payable 6,027 5,805
Other operating payables 3,286 3,171
Other non-operating payables 537 465
Other payables 3,823 3,636
Current tax liabilities 157 148
Operating working capital requirements 3,140 3,010
Non-operating working capital requirements (including current tax
receivables and liabilities)(373) 171
Working capital requirements 2,767 3,181

Consolidated financial statements of the Saint-Gobain Group
21
3.6. Off-balance sheet commitments related to operating activities
3.6.1. Obligations under finance leases
Non-current assets acquired under finance leases are recognized as an asset and a liability in the balance sheet (see Note 5.4
for further information).
Future payment commitments under finance leases are as follows:
At December 31, 2017, future finance lease payment commitments represented €56 million under equipment and
machinery leases and €23 million under leases of land and buildings.
3.6.2. Obligations under operating leases
The Group leases equipment, vehicles, offices, warehouses and production or sales premises. Lease terms generally range
from one to nine years. The liability for total future minimum payments over the lease terms is discounted. The leases
contain rollover options for varying periods of time and some include clauses covering the payment of real estate taxes and
insurance. In most cases, management expects that these leases will be rolled over or replaced by other leases in the normal
course of business.
In 2017, rental expenses amounted to €870 million, including €569 million for land and buildings, and revenue from
subleases represented €19 million. Net rental expense was €851 million.
Payments due under non-cancelable operating leases are as follows:
(in € millions) 2017 2016
Future minimum lease payments
Due within 1 year 19 17
Due in 1 to 5 years 43 40
Due beyond 5 years 17 12
Total future minimum lease payments 79 69
Less finance charge (13) (10)
Present value of future minimum lease payments 66 59
Total 2017 Total 2016
(in € millions)
Due within 1
year
Due in 1 to 5
years
Due beyond 5
years
Rental expense 3,209 727 1,572 910 3,185
Subletting revenue (81) (17) (29) (35) (76)
Total 3,128 710 1,543 875 3,109
Payments due by period
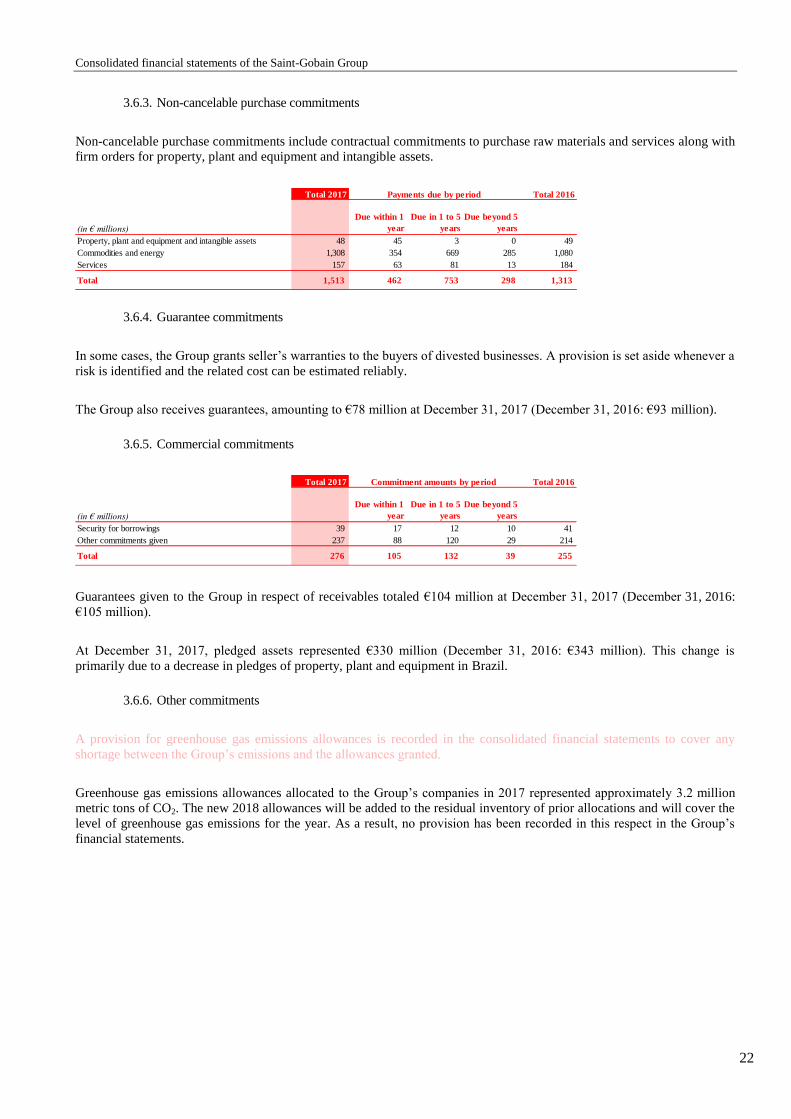
Consolidated financial statements of the Saint-Gobain Group
22
3.6.3. Non-cancelable purchase commitments
Non-cancelable purchase commitments include contractual commitments to purchase raw materials and services along with
firm orders for property, plant and equipment and intangible assets.
3.6.4. Guarantee commitments
In some cases, the Group grants seller’s warranties to the buyers of divested businesses. A provision is set aside whenever a
risk is identified and the related cost can be estimated reliably.
The Group also receives guarantees, amounting to €78 million at December 31, 2017 (December 31, 2016: €93 million).
3.6.5. Commercial commitments
Guarantees given to the Group in respect of receivables totaled €104 million at December 31, 2017 (December 31, 2016:
€105 million).
At December 31, 2017, pledged assets represented €330 million (December 31, 2016: €343 million). This change is
primarily due to a decrease in pledges of property, plant and equipment in Brazil.
3.6.6. Other commitments
A provision for greenhouse gas emissions allowances is recorded in the consolidated financial statements to cover any
shortage between the Group’s emissions and the allowances granted.
Greenhouse gas emissions allowances allocated to the Group’s companies in 2017 represented approximately 3.2 million
metric tons of CO2. The new 2018 allowances will be added to the residual inventory of prior allocations and will cover the
level of greenhouse gas emissions for the year. As a result, no provision has been recorded in this respect in the Group’s
financial statements.
Total 2017 Total 2016
(in € millions)
Due within 1
year
Due in 1 to 5
years
Due beyond 5
years
Property, plant and equipment and intangible assets 48 45 3 0 49
Commodities and energy 1,308 354 669 285 1,080
Services 157 63 81 13 184
Total 1,513 462 753 298 1,313
Payments due by period
Total 2017 Total 2016
(in € millions)
Due within 1
year
Due in 1 to 5
years
Due beyond 5
years
Security for borrowings 39 17 12 10 41
Other commitments given 237 88 120 29 214
Total 276 105 132 39 255
Commitment amounts by period
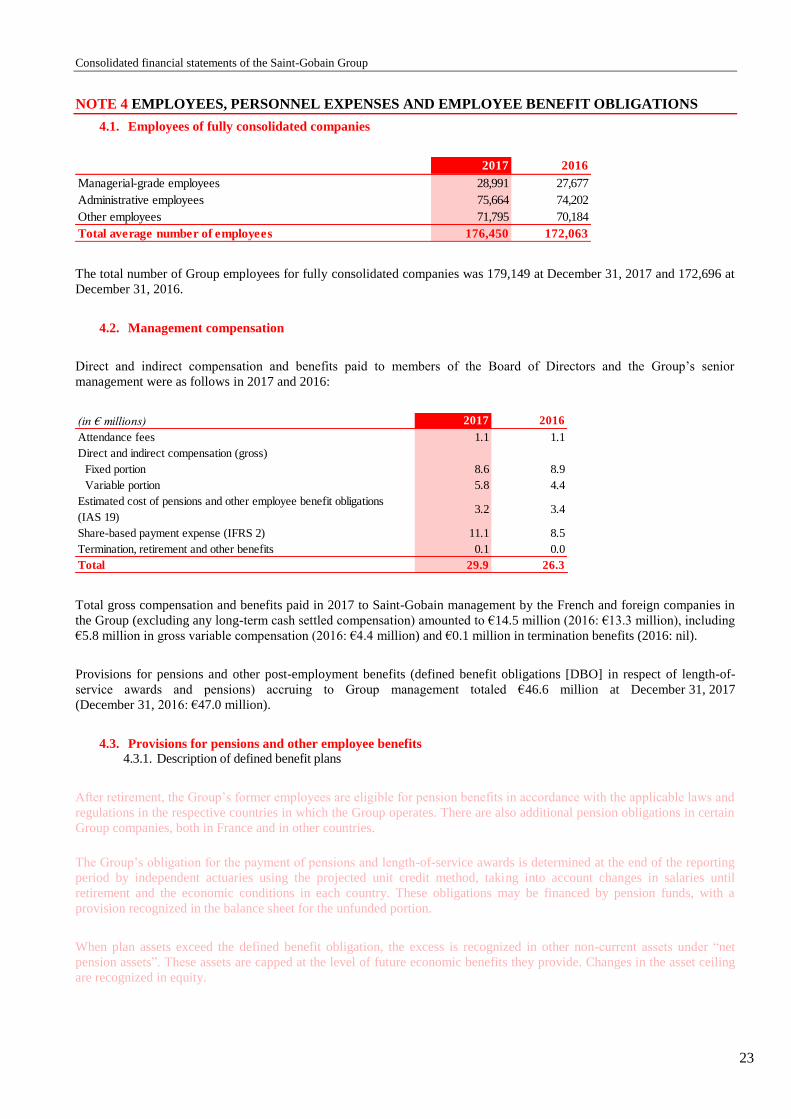
Consolidated financial statements of the Saint-Gobain Group
23
NOTE 4 EMPLOYEES, PERSONNEL EXPENSES AND EMPLOYEE BENEFIT OBLIGATIONS
4.1. Employees of fully consolidated companies
The total number of Group employees for fully consolidated companies was 179,149 at December 31, 2017 and 172,696 at
December 31, 2016.
4.2. Management compensation
Direct and indirect compensation and benefits paid to members of the Board of Directors and the Group’s senior
management were as follows in 2017 and 2016:
Total gross compensation and benefits paid in 2017 to Saint-Gobain management by the French and foreign companies in
the Group (excluding any long-term cash settled compensation) amounted to €14.5 million (2016: €13.3 million), including
€5.8 million in gross variable compensation (2016: €4.4 million) and €0.1 million in termination benefits (2016: nil).
Provisions for pensions and other post-employment benefits (defined benefit obligations [DBO] in respect of length-of-
service awards and pensions) accruing to Group management totaled €46.6 million at December 31, 2017
(December 31, 2016: €47.0 million).
4.3. Provisions for pensions and other employee benefits
4.3.1. Description of defined benefit plans
After retirement, the Group’s former employees are eligible for pension benefits in accordance with the applicable laws and
regulations in the respective countries in which the Group operates. There are also additional pension obligations in certain
Group companies, both in France and in other countries.
The Group’s obligation for the payment of pensions and length-of-service awards is determined at the end of the reporting
period by independent actuaries using the projected unit credit method, taking into account changes in salaries until
retirement and the economic conditions in each country. These obligations may be financed by pension funds, with a
provision recognized in the balance sheet for the unfunded portion.
When plan assets exceed the defined benefit obligation, the excess is recognized in other non-current assets under “net
pension assets”. These assets are capped at the level of future economic benefits they provide. Changes in the asset ceiling
are recognized in equity.
2017 2016
Managerial-grade employees 28,991 27,677
Administrative employees 75,664 74,202
Other employees 71,795 70,184
Total average number of employees 176,450 172,063
(in € millions) 2017 2016
Attendance fees 1.1 1.1
Direct and indirect compensation (gross)
Fixed portion 8.6 8.9
Variable portion 5.8 4.4
Estimated cost of pensions and other employee benefit obligations
(IAS 19)3.2 3.4
Share-based payment expense (IFRS 2) 11.1 8.5
Termination, retirement and other benefits 0.1 0.0
Total 29.9 26.3
Consolidated financial statements of the Saint-Gobain Group
24
Actuarial gains and losses result from changes in actuarial assumptions, experience adjustments and the difference between
the funds’ actual and estimated (calculated) rates of return. They are recognized against equity as and when they arise.
The interest cost of these obligations and the return on the related plan assets are measured by the Group using the discount
rate applied to estimate the obligation at the beginning of the period, and are recognized as financial income or expense.
The Group’s main defined benefit plans are as follows:
In France, employees receive length-of-service awards on retirement based on years of service and the calculation methods
prescribed in the applicable collective bargaining agreements.
In addition to length-of-service awards, there are three defined benefit plans, all of which are final salary plans. These plans
were closed to new entrants by the companies concerned between 1969 and 1997. Effective March 1, 2012, a defined
benefit plan complying with Article L.137-11 of France’s Social Security Code (Code de la sécurité sociale) was set up by
Compagnie de Saint-Gobain.
In Germany, retirement plans provide pensions and death and disability benefits for employees. These plans have been
closed to new entrants since 1996. Since January 1997, new employees have been offered pension plans based on
contributions financed jointly by employer and employee.
In the Netherlands, ceilings have been introduced for defined benefit supplementary pension plans, above which they are
converted into defined contribution plans.
In the United Kingdom, retirement plans provide pensions as well as death and permanent disability benefits. These defined
benefit plans – which are based on employees’ average salaries over their final years of employment – have been closed to
new entrants since 2001.
In the United States and Canada, the Group’s defined benefit plans are final salary plans. Since January 1, 2001, new
employees have been offered a defined contribution plan.
In the United States and Spain, retired employees receive benefits other than pensions, mainly concerning healthcare
benefits. The Group’s obligation under these plans is determined using the actuarial method and is covered by a provision
recorded in the balance sheet.
Provisions for other long-term employee benefits cover all other employee benefits. These benefits primarily include long-
service awards in France, jubilee awards in Germany, deferred compensation, provisions for social security benefits in the
United States, and termination benefits in different countries. The related defined benefit obligation is generally calculated
on an actuarial basis using the same rules as for pension obligations. Actuarial gains and losses relating to these benefits are
recognized immediately in income statement.
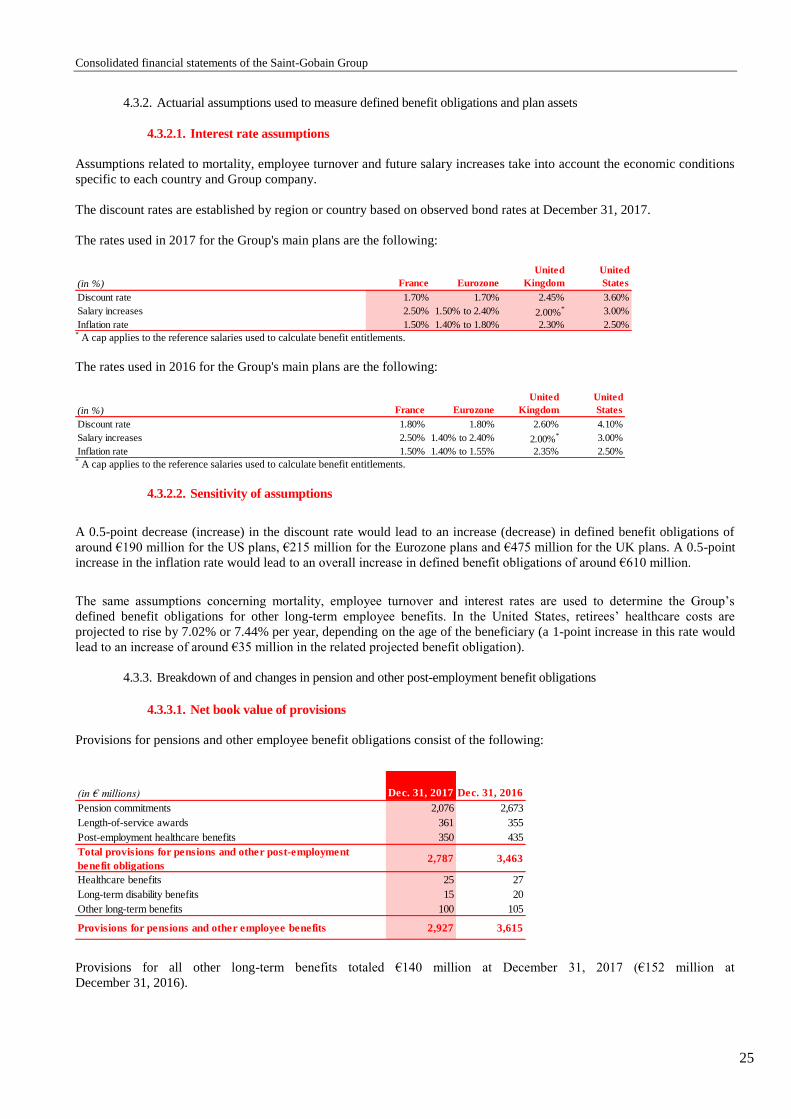
Consolidated financial statements of the Saint-Gobain Group
25
4.3.2. Actuarial assumptions used to measure defined benefit obligations and plan assets
4.3.2.1. Interest rate assumptions
Assumptions related to mortality, employee turnover and future salary increases take into account the economic conditions
specific to each country and Group company.
The discount rates are established by region or country based on observed bond rates at December 31, 2017.
The rates used in 2017 for the Group's main plans are the following:
* A cap applies to the reference salaries used to calculate benefit entitlements.
The rates used in 2016 for the Group's main plans are the following:
* A cap applies to the reference salaries used to calculate benefit entitlements.
4.3.2.2. Sensitivity of assumptions
A 0.5-point decrease (increase) in the discount rate would lead to an increase (decrease) in defined benefit obligations of
around €190 million for the US plans, €215 million for the Eurozone plans and €475 million for the UK plans. A 0.5-point
increase in the inflation rate would lead to an overall increase in defined benefit obligations of around €610 million.
The same assumptions concerning mortality, employee turnover and interest rates are used to determine the Group’s
defined benefit obligations for other long-term employee benefits. In the United States, retirees’ healthcare costs are
projected to rise by 7.02% or 7.44% per year, depending on the age of the beneficiary (a 1-point increase in this rate would
lead to an increase of around €35 million in the related projected benefit obligation).
4.3.3. Breakdown of and changes in pension and other post-employment benefit obligations
4.3.3.1. Net book value of provisions
Provisions for pensions and other employee benefit obligations consist of the following:
Provisions for all other long-term benefits totaled €140 million at December 31, 2017 (€152 million at
December 31, 2016).
(in %) France Eurozone
United
Kingdom
United
States
Discount rate 1.70% 1.70% 2.45% 3.60%
Salary increases 2.50% 1.50% to 2.40% 2.00%* 3.00%
Inflation rate 1.50% 1.40% to 1.80% 2.30% 2.50%
(in %) France Eurozone
United
Kingdom
United
States
Discount rate 1.80% 1.80% 2.60% 4.10%
Salary increases 2.50% 1.40% to 2.40% 2.00%* 3.00%
Inflation rate 1.50% 1.40% to 1.55% 2.35% 2.50%
(in € millions) Dec. 31, 2017 Dec. 31, 2016
Pension commitments 2,076 2,673
Length-of-service awards 361 355
Post-employment healthcare benefits 350 435
Total provisions for pensions and other post-employment
benefit obligations2,787 3,463
Healthcare benefits 25 27
Long-term disability benefits 15 20
Other long-term benefits 100 105
Provisions for pensions and other employee benefits 2,927 3,615
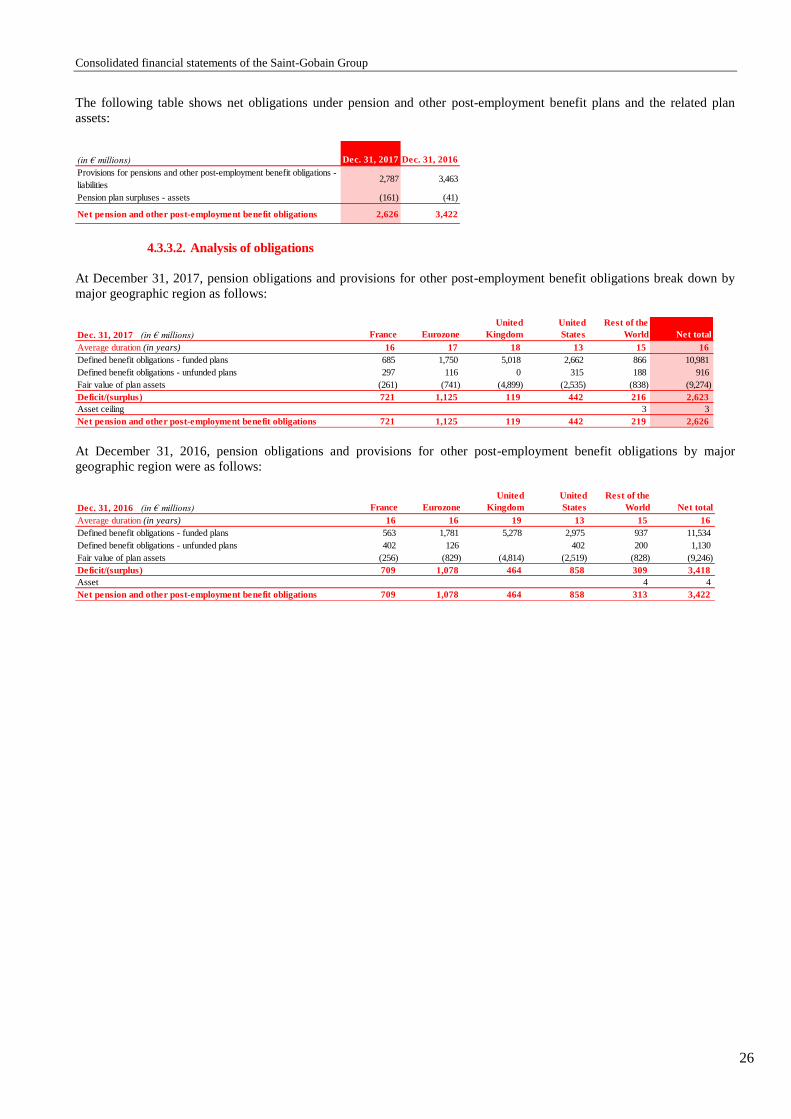
Consolidated financial statements of the Saint-Gobain Group
26
The following table shows net obligations under pension and other post-employment benefit plans and the related plan
assets:
4.3.3.2. Analysis of obligations
At December 31, 2017, pension obligations and provisions for other post-employment benefit obligations break down by
major geographic region as follows:
At December 31, 2016, pension obligations and provisions for other post-employment benefit obligations by major
geographic region were as follows:
(in € millions) Dec. 31, 2017 Dec. 31, 2016
Provisions for pensions and other post-employment benefit obligations -
liabilities2,787 3,463
Pension plan surpluses - assets (161) (41)
Net pension and other post-employment benefit obligations 2,626 3,422
Dec. 31, 2017(in € millions) France Eurozone
United
Kingdom
United
States
Rest of the
World Net total
Average duration (in years) 16 17 18 13 15 16
Defined benefit obligations - funded plans 685 1,750 5,018 2,662 866 10,981
Defined benefit obligations - unfunded plans 297 116 0 315 188 916
Fair value of plan assets (261) (741) (4,899) (2,535) (838) (9,274)
Deficit/(surplus) 721 1,125 119 442 216 2,623
Asset ceiling 3 3
Net pension and other post-employment benefit obligations 721 1,125 119 442 219 2,626
Dec. 31, 2016(in € millions) France Eurozone
United
Kingdom
United
States
Rest of the
World Net total
Average duration (in years) 16 16 19 13 15 16
Defined benefit obligations - funded plans 563 1,781 5,278 2,975 937 11,534
Defined benefit obligations - unfunded plans 402 126 402 200 1,130
Fair value of plan assets (256) (829) (4,814) (2,519) (828) (9,246)
Deficit/(surplus) 709 1,078 464 858 309 3,418
Asset 4 4
Net pension and other post-employment benefit obligations 709 1,078 464 858 313 3,422
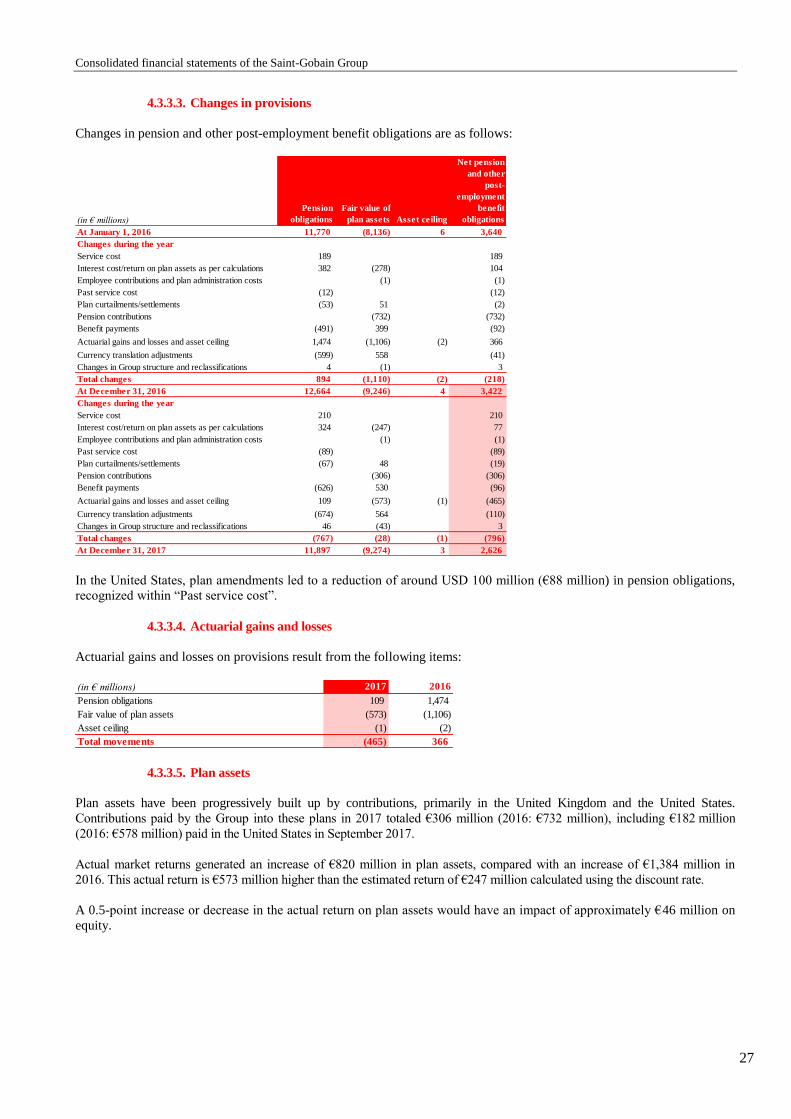
Consolidated financial statements of the Saint-Gobain Group
27
4.3.3.3. Changes in provisions
Changes in pension and other post-employment benefit obligations are as follows:
In the United States, plan amendments led to a reduction of around USD 100 million (€88 million) in pension obligations,
recognized within “Past service cost”.
4.3.3.4. Actuarial gains and losses
Actuarial gains and losses on provisions result from the following items:
4.3.3.5. Plan assets
Plan assets have been progressively built up by contributions, primarily in the United Kingdom and the United States.
Contributions paid by the Group into these plans in 2017 totaled €306 million (2016: €732 million), including €182 million
(2016: €578 million) paid in the United States in September 2017.
Actual market returns generated an increase of €820 million in plan assets, compared with an increase of €1,384 million in
2016. This actual return is €573 million higher than the estimated return of €247 million calculated using the discount rate.
A 0.5-point increase or decrease in the actual return on plan assets would have an impact of approximately €46 million on
equity.
(in € millions)
Pension
obligations
Fair value of
plan assets Asset ceiling
Net pension
and other
post-
employment
benefit
obligations
At January 1, 2016 11,770 (8,136) 6 3,640
Changes during the year
Service cost 189 189
Interest cost/return on plan assets as per calculations 382 (278) 104
Employee contributions and plan administration costs (1) (1)
Past service cost (12) (12)
Plan curtailments/settlements (53) 51 (2)
Pension contributions (732) (732)
Benefit payments (491) 399 (92)
Actuarial gains and losses and asset ceiling 1,474 (1,106) (2) 366
Currency translation adjustments (599) 558 (41)
Changes in Group structure and reclassifications 4 (1) 3
Total changes 894 (1,110) (2) (218)
At December 31, 2016 12,664 (9,246) 4 3,422
Changes during the year
Service cost 210 210
Interest cost/return on plan assets as per calculations 324 (247) 77
Employee contributions and plan administration costs (1) (1)
Past service cost (89) (89)
Plan curtailments/settlements (67) 48 (19)
Pension contributions (306) (306)
Benefit payments (626) 530 (96)
Actuarial gains and losses and asset ceiling 109 (573) (1) (465)
Currency translation adjustments (674) 564 (110)
Changes in Group structure and reclassifications 46 (43) 3
Total changes (767) (28) (1) (796)
At December 31, 2017 11,897 (9,274) 3 2,626
(in € millions) 2017 2016
Pension obligations 109 1,474
Fair value of plan assets (573) (1,106)
Asset ceiling (1) (2)
Total movements (465) 366

Consolidated financial statements of the Saint-Gobain Group
28
Plan assets mainly comprise:
Contributions to pension plans for 2018 are estimated at around €110 million.
4.3.3.6. Employee benefit expense
The cost of the Group’s pension and other post-employment benefit plans (excluding other employee benefits) is as
follows:
4.3.4. Defined contribution plans
Contributions to defined contribution plans are expensed as incurred.
Contributions to defined contribution plans for 2017 represented an estimated €644 million (2016: €628 million), including
€434 million for government-sponsored basic pension schemes (2016: €418 million), €131 million for government-
sponsored supplementary pension schemes, mainly in France (2016: €131 million), and €79 million for corporate-
sponsored supplementary pension plans (2016: €79 million).
(in %) Dec. 31, 2017 Dec. 31, 2016
Equities 29% 27%
Bonds 48% 55%
Other 23% 18%
Total 100% 100%
(in € millions) 2017 2016
Service cost 210 189
Interest cost 324 382
Return on plan assets (247) (278)
Past service cost, plan curtailments and settlements (108) (14)
Employee contributions and plan administration costs (1) (1)
Pensions, length-of-service awards and
other post-employment benefits178 278

Consolidated financial statements of the Saint-Gobain Group
29
4.4. Share-based payments
4.4.1. Group Savings Plan
The Group Savings Plan (Plan Epargne Groupe) is an employee stock purchase plan open to all Group employees in
France and most other countries where the Group is present. Eligible employees must have completed a minimum of three
months’ service within the Group. Eligible employees are able to invest in Saint-Gobain shares at a preferential
subscription price. These shares are held either directly or through the employee saving plan’s mutual funds, depending on
local legislation, and are subject to a mandatory five- or ten-year lock-up, except following the occurrence of certain
events. The Board of Directors delegates authorization for setting the subscription price to the Chief Executive Officer of
Compagnie de Saint-Gobain. It corresponds to the average of the opening prices for the Saint-Gobain share on Euronext
Paris over the 20 trading days preceding the date of the decision, subject to a 20% discount, in accordance with applicable
laws, the Shareholders’ Meeting resolutions and the deliberations of the Board of Directors.
The compensation cost recorded in accordance with IFRS 2 is measured by reference to the fair value of a discount offered
on restricted stock (i.e., stock subject to a lock-up). The cost of the lock-up for the employee is defined as the cost of a two-
step strategy that involves first selling the restricted stock forward five or ten years and then purchasing the same number of
shares on the spot market and financing the purchase with debt. The borrowing cost is estimated at the rate that would be
charged by a bank to an individual with an average risk profile for a general-purpose, five- or ten-year consumer loan
repayable at maturity. The cost of the plans is recognized in full at the end of the subscription period.
In 2017, 4,593,807 new shares with a par value of €4 were issued to employees under the PEG at an average subscription
price of €36.72 (2016: 4,653,810 shares at an average price of €29.42), representing a share capital increase of €168 million
(€136 million in 2016), net of transaction fees.
No amount was expensed in respect of the plans in 2017 or 2016 owing to the lock-in cost.
The following table shows the main features of the standard plans, the amounts invested in the plans and the valuation
assumptions applied in 2017 and 2016:
*A 0.5-point decline in borrowing costs for the employee would have no material impact on the 2017 share-based payment expense as calculated in
accordance with IFRS 2.
2017 2016
Plan characteristics
Date of Shareholders' Meeting June 4, 2015 (17th
Resolution) June 4, 2015 (17th
Resolution)
Date of the Chief Executive Officer's decision fixing the subscription price March 20 March 21
Plan duration (in years) 5 or 10 5 or 10
Reference price (in €) 45.89 36.77
Subscription price (in €) 36.72 29.42
Discount (in %) 20.00% 20.00%
Total discount on the date of the Chief Executive Officer's decision (in %) (a) 21.25% 21.94%
Employee investments (in € millions) 168.7 136.9
Total number of shares subscribed 4,593,807 4,653,810
Valuation assumptions (5-year maturity)
Interest rate applicable to employees* 4.80% 5.00%
Risk-free interest rate 0.19% -0.15%
Repo rate 0.47% 0.50%
Lock-up discount (in %) (b) 21.17% 22.92%
Total cost to the Group (in %) (a-b) 0.08% -0.98%
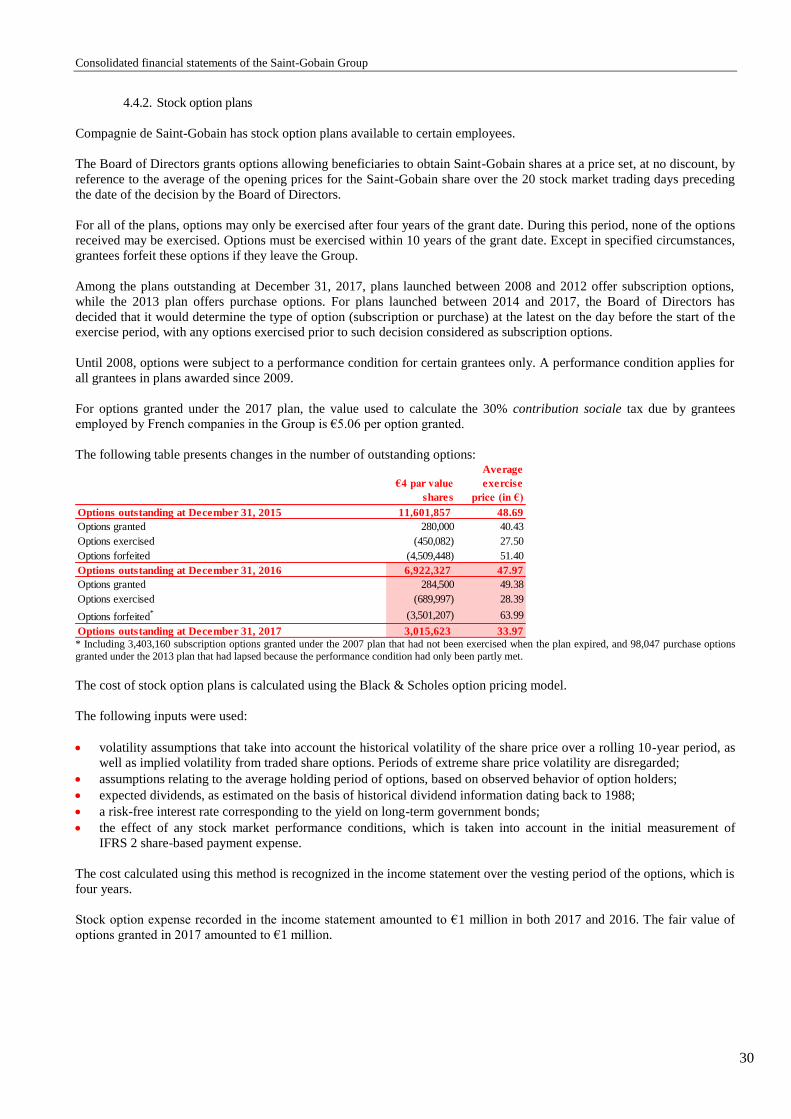
Consolidated financial statements of the Saint-Gobain Group
30
4.4.2. Stock option plans
Compagnie de Saint-Gobain has stock option plans available to certain employees.
The Board of Directors grants options allowing beneficiaries to obtain Saint-Gobain shares at a price set, at no discount, by
reference to the average of the opening prices for the Saint-Gobain share over the 20 stock market trading days preceding
the date of the decision by the Board of Directors.
For all of the plans, options may only be exercised after four years of the grant date. During this period, none of the options
received may be exercised. Options must be exercised within 10 years of the grant date. Except in specified circumstances,
grantees forfeit these options if they leave the Group.
Among the plans outstanding at December 31, 2017, plans launched between 2008 and 2012 offer subscription options,
while the 2013 plan offers purchase options. For plans launched between 2014 and 2017, the Board of Directors has
decided that it would determine the type of option (subscription or purchase) at the latest on the day before the start of the
exercise period, with any options exercised prior to such decision considered as subscription options.
Until 2008, options were subject to a performance condition for certain grantees only. A performance condition applies for
all grantees in plans awarded since 2009.
For options granted under the 2017 plan, the value used to calculate the 30% contribution sociale tax due by grantees
employed by French companies in the Group is €5.06 per option granted.
The following table presents changes in the number of outstanding options:
* Including 3,403,160 subscription options granted under the 2007 plan that had not been exercised when the plan expired, and 98,047 purchase options
granted under the 2013 plan that had lapsed because the performance condition had only been partly met.
The cost of stock option plans is calculated using the Black & Scholes option pricing model.
The following inputs were used:
volatility assumptions that take into account the historical volatility of the share price over a rolling 10-year period, as
well as implied volatility from traded share options. Periods of extreme share price volatility are disregarded;
assumptions relating to the average holding period of options, based on observed behavior of option holders;
expected dividends, as estimated on the basis of historical dividend information dating back to 1988;
a risk-free interest rate corresponding to the yield on long-term government bonds;
the effect of any stock market performance conditions, which is taken into account in the initial measurement of
IFRS 2 share-based payment expense.
The cost calculated using this method is recognized in the income statement over the vesting period of the options, which is
four years.
Stock option expense recorded in the income statement amounted to €1 million in both 2017 and 2016. The fair value of
options granted in 2017 amounted to €1 million.
€4 par value
shares
Average
exercise
price (in €)
Options outstanding at December 31, 2015 11,601,857 48.69
Options granted 280,000 40.43
Options exercised (450,082) 27.50
Options forfeited (4,509,448) 51.40
Options outstanding at December 31, 2016 6,922,327 47.97
Options granted 284,500 49.38
Options exercised (689,997) 28.39
Options forfeited* (3,501,207) 63.99
Options outstanding at December 31, 2017 3,015,623 33.97

Consolidated financial statements of the Saint-Gobain Group
31
The table below summarizes information about stock options outstanding at December 31, 2017, after taking into account
partial fulfillment of the performance criteria attached to certain plans:
* 2014, 2015, 2016 and 2017 plans: see above.
For subscription options, the sum received by the Company when options are exercised is recorded in “Capital stock” for
the portion representing the par value of the shares, with the balance – net of directly attributable transaction costs –
recorded under “Additional paid-in capital”.
At December 31, 2017, 1,991,623 stock options were exercisable (at an average exercise price of €30.19) and
1,024,000 options (with an average exercise price of €41.26) had not yet vested.
4.4.3. Performance shares and performance unit grants
The Group set up a worldwide share grant plan in 2009 whereby each Group employee was awarded seven shares. This
plan ended in the first half of 2014. Since 2009, performance share plans have also been set up for certain categories of
employees. These plans are subject to eligibility criteria based on the grantee’s period of service (service conditions) with
the Group as well as performance criteria (performance conditions), which are described below. The IFRS 2 share-based
payment expense takes into account these criteria as well as the lock-up feature. It is determined after deducting the present
value of forfeited dividends on the performance shares and are recognized over the vesting period, which ranges from two
to four years depending on the country.
Since 2012, performance unit plans have been set up for certain employees in France. These plans are also subject to
service and performance conditions. The IFRS 2 share-based payment expense therefore takes into account these factors, as
well as the fact that the units are cash-settled. IFRS 2 stipulates that for cash-settled share-based payment transactions, the
granted instruments are initially measured at fair value at the grant date, then remeasured at the end of each reporting
period, with the expense adjusted accordingly pro rata to the rights that have vested at the reporting date. The expense is
recognized over the vesting period of the rights.
a) Performance share plans
Various performance share plans have been set up by Saint-Gobain since 2009.
Four performance share plans were outstanding at December 31, 2017. The plans approved by the Board of Directors in
2014 and 2015 solely concern certain managerial-grade employees and senior managers of the Group outside France. The
plans approved by the Board of Directors in 2016 and on November 23, 2017 concern managerial-grade employees and
senior managers of the Group both within and outside France.
All plans are subject to service and performance conditions. The vesting period for the plans is four years and the shares
will be delivered the day after the end of the vesting period.
Grant date
Exercise
price (in €)
Number of
options
Weighted
average
contractual
life (in months)
Exercise
price (in €)
Number of
options
Number of
options Type of options
2008 25.88 1,185,015 11 1,185,015 Subscription
2009 36.34 654,514 23 654,514 Subscription
2010 35.19 0 35 0 Subscription
2011 31.22 0 47 0 Subscription
2012 27.71 19,962 59 19,962 Subscription
2013 38.80 132,132 71 132,132 Purchase
2014 83 34.13 234,550 234,550 Subscription or purchase*
2015 95 39.47 224,950 224,950 Subscription or purchase*
2016 107 40.43 280,000 280,000 Subscription or purchase*
2017 119 49.38 284,500 284,500 Subscription or purchase*
Total 1,991,623 1,024,000 3,015,623
Exercisable options Non-exercisable options Total options outstanding

Consolidated financial statements of the Saint-Gobain Group
32
The table below shows changes in the number of performance share rights:
* Including 457,535 existing shares delivered under the 2013 plan, and 1,260 existing shares delivered in advance under the 2014, 2015 and 2016 plans.
The fair value of the performance shares corresponds to the Saint-Gobain share price on the grant date less the value of
dividends not payable on the shares during the vesting period and, as for the Group Savings Plan, minus the discount on
restricted stock (i.e., stock subject to a four-year lock-up), which has been estimated at around 30% of the share price. The
share-based payment expense is recognized over the two- or four-year vesting period of the performance shares.
The expense recorded in the income statement in 2017 for these plans amounted to €16 million (2016: €10 million).
The following table shows the expected dates when shares under the four performance share plans outstanding at
December 31, 2017 will be delivered (except in the case of early release following the grantee’s death or disability), along
with the service and performance conditions remaining to be fulfilled:
* Subject to fulfillment of the service and performance conditions applicable to each plan.
b) Performance unit plans
Performance unit plans subject to service and performance conditions were set up every year between 2012 and 2015 for
certain management-grade employees and senior managers of the Group in France. These plans do not give rise to the
delivery of shares but entitle grantees to receive cash compensation deferred over the long term (exercise period between
four and ten years after the grant date), the amount of which will be determined by reference to the Company’s share price.
No long-term payment plan in the form of performance units was set up in 2017 or 2016, since all beneficiaries received
rights to performance shares.
In 2017, 490,914 performance units under the 2013 plan vested, while 79,871 performance units under the same plan
lapsed, including 61,645 because the related performance condition was only partly met.
The table below shows historical data for the performance unit plans in the process of vesting at December 31, 2017:
* Subject to fulfillment of the service and performance conditions applicable to each plan.
The expense recorded in the income statement in 2017 for these plans amounted to €21 million (2016: €20 million).
Number of
rights
Number of performance share rights at December 31, 2015 2,351,881
Performance share rights granted in November 2016 1,231,320
Shares issued/delivered (583,220)
Lapsed and canceled rights (196,856)
Number of performance share rights at December 31, 2016 2,803,125
Performance share rights granted in November 2017 1,226,680
Shares issued/delivered* (458,795)
Lapsed and canceled rights (83,570)
Number of performance share rights at December 31, 2017 3,487,440
Grant date
Number of rights at
December 31, 2017*
End of vesting
and lock-up period Type of shares
November 20, 2014 529,340 November 20, 2018 existing
November 26, 2015 500,510 November 26, 2019 existing
November 24, 2016 1,230,910 November 24, 2020 existing
November 23, 2017 1,226,680 November 23, 2021 existing
Total 3,487,440
Grant date
Number of performance
units granted at
inception of plan
Exercised
early
Number of
performance units at
December 31, 2017*
November 20, 2014 598,400 1,550 596,850
November 26, 2015 556,340 556,340
Total 1,154,740 1,550 1,153,190

Consolidated financial statements of the Saint-Gobain Group
33
NOTE 5 INTANGIBLE ASSETS AND PROPERTY, PLANT AND EQUIPMENT
5.1. Goodwill
When an entity is acquired by the Group, its identifiable assets and assumed liabilities are recognized at their fair value
within a 12-month measurement period and retroactively at the acquisition date.
The final acquisition price (“consideration transferred” in IFRS 3R), including, as appropriate, the estimated fair value of
any earn-out payments or other deferred consideration (“contingent consideration” in IFRS 3R), is determined in the
12 months following the acquisition. Under IFRS 3R, any adjustments to the acquisition price beyond this 12-month period
are recorded in the income statement. All costs directly attributable to the acquisition, i.e., costs that the acquirer incurs to
effect a business combination, such as professional fees paid to investment banks, attorneys, auditors, independent
appraisers and other consultants, are no longer capitalized as part of the cost of the business combination. They are
therefore expensed as incurred and are no longer included in the cost of acquisition.
In addition, goodwill is recognized only at the date that control is achieved. Any subsequent increase in ownership interest
(without change of control) is recorded as a change in equity without adjusting goodwill.
Goodwill is recorded in the consolidated balance sheet as the difference between (i) the acquisition-date fair value plus the
amount of any minority interests in the acquisition – measured either at fair value (full goodwill method) or at the
proportionate interest in the fair value of the net identifiable assets acquired (partial goodwill method) – and (ii) the net
amount of assets and liabilities acquired at their fair value at the acquisition date. The Group generally applies the partial
goodwill method and the amount of goodwill calculated under the full goodwill method is not therefore material.
Any excess of the cost of an acquisition over the fair value of the Group’s share of the assets and liabilities of the acquired
entity is recorded as goodwill. Any negative difference between the cost of the acquisition and the fair value of the net
assets and liabilities acquired is recognized in the income statement during the year of acquisition.
Changes in goodwill in 2017 and 2016 are detailed below:
In 2017, changes in Group structure related mainly to newly consolidated companies in the Construction Products Sector
representing €474 million. Impairment tests performed in 2017 led to the recognition of goodwill impairment, primarily in
the Flat Glass business in the United States and the United Kingdom. The 2017 currency translation adjustments primarily
reflect the impact of fluctuations in the US dollar, pound sterling, Norwegian krone and Brazilian real.
In 2016, changes in Group structure related mainly to newly consolidated companies representing €189 million.
Impairment tests performed in 2016 led to the recognition of goodwill impairment, primarily on the Interior Solutions
business. Currency translation adjustments primarily reflected the impact of fluctuations in the pound sterling, US dollar,
and Brazilian real.
(in € millions) 2017 2016
At January 1
Gross value 12,160 12,180
Accumulated impairment (1,491) (1,497)
Net value 10,669 10,683
Changes during the year
Impairment (70) (13)
Translation adjustments (497) (189)
Changes in Group structure 473 188
Total changes (94) (14)
At December 31
Gross value 12,023 12,160
Accumulated impairment (1,448) (1,491)
Net value 10,575 10,669
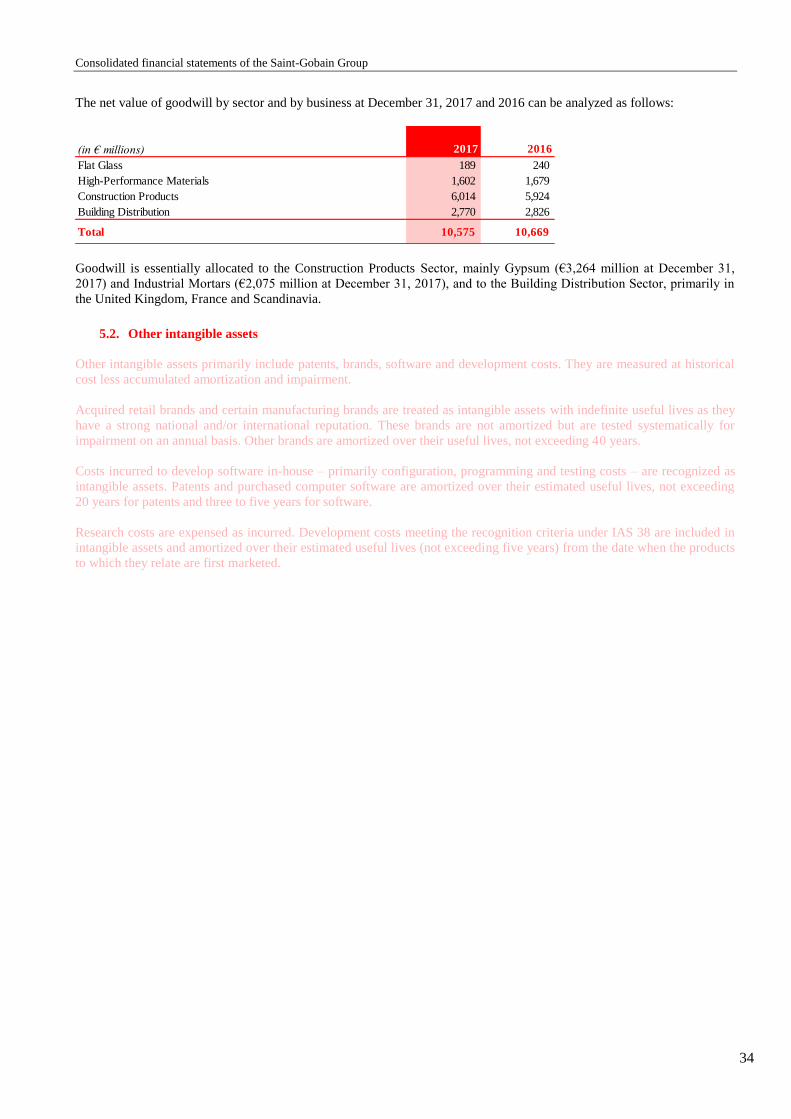
Consolidated financial statements of the Saint-Gobain Group
34
The net value of goodwill by sector and by business at December 31, 2017 and 2016 can be analyzed as follows:
Goodwill is essentially allocated to the Construction Products Sector, mainly Gypsum (€3,264 million at December 31,
2017) and Industrial Mortars (€2,075 million at December 31, 2017), and to the Building Distribution Sector, primarily in
the United Kingdom, France and Scandinavia.
5.2. Other intangible assets
Other intangible assets primarily include patents, brands, software and development costs. They are measured at historical
cost less accumulated amortization and impairment.
Acquired retail brands and certain manufacturing brands are treated as intangible assets with indefinite useful lives as they
have a strong national and/or international reputation. These brands are not amortized but are tested systematically for
impairment on an annual basis. Other brands are amortized over their useful lives, not exceeding 40 years.
Costs incurred to develop software in-house – primarily configuration, programming and testing costs – are recognized as
intangible assets. Patents and purchased computer software are amortized over their estimated useful lives, not exceeding
20 years for patents and three to five years for software.
Research costs are expensed as incurred. Development costs meeting the recognition criteria under IAS 38 are included in
intangible assets and amortized over their estimated useful lives (not exceeding five years) from the date when the products
to which they relate are first marketed.
(in € millions) 2017 2016
Flat Glass 189 240
High-Performance Materials 1,602 1,679
Construction Products 6,014 5,924
Building Distribution 2,770 2,826
Total 10,575 10,669

Consolidated financial statements of the Saint-Gobain Group
35
Changes in other intangible assets during 2017 and 2016 are analyzed below:
Impairment of non-amortizable brands in 2017 concerned Lapeyre.
The breakdown of non-amortizable brands by sector is provided in the segment information tables in Note 3 "Information
concerning the Group’s operating activities".
5.3. Property, plant and equipment
Land, buildings and equipment are carried at historical cost less accumulated depreciation and impairment.
Cost may also include incidental expenses directly attributable to the acquisition, as well as the impact of transfers from
equity of any gains/losses on qualifying cash flow hedges of property, plant and equipment purchases.
Expenses incurred in exploring and evaluating mineral resources are included in property, plant and equipment when it is
probable that associated future economic benefits will flow to the Group. They include mainly the costs of topographical or
geological studies, drilling costs, sampling costs and all costs incurred in assessing the technical feasibility and commercial
viability of extracting the mineral resource.
Material borrowing costs incurred for the construction and acquisition of property, plant and equipment are included in the
cost of the related asset if they are significant.
Property, plant and equipment are considered as having no residual value, as they chiefly consist of industrial assets that are
intended to be used until the end of their useful lives.
(in € millions) Patents
Non-
amortizable
brands Software
Development
costs Other Total
At January 1, 2016
Gross value 162 2,872 1,000 131 425 4,590
Accumulated amortization and impairment (138) (587) (806) (97) (214) (1,842)
Net value 24 2,285 194 34 211 2,748
Changes during the year
Acquisitions 5 0 91 17 38 151
Disposals 0 0 (12) 0 (1) (13)
Translation adjustments 1 (140) 3 1 0 (135)
Amortization and impairment (4) 0 (68) (13) (12) (97)
Changes in Group structure and other 0 (1) 12 (3) 0 8
Total changes 2 (141) 26 2 25 (86)
At December 31, 2016
Gross value 165 2,731 1,066 147 451 4,560
Accumulated amortization and impairment (139) (587) (846) (111) (215) (1,898)
Net value 26 2,144 220 36 236 2,662
Changes during the year
Acquisitions 0 0 97 8 79 184
Disposals 0 0 (3) 0 (1) (4)
Translation adjustments (2) (55) (9) (2) (11) (79)
Amortization and impairment (4) (80) (74) (13) (11) (182)
Changes in Group structure and other 0 6 8 2 6 22
Total changes (6) (129) 19 (5) 62 (59)
At December 31, 2017
Gross value 149 2,682 1,093 119 505 4,548
Accumulated amortization and impairment (129) (667) (854) (88) (207) (1,945)
Net value 20 2,015 239 31 298 2,603
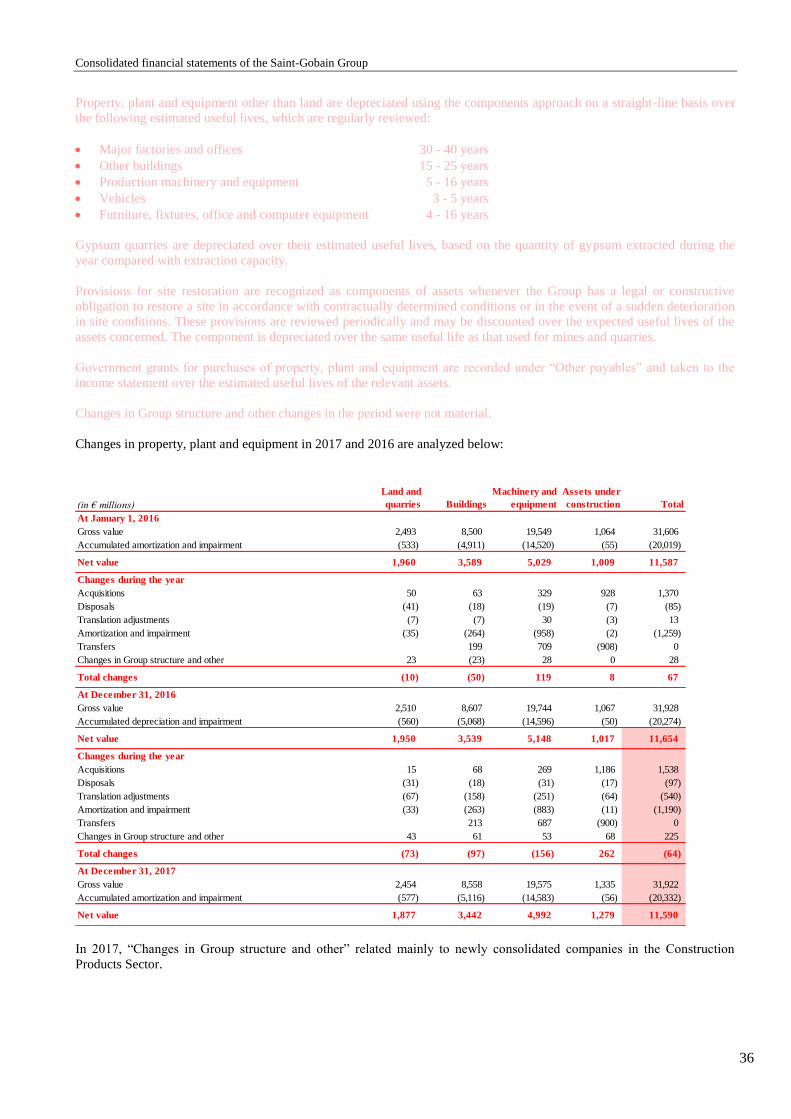
Consolidated financial statements of the Saint-Gobain Group
36
Property, plant and equipment other than land are depreciated using the components approach on a straight-line basis over
the following estimated useful lives, which are regularly reviewed:
Major factories and offices 30 - 40 years
Other buildings 15 - 25 years
Production machinery and equipment 5 - 16 years
Vehicles 3 - 5 years
Furniture, fixtures, office and computer equipment 4 - 16 years
Gypsum quarries are depreciated over their estimated useful lives, based on the quantity of gypsum extracted during the
year compared with extraction capacity.
Provisions for site restoration are recognized as components of assets whenever the Group has a legal or constructive
obligation to restore a site in accordance with contractually determined conditions or in the event of a sudden deterioration
in site conditions. These provisions are reviewed periodically and may be discounted over the expected useful lives of the
assets concerned. The component is depreciated over the same useful life as that used for mines and quarries.
Government grants for purchases of property, plant and equipment are recorded under “Other payables” and taken to the
income statement over the estimated useful lives of the relevant assets.
Changes in Group structure and other changes in the period were not material.
Changes in property, plant and equipment in 2017 and 2016 are analyzed below:
In 2017, “Changes in Group structure and other” related mainly to newly consolidated companies in the Construction
Products Sector.
(in € millions)
Land and
quarries Buildings
Machinery and
equipment
Assets under
construction Total
At January 1, 2016
Gross value 2,493 8,500 19,549 1,064 31,606
Accumulated amortization and impairment (533) (4,911) (14,520) (55) (20,019)
Net value 1,960 3,589 5,029 1,009 11,587
Changes during the year
Acquisitions 50 63 329 928 1,370
Disposals (41) (18) (19) (7) (85)
Translation adjustments (7) (7) 30 (3) 13
Amortization and impairment (35) (264) (958) (2) (1,259)
Transfers 199 709 (908) 0
Changes in Group structure and other 23 (23) 28 0 28
Total changes (10) (50) 119 8 67
At December 31, 2016
Gross value 2,510 8,607 19,744 1,067 31,928
Accumulated depreciation and impairment (560) (5,068) (14,596) (50) (20,274)
Net value 1,950 3,539 5,148 1,017 11,654
Changes during the year
Acquisitions 15 68 269 1,186 1,538
Disposals (31) (18) (31) (17) (97)
Translation adjustments (67) (158) (251) (64) (540)
Amortization and impairment (33) (263) (883) (11) (1,190)
Transfers 213 687 (900) 0
Changes in Group structure and other 43 61 53 68 225
Total changes (73) (97) (156) 262 (64)
At December 31, 2017
Gross value 2,454 8,558 19,575 1,335 31,922
Accumulated amortization and impairment (577) (5,116) (14,583) (56) (20,332)
Net value 1,877 3,442 4,992 1,279 11,590
Consolidated financial statements of the Saint-Gobain Group
37
5.4. Finance leases and operating leases
Assets held under finance leases that transfer to the Group substantially all of the risks and rewards of ownership are
recognized as property, plant and equipment (land, buildings and equipment). They are recorded at the inception of the
lease term at the lower of the fair value of the leased assets and the present value of the minimum lease payments.
Property, plant and equipment acquired under finance leases are depreciated on a straight-line basis over the shorter of the
estimated useful life of the asset – determined using the same criteria as for assets owned by the Group – or the lease term.
The corresponding liability is shown in the balance sheet net of related interest.
Rental payments under operating leases are expensed as incurred.
In 2017, other movements in property, plant and equipment include an amount of €15 million (2016: €21 million) relating
to assets acquired under new finance leases not included in the cash flow statement in accordance with IAS 7. At
December 31, 2017, total property, plant and equipment acquired under finance leases amounted to €83 million
(December 31, 2016: €71 million).
5.5. Impairment review
5.5.1. Impairment of property, plant and equipment, intangible assets and goodwill
Property, plant and equipment, goodwill and other intangible assets are tested for impairment on a regular basis. These tests
consist of comparing the asset’s carrying amount to its recoverable amount. The recoverable amount is the higher of the
asset’s fair value less costs to sell and its value in use, calculated by reference to the net present value of the future cash
flows expected to be derived from the asset.
For property, plant and equipment and amortizable intangible assets, an impairment test is performed whenever revenues
from the asset decline or the asset generates operating losses due to either internal or external factors, and no material
improvement is forecast in the annual budget or the relevant business plan.
For goodwill and other intangible assets (including brands with indefinite useful lives), an impairment test is performed at
least annually based on the business plan. Goodwill is reviewed systematically and exhaustively at the level of each cash-
generating unit (CGU). The Group’s reporting segments are its business sectors, which may each include several CGUs. A
CGU is a reporting sub-segment, generally defined as a core business of the segment in a given geographic area. It typically
reflects the level at which the Group organizes its businesses and analyzes its results for internal reporting purposes. The
number of CGUs in both 2017 and 2016 was 30.
The method used for these impairment tests is consistent with that employed by the Group for the valuation of companies
acquired in business combinations or acquisitions of equity interests. The carrying amount of the CGUs is compared to
their value in use, corresponding to the net present value of future cash flows excluding interest but including tax. It is
determined using assumptions made by senior management based on estimates and judgments including future changes in
net sales, profitability, investments and other cash flows arising from the use of the corresponding assets, as well as the
discount rate applied to future cash flows. Cash flows for the last year of the business plan are rolled forward over the
following two years. For impairment tests of goodwill, normative cash flows (corresponding to cash flows at the mid-point
in the business cycle) are then projected to perpetuity using a low annual growth rate (generally 1.5%, except for emerging
markets or businesses with a high organic growth potential where a 2% rate is used). Growth data are supported by external
data issued by prominent organizations. The discount rate applied to these cash flows corresponds to the Group’s average
cost of capital (7.25% in 2017 and 2016) plus a country risk premium where appropriate depending on the geographic area
concerned. The discount rates applied in 2017 for the main operating regions were 7.25% for the Eurozone and North
America, 8.25% for Eastern Europe and emerging Asia-Pacific and 8.75% for South America, Russia and the Middle East.
The recoverable amount calculated using a post-tax discount rate gives the same result as a pre-tax rate applied to pre-tax
cash flows.
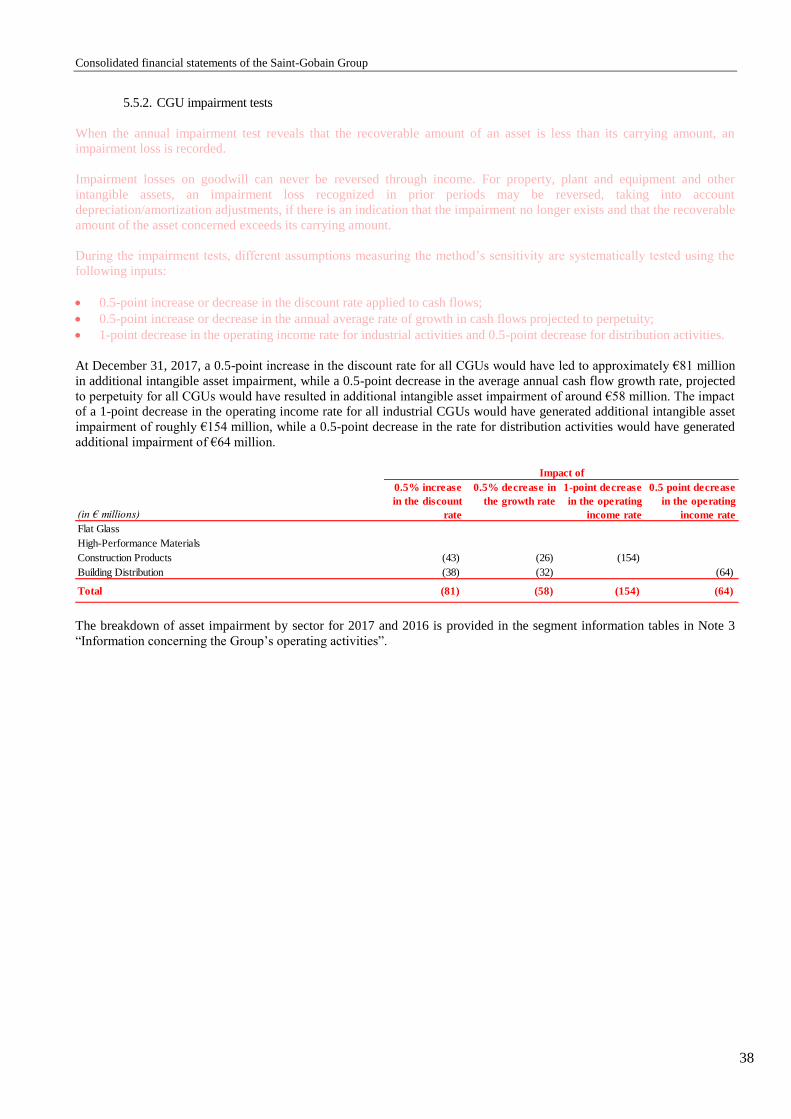
Consolidated financial statements of the Saint-Gobain Group
38
5.5.2. CGU impairment tests
When the annual impairment test reveals that the recoverable amount of an asset is less than its carrying amount, an
impairment loss is recorded.
Impairment losses on goodwill can never be reversed through income. For property, plant and equipment and other
intangible assets, an impairment loss recognized in prior periods may be reversed, taking into account
depreciation/amortization adjustments, if there is an indication that the impairment no longer exists and that the recoverable
amount of the asset concerned exceeds its carrying amount.
During the impairment tests, different assumptions measuring the method’s sensitivity are systematically tested using the
following inputs:
0.5-point increase or decrease in the discount rate applied to cash flows;
0.5-point increase or decrease in the annual average rate of growth in cash flows projected to perpetuity;
1-point decrease in the operating income rate for industrial activities and 0.5-point decrease for distribution activities.
At December 31, 2017, a 0.5-point increase in the discount rate for all CGUs would have led to approximately €81 million
in additional intangible asset impairment, while a 0.5-point decrease in the average annual cash flow growth rate, projected
to perpetuity for all CGUs would have resulted in additional intangible asset impairment of around €58 million. The impact
of a 1-point decrease in the operating income rate for all industrial CGUs would have generated additional intangible asset
impairment of roughly €154 million, while a 0.5-point decrease in the rate for distribution activities would have generated
additional impairment of €64 million.
The breakdown of asset impairment by sector for 2017 and 2016 is provided in the segment information tables in Note 3
“Information concerning the Group’s operating activities”.
(in € millions)
0.5% increase
in the discount
rate
0.5% decrease in
the growth rate
1-point decrease
in the operating
income rate
0.5 point decrease
in the operating
income rate
Flat Glass
High-Performance Materials
Construction Products (43) (26) (154)
Building Distribution (38) (32) (64)
Total (81) (58) (154) (64)
Impact of
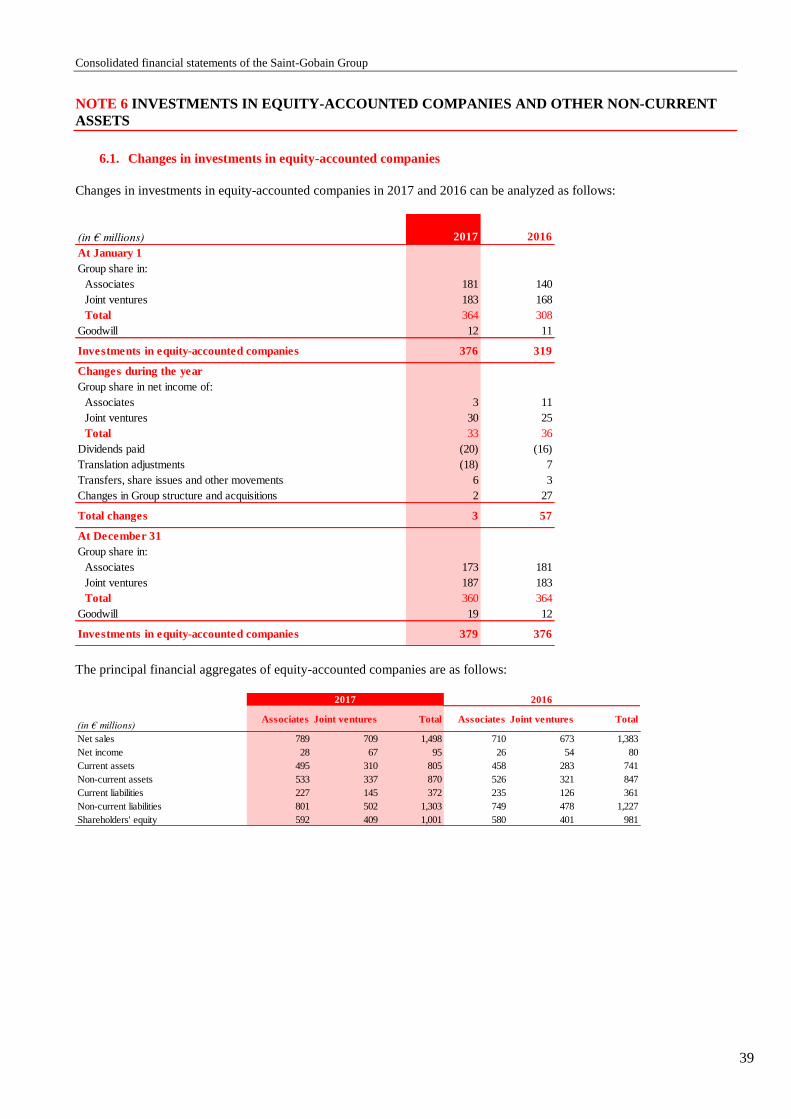
Consolidated financial statements of the Saint-Gobain Group
39
NOTE 6 INVESTMENTS IN EQUITY-ACCOUNTED COMPANIES AND OTHER NON-CURRENT
ASSETS
6.1. Changes in investments in equity-accounted companies
Changes in investments in equity-accounted companies in 2017 and 2016 can be analyzed as follows:
The principal financial aggregates of equity-accounted companies are as follows:
(in € millions) 2017 2016
At January 1
Group share in:
Associates 181 140
Joint ventures 183 168
Total 364 308
Goodwill 12 11
Investments in equity-accounted companies 376 319
Changes during the year
Group share in net income of:
Associates 3 11
Joint ventures 30 25
Total 33 36
Dividends paid (20) (16)
Translation adjustments (18) 7
Transfers, share issues and other movements 6 3
Changes in Group structure and acquisitions 2 27
Total changes 3 57
At December 31
Group share in:
Associates 173 181
Joint ventures 187 183
Total 360 364
Goodwill 19 12
Investments in equity-accounted companies 379 376
(in € millions)Associates Joint ventures Total Associates Joint ventures Total
Net sales 789 709 1,498 710 673 1,383
Net income 28 67 95 26 54 80
Current assets 495 310 805 458 283 741
Non-current assets 533 337 870 526 321 847
Current liabilities 227 145 372 235 126 361
Non-current liabilities 801 502 1,303 749 478 1,227
Shareholders' equity 592 409 1,001 580 401 981
2017 2016

Consolidated financial statements of the Saint-Gobain Group
40
6.2. Transactions with equity-accounted companies – related-parties
The consolidated financial statements include transactions conducted by the Group in the normal course of its businesses
with associates and joint ventures. These transactions are carried out on an arm’s length basis.
The assets and liabilities of equity-accounted companies at December 31 are as follows:
Purchases and sales with equity-accounted companies are as follows:
6.3. Transactions with key shareholders
Some subsidiaries of the Saint-Gobain Group, particularly in the Building Distribution Sector, carry out commercial
transactions with subsidiaries of the Wendel group. These transactions are carried out on an arm’s-length basis.
(in € millions) Dec. 31, 2017 Dec. 31, 2016
Financial receivables 1 1
Inventories 0 0
Short-term receivables 7 8
Cash and cash equivalents 0 0
Provisions for asset impairment 0 0
Short-term debt 2 2
Cash advances 0 0
(in € millions) 2017 2016
Purchases 2 2
Sales 40 43
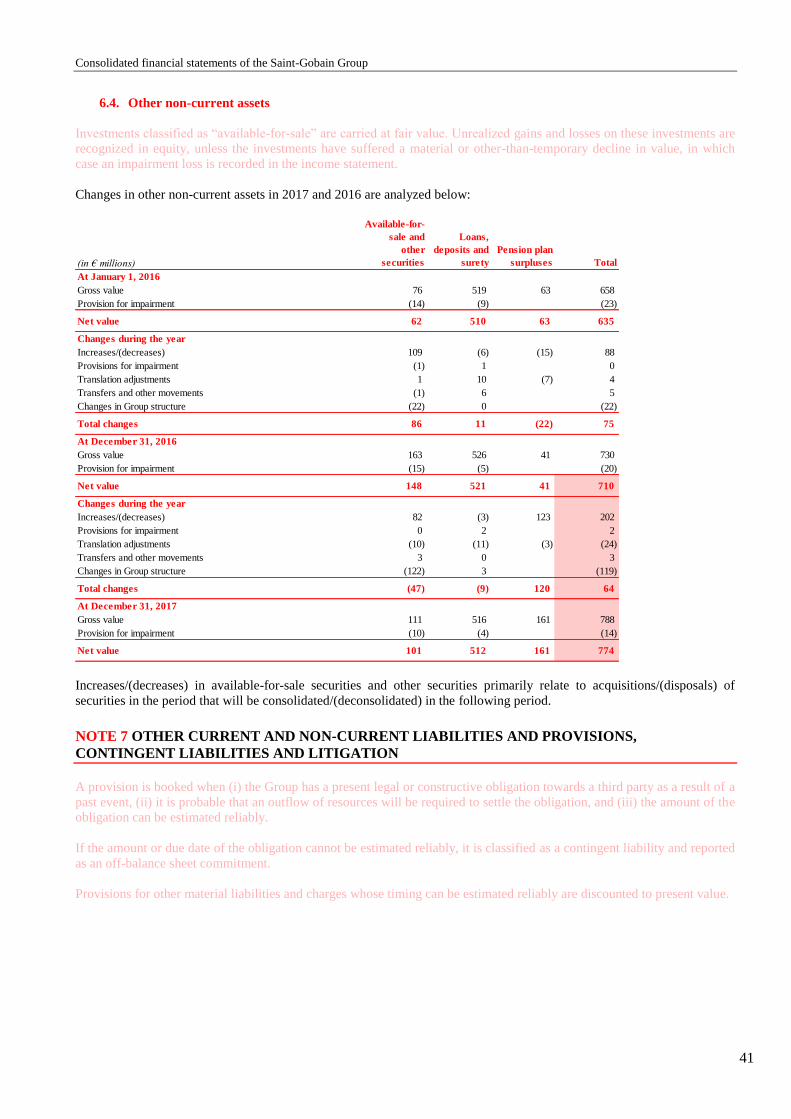
Consolidated financial statements of the Saint-Gobain Group
41
6.4. Other non-current assets
Investments classified as “available-for-sale” are carried at fair value. Unrealized gains and losses on these investments are
recognized in equity, unless the investments have suffered a material or other-than-temporary decline in value, in which
case an impairment loss is recorded in the income statement.
Changes in other non-current assets in 2017 and 2016 are analyzed below:
Increases/(decreases) in available-for-sale securities and other securities primarily relate to acquisitions/(disposals) of
securities in the period that will be consolidated/(deconsolidated) in the following period.
NOTE 7 OTHER CURRENT AND NON-CURRENT LIABILITIES AND PROVISIONS,
CONTINGENT LIABILITIES AND LITIGATION
A provision is booked when (i) the Group has a present legal or constructive obligation towards a third party as a result of a
past event, (ii) it is probable that an outflow of resources will be required to settle the obligation, and (iii) the amount of the
obligation can be estimated reliably.
If the amount or due date of the obligation cannot be estimated reliably, it is classified as a contingent liability and reported
as an off-balance sheet commitment.
Provisions for other material liabilities and charges whose timing can be estimated reliably are discounted to present value.
(in € millions)
Available-for-
sale and
other
securities
Loans,
deposits and
surety
Pension plan
surpluses Total
At January 1, 2016
Gross value 76 519 63 658
Provision for impairment (14) (9) (23)
Net value 62 510 63 635
Changes during the year
Increases/(decreases) 109 (6) (15) 88
Provisions for impairment (1) 1 0
Translation adjustments 1 10 (7) 4
Transfers and other movements (1) 6 5
Changes in Group structure (22) 0 (22)
Total changes 86 11 (22) 75
At December 31, 2016
Gross value 163 526 41 730
Provision for impairment (15) (5) (20)
Net value 148 521 41 710
Changes during the year
Increases/(decreases) 82 (3) 123 202
Provisions for impairment 0 2 2
Translation adjustments (10) (11) (3) (24)
Transfers and other movements 3 0 3
Changes in Group structure (122) 3 (119)
Total changes (47) (9) 120 64
At December 31, 2017
Gross value 111 516 161 788
Provision for impairment (10) (4) (14)
Net value 101 512 161 774

Consolidated financial statements of the Saint-Gobain Group
42
7.1. Provisions for other liabilities and charges
The table below provides a breakdown by type along with details of changes in other provisions and current and non-
current liabilities:
7.1.1. Provisions for claims and litigation
At December 31, 2017 and 2016, provisions for claims and litigation mainly covered asbestos-related lawsuits filed against
the Group. These provisions are described in further detail in Note 7.2 "Contingent liabilities and litigation".
7.1.2. Provisions for environmental risks
These provisions cover costs relating to environmental protection measures, as well as site rehabilitation and clean-up
costs.
7.1.3. Provisions for restructuring costs
Provisions for restructuring costs amounted to €79 million at December 31, 2017 (December 31, 2016: €99 million),
including net additions of €40 million during the year. The provisions primarily concern Benelux (€26 million), Germany
(€18 million), and the United Kingdom (€12 million).
7.1.4. Provisions for personnel expenses
These provisions primarily cover indemnities due to employees that are unrelated to the Group’s reorganization plans.
7.1.5. Provisions for customer warranties
These provisions cover the Group’s commitments under warranties granted to customers mainly in the United States. They
are determined on a statistical basis using a range of criteria and take into account contractual warranty payments made in
prior years in the business and region concerned. In addition, specific provisions may be set aside for identified risks.
7.1.6. Provisions for other contingencies
At December 31, 2017, provisions for other contingencies amounted to €235 million (December 31, 2016: €281 million)
and mainly concerned the United States (€59 million), France (€46 million), Germany (€43 million) and Brazil
(€39 million).
7.1.7. Investment-related liabilities
(in € millions)
Provisions
for claims and
litigation
Provisions for
environmental
risks
Provisions for
restructuring
costs
Provisions
for personnel
expenses
Provisions
for customer
warranties
Provisions for
other
contingencies
Total provisions
for other
liabilities
Investment-
related
liabilities Total
At January 1, 2016
Current portion 127 39 67 27 130 60 450 4 454
Non-current portion 468 124 72 56 125 247 1,092 184 1,276
Total provisions for other liabilities and investment-related
liabilities595 163 139 83 255 307 1,542 188 1,730
Movements during the year
Additions 144 15 49 43 70 60 381 381
Reversals (8) (4) (17) (14) (26) (65) (134) (134)
Utilizations (150) (12) (70) (11) (65) (33) (341) (341)
Changes in Group structure 0 0 0
Other (reclassifications and translation adjustments) 19 (4) (2) 4 (1) 12 28 14 42
Total movements 5 (5) (40) 22 (22) (26) (66) 14 (52)
At December 31, 2016
Current portion 125 36 52 29 122 60 424 12 436
Non-current portion 475 122 47 76 111 221 1,052 190 1,242
Total provisions for other liabilities and investment-related
liabilities600 158 99 105 233 281 1,476 202 1,678
Movements during the year
Additions 155 12 49 62 64 73 415 415
Reversals (3) (3) (9) (13) (23) (25) (76) (76)
Utilizations (135) (12) (58) (34) (54) (99) (392) (392)
Changes in Group structure 2 1 3 6 12 12
Other (reclassifications and translation adjustments) (71) (1) (4) (6) (25) (1) (108) (64) (172)
Total movements (54) (4) (20) 10 (35) (46) (149) (64) (213)
At December 31, 2017
Current portion 137 30 38 21 102 71 399 13 412
Non-current portion 409 124 41 94 96 164 928 125 1,053
Total provisions for other liabilities and investment-related
liabilities546 154 79 115 198 235 1,327 138 1,465
Consolidated financial statements of the Saint-Gobain Group
43
Investment-related liabilities correspond to commitments to purchase minority interests, liabilities relating to the
acquisition of shares in Group companies, and minority shareholder puts.
In 2017, changes in investment-related liabilities primarily concerned minority shareholder puts.
7.2. Contingent liabilities and litigation
7.2.1. Asbestos-related litigation
Current legal actions related to asbestos are described below.
7.2.1.1. Asbestos-related litigation in France
a) Inexcusable fault lawsuits
In France, 10 further individual lawsuits were filed in 2017 by former employees (or persons claiming through them) of
Everite and Saint-Gobain PAM which in the past had carried out fiber-cement operations for asbestos-related occupational
diseases they have or had. As at December 31, 2017, a total of 815 such lawsuits had been issued against the two
companies since 1996 with the aim of obtaining supplementary compensation over and above the amounts paid by the
French Social Security authorities in this respect.
As of December 31, 2017, 775 of these 815 lawsuits had been completed in terms of liability and quantum as well as in
terms of liability for the payment of compensation. In all these cases, the employers were held liable on the grounds of
“inexcusable fault”.
Compensation paid by Everite and Saint-Gobain PAM in settlement of these lawsuits totaled approximately €3 million.
Concerning the 40 lawsuits outstanding against Everite and Saint-Gobain PAM at December 31, 2017, seven have been
completed in terms of both liability and quantum, but liability for the payment of compensation has not yet been assigned.
Out of the 33 remaining lawsuits, at December 31, 2017 the procedures relating to the merits of 28 cases were at different
stages, with two in the process of being investigated by the French Social Security authorities and 26 pending before the
Social Security Courts or the Appeal Courts. The last five actions have been canceled but the plaintiffs may request their
restoration at any time within a two-year period following their cancellation.
In addition, as of December 31, 2017, 228 similar suits had been filed since the outset of the litigation by current or former
employees, or persons claiming through them, of 13 other French companies of the Group (excluding suits against
companies that are no longer part of the Group), in particular by current or former employees who used equipment
containing asbestos to protect themselves against heat from furnaces.
As of December 31, 2017, 191 lawsuits had been completed. In 110 of these cases, the employer was held liable for
“inexcusable fault”.
The compensation definitively paid by these companies totaled approximately €6.1 million. With regard to the 37 suits
outstanding at December 31, 2017, two cases were still at the investigation stage by the French Social Security authorities,
34 were being investigated – including 24 pending before the Social Security Courts, eight before the Appeal Courts and
two before the Civil Supreme Court (Court of Cassation). Lastly, one suit has been canceled but the plaintiff may request
its restoration at any time within a two-year period following its cancellation.
Consolidated financial statements of the Saint-Gobain Group
44
b) Anxiety claims
Eight of the Group’s French companies, including six that operate or have operated facilities classified as containing
asbestos, are subject of damages claims that are different from those described above.
“Facilities classified as containing asbestos” are defined as industrials facilities, that have been closed or are still operating,
which previously manufactured materials containing asbestos or used protection and insulation equipment containing
asbestos and are included by ministerial decree on the official list of facilities whose current or former employees are
entitled to the early-retirement benefits paid to asbestos workers (ACAATA).
At December 31, 2017, a total of 822 suits had been brought by current or former employees claiming compensation for
prejudice of anxiety suffered as a result of their alleged exposure to asbestos. None of these plaintiffs were suffering from
an asbestos-related disease and some of them were not receiving the ACAATA benefit. Of these 822 suits, 693 have been
terminated. Three plaintiffs had their claims dismissed, while for the 690 others who were recognized as having been
exposed to an asbestos risk, the total amount of compensation is €7.6 million at December 31, 2017. Of the remaining
129 suits, two are pending before the competent Appeal Courts and 116 have been canceled but the plaintiffs may request
their restoration at any time during a period of two years following their cancellation. Finally, six suits have been dismissed
by the competent labor tribunals and five plaintiffs have withdrawn the action they initiated.
It should be clarified that the figures above do not take into account suits filed against companies that are no longer part of
the Group.
7.2.1.2. Asbestos-related litigation in the United States
In the United States, several companies that once manufactured products containing asbestos such as asbestos-cement
pipes, roofing products, specialized insulation or gaskets, are facing legal action from persons other than their employees or
former employees. These claims for compensatory – and in some cases punitive – damages are based on alleged exposure
to these products, although in many instances the claimants cannot demonstrate any specific exposure to one or more
products, or any specific illness or physical disability. The vast majority of these claims are made simultaneously against
many other non-Group entities which have been manufacturers, distributors, installers or users of products containing
asbestos.
a) Developments in 2017
About 3,100 new claims were filed against CertainTeed in 2017, a slight decrease compared to the 3,200 filed in 2016.
Over the last few years, the number of new claims has remained relatively stable.
Almost all of the claims against CertainTeed are settled out of court or dismissed. Approximately 3,900 of the pending
claims were resolved in 2017, compared to 3,700 in 2016 and 4,600 in 2015. Taking into account the 35,100 outstanding
claims at the end of 2016 and the new claims having arisen during the year, as well as claims settled, around 34,300 claims
were outstanding at December 31, 2017. A large number of these pending claims were filed more than five years ago by
individuals without any significant asbestos-related impairment, and it is likely that many of these claims will ultimately be
dismissed.
b) Impact on the Group’s financial statements
The Group recorded a USD 102 million charge in 2017 to cover future developments in relation to claims. This amount is
stable compared to the amount recorded in 2016 and 2015. At December 31, 2017, the Group provision for asbestos-related
claims against CertainTeed in the United States amounts to USD 555 million (compared to USD 562 million at
December 31, 2016 and USD 581 million at December 31, 2015).
c) Cash flow impact
Compensation paid in respect of these claims against CertainTeed, including claims settled prior to 2017 but only paid out
in 2017, and those fully resolved and paid in 2017, and compensation paid in 2017 by other Group businesses in the United
States in connection with asbestos-related litigation, amounted to USD 76 million (compared to USD 97 million in 2016
and USD 65 million in 2015).

Consolidated financial statements of the Saint-Gobain Group
45
7.2.1.3. Situation in Brazil
In Brazil, former employees of Brasilit suffering from asbestos-related occupational illnesses are offered, depending on the
case, solely financial compensation, or otherwise lifetime medical assistance combined with financial compensation.
Around 1,200 contractual instruments were signed accordingly so far.
Two collective actions were initiated against Brasilit in 2017 by two associations defending the former exposed workers of
plants of São Caetano (SP) and Recife (PE), asking for reconsideration of medical assistance and compensation. These
cases are at very early stage for the moment.
Brasilit is subject to controls by the Ministry of Labor and continues to comply with all its legal obligations with regard to
medical assistance of employees and former employees.
In November 2017, the Supreme Court of Brazil has decided to ban asbestos definitively across the country. Brasilit
stopped using this material voluntarily as soon as 2002.
7.2.2. Anti-trust law and related proceedings
7.2.2.1. Investigation by the Swiss Competition Commission in the sanitary products wholesale
In November 2011, the Swiss Competition Commission (Commission Suisse de la Concurrence) opened an investigation
for anti-competitive practices in the sanitary products wholesale sector. In May 2014, the Commission Secretariat issued a
notification of complaints against Sanitas Troesch and against other wholesalers in the sector alleging that Sanitas Troesch
and some of its competitors had, among other things, agreed in 2005 and 2012 to lower gross prices.
The total fine decided against all the companies involved is CHF 80 million. For Sanitas Troesch, the fine is
CHF 28.5 million. Sanitas Troesch appealed this decision on May 2, 2016. Sanitas Troesch continues to firmly refute the
claims made; however, a provision for litigation was recognized at December 31, 2015 for an amount equivalent to the fine
(unchanged at December 31, 2017).
7.2.2.2. Investigation by the French Competition Authority in the building insulation products sector
On August 6, 2014, Saint-Gobain Isover and Compagnie de Saint-Gobain (as the parent company of Saint-Gobain Group)
received a notice of complaints from the French Competition Authority (Autorité de la Concurrence Française). The only
complaint made was of having exchanged allegedly strategic and confidential information, between 2002 and 2007,
relating to a certification request lodged by Actis before the Versailles Commercial Court for one of its products, and in
relation to a dispute between Actis and the mineral wool manufacturers’ association (FILMM), of which Saint-Gobain
Isover was a member.
Saint-Gobain Isover and Compagnie de Saint-Gobain are challenging this complaint. A hearing was held on May 11, 2016.
The Competition Authority’s final ruling was postponed to a date not yet known.
In the civil law area, in March 2013 Actis served a civil liability writ on Saint-Gobain Isover, the Centre Scientifique et
Technique du Bâtiment, and the FILMM before the Paris Civil Court (Tribunal de Grande Instance) for the adverse
consequences of facts forming the subject of the investigation by the Competition Authority. In an order dated
December 16, 2014, the pre-trial judge declared a stay of proceedings while waiting for the decision from the Competition
Authority.
7.2.2.3. Investigation by the Anti-trust Division of the United States Department of Justice in the United States
drywall industry
In July 2015, the Anti-trust division of the United States Department of Justice opened a criminal investigation into
potential anti-competitive practices, specifically a price agreement, in the United States drywall industry. This investigation
followed complaints filed in late 2012 in the form of class actions in the civil courts against eight drywall manufacturers in
the sector, including CertainTeed, by some of their customers.
On the basis of testimony and documents submitted in the civil proceedings, CertainTeed and its attorneys have not
identified any element that might create liability for CertainTeed, and as a result filed a motion for summary judgment in
May 2015 in order to end the civil proceedings. This application was accepted on February 18, 2016 by the competent
court. An appeal against this decision is still possible.
Consolidated financial statements of the Saint-Gobain Group
46
7.2.3. Environmental-related litigation
7.2.3.1. PFOA matters in the United States
Levels of PFOA (perfluorooctanoic acid) in excess of U.S. Environmental Protection Agency (EPA) or state health
advisories have been found in municipal water systems and private wells near current Saint-Gobain Performance Plastics
(SG PPL) facilities in Hoosick Falls (New York) and Merrimack (New Hampshire), and two former facilities in North
Bennington (Vermont) in the United States. PFOA and PTFE (polytetrafluorethylene) have never been manufactured by
these plants. SG PPL is a processor of PTFE which it purchases from third party suppliers and which in the past contained
traces of PFOA.
SG PPL has voluntarily provided bottled water in all three communities, installed point-of-entry treatment systems to
residents and businesses in the Hoosick Falls and North Bennington areas, and installed carbon filtration systems on the
municipal water supply in Hoosick Falls. In addition, it has voluntarily committed to fund water line extensions in certain
communities in the Merrimack and Bennington areas. The investigations are on-going and the scope of responsibility for
SG PPL arising from environmental remediation and clean-up obligations at these sites has not yet been established.
Without admitting liability, SGPPL has signed consent orders with the environmental regulators in New York and Vermont
pursuant to which SGPPL has agreed to complete investigations and implement interim remediation measures.
Responsibility, if any, is expected to be shared with other parties as regards in particular the Hoosick Falls’ site.
PFOA-related lawsuits alleging both health-related and economic damages claims have been filed in civil courts in New
York, New Hampshire and Vermont, some of which are in the form of proposed class actions. It is difficult to predict the
timing or outcome of any such litigation, or whether any additional litigation will be brought against SG PPL.
On December 31, 2017, the provision recorded by the Company in respect of this matter amounts to € 44 million.
7.2.4. Other potential liabilities
7.2.4.1. Grenfell Tower fire in the United Kingdom
At the time of the refurbishing of the Grenfell Tower in 2015, Celotex sold through distributors an insulation product for
use as part of multicomponent ventilated rainscreen cladding system.
Following the Grenfell Tower fire on June 14, 2017, investigations are ongoing, and, in this context, Celotex as well as
more than 60 other companies or organizations, is heard by the British authorities.
7.2.5. Other proceedings and disputes
Some of the Group’s companies may also be the subject of other claims made by their employees or by the tax authorities.
Apart from the proceedings and litigation described above, to the best of the Company’s knowledge no other government,
court or arbitration proceedings exist (including pending proceedings or proceedings where the Company and/or the Group
might be threatened) which could have or which has had, in the last 12 months, a significant impact on the financial or
profit position of the Company and/or Group.

Consolidated financial statements of the Saint-Gobain Group
47
NOTE 8 FINANCING AND FINANCIAL INSTRUMENTS
8.1. Risk factors: financial risks
8.1.1. Liquidity risk
a) Liquidity risk on financing
In a crisis environment, the Group might be unable to raise the financing or refinancing needed to cover its investment
plans on the credit or capital markets, or to obtain such financing or refinancing on acceptable terms.
The Group’s overall exposure to liquidity risk on its net debt is managed by the Treasury and Financing Department of
Compagnie de Saint-Gobain, the Group’s parent company. The subsidiaries generally enter into short- or long-term
financing arrangements with Compagnie de Saint-Gobain or with the National Delegations’ cash pools.
The Group’s policy is to ensure that the Group’s financing will be rolled over at maturity and to optimize borrowing costs.
Long-term debt therefore systematically represents a high percentage of overall debt. At the same time, the maturity
schedules of long-term debt are set in such a way that replacement capital market issues are spread over time.
The Group’s main source of long-term financing is bonds, which are generally issued under the Medium Term Notes
program. Saint-Gobain also uses perpetual bonds, participating securities, a long-term securitization program, bank
borrowings and lease financing.
Short-term debt comprises borrowings under Negotiable European Commercial Paper (NEU CP), and occasionally Euro
Commercial Paper and US Commercial Paper, but also includes receivables securitization programs and bank financing.
Financial assets comprise marketable securities and cash and cash equivalents.
Compagnie de Saint-Gobain’s liquidity position is secured by confirmed syndicated lines of credit.
A breakdown of long- and short-term debt by type and maturity is provided in Note 8.3, which also details the main
characteristics of the Group’s financing programs and confirmed credit lines.
Saint-Gobain’s long-term debt issues have been rated BBB with a stable outlook by Standard & Poor’s since
December 9, 2014.
Saint-Gobain’s long-term debt issues have been rated Baa2 with a stable outlook by Moody’s since December 9, 2014.
There is no guarantee that the Company will be in a position to maintain its credit risk ratings at current levels. Any
deterioration in the Group’s credit risk rating could limit its capacity to raise funds and could lead to higher rates of interest
on future borrowings.
b) Liquidity risk on investments
Short-term investments consist of bank deposits and mutual fund units. To reduce liquidity and high volatility risks,
whenever possible, the Group invests in money market and/or bond funds.

Consolidated financial statements of the Saint-Gobain Group
48
8.1.2. Market risks
a) Interest rate risks
The Group’s overall exposure to interest rate risk on consolidated debt is managed by the Treasury and Financing
Department of Compagnie de Saint-Gobain. Where subsidiaries use derivatives to hedge interest rate risks, their
counterparty is generally Compagnie de Saint-Gobain, the Group’s parent company.
The Group’s policy is aimed at fixing the cost of its medium-term debt against interest rate risk and optimizing borrowing
costs. According to Group policy, the derivative financial instruments used to hedge these risks can include interest rate
swaps, cross-currency swaps, options – including caps, floors and swaptions – and forward rate agreements.
The table below shows the sensitivity at December 31, 2017 of pre-tax income and pre-tax equity to fluctuations in the
interest rate on the Group’s net debt after hedging:
Note 8.4 to the consolidated financial statements provides a breakdown of interest rate risk hedging instruments and of
gross debt by rate type (fixed or variable) after hedging.
b) Foreign exchange risk
The currency hedging policies described below could be insufficient to protect the Group against unexpected or sharper
than expected fluctuations in exchange rates resulting from economic and financial market conditions.
Foreign exchange risks are managed by hedging virtually all transactions entered into by Group entities in currencies other
than their functional currencies. Compagnie de Saint-Gobain and its subsidiaries may use forward contracts and options to
hedge exposures arising from current and forecast transactions.
The subsidiaries set up contracts generally through the Group’s parent company, Compagnie de Saint-Gobain, which then
carries out the corresponding forex hedging transaction, or through the National Delegations’ cash pools. Failing this,
contracts are taken out with one of the subsidiary’s banks.
Most forward contracts have short maturities of around three months. However, forward contracts taken out to hedge firm
orders may have longer terms.
The Group monitors its exposure to foreign exchange risk using a monthly reporting system that captures the foreign
exchange positions taken by its subsidiaries. At December 31, 2017, 98% of the Group’s foreign exchange exposure
eligible for hedging was hedged.
The residual net foreign exchange exposure of subsidiaries for the currencies presented below was as follows at
December 31, 2017:
(in € millions)
Impact on
pre-tax
income
Impact on
pre-tax
equity
Interest rate increase of 50 basis points 10 7
Interest rate decrease of 50 basis points (10) (7)
(in millions of euro equivalent) Long Short
EUR 1 5
USD 13 7
Other currencies 0 4
Total 14 16
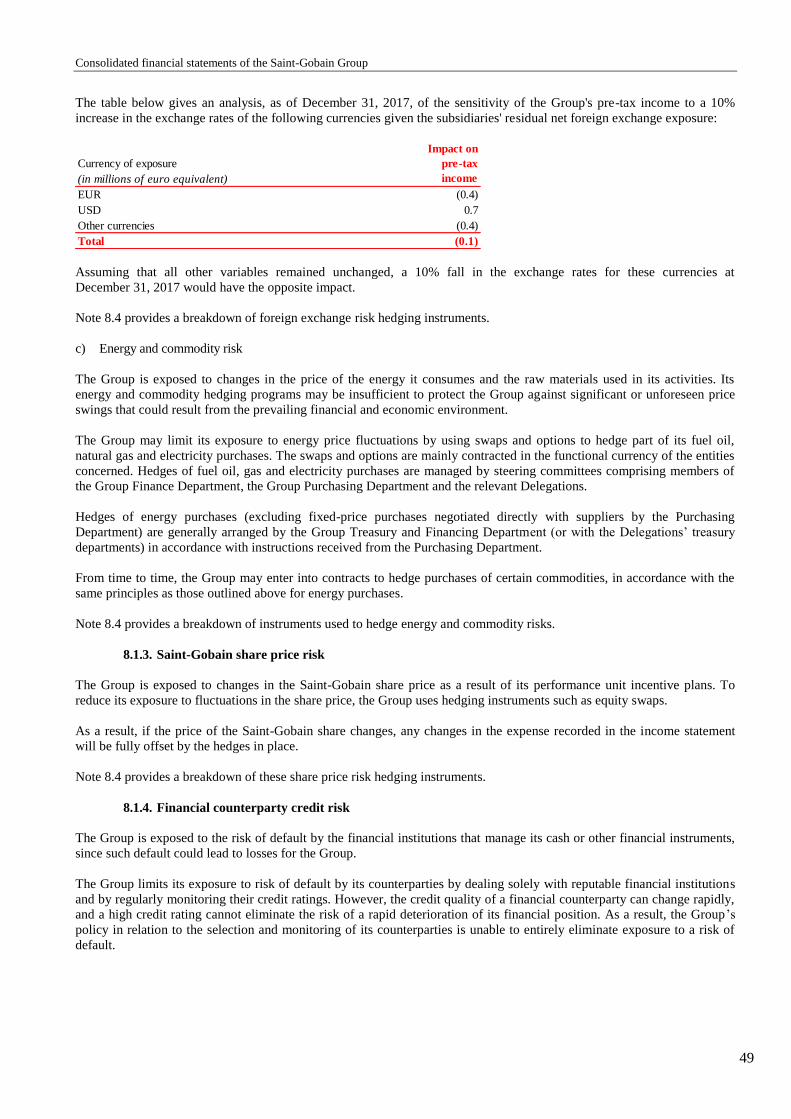
Consolidated financial statements of the Saint-Gobain Group
49
The table below gives an analysis, as of December 31, 2017, of the sensitivity of the Group's pre-tax income to a 10%
increase in the exchange rates of the following currencies given the subsidiaries' residual net foreign exchange exposure:
Assuming that all other variables remained unchanged, a 10% fall in the exchange rates for these currencies at
December 31, 2017 would have the opposite impact.
Note 8.4 provides a breakdown of foreign exchange risk hedging instruments.
c) Energy and commodity risk
The Group is exposed to changes in the price of the energy it consumes and the raw materials used in its activities. Its
energy and commodity hedging programs may be insufficient to protect the Group against significant or unforeseen price
swings that could result from the prevailing financial and economic environment.
The Group may limit its exposure to energy price fluctuations by using swaps and options to hedge part of its fuel oil,
natural gas and electricity purchases. The swaps and options are mainly contracted in the functional currency of the entities
concerned. Hedges of fuel oil, gas and electricity purchases are managed by steering committees comprising members of
the Group Finance Department, the Group Purchasing Department and the relevant Delegations.
Hedges of energy purchases (excluding fixed-price purchases negotiated directly with suppliers by the Purchasing
Department) are generally arranged by the Group Treasury and Financing Department (or with the Delegations’ treasury
departments) in accordance with instructions received from the Purchasing Department.
From time to time, the Group may enter into contracts to hedge purchases of certain commodities, in accordance with the
same principles as those outlined above for energy purchases.
Note 8.4 provides a breakdown of instruments used to hedge energy and commodity risks.
8.1.3. Saint-Gobain share price risk
The Group is exposed to changes in the Saint-Gobain share price as a result of its performance unit incentive plans. To
reduce its exposure to fluctuations in the share price, the Group uses hedging instruments such as equity swaps.
As a result, if the price of the Saint-Gobain share changes, any changes in the expense recorded in the income statement
will be fully offset by the hedges in place.
Note 8.4 provides a breakdown of these share price risk hedging instruments.
8.1.4. Financial counterparty credit risk
The Group is exposed to the risk of default by the financial institutions that manage its cash or other financial instruments,
since such default could lead to losses for the Group.
The Group limits its exposure to risk of default by its counterparties by dealing solely with reputable financial institutions
and by regularly monitoring their credit ratings. However, the credit quality of a financial counterparty can change rapidly,
and a high credit rating cannot eliminate the risk of a rapid deterioration of its financial position. As a result, the Group’s
policy in relation to the selection and monitoring of its counterparties is unable to entirely eliminate exposure to a risk of
default.
Currency of exposure
(in millions of euro equivalent)
Impact on
pre-tax
income
EUR (0.4)
USD 0.7
Other currencies (0.4)
Total (0.1)
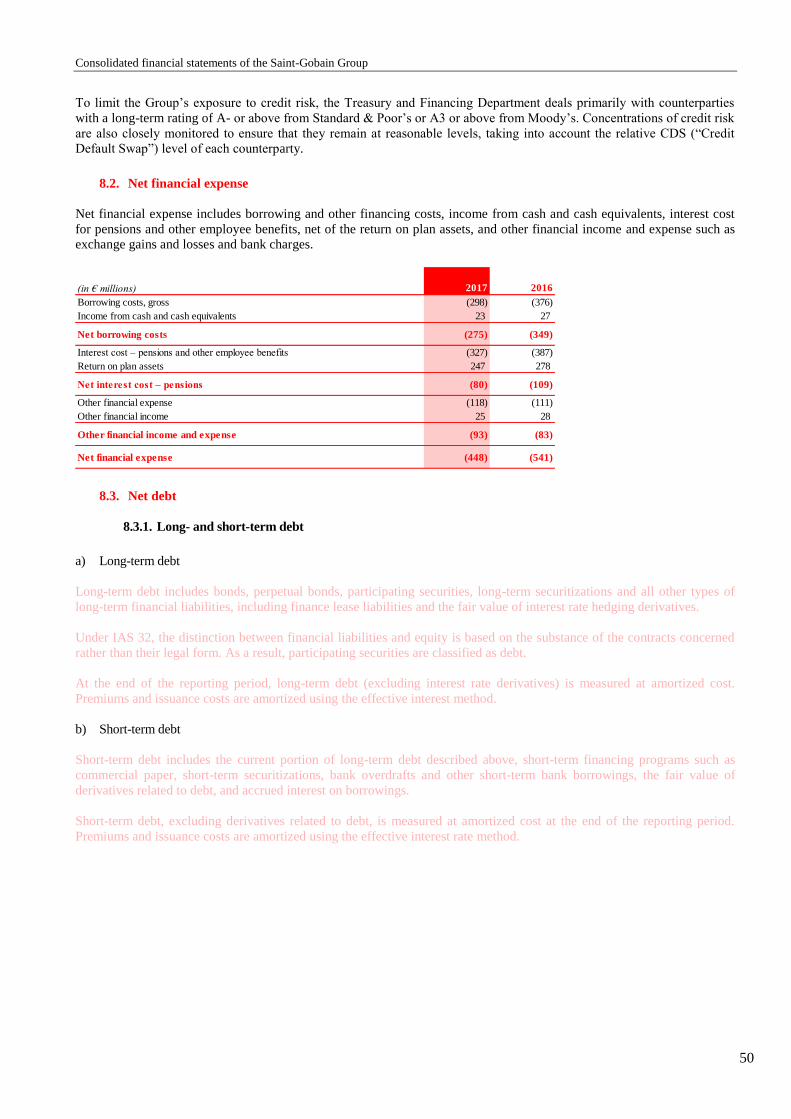
Consolidated financial statements of the Saint-Gobain Group
50
To limit the Group’s exposure to credit risk, the Treasury and Financing Department deals primarily with counterparties
with a long-term rating of A- or above from Standard & Poor’s or A3 or above from Moody’s. Concentrations of credit risk
are also closely monitored to ensure that they remain at reasonable levels, taking into account the relative CDS (“Credit
Default Swap”) level of each counterparty.
8.2. Net financial expense
Net financial expense includes borrowing and other financing costs, income from cash and cash equivalents, interest cost
for pensions and other employee benefits, net of the return on plan assets, and other financial income and expense such as
exchange gains and losses and bank charges.
8.3. Net debt
8.3.1. Long- and short-term debt
a) Long-term debt
Long-term debt includes bonds, perpetual bonds, participating securities, long-term securitizations and all other types of
long-term financial liabilities, including finance lease liabilities and the fair value of interest rate hedging derivatives.
Under IAS 32, the distinction between financial liabilities and equity is based on the substance of the contracts concerned
rather than their legal form. As a result, participating securities are classified as debt.
At the end of the reporting period, long-term debt (excluding interest rate derivatives) is measured at amortized cost.
Premiums and issuance costs are amortized using the effective interest method.
b) Short-term debt
Short-term debt includes the current portion of long-term debt described above, short-term financing programs such as
commercial paper, short-term securitizations, bank overdrafts and other short-term bank borrowings, the fair value of
derivatives related to debt, and accrued interest on borrowings.
Short-term debt, excluding derivatives related to debt, is measured at amortized cost at the end of the reporting period.
Premiums and issuance costs are amortized using the effective interest rate method.
(in € millions) 2017 2016
Borrowing costs, gross (298) (376)
Income from cash and cash equivalents 23 27
Net borrowing costs (275) (349)
Interest cost – pensions and other employee benefits (327) (387)
Return on plan assets 247 278
Net interest cost – pensions (80) (109)
Other financial expense (118) (111)
Other financial income 25 28
Other financial income and expense (93) (83)
Net financial expense (448) (541)
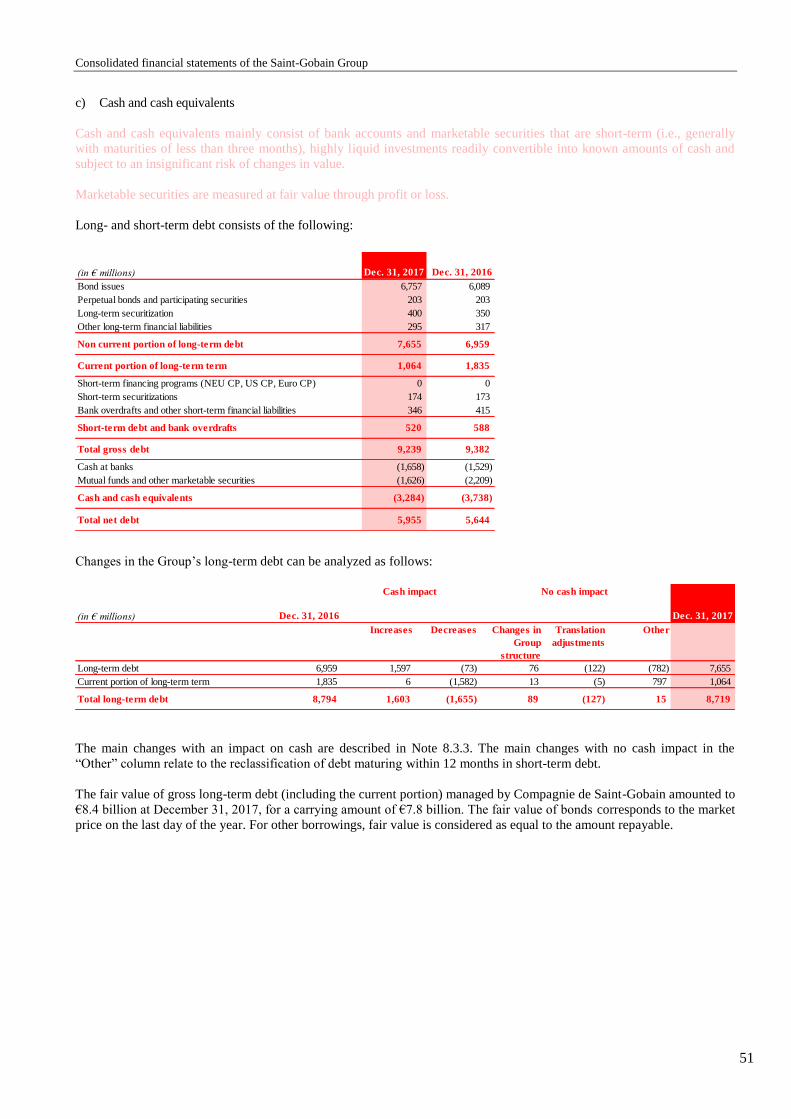
Consolidated financial statements of the Saint-Gobain Group
51
c) Cash and cash equivalents
Cash and cash equivalents mainly consist of bank accounts and marketable securities that are short-term (i.e., generally
with maturities of less than three months), highly liquid investments readily convertible into known amounts of cash and
subject to an insignificant risk of changes in value.
Marketable securities are measured at fair value through profit or loss.
Long- and short-term debt consists of the following:
Changes in the Group’s long-term debt can be analyzed as follows:
The main changes with an impact on cash are described in Note 8.3.3. The main changes with no cash impact in the
“Other” column relate to the reclassification of debt maturing within 12 months in short-term debt.
The fair value of gross long-term debt (including the current portion) managed by Compagnie de Saint-Gobain amounted to
€8.4 billion at December 31, 2017, for a carrying amount of €7.8 billion. The fair value of bonds corresponds to the market
price on the last day of the year. For other borrowings, fair value is considered as equal to the amount repayable.
(in € millions) Dec. 31, 2017 Dec. 31, 2016
Bond issues 6,757 6,089
Perpetual bonds and participating securities 203 203
Long-term securitization 400 350
Other long-term financial liabilities 295 317
Non current portion of long-term debt 7,655 6,959
Current portion of long-term term 1,064 1,835
Short-term financing programs (NEU CP, US CP, Euro CP) 0 0
Short-term securitizations 174 173
Bank overdrafts and other short-term financial liabilities 346 415
Short-term debt and bank overdrafts 520 588
Total gross debt 9,239 9,382
Cash at banks (1,658) (1,529)
Mutual funds and other marketable securities (1,626) (2,209)
Cash and cash equivalents (3,284) (3,738)
Total net debt 5,955 5,644
(in € millions) Dec. 31, 2016 Dec. 31, 2017
Increases Decreases Changes in
Group
structure
Translation
adjustments
Other
Long-term debt 6,959 1,597 (73) 76 (122) (782) 7,655
Current portion of long-term term 1,835 6 (1,582) 13 (5) 797 1,064
Total long-term debt 8,794 1,603 (1,655) 89 (127) 15 8,719
No cash impactCash impact
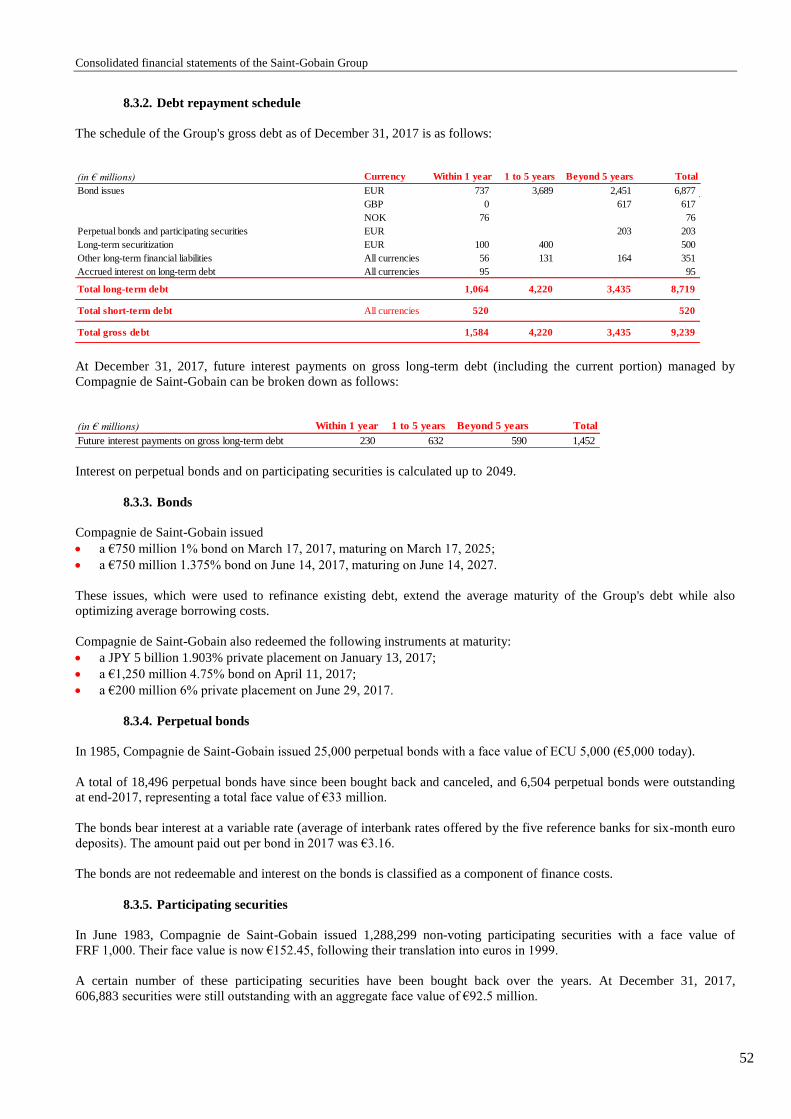
Consolidated financial statements of the Saint-Gobain Group
52
8.3.2. Debt repayment schedule
The schedule of the Group's gross debt as of December 31, 2017 is as follows:
At December 31, 2017, future interest payments on gross long-term debt (including the current portion) managed by
Compagnie de Saint-Gobain can be broken down as follows:
Interest on perpetual bonds and on participating securities is calculated up to 2049.
8.3.3. Bonds
Compagnie de Saint-Gobain issued
a €750 million 1% bond on March 17, 2017, maturing on March 17, 2025;
a €750 million 1.375% bond on June 14, 2017, maturing on June 14, 2027.
These issues, which were used to refinance existing debt, extend the average maturity of the Group's debt while also
optimizing average borrowing costs.
Compagnie de Saint-Gobain also redeemed the following instruments at maturity:
a JPY 5 billion 1.903% private placement on January 13, 2017;
a €1,250 million 4.75% bond on April 11, 2017;
a €200 million 6% private placement on June 29, 2017.
8.3.4. Perpetual bonds
In 1985, Compagnie de Saint-Gobain issued 25,000 perpetual bonds with a face value of ECU 5,000 (€5,000 today).
A total of 18,496 perpetual bonds have since been bought back and canceled, and 6,504 perpetual bonds were outstanding
at end-2017, representing a total face value of €33 million.
The bonds bear interest at a variable rate (average of interbank rates offered by the five reference banks for six-month euro
deposits). The amount paid out per bond in 2017 was €3.16.
The bonds are not redeemable and interest on the bonds is classified as a component of finance costs.
8.3.5. Participating securities
In June 1983, Compagnie de Saint-Gobain issued 1,288,299 non-voting participating securities with a face value of
FRF 1,000. Their face value is now €152.45, following their translation into euros in 1999.
A certain number of these participating securities have been bought back over the years. At December 31, 2017,
606,883 securities were still outstanding with an aggregate face value of €92.5 million.
(in € millions) Currency Within 1 year 1 to 5 years Beyond 5 years Total
Bond issues EUR 737 3,689 2,451 6,877
GBP 0 617 617
NOK 76 76
Perpetual bonds and participating securities EUR 203 203
Long-term securitization EUR 100 400 500
Other long-term financial liabilities All currencies 56 131 164 351
Accrued interest on long-term debt All currencies 95 95
Total long-term debt 1,064 4,220 3,435 8,719
Total short-term debt All currencies 520 520
Total gross debt 1,584 4,220 3,435 9,239
(in € millions) Within 1 year 1 to 5 years Beyond 5 years Total
Future interest payments on gross long-term debt 230 632 590 1,452

Consolidated financial statements of the Saint-Gobain Group
53
Interest on the securities ranges from 75% to 125% of the average corporate bond yield (TMO), based on the Group’s
consolidated income. The amount paid out per security in 2017 was €1.36.
In April 1984, 194,633 non-voting participating securities were issued with a face value of ECU 1,000 (€1,000 today).
A certain number of these securities have been bought back over the years. At December 31, 2017, 77,516 securities were
still outstanding with an aggregate face value of €77.5 million.
Interest comprises (i) a fixed portion of 7.5% paid per year applicable to 60% of the nominal amount of the security, and
(ii) a variable portion applicable to the remaining 40% of the nominal amount of the participating security, which is linked
to consolidated net income of the previous year and to the reference six-month Libor EUR rate +7/8%. The amount paid
per security in 2017 was €65.35, paid in two installments (€32.55 and €32.80).
These participating securities are not redeemable and the interest paid on them is reported under borrowing costs.
8.3.6. Financing programs
The Group has a number of medium- and long-term financing programs (Medium-Term Notes) and short-term financing
programs (Commercial Paper).
At December 31, 2017, issuance under these programs was as follows:
* Equivalent of USD 1,000 million based on the exchange rate at December 31, 2017.
In accordance with market practices, Negotiable European Commercial Paper (NEU CP), US Commercial Paper and Euro
Commercial Paper are generally issued with maturities of one to six months. They are treated as variable-rate debt since they are
rolled over at frequent intervals.
8.3.7. Syndicated lines of credit
Compagnie de Saint-Gobain has two syndicated lines of credit that are intended to provide a secure source of financing for
the Group (including as additional backing for its NEU CP, US Commercial Paper and Euro Commercial Paper programs):
a €2.5 billion syndicated line of credit which was contracted in December 2013. This facility was renegotiated in
December 2017 and rolled over until December 2022, with two further one-year rollover options;
a second €1.5 billion syndicated line of credit which was contracted in December 2017. This facility expires in
December 2022 and has two one-year rollover options. It replaces a syndicated line of credit for an equivalent amount
initially maturing in 2018.
Based on the Group’s current credit rating for long-term debt issues, the two facilities are not subject to any hard covenants.
Neither of these two lines of credit had been drawn down at December 31, 2017.
(in € millions)
Authorized
drawings
Authorized limits
at Dec. 31, 2017
Balance
outstanding
at Dec. 31, 2017
Balance
outstanding
at Dec. 31,
2016
Medium Term Notes 15,000 7,776 7,777
NEU CP up to 12 months 3,000 0
US Commercial Paper up to 12 months 834 * 0
Euro Commercial Paper up to 12 months 834 * 0
Consolidated financial statements of the Saint-Gobain Group
54
8.3.8. Receivables securitization programs
The Group has set up two receivables securitization programs, one through its French subsidiary Point.P Finances GIE, and
the other through its US subsidiary, Saint-Gobain Receivables Corporation.
The French program was rolled over on November 10, 2016 for a maximum amount of €500 million. It amounted to €500
million at both December 31, 2017 and December 31, 2016. Based on observed seasonal fluctuations in receivables
included in the program and on the contract’s features, €400 million of this amount was classified as non-current and the
balance as current.
The US program was renewed on October 21, 2015 for a maximum amount of $350 million. Its euro-equivalent value at
December 31, 2017 was €174 million (December 31, 2016: €173 million).
8.3.9. Collateral
At December 31, 2017, €11 million of Group debt was secured by various non-current assets (real estate and securities).
8.4. Financial instruments
The Group uses interest rate, foreign exchange and commodity derivatives to hedge its exposure to changes in interest
rates, exchange rates and commodity prices that may arise in the normal course of business.
In accordance with IAS 32 and IAS 39, all such instruments are recognized in the balance sheet and measured at fair value,
irrespective of whether or not they are part of a hedging relationship that qualifies for hedge accounting under IAS 39.
Changes in the fair value of both derivatives that are designated and qualified as fair value hedges and derivatives that do
not qualify for hedge accounting during the period are taken to the income statement (in business income and expense for
operational foreign exchange derivatives and commodity derivatives not qualifying for hedge accounting, and in net
financial income and expense for all other derivatives). However, in the case of derivatives that qualify as cash flow
hedges, the effective portion of the gain or loss arising from changes in fair value is recognized directly in equity, and only
the ineffective portion is recognized in the income statement.
a) Fair value hedges
Fair value hedge accounting is applied by the Group mainly for derivative instruments which swap fixed rates against
variable rates (fixed-for-floating interest rate swaps). These derivatives hedge fixed-rate debts exposed to a fair value risk.
In accordance with hedge accounting principles, debt included in a designated fair value hedging relationship is remeasured
at fair value and to the extent of the risk hedged. As the loss or gain on the underlying hedged item offsets the effective
portion of the gain or loss on the fair value hedge, the income statement is only impacted by the ineffective portion of the
hedge.
b) Cash flow hedges
Cash flow hedge accounting is applied by the Group mainly for derivative instruments which fix the cost of future
investments (financial assets or property, plant and equipment) and the price of future purchases, mostly gas and fuel oil
(commodity swaps) or foreign currencies (foreign exchange forwards). Transactions hedged by these instruments are
qualified as highly probable. The application of cash flow hedge accounting allows the Group to defer the impact on the
income statement of the effective portion of changes in the fair value of these derivatives by recording them in a hedging
reserve in equity. This reserve is reclassified to the income statement when the hedged transaction occurs and the hedged
item itself affects income. In the same way as for fair value hedges, cash flow hedging limits the Group’s exposure to
changes in the fair value of these derivatives to the ineffective portion of the hedge.
c) Derivatives that do not qualify for hedge accounting
Changes in the fair value of derivatives that do not qualify for hedge accounting are recognized in the income statement.
Instruments concerned are primarily foreign exchange swaps and foreign exchange forwards.

Consolidated financial statements of the Saint-Gobain Group
55
d) Fair value of financial instruments
The fair value of financial assets and financial liabilities corresponds to their quoted price on an active market (if any): this
represents level 1 in the fair value hierarchy defined in IFRS 7 and IFRS 13. The fair value of instruments not quoted in an
active market, such as derivatives or financial assets and liabilities, is determined by reference to commonly used valuation
techniques such as the fair value of another recent and similar transaction, or discounted cash flow analysis based on
observable market inputs. This represents level 2 in the fair value hierarchy defined in IFRS 7 and IFRS 13.
The fair value of short-term financial assets and liabilities is considered as being the same as their carrying amount due to
their short maturities.
The following table presents a breakdown of the principal derivatives used by the Group:
8.4.1. Currency instruments
Currency swaps
The Group uses currency swaps mainly to convert euro-denominated funds into foreign currencies for cash management
purposes.
Forward foreign exchange contracts and currency options
Forward foreign exchange contracts and currency options are used to hedge foreign currency transactions, particularly
commercial transactions (purchases and sales) and investments.
8.4.2. Interest rate instruments
Interest rate swaps
The Group uses interest rate swaps to convert part of its fixed (variable) rate bank debt and bond debt to variable (fixed)
rates.
Cross-currency swaps
The Group uses cross-currency swaps to convert foreign currency debt (euro debt) into euro debt (foreign currency debt).
(in € millions)
Derivatives
recorded in
assets
Derivatives
recorded in
liabilities Dec. 31, 2017 Dec. 31, 2016 Within 1 year 1 to 5 years
Beyond 5
years Dec. 31, 2017
Fair value hedges 0 0 0
Cash flow hedges
Currency 6 (23) (17) 231 2,782 0 0 2,782
Interest rate 0 (71) (71) (70) 0 0 377 377
Energy and commodities 4 0 4 5 18 0 0 18
Other risks: equities 14 0 14 13 0 30 47 77
Cash flow hedges – total 24 (94) (70) 179 2,800 30 424 3,254
Currency 83 (11) 72 (5) 6,185 12 0 6,197
Interest rate 0 0 0 0 0 0 0 0
Energy and commodities 0 0 0 0 0 0 0 0
Derivatives not qualifying for hedge accounting – total 83 (11) 72 (5) 6,185 12 0 6,197
Total 107 (105) 2 174 8,985 42 424 9,451
Derivatives not qualifying for hedge accounting mainly contracted
by Compagnie de Saint-Gobain
Fair value Nominal amount by maturity

Consolidated financial statements of the Saint-Gobain Group
56
8.4.3. Energy and commodity instruments
Energy and commodity swaps
Energy and commodity swaps are used to hedge the risk of changes in the price of certain purchases used in the Group
subsidiaries’ operating activities, particularly energy (fuel oil, natural gas and electricity) purchases.
8.4.4. Other risks
Equity derivatives
Equity derivatives are used to hedge the risk of changes in the Saint-Gobain share price in connection with the performance
units long-term incentive plan.
8.4.5. Credit value adjustments to derivative instruments
Credit value adjustments to derivative instruments are calculated in accordance with IFRS 13 based on historical
probabilities of default derived from calculations performed by a leading rating agency and on the estimated loss given
default. At December 31, 2017, credit value adjustments were not material.
8.4.6. Impact on equity of financial instruments qualifying for cash flow hedge accounting
At December 31, 2017, the cash flow hedging reserve carried in equity in accordance with IFRS had a credit balance of €21
million, consisting mainly of:
a debit balance of €29 million in relation to cross-currency swaps designated as cash flow hedges that are used to
convert a GBP bond issue into euros;
a credit balance of €49 million corresponding to changes in the fair value of currency hedges taken out in relation to
the acquisition of a controlling interest in Sika, breaking down as:
a credit balance of €70 million taken to equity when the initial hedge was unwound,
a debit balance of €21 million corresponding to changes in the fair value of the new hedge, measured at a spot
exchange rate of CHF 1.17 for €1. An increase of 10% in this exchange rate would result in a decrease of around
€245 million in equity. A decrease of 10% in this exchange rate would have the opposite impact.
The ineffective portion of cash flow hedging derivatives is not material.
8.4.7. Impact on income of financial instruments not qualifying for hedge accounting
The fair value of derivatives classified as financial assets and liabilities at fair value through profit or loss represented a
gain of €2 million in 2017 compared to a loss of €5 million in 2016. Changes in the fair value of the initial hedge are offset
in the income statement against the unwinding of the hedge taken out in connection with the acquisition of a controlling
interest in Sika.
8.4.8. Embedded derivatives
The Saint-Gobain Group regularly analyzes its contracts in order to separately identify financial instruments classified as
embedded derivatives under IFRS.
At December 31, 2017, no embedded derivatives deemed to be material at Group level were identified.
8.4.9. Group debt structure
The weighted average interest rate on total gross debt under IFRS and after hedging (interest rate swaps, currency swaps
and cross-currency swaps) was 2.8% at December 31, 2017, compared with 3.4% at December 31, 2016.
The average internal rate of return for the main component of long-term debt before hedging (bonds) was 3.2% in 2017,
compared with 3.9% in 2016.
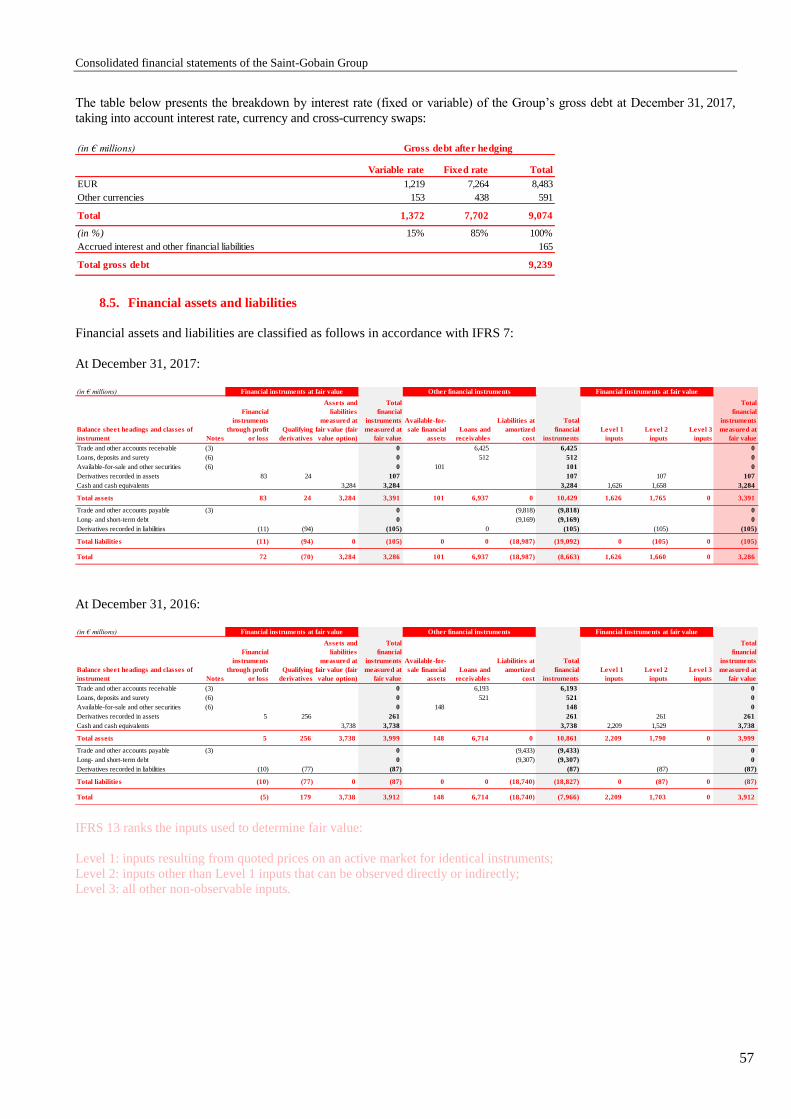
Consolidated financial statements of the Saint-Gobain Group
57
The table below presents the breakdown by interest rate (fixed or variable) of the Group’s gross debt at December 31, 2017,
taking into account interest rate, currency and cross-currency swaps:
8.5. Financial assets and liabilities
Financial assets and liabilities are classified as follows in accordance with IFRS 7:
At December 31, 2017:
At December 31, 2016:
IFRS 13 ranks the inputs used to determine fair value:
Level 1: inputs resulting from quoted prices on an active market for identical instruments;
Level 2: inputs other than Level 1 inputs that can be observed directly or indirectly;
Level 3: all other non-observable inputs.
(in € millions)
Variable rate Fixed rate Total
EUR 1,219 7,264 8,483
Other currencies 153 438 591
Total 1,372 7,702 9,074
(in %) 15% 85% 100%
Accrued interest and other financial liabilities 165
Total gross debt 9,239
Gross debt after hedging
(in € millions)
Balance sheet headings and classes of
instrument Notes
Financial
instruments
through profit
or loss
Qualifying
derivatives
Assets and
liabilities
measured at
fair value (fair
value option)
Total
financial
instruments
measured at
fair value
Available-for-
sale financial
assets
Loans and
receivables
Liabilities at
amortized
cost
Total
financial
instruments
Level 1
inputs
Level 2
inputs
Level 3
inputs
Total
financial
instruments
measured at
fair value
Trade and other accounts receivable (3) 0 6,425 6,425 0
Loans, deposits and surety (6) 0 512 512 0
Available-for-sale and other securities (6) 0 101 101 0
Derivatives recorded in assets 83 24 107 107 107 107
Cash and cash equivalents 3,284 3,284 3,284 1,626 1,658 3,284
Total assets 83 24 3,284 3,391 101 6,937 0 10,429 1,626 1,765 0 3,391
Trade and other accounts payable (3) 0 (9,818) (9,818) 0
Long- and short-term debt 0 (9,169) (9,169) 0
Derivatives recorded in liabilities (11) (94) (105) 0 (105) (105) (105)
Total liabilities (11) (94) 0 (105) 0 0 (18,987) (19,092) 0 (105) 0 (105)
Total 72 (70) 3,284 3,286 101 6,937 (18,987) (8,663) 1,626 1,660 0 3,286
Financial instruments at fair value Other financial instruments Financial instruments at fair value
(in € millions)
Balance sheet headings and classes of
instrument Notes
Financial
instruments
through profit
or loss
Qualifying
derivatives
Assets and
liabilities
measured at
fair value (fair
value option)
Total
financial
instruments
measured at
fair value
Available-for-
sale financial
assets
Loans and
receivables
Liabilities at
amortized
cost
Total
financial
instruments
Level 1
inputs
Level 2
inputs
Level 3
inputs
Total
financial
instruments
measured at
fair value
Trade and other accounts receivable (3) 0 6,193 6,193 0
Loans, deposits and surety (6) 0 521 521 0
Available-for-sale and other securities (6) 0 148 148 0
Derivatives recorded in assets 5 256 261 261 261 261
Cash and cash equivalents 3,738 3,738 3,738 2,209 1,529 3,738
Total assets 5 256 3,738 3,999 148 6,714 0 10,861 2,209 1,790 0 3,999
Trade and other accounts payable (3) 0 (9,433) (9,433) 0
Long- and short-term debt 0 (9,307) (9,307) 0
Derivatives recorded in liabilities (10) (77) (87) (87) (87) (87)
Total liabilities (10) (77) 0 (87) 0 0 (18,740) (18,827) 0 (87) 0 (87)
Total (5) 179 3,738 3,912 148 6,714 (18,740) (7,966) 2,209 1,703 0 3,912
Financial instruments at fair value Other financial instruments Financial instruments at fair value
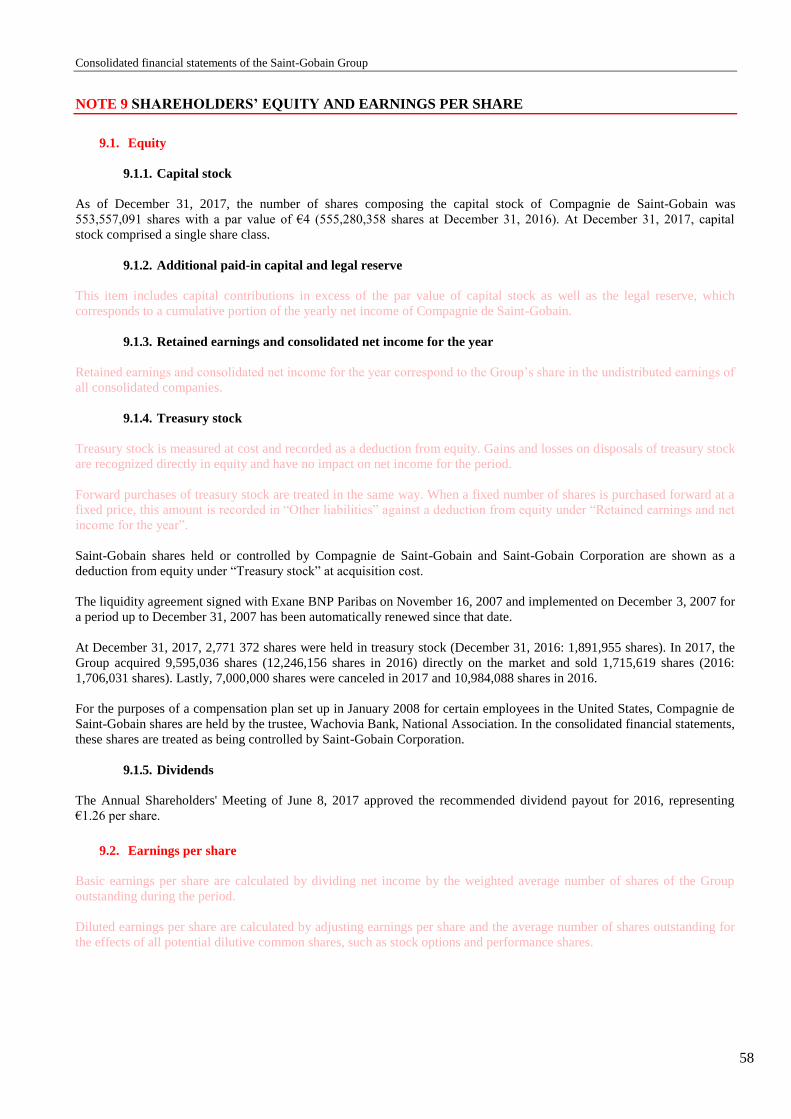
Consolidated financial statements of the Saint-Gobain Group
58
NOTE 9 SHAREHOLDERS’ EQUITY AND EARNINGS PER SHARE
9.1. Equity
9.1.1. Capital stock
As of December 31, 2017, the number of shares composing the capital stock of Compagnie de Saint-Gobain was
553,557,091 shares with a par value of €4 (555,280,358 shares at December 31, 2016). At December 31, 2017, capital
stock comprised a single share class.
9.1.2. Additional paid-in capital and legal reserve
This item includes capital contributions in excess of the par value of capital stock as well as the legal reserve, which
corresponds to a cumulative portion of the yearly net income of Compagnie de Saint-Gobain.
9.1.3. Retained earnings and consolidated net income for the year
Retained earnings and consolidated net income for the year correspond to the Group’s share in the undistributed earnings of
all consolidated companies.
9.1.4. Treasury stock
Treasury stock is measured at cost and recorded as a deduction from equity. Gains and losses on disposals of treasury stock
are recognized directly in equity and have no impact on net income for the period.
Forward purchases of treasury stock are treated in the same way. When a fixed number of shares is purchased forward at a
fixed price, this amount is recorded in “Other liabilities” against a deduction from equity under “Retained earnings and net
income for the year”.
Saint-Gobain shares held or controlled by Compagnie de Saint-Gobain and Saint-Gobain Corporation are shown as a
deduction from equity under “Treasury stock” at acquisition cost.
The liquidity agreement signed with Exane BNP Paribas on November 16, 2007 and implemented on December 3, 2007 for
a period up to December 31, 2007 has been automatically renewed since that date.
At December 31, 2017, 2,771 372 shares were held in treasury stock (December 31, 2016: 1,891,955 shares). In 2017, the
Group acquired 9,595,036 shares (12,246,156 shares in 2016) directly on the market and sold 1,715,619 shares (2016:
1,706,031 shares). Lastly, 7,000,000 shares were canceled in 2017 and 10,984,088 shares in 2016.
For the purposes of a compensation plan set up in January 2008 for certain employees in the United States, Compagnie de
Saint-Gobain shares are held by the trustee, Wachovia Bank, National Association. In the consolidated financial statements,
these shares are treated as being controlled by Saint-Gobain Corporation.
9.1.5. Dividends
The Annual Shareholders' Meeting of June 8, 2017 approved the recommended dividend payout for 2016, representing
€1.26 per share.
9.2. Earnings per share
Basic earnings per share are calculated by dividing net income by the weighted average number of shares of the Group
outstanding during the period.
Diluted earnings per share are calculated by adjusting earnings per share and the average number of shares outstanding for
the effects of all potential dilutive common shares, such as stock options and performance shares.
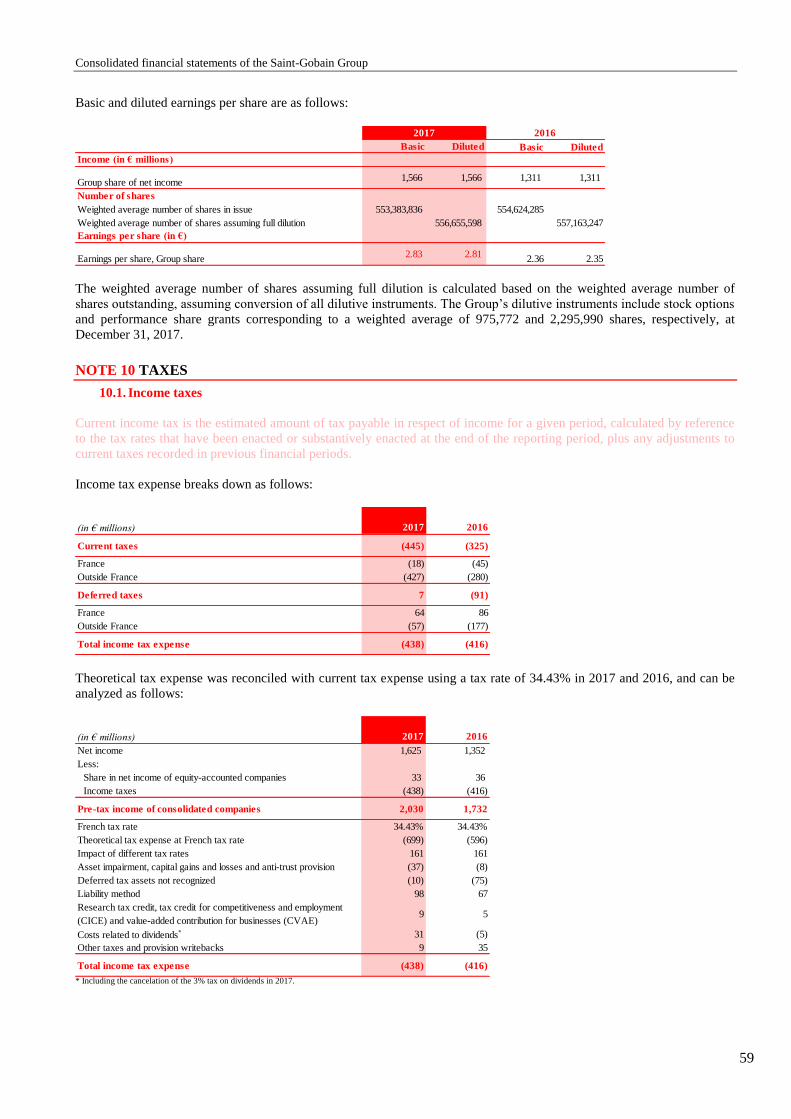
Consolidated financial statements of the Saint-Gobain Group
59
Basic and diluted earnings per share are as follows:
The weighted average number of shares assuming full dilution is calculated based on the weighted average number of
shares outstanding, assuming conversion of all dilutive instruments. The Group’s dilutive instruments include stock options
and performance share grants corresponding to a weighted average of 975,772 and 2,295,990 shares, respectively, at
December 31, 2017.
NOTE 10 TAXES
10.1. Income taxes
Current income tax is the estimated amount of tax payable in respect of income for a given period, calculated by reference
to the tax rates that have been enacted or substantively enacted at the end of the reporting period, plus any adjustments to
current taxes recorded in previous financial periods.
Income tax expense breaks down as follows:
Theoretical tax expense was reconciled with current tax expense using a tax rate of 34.43% in 2017 and 2016, and can be
analyzed as follows:
* Including the cancelation of the 3% tax on dividends in 2017.
Basic Diluted Basic Diluted
Income (in € millions)
Group share of net income1,566 1,566 1,311 1,311
Number of shares
Weighted average number of shares in issue 553,383,836 554,624,285
Weighted average number of shares assuming full dilution 556,655,598 557,163,247
Earnings per share (in €)
Earnings per share, Group share2.83 2.81
2.36 2.35
2017 2016
(in € millions) 2017 2016
Current taxes (445) (325)
France (18) (45)
Outside France (427) (280)
Deferred taxes 7 (91)
France 64 86
Outside France (57) (177)
Total income tax expense (438) (416)
(in € millions) 2017 2016
Net income 1,625 1,352
Less:
Share in net income of equity-accounted companies 33 36
Income taxes (438) (416)
Pre-tax income of consolidated companies 2,030 1,732
French tax rate 34.43% 34.43%
Theoretical tax expense at French tax rate (699) (596)
Impact of different tax rates 161 161
Asset impairment, capital gains and losses and anti-trust provision (37) (8)
Deferred tax assets not recognized (10) (75)
Liability method 98 67
Research tax credit, tax credit for competitiveness and employment
(CICE) and value-added contribution for businesses (CVAE)9 5
Costs related to dividends* 31 (5)
Other taxes and provision writebacks 9 35
Total income tax expense (438) (416)
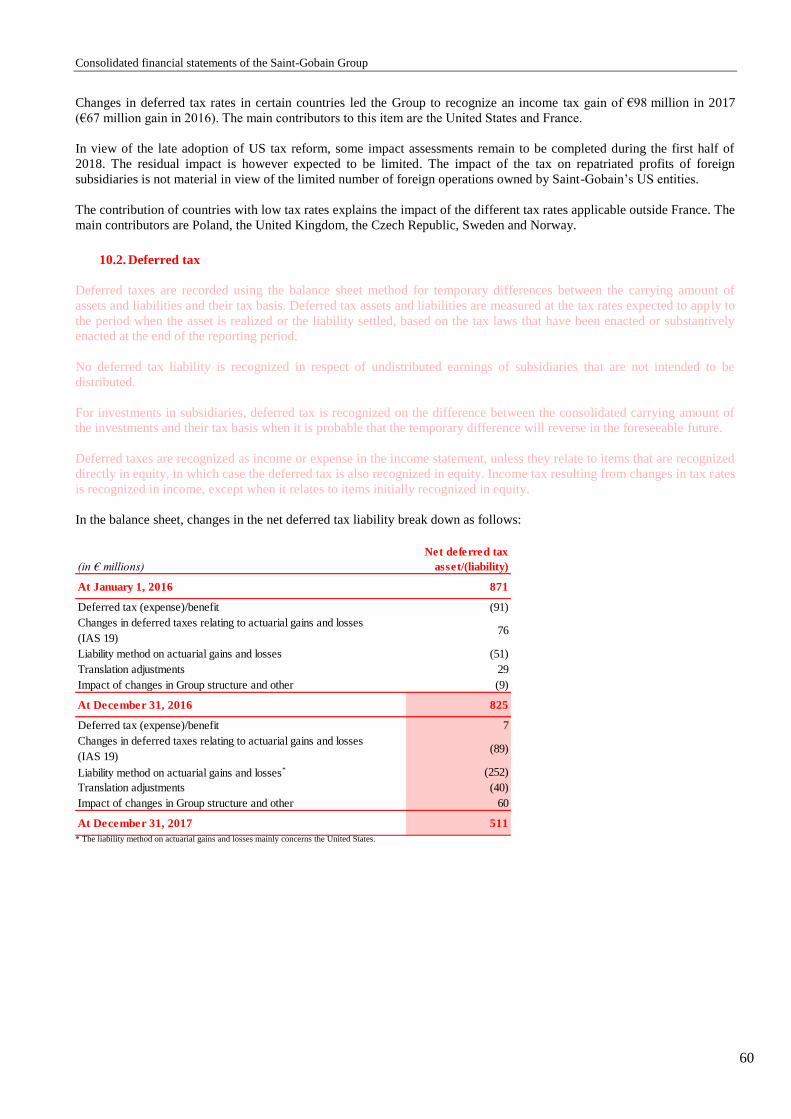
Consolidated financial statements of the Saint-Gobain Group
60
Changes in deferred tax rates in certain countries led the Group to recognize an income tax gain of €98 million in 2017
(€67 million gain in 2016). The main contributors to this item are the United States and France.
In view of the late adoption of US tax reform, some impact assessments remain to be completed during the first half of
2018. The residual impact is however expected to be limited. The impact of the tax on repatriated profits of foreign
subsidiaries is not material in view of the limited number of foreign operations owned by Saint-Gobain’s US entities.
The contribution of countries with low tax rates explains the impact of the different tax rates applicable outside France. The
main contributors are Poland, the United Kingdom, the Czech Republic, Sweden and Norway.
10.2. Deferred tax
Deferred taxes are recorded using the balance sheet method for temporary differences between the carrying amount of
assets and liabilities and their tax basis. Deferred tax assets and liabilities are measured at the tax rates expected to apply to
the period when the asset is realized or the liability settled, based on the tax laws that have been enacted or substantively
enacted at the end of the reporting period.
No deferred tax liability is recognized in respect of undistributed earnings of subsidiaries that are not intended to be
distributed.
For investments in subsidiaries, deferred tax is recognized on the difference between the consolidated carrying amount of
the investments and their tax basis when it is probable that the temporary difference will reverse in the foreseeable future.
Deferred taxes are recognized as income or expense in the income statement, unless they relate to items that are recognized
directly in equity, in which case the deferred tax is also recognized in equity. Income tax resulting from changes in tax rates
is recognized in income, except when it relates to items initially recognized in equity.
In the balance sheet, changes in the net deferred tax liability break down as follows:
* The liability method on actuarial gains and losses mainly concerns the United States.
(in € millions)
Net deferred tax
asset/(liability)
At January 1, 2016 871
Deferred tax (expense)/benefit (91)
Changes in deferred taxes relating to actuarial gains and losses
(IAS 19)76
Liability method on actuarial gains and losses (51)
Translation adjustments 29
Impact of changes in Group structure and other (9)
At December 31, 2016 825
Deferred tax (expense)/benefit 7
Changes in deferred taxes relating to actuarial gains and losses
(IAS 19)(89)
Liability method on actuarial gains and losses* (252)
Translation adjustments (40)
Impact of changes in Group structure and other 60
At December 31, 2017 511
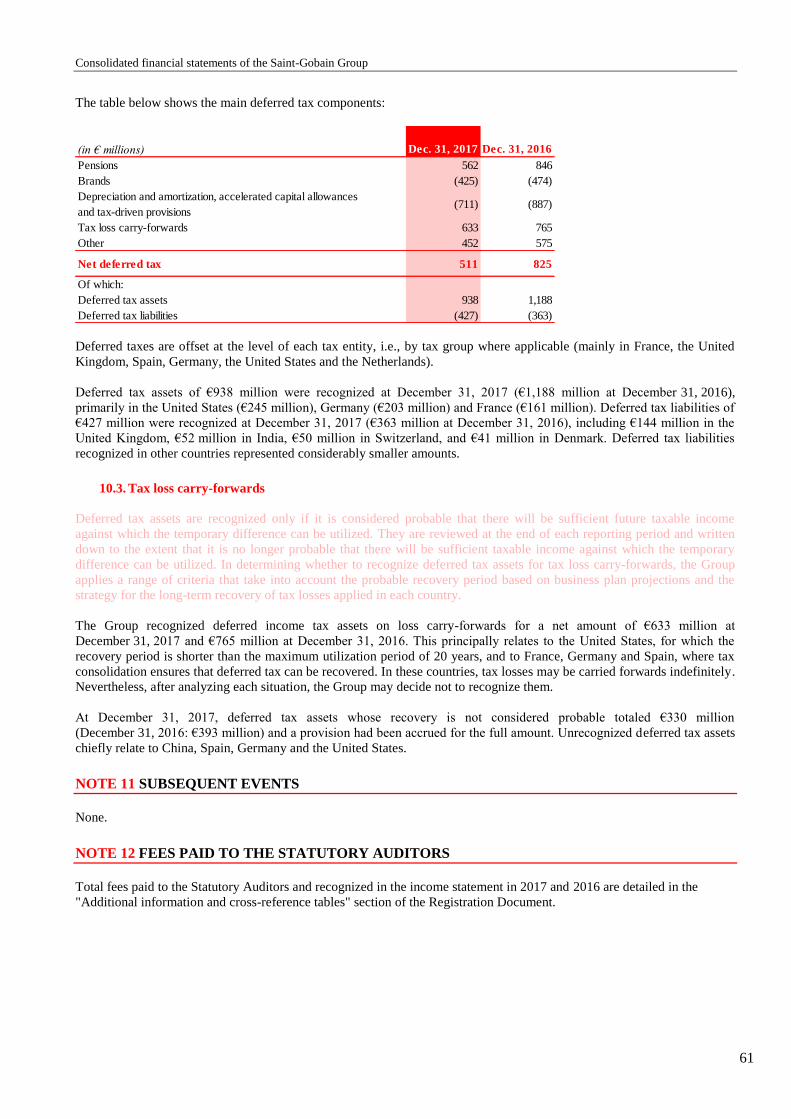
Consolidated financial statements of the Saint-Gobain Group
61
The table below shows the main deferred tax components:
Deferred taxes are offset at the level of each tax entity, i.e., by tax group where applicable (mainly in France, the United
Kingdom, Spain, Germany, the United States and the Netherlands).
Deferred tax assets of €938 million were recognized at December 31, 2017 (€1,188 million at December 31, 2016),
primarily in the United States (€245 million), Germany (€203 million) and France (€161 million). Deferred tax liabilities of
€427 million were recognized at December 31, 2017 (€363 million at December 31, 2016), including €144 million in the
United Kingdom, €52 million in India, €50 million in Switzerland, and €41 million in Denmark. Deferred tax liabilities
recognized in other countries represented considerably smaller amounts.
10.3. Tax loss carry-forwards
Deferred tax assets are recognized only if it is considered probable that there will be sufficient future taxable income
against which the temporary difference can be utilized. They are reviewed at the end of each reporting period and written
down to the extent that it is no longer probable that there will be sufficient taxable income against which the temporary
difference can be utilized. In determining whether to recognize deferred tax assets for tax loss carry-forwards, the Group
applies a range of criteria that take into account the probable recovery period based on business plan projections and the
strategy for the long-term recovery of tax losses applied in each country.
The Group recognized deferred income tax assets on loss carry-forwards for a net amount of €633 million at
December 31, 2017 and €765 million at December 31, 2016. This principally relates to the United States, for which the
recovery period is shorter than the maximum utilization period of 20 years, and to France, Germany and Spain, where tax
consolidation ensures that deferred tax can be recovered. In these countries, tax losses may be carried forwards indefinitely.
Nevertheless, after analyzing each situation, the Group may decide not to recognize them.
At December 31, 2017, deferred tax assets whose recovery is not considered probable totaled €330 million
(December 31, 2016: €393 million) and a provision had been accrued for the full amount. Unrecognized deferred tax assets
chiefly relate to China, Spain, Germany and the United States.
NOTE 11 SUBSEQUENT EVENTS
None.
NOTE 12 FEES PAID TO THE STATUTORY AUDITORS
Total fees paid to the Statutory Auditors and recognized in the income statement in 2017 and 2016 are detailed in the
"Additional information and cross-reference tables" section of the Registration Document.
(in € millions) Dec. 31, 2017 Dec. 31, 2016
Pensions 562 846
Brands (425) (474)
Depreciation and amortization, accelerated capital allowances
and tax-driven provisions(711) (887)
Tax loss carry-forwards 633 765
Other 452 575
Net deferred tax 511 825
Of which:
Deferred tax assets 938 1,188
Deferred tax liabilities (427) (363)

Consolidated financial statements of the Saint-Gobain Group
62
NOTE 13 PRINCIPAL CONSOLIDATED COMPANIES
The table below shows the Group’s principal consolidated companies, typically those with annual sales of over
€100 million.
INNOVATIVE MATERIALS SECTOR
FLAT GLASS Country
Consolidation
method
Percentage
held directly
and indirectly
Saint-Gobain Glass Deutschland GmbH, Stolberg* Germany Full consolidation 99.99%
Saint-Gobain Sekurit Deutschland GmbH & CO Kg, Herzogenrath* Germany Full consolidation 99.99%
Saint-Gobain Deutsche Glas GmbH, Stolberg* Germany Full consolidation 99.99%
Flachglas Torgau GmbH, Torgau* Germany Full consolidation 99.99%
Saint-Gobain Weisswasser GmbH, Aachen* Germany Full consolidation 99.99%
Glasverarbeitungs-Gesellschaft Bremen mbH, Bremen* Germany Full consolidation 99.99%
Saint-Gobain Glassolutions Nord GmbH, Lübeck* Germany Full consolidation 99.99%
Saint-Gobain Glassolutions Süd GmbH, Tuttlingen* Germany Full consolidation 99.99%
Saint-Gobain Glassolutions Objekt-Center GmbH, Radeburg* Germany Full consolidation 99.99%
Glas-Funke GmbH, Kall* Germany Full consolidation 99.99%
Glasverarbeitungs-Gesellschaft Deggendorf mbH, Deggendorf* Germany Full consolidation 99.99%
Vetrotech Saint-Gobain Kinon GmbH, Aachen* Germany Full consolidation 99.99%
Saint-Gobain Autoglas GmbH, Herzogenrath* Germany Full consolidation 99.99%
Saint-Gobain Sekurit Deutschland Beteiligungen GmbH, Herzogenrath* Germany Full consolidation 99.99%
FABA Autoglas Technik GmbH & Co. Betriebs-KG, Berlin* Germany Full consolidation 99.99%
Freeglass GmbH & Co. KG, Schwaikheim* Germany Full consolidation 99.99%
Saint-Gobain Autover Deutschland GmbH, Kerpen* Germany Full consolidation 99.99%
Freudenberger Autoglas GmbH, München* Germany Full consolidation 99.99%
Saint-Gobain Construction Products Belgium Belgium Full consolidation 100.00%
Cebrace Cristal Plano Ltda Brazil Full consolidation 50.00%
Saint-Gobain Do Brasil Ltda Brazil Full consolidation 100.00%
SG Hanglas Sekurit (Shanghaï) Co., Ltd China Full consolidation 90.24%
Hankuk Sekurit Limited South Korea Full consolidation 90.13%
Hankuk Glass Industries Inc. South Korea Full consolidation 80.47%
Saint-Gobain Cristaleria S.L Spain Full consolidation 99.83%
Saint-Gobain Glass France France Full consolidation 100.00%
Saint-Gobain Sekurit France France Full consolidation 100.00%
Eurofloat France Full consolidation 100.00%
Saint-Gobain Glass Solutions Menuisiers Industriels France Full consolidation 100.00%
Saint-Gobain India Private Limited India Full consolidation 99.14%
Saint-Gobain Glass Italia S.p.a Italy Full consolidation 100.00%
Saint-Gobain Mexico Mexico Full consolidation 99.83%
Saint-Gobain Polska Sp Zoo Poland Full consolidation 99.11%
Saint-Gobain Innovative Materials Polska Sp Zoo Poland Full consolidation 98.61%
Saint-Gobain Sekurit CZ, Spol S.R.O Czech Republic Full consolidation 100.00%
Saint-Gobain Glass (United Kingdom) Limited United Kingdom Full consolidation 100.00%
Vetrotech Saint-Gobain International Switzerland Full consolidation 100.00%
Dec. 31, 2017

Consolidated financial statements of the Saint-Gobain Group
63
HIGH PERFORMANCE MATERIALS Country
Consolidation
method
Percentage
held directly
and indirectly
Saint-Gobain Abrasives GmbH, Wesseling* Germany Full consolidation 100.00%
Saint-Gobain Diamantwerkzeuge GmbH, Norderstedt* Germany Full consolidation 100.00%
Supercut Europe GmbH, Baesweiler* Germany Full consolidation 100.00%
Ernst Winter & Sohn Norderstedt GmbH & Co. KG, Norderstedt* Germany Full consolidation 100.00%
Saint-Gobain Performance Plastics Isofluor GmbH, Neuss* Germany Full consolidation 100.00%
Saint-Gobain Performance Plastics MG Silikon GmbH, Lindau* Germany Full consolidation 100.00%
Saint-Gobain Performance Plastics Pampus GmbH, Willich* Germany Full consolidation 100.00%
Saint-Gobain Performance Plastics L+S GmbH, Wertheim* Germany Full consolidation 100.00%
Saint-Gobain Performance Plastics Biolink GmbH, Waakirchen* Germany Full consolidation 100.00%
Kirson Industrial Reinforcement GmbH, Neustadt an der Donau* Germany Full consolidation 100.00%
Saint-Gobain Do Brasil Ltda Brazil Full consolidation 100.00%
Saint-Gobain Canada, Inc. Canada Full consolidation 100.00%
Saint-Gobain Performance Plastics (Shanghaï) Co., LTD China Full consolidation 100.00%
Saint-Gobain Abrasives (Shanghaï) Co., LTD China Full consolidation 100.00%
Saint-Gobain Abrasives, Inc. United States Full consolidation 100.00%
Saint-Gobain Ceramics & Plastics, Inc. United States Full consolidation 100.00%
Saint-Gobain Performance Plastics Corporation United States Full consolidation 100.00%
Saint-Gobain Adfors America, Inc. United States Full consolidation 100.00%
Saint-Gobain Abrasifs France Full consolidation 99.98%
Société Européenne des Produits Réfractaires - SEPR France Full consolidation 100.00%
Grindwell Norton Ltd India Full consolidation 51.59%
Saint-Gobain K.K. Japan Full consolidation 100.00%
Saint-Gobain America S.A De C.V Mexico Full consolidation 99.83%
Saint-Gobain Abrasives BV Netherlands Full consolidation 100.00%
Saint-Gobain HPM Polska Sp Zoo Poland Full consolidation 100.00%
Saint-Gobain Adfors CZ S.R.O. Czech Republic Full consolidation 100.00%
Dec. 31, 2017
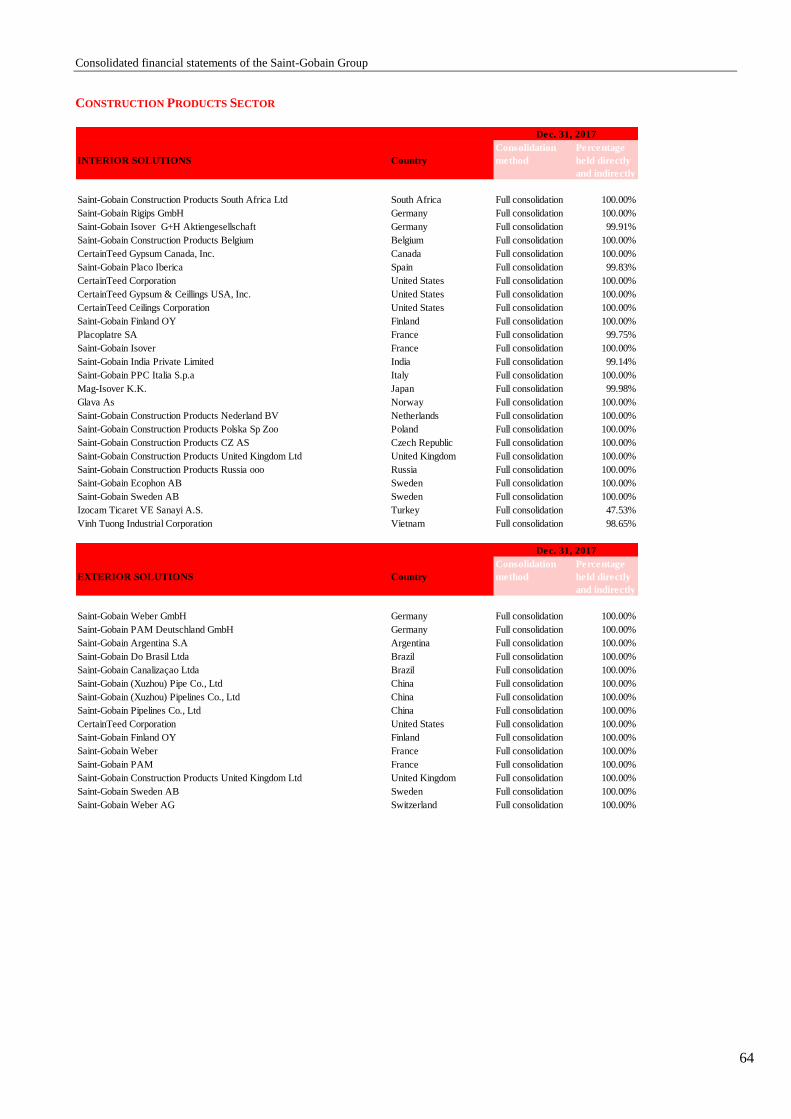
Consolidated financial statements of the Saint-Gobain Group
64
CONSTRUCTION PRODUCTS SECTOR
INTERIOR SOLUTIONS Country
Consolidation
method
Percentage
held directly
and indirectly
Saint-Gobain Construction Products South Africa Ltd South Africa Full consolidation 100.00%
Saint-Gobain Rigips GmbH Germany Full consolidation 100.00%
Saint-Gobain Isover G+H Aktiengesellschaft Germany Full consolidation 99.91%
Saint-Gobain Construction Products Belgium Belgium Full consolidation 100.00%
CertainTeed Gypsum Canada, Inc. Canada Full consolidation 100.00%
Saint-Gobain Placo Iberica Spain Full consolidation 99.83%
CertainTeed Corporation United States Full consolidation 100.00%
CertainTeed Gypsum & Ceillings USA, Inc. United States Full consolidation 100.00%
CertainTeed Ceilings Corporation United States Full consolidation 100.00%
Saint-Gobain Finland OY Finland Full consolidation 100.00%
Placoplatre SA France Full consolidation 99.75%
Saint-Gobain Isover France Full consolidation 100.00%
Saint-Gobain India Private Limited India Full consolidation 99.14%
Saint-Gobain PPC Italia S.p.a Italy Full consolidation 100.00%
Mag-Isover K.K. Japan Full consolidation 99.98%
Glava As Norway Full consolidation 100.00%
Saint-Gobain Construction Products Nederland BV Netherlands Full consolidation 100.00%
Saint-Gobain Construction Products Polska Sp Zoo Poland Full consolidation 100.00%
Saint-Gobain Construction Products CZ AS Czech Republic Full consolidation 100.00%
Saint-Gobain Construction Products United Kingdom Ltd United Kingdom Full consolidation 100.00%
Saint-Gobain Construction Products Russia ooo Russia Full consolidation 100.00%
Saint-Gobain Ecophon AB Sweden Full consolidation 100.00%
Saint-Gobain Sweden AB Sweden Full consolidation 100.00%
Izocam Ticaret VE Sanayi A.S. Turkey Full consolidation 47.53%
Vinh Tuong Industrial Corporation Vietnam Full consolidation 98.65%
EXTERIOR SOLUTIONS Country
Consolidation
method
Percentage
held directly
and indirectly
Saint-Gobain Weber GmbH Germany Full consolidation 100.00%
Saint-Gobain PAM Deutschland GmbH Germany Full consolidation 100.00%
Saint-Gobain Argentina S.A Argentina Full consolidation 100.00%
Saint-Gobain Do Brasil Ltda Brazil Full consolidation 100.00%
Saint-Gobain Canalizaçao Ltda Brazil Full consolidation 100.00%
Saint-Gobain (Xuzhou) Pipe Co., Ltd China Full consolidation 100.00%
Saint-Gobain (Xuzhou) Pipelines Co., Ltd China Full consolidation 100.00%
Saint-Gobain Pipelines Co., Ltd China Full consolidation 100.00%
CertainTeed Corporation United States Full consolidation 100.00%
Saint-Gobain Finland OY Finland Full consolidation 100.00%
Saint-Gobain Weber France Full consolidation 100.00%
Saint-Gobain PAM France Full consolidation 100.00%
Saint-Gobain Construction Products United Kingdom Ltd United Kingdom Full consolidation 100.00%
Saint-Gobain Sweden AB Sweden Full consolidation 100.00%
Saint-Gobain Weber AG Switzerland Full consolidation 100.00%
Dec. 31, 2017
Dec. 31, 2017
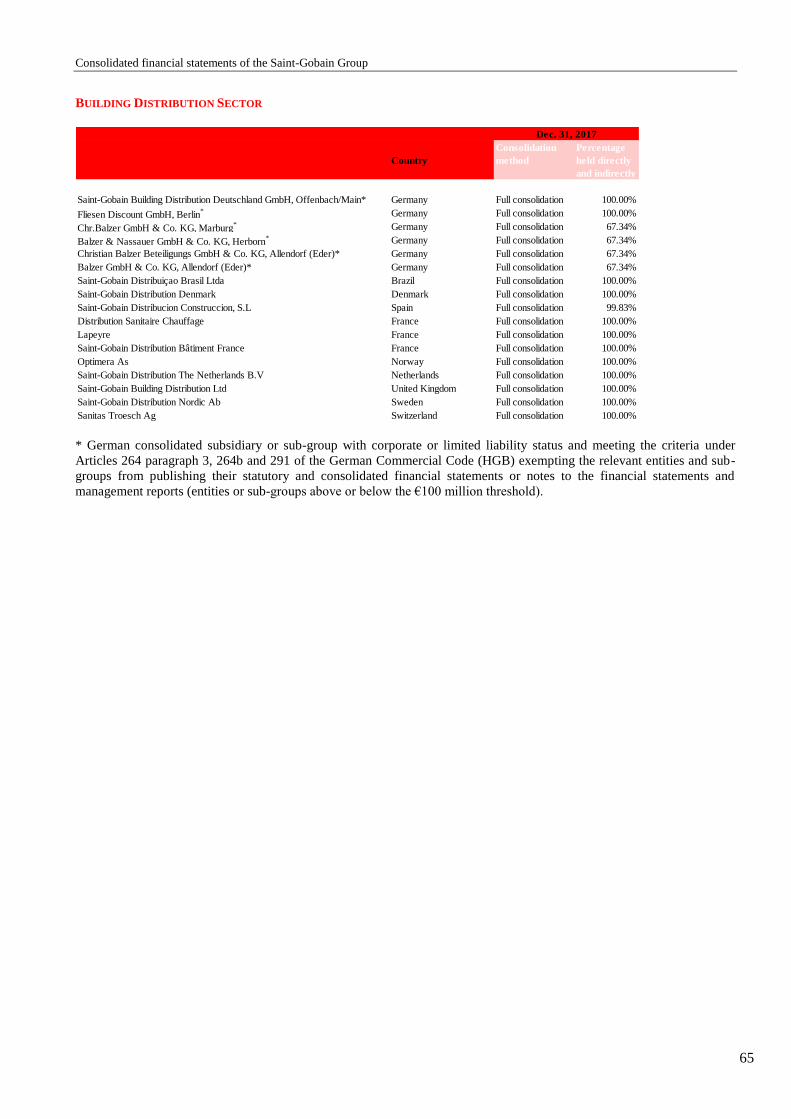
Consolidated financial statements of the Saint-Gobain Group
65
BUILDING DISTRIBUTION SECTOR
* German consolidated subsidiary or sub-group with corporate or limited liability status and meeting the criteria under
Articles 264 paragraph 3, 264b and 291 of the German Commercial Code (HGB) exempting the relevant entities and sub-
groups from publishing their statutory and consolidated financial statements or notes to the financial statements and
management reports (entities or sub-groups above or below the €100 million threshold).
Country
Consolidation
method
Percentage
held directly
and indirectly
Saint-Gobain Building Distribution Deutschland GmbH, Offenbach/Main* Germany Full consolidation 100.00%
Fliesen Discount GmbH, Berlin* Germany Full consolidation 100.00%
Chr.Balzer GmbH & Co. KG, Marburg* Germany Full consolidation 67.34%
Balzer & Nassauer GmbH & Co. KG, Herborn* Germany Full consolidation 67.34%
Christian Balzer Beteiligungs GmbH & Co. KG, Allendorf (Eder)* Germany Full consolidation 67.34%
Balzer GmbH & Co. KG, Allendorf (Eder)* Germany Full consolidation 67.34%
Saint-Gobain Distribuiçao Brasil Ltda Brazil Full consolidation 100.00%
Saint-Gobain Distribution Denmark Denmark Full consolidation 100.00%
Saint-Gobain Distribucion Construccion, S.L Spain Full consolidation 99.83%
Distribution Sanitaire Chauffage France Full consolidation 100.00%
Lapeyre France Full consolidation 100.00%
Saint-Gobain Distribution Bâtiment France France Full consolidation 100.00%
Optimera As Norway Full consolidation 100.00%
Saint-Gobain Distribution The Netherlands B.V Netherlands Full consolidation 100.00%
Saint-Gobain Building Distribution Ltd United Kingdom Full consolidation 100.00%
Saint-Gobain Distribution Nordic Ab Sweden Full consolidation 100.00%
Sanitas Troesch Ag Switzerland Full consolidation 100.00%
Dec. 31, 2017


