
2017 Operating Plan and Budget:Operating Income and ExpenseSubmitted to 2016 Governing CouncilSeptember 2016
IREM® logo, IREM®, CERTIFIED PROPERTY MANAGER®, CPM®, the CPM key logo, ACCREDITED RESIDENTIAL MANAGER®, ARM®, the ARM torch logo, ACCREDITED MANAGEMENT ORGANIZATION®, AMO®, the AMO circle logo, Income/Expense Analysis®, Expense Analysis® and JPM® are registered marks of the Institute of Real Estate Management
Page 1

Table of ContentsPage 3 2017 Operating Plan and Budget OverviewPage 9 Operating Plan and Budget Page 13 Financial Philosophy and ReservesPage 15 Business LinesPage 16 Member RetentionPage 21 CredentialingPage 24 Knowledge ProductsPage 27 Chapter LeadershipPage 30 Volunteer LeadershipPage 33 External RelationsPage 36 National EventsPage 39 InternationalPage 42 Business Development for MembersPage 45 Corporate OperationsPage 48 Capital Expense Budget Page 49 Depreciation Schedule
Page 2

2017 IREM Operating Plan and Budget Presented to Governing Council 2016
The 2017 operating plan and budget were developed by the IREM Headquarters staff with guidance and direction from and thorough
review by the 2016-2017 officer team. They were developed with attention to IREM’s current strategic plan, a focus on growth in
membership and revenues, and appropriate investments in the future. The budget is organized around 10 business lines of related
programs and product lines that enable the evaluation of program effectiveness and performance and reinforce accountability and is
mindful of the organization’s reserve policy.
The 2017 operating budget is a break-even budget that reflects:
Operating income of $12,561,770 – up 4.0% over the 2016 year-end forecast
Operating expenses totaling $12,559,305 – also up 4.0% over the 2016 year-end forecast
Net operating income from operations of $2,465
Cash contribution to reserves of $75,215 – contributions 12.6% greater than forecast for 2016
A 60% decline in depreciation – from $462,756 in 2016 down to $182,264
An increase in total (U.S. and international) membership dues of 2.3%, to $7,310,936 – representing 58% of the total operating
income budget – with no increase in member dues levels
A combined U.S. and international membership count of 21,235 by year-end 2017, reflecting 4.4% membership growth and CPM
growth of 1.4%, achieved through gains in new members, reinstated members, and solid retention numbers, with 8.7%% of all
members and 13.3% of all CPMs coming from outside the U.S.
Revenue from credentialing programs (comprising application fees, credentialing courses, exam fees) increasing by 5.2% - with a
$100 increase in tuition for students who register fewer than 30 days before a classroom course, but no other increase in fees or
tuitions paid by students or royalties paid by chapters
Total credentialing course enrollments climbing to 5,623, a 3.3% increase, with 59% of these students attending classroom
courses, and the remaining 41% electing the online option
A $48,000 savings as a result of the transition from 2016’s combined Leadership and Legislative Summit and Capitol Hill Visit
Day to the 2017 plan for four regional meetings, in-district Congressional visits, and the new Federal Advocacy Board
Page 3

An increase of only 1.7% in staff salaries and benefits, which incorporates appropriate market-aligned salary and benefit increases,
offset by a decrease in total number of FTEs resulting from current and anticipated operational efficiencies
A capital budget of $75,750, which incorporates development of new and updated publications, software upgrades, and
replacement servers
Key Themes for 2017 IREM’s current strategic direction is driven by positioning IREM as a leader within the real estate management industry across all
asset classes and for real estate property and asset managers at all career levels. This overarching narrative is woven throughout the
2017 operating plan by attention to these six themes:
Theme 1. Target growth of millennial market in the office and apartment sectors
Theme 2. Execute IREM’s strategic meeting direction
Theme 3. Extend outreach efforts into the corporate market
Theme 4. Differentiate and reposition the IREM image
Theme 5. Elevate visibility of key programs
Theme 6. Plan for the future
Tactical plans, operating budgets, and targeted outcomes for each of these six themes are woven throughout the 2017 operating plan
and budget. Expanded upon here are some of the major thrusts, with budget impacts noted as appropriate.
Theme 1. Target growth of millennial market in the office and apartment sectors
Rebrand the ACoM certification, repositioning it as a program designed for entry-level commercial property managers (versus
the current target market of commercial site managers with small portfolios). Support this by developing an online course
specifically for the ACoM that directly speaks to what younger, entry-level commercial managers need to succeed and fully meets
the education requirement for the certification, similar to the RES201 for the ARM program. An allocation of $10,750 is included
in the budget for development of this new course, which will be available in the fall, so that the “new and improved ACoM” can
be launched at IREM’s Global Summit in October.
Deepen market penetration of the ARM certification by expanding the capacity to deliver the RES201 course and focusing on
the entry-level apartment community manager. Knowing the direct relationship between offerings of the RES201 course and new
ARM members, the pool of RES201 instructors, particularly in key markets where there is a void, will be expanded by recruiting,
training, and onboarding new RES201 instructors; funds of nearly $50,000 are earmarked for this purpose. In concert with this
Page 4

instructor capacity-building, the RES201 course content and thrust will be recast to appeal more directly to younger residential
managers just starting their careers.
Target CPM recruitment campaigns to millennials in the 20-30 age group who are entering the property management workforce
and are seeking training, industry insights, the tools they need to succeed, and industry contacts. Among these campaigns will be a
continuation of the CPM Sponsor program and the Member ROI Club program, both of which rely on word-of-mouth marketing
and members recruiting members.
Maximize touch points and meaningful engagements with young professionals who are contemplating IREM membership or
already have become members. Continue the robust college and university outreach program that engages students. Support young
professionals and connect them with mentors who can help them up the career ladder. Continue to implement recommendations
from the 2015 young professionals task force by: recognizing and engaging young professionals through a “30 under 30” program
planned, producing guidelines for career mentoring, intentionally involving young professionals in governance activities within
IREM and conversations about IREM and the industry, and offering a leadership-focused CPM-track program targeting real estate
management practitioners under 35.
Direct intentional, focused attention on racial and ethnic diversity. Among action steps included in the 2017 plan is to continue
and more aggressively promote the IREM Diversity Scholarship program, funded by the IREM Foundation, and leverage diversity
scholars to attract leaders from underrepresented market segments; continue outreach to Historically Black Colleges and
Universities (HBCUs), supporting those interested in starting real estate degree programs and engaging more deeply with those
that have such programs in place; and speaking out on the value of a diverse workforce and the richness it offers.
Theme 2. Execute IREM’s strategic meeting direction
The transition from the Washington, DC-based Leadership and Legislative Summit to regional gatherings and grassroots advocacy
will take place in 2017, with an overall bottom-line impact on the operating budget of $48,000 in savings. This reflects the elimination
of both income and expense related to the LLS and all of its related governance and legislative activities, the addition of income and
expense for the four US regional meetings, and the addition of expenses in the government affairs program for the new advocacy
board and in-district outreach.
Launch the regional leadership meetings, offering a full-day education and networking program directed toward developing
chapter leadership and strengthening the chapter network. This will be complemented with industry education and networking
events, delivered through existing signature events or directly by IREM. The budget anticipates $129,950 in income and $205,933
in expenses for the four regional meetings in the U.S. A fifth regional gathering will take place in Canada; its budget is contained
in the international program budget. The 2017 regional meetings will be held:
Page 5

Northeast Regional Meeting - New York, NY, March 21-23, 2017
South/Southeast Regional Meeting - Atlanta, GA, April 4-6, 2017
West Regional Meeting - Costa Mesa, CA, May 9-11, 2017
Midwest Regional Meeting - Minneapolis, MN, June 6-8, 2017
Region 14 Leadership Conference and REIC Annual Conference - Halifax, Nova Scotia, June 13-15, 2017
Introduce the IREM Global Summit – a retooling of the IREM Fall Conference as the single gathering of IREM members from
around the world. The Summit will bring together the best of industry-focused education and learning, opportunities for
networking with colleagues, a venue for Industry Partners and other service providers to connect with IREM’s member
practitioners, face-to-face committee and board meetings and other governance activities, and a platform to recognize new REME
and other award recipients and install the 2018 leadership team. The 2017 IREM Global Summit will take place in Chicago at the
Hilton Chicago Hotel October 10-14, 2017, and serve as a kick-off of IREM’s 85th anniversary year. The Global Summit budget
anticipates $355,610 in income and $466,192 in expense, with the expense budget enhanced to support a more robust speaker
schedule. (Note that exhibitor and sponsor revenues associated with the Global Summit appear in the vendor relations budget.)
Impact federal policy through in-district advocacy at the grassroots level partnered with a new Federal Advocacy Board.
With the dissolution of the Leadership and Legislative Summit, the vehicle for gaining the attention of Members of Congress will
shift to in-district Congressional meetings. A model for conducting these in-district meetings will be unveiled this fall, and
throughout 2017 chapters will be supported in these initiatives and urged to share the results of their efforts. Supplementing and
complimenting the chapters’ in-district advocacy will be the new Federal Advocacy Board, which will serve as IREM’s primary
vehicle for connecting in Washington, DC, with key Congressional leaders, government agencies, and regulatory bodies whose
interests intersect with those of the real estate management industry. All told, the government affairs budget will increase by
$23,000 or 51% in 2017.
Theme 3. Extend outreach efforts into corporate markets
Conduct IREM’s second Commercial Summit in Chicago in January, continuing to build on the momentum that began in 2016
by bringing together commercial property management company leaders with their asset management clients for the purpose of
information and idea sharing, positioning IREM as a conduit for valuable information exchange, and creating an opportunity to
learn from market leaders and their clients the challenges they are facing and issues they are addressing.
Implement enhancements to the AMO program. Strengthen the connection AMO companies have with IREM and the benefit
they derive in terms of both service to support their business enterprises and exposure to their client markets. The budgeted
allocation for this activity has been increased 43%, which will go toward continuing and improving on communications with and
services to AMO firms and aggressively promoting the value of hiring of AMO firms to real estate owners and investors through
Page 6
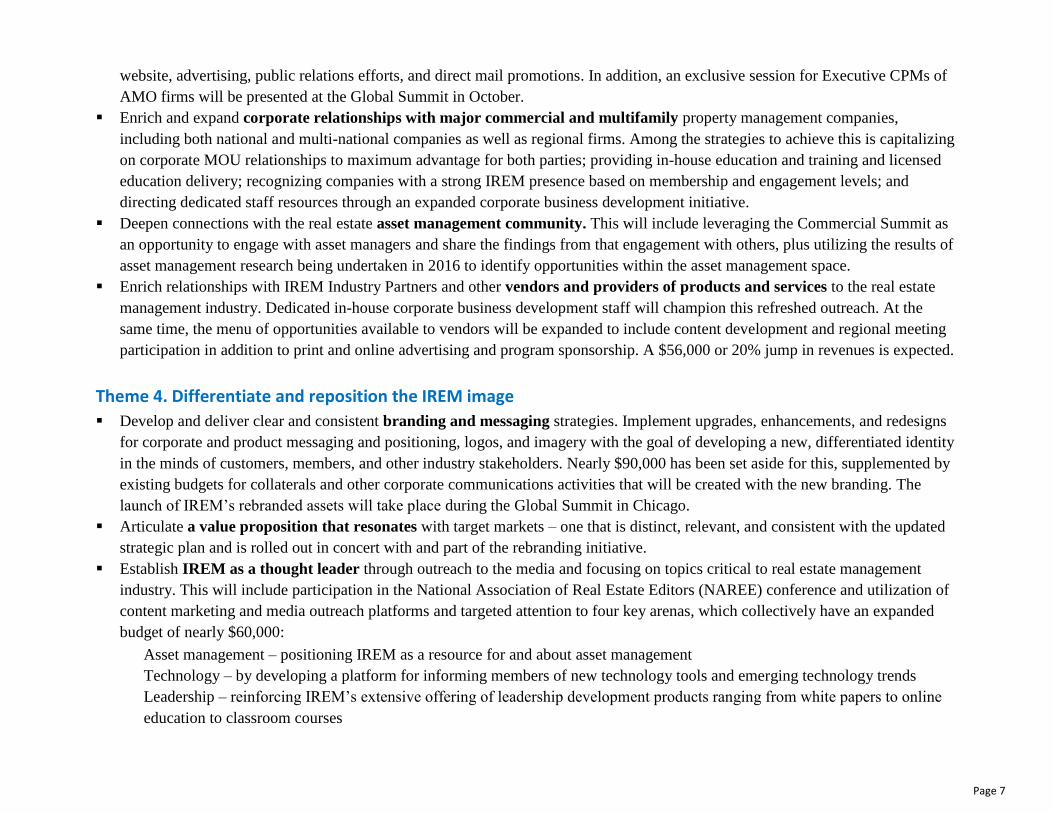
website, advertising, public relations efforts, and direct mail promotions. In addition, an exclusive session for Executive CPMs of
AMO firms will be presented at the Global Summit in October.
Enrich and expand corporate relationships with major commercial and multifamily property management companies,
including both national and multi-national companies as well as regional firms. Among the strategies to achieve this is capitalizing
on corporate MOU relationships to maximum advantage for both parties; providing in-house education and training and licensed
education delivery; recognizing companies with a strong IREM presence based on membership and engagement levels; and
directing dedicated staff resources through an expanded corporate business development initiative.
Deepen connections with the real estate asset management community. This will include leveraging the Commercial Summit as
an opportunity to engage with asset managers and share the findings from that engagement with others, plus utilizing the results of
asset management research being undertaken in 2016 to identify opportunities within the asset management space.
Enrich relationships with IREM Industry Partners and other vendors and providers of products and services to the real estate
management industry. Dedicated in-house corporate business development staff will champion this refreshed outreach. At the
same time, the menu of opportunities available to vendors will be expanded to include content development and regional meeting
participation in addition to print and online advertising and program sponsorship. A $56,000 or 20% jump in revenues is expected.
Theme 4. Differentiate and reposition the IREM image
Develop and deliver clear and consistent branding and messaging strategies. Implement upgrades, enhancements, and redesigns
for corporate and product messaging and positioning, logos, and imagery with the goal of developing a new, differentiated identity
in the minds of customers, members, and other industry stakeholders. Nearly $90,000 has been set aside for this, supplemented by
existing budgets for collaterals and other corporate communications activities that will be created with the new branding. The
launch of IREM’s rebranded assets will take place during the Global Summit in Chicago.
Articulate a value proposition that resonates with target markets – one that is distinct, relevant, and consistent with the updated
strategic plan and is rolled out in concert with and part of the rebranding initiative.
Establish IREM as a thought leader through outreach to the media and focusing on topics critical to real estate management
industry. This will include participation in the National Association of Real Estate Editors (NAREE) conference and utilization of
content marketing and media outreach platforms and targeted attention to four key arenas, which collectively have an expanded
budget of nearly $60,000:
Asset management – positioning IREM as a resource for and about asset management
Technology – by developing a platform for informing members of new technology tools and emerging technology trends
Leadership – reinforcing IREM’s extensive offering of leadership development products ranging from white papers to online
education to classroom courses
Page 7
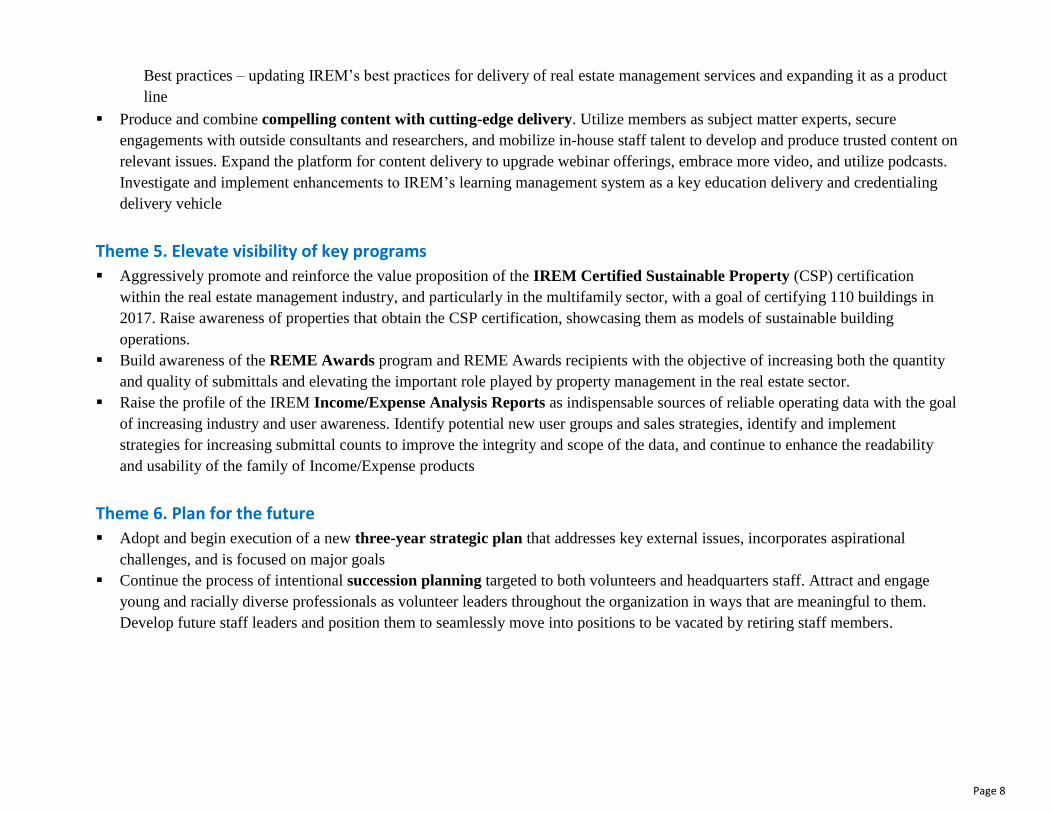
Best practices – updating IREM’s best practices for delivery of real estate management services and expanding it as a product
line
Produce and combine compelling content with cutting-edge delivery. Utilize members as subject matter experts, secure
engagements with outside consultants and researchers, and mobilize in-house staff talent to develop and produce trusted content on
relevant issues. Expand the platform for content delivery to upgrade webinar offerings, embrace more video, and utilize podcasts.
Investigate and implement enhancements to IREM’s learning management system as a key education delivery and credentialing
delivery vehicle
Theme 5. Elevate visibility of key programs
Aggressively promote and reinforce the value proposition of the IREM Certified Sustainable Property (CSP) certification
within the real estate management industry, and particularly in the multifamily sector, with a goal of certifying 110 buildings in
2017. Raise awareness of properties that obtain the CSP certification, showcasing them as models of sustainable building
operations.
Build awareness of the REME Awards program and REME Awards recipients with the objective of increasing both the quantity
and quality of submittals and elevating the important role played by property management in the real estate sector.
Raise the profile of the IREM Income/Expense Analysis Reports as indispensable sources of reliable operating data with the goal
of increasing industry and user awareness. Identify potential new user groups and sales strategies, identify and implement
strategies for increasing submittal counts to improve the integrity and scope of the data, and continue to enhance the readability
and usability of the family of Income/Expense products
Theme 6. Plan for the future
Adopt and begin execution of a new three-year strategic plan that addresses key external issues, incorporates aspirational
challenges, and is focused on major goals
Continue the process of intentional succession planning targeted to both volunteers and headquarters staff. Attract and engage
young and racially diverse professionals as volunteer leaders throughout the organization in ways that are meaningful to them.
Develop future staff leaders and position them to seamlessly move into positions to be vacated by retiring staff members.
Page 8

2017 Operating Income and Expense
2012 2013 2014 2015 2016F 2017BDirect Income $11,261,147 $11,370,490 $11,741,117 $11,765,824 $12,080,426 $12,561,770
Direct Expense $10,884,570 $10,904,256 $11,631,831 $11,356,974 $12,073,638 $12,559,305
$‐
$2,000,000
$4,000,000
$6,000,000
$8,000,000
$10,000,000
$12,000,000
$14,000,000
Page 9
_ __ 2015 Actual 2016 Budget 2016 Recast
2016 Forecast
(6 + 6) * 2017 Budget
Variance
Fav/(Unfav)
17-Budget vs
16-Forecast
% Variance
Fav/Unfav)
17-Bud vs
16-Forecast
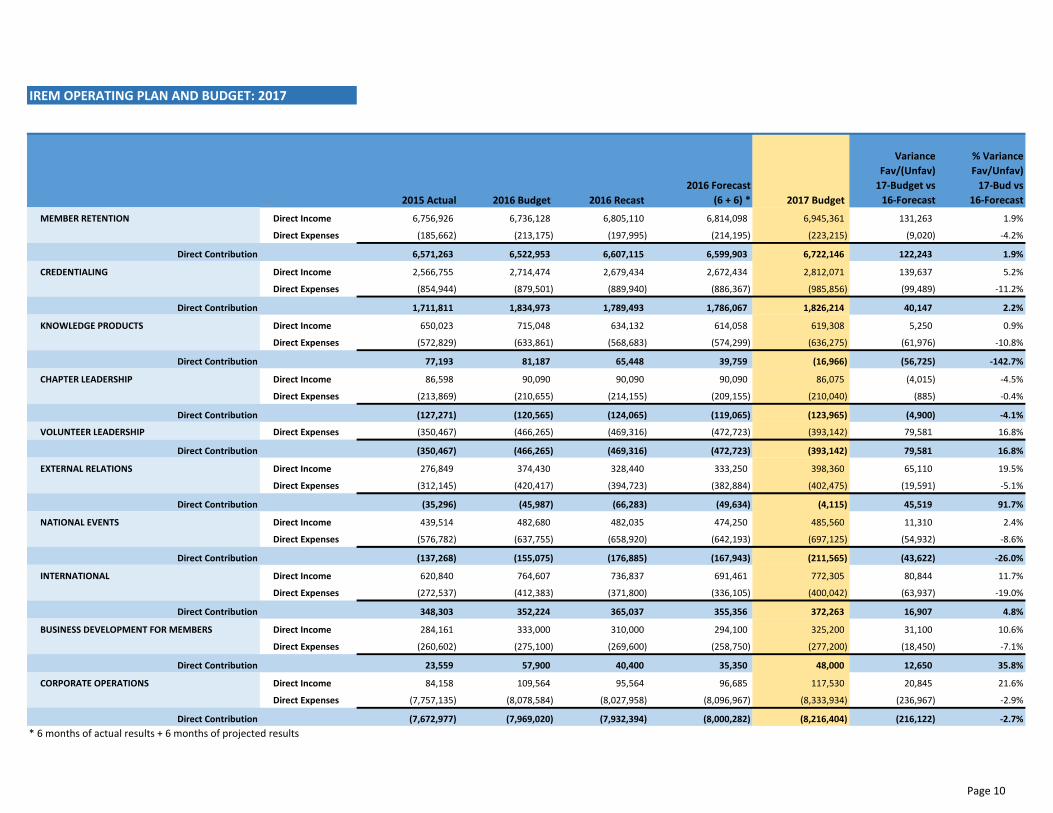
MEMBER RETENTION Direct Income 6,756,926 6,736,128 6,805,110 6,814,098 6,945,361 131,263 1.9%
Direct Expenses (185,662) (213,175) (197,995) (214,195) (223,215) (9,020) -4.2%
Direct Contribution 6,571,263 6,522,953 6,607,115 6,599,903 6,722,146 122,243 1.9%
CREDENTIALING Direct Income 2,566,755 2,714,474 2,679,434 2,672,434 2,812,071 139,637 5.2%
Direct Expenses (854,944) (879,501) (889,940) (886,367) (985,856) (99,489) -11.2%
Direct Contribution 1,711,811 1,834,973 1,789,493 1,786,067 1,826,214 40,147 2.2%
KNOWLEDGE PRODUCTS Direct Income 650,023 715,048 634,132 614,058 619,308 5,250 0.9%
Direct Expenses (572,829) (633,861) (568,683) (574,299) (636,275) (61,976) -10.8%
Direct Contribution 77,193 81,187 65,448 39,759 (16,966) (56,725) -142.7%
CHAPTER LEADERSHIP Direct Income 86,598 90,090 90,090 90,090 86,075 (4,015) -4.5%
Direct Expenses (213,869) (210,655) (214,155) (209,155) (210,040) (885) -0.4%
Direct Contribution (127,271) (120,565) (124,065) (119,065) (123,965) (4,900) -4.1%
VOLUNTEER LEADERSHIP Direct Expenses (350,467) (466,265) (469,316) (472,723) (393,142) 79,581 16.8%
Direct Contribution (350,467) (466,265) (469,316) (472,723) (393,142) 79,581 16.8%
EXTERNAL RELATIONS Direct Income 276,849 374,430 328,440 333,250 398,360 65,110 19.5%
Direct Expenses (312,145) (420,417) (394,723) (382,884) (402,475) (19,591) -5.1%
Direct Contribution (35,296) (45,987) (66,283) (49,634) (4,115) 45,519 91.7%
NATIONAL EVENTS Direct Income 439,514 482,680 482,035 474,250 485,560 11,310 2.4%
Direct Expenses (576,782) (637,755) (658,920) (642,193) (697,125) (54,932) -8.6%
Direct Contribution (137,268) (155,075) (176,885) (167,943) (211,565) (43,622) -26.0%
INTERNATIONAL Direct Income 620,840 764,607 736,837 691,461 772,305 80,844 11.7%
Direct Expenses (272,537) (412,383) (371,800) (336,105) (400,042) (63,937) -19.0%
Direct Contribution 348,303 352,224 365,037 355,356 372,263 16,907 4.8%
BUSINESS DEVELOPMENT FOR MEMBERS Direct Income 284,161 333,000 310,000 294,100 325,200 31,100 10.6%
Direct Expenses (260,602) (275,100) (269,600) (258,750) (277,200) (18,450) -7.1%
Direct Contribution 23,559 57,900 40,400 35,350 48,000 12,650 35.8%
CORPORATE OPERATIONS Direct Income 84,158 109,564 95,564 96,685 117,530 20,845 21.6%
Direct Expenses (7,757,135) (8,078,584) (8,027,958) (8,096,967) (8,333,934) (236,967) -2.9%
Direct Contribution (7,672,977) (7,969,020) (7,932,394) (8,000,282) (8,216,404) (216,122) -2.7%
* 6 months of actual results + 6 months of projected results
IREM OPERATING PLAN AND BUDGET: 2017
Page 10

IREM OPERATING PLAN AND BUDGET: 2017
OPERATING RECAP __ 2015 Actual 2016 Budget 2016 Recast
2016 Forecast
(6 + 6) * 2017 Budget
Variance
Fav/(Unfav)
17-Budget vs
16-Forecast
% Variance
Fav/Unfav)
17-Bud vs
16-Forecast
Direct Income 11,765,824 12,320,021 12,161,641 12,080,426 12,561,770 481,344 4.0%
Direct Expenses (11,356,974) (12,227,696) (12,063,091) (12,073,638) (12,559,305) (485,667) -4.0%
Net Income/Loss From Operations 408,850 92,325 98,550 6,788 2,465 (4,323) -63.7%
DEPRECIATION _ 2015 Actual 2016 Budget 2016 Recast
2016 Forecast
(6 + 6) * 2017 Budget
Variance
Fav/(Unfav)
17-Budget vs
16-Forecast
% Variance
Fav/Unfav)
17-Bud vs
16-Forecast
DEPRECIATION Direct Expenses (614,828) (489,542) (464,843) (462,756) (182,264) 280,492 60.6%
Direct Contribution (614,828) (489,542) (464,843) (462,756) (182,264) 280,492 60.6%
Net Operating Income/(Loss) After Depreciation (205,978) (397,217) (366,293) (455,968) (179,799) 276,169 60.6%
NET INVESTMENTS _ 2015 Actual 2016 Budget 2016 Recast
2016 Forecast
(6 + 6) * 2017 Budget
Variance
Fav/(Unfav)
17-Budget vs
16-Forecast
% Variance
Fav/Unfav)
17-Bud vs
16-Forecast
INVESTMENTS Direct Income (80,192) 196,549 196,549 125,005 165,000 39,995 32.0%
Direct Expenses (32,338) (34,250) (34,250) (17,482) (16,500) 982 5.6%
Direct Contribution (112,530) 162,299 162,299 107,523 148,500 40,977 38.1%
TOTAL RECAP _ 2015 Actual 2016 Budget 2016 Recast
2016 Forecast
(6 + 6) * 2017 Budget
Variance
Fav/(Unfav)
17-Budget vs
16-Forecast
% Variance
Fav/Unfav)
17-Bud vs
16-Forecast
Direct Income 11,685,632 12,516,570 12,358,190 12,205,431 12,726,770 521,339 4.3%
Direct Expenses (12,004,139) (12,751,488) (12,562,184) (12,553,876) (12,758,069) (204,193) -1.6%
Net Income/(Loss) (318,508) (234,918) (203,994) (348,445) (31,299) 317,146 91.0%
* 6 months of actual results + 6 months of projected results
Page 11

IREM OPERATING PLAN AND BUDGET: 2017
INCOME FROM OPERATIONS X 2015 Actual 2016 Budget 2016 Recast
2016 Forecast
(6 + 6) * 2017 Budget
Variance
Fav/(Unfav)
17-Budget vs
16-Forecast
% Variance
Fav/Unfav)
17-Bud vs
16-Forecast
OPERATING INCOME 11,765,824 12,320,021 12,161,641 12,080,426 12,561,770 481,344 4.0%
OPERATING EXPENSES (11,356,974) (12,227,696) (12,063,091) (12,073,638) (12,559,305) (485,667) -4.0%
NET INCOME/(LOSS) FROM OPERATIONS 408,850 92,325 98,550 6,788 2,465 (4,323) -63.7%
CAPITAL EXPENDITURES (700,280) (60,000) (60,000) (47,494) (75,750) (28,256) -59.5%
NET INVESTMENT INCOME (112,530) 162,299 162,299 107,523 148,500 40,977 38.1%
CASH CONTRIBUTION TO RESERVES (403,960) 194,624 200,849 66,817 75,215 8,398 12.6%
* 6 months of actual results + 6 months of projected results
IREM RESERVE POSITION & CONTRIBUTION TO RESERVES
Page 12

OPERATING STATEMENT OF INCOME AND EXPENSES (FOR FINANCIAL PHILOSOPHY)
2008 2009 2010 2011 2012 2013 2014 2015 2016 Forecast 2017 Budget
INCOME (INCLUDES INVESTMENTS)
Total income $10,640,893 $11,084,483 $11,431,410 $10,842,570 $11,528,206 $11,640,217 $11,829,513 $11,685,657 $12,205,431 $12,726,770
% change (YOY) -8.6% 4.2% 3.1% -5.2% 6.3% 1.0% 1.6% -1.2% 4.4% 4.3%
EXPENSE (INCLUDES DEPRECIATION)
Total expense ($11,729,347) ($10,633,680) ($10,896,238) ($11,285,513) ($11,425,409) ($11,492,813) ($12,255,068) ($12,004,163) ($12,553,876) ($12,758,069)
% change (YOY) -0.8% 9.3% -2.5% -3.6% -1.2% -0.6% -6.6% 2.0% -4.6% -1.6%
EXCESS OF INCOME OVER EXPENSE
Total excess ($1,088,454) $450,803 $535,172 ($442,943) $102,797 $147,404 ($425,555) ($318,506) ($348,445) ($31,299)
% change (YOY) -30309.7% -141.4% 18.7% -182.8% -123.2% 43.4% -388.7% -25.2% 9.4% -91.0%
DEPRECIATION (ADD BACK)
Total depreciation $353,801 $364,132 $258,039 $602,864 $507,597 $552,230 $582,448 $614,831 $462,756 $182,264
% change (YOY) 17.8% -2.9% 29.1% -133.6% 15.8% -8.8% -5.5% -5.6% 24.7% 60.6%
CASH PROFIT FROM OPERATIONS
Total excess ($734,653) $814,935 $793,211 $159,921 $610,394 $699,634 $156,893 $296,325 $114,311 $150,965
% change (YOY) -269.3% -210.9% -2.7% -79.8% 281.7% 14.6% -77.6% 88.9% -61.4% 32.1%
CONTRIBUTION TO RESERVES
2008 2009 2010 2011 2012 2013 2014 2015 2016 Forecast 2017 Budget
INCOME (INCLUDES INVESTMENTS)
Total income $10,640,893 $11,084,483 $11,431,410 $10,842,570 $11,528,206 $11,640,217 $11,829,513 $11,685,657 $12,205,431 $12,726,770
% change (YOY) -8.6% 4.2% 3.1% -5.2% 6.3% 1.0% 1.6% -1.2% 4.4% 4.3%
EXPENSE (EXCLUDES DEPRECIATION)
Total expense ($11,375,546) ($10,269,548) ($10,638,199) ($10,682,649) ($10,917,812) ($10,940,583) ($11,672,620) ($11,389,332) ($12,091,120) ($12,575,805)
% change (YOY) -1.5% 9.7% -3.6% -0.4% -2.2% -0.2% -6.7% 2.4% -6.2% -4.0%
CAPITAL EXPENSE
Total capital expense ($520,847) ($629,875) ($898,737) ($805,067) ($284,904) ($185,649) ($239,184) ($700,280) ($47,494) ($75,750)
% change (YOY) -75.4% -20.9% -42.7% 10.4% 64.6% 34.8% -28.8% -192.8% 93.2% -59.5%
TOTAL CASH CONTRIBUTION TO RESERVES
Total contribution ($1,255,500) $185,060 ($105,526) ($645,146) $325,490 $513,985 ($82,291) ($403,955) $66,817 $75,215
% change (YOY) -1017.4% -114.7% -157.0% 511.4% -150.5% 57.9% -116.0% 390.9% -116.5% 12.6%
AVERAGE CASH RESERVES VS POLICY (33.3% OF AVERAGE OPERATING EXPENSES EXCLUDING DEPRECIATION)
Required reserves $3,788,057 $3,419,759 $3,542,520 $3,557,322 $3,635,631 $3,643,214 $3,886,982 $3,792,648 $4,026,343 $4,187,743
Actual average reserves $6,146,040 $5,363,900 $5,635,589 $5,139,615 $4,755,834 $5,470,023 $5,967,678 $5,657,073 $5,551,796 $5,622,812
Over (under) $2,357,983 $1,944,141 $2,093,069 $1,582,293 $1,120,203 $1,826,809 $2,080,696 $1,864,426 $1,525,453 $1,435,069
Actual reserves as % of cash
expense 162.2% 156.9% 159.1% 144.5% 130.8% 150.1% 153.5% 149.2% 137.9% 134.3%
Page 13

2008 2009 2010 2011 2012 2013 2014 20152016
Forecast2017 Budget
Required reserves $3,788,057 $3,419,759 $3,542,520 $3,557,322 $3,635,631 $3,643,214 $3,886,982 $3,792,648 $4,026,343 $4,187,743
Actual average reserves $6,146,040 $5,363,900 $5,635,589 $5,139,615 $4,755,834 $5,470,023 $5,967,678 $5,657,073 $5,551,796 $5,622,812
$0
$1,000,000
$2,000,000
$3,000,000
$4,000,000
$5,000,000
$6,000,000
$7,000,000
Financial Reserves
Reserve RequirementFour months average operating expenses, less depreciation
Actual average reserves
Page 14

Business Lines
1. Member Retention – comprises US membership dues, dues collection and retention activities, Associate membership, and ethics administration
2. Credentialing Programs – includes all courses leading to IREM credentials, admissions administration, and marketing of credentialed membership programs and credentialing courses
3. Knowledge Products – made up of non‐credentialing professional development courses, Journal of Property Management, publications, Income/Expense and other industry research, contract development work, webinars, forms, and all other knowledge products
4. Chapter Leadership – programs and services that support US chapters5. Volunteer Leadership – programs and services that support leadership and governance activities and corporate strategy6. External Relations – contains programs and initiatives that promote IREM as an organization throughout the US and foster
relationships with real estate companies, industry associations and leaders, academic institutions, government bodies, and vendors
7. National Events – production and delivery of U.S. regional leadership conferences and fall Global Summit8. International – comprises all programs and activities that take place outside the US, including education, membership
admissions, member service, chapter service and support, and external relations9. Business Development for Members – programs and initiatives aimed at increasing employment and business opportunities for
and promote expertise of IREM’s credentialed members 10. Corporate Operations – contains all administrative costs of running IREM, including rent and other office expenses, finance and
accounting, insurance and risk management, information technology, all salaries and benefits, contingency expense, as well as a service contract with the IREM Foundation
IREM’s operating plan and budget are organized around 10 business lines – core activities represented by groups of similar products, programs, services, and revenue‐generating activities. Each business line is made up of a series of programs – closely aligned individual products, programs, services, and revenue‐generating activities.
Page 15

Business Line: Member RetentionU.S. membership dues invoicing and collections, member retention communications and campaigns, Associate membership admissions, and administration of IREM’s ethics program
Programs in this business line:
Dues – U.S. member dues invoicing and collection for all member types, processing new emeritus members and reinstatements, NAR Institute Affiliate (IA) membership administration; expenses include member engagement communications and chapter payments for Associate dues
Associates – Associate Member admissions processing for U.S.
Ethics – legal and administrative support for oversight of IREM's Codes of Professional Ethics through the three Ethics Boards
Page 16

Business Line: Member Retention2017 Highlights Total U.S. membership will reach nearly 19,400 by end
of 2017
No increase in dues rates for any member categories; last dues increase was in 2015 when dues were raised by 2‐5%
2012 2013 2014 2015 2016F 2017BDirect Income $6,398,083 $6,677,652 $6,704,394 $6,756,926 $6,814,361 $6,945,361
Direct Expense $148,996 $141,527 $189,116 $185,662 $214,195 $223,215
$‐
$1,000,000
$2,000,000
$3,000,000
$4,000,000
$5,000,000
$6,000,000
$7,000,000
$8,000,000
Page 17

BUSINESS LINE: MEMBER RETENTION
Program Name Business Line_ 2015 Actual 2016 Budget 2016 Recast
2016 Forecast
(6 + 6 ) * 2017 Budget
Variance
Fav/(Unfav)
2017-B vs 2016-F
% Variance
Fav/Unfav)
2017-B vs 2016-F
DUES - U.S. MEMBER RETENTIONDirect Income 6,756,926 6,736,128 6,805,110 6,814,098 6,945,361 131,263 1.9%
Direct Expenses (174,099) (203,175) (187,995) (201,895) (209,615) (7,720) -3.8%
Direct Contribution 6,582,827 6,532,953 6,617,115 6,612,203 6,735,746 123,543 1.9%
ASSOCIATES MEMBER RETENTIONDirect Expenses (8,353) (7,500) (7,500) (9,200) (10,200) (1,000) -10.9%
Direct Contribution (8,353) (7,500) (7,500) (9,200) (10,200) (1,000) -10.9%
ETHICS ADMINISTRATION MEMBER RETENTIONDirect Expenses (3,210) (2,500) (2,500) (3,100) (3,400) (300) -9.7%
Direct Contribution (3,210) (2,500) (2,500) (3,100) (3,400) (300) -9.7%
Net Income/(Loss) 6,571,263 6,522,953 6,607,115 6,599,903 6,722,146 122,243 1.9%
* 6 months of actual results + 6 months of projected results
Page 18

YEAR-END MEMBERSHIP COUNTS
2008 2009 2010 2011 2012 2013 2014 2015
2016
Forecast
2017
BudgetCPM
U.S. 7,668 7,615 7,537 7,405 7,486 7,494 7,427 7,432 7,458 7,534
International 1,037 1,157 1,024 1,001 1,020 1,024 1,038 1,061 1,113 1,157
Total CPM Members 8,705 8,772 8,561 8,406 8,506 8,518 8,465 8,493 8,571 8,691
% Change 0.7% 0.8% -2.4% -1.8% 1.2% 0.1% -0.6% 0.3% 0.9% 1.4%
CPM approvals U.S. 369 335 277 291 286 329 310 293 250 300
CPM approvals International 158 166 145 124 109 93 115 102 135 127
Candidate
U.S. 3,326 3,087 3,139 3,037 3,244 3,173 3,020 3,037 3,200 3,361
International 175 163 172 156 164 186 196 204 218 234
Total Candidate Members 3,501 3,250 3,311 3,193 3,408 3,359 3,216 3,241 3,418 3,595
% Change 5.9% -7.2% 1.9% -3.6% 6.7% -1.4% -4.3% 0.8% 5.5% 5.2%
Candidate approvals U.S. 1,261 1,051 1,057 1,065 1,110 924 850 959 1,000 1,000
Candidate approvals International 33 28 49 63 146 70 63 102 53 56
ARM
U.S. 2,865 2,766 2,752 2,774 2,868 3,016 3,075 3,142 3,305 3,469
U.S. Duals: ARM/CPM or ARM/Candidate or
ARM/ACoM 629 619 646 641 707 719 689 665 656 650
International 210 246 271 209 212 213 255 269 297 321
Total ARM Members 3,704 3,631 3,669 3,624 3,787 3,948 4,019 4,076 4,258 4,440
% Change 0.2% -2.0% 1.0% -1.2% 4.5% 4.3% 1.8% 1.4% 4.5% 4.3%
ARM approvals U.S. 489 377 400 494 509 453 409 445 495 495
ARM approvals International 29 56 40 54 29 21 53 36 57 56
Total ARM Candidates (Canada) 30 34 39 61 70 74 92
ACoM
U.S. 20 34 39 48 50 54 49 54 67 70
U.S. Duals: ACoM/CPM or ACoM/Candidate or
ACoM/ARM 24 38 53 60 61 65 77 75 70 68
International 2 4 6 7 16 16 17 21 25 31
Total ACoM Members 46 76 98 115 127 135 143 150 162 169
Total ACoM Candidates (Canada) 6 5 6 8 3 3 5
Associate Members 2,210 2,058 1,918 1,909 1,779 2,561 2,892 3,110 3,507 3,904
% Change 1.1% -6.9% -6.8% -0.5% -6.8% 44.0% 12.9% 7.5% 12.8% 11.3%
Student Members 280 323 308 188 336 443 372 305 298 295
Academic Members 21 21 25 22 26 32 39 49 45 44
Total Members 18,467 18,131 17,890 17,493 18,008 19,041 19,215 19,497 20,336 21,235
% change 2.1% -1.8% -1.3% -2.2% 2.9% 5.7% 0.9% 1.5% 4.3% 4.4%
AMO
U.S. HQs 547 550 553 560 562
International HQs 6 7 7 7 8
Total AMO Headquarters 515 524 537 537 560 553 557 560 567 570
% Change 1.6% 1.7% 2.5% 0.0% 4.3% -1.3% 0.7% 0.5% 1.3% 0.5%
U.S. Branches 572 581 570 580
International Branches 8 6 3 3
Total AMO Branches 617 542 568 568 572 580 587 0 573 583
Total AMO Offices 1,133 1,144 560 1,140 1,153
AMO approvals U.S. 23 30 33 25 35 18 20 19 20 20
AMO approvals International 2 1 0 0 0
Page 19

MEMBERSHIP DUES AND FEES HISTORY
CPM Program 2008 2009 2010 2011 2012 2013 2014 2015 2016 2017 Budget
CPM $525 $525 $545 $545 $545 $555 $555 $565 $565 $565
% change 3.8% 1.8% 1.8%
CPM-Emeritus/Lifetime
(no new Lifetime after 2001) $105 $105 $109 - $273 $109 - $273 $109 - $272.50 $111 - $277.50 $111 - $277.50 $113 - $283 $113 - $283 $113 - $283
% change
CPM-Past President $0 $0 $0 $0 $0 $0 $0 $0 $0 $0
CPM-Inactive (no new after 2001)
CPM-International (range) $148 - $372 $184 - $372 $184 - $372 $184 - $372 $184 - $372 $184 - $372 $184 - $372 $184 - $372 $184 - $372 $184 - $372
CPM Candidate $470 $470 $490 $490 $490 $495 $495 $495 $495 $495
% change 4.3% 1.0%
CPM Candidate application fee $150 $150 $150 $160 $160 $160 $160 $160 $160 $160
% change 6.7%
CPM application fee $200 $200 $200 $210 $210 $210 $210 $210 $210 $210
% change 5.0%
CPM Fast Track Fee $630 $630 $630 $800
CPM certification exam fee $100 $100 $100 $100 $100 $100 $270 $270 $270 $270
% change 170.0%
Management plan fee $750 $750 $750 $750 $750 $750 $750 $750 $750 $750
% change 316.7%
MPSA fee $1,295 $1,295 $1,295 $1,295 $1,295 $1,295 $1,295 $1,295 $1,295 $1,295
% change 78.6%
ARM Program 2008 2009 2010 2011 2012 2013 2014 2015 2016 2017 Budget
ARM $195 $195 $205 $205 $205 $210 $210 $220 $220 $220
% change 5.1% 2.4% 4.8%
CPM/ARM dual designees $95 $95 $95 $103 $102.50 $105 $105 $110 $110 $110
% change 8.4% -0.5% 2.4% 4.8%
ARM-Lifetime (no new after 2001) $40 $40 $40 $40 $40 $42 $42 $44 $44 $44
% change 5.0% 4.8%
ARM-Emeritus $40 $40 $40 $40 $40 $42 $42 $44-$110 $44-$110 $44-$110
% change 5.0% 4.8%
ARM-Inactive (no new after 2001)
ARM-International (range) $53 - $131 $68 - $131 $68 - $131 $68 - $131 $68 - $131 $68 - $131 $68 - $131 $68 - $131 $68 - $131 $68 - $131
ARM Applicant (no new after 2001)
ARM application fee $75 $75 $75 $80 $80 $80 $80 $80 $80 $80
% change 6.7%
ARM certification exam fee $60 $60 $60 $60 $60 $60 $60 $60 $60 $60
% change
ACoM Program 2008 2009 2010 2011 2012 2013 2014 2015 2016 2017 Budget
ACoM $195 $195 $195 $195 $195 $200 $200 $200 $200 $200
% change 2.6%
ACoM application fee $75 $75 $75 $80 $80 $80 $80 $80 $80 $80
% change 6.7%
ACoM certification exam fee $60 $60 $60 $60 $60 $60 $60 $60 $60 $60
% change
Associate Member Program 2008 2009 2010 2011 2012 2013 2014 2015 2016 2017 Budget
Associate Member $195 $195 $205 $205 $205 $210 $210 $220 $220 $220
% change 5.1% 2.4% 4.8%
AMO Program 2008 2009 2010 2011 2012 2013 2014 2015 2016 2017 Budget
AMO Headquarters $440 $440 $440 $440 $440 $450 $450 $475 $475 $475
% change 2.3% 5.6%
AMO Branch $100 $100 $100 $100 $100 $110 $110 $110 $110 $110
% change 10.0%
AMO application fee $405 $405 $405 $425 $425 $425 $425 $425 $425 $425
% change 4.9%
AMO reaccreditation fee $100 $100 $100 $100 $100
Page 20

Business Line: CredentialingMembership activities, including applications, education, exams, and services associated with earning an IREM credential (CPM, ARM, ACoM, AMO) in the U.S., including credentialing marketing, recruiting, admissions, credentialing education and exam development and delivery, instructor management
Programs within business line:
Classroom Credentialing Education – all courses that earn credit toward the CPM, ARM, ACoM, and AMO credentials delivered in the classroom, promoted to the public, and sponsored by either chapters or IREM Headquarters
Self‐Paced Online Credentialing Education – all courses that earn credit toward the CPM, ARM, ACoM, and AMO credentials delivered online as self‐paced offerings
Corporate and Government Credentialing Courses – all courses that earn credit toward the CPM, ARM, ACoM, and AMO credentials delivered as private in‐house classroom offerings, online offerings, or through licensing agreements to corporate and government clients; also includes enrollments resulting from corporate MOUs and government purchasing programs in public online and classroom offerings
Credentialing Exams – delivery, proctoring, and processing of all credentialing exams for CPM, ARM, and ACoM, including management plans and MPSA
Credentialing Content Development – development of credentialing course curriculum, student and instructor materials, and examinations for all credentialing programs
Instructor Management – management and support of IREM instructors, including instructor recruitment and training, course assignments and scheduling, course and instructor evaluations, instructor presentation skill development – all with a goal of ensuring quality classroom delivery; also includes oversight of MPSA and management plan graders to ensure grading integrity and consistency
Credentialing Marketing – all strategies, campaigns, and tactics for marketing credentialing courses and membership recruitment for all credentialed member categories
CPM – CPM candidate and CPM admissions processing
ARM – ARM admissions processing
AMO – AMO admissions processing for new AMO firms, AMO reaccreditations, and AMO firm changes
ACoM – ACoM admissions processing
Page 21

Business Line: Credentialing2017 Highlights Reposition and rebrand the ACoM certification as a
program for entry‐level commercial property managers – develop an online course specifically for the ACoM that fulfills the ACoM education requirement (similar to the RES201 for the ARM)
Deepen market penetration of the ARM certification by developing a refreshed RES201 course targeted to entry‐level residential property manager and by expanding the capacity to deliver the RES201 course by increasing number of RES201 instructors in key markets
Target CPM recruitment campaigns to millennials and young professionals
Continue the CPM sponsor program, enhance the Member ROI program, launch a video recruitment series
Release updated versions of CPM credentialing courses (HRS402, MKL404/5/6, FIN402, MNT402, ASM603/4/5) that reflect job analysis findings and incorporate more engaging activities in both classroom and online versions
Refresh ETH800 course with updated video scenarios Review, revise, and update the CPM, ARM, and ACoM
certification exams and MPSA exam to incorporate findings from job analysis and ensure exam rigor
Explore alternate vehicles for delivering MPSA and certification exams, including online testing options
Course and exam tuitions and fees remain at same regular and member rates; for classroom course, tuitions increase by $100 for those who register fewer than 30 days out, with the goal of increasing registrations, improving course shipment practices, and minimizing course cancellations; chapter sponsors will receive $50 of the $100 fee increase
2012 2013 2014 2015 2016F 2017BIncome $2,447,857 $2,430,655 $2,536,825 $2,566,755 $2,672,434 $2,812,071
Direct Expense $955,474 $928,477 $1,030,007 $854,944 $886,367 $985,856
$‐
$500,000
$1,000,000
$1,500,000
$2,000,000
$2,500,000
$3,000,000
Page 22

BUSINESS LINE: CREDENTIALING
Program Name Business Line_ 2015 Actual 2016 Budget 2016 Recast
2016 Forecast
(6 + 6) * 2017 Budget
Variance
Fav/(Unfav)
2017-B vs 2016-F
% Variance
Fav/Unfav)
2017-B vs 2016-F
CLASSROOM - CREDENTIALING CREDENTIALINGDirect Income 706,121 760,017 745,815 745,815 799,727 53,912 7.2%
Direct Expenses (353,432) (265,726) (280,815) (280,815) (301,952) (21,137) -7.5%
Direct Contribution 352,689 494,291 464,999 465,000 497,774 32,774 7.0%
SELF-PACED ONLINE CREDENTIALING CREDENTIALINGDirect Income 1,034,957 1,051,616 1,065,280 1,065,280 1,113,649 48,369 4.5%
Direct Expenses (425) (700) (700) (150) (2,350) (2,200) -1466.7%
Direct Contribution 1,034,532 1,050,916 1,064,580 1,065,130 1,111,299 46,169 4.3%
CORPORATE & GOVERNMENT COURSES CREDENTIALINGDirect Income 181,066 200,000 200,000 194,000 209,000 15,000 7.7%
Direct Expenses (26,573) (57,150) (57,150) (53,300) (59,700) (6,400) -12.0%
Direct Contribution 154,494 142,850 142,850 140,700 149,300 8,600 6.1%
CREDENTIALING EXAMS CREDENTIALINGDirect Income 361,335 406,371 372,269 372,269 381,285 9,016 2.4%
Direct Expenses (101,941) (118,350) (102,850) (102,850) (94,069) 8,781 8.5%
Direct Contribution 259,394 288,021 269,419 269,419 287,216 17,797 6.6%
CONTENT DEVELOPMENT CREDENTIALINGDirect Expenses (13,268) (21,200) (21,200) (19,600) (60,550) (40,950) -208.9%
Direct Contribution (13,268) (21,200) (21,200) (19,600) (60,550) (40,950) -208.9%
INSTRUCTOR MANAGEMENT CREDENTIALINGDirect Expenses (49,241) (20,525) (39,775) (34,321) (78,920) (44,599) -129.9%
Direct Contribution (49,241) (20,525) (39,775) (34,321) (78,920) (44,599) -129.9%
CREDENTIALING MARKETING CREDENTIALINGDirect Expenses (261,035) (347,500) (339,500) (344,000) (336,000) 8,000 2.3%
Direct Contribution (261,035) (347,500) (339,500) (344,000) (336,000) 8,000 2.3%
CPM CREDENTIALINGDirect Income 233,833 232,590 232,590 232,590 249,750 17,160 7.4%
Direct Expenses (25,293) (24,500) (24,500) (26,266) (26,000) 266 1.0%
Direct Contribution 208,540 208,090 208,090 206,324 223,750 17,426 8.4%
ARM CREDENTIALINGDirect Income 27,123 31,680 31,680 31,680 32,680 1,000 3.2%
Direct Expenses (14,260) (14,900) (14,900) (14,900) (15,600) (700) -4.7%
Direct Contribution 12,863 16,780 16,780 16,780 17,080 300 1.8%
AMO CREDENTIALINGDirect Income 21,600 31,000 31,000 30,000 25,100 (4,900) -16.3%
Direct Expenses (7,583) (7,100) (7,100) (7,580) (8,100) (520) -6.9%
Direct Contribution 14,017 23,900 23,900 22,420 17,000 (5,420) -24.2%
ACoM CREDENTIALINGDirect Income 720 1,200 800 800 880 80 10.0%
Direct Expenses (1,895) (1,850) (1,450) (2,585) (2,615) (30) -1.2%
Direct Contribution (1,175) (650) (650) (1,785) (1,735) 50 2.8%
Net Income/(Loss) 1,711,811 1,834,973 1,789,493 1,786,067 1,826,214 40,147 2.2%
* 6 months of actual results + 6 months of projected results
Page 23

Business Line: Knowledge ProductsDevelopment, delivery, marketing, and sales of all knowledge products exclusive of credentialing courses – includes classroom and online seminars, publications, JPM, Income/Expense Analysis, webinars, tutorials, news and other content, third‐party contract work, and industry research.
Programs within business line:
Non‐credentialing Education – online and classroom courses and virtual seminars that do not earn credit toward an IREM credential
Journal of Property Management – published bi‐monthly in digital and print, IREM’s primary communications vehicle, complimentary to members, some paid subscribers
Income/Expense Reports – five statistical reports based on operating income and expense data submitted by members and nonmembers; available in print, e‐book, online lab formats, by metro areas, and through corporate licenses; CPMs and data contributors receive free digital reports or pay only $50 for print copies
Publications – books, white papers, reports on industry‐specific topics, available in print and digital formats
Knowledge and Content Services – both for‐sale knowledge products and complimentary and member service products, including webinars, forms and checklists, weekly newsletter, tutorials, thought leadership
Knowledge Products Marketing – strategies, campaigns, and tactics for marketing of non‐credentialing courses, webinars, and content services
Contract Work – development of education curriculum or delivery of other services under third‐party contracts with outside organizations, such as government and NAR
Page 24

Business Line: Knowledge Products
2012 2013 2014 2015 2016F 2017BDirect Income $707,650 $544,396 $589,151 $650,023 $614,058 $619,308
Direct Expense $538,038 $522,266 $675,460 $572,829 $574,299 $636,275
$‐
$100,000
$200,000
$300,000
$400,000
$500,000
$600,000
$700,000
$800,000 2017 Highlights Launch a series of virtual seminars offering in‐depth
industry education and presented on webinar platform; 10 seminars are planned
Develop meaningful content to continue to position IREM as a thought leader in real estate asset management, leadership development, technology, and best practices
Withdraw from IREM Headquarters obtaining state CE approvals for IREM courses, while supporting those chapters that elect to obtain CE on their own
Produce revision of Principles of Real Estate Management, 17th edition, in both print version and interactive digital version
Page 25

BUSINESS LINE: KNOWLEDGE PRODUCTS
Program Name Business Line_ 2015 Actual 2016 Budget 2016 Recast
2016 Forecast
(6 + 6) * 2017 Budget
Variance
Fav/(Unfav)
2017-B vs 2016-F
% Variance
Fav/Unfav)
2017-B vs 2016-F
NON-CREDENTIALING EDUCATION KNOWLEDGE PRODUCTSDirect Income 86,895 109,060 89,998 80,651 92,759 12,108 15.0%
Direct Expenses (4,208) (14,835) (13,960) (11,760) (11,635) 125 1.1%
Direct Contribution 82,687 94,225 76,038 68,891 81,124 12,233 17.8%
JOURNAL OF PROPERTY MANAGEMENT (JPM) KNOWLEDGE PRODUCTSDirect Income 11,178 24,291 12,343 14,343 14,403 60 0.4%
Direct Expenses (221,228) (210,633) (210,460) (209,714) (209,698) 16 0.0%
Direct Contribution (210,050) (186,342) (198,117) (195,371) (195,295) 76 0.0%
STATE CONTINUING EDUCATION KNOWLEDGE PRODUCTSDirect Expenses (7,284) (18,180) (9,225) (3,920) (4,000) (80) -2.0%
Direct Contribution (7,284) (18,180) (9,225) (3,920) (4,000) (80) -2.0%
INCOME & EXPENSE KNOWLEDGE PRODUCTSDirect Income 356,383 357,531 357,531 348,064 357,333 9,269 2.7%
Direct Expenses (161,598) (143,300) (141,300) (141,300) (145,605) (4,305) -3.0%
Direct Contribution 194,785 214,231 216,231 206,764 211,728 4,964 2.4%
PUBLICATIONS KNOWLEDGE PRODUCTSDirect Income 94,578 121,491 114,585 90,000 119,539 29,539 32.8%
Direct Expenses (63,800) (62,313) (62,138) (62,605) (88,377) (25,772) -41.2%
Direct Contribution 30,778 59,178 52,446 27,395 31,162 3,767 13.8%
KNOWLEDGE & CONTENT SERVICES KNOWLEDGE PRODUCTSDirect Income 9,988 62,675 12,675 13,500 15,275 1,775 13.1%
Direct Expenses (108,526) (170,500) (120,500) (135,000) (164,360) (29,360) -21.7%
Direct Contribution (98,538) (107,825) (107,825) (121,500) (149,085) (27,585) -22.7%
MARKETING - KNOWLEDGE PRODUCTS KNOWLEDGE PRODUCTSDirect Expenses (5,673) (12,000) (9,000) (9,000) (11,000) (2,000) -22.2%
Direct Contribution (5,673) (12,000) (9,000) (9,000) (11,000) (2,000) -22.2%
CONTRACT WORK KNOWLEDGE PRODUCTSDirect Income 91,000 40,000 47,000 67,500 20,000 (47,500) -70.4%
Direct Expenses (512) (2,100) (2,100) (1,000) (1,600) (600) -60.0%
Direct Contribution 90,488 37,900 44,900 66,500 18,400 (48,100) -72.3%
Net Income/(Loss) 77,193 81,187 65,448 39,759 (16,966) (56,725) -142.7%
* 6 months of actual results + 6 months of projected results
Page 26

Business Line: Chapter LeadershipPrograms and services that support chapters and RVPs in the U.S. through the local member network
Programs within this business line:
Chapter Support – Administrative support to IREM chapters, chapter volunteer leaders, and IAEs, including IAE work group, IAE symposium, chapter recognition program, chapter president and IAE training; also includes chapter website program
Chapter Presidents Subsidy – financial assistance through reimbursement of airfare or other travel expense to chapters that send incoming presidents to the IREM Global Summit in Chicago in October 2017
Chapter Visits – scheduling and support of and communications with IREM chapters that are visited by IREM senior leaders; approximately 40% of chapters are visited each year
RVP Travel – financial and administrative support for RVPs to visit chapters within their region; also includes RVP training
Page 27

Business Line: Chapter Leadership2017 Highlights Provide continued high‐level support of chapters and
regional vice presidents in the U.S., including visits to chapters by national officers, RVP visits to and support of chapters, and IAE professional development
2012 2013 2014 2015 2016F 2017BDirect Income $71,175 $75,275 $90,365 $86,598 $90,090 $86,075
Direct Expense $213,237 $222,398 $210,653 $213,869 $209,155 $210,040
$‐
$50,000
$100,000
$150,000
$200,000
$250,000
Page 28

BUSINESS LINE: CHAPTER LEADERSHIP
Program Name Business Line_ 2015 Actual 2016 Budget 2016 Recast
2016 Forecast
(6 + 6) * 2017 Budget
Variance
Fav/(Unfav)
2017-B vs 2016-F
% Variance
Fav/Unfav)
2017-B vs 2016-F
CHAPTER SUPPORT CHAPTER LEADERSHIPDirect Income 86,598 90,090 90,090 90,090 86,075 (4,015) -4.5%
Direct Expenses (110,203) (111,215) (114,715) (114,715) (108,410) 6,305 5.5%
Direct Contribution (23,606) (21,125) (24,625) (24,625) (22,335) 2,290 9.3%
CHAPTER PRESIDENTS SUBSIDY CHAPTER LEADERSHIPDirect Expenses (28,015) (27,450) (27,450) (27,450) (28,800) (1,350) -4.9%
Direct Contribution (28,015) (27,450) (27,450) (27,450) (28,800) (1,350) -4.9%
CHAPTER VISITS CHAPTER LEADERSHIPDirect Expenses (35,174) (31,130) (31,130) (31,130) (32,230) (1,100) -3.5%
Direct Contribution (35,174) (31,130) (31,130) (31,130) (32,230) (1,100) -3.5%
RVP TRAVEL CHAPTER LEADERSHIPDirect Expenses (40,476) (40,860) (40,860) (35,860) (40,600) (4,740) -13.2%
Direct Contribution (40,476) (40,860) (40,860) (35,860) (40,600) (4,740) -13.2%
Net Income/(Loss) (127,271) (120,565) (124,065) (119,065) (123,965) (4,900) -4.1%
* 6 months of actual results + 6 months of projected results
Page 29

Business Line: Volunteer LeadershipPrograms and services that support the volunteer leadership team in executing corporate strategy, leadership development, and governance activities
Programs within this business line:
Strategic Planning – strategic planning, research, and scanning, including the annual executive committee retreat in Chicago; research to support strategic decision‐making and monitoring; task forces and related activities to support the execution of the strategic plan
Leadership Recognition and Support – identification, support, and recognition of IREM volunteer leaders; includes officer spouse travel and related expenses
Committee and Board Support – administrative and governance support for IREM’s committees and boards, including both virtual meetings and engagement as well as in‐person meetings that will take place during IREM Global Summit in October
Leadership and Officer Briefings – meetings conducted to oversee IREM governance, onboard and train new officers, conduct briefings and other business matters; includes both virtual and in‐person meetings
Page 30

Business Line: Volunteer Leadership2017 Highlights With a single national governance meeting,
committee and board activity will occur primarily through virtual meetings, and the overall cost of governance drops
Updated and refreshed 2017‐2019 strategic plan anticipated as outcome of January executive committee retreat
2012 2013 2014 2015 2016F 2017BDirect Income $‐ $‐ $‐ $‐ $‐ $‐
Direct Expense $310,251 $391,589 $420,172 $350,467 $472,723 $393,142
$‐
$50,000
$100,000
$150,000
$200,000
$250,000
$300,000
$350,000
$400,000
$450,000
$500,000
Page 31

BUSINESS LINE: VOLUNTEER LEADERSHIP
Program Name Business Line_ 2015 Actual 2016 Budget 2016 Recast
2016 Forecast
(6 + 6) * 2017 Budget
Variance
Fav/(Unfav)
2017-B vs 2016-F
% Variance
Fav/Unfav)
2017-B vs 2016-F
STRATEGIC PLANNING VOLUNTEER LEADERSHIPDirect Expenses (47,565) (112,000) (114,480) (125,321) (98,040) 27,281 21.8%
Direct Contribution (47,565) (112,000) (114,480) (125,321) (98,040) 27,281 21.8%
LEADERSHIP RECOGNITION & SUPPORT VOLUNTEER LEADERSHIPDirect Expenses (84,832) (101,800) (107,985) (95,888) (126,395) (30,507) -31.8%
Direct Contribution (84,832) (101,800) (107,985) (95,888) (126,395) (30,507) -31.8%
COMMITTEE & BOARD SUPPORT VOLUNTEER LEADERSHIPDirect Expenses (160,512) (202,845) (194,286) (197,457) (109,147) 88,310 44.7%
Direct Contribution (160,512) (202,845) (194,286) (197,457) (109,147) 88,310 44.7%
LEADERSHIP & OFFICER BRIEFINGS VOLUNTEER LEADERSHIPDirect Expenses (57,557) (49,620) (52,565) (54,057) (59,560) (5,503) -10.2%
Direct Contribution (57,557) (49,620) (52,565) (54,057) (59,560) (5,503) -10.2%
Net Income/(Loss) (350,467) (466,265) (469,316) (472,723) (393,142) 79,581 16.8%
* 6 months of actual results + 6 months of projected results
Page 32

Business Line: External RelationsPrograms and initiatives that foster external relationships with real estate management companies, industry associations and leaders, academic institutions, government bodies, and vendors
Programs within this business line:
Corporate Outreach – participation in industry and corporate events and tradeshows, attendance at NAR national meetings and participation in NAR committees, Commercial Summit, and business development initiatives directed toward corporate and government clients
Academic, Young Professional, Diversity Outreach – three outreach programs: (1) academic outreach to colleges and universities, academic MOUs and advisory board roles, student and academic membership programs (exclusive of dues revenue), career support materials, and support of chapter college outreach programs and IREM student clubs through program overseen by Student and Academic Advisory Board; (2) diversity outreach to attract and engage an ethnically diverse market to IREM through Diversity Advisory Board; and (3) young professional outreach, aimed at attracting and engaging young property professionals (under 35) to IREM
Government Relations – an agency and regulatory program addressing notices, rules, and orders concerning federal law; a state and municipal affairs program addressing legislative and legal issues and encouraging statehouse visits; a federal advocacy program addressing legislative and legal issues, including an In‐District Visit program for grassroots lobbying of U.S. Congressmen, Federal Housing Advisory Board, and Federal Advocacy Board
Corporate Marketing and Public Relations – initiatives designed to promote IREM as an organization, the IREM brand, and the combined programs and services of the organization
Vendor Relations ‐ vendor relationships and sponsorships that offer access to IREM members, including Industry Partners, corporate sponsors, online and JPM advertising, conference exhibitors/sponsors, buyer's guide royalties, REME Award sponsors, and I/E sponsorships and advertising
Industry Awards – REME Awards program recognizing innovative business practices by property management companies and practitioners, culminating in an awards presentations at IREM Global Summit
Page 33

Business Line: External Relations2017 Highlights Commercial Summit to be held in January and capitalize
on momentum gained from initial summit in 2016
Expanded staffing in business development area will be aimed at strengthening depth and scope of relationships with corporate real estate companies and vendors
Continued attention to college and university engagement and diversity programs, with additional outreach to HBCUs and to high school students
Engagements with young professionals to be expanding and will include a “30 under 30” initiative
Launch of the REstart program through IREM chapters
Government relations to shift its federal focus to in‐district meetings as primary vehicle for members to connect with Congressional leaders, supplemented with launch of Federal Advocacy Board positioned to speak on behalf of IREM in DC
Local and state government affairs issues to be supported by statehouse visit program
Expansion of corporate PR and communications efforts to position IREM as an organizational thought leader and its leaders as subject matter experts; includes participation in NAREE (National Association of Real Estate Editors) conference
In its third year, the REME Awards is targeting a 25% increase in submissions2012 2013 2014 2015 2016F 2017B
Direct Income $277,921 $342,220 $355,439 $276,849 $333,250 $398,360
Direct Expense $256,620 $346,756 $348,887 $312,145 $382,884 $402,475
$‐
$50,000
$100,000
$150,000
$200,000
$250,000
$300,000
$350,000
$400,000
$450,000
Page 34

BUSINESS LINE: EXTERNAL RELATIONS
Program Name Business Line_ 2015 Actual 2016 Budget 2016 Recast
2016 Forecast
(6 + 6) * 2017 Budget
Variance
Fav/(Unfav)
2017-B vs 2016-F
% Variance
Fav/Unfav)
2017-B vs 2016-F
CORPORATE OUTREACH EXTERNAL RELATIONSDirect Expenses (84,949) (133,055) (116,555) (113,605) (139,050) (25,445) -22.4%
Direct Contribution (84,949) (133,055) (116,555) (113,605) (139,050) (25,445) -22.4%
ACADEMIC, PROFESSIONAL & DIVERSITY EXTERNAL RELATIONSDirect Income 36,473 48,930 48,930 47,100 56,360 9,260 19.7%
Direct Expenses (55,577) (65,940) (65,940) (65,755) (89,230) (23,475) -35.7%
Direct Contribution (19,104) (17,010) (17,010) (18,655) (32,870) (14,215) -76.2%
GOVERNMENT RELATIONS EXTERNAL RELATIONSDirect Expenses (35,496) (42,872) (50,048) (44,614) (67,345) (22,731) -51.0%
Direct Contribution (35,496) (42,872) (50,048) (44,614) (67,345) (22,731) -51.0%
CORPORATE MARKETING & PUBLIC RELATIONS EXTERNAL RELATIONSDirect Expenses (50,326) (77,950) (67,650) (65,150) (71,850) (6,700) -10.3%
Direct Contribution (50,326) (77,950) (67,650) (65,150) (71,850) (6,700) -10.3%
VENDOR RELATIONS EXTERNAL RELATIONSDirect Income 240,376 325,500 279,510 286,150 342,000 55,850 19.5%
Direct Expenses (47,010) (63,100) (57,030) (54,160) (3,100) 51,060 94.3%
Direct Contribution 193,366 262,400 222,480 231,990 338,900 106,910 46.1%
INDUSTRY AWARDS EXTERNAL RELATIONSDirect Income - - - - #DIV/0!
Direct Expenses (38,787) (37,500) (37,500) (39,600) (31,900) 7,700 19.4%
Direct Contribution (38,787) (37,500) (37,500) (39,600) (31,900) 7,700 19.4%
Net Income/(Loss) (35,296) (45,987) (66,283) (49,634) (4,115) 45,519 91.7%
* 6 months of actual results + 6 months of projected results
Page 35

Business Line: National EventsProduction and delivery of Global Summit in October plus four U.S. regional meetings
Programs within this business line:
Global Summit ‐ a retooling of the fall conference with an emphasis on broadening the relevance of professional education and networking opportunities to IREM's global members and partners; engaging practitioners at all levels with purposeful focus on asset managers and young professionals will continue; IREM governance meetings will remain an integral component
Regional Meetings ‐ new in 2017, the regional meetings will focus on strengthening the IREM chapter network by delivering programming focused on developing chapter leaders, the sharing of best practices, and the IREM strategic plan and themes; participants will also have the opportunity to attend regional industry events, conveniently co‐located with the chapter program
Page 36

Business Line: National Events2017 Highlights The Fall Leadership Conference will become the
Global Summit in 2017, taking place in IREM’s hometown of Chicago with attendance expected to top 700
The kick‐off of four regional meetings set for New York City, Minneapolis, Atlanta, and Orange County – all of which will combine chapter leadership, networking , and industry‐related educational programming
2012 2013 2014 2015 2016F 2017BDirect Income $430,118 $417,169 $425,795 $439,514 $474,250 $485,560
Direct Expense $556,111 $562,825 $596,981 $576,782 $642,193 $697,125
$‐
$100,000
$200,000
$300,000
$400,000
$500,000
$600,000
$700,000
$800,000
Page 37

BUSINESS LINE: NATIONAL EVENTS
Program Name Business Line_ 2015 Actual 2016 Budget 2016 Recast
2016 Forecast
(6 + 6) * 2017 Budget
Variance
Fav/(Unfav)
2017-B vs 2016-F
% Variance
Fav/Unfav)
2017-B vs 2016-F
LEADERSHIP & LEGISLATIVE SUMMIT (LLS) NATIONAL EVENTSDirect Income 155,605 160,150 159,570 150,535 (150,535) -100.0%
Direct Expenses (217,890) (235,480) (237,780) (220,839) 220,839 100.0%
Direct Contribution (62,285) (75,330) (78,210) (70,304) 70,304 100.0%
IREM GLOBAL SUMMIT NATIONAL EVENTSDirect Income 283,909 322,530 322,465 323,715 355,610 31,895 9.9%
Direct Expenses (358,892) (402,275) (421,140) (421,354) (491,192) (69,838) -16.6%
Direct Contribution (74,983) (79,745) (98,675) (97,639) (135,582) (37,943) -38.9%
REGIONAL MEETINGS NATIONAL EVENTSDirect Income - - - 129,950 129,950 #DIV/0!
Direct Expenses - - - (205,933) (205,933) #DIV/0!
Direct Contribution - - - (75,983) (75,983) #DIV/0!
Net Income/(Loss) (137,268) (155,075) (176,885) (167,943) (211,565) (43,622) -26.0%
* 6 months of actual results + 6 months of projected results
Page 38

Business Line: International Programs and activities related to international outreach, including dues, membership admissions and services, chapter services, international outreach and travel, international education, with international defined as all activity outside of the United States
Programs in this business line:
International Dues ‐ represents dues for all categories of membership outside the US; expense is service fee paid to international partners/chapters for collecting dues on IREM's behalf
International Membership ‐ comprises all membership and certification exam activity, chapter and member services, travel outside the US by staff and leaders and Canadian RVP, IREM participation in various international standards coalitions, and promotion of IREM on the global platform per the 2015‐16 strategic plan
International Education ‐ delivery of IREM education outside the US, reflecting revenues from course royalties, licensing fees, and reimbursable costs when US instructors teach internationally, and expenses attributable primarily to instructor costs and course translation
Page 39

Business Line: International 2017 Highlights Slight upward trend in overall revenues from
international programs, majority of which come from two countries – Canada and Japan
Continued growth in overall number of CPMs and new CPM approvals, offset by lower retention rates than in U.S., budgeted to end the year with 1,849 members, or 8.7% of total IREM membership
Incorporates global outreach and branding through event participation (MIPIM, ProEstate, ExpoReal) and coalitions (IPMS, IES)
Classroom education to be offered in Brazil, Bulgaria, Canada, China, India, Japan, Kazakhstan, Korea, Russia, Ukraine, and via online courses to English‐speaking students in other countries
Complies with this business line’s policy of revenues covering all direct operating plus dedicated staff expenses
2012 2013 2014 2015 2016F 2017BDirect Income $617,784 $583,514 $684,466 $620,840 $691,461 $772,305
Direct Expense $379,603 $296,212 $342,368 $272,537 $336,105 $400,042
$‐
$100,000
$200,000
$300,000
$400,000
$500,000
$600,000
$700,000
$800,000
$900,000
Page 40

BUSINESS LINE: INTERNATIONAL
Program Name Business Line_ 2015 Actual 2016 Budget 2016 Recast
2016 Forecast
(6 + 6) * 2017 Budget
Variance
Fav/(Unfav)
2017-B vs 2016-F
% Variance
Fav/Unfav)
2017-B vs 2016-F
INTERNATIONAL DUES INTERNATIONALDirect Income 329,556 326,095 332,000 332,000 365,575 33,575 10.1%
Direct Expenses (24,201) (23,148) (25,000) (25,000) (24,743) 257 1.0%
Direct Contribution 305,355 302,947 307,000 307,000 340,832 33,832 11.0%
INTERNATIONAL MEMBERSHIP INTERNATIONALDirect Income 76,953 118,465 100,420 97,420 99,265 1,845 1.9%
Direct Expenses (163,003) (237,600) (216,600) (213,050) (245,690) (32,640) -15.3%
Direct Contribution (86,050) (119,135) (116,180) (115,630) (146,425) (30,795) -26.6%
INTERNATIONAL EDUCATION INTERNATIONALDirect Income 214,331 320,047 304,417 262,041 307,465 45,424 17.3%
Direct Expenses (85,333) (151,635) (130,200) (98,055) (129,609) (31,554) -32.2%
Direct Contribution 128,998 168,412 174,217 163,986 177,856 13,870 8.5%
Net Income/(Loss) 348,303 352,224 365,037 355,356 372,263 16,907 4.8%
* 6 months of actual results + 6 months of projected results
Page 41

Business Line: Business Development for Members Programs and initiatives to promote the expertise of members and increase their visibility and business opportunities, including credential awareness, AMO services, IREM Jobs program, and sustainability program
Programs in this business line:
Credential Awareness – activities to promote the expertise of and hiring of credentialed members; also includes image study conducted every 3‐5 years to measure awareness of credentials among owners, investors, and employers who hire members and member firms, last conducted in 2015
Jobs Program – online jobs board, housed on irem.org in Career Center and powered by Boxwood
AMO Services – promotion of AMO‐accredited companies to client market; communication, services, and networking targeted to executive CPMs with AMO firms
Sustainability – IREM Certified Sustainable Property certification marketing, sales, and administration; other sustainability education and related activities and outreach supported by Yardi energy efficiency grant, including online courses, conference sessions, chapter workshops, webinars publications, and attendance at Greenbuild and similar sustainability‐related events
Page 42

Business Line: Business Development for Members 2017 Highlights A major organization‐wide branding initiative will be
undertaken in 2017, funded largely through the credential awareness budget and launched in October at the IREM Global Summit
Chapter co‐op advertising program is being phased out due to drop‐off in participation; to be replaced by more regional advertising
Enhancement of AMO services, including more robust “why hire an AMO” promotional efforts, expanded outreach to customers of AMO firms, and special programming for Executive CPMs at Global Summit
Anticipated Yardi sustainability grant will fund development of sustainability education and participation in USGBC and GRESB
IREM Certified Sustainability Property program aiming for 110 new certified properties in 2017
2012 2013 2014 2015 2016F 2017BDirect Income $50,168 $57,498 $286,782 $284,161 $294,100 $325,200
Direct Expense $174,782 $195,985 $249,135 $260,602 $258,750 $277,200
$‐
$50,000
$100,000
$150,000
$200,000
$250,000
$300,000
$350,000
Page 43

BUSINESS LINE: BUSINESS DEVELOPMENT FOR MEMBERS
Program Name Business Line_ 2015 Actual 2016 Budget 2016 Recast
2016 Forecast
(6 + 6) * 2017 Budget
Variance
Fav/(Unfav)
2017-B vs 2016-F
% Variance
Fav/Unfav)
2017-B vs 2016-F
CREDENTIAL AWARENESS BUSINESS DEVELOPMENT FOR MEMBERSDirect Income 1,000 7,000 2,000 2,000 - (2,000) -100.0%
Direct Expenses (197,531) (181,500) (173,000) (173,000) (177,000) (4,000) -2.3%
Direct Contribution (196,531) (174,500) (171,000) (171,000) (177,000) (6,000) -3.5%
JOBS PROGRAM BUSINESS DEVELOPMENT FOR MEMBERSDirect Income 79,085 76,000 78,000 77,000 78,000 1,000 1.3%
Direct Expenses - (1,700) (1,700) (1,700) (1,150) 550 32.4%
Direct Contribution 79,085 74,300 76,300 75,300 76,850 1,550 2.1%
AMO SERVICES BUSINESS DEVELOPMENT FOR MEMBERSDirect Income 576 - - 100 (100) -100.0%
Direct Expenses - (19,000) (22,000) (22,000) (31,500) (9,500) -43.2%
Direct Contribution 576 (19,000) (22,000) (21,900) (31,500) (9,600) -43.8%
SUSTAINABILITY INTIATIVES BUSINESS DEVELOPMENT FOR MEMBERSDirect Income 203,500 250,000 230,000 215,000 247,200 32,200 15.0%
Direct Expenses (63,072) (72,900) (72,900) (62,050) (67,550) (5,500) -8.9%
Direct Contribution 140,428 177,100 157,100 152,950 179,650 26,700 17.5%
Net Income/(Loss) 23,559 57,900 40,400 35,350 48,000 12,650 35.8%
* 6 months of actual results + 6 months of projected results
Page 44

Business Line: Corporate OperationsAdministrative costs of running the organization, including all salaries and benefits
Programs in this business line:
Finance and Accounting – all accounting activity including payroll, state and federal tax returns, annual audit, bank reconciliations, bank and credit card fees, monthly financial statements, accounts payable and accounts receivable transactions, inventory and financial controls; also incudes service fees for processing of chapter dues for chapters that elect this service
Fulfillment – provides for the fulfillment of orders from off‐site warehouse, including postage and handling
General Office – provides a working environment and other services for staff, including office space, walk‐up copiers, and mail room functions; IREM occupies 15,331 sq. ft. of office space at a current rate of $28.33/foot plus CAM and real estate taxes
Risk Management – provides comprehensive insurance coverage for the Institute and general liability insurance coverage for the chapters
Information Technology – provides all aspects of IT support including desktop, server, email, website, AMS, LMS, CMS, internet, and phone system; maintains all licenses and support contracts for all operating systems
Human Resources – ongoing activities that support staff recruitment, talent selection, professional growth, and recognition and support IREM’s goal of promoting a strong organizational culture by selecting the best talent, minimizing turnover, and increasing productivity
Executive Office – covers the costs associated with the operation of the executive office and CEO activity
Legal – fees for general legal work not associated with a specific program
Trademarks – involves renewal and policing of existing marks, pursuing infringement cases, and applying for new registrations as may be required
Contingency – by policy, approximately 1% of operating expenses are held in reserve for contingent expenses that may occur during the year
Foundation – represents IREM's management of the IREM Foundation under a third‐party administrative services agreement
Innovation Fund – new strategic development/incubator fund established by the executive committee to support worthwhile "venture capital" opportunities that may evolve as the year unfolds but cannot be predicted when the budget is prepared.
Miscellaneous – miscellaneous income attributed to stale‐dated checks and earning of American Express points
Salaries and Wages – all compensation including salaries and salary adjustments, salary erosion, and earned bonuses for both full‐time and part‐time/temporary staff
Benefits – comprises all employee benefits, including social security, medical insurance, pension, and related benefits
Page 45

Business Line: Corporate Operations2017 Highlights Corporate operations represents two‐
thirds of overall operating expense budget, the majority comprising salary and benefits
Total FTEs in 2017 are budgeted at 67, with salaries and benefits budget representing 51% of total operating expenses
HQ collected dues on behalf of 49 chapters in 2016; this number is expected to increase slightly in 2017
2012 2013 2014 2015 2016F 2017BDirect Income $260,391 $242,110 $67,899 $84,158 $96,685 $117,530
Direct Expense $7,351,457 $7,296,220 $7,569,051 $7,757,135 $8,096,967 $8,333,934
$‐
$1,000,000
$2,000,000
$3,000,000
$4,000,000
$5,000,000
$6,000,000
$7,000,000
$8,000,000
$9,000,000
Page 46

BUSINESS LINE: CORPORATE OPERATIONS
Program Name Business Line_ 2015 Actual 2016 Budget 2016 Recast
2016 Forecast
(6 + 6) * 2017 Budget
Variance
Fav/(Unfav)
2017-B vs 2016-F
% Variance
Fav/Unfav)
2017-B vs 2016-F
FINANCE & ACCOUNTING CORPORATE OPERATIONSDirect Income 16,547 40,000 26,000 24,919 26,000 1,081 4.3%
Direct Expenses (284,548) (299,692) (282,430) (285,717) (290,750) (5,033) -1.8%
Direct Contribution (268,001) (259,692) (256,430) (260,798) (264,750) (3,952) -1.5%
FULFILLMENT CORPORATE OPERATIONSDirect Expenses (10,332) (12,292) (10,570) (10,570) (11,340) (770) -7.3%
Direct Contribution (10,332) (12,292) (10,570) (10,570) (11,340) (770) -7.3%
GENERAL OFFICE CORPORATE OPERATIONSDirect Expenses (627,702) (628,057) (626,386) (627,583) (628,480) (897) -0.1%
Direct Contribution (627,702) (628,057) (626,386) (627,583) (628,480) (897) -0.1%
RISK MANAGEMENT CORPORATE OPERATIONSDirect Expenses (103,924) (105,759) (93,216) (94,922) (98,967) (4,045) -4.3%
Direct Contribution (103,924) (105,759) (93,216) (94,922) (98,967) (4,045) -4.3%
INFORMATION TECHNOLOGY CORPORATE OPERATIONSDirect Expenses (428,768) (435,500) (441,500) (452,098) (565,750) (113,652) -25.1%
Direct Contribution (428,768) (435,500) (441,500) (452,098) (565,750) (113,652) -25.1%
HUMAN RESOURCES CORPORATE OPERATIONSDirect Expenses (76,335) (81,370) (78,370) (77,625) (82,160) (4,535) -5.8%
Direct Contribution (76,335) (81,370) (78,370) (77,625) (82,160) (4,535) -5.8%
EXECUTIVE OFFICE CORPORATE OPERATIONSDirect Expenses (17,424) (20,000) (18,600) (16,347) (16,905) (558) -3.4%
Direct Contribution (17,424) (20,000) (18,600) (16,347) (16,905) (558) -3.4%
LEGAL CORPORATE OPERATIONSDirect Expenses (364) (3,000) (2,000) (2,000) (1,000) 1,000 50.0%
Direct Contribution (364) (3,000) (2,000) (2,000) (1,000) 1,000 50.0%
TRADEMARKS CORPORATE OPERATIONSDirect Expenses (4,081) (13,100) (14,444) (10,414) (13,500) (3,086) -29.6%
Direct Contribution (4,081) (13,100) (14,444) (10,414) (13,500) (3,086) -29.6%
CONTINGENCY CORPORATE OPERATIONSDirect Expenses - (125,000) (125,000) (125,000) (125,000) - 0.0%
Direct Contribution - (125,000) (125,000) (125,000) (125,000) - 0.0%
FOUNDATION CORPORATE OPERATIONSDirect Income 63,654 65,564 65,564 65,564 67,530 1,966 3.0%
Direct Contribution 63,654 65,564 65,564 65,564 67,530 1,966 3.0%
INNOVATION FUND CORPORATE OPERATIONSDirect Expenses (85) (25,000) (25,000) (25,000) (25,000) - 0.0%
Direct Contribution (85) (25,000) (25,000) (25,000) (25,000) - 0.0%
MISCELLANEOUS CORPORATE OPERATIONSDirect Income 3,957 4,000 4,000 6,202 24,000 17,798 287.0%
Direct Contribution 3,957 4,000 4,000 6,202 24,000 17,798 287.0%
SALARIES & WAGES CORPORATE OPERATIONSDirect Expenses (4,608,807) (4,623,341) (4,611,351) (4,665,006) (4,678,677) (13,671) -0.3%
Direct Contribution (4,608,807) (4,623,341) (4,611,351) (4,665,006) (4,678,677) (13,671) -0.3%
BENEFITS CORPORATE OPERATIONSDirect Expenses (1,594,765) (1,706,473) (1,699,091) (1,704,685) (1,796,406) (91,721) -5.4%
Direct Contribution (1,594,765) (1,706,473) (1,699,091) (1,704,685) (1,796,406) (91,721) -5.4%
Net Income/(Loss) (7,672,977) (7,969,020) (7,932,394) (8,000,282) (8,216,404) (216,122) -2.7%
* 6 months of actual results + 6 months of projected results
Page 47
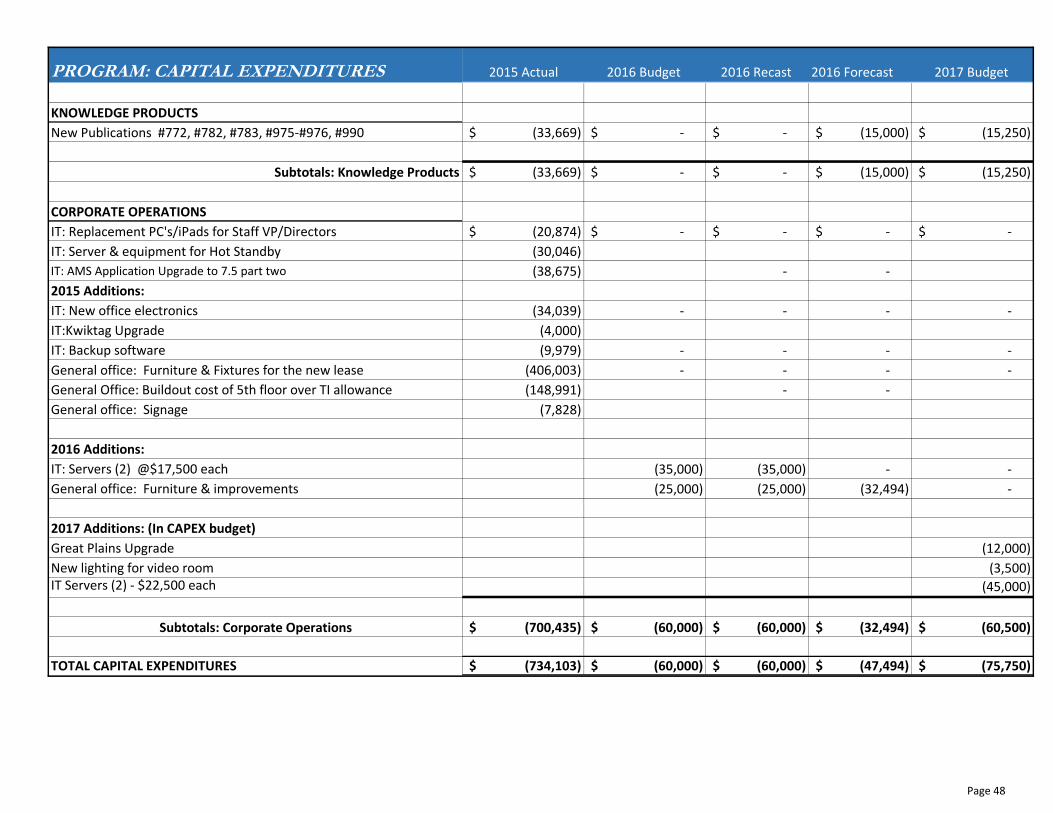
PROGRAM: CAPITAL EXPENDITURES 2015 Actual 2016 Budget 2016 Recast 2016 Forecast 2017 Budget
KNOWLEDGE PRODUCTS
New Publications #772, #782, #783, #975-#976, #990 (33,669)$ -$ -$ (15,000)$ (15,250)$
Subtotals: Knowledge Products (33,669)$ -$ -$ (15,000)$ (15,250)$
CORPORATE OPERATIONS
IT: Replacement PC's/iPads for Staff VP/Directors (20,874)$ -$ -$ -$ -$
IT: Server & equipment for Hot Standby (30,046)
IT: AMS Application Upgrade to 7.5 part two (38,675) - -
2015 Additions:
IT: New office electronics (34,039) - - - -
IT:Kwiktag Upgrade (4,000)
IT: Backup software (9,979) - - - -
General office: Furniture & Fixtures for the new lease (406,003) - - - -
General Office: Buildout cost of 5th floor over TI allowance (148,991) - -
General office: Signage (7,828)
2016 Additions:
IT: Servers (2) @$17,500 each (35,000) (35,000) - -
General office: Furniture & improvements (25,000) (25,000) (32,494) -
2017 Additions: (In CAPEX budget)
Great Plains Upgrade (12,000)
New lighting for video room (3,500) IT Servers (2) - $22,500 each (45,000)
Subtotals: Corporate Operations (700,435)$ (60,000)$ (60,000)$ (32,494)$ (60,500)$
TOTAL CAPITAL EXPENDITURES (734,103)$ (60,000)$ (60,000)$ (47,494)$ (75,750)$
Page 48

Depreciation & Amortization:
Historic Cost Prior A/D 2015 2016 2017 2018 2019 2020 2021 2022 2023 2024 2025 Total Depr
Amortization - Rent
Buildout 9/1/2015 10 yr 148,991.28$ 1372 4,966.38$ 14,899.13$ 14,899.13$ 14,899.13$ 14,899.13$ 14,899.13$ 14,899.13$ 14,899.13$ 14,899.13$ 14,899.13$ 9,932.73$ 148,991.28$
Furniture - Lease 8/15/2015 - 10 yr 406,002.96 Class 11 (1360) 20,300.15 40,600.30 40,600.30 40,600.30 40,600.30 40,600.30 40,600.30 40,600.30 40,600.30 40,600.30 20,300.11 406,002.96
-
Amortization - Rent 554,994.24$ -$ 25,266.53$ 55,499.43$ 55,499.43$ 55,499.43$ 55,499.43$ 55,499.43$ 55,499.43$ 55,499.43$ 55,499.43$ 55,499.43$ 30,232.84$ 554,994.24$
Depreciation & Amortization:
AMS System 1/1/2011 1,043,839.65$ 1185 695,893.08$ 173,973.28$ 173,973.29$ -$ -$ -$ -$ -$ -$ -$ -$ -$ 1,043,839.65$
AMS - Membership upgrade 1/1/2012 25,495.00 1185-2 15,297.00 5,099.00 5,099.00 - - - - - - - - - 25,495.00
AMS upgrade to 7.51 4/1/2015 3 yr 225,458.12 1340 39,646.33 56,364.53 56,364.53 56,364.53 16,718.20 - - - - - - 225,458.12
Great Plains 1/1/2011 105,654.76 1186 70,436.55 17,609.13 17,609.08 - - - - - - - - - 105,654.76
Quik Tag Document sytem 2/1/2011 21,087.43 1156-1 21,087.43 - - 21,087.43
Quik Tag upgrade 2015 8/15/15 4,000.00 1156-2 555.56 1,333.33 1,333.33 777.78 4,000.00
KMX integration w/ AMS 5/1/2012 37,200.00 1187-1 20,918.15 7,848.55 7,848.55 584.75 - - - - - - - - 37,200.00
I/E Upgrade 10/2010 837,733.90 1136-1139, 1269 707,370.52 129,333.79 1,029.59 - - - - - - - - - 837,733.90
Website 06/2013 379,421.15 1265 Class 10 189,710.58 126,473.72 63,236.85 - - - - - - - - - 379,421.15
Website Enhancements 11/2014 43,307.79 1265-3 Class 10 2,405.98 14,435.93 14,435.93 12,029.95 - - - - - - - - 43,307.79
Office & Other equipment 325,602.95 Class 1 253,000.70 15,505.38 19,889.24 14,568.43 11,319.59 6,930.67 4,388.94 - - - - - 325,602.95
Computer Equipment (2012 onwards) 202,515.18 Class 9 81,854.98 55,899.29 38,524.64 21,655.34 4,580.93 - - - - - - - 202,515.18
Disposed assets -2015 20,487.34 17,305.89 3,181.45 20,487.34
Disposed assets -2015 (20,487.34) (20,487.34) (20,487.34)
2016 Actual Purchases:
2016 Computer Equipment purch 22,506.88 6,543.15 7,502.28 7,502.28 959.17 22,506.88
2016 Furniture 3,986.88 9 yrs 369.18 443.04 443.04 443.04 443.04 443.04 443.04 443.04 443.04 73.38 3,986.88
2016 Budgeted/forecasted adds:
IT: Servers (2) @$17,500 each - 3 yrs - July 1 - - - - -
General office: Replacement furniture & improvements 6,000.00 3 yrs - July 1 1,000.00 2,000.00 2,000.00 1,000.00 6,000.00
CAPEX - 2016 32,493.76$ (27,506.24)$
difference over recast/budget
2017 adds budgeted:
Great Plains upgrade 12,000.00 5 year Feb 1 - 2,200.00 2,400.00 2,400.00 2,400.00 2,400.00 200.00 12,000.00
New lighting for video room 3,500.00 3 yrs - July 1 - 583.33 1,166.67 1,166.67 583.33 3,500.00
IT: Servers (2) @$22,500 each 45,000.00 3 yrs - July 1 7,500.00 15,000.00 15,000.00 7,500.00 45,000.00
- 3 yrs - July 1 - - - - -
CAPEX - 2017 60,500.00$
Depreciation & Amortization 3,344,309.69$ 2,054,793.52$ 589,561.41$ 407,256.36$ 126,764.98$ 101,554.82$ 44,617.75$ 15,315.31$ 2,843.04$ 643.04$ 443.04$ 443.04$ 73.38$ 3,344,309.69$
Combined Depreciation/Rent 3,899,303.93$ -$ 2,054,793.52$ 614,827.94$ 462,755.79$ 182,264.41$ 157,054.25$ 100,117.18$ 70,814.74$ 58,342.47$ 56,142.47$ 55,942.47$ 55,942.47$ 30,306.22$ 3,899,303.93$
actual forecast
Page 49


