

Table of Contents | 2
Foreword
Welcome to The Lines Company’s 2018 Asset Management Plan (AMP).
This document’s new format continues the company’s journey of change. It includes the AMP itself and our planning processes, where we have started aligning more closely with international standards for asset management practice. Going forward this focuses us firmly on risk ‐ to our assets, and to our customers who rely on them.
Through reducing risk we aim to continue improving efficiency and managing our service to customers in a safe, reliable and cost‐effective way, and build on the high‐quality technical information from previous similar plans.
Much of our attention over the 10‐year period of the AMP will be on investing in our assets to support the King Country and Ruapehu regions’ current and future economic development. Maintaining and improving a secure, reliable supply of electricity from our key substations in a cost‐ effective way across the life of those assets will be a fundamental focus. In combination with a comprehensive review of our line renewal programme, we aim to reduce the risk of system outages and to minimise consequences to customers should these occur.
The safety of our people, our community and our assets is paramount to us, thus it is another key feature of this plan. We are investing specifically to reduce safety risks on our assets, their interaction with the community we serve, and in the way we work as a company to maintain them.
We understand these changes also reflect an increase in expenditure from previous plans and that this may impact consumers. There is further work for us to refine our project planning to ensure our expenditure provides the best possible balance of safety, service and cost outcomes. That too will be a focus in the coming year.
In developing the 2018 AMP our goal has been to provide a 10‐year roadmap for our assets in a more informative and easily read way. We want to encourage our stakeholders – our customers, our business partners, and the people living in our community ‐ to engage with us on the way we manage the custodianship of our assets and on the projects that stem from the guiding principles outlined in this document.
With your support and feedback our business can continue to develop and succeed, so I invite you to comment by emailing [email protected].
The Lines Company
Sean Horgan Chief Executive

Table of Contents | 3
Contents Foreword ......................................................................................................................................................................... 2
Document Structure ........................................................................................................................................................ 6
1. Introduction .......................................................................................................................................................... 7
1.1 Purpose ....................................................................................................................................................... 7
1.2 Overview ..................................................................................................................................................... 7
1.3 Business Context ....................................................................................................................................... 10
1.4 Our Asset Management Plan .................................................................................................................... 13
1.5 Key Outcomes ........................................................................................................................................... 17
1.6 Development Initiatives ............................................................................................................................ 20
2. Background ......................................................................................................................................................... 23
2.1 Overview of The Lines Company .............................................................................................................. 23
2.2 Business Objectives .................................................................................................................................. 26
2.3 Our Region ................................................................................................................................................ 27
3. Network Assets ................................................................................................................................................... 36
3.1 Asset Summary ......................................................................................................................................... 36
3.2 Points of Supply ........................................................................................................................................ 36
3.3 Embedded Generators .............................................................................................................................. 38
3.4 Zone Substations ...................................................................................................................................... 39
3.5 Zone Substation Power Transformers ...................................................................................................... 41
3.6 Sub‐transmission 33kV Switchgear ........................................................................................................... 41
3.7 Support Structures: Poles ......................................................................................................................... 41
3.8 Support Structures: Crossarms ................................................................................................................. 42
3.9 Overhead Line Conductor ......................................................................................................................... 42
3.10 Cables ........................................................................................................................................................ 43
3.11 Distribution Transformers ........................................................................................................................ 43
3.12 Distribution Switches ................................................................................................................................ 43
3.13 Secondary Assets ...................................................................................................................................... 44
4. Approach to Asset Management ........................................................................................................................ 47
4.1 Asset Management System ...................................................................................................................... 47
4.2 Asset Management Policy ........................................................................................................................ 49
4.3 Asset Management Objectives ................................................................................................................. 50
4.4 Asset Management Accountabilities ........................................................................................................ 51
4.5 Risk Management ..................................................................................................................................... 52
Table of Contents | 4
4.6 Life Cycle Management ............................................................................................................................ 53
4.7 Information Systems ................................................................................................................................. 59
4.8 Business Continuity Planning .................................................................................................................... 60
5. Capital Project Planning and Delivery ................................................................................................................. 63
5.1 Capital Project Portfolio and Investment Drivers ..................................................................................... 63
5.2 Asset Renewals ......................................................................................................................................... 64
5.3 Network Development ............................................................................................................................. 79
5.4 Customer Required Projects ..................................................................................................................... 85
5.5 Summary of Network Capex ..................................................................................................................... 87
5.6 Non‐Network Asset Capex ........................................................................................................................ 87
5.7 Capital Expenditure Summary .................................................................................................................. 89
5.8 New Technologies ..................................................................................................................................... 89
5.9 Capability to Deliver ................................................................................................................................. 90
5.10 Summary of Key Assumptions .................................................................................................................. 90
6. Operations and Maintenance ............................................................................................................................. 93
6.1 Operations and Maintenance Objectives ................................................................................................. 93
6.2 Operations and Maintenance Planning .................................................................................................... 93
6.3 Vegetation Management .......................................................................................................................... 99
6.4 Business Support, System Operation and Network Support .................................................................. 100
6.5 Total Forecasted Operational and Maintenance Expenditure ............................................................... 100
7. Summary of Expenditure and Forecasts ........................................................................................................... 103
7.1 Capital Expenditure ................................................................................................................................ 103
7.2 Operational Expenditure ........................................................................................................................ 105
8. Asset Management Performance ..................................................................................................................... 108
8.1 Safety ...................................................................................................................................................... 108
8.2 Customer Experience .............................................................................................................................. 109
8.3 Cost Efficiency ......................................................................................................................................... 111
8.4 Asset performance ................................................................................................................................. 111
9. Continual Improvement .................................................................................................................................... 114
9.1 Assessment of Asset Management Performance ................................................................................... 114
Appendix A: Glossary .................................................................................................................................................. 119
Appendix B: Information Disclosure Compliance ........................................................................................................ 121
Appendix C: Information Disclosure Asset Management Plan Schedules .................................................................. 130
Appendix D: Director Certification .............................................................................................................................. 151

Introduction | 5
Introduction

Introduction | 6
Document Structure Plan Summary
Introduces our business and summarises our plan
Introducing Our Business And Our Assets
Introduces The Lines Company, our customers and our network
Describes the assets we own and operate
How We Manage Our Assets
Sets out our approach to asset management and how we manage risks
Our 10‐Year Plan
Sets out our plans for developing the network
Sets out how we maintain our network assets and our supporting operations
Summarises our forecast capital and operational expenditure for the next 10 years
How We Monitor With Industry Regulators
Describes how well our business and assets perform against our strategic objectives
Describes how we intend to improve our performance over time
How We Comply With Industry Regulations
Appendix A Provides a glossary of key terms used in this document
Appendix B References the compliance requirements in our AMP
Appendix C Provides summary schedules required by the Commerce Commission
Appendix D Provides the Directors Certification for this AMP

Introduction | 7
1. Introduction Chapter Overview
This chapter introduces our 2018 Asset Management Plan (AMP). It outlines its purpose and objectives, for whom it is written and how it is structured. It also provides a summary of the AMP including the key themes and initiatives that underpin our ten‐year planning period, as we see them at the current time.
1.1 Purpose
This Asset Management Plan (AMP) describes our electricity network, our assets and our investment requirements. It also provides an overview of our asset management practices, our planning and our key risks and issues as we perceive them.
The purpose of this AMP is to communicate with our stakeholders by:
Providing readers with an understanding of the nature and characteristics of our network region.
Describing the assets we own and operate.
Detailing the investment requirements we foresee over the AMP period, so that we can continue to operate our network safely and reliably, and meet our strategic objective, which is to deliver shareholder value through customer centricity, productivity and efficiency, risk management and growth and diversity.
Outlining our asset management objectives, which are to develop proficiency in leadership and enablement, asset planning, business process and continual improvement.
Detailing our asset management processes which have been put in place to meet those objectives
Describing the relationship between our AMP and our strategic plan, and its importance of as a key planning document.
1.2 Overview
The Lines Company 2018 Asset Management Plan has undergone a significant refresh from previous iterations. This version of the AMP is intended to take the significant, high‐quality technical information contained within earlier versions and demonstrate how that aligns with TLC’s strategic direction and objectives.
In doing so we have sought to provide information to our stakeholders about how we are managing the assets they have entrusted to us. Specifically we aim to:
Provide readers with a broad understanding of the characteristics of our network, and the assets we own and operate.
Demonstrate the investment requirements we foresee over the AMP period to enable us to progress in accordance with our business objectives.
Convey the asset management and planning processes which have been established to manage our significant asset investments and to maintain our stakeholder interests.
Through this AMP document, we have aimed to explain technical issues in a way that is meaningful to all our stakeholders. Consequently this AMP document is a concise overview of our broader asset management processes and outputs, and is deliberately presented in the form of a high‐level summary of deeper technical information.
We aim to provide enough detail to explain how our plans and decisions arise and are implemented in a way that makes it easy to read and understand.
This plan covers a ten‐year period from 1 April 2018 to 31 March 2028 (financial years 2019 to 2028 – the planning period). As with any long‐term plan, the details tend to be more accurate in the earlier years as it is easier to predict the near‐term state of our assets and required actions, plans and expenditure. This Asset Management Plan was approved by The Lines Company Limited Board of Directors on 15 March 2018.
Introduction | 8
1.2.1 A Change in Approach
TLC has undergone significant change during 2017, with a change in Board composition and number of new appointments to the Senior Leadership Team, including a new Chief Executive. We have developed a new business strategy which positions TLC as a sustainable company for the future in the face of significant change across the Electricity Industry.
During 2017 we have taken the opportunity to have our safety performance and culture assessed by an independent third party. This assessment has highlighted a number of areas where our performance is good, however a number of opportunities for improvement have also been identified that will help us keep our people and the public safe. A two‐year Safety and Wellbeing roadmap has been developed to ensure these improvements are planned and executed efficiently.
We have also changed our approach to Asset Management, and have commenced work on aligning with the internationally recognised ISO 55000 standard for Asset Management. A three‐year plan for the improvement of our Asset Management processes and subsequent execution of works has been developed and will be used to identify and further drive improvements across the business. Consistency of business process and further efficiency in the way we operate is already evident in the early stages of implementation. Our continued focus on improving the way in which we manage our assets over the coming years will deliver further benefit and ensure that we operate a safe, reliable, cost‐effective network that meets our customers’ needs now and into the future.
1.2.2 Short‐term Horizon
The following issues provide both immediate and long term opportunity and challenge and have been key considerations as we have developed this AMP.
Asset Risk & Safety
Our focus on high impact safety related works continues to be prioritized to ensure that hazards that could cause injury to our people or the public are addressed.
In parallel we are continuing to develop our understanding of the condition of our assets, and translating that condition to an understanding of risk. This sees a progressive move away from purely age and condition related assessment to one that encompasses reliability of asset, asset class and the network as a whole, and a clear understanding of the impact that any failures may have on our customers. The core challenge with this is underlying data quality and the ability to translate raw data into asset information. Additional resource is being added to our Asset Management Team to ensure that rapid progress is made with this initiative.
Technology
Rapid advances are being made in technologies that have an impact on customer behavior in relation to electricity. These changes will affect the traditional approach to the supply of electricity to customers, and while the effects of them are not evident on our network yet, we are considering how they will impact our business and our assets in the future.
Key areas where technology is rapidly developing include:
Solar energy, which is approaching economic viability at a domestic level.
Battery storage, technically viable network and domestic level solutions are available but are some way from commercial viability. Development of battery technology is being driven by investment in Electric Vehicles (EVs).
Electric vehicle, uptake across New Zealand is increasing, providing an opportunity to support a more environmentally friendly transport fleet, countered by the requirement to carefully manage any network peaks that may occur in the future if there is a significant EV fleet within the region.
The Internet Of Things is seeing a higher level of customer engagement with respect to their energy consumption, which also provides the for a higher level of competition in the electricity sector from non‐traditional competitors (e.g. Apple, Amazon).
The advances in technology also allows us to consider alternatives to the traditional ‘poles and wires’ method of

Introduction | 9
providing highly available, reliable electricity to our customers with the use of batteries or solar products, some of which may be supplemented with diesel generation.
With these advances, and the possibility of viable alternatives to providing a reliable supply of electricity to our customers, comes the risk of our assets being displaced or stranded and as such consideration will need to be given to the accounting treatment of these assets. This may see the need to depreciate ‘at risk’ assets at a higher level than is currently the case.
Time of Use Pricing
During 2017 a complete review of our pricing methodology was undertaken by two independent consultants. Following extensive consultation with customers during that review, a change in pricing methodology was approved. In October 2018 our billing methodology will change from the historical demand‐based approach to a Time of Use system incorporating peak, off‐peak and shoulder periods with different kilowatt hour (kWh) rates. Time of Use has been implemented to provide a simple, easy and transparent pricing methodology for our customers. Modelling completed during the development of the Time of Use system and following customer trials suggests that there will not be a material impact to the network and consequently no change in spend (increase or reduction) has been forecast in relation to the transition to Time of Use. Customer use patterns will be closely monitored over the first 12‐18 months of implementation to verify the impact and if required investment plans will be adjusted accordingly.
Skilled Resource Availability
Over the past two decades the average age of skilled personnel within the Electricity Industry has climbed steadily. Over time there has been a decline in companies providing apprenticeships and this coupled with significant demand outside of New Zealand for these skills sees a tight labour market for the electricity industry as a whole for the foreseeable future. We expect that this combined with significant work programmes being undertaken by a number of other industry participants will place pressure on the delivery of work over the planning period. TLC has committed to an ongoing trainee line mechanic programme which seeks to employ four new trainees a year to bolster our capability.
Live Line Work and Weather Impacting Network Performance
As a result of international trends and recent changes in Health and Safety legislation, TLC has ceased all high voltage live line work pending completion of a formal review of the practice and alignment with the industry agreed approach. This coupled with changing weather patterns with a higher number of intense weather events is resulting in an overall increase in outages experienced by customers.
These trends are being taken into consideration as we look to manage our network into the future. This is subject to further analysis, however they could result in additional equipment or a higher standard of design being required to overcome the consequent reliability issues.
1.2.3 Key Assumptions in Developing this Plan
This plan has been developed with the following key assumptions:
TLC is able to attract and retain staff and has access to contractors via the wider market to fulfil its capital programme.
Conditions that affect our business (weather, business costs and operating environment) do not vary materially from where we understand them today.
A government review of the electricity industry does not materially change our revenues or cost base.
Access to capital and inflation remains stable.
The regulatory environment does not change significantly over the planning period.

Introduction | 10
1.3 Business Context
TLC recognises its role in providing a service that is essential to enable a high standard of living and economic prosperity in the King Country and Ruapehu regions. As a whole, the electrical industry in New Zealand is poised for significant change in the near future driven by factors such as the uptake of Distributed Energy Resources (e.g. photovoltaics, battery storage etc.), increasing consumer engagement, projected growth of electric vehicles and an ‘end‐to‐end’ Government review of the electricity sector– to list a few.
To prepare ourselves for these changes TLC has developed a robust strategy to deliver long‐term financial vitality and viability for our shareholder. The strategy provides the foundation and direction that TLC needs to best serve our customers now and into the future, and positions us to become a different business in the future whilst being cognisant of our responsibilities to our customers and community.
1.3.1 Our Business Structure
TLC has four business units that integrate to support the management of its distribution network. The relationship of the three non‐network business units to the core network and its asset management is set out in figure 1.2.1.
Figure 1.3.1: Integrated TLC Business
1.3.2 Network Overview
The Lines Company network provides an electricity distribution service to ~24,000 connected customers covering 13,700 km2. It is one of the largest network areas in New Zealand, but has a low population density and doesn’t supply a major urban centre. Consequently much of the network is committed to providing electrical distribution services to rural and sparsely populated areas.
Relative to other distributors in New Zealand, the TLC network is also electrically complex. It has one of the most diverse customer populations, a long circuit length, multiple and varied points of supply (from both Transpower and large generators), and significant electricity generation that is embedded within the network.

Introduction | 11
Figure 1.3.2: TLC Network Region
1.3.3 Network Growth
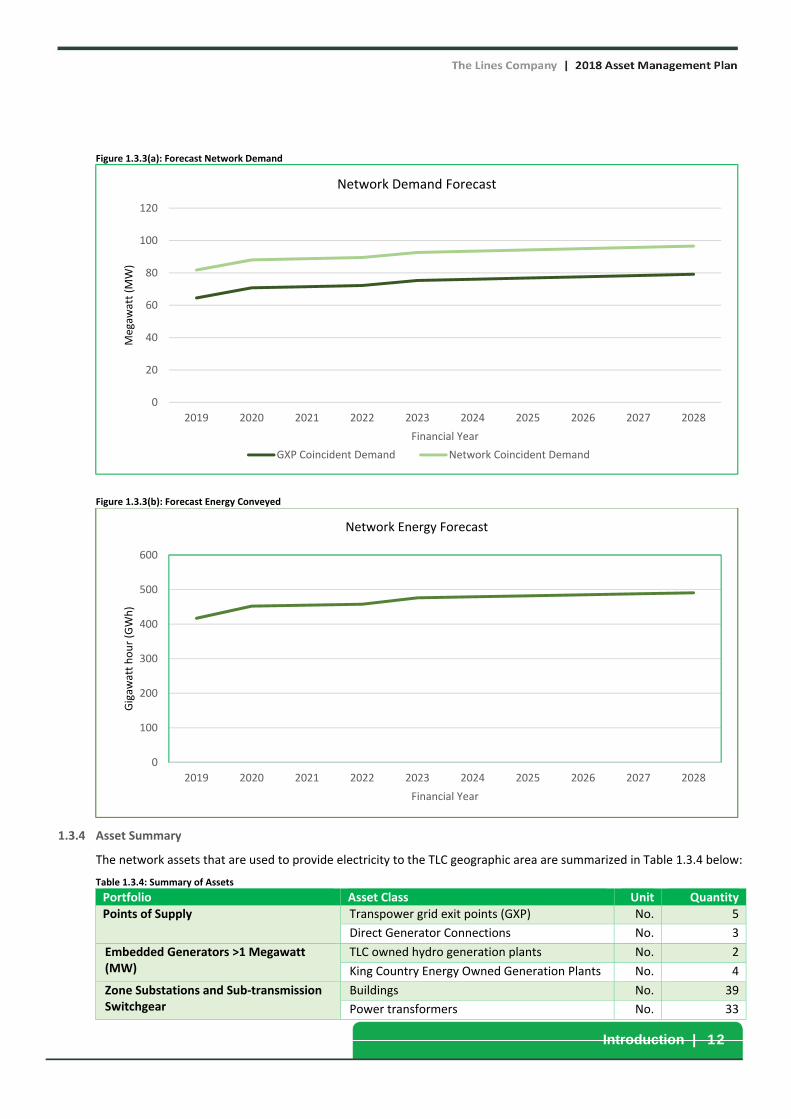
Electricity demand on the TLC network has continued to grow, driven primarily by farming, commercial and industrial business growth. There is a high likelihood of increases in the population of townships in the northern area of the network, further driving increases in load. In some cases the demand on our assets is predicted to meet a tipping point over the planning period, and investment in new assets is now required to continue to provide a reliable electricity supply. Projects related to growth include the upgrade of the Hangatiki 110 kV supply point (the installation of a new high voltage transformer), upgrade of the Ohakune supply point (increase in cable capacity) and line renewal projects in Otorohanga and Ohakune.
The planned dairy factory within the Otorohanga region and the proposed upgrade of the Waikeria1 prison are both key considerations over the planning period and will result in investment in our electricity network being made to support regional economic growth.
In total we expect both network coincident demand and network energy growth to increase by circa 25% over the planning period.
Figures 1.2.3(a) and (b) below show the forecast growth in terms of power and energy demand.
1 Waikeria Prison is outside of the TLC network area, however residential growth is expected in Otorohanga to support staffing requirements.
Waitomo
Benneydale
Ohakune
Piopio
Mokau
Te Kuiti
Otorohanga
National Park
Whakamaru
Turangi
Taumarunui
Mangakino
Mokai
Taharoa
Introduction | 12
Figure 1.3.3(a): Forecast Network Demand
Figure 1.3.3(b): Forecast Energy Conveyed
1.3.4 Asset Summary
The network assets that are used to provide electricity to the TLC geographic area are summarized in Table 1.3.4 below:
Table 1.3.4: Summary of Assets
Portfolio Asset Class Unit Quantity Points of Supply Transpower grid exit points (GXP) No. 5
Direct Generator Connections No. 3
Embedded Generators >1 Megawatt (MW)
TLC owned hydro generation plants No. 2
King Country Energy Owned Generation Plants No. 4
Zone Substations and Sub‐transmission Switchgear
Buildings No. 39
Power transformers No. 33
0
20
40
60
80
100
120
2019 2020 2021 2022 2023 2024 2025 2026 2027 2028
Megaw
att (M
W)
Financial Year
Network Demand Forecast
GXP Coincident Demand Network Coincident Demand
0
100
200
300
400
500
600
2019 2020 2021 2022 2023 2024 2025 2026 2027 2028
Gigaw
att hour (GWh)
Financial Year
Network Energy Forecast

Introduction | 13
Portfolio Asset Class Unit Quantity 33 kV switchgear No. 249
Support Structures Poles No. 34,548
Crossarms No. 51,156
Overhead Conductors Sub‐transmission km 502
Distribution km 3,085
Low voltage km 449
Cables Sub‐transmission km 11
Distribution km 128
Low voltage km 179
Low Voltage (LV) Pillar Boxes No. 4095
Distribution Transformers Ground mounted No. 503
Pole mounted No. 4,596
Distribution Switches Ground mounted switchgear No. 438
Pole mounted fuses No. 6,912
Pole mounted switches No. 568
Circuit breakers, reclosers and sectionalisers No. 275
Secondary Systems SCADA and communication No. 834
Protection relays No. 269
Load control systems No. 10
Metering (on network) No. 24,058
1.4 Our Asset Management Plan
1.4.1 Key Asset Management Issues
TLC is facing a range of short to medium‐term challenges that include security of supply constraints (brought about by incremental growth and reliability concerns related to some key assets), safety and environmental risks and line renewal requirements. These are considered the critical risks that the AMP is seeking to address.
Security of Supply
Currently TLC has a range of security of supply issues to address in its Points of Supply (POS) and zone substations. From a customer perspective:
Over 10,000 customers are connected to a zone substation that does not meet our security of supply targets.
Over 16000 customers are connected to a grid exit point GXP that does not meet our security of supply targets.
Figure 1.4.1(a) shows an overview of our zone substation security. For most substations TLC can provide ‘fast response’ backup (transformer replacement or back feed) options, but constraints are now apparent on five of our most significant zone substations.
Projects within the planning period will address these security constraints providing a more reliable and resilient supply to our customers.

Introduction | 14
Figure 1.4.1(a): Security Rating of TLC’s Zone Substations
Safety and Environmental
TLC has three significant Safety and Environmental risks that need to be addressed:
Public safety risks associated with distribution transformers enclosed in wooden and tin sheds.
Safety risks associated with the cables on the Ruapehu ski‐fields.
Unsafe‐to‐operate switchgear (known as SDAF switchgear).
The replacement of the distribution transformers noted above is phased over years 1‐3 of the planning period. Replacement of the cables on the Ruapehu ski‐fields requires extensive input from our customer and consultation with both iwi and the Department of Conservation. As such this is scheduled for years 2‐5 of the planning period. The remaining three SDAF switches on our network will be replaced or removed over the coming 18 months.
Line Renewals
One of the most significant challenges for the business is transforming its line renewal programme to create a sustainable forward management programme.
TLC has some 4000 km of lines which are supported by approximately 34,000 poles and 50,000 crossarms. The establishment of the core network took place through the mid 1900s and since that time the renewal of line infrastructure has not quite kept sufficient pace to maintain an average mid‐life age.
Figure 1.4.1(b) shows TLC’s rolling average pole age profile. Although this is a crude indicator of risk, it shows that the average age of TLC’s pole asset fleet has been steadily increasing year on year.
0
500
1000
1500
2000
2500
3000
3500
Number of Customers
Zone Substation Security Summary
N N‐1 N‐1 Constrained N‐1 Switched
Over 10,000 customers (around 43%) are impacted by security of

Introduction | 15
Figure 1.4.1(b): TLC’s Pole Age Profile
Although our line renewal programme has successfully improved the reliability of our distribution network over the last fifteen years, that performance will begin to erode without further planned renewal.
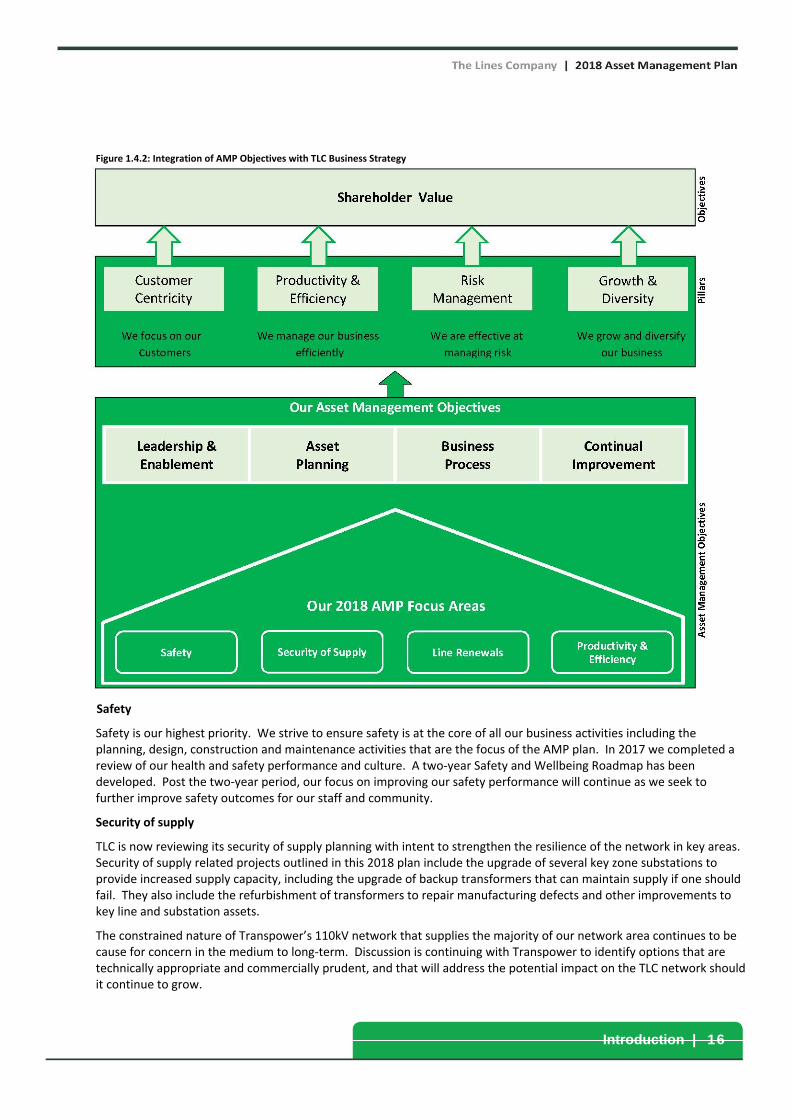
1.4.2 Our Business and Planning Objectives
Our core business objective is to connect customers with a safe and reliable electricity supply, and by doing so deliver value to our shareholders. TLC has four strategic pillars that drive our business activities and decisions to achieve this objective:
Customer Centricity: We focus on our customers.
Productivity and Efficiency: We manage our business efficiently.
Risk Management: We are effective at managing risk.
Growth and Diversity: We grow and diversify our business.
Our planning objectives in this AMP seek to deliver to our business goals and focus on activities that improve network reliability, business productivity and customer value outcomes. They are centred around five key themes:
Safety: Making targeted investments to improve the safety of our assets.
Security of Supply: Investing to improve the reliability and backup measures of our key supply points.
Line Renewal: Targeting sustainable delivery of our line renewal programme whilst ensuring our distribution lines remain safe and reliable.
Efficiency and Productivity: Improving business processes and systems.
Growth: Making targeted investments to support customer and network growth.
The following diagram shows how these AMP objectives link to the TLC business strategy.
0
5
10
15
20
25
30
35
40
2028
2018
2008
1998
1988
1978
1968
1958
1948
1938
1928
Rolling Average Pole Age
Average
Age (Years)
Average Pole Age at Year X
2018 AMP Plan
Introduction | 16
Figure 1.4.2: Integration of AMP Objectives with TLC Business Strategy
Safety
Safety is our highest priority. We strive to ensure safety is at the core of all our business activities including the planning, design, construction and maintenance activities that are the focus of the AMP plan. In 2017 we completed a review of our health and safety performance and culture. A two‐year Safety and Wellbeing Roadmap has been developed. Post the two‐year period, our focus on improving our safety performance will continue as we seek to further improve safety outcomes for our staff and community.
Security of supply
TLC is now reviewing its security of supply planning with intent to strengthen the resilience of the network in key areas. Security of supply related projects outlined in this 2018 plan include the upgrade of several key zone substations to provide increased supply capacity, including the upgrade of backup transformers that can maintain supply if one should fail. They also include the refurbishment of transformers to repair manufacturing defects and other improvements to key line and substation assets.
The constrained nature of Transpower’s 110kV network that supplies the majority of our network area continues to be cause for concern in the medium to long‐term. Discussion is continuing with Transpower to identify options that are technically appropriate and commercially prudent, and that will address the potential impact on the TLC network should it continue to grow.

Introduction | 17
Line renewal
In this AMP we are targeting an increase in the quantity of line renewal work to ensure that the age and consequent risk associated with our distribution network remains within acceptable limits.TLC has also commenced development of an asset risk management model which will provide risk based insight on the state of the line assets and allow TLC to base renewal decisions on condition and risk rather than coarse indicators such as age alone. It is expected that through this analysis TLC will be able to ensure its planned investment in line renewals is optimised over time.
Efficiency and productivity
We are working to further our asset management related business processes and systems. Planned expenditure related to efficiency and productivity improvement includes the review of our asset management business process to align with the international standard for asset management, ISO 55000. We are also seeking to improve the integration of our core technology systems and their interaction with field tools.
1.5 Key Outcomes
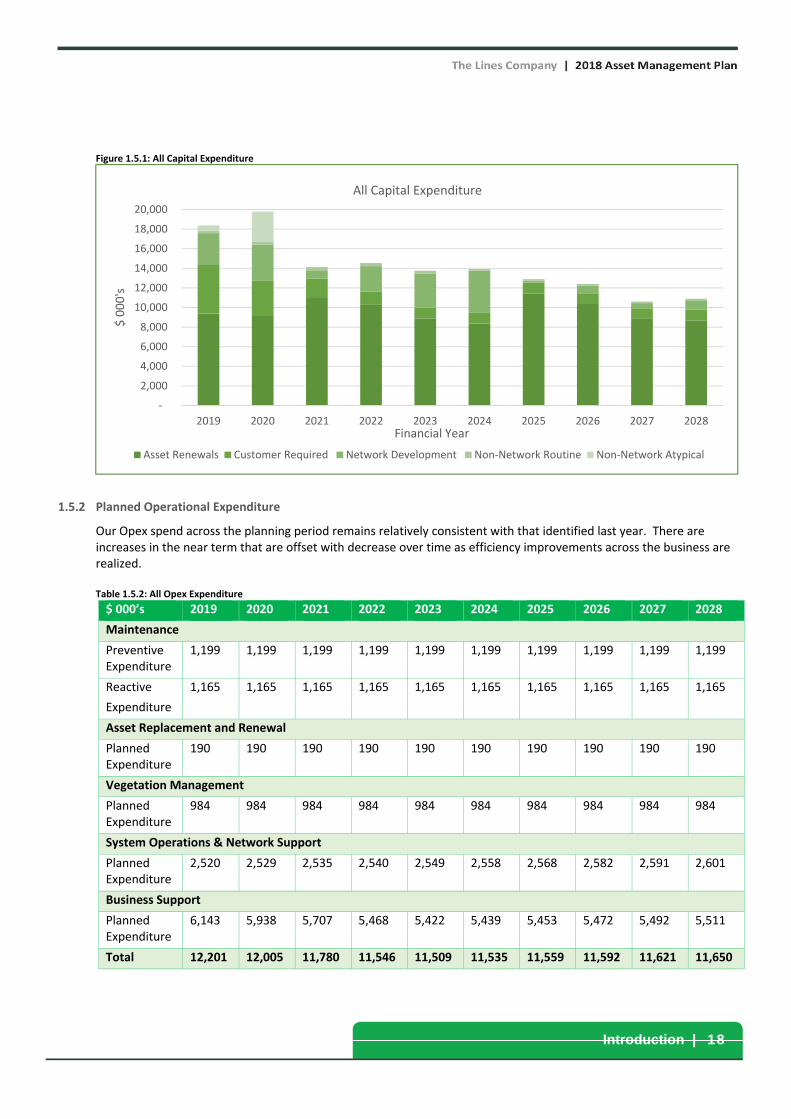
1.5.1 Planned Capital Expenditure
Over the past two years significant work has been undertaken to review our approach to security of supply and reliability of the network. The historical focus has been on increasing the reliability of the distribution and sub‐transmission networks which has seen a marked improvement in the overall reliability of the network over the past 15 years. However, over that period growth (both incremental and customer driven) across the network has now meant that investment is required in zone substations and points of supply over the planning period to ensure that a reliable supply of electricity is able to be maintained to those areas. In parallel, the line renewal programme needs to continue at levels similar to previous years to ensure that the reliability is maintained.
In the 2017 Asset Management Plan Update we signalled a lift in capital expenditure from an historical base of around $10M to $15M per annum to enable us to continue to provide a safe, reliable, resilient network. In developing this AMP, we have continued that focus.
A summary of the capital expenditure for the planning period is outlined in Table 1.5.1.
Table 1.5.1: Summary of Total Capital Expenditure – 10 years
$ 000’s 2019 2020 2021 2022 2023 2024 2025 2026 2027 2028
Network
Asset Renewals 9,493 9,133 10,971 10,268 8,886 8,364 11,439 10,362 8,835 8,681
Customer Required 4,948 3,586 1,988 1,361 1,093 1,093 1,093 1,093 1,093 1,093
Network Development
3,151 3,699 843 2,588 3,506 4,320 220 792 514 965
Non‐Network
Routine 235 261 317 317 261 151 151 151 151 151
Atypical 550 3,100 ‐ ‐ ‐ ‐ ‐ ‐ ‐ ‐
Total 18,377 19,779 14,119 14,534 13,747 13,929 12,903 12,398 10,593 10,889
Introduction | 18
Figure 1.5.1: All Capital Expenditure
1.5.2 Planned Operational Expenditure
Our Opex spend across the planning period remains relatively consistent with that identified last year. There are increases in the near term that are offset with decrease over time as efficiency improvements across the business are realized.
Table 1.5.2: All Opex Expenditure
$ 000’s 2019 2020 2021 2022 2023 2024 2025 2026 2027 2028
Maintenance
Preventive Expenditure
1,199 1,199 1,199 1,199 1,199 1,199 1,199 1,199 1,199 1,199
Reactive
Expenditure
1,165 1,165 1,165 1,165 1,165 1,165 1,165 1,165 1,165 1,165
Asset Replacement and Renewal
Planned Expenditure
190 190 190 190 190 190 190 190 190 190
Vegetation Management
Planned Expenditure
984 984 984 984 984 984 984 984 984 984
System Operations & Network Support
Planned Expenditure
2,520 2,529 2,535 2,540 2,549 2,558 2,568 2,582 2,591 2,601
Business Support
Planned Expenditure
6,143 5,938 5,707 5,468 5,422 5,439 5,453 5,472 5,492 5,511
Total 12,201 12,005 11,780 11,546 11,509 11,535 11,559 11,592 11,621 11,650
‐
2,000
4,000
6,000
8,000
10,000
12,000
14,000
16,000
18,000
20,000
2019 2020 2021 2022 2023 2024 2025 2026 2027 2028
$ 000's
Financial Year
All Capital Expenditure
Asset Renewals Customer Required Network Development Non‐Network Routine Non‐Network Atypical

Introduction | 19
Figure 1.5.2: All Opex Expenditure
1.5.3 Asset Management Performance
In developing this Asset Management Plan, we have determined four asset management performance measures that will assist in determining our effectiveness over time. These are detailed below:
Safety: Safety of our team, our customers and our community is of paramount importance to TLC. No job is so important that it cannot be completed safely.
Customer Experience: Our customers’ experience in dealing with us and the service levels they receive from our network are key elements in how we operate our business. We remain focused on ensuring that our network remains reliable and that when our customers contact us we respond in a timely and professional manner to resolve their queries.
Cost Efficiency: We aim to deliver service from a safe, reliable network to our customers in the most cost effective manner possible. The widely varying nature of our network and its relatively low customer density provides a number of challenges in ensuring that costs remain well controlled.
Asset Performance: Performance of our assets is strongly influenced by the decisions we make in the design, construction, operation and maintenance of our assets. Our focus is to ensure that our assets achieve or maintain performance levels at the lowest life cycle cost.
1.5.4 Continual Improvement
We are endeavouring to continually improve the way we manage our assets and the outcomes we provide to our stakeholders. The Commerce Commission provides a standard framework for measuring asset management improvement, which ranks our maturity level from 0 to 4. We undertake this self‐assessment each year to track our and report on our progression in asset management competency.
This year our competency level has increased resulting from the development work undertaken in asset management during 2017. The conclusion from this review is that TLC is making steady progress in our asset management maturity, but also that we have many areas that we can further strengthen. These will be key focal points on our further development.
‐
2,000
4,000
6,000
8,000
10,000
12,000
14,000
2019 2020 2021 2022 2023 2024 2025 2026 2027 2028
$ 000's
Financial Year
Operational Expenditure
Preventive Maintenance Reactive Maintenance
Asset Replacement and Renewal Vegetation Management
System Operations and Network Support Business Support

Introduction | 20
Figure 1.5.4: Asset Strategy and Delivery
1.6 Development Initiatives
1.6.1 Asset Management Framework
During 2017 TLC has reviewed its approach to Asset Management and has committed to aligning our Asset Management Framework to the internationally recognised ISO 55000 series of standards. In aligning with these standards we have structured our Asset Management Planning around four pillars. These are summarised below:
• Leadership and Enablement of the asset management approach which is aligned with TLC’s business objectives, and meets the requirements of both external and internal stakeholders.
• Asset Planning ‐ a detailed end‐to‐end planning process across the asset portfolio which commences with risk profiling of the assets, through to delivery.
• Business Processes ‐ well defined quality processes for the delivery of CAPEX and OPEX work to the assets along with other tasks such as switching, investigations, materials supply and so forth. The intent is to reduce the cost of work through quality management, assure consistency of approach and promote the competency of all teams involved with service delivery.
• Continual improvement – consistently improving asset management processes as well as determining future options for network resilience and reliability.
1.6.2 Data Quality and Predictive Risk Modelling
TLC recognises that the quality of the data and information that it holds on its asset portfolio are essential enablers in ensuring a focused and prudent asset management system that delivers high quality network performance through targeted risk reduction at the lowest life cycle cost.
We have commenced the development of an Asset Risk Management Model for our distribution network assets. This is based on the Distribution Network Operators (DNO) Common Network Asset Indices Methodology (Common

Introduction | 21
Methodology) published by the UK Ofgem as an open source for electricity network companies to assess asset health and criticality. Once fully implemented this will be used as a tool to assess the current risk associated with the assets and also predict future risk based on various investment scenarios. It is intended to develop a similar model for all major asset classes.
This will require a more detailed understanding of the condition of our assets and the manner in which that condition translates into asset and business risk. We believe the investment in this approach will provide significant benefit over the traditional approach of a point estimate of asset risk using a combination of age, condition and reliability.

Background | 22
Background
Background | 23
2. Background Chapter Overview
This chapter provides an overview of The Lines Company including ownership and governance, business context, our customers and stakeholders, our network, asset summary and operating environment.
2.1 Overview of The Lines Company
2.1.1 Company Profile
The Lines Company’s core business is the ownership, maintenance and operation of an electricity distribution business predominantly located in the King Country and Ruapehu regions of New Zealand.
The Lines Company (TLC) was established in 1999 when electricity industry reforms required the separation of retailing and distribution lines businesses. Before then TLC’s lines business assets were vested in King Country Energy Ltd and the Waitomo Energy Company, both of which had themselves been created out of the old Power Boards as part of reforms earlier that decade.
TLC is 100% owned by the Waitomo Energy Services Customer Trust (“WESCT”), which is governed by six trustees. Three trustees are elected by customers within a gazetted area (Hangatiki and Whakamaru) who then appoint one further trustee. Major customers within the Hangatiki and Whakamaru area also elect two trustees.
TLC’s Head Office is located in Te Kuiti with operational depots in Taumarunui, Ohakune and Turangi. The group has four distinct business units – Network, Metering, Generation and Network Services, with only the Network business being constrained to the Waitomo and King Country regions.
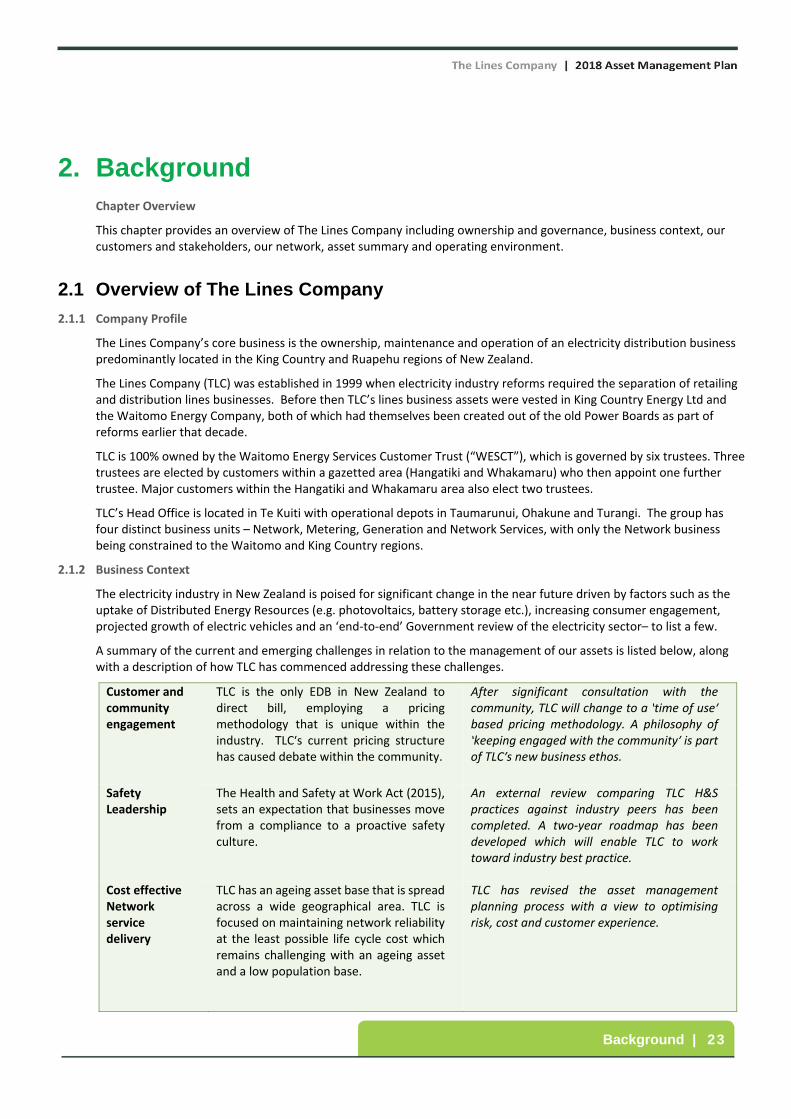
2.1.2 Business Context
The electricity industry in New Zealand is poised for significant change in the near future driven by factors such as the uptake of Distributed Energy Resources (e.g. photovoltaics, battery storage etc.), increasing consumer engagement, projected growth of electric vehicles and an ‘end‐to‐end’ Government review of the electricity sector– to list a few.
A summary of the current and emerging challenges in relation to the management of our assets is listed below, along with a description of how TLC has commenced addressing these challenges.
Customer and community engagement
TLC is the only EDB in New Zealand to direct bill, employing a pricing methodology that is unique within the industry. TLC’s current pricing structure has caused debate within the community.
After significant consultation with the community, TLC will change to a ‘time of use’ based pricing methodology. A philosophy of ‘keeping engaged with the community’ is part of TLC’s new business ethos.
Safety Leadership
The Health and Safety at Work Act (2015), sets an expectation that businesses move from a compliance to a proactive safety culture.
An external review comparing TLC H&S practices against industry peers has been completed. A two‐year roadmap has been developed which will enable TLC to work toward industry best practice.
Cost effective Network service delivery
TLC has an ageing asset base that is spread across a wide geographical area. TLC is focused on maintaining network reliability at the least possible life cycle cost which remains challenging with an ageing asset and a low population base.
TLC has revised the asset management planning process with a view to optimising risk, cost and customer experience.

Background | 24
Emerging technologies
The emergence of new technology such as photovoltaics, battery storage, smart in‐home devices, electric vehicles and digital trading platforms, to name a few, has the potential to significantly change the industry and TLC’s business activities.
TLC is involved in a number of technology initiatives from a solar trial through to real time data acquisition and monitoring of Network information. In 2017, TLC was awarded EECA funding to support the rollout of Electric Vehicle charging units at accommodation destinations throughout TLC’s network.
Investment in systems and processes
TLC’s systems and processes require updating and investment in order to meet the requirements of an evolving business.
TLC’s new customer management system will go live in 2018. In addition, a number of process improvement programmes are in place, especially in the Network development and operations area.
2.1.3 Business Structure
TLC has four business units that integrate to support the management of its distribution network. Further detail on the Network business unit is provided in Section 2.3. The relationship of the three non‐network business units to the core network and its asset management is set out below:
Figure 2.1.3: Integrated TLC Business
These business units provide strategic opportunities for the ongoing refinement of TLC’s approach to asset management.
Generation
TLC operates and maintains three hydro generation sites – these are either wholly‐owned, or owned in partnership with landowners. Two generation sites (Speedys Road and Mangapehi) are in TLC’s network area while one site is located at Matawai near Gisborne. These generation sites are run of the river (i.e. no hydraulic storage) hydroelectric plants. The output is dependent on rainfall in the catchments that supply the in‐take rivers. Incremental improvements continue to be made on plant and equipment in order to optimise generation output and ensure reliability of supply.
Metering
Financial Corporation Limited (FCL) is a wholly‐owned subsidiary of TLC and represents the Group’s metering interests. FCL owns both on‐network meters (meters on the TLC Network) and off‐network meters (which exist on non‐TLC networks) where FCL derives income from electricity retailers and some industrial sites throughout New Zealand. FCL also own 36% in Embrium Holdings Ltd – an “early stage” meter analytics business based in Wellington.

Background | 25
Network Services
TLC has a wholly‐owned power system contracting unit. TLC Network Services provides network construction services, as well as maintenance, fault management and technical services to customers. The business unit employs approximately 65 staff and is focused as a specialist support unit to the network. At the time of writing TLC Network Services does not offer any substantial services outside the TLC core network area.
In addition to in‐house teams, TLC also engages external service providers for vegetation management (arborist services) and other specific major construction projects.
2.1.4 Organisation Structure
The Lines Company is structured into six divisions which manage the TLC business unit portfolio. The organisation structure is shown below:
Figure 2.1.4: TLC Organisation Structure

Background | 26
2.2 Business Objectives
2.2.1 Strategic Framework
TLC has recently developed a robust strategy to deliver long‐term financial vitality and viability for our shareholders in the face of rapidly changing customer expectations and an evolving energy landscape – the fundamental building blocks of which are outlined in Figure 2.2.1.
The strategy provides the foundation and direction that TLC needs to best serve our customers now and into the future. The strategic plan positions TLC to become a different business in the future and takes into account our responsibilities to our customers and community as well as the changes transforming our industry — increasingly sophisticated Network requirements, greater dependence on technology, third parties entering the market and the importance of Network data and analytics.
Figure 2.2.1: TLC’s Strategic Framework
2.2.2 Organisational Values
In conjunction with the development of the new strategy TLC has defined and rolled out a new set of organisational values. These values, supported by a set of behaviours, underpin how the people within TLC act with their colleagues, our customers and our community. These values are detailed below.
Figure 2.2.2: TLC’s Values
Keep Well
Health and wellbeing comes first.
Act safely.
Protect those around us.
Be Awesome
Innovate and bring ideas to life.
Punch above our weight.
Embrace change positively.
Exceed expectations.

Background | 27
Be Proud
Work hard to get the job done.
Make a difference.
Celebrate our expertise.
Embrace our unique community.
Own It
Be responsible for our actions.
Take ownership from start to finish.
Deliver on promises.
Overcome challenges.
2.2.3 Link to Asset Management Planning
Our business strategy, supported by the four building blocks of Customer Centricity, Productivity and Efficiency, Risk Management and Growth and Diversity drive our approach to Asset Management. Our Asset Management Policy is detailed in Section 4 with each of the principles articulated being able to be linked back to one of these four building blocks.
Our Asset Management performance is measured as detailed in Section 8 with four key areas:
Safety: Safety of our team, our customers and our community is of paramount importance to TLC. No job is so important that it cannot be completed safely.
Customer Experience: Our customers’ experience in dealing with us and the service levels they receive from our network are key elements in how we operate our business. We remain focused on ensuring that our network remains reliable and that when our customers contact us we respond in a timely and professional manner to resolve their queries.
Cost Efficiency: We aim to deliver service from a safe, reliable network to our customers in the most cost effective manner possible. The widely varying nature of our network and its relatively low customer density provides a number of challenges in ensuring that costs remain well controlled.
Asset Performance: Performance of our assets is strongly influenced by the decisions we make in the design, construction, operation and maintenance of our assets. Our focus is to ensure that our assets achieve or maintain performance levels at the lowest life cycle cost.
2.3 Our Region
2.3.1 Overview
In total the TLC network provides an electricity distribution service to around 24,000 connected customers covering 13,700 km2. It is one of the largest network areas in New Zealand without a major urban centre. Consequently it has become a specialist in providing electrical distribution services to rural and sparsely populated areas. These areas include the highest points in the North Island of New Zealand (the Turoa and Whakapapa ski‐fields on Mount Ruapehu).
The region’s core economic industries are dairy farming, industrial processing (limestone and timber), mining (iron sand) and tourism. The network also includes popular ski‐fields with a consequent winter peak loading, plus an increasing uptake in holiday homes and tourist destinations, which can lead to significant swings in network loads in these regions from a low permanent resident base.

Background | 28
TLC’s network supplies ~381GWh of electricity per year and has a regulated asset base (RAB) value of $184 million (March 2017).
Figure 2.3.1(a): TLC Network Region
Points of Supply (POS) to the TLC network are not only from Transpower grid exit points (GXPs), but also from major Waikato generation plants connected to our sub‐transmission network. Supply to the network is also supported by a number of embedded hydro generators connected to the distribution network at 11kV.
Our network characteristics are influenced by our customers, our assets, our operating environment, our stakeholders and our network boundaries.
Figure 2.3.1(b): Key Influences on the TLC Network
2.3.2 Our Customers
TLC serves around 24,000 homes and businesses supplied through six points of supply including Hangatiki, Whakamaru, Ongarue, Tokaanu, National Park and Ohakune.
Waitomo
Benneydale
Ohakune
Piopio
Mokau
Te Kuiti
Otorohanga
National Park
Whakamaru
Turangi
Taumarunui
Mangakino
Mokai
Taharoa
TLC Network
Our Operating Environment
Our N
etwork
Boundaries O
ur Assets
Our
Stakeholders
Our Customers

Background | 29
Our customers are a mix of high value industry, dairy farming, traditional residential customers and a high proportion of tenancy or holiday‐based accommodation. Table 2.3.2 below sets out our customer profile with ICP numbers by category:
Table 2.3.2: Number of customers (ICPs) by category
Customer Group Customers % of ICPs
Accommodation 220 0.93%
Commercial 2,408 10.14%
Farming 3,123 13.37%
Holiday Home 3,698 15.58%
Major 138 0.58%
Residential 14,008 59.01%
Unmetered 93 0.39%
TOTAL 23738 100%
Large Load Customers
There are several diverse, large load customers that generate considerable economic value to the region who have increased reliability and quality requirements. A number of these facilities are on the end of long sections of network, with no alternative supply. As large load customers may not always be able to fund high levels of network security there is a heightened demand for network reliability, as well as good communications managing interruptions to supply. These large load customers include the following and also shown in the supply coverage map shown in Figure 2.3.2
• Iron sands processing and loading.
• Ski‐fields.
• Corrections facilities.
• Limestone extraction and processing.
• Meat processing.
• Timber processing.
• Milk processing and glasshouse food production.
2.3.3 Our Assets
TLC operates a sub‐transmission network operating at 33 kV connecting points of supply to zone substations. TLC’s network is one of the most geographically complex and distributed networks in New Zealand. Its key characteristics include:
• One of the smallest customer populations in New Zealand (ranking 20th out of 29 electricity distributors in terms of number of customers).
• A relatively long circuit length (12th out of 29 in terms of the length of network) and no large urban centres, resulting in a low customer per km ratio.
• Sparsely populated, with long lines in rugged terrain, and few alternative supply options.
Waitomo
Benneydale
Ohakune
Piopio
Mokau
Te Kuiti
Otorohanga
National Park
Whakamaru
Turangi
Taumarunui
Mangakino
Mokai
Taharoa
Figure 2.3.2: Location of Major Customers

Background | 30
• Large unpredictable loads, and embedded hydro generation.
• A customer mix (and need) that is widely varied, being a mix of high‐value primary sector industry, dairy farming, a relatively low proportion of traditional residential customers, and a high proportion of tenancy or holiday‐based accommodation.
To address the geographic and customer characteristics our network has a unique asset configuration which includes:
• Few lines on roadsides and many across rugged mountainous terrain.
• Large numbers of Single Wire Earth Return (SWER) systems (60 plus).
• North Eastern areas supplied directly from major Waikato generation plants bypassing Transpower grid exit points (GXPs).
• A number of embedded hydro generators connected to the distribution network.
• Long lengths of 33kV network providing sub transmission.
• Long lengths of privately owned 11kV lines, often in remote rugged country.
The majority of the distribution network operates at 11kV and is characterised by long rural feeders across terrain that is difficult to access. As such is prone to a higher level of interruptions than typical given its size.
2.3.4 Our Operating Environment
The environment we operate in is an important factor in delivering our services. The following factors determine our operating environment:
• Topography.
• Geology and climate.
• Land access.
• Vegetation.
• Access to human resource.
• Technological changes.
• Energy consumption trends.
Topography
The topography of our supply area varies greatly from the iron‐sand beaches on the west coast to the highest points in the North Island of New Zealand at the Turoa and Whakapapa ski‐fields on Mount Ruapehu. It is an area of steep, rolling hills and valleys dissected by rivers and streams. As a result, lines tend to go from hill to hill and predominately through remote rugged terrain.
Geology and Climate
The King Country is a broad expanse of uplifted sedimentary rock west of the North Island main divide and central volcanic zone, and is part of a larger, geologically similar tract of land that includes inland Whanganui and Taranaki. Mountain ranges flank the King Country – the greywacke and argillite Hērangi Range in the west and the greywacke and ignimbrite Rangitoto and Hauhungaroa ranges to the east. The hills are siltstone, sandstone and mudstone.
TLC’s western coastal assets are subject to salt‐laden air; assets therefore are chosen that perform well in this environment.
Thermal areas, such as Tokaanu, require components that can be installed in hot ground. In one case TLC obtained special dispensation to not follow the Taupo District Council District Plan for underground reticulations in urban areas, as the ground was too hot for an underground cable. TLC has also been compelled to install wooden poles in some regions due to the corrosive nature of the gases in the thermal area that reduce the life of concrete poles.

Background | 31
Overall, the diversity of soil types of our network region (iron‐sand, peat soils, sandstone etc.) along with the diversity of regional geological conditions (volcanic zones, coastal areas etc.) adds complexity to the design, construction and operation of our network.
Land Access
TLC has an extensive distribution system across private land in order to cost effectively reach remote regions. Land access is fundamental to our continuing operations, but is regularly constrained by climatic conditions (wet soils preventing vehicle access to hilly terrain during winter), and community considerations such as vehicle access across paddocks during lambing periods.
As a Network Operator TLC has existing rights under the Electricity Act 1992 for assets built prior to 1992. These rights give TLC access to maintain the equipment constructed prior to 1992. Notwithstanding these rights, practical access is often restricted by the constraints mentioned above, and as such TLC has a relatively high use of helicopters to support construction and maintenance.
Vegetation
TLC’s distribution network crosses through dense vegetative and forested areas. As a result TLC has a high exposure to faults from tree fall, particularly during storm events. TLC invests significantly in vegetation management (tree‐trimming) to maintain reliable supply to its rural customers.
Access to Human Resource
The labour market supporting the electricity distribution industry continues to be ‘tight’, with it being very difficult to find sufficient skilled workers to carry out all planned works. This is expected to become more challenging as other companies around New Zealand embark on significant re‐investment programmes over the next 10 years. TLC is investing in its staff training and development including the recruitment of four new line mechanic trainees each year to assist in mitigating the risk that this skills shortage presents.
Live Line Work
Live line work is under review across the industry which has seen the cessation of all live line work at TLC until we are convinced that it may continue to be carried out safely. This means that there are more outages required to effect improvements to the network and places pressure on completion of planned work programmes while remaining within the regulatory outage limit requirements.
Technological Changes
Solar energy at a domestic level is becoming more economically viable with an increasing trend in installation numbers across the country. Alternative business models are being developed whereby customers pay no money up front but receive discounted electricity from the installation of solar panels on their property. Over time this approach may see the aggregation of individual solar installations into virtual power plants. The uptake of solar in The Lines Company network is still relatively low and is not expected to increase materially in the short‐term, however consideration is being given as to how to manage the network in an environment where there is bi‐directional power flow.
Battery storage technology is also emerging as a significant network consideration. It is currently being driven predominantly by the electric vehicle market, with the economics of domestic, distribution or grid battery systems still being generally unfavourable on a large scale when compared to traditional means of electricity distribution. It is expected that as further investment in battery technology and manufacturing takes place, the cost of battery systems will decrease and there will be an increase in the number of combined solar/battery based systems at a domestic level. There are however, a number of opportunities within the TLC network where moderate sized battery installations may provide a viable commercial and technical solution due to the remote nature of the customer installation and length of the associated connection to the network.
Where batteries by themselves are not viable, other technology options that integrate solar panels, batteries and diesel generation have been developed commercially. As stand‐alone systems these often provide a more reliable and cost effective electricity supply to customers than the cost of replacement of a traditional distribution line.
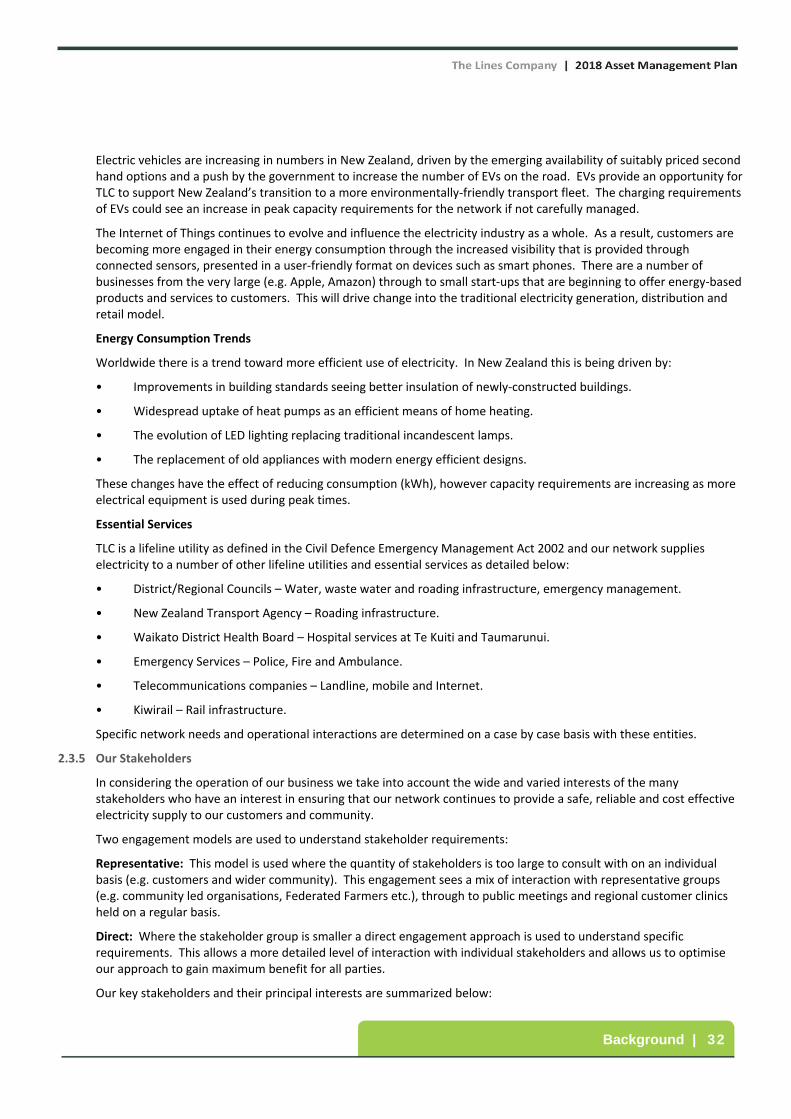
Background | 32
Electric vehicles are increasing in numbers in New Zealand, driven by the emerging availability of suitably priced second hand options and a push by the government to increase the number of EVs on the road. EVs provide an opportunity for TLC to support New Zealand’s transition to a more environmentally‐friendly transport fleet. The charging requirements of EVs could see an increase in peak capacity requirements for the network if not carefully managed.
The Internet of Things continues to evolve and influence the electricity industry as a whole. As a result, customers are becoming more engaged in their energy consumption through the increased visibility that is provided through connected sensors, presented in a user‐friendly format on devices such as smart phones. There are a number of businesses from the very large (e.g. Apple, Amazon) through to small start‐ups that are beginning to offer energy‐based products and services to customers. This will drive change into the traditional electricity generation, distribution and retail model.
Energy Consumption Trends
Worldwide there is a trend toward more efficient use of electricity. In New Zealand this is being driven by:
• Improvements in building standards seeing better insulation of newly‐constructed buildings.
• Widespread uptake of heat pumps as an efficient means of home heating.
• The evolution of LED lighting replacing traditional incandescent lamps.
• The replacement of old appliances with modern energy efficient designs.
These changes have the effect of reducing consumption (kWh), however capacity requirements are increasing as more electrical equipment is used during peak times.
Essential Services
TLC is a lifeline utility as defined in the Civil Defence Emergency Management Act 2002 and our network supplies electricity to a number of other lifeline utilities and essential services as detailed below:
• District/Regional Councils – Water, waste water and roading infrastructure, emergency management.
• New Zealand Transport Agency – Roading infrastructure.
• Waikato District Health Board – Hospital services at Te Kuiti and Taumarunui.
• Emergency Services – Police, Fire and Ambulance.
• Telecommunications companies – Landline, mobile and Internet.
• Kiwirail – Rail infrastructure.
Specific network needs and operational interactions are determined on a case by case basis with these entities.
2.3.5 Our Stakeholders
In considering the operation of our business we take into account the wide and varied interests of the many stakeholders who have an interest in ensuring that our network continues to provide a safe, reliable and cost effective electricity supply to our customers and community.
Two engagement models are used to understand stakeholder requirements:
Representative: This model is used where the quantity of stakeholders is too large to consult with on an individual basis (e.g. customers and wider community). This engagement sees a mix of interaction with representative groups (e.g. community led organisations, Federated Farmers etc.), through to public meetings and regional customer clinics held on a regular basis.
Direct: Where the stakeholder group is smaller a direct engagement approach is used to understand specific requirements. This allows a more detailed level of interaction with individual stakeholders and allows us to optimise our approach to gain maximum benefit for all parties.
Our key stakeholders and their principal interests are summarized below:

Background | 33
Table 2.3.5: Key Stakeholder Requirements
Key stakeholders Main Interests Engagement
Our Customers Service quality and reliability; price; safety; connection agreements
Representative, direct where required
Communities, Iwi, Landowners
Public safety; environment; land access and respect for traditional lands
Representative, direct where required
Regional and District Councils
Public safety; environmental management; land access; supply to essential services; emergency management
Direct
Employees and Contractors
Safe, productive work environment; remuneration; training and development; asset management documentation
Direct, representative where required
Waitomo Energy Services Customer Trust
Efficient management; financial performance; governance; risk management
Direct (via Board of Directors)
Board of Directors Efficient management; financial performance; governance; risk management
Direct
Commerce Commission
Pricing levels; effective governance; quality standards, reviews and audits leading to continual improvement
Direct
Electricity Retailers Business processes; access to the network; use of systems agreements; customer service
Direct
Regulators Workplace safety, (Worksafe); electrical compliance (Worksafe, Energy Safety); market operation and access (Electricity Authority); environmental performance (Regional Councils)
Direct
Distributed Generators
Access to the network; connection agreements, price, operations management
Direct
Transpower Load forecasting; GXP planning, technical performance; technical compliance
Direct
Managing Stakeholder Conflicts of Interest
Where material conflicts of interest emerge between different stakeholders, these are reported and discussed by the senior leadership team to form a resolution, followed by further engagement with the affected parties or their representatives. Cases with high materiality (which may be both objective and subjective) are reported to and discussed with TLC’s Board of Directors.
Decision outcomes are typically determined by safety, fairness and equity considerations as primary drivers.
2.3.6 Our Network Boundaries
TLC’s network crosses the boundaries of seven district councils and three regional councils. In some cases we provide electricity distribution and other services to these councils as customers. A high degree of co‐ordination and interaction is required between TLC and councils to ensure that the services we collectively provide are safe, reliable and cost effective.

Background | 34
Table 2.3.6: List of Regional and Local Councils
Regional Council District Council
Waikato Regional Council Otorohanga District Council
Waitomo District Council
Taupo District Council
Waipa District Council
South Waikato District Council
Manawatu‐Wanganui Regional Council Ruapehu District Council
Taranaki Regional Council New Plymouth District Council
The TLC network boundaries are defined as:
• Supply from Transpower:
Supply from Transpower is at the connection to Transpower grid exit points, as defined in Transpower connection agreements.
• Supply from Large Generation Plants:
At Whakamaru, Atiamuri and Mokai, the demarcation point that defined in connection agreements.
• Supply from Distributed Generators:
The asset boundary for distributed generators is the ‘Point of Connection’ as detailed in TLC’s Terms and Conditions of Supply.
• Supply to the Customer:
Supply to the customer is at the customer’s ‘Point of Connection’ as defined in TLC’s Standard Terms of Service.
Company policy is to regard any line that supplies a property owned by a single entity as private regardless of voltage. The private lines start at the Point of Connection to the network and then travel to individual properties. The ‘Point of Connection’ may or may not be the ‘Point of Supply’. The ‘Point of Supply’ is defined in legislation and, in most cases, is the point where a line crosses the boundary to a property. If these lines were included in the assets owned by TLC, the likely line length increase would be a further 17% or approximately 730km.
These private lines can be non‐compliant with present day codes and from time to time can cause faults that affect other customers. TLC carries out inspections on private lines free of charge and notifies customers when maintenance or issues of noncompliance are identified.

Network Assets | 35
Network Assets

Network Assets | 36
3. Network Assets Chapter Overview
This chapter describes our network configuration and asset portfolio in detail.
3.1 Asset Summary
To summarise our assets we have grouped our distribution system (including Non‐TLC supply points) into eight portfolios described in Table 3.1. The key information for each portfolio is set out in the following sections.
Table 3.1: TLC’s Asset Portfolio
Portfolio Asset Class Unit Quantity
Points of Supply Transpower grid exit points (GXP) No. 5
Direct Generator Connections No. 3
Embedded Generators >1 Megawatt (MW)
TLC owned hydro generation plants (on and off
network)
No. 3
King Country Energy Owned Generation Plants No. 4
Zone Substations and Subtransmission Switchgear
Buildings No. 39
Power transformers No. 33
33 kV switchgear No. 249
Support Structures Poles No. 34,548
Crossarms No. 51,156
Overhead Conductors Sub‐transmission km 502
Distribution km 3,085
Low voltage km 449
Cables Sub‐transmission km 11
Distribution km 128
Low voltage km 179
Low Voltage (LV) Pillar Boxes No. 4095
Distribution Transformers Ground mounted No. 503
Pole mounted No. 4,596
Distribution Switches Ground mounted switchgear No. 438
Pole mounted fuses No. 6,912
Pole mounted switches No. 568
Circuit breakers, reclosers and sectionalisers No. 275
Secondary Systems SCADA and communication No. 834
Protection relays No. 269
Load control systems No. 10
Metering (on network) No. 24,058
3.2 Points of Supply
3.2.1 Overview
The TLC network is supplied from eight locations which include five from Transpower’s Grid Exit Points (GXPs), two directly from hydro generators and one geothermal plant. Figure 3.2.1 shows a high‐level depiction of the Points of Supply to the TLC Network.

Network Assets | 37
Figure 3.2.1: Location of Major Points of Supply
Table 3.2.1 outlines the characteristics of each point of supply to the network and the key loads supplied from each.
Table 3.2.1: Characteristics of Supply Points
Supply Points Description Key Load Types Served
Hangatiki GXP Dual transformer supply restricted by load exceeding the capacity of one transformer
Industrial loads o Iron sand extraction o Timber processing o Limestone processing o Meat processing
Distributed generation (10.1MW)
Rural loads (dry stock and dairy) Te Kuiti and Otorohanga towns
Ongarue GXP Single transformer supply with backup via a 33kV line from Tokaanu
Rural loads Taumarunui town
Distributed generation (7.5MW) Tokaanu GXP Dual transformer supply with load below the capacity
of one transformer Holiday accommodation
Department of Corrections
Turangi town National Park GXP
Single transformer supply with backup via a 33kV line from Tokaanu
Whakapapa ski‐field
Holiday accommodation
National Park township Ohakune GXP Single transformer supply with limited backup from
Tangiwai GXP Turoa ski‐field Holiday accommodation
Ohakune town Whakamaru Single transformer supply directly from the large
hydro generators on the Waikato River with limited backup from Atiamuri
Dairy farming
Holiday accommodation
Mokai Energy Park
Single supply from Tuaropaki Mokai Geothermal Power station with limited backup
Milk processing facilities
Horticulture (glasshouses)
Hangatiki
Ongarue
National Park
Whakamaru
Tokaanu
Ohakune
Atiamuri
Mokai
Tangiwai
220 kV Transmission Line 110 kV Transmission Line Transpower supply point to TLC
Supply point to TLC
Major generation plant

Network Assets | 38
3.2.2 Summary of Points of Supply
The following table provides a summary of our supply points (Table 3.2.2), and outlines the level of security we have at each point and impact that a loss of supply would cause.
Table 3.2.2: Supply Point Summary
Supply Points
Asset Owner
Cust. Serviced
Operating Security Level
Peak Load (MVA)
Installed Capacity (MVA)
Trans‐former Security
11kV or 33kV Backup
Hangatiki1 Transpower 9166 N1 33.9 40 N‐1 Light (2.0MVA)
Tokaanu Transpower 4871 N‐1 9.3 40 N‐1 Yes
Ongarue Transpower 4818 N‐1 Switched
10.0 20 N Yes
Atiamuri2 TLC 2589 N‐12 Switched
10.9 10 N Yes
Whakamaru Tuaropaki 10.1 23 N Yes
Ohakune3 Transpower 2045 N3 7.5 20 N Light (2.0MVA)
National Park
Transpower 866 N‐1 Switched
6.7 20 N Yes
Mokai TLC 12 N 4.0 7.5 N Light (1.0MVA)
Notes: 1. Hangatiki currently operates over the N‐1 transformer capacity of 20MVA for over 55% of the year. 2. Atiamuri is a backup supply for Whakamaru 3. Ohakune currently operates over the backup capacity of 2MVA for 40% of the year.
3.3 Embedded Generators
3.3.1 Overview
TLC has six embedded hydro generating stations >1MW connected to its network. TLC operates and maintains two of these hydro generation sites. These are either wholly‐owned or owned in partnership with landowners. The other four stations are owned by King Country Energy.
When available generation output is used to support the operation of the network. However as all of the generation has minimal storage the generation output is not essential to maintain supply to customers.
Table 3.3.1: Distributed Generation Summary
Ongarue GXP1 Hangatiki GXP2
Owner/Operator Station/Machine Rating (MW) Station/Machine Rating (MW)
King Country Energy Wairere 4 Wairere 5 Mokauiti 1 Mokauiti 2
3.0 1.2 1.0 0.6
Kuratau 1 Kuratau 2 Piriaka 1 Piriaka 2 Piriaka 3
3.0 3.0 1.0 0.3 0.3
The Lines Company Mangapehi 1 Mangapehi 2 Speedys Road3
1.5 1.5 2.2
Notes: 1. Ongarue generation can be switched to support National Park or Tokaanu GXPs as required. 2. With the exception of Speedys Road, Hangatiki generation can be switched to support Whakamaru POS on a limited basis. 3. Speedys Road is 75% owned by TLC with the remaining 25% owned by the landowner where the station is located.

Network Assets | 39
3.3.2 TLC Off Network Generation
TLC owns and operates one off network hydro generation station that is embedded in Eastland Energy’s network.
Table 3.3.2: Off Network Distributed Generation Summary
Network Operator Station/Machine Rating (MW)
Eastland Energy Matawai 1 Matawai 1
1.0 1.0
3.4 Zone Substations
3.4.1 Overview
TLC maintains and operates 27 zone substations that transform electricity from our 33kV sub‐transmission network to supply our 11kV distribution network. Figure 3.4.1 shows TLC’s 33kV sub‐transmission network and the location of its zone substations.
Our 33kV sub‐transmission network is one of the longest in New Zealand at 503 km and as such its exposure to faults caused by weather and vegetation‐related incidents is high. Sub‐transmission line backups between points of supply are long and amongst the oldest parts of the network. Reliability‐centered maintenance of the sub‐transmission network is an essential part of our asset management approach, coupled with targeted reinvestment to minimise interruptions to customers’ supply.
Figure 3.4.1: TLCS’s Sub‐transmission (33kV) Network and Zone Substations
Hangatiki Sub & GXP
Ohakune Sub & GXP
Te Waireka
Te Anga
Taharoa
Wairere Falls
Maraetai
Whakamaru POS
Kaahu Tee
Marotiri Mokai POS
Ongarue Sub & GXP
Nihoniho
Borough
Manunui
OtukouTokaanu Sub & GXP
National ParkSub & GXP
Kiko Rd
Awamate
Waiotaka
Tawhai
Arohena
Kuratau
Oparure
Waitete
Gadsby Rd
Taharoa Village
Atiamuri POS
Tuhua
Maehoenui
Turangi
33 kV Sub-transmission line TLC Zone substation Transpower supply point to TLC Supply point to TLC Major generation plant

Network Assets | 40
Table 3.4.1 shows a summary of the zone substations and their security levels.
TLC has a number of zone substations with single transformers and with light load backup from other substations via the 11kV distribution network. This places higher requirements for sub‐transmission and zone substation maintenance and operational response to minimise interruptions to customers’ supply.
Table 3.4.1: Zone Substations Summary
Zone Substation
Custo
mers
Service
d
Operating Security Level
Peak Lo
ad
(MVA)
Installe
d
Cap
acity (M
VA)
Security Substation Building
Strength (% of new building standard)2
Tfmr 33kV Line
Bus 11kV Backup1
Te Waireka 3048 N‐1 Constrained 12.3 20 N‐13 N‐1 N‐1 Light 20%
Borough 2888 N‐1 Constrained 8.5 10 N‐14 N‐1 N‐1 Light 40%
Turangi 2002 N 4.9 5 N‐1 N N‐1 Med Unassessed2
Waitete 1900 N‐1 8.9 15 N‐1 N‐1 N‐15 Med 25%
Kuratau 1635 N6 2.7 6 N N‐1 N No Unassessed
Wairere Falls 1371 N 3.0 5 N‐1 N N Med 100%
Gadsby Road 1364 N‐1 Switched 5.4 5 N N‐1 N Yes 50%
Maraetai 1262 N 5.2 10 N N N Light Unassessed
Manunui 1143 N 3.1 5 N N‐1 N Light Unassessed
Kiko Road 838 N‐1 Switched 1.5 3 N N N Yes Unassessed
National Park 647 N‐1 Switched 1.6 3 N N‐1 N Yes Unassessed
Mahoenui 628 N 0.9 3 N N N Med Unassessed
Arohena 554 N 2.9 3 N N N Med Unassessed
Marotiri 523 N‐1 Switched 2.0 3 N N N Yes Unassessed
Hangatiki 397 N 4.5 5 N N‐1 N Light 20%
Nihoniho 395 N‐1 Switched 0.5 1.5 N N N Yes Unassessed
Tuhua 395 N‐1 Switched 0.6 1.5 N N N Yes Unassessed
Awamate 308 N‐1 Switched 0.8 2 N N N Yes Unassessed
Te Anga 302 N‐1 Switched 2.1 2 N N N Yes Unassessed
Kaahu Tee 249 N 2.2 2 N N‐1 N Med Unassessed
Tawhai 135 N 4.9 5 N N‐1 N Light Unassessed
Taharoa Village 117 N‐1 Switched 0.3 2 N N‐1 N Yes Unassessed
Tokaanu 82 N 0.2 1.25 N N‐1 N No Unassessed
Otukou 70 N 0.2 0.5 N N‐1 N No Unassessed
Waiotaka 6 N‐1 Switched 0.5 2 N N N Yes Unassessed
Oparure 3 N 1.7 3 N N N Light Unassessed
Taharoa 1 N‐1 15.2 15 N‐1 N‐1 N No Unassessed7
Notes: 1. 11kV backup: Light backup is < 20% of peak load and medium backup is < 50% of peak load. 2. All buildings containing switchgear have been assessed for earthquake resilience as a priority. All other substation buildings will be assessed
in the coming year. Buildings under 67% of the National Building Standards (NBS) are considered an earthquake risk. Buildings below 34% are earthquake prone and have a high risk of failure.
3. During the dairy season the Te Waireka load is above the N‐1 capacity predominantly on weekdays during milking times (7:00‐9:00am and 3:30‐5:00pm).
4. The load at Borough zone substation is above the N‐1 capacity for periods during the winter months. 5. Only the secondary bus at Waitete is fully backed up. The primary bus cannot be fully backed up by the secondary bus. 6. Kuratau is currently N security due to the failure of one transformer. 7. The substation building at Taharoa is owned and maintained by Taharoa Ironsands Ltd.

Network Assets | 41
3.5 Zone Substation Power Transformers
3.5.1 Summary of Power Transformers
Power transformers are primary plant used to feed power to or from our distribution network. The following table provides a general overview of our power transformers. The three categories are based on manufacturer as each has a different risk profile. The manufacturing defects that prompt this split are detailed further below.
Table 3.5.1: Power transformer overview
Description Alstom ETEL Other
Quantity 6 6 25
Average Age (Years) 17 7 45
Expected Life (Years) 50 30 70
3.6 Sub-transmission 33kV Switchgear
3.6.1 Summary of Sub‐transmission Switchgear
TLC has 249 sub‐transmission switches. Some of the assets are located in zone substations and others are in the field on sub‐transmission lines. The switch ages and condition vary and they are renewed when no longer serviceable.
Table 3.6.1 Sub‐transmission Switchgear Assets and Location
Description Field Zone Subs Total
Air Break Switches 68 60 128
Circuit Breakers 5 49 54
Fused Links 6 4 10
Load Break Switches 1 1
Reclosers 7 3 10
Solid Links 30 12 42
Transformer Fuses 3 3
Total 116 133 249
3.7 Support Structures: Poles
3.7.1 Summary of Poles
TLC has 34,548 poles supporting its overhead line network. These are a mix of concrete, hardwood, softwood and iron rail. Most of the pole assets are pre‐stressed concrete.
Table 3.7.1 Pole Population by Network Configuration and Pole Type
Network Population Pole Material Description
Sub‐transmission Line (33 kV)
3,690 Pre‐stressed concrete Mass reinforced concrete
Hardwood Softwood
Most of the poles supporting 33kV conductor are pre‐stressed concrete. The population only includes the poles that support 33kV overhead conductor, with no additional under built lower voltage conductors.
Distribution Line (11 kV)
25,735 Pre‐stressed concrete Mass reinforced concrete
Over 60% of poles supporting 11kV conductors are concrete, and the majority of them are pre‐

Network Assets | 42
Network Population Pole Material Description
Hardwood Softwood Iron Rail
stressed. Poles that have 33 kV conductor above the 11kV conductor and/or low voltage conductor under built are included in this group.
Low Voltage Line 5123 Hardwood Softwood Iron Rail
Most of our poles supporting low voltage overhead conductor are wooden poles.
Total 34,548
3.8 Support Structures: Crossarms
3.8.1 Summary of Crossarms
TLC has 51,156 crossarms in service, most of which are wooden.
Table 3.8.1 Crossarm by Network Configuration and Material
Network Population Description
Subtransmission Line (33 kV)
3,780
Distribution Line (11 kV) 33,352 About 99% are wooden.
Low Voltage Line 14,024
Total 51,156
The crossarm summary above includes bolted (no crossarm), steel crossarms and wooden crossarms.
3.9 Overhead Line Conductor
3.9.1 Summary of Overhead Conductors
TLC has 4036 km of overhead line conductor, with the majority being 3‐phase 11kV. However TLC has a substantial amount of 33kV (502 km) and 11kV Single wire Earth Return (SWER – 868 km) conductor, which are both proportionally higher than most NZ networks.
Table 3.9.1 Conductor Population
Overhead Conductors Line Length (km) Description
Sub‐transmission – 33 kV 502
Distribution – 11 kV 3 phase 2,217
Distribution – 11 kV SWER 868 Single Wire Earth Return systems (SWER) are single conductor lines. Two feeders (Tokaanu River and Pihanga) operate at 6.6kV to earth, all others operate at 11kV to earth.
LV 449
Total 4,036
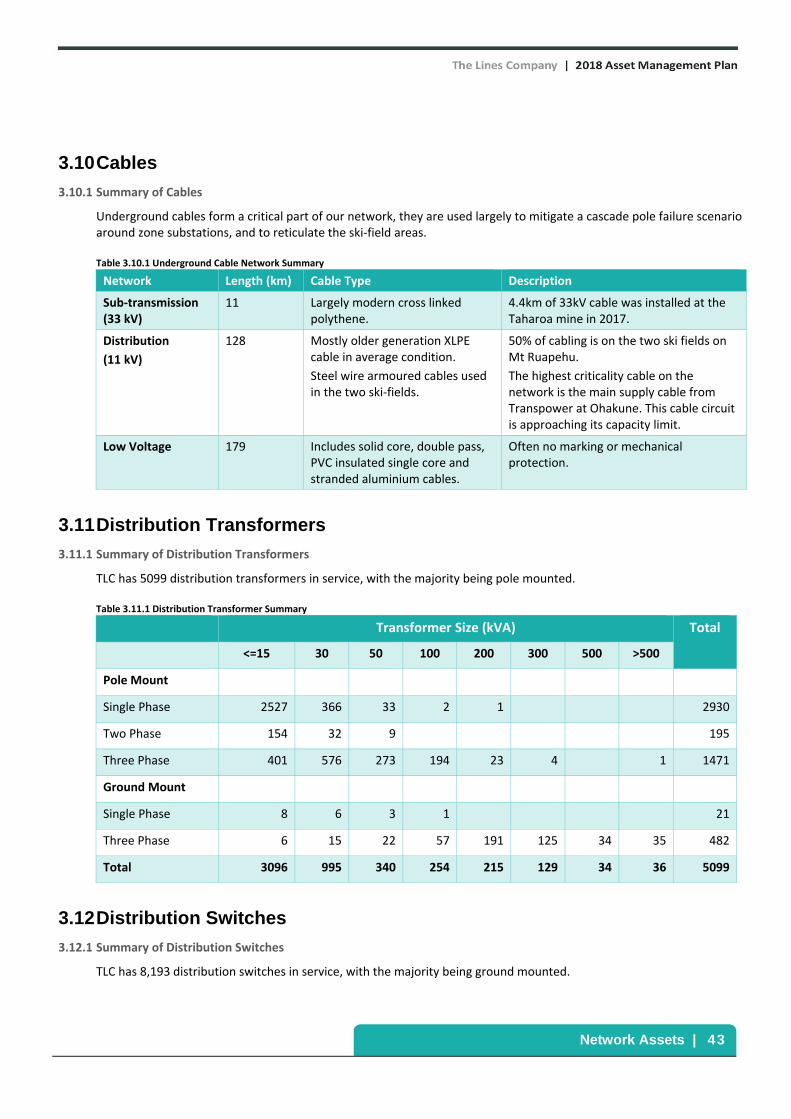
Network Assets | 43
3.10 Cables
3.10.1 Summary of Cables
Underground cables form a critical part of our network, they are used largely to mitigate a cascade pole failure scenario around zone substations, and to reticulate the ski‐field areas.
Table 3.10.1 Underground Cable Network Summary
Network Length (km) Cable Type Description
Sub‐transmission (33 kV)
11 Largely modern cross linked polythene.
4.4km of 33kV cable was installed at the Taharoa mine in 2017.
Distribution
(11 kV)
128 Mostly older generation XLPE cable in average condition.
Steel wire armoured cables used in the two ski‐fields.
50% of cabling is on the two ski fields on Mt Ruapehu.
The highest criticality cable on the network is the main supply cable from Transpower at Ohakune. This cable circuit is approaching its capacity limit.
Low Voltage 179 Includes solid core, double pass, PVC insulated single core and stranded aluminium cables.
Often no marking or mechanical protection.
3.11 Distribution Transformers
3.11.1 Summary of Distribution Transformers
TLC has 5099 distribution transformers in service, with the majority being pole mounted.
Table 3.11.1 Distribution Transformer Summary
Transformer Size (kVA) Total
<=15 30 50 100 200 300 500 >500
Pole Mount
Single Phase 2527 366 33 2 1 2930
Two Phase 154 32 9 195
Three Phase 401 576 273 194 23 4 1 1471
Ground Mount
Single Phase 8 6 3 1 21
Three Phase 6 15 22 57 191 125 34 35 482
Total 3096 995 340 254 215 129 34 36 5099
3.12 Distribution Switches
3.12.1 Summary of Distribution Switches
TLC has 8,193 distribution switches in service, with the majority being ground mounted.

Network Assets | 44
Table 3.12.1 11kV Distribution Switchgear and Control Assets
Switch Type Pole Mt Ground Mt Total
11kV Air Break Switches 554 554
11kV Circuit Breakers 66 131 197
11kV Fused Switches/Fused Links 907 74 981
11kV Load Break Switches 14 161 175
11kV Reclosers 133 1 134
11kV RTE Integrated Transformer Switches 68 68
11kV Sectionalisers 76 76
11kV Solid Links 536 536
11kV Transformer/Tap‐off Fuses 5,469 3 5,472
Total 7,755 438 8,193
3.13 Secondary Assets
Table 3.13 provides a summary of TLC’s secondary assets
Table 3.13 Secondary Assets Summary
Secondary Assets
Regulators TLC has 71 voltage regulators. The majority of the sites have two relatively new single‐phase regulators operating in open delta to give +10% regulation.
Protection Relays Devices fitted with protection relays fall into a five yearly inspection programme. Older style electromechanical relays are being changed out to electronic relays where required with switchgear upgrades. Where possible Arc Flash detection is included.
Ripple Injection Systems TLC operates two generations of ripple systems. One in the southern part of the network (317Hz Decabit) and a combination of new (317Hz Decabit) and old (725Hz Semagyr) in the north.
The 725 Hz system is being phased out as meters around the network are replaced with smart meters that have internal ripple control capabilities. The 725 Hz ripple control transmitters are decommissioned as the meter installation programme is concluded in each 11kV zone in the northern network.
SCADA System TLC network uses a Lester Abbey central control system and RTUs to automate our 27 zone substations and other assets essential to maintaining network performance.
Data Communication The UHF data communication system consists of a head end and 12 repeater sites (excluding individual RTU radios) using both analog and digital technology operating on two channels.
Voice Radio Equipment A frequency modulated voice communication system consisting of six repeaters, linking equipment and radios in the mobile fleet is owned and operated by TLC.
Mobile Emergency Generator and Injection Transformer
TLC owns a mobile generator, protection transformer, and circuit breaker capable of injecting into the 11kV network under emergency or shutdown conditions

Network Assets | 45
Secondary Assets
Mobile Capacitor Banks TLC has an 11kV mobile capacitor bank and four fixed capacitor bank units that are rated at 1MVAr.
Metering Assets TLC, through a subsidiary company (FCL), owns the majority of customer meters and relays. It also owns interconnection metering assets at Whakamaru, Mokai and Tangiwai.
3.13.1 Asset Data Accuracy
Data accuracy varies across the asset base and is steadily being refined and improved as both inspections and work are completed on the network.
It is estimated that accurate distribution and sub‐transmission line condition data is held for around 80% of the network, with this information having been gathered as part of the line inspection programme which has been running for the past 14 years. The level of accuracy held on low voltage lines remains low as the focus remains on gathering information on and improving the performance of the distribution and sub‐transmission networks.
Age‐related data is uncertain across a number of asset classes largely as a result of the various changes in ownership over time. This sees a number of assets identified with a default commissioning date of 1980. As condition data and subsequent risk assessments become more mature the age data will be of less relevance for managing the ongoing life cycle of the assets.

Approach to Asset Management | 46
Approach to Asset
Management
Approach to Asset Management | 47
4. Approach to Asset Management Chapter Overview
This chapter explains our asset management policy and process. It sets out how we translate our business strategy and objectives into our day‐to‐day investment and operational decisions ensuring effective line of sight between business goals and asset management practice.
TLC is transitioning its asset management approach to align with the ISO 55000 framework. As part of this an assessment against the requirements of ISO 55001:2014 was conducted and alignment with a four pillar interpretation of that standard has been adopted as summarised below:
• Leadership and Enablement of the asset management approach which is aligned with TLC’s business objectives and meets the requirements of both external and internal stakeholders.
• Asset Planning ‐ a detailed end‐to‐end planning process across the asset portfolio which commences with risk profiling of the assets through options analysis in the Capital Plan.
• Business Processes – well‐defined quality processes for the delivery of CAPEX and OPEX work to the assets along with other tasks such as switching, investigations, materials supply and so forth. The intent is to reduce the cost of work through quality management, assure consistency of approach and promote the competency of all teams involved with service delivery.
• Continual Improvement – consistently improving asset management processes as well as determining future options for network resilience and reliability.
4.1 Asset Management System
The TLC Asset Management System is shown overleaf as a structured framework with multiple functions which work with each other to deliver the asset management pillars listed above. Implicit to this framework is a quality management approach based on ISO 55001, leading to continual improvement to reduce the overall cost of asset ownership, as well as manage risk within defined risk appetites. Figure 4.1 shows our current asset management process. This will further evolve over time as TLC continues to develop its people, processes and systems to strengthen its alignment with the ISO 55000 methodologies.

Approach to Asset Management | 48
Figure 4.1: Our Asset Management System

Approach to Asset Management | 49
4.2 Asset Management Policy
Our Asset Management Policy sets out high level asset management principles that link our Company Strategic Framework to our Asset Management Objectives.
The Lines Company Asset Management Policy
Leadership and Enablement
1. Safety is our highest priority with a proactive approach to the safety of all personnel who work on our
network, our communities who live, work and play near our network, and our customers who use electricity
from our network.
2. Asset management is how we realise sustainable value for our shareholder, community and customers
through balancing the opportunities, risks and costs against the desired performance of our physical assets.
3. Asset management will be delivered by an informed leadership who communicate to and engage with
external and internal stakeholders to ensure an efficient approach which is cognisant of both current and
future requirements of those stakeholders and the company.
Asset Planning
4. We will provide services that meet our customers’ needs including minimising planned network outages,
reducing unplanned outages and delivering electricity to our customers at an efficient price through planning
and scheduling the work in advance.
5. We focus on maintaining network reliability at the least possible life cycle cost, addressing an ageing asset
base and low population densities.
6. Asset planning will consider options other than capital replacement to address issues associated with
compliance, condition and performance.
7. We will seek out and implement new and emerging technology where a demonstrable benefit in cost, risk or
performance is determined.
Business Processes
8. Delivery of work on our network assets will be enhanced with commitments to quality, competency of teams
and efficient processes.
9. Service level performance will be enhanced through effective work management processes and
communication with customers and other stakeholders.
10. Our asset management approach will be supported by an integrated management system which supports
other important functions across the company.
11. We will enhance the quality of the information held on our assets through targeted inspection programmes
and appropriate use of technology to assist in analysis.
Continual Improvement
12. Network services will be monitored continually and this information used to determine future asset renewal
work.
13. We will continually enhance our community reputation through ongoing improvements in services and in
cost versus risk management of the network.
14. We will collaborate with our industry peers and partners drawing on their experience and expertise to
improve the performance of our network.

Approach to Asset Management | 50
4.3 Asset Management Objectives
Table 4.3: Asset Management Objectives
Asset Management Policy Area Asset Management Objectives FY19‐FY21
Leadership and Enablement
Safety is our top priority
Asset management is how we realise sustainable value from the physical assets
Asset management will be delivered by an informed leadership
1. Safety specifications are clear
2. Operational targets are defined
3. Cost control processes are defined
4. Appropriate work practices and design standards are provided to assure power quality and minimise security risk
5. Capital planning processes are defined
6. Asset requirements to achieve our license to operate are clear and incorporated into project, operating and maintenance processes
7. Asset management‐relevant community, environmental and sustainability safeguards and obligations are clear
Asset Planning
Our customers’ experience will be enhanced
We are focused on maintaining network reliability at the least possible life cycle cost
Asset planning will consider options other than capital replacement
We will implement new and emerging technology where these provide advantages
8. Safety integrated into design, asset specifications and work planning
9. Credible long term budgets are developed based on information about the operations and the assets
10. Asset planning is optimised for life cycle cost and operational performance
11. Optimal supply and risk to power quality and security is a planning consideration
12. Capital work planning considers business case targets and is optimised for life cycle cost and resources
13. Asset planning outcomes are consistent with the requirements of the ’license to operate’
14. Asset work planning considers environmental standards and obligations
Business Process
We will deliver quality work through competent teams and efficient processes.
Service level performance will be met or exceeded
Our asset management approach will be supported by an integrated management system
15. Capital investment is consistent with the approved long‐term budgets
16. Work is timely and within budget
17. Faults and risk to network reliability are managed to reduce unplanned interruptions
18. Capital work is undertaken as per plan with effective management of contingencies to address risk to cost, quality and the design outcome
19. Work is planned for effective use of resources
20. Asset‐specific sustainability safeguards and community engagement steps are incorporated into the work delivered
Continual Improvement
Network reliability and quality of supply will be continually monitored
21. Safety performance is measured
22. Operational performance including customer satisfaction and on‐time fault response is measured and reported

Approach to Asset Management | 51
Asset Management Policy Area Asset Management Objectives FY19‐FY21
We will continually enhance our community reputation
We will collaborate with industry peers and partners
23. Expenditure is monitored and budget compliance reported
24. Faults measured and asset‐related incidents correlated with asset condition and work history
25. Capital projects are assessed for compliance to the business case targets, cost control and performance
26. Compliance of work and asset performance to the license to operate is measured and reported
27. Breaches of asset‐induced environmental protection and non‐compliances in environment and sustainability audits are reported along with their level of severity
4.4 Asset Management Accountabilities
Asset management is a multi‐level process involving governance, management and execution for many areas of the business. Table 4.4 shows the accountabilities across the TLC business as they relate to the asset management process.
Table 4.4: Asset Management Accountabilities
Role Accountability
Board Set strategic direction of business
Approve and monitor risk appetite and associated risk management framework
Review and approve Asset Management Plan (AMP) and associated budgets Chief Executive Develop and implement Business Plan
Enable delivery of AMP outputs GM Network Development
Develop and implement Asset Management Framework
Produce annual AMP
Manage and monitor delivery of AMP outputs. Asset Strategy Manager
Assess feedback on asset health and performance which need to be addressed in the AMP and/or require updates of the asset class strategies
Review and rationalise risk ranking of issues and proposed work in the AMP
Determine requirements for capitalised maintenance and major asset renewals
Schedule a pipeline of project work to be prioritised, planned and scheduled
Develop budget estimate for the short‐term work from the AMP
Refine scopes of work and cost estimates
Annual scheduling of major work Asset Engineers Define criteria for monitoring of asset health, risk and performance
Specify equipment and installation standards for assets
Develop the preventive maintenance schedule of asset surveillance. Determine feedback requirements and trigger points on asset condition
Monitor equipment condition following maintenance inspections and advise when remedial action or renewals should take place
Network Performance Engineer
Address load constraints and risks to voltage compliance across the network
Develop strategies to reduce unplanned SAIDI
Planning for network growth
Scenario analysis to consider impact of disruptive technology on the network Commercial Manager Profile and budget for expected customer driven growth
Engage with major customers on scheduled future work Asset Information Manager
Manage of the AMP information systems
Report on risk and cost profiles within the AMP
Report the preventive maintenance schedule in the asset information system

Approach to Asset Management | 52
Role Accountability
Manage asset condition data Manager, Network Services
Detailed plans of work packages from the AMP
Deliver project work
Deliver the preventive maintenance schedule
Collect condition data and feedback on faults response plus other repairs
4.4.1 AMP Governance
Asset Management decisions are authorised according to The Lines Company’s delegated Financial Authority Policy, which defines the capital and operational expenditure limits of the Senior Leadership Team. Separate limits are defined for budgeted and unbudgeted expenditure. Any expenditure that exceeds these limits in sum is submitted to the Board of Directors with a business case for separate consideration and approval.
The asset management capital and maintenance programmes are reported to the Board of Directors by the Senior Leadership Team each month, with explanatory notes on deviations from plan.
4.5 Risk Management
Risk management is a fundamental asset management discipline. It requires robust processes in place to assess and manage all business‐related risk. We are transitioning our risk management processes to align with ISO 31000:2009 commencing with Tier 1 as detailed below.
Risk is defined as the effect of uncertainty on the ability of an organization to meet its objectives. The purpose of a risk management framework is to actively apply risk treatment options so that the TLC can ensure any uncertainties of meeting its objectives can be avoided, reduced, removed, or managed.
4.5.1 Tier 1 Risk Management Framework
Tier 1 risks are those risks that are visible to the Board with accountability for managing them assigned to a Senior Leadership Team member. The Board is involved in setting the company risk appetite for each type of risk identified.
Risk identification and evaluation encompasses assessment of the following areas:
• People safety and resource availability.
• Stakeholder confidence/reputation; environmental and cultural (Ngā taonga tuku iho nō ngā tūpuna) preservation.
• Commercial/financial sustainability.
• Performance of core services.
• Regulatory.
Following identification of the risks, strategies and processes to manage risks in line with the business’ risk appetite are implemented. These efforts are supported by a comprehensive risk monitoring and reporting regime with visibility provided to the Board Audit and Risk Committee on a bi‐annual basis and any changes to tier 1 risks reported to the Board as part of regular Management reporting.
4.5.2 Tier 2 and 3 Risks
Tier 2 and 3 risks are currently managed within individual business units in a manner that best reflects the needs of the business unit. Over the coming year, tier 2 and 3 risks will be aligned with the tier 1 risk framework across the company. This will enable a consistent approach to managing risks and the ability to identify common and cascading risks to ensure that they are managed appropriately.
Detailed asset‐related risk is currently considered at both tier 2 and 3 levels and is used as a means to prioritise activity developed as part of the asset management process. The assessment methodology is further detailed in Section 4.6.5.

Approach to Asset Management | 53
4.6 Life Cycle Management
Management of our assets is based on taking a whole of life approach to asset management. Our interpretation of the life cycle is shown in Figure 4.6:
Figure 4.6: Asset Life Cycle Process
A detailed description of TLC’s asset life cycle management is provided in the following sections.
4.6.1 Plan
Planning is the process of identifying specific network requirements that will deliver stakeholder expectations for service and price, investigating options and authorising expenditure.
Our capital project planning and acquisition process consists of the following steps:
Needs Identification
There are three broad categories to our planning: asset renewals, network development (to address growth and security requirements) and customer required work.
Asset Renewals
Needs identification for asset renewal planning uses the information gathered from condition, reliability and risk assessments. This sees assets that have been identified as approaching end of life, or having a high safety risk, scheduled for renewal. An assessment is made as to the scope of the renewal which may comprise refurbishment, overhaul or outright replacement.
Network Development
Monitoring and modelling of network performance and customer load use patterns drives investment planning for network development purposes. This assessment takes a medium to long‐term view of network requirements to ensure that performance remains within statutory limits and that incremental growth due to changes in population and network configuration are able to be accommodated with minimal impact. Asset relocation for improving security or quality of supply is also included in this category.
Customer Required
Customer required work is usually initiated by a major customer due to establishment of a new plant or a change in the electricity requirements of an existing plant. Agreement is reached with the customer as to how to fund this development, which may see a full or partial capital contribution from the customer and any additional funding requirements being met through ongoing connection charges.

Approach to Asset Management | 54
Prioritisation
Prioritisation of asset renewal and network development projects is carried out based on risk assessment outlined in in Section 4.6.5, which includes asset related risks and business related risks. This process analyses consequences including safety, loss of load or loss of security and a likelihood of occurrence. It also considers alignment with TLC’s corporate and asset management objectives. Prioritisation of customer required projects is based largely on the timing requirements of the customer. Once the assessment process is complete a ranked list of capital projects is produced.
Development of Proposals
Proposals for identified capital projects are developed to ensure all requirements are identified and incorporated into the planning process and that financial approval is gained in line with company delegated authorities.
The development process includes the following:
• Scope technical and performance requirements.
• Identify any project pre‐requisites (e.g. land access, consenting, design and procurement lead times).
• Consider alignment with other projects to minimise cost out outage impacts.
• Consideration of the use of standardised designs or asset types to minimise lifecycle costs.
• Consideration of alternative options, including non‐network options, if these present lower cost outcomes.
• Schedule projects across the planning period (10 years).
• Where projects are identified for years 1‐3 more detailed planning (Design & Construct) commences.
Financial and Outage Budgeting
Financial budget is based on a combination of historical project information and estimation of costs through TLC’s Network Services business unit. Following the development of proposals cost estimates for projects are co‐optimised with outage availability. This is to ensure that an optimal point is met between the cost of delivering the project and the outage impact that it will have when the work is carried out.
This includes:
• Phasing planned outages to ensure they are executed at the optimal time of year (consideration is given to weather patterns, land access, dairy season and historical outages).
• Use of generators to reduce customer outages (cost versus outage co‐optimisation).
• Additional resourcing to reduce the time associated with a project outage.
Formation of Annual Capital Plans
The outputs from the preceding stages that result in projects in year 1 are consolidated and assessed at a Management and Board level to ensure that all identified risks have been managed within the company’s risk appetite. Once complete the capital spend is confirmed.
Detailed planning for execution of project work then commences.
4.6.2 Design and Construct
Design and construct is the implementation of the planning process through works delivery.
Design
In‐house design capability is maintained for line‐related works. New lines are designed to AS/NZS7000. Minor design changes to other asset classes are carried out by internal engineering staff where resource and skillset allows. Major projects on asset classes other than lines and pole mounted equipment are completed by external parties. The impact of any changes to design or introduction of new equipment are assessed by engineering staff

Approach to Asset Management | 55
as part of the design review process. Soil condition and climate impact on assets are assessed in the design phase.
Construct
Line‐related construction activity is carried out by the Network Services business unit with support from key contractors where needed to manage resource or outage constraints. Network Services also carries out minor project works where their skillset and resource allows.
Major projects (e.g. construction or renewal of zone substations) are outsourced either as a design and build package or design is completed by specialists with construction contracted out separately.
Project‐related work is usually managed using the internal project management team to ensure that TLC stakeholder and technical and commercial requirements for work completed are met.
4.6.3 Operate and Maintain
Operate and maintain means that TLC operates the network and assets in such a way as to deliver the service levels sought by customers and effectively maintain the equipment and network through defect identification and planned maintenance activities. Network operations and our approach to maintenance are detailed in Section 6 and summarised below:
Preventive Maintenance
Preventive maintenance is predominantly time or operating cycle‐based maintenance. It involves the collection of operational and asset condition information through site inspection, asset routine service and asset condition tests. TLC’s preventive maintenance strategy provides essential information about the health of the assets, reducing preventable defects and meet all statutory obligations.
Our preventive maintenance schedule ensures that routine work is scheduled as required to ensure TLC’s assets meet all performance requirements and remain compliant with regulations. The schedule is defined by, and managed in accordance with, the strategy approved by the asset engineers and budgeted in the annual works plan.
Reactive Maintenance
TLC’s reactive maintenance comprises fixing defects identified from preventative maintenance inspections and fault response. Focused primarily on fault response, reactive maintenance makes up the largest proportion of our maintenance by spend. The majority of the reactive maintenance spend is driven by external factors (generally weather, vegetation and third party‐related events) rather than a high rate of asset failure. The balance between preventive and reactive maintenance is monitored on an ongoing basis to ensure the network performance is maintained to target levels in the most cost efficient manner.
Maintenance Scheduling
Preventive maintenance activities are scheduled annually and are based on the current understanding of asset condition and performance requirements for the planning period. These activities are incorporated into the annual works plan. Planned maintenance activities are scheduled such that they do not create resource or outage constraints during peak work times, which often sees this work carried out during winter when land access for line renewal work is constrained.
Financial and Resource Budgeting
An allowance for both cost and resource for corrective maintenance is made in the annual planning process. This is based on historical requirements and as noted above is driven largely by weather, vegetation and third party events.
4.6.4 Assess Asset Condition and Risk: Renew or Dispose
Asset condition assessment is the process of identifying assets which meet the end of life criteria and to decide when to renew and/or dispose of assets.
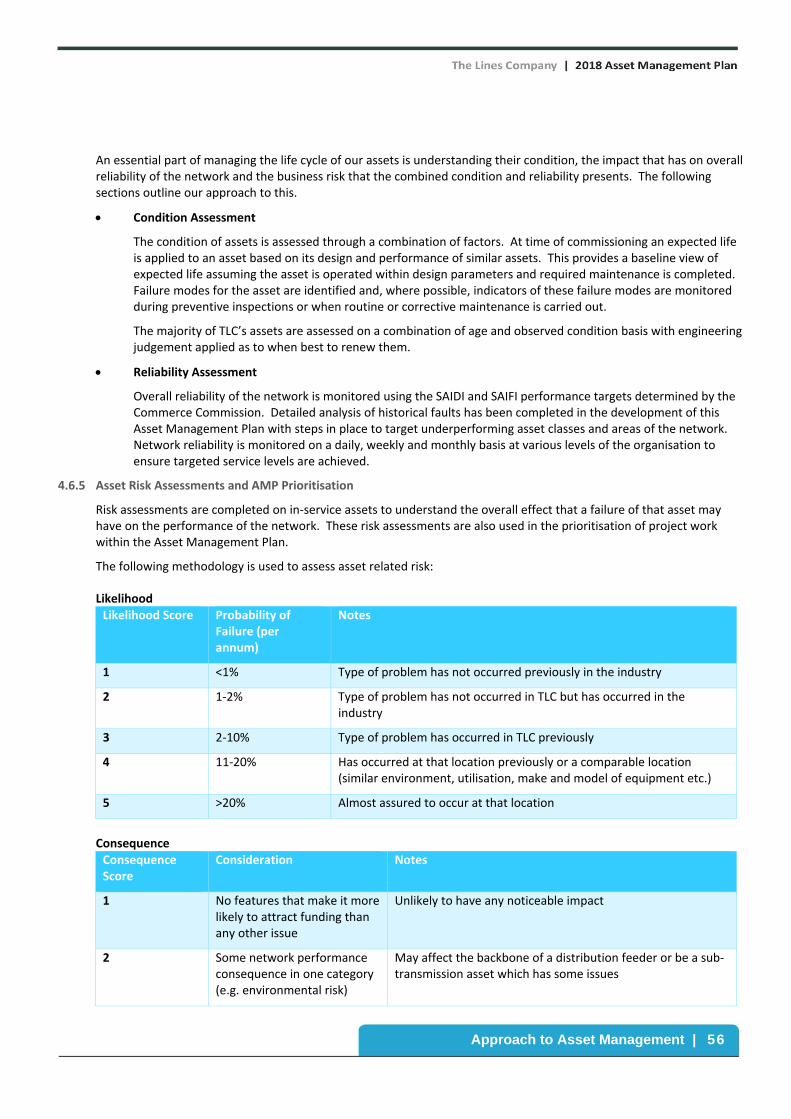
Approach to Asset Management | 56
An essential part of managing the life cycle of our assets is understanding their condition, the impact that has on overall reliability of the network and the business risk that the combined condition and reliability presents. The following sections outline our approach to this.
Condition Assessment
The condition of assets is assessed through a combination of factors. At time of commissioning an expected life is applied to an asset based on its design and performance of similar assets. This provides a baseline view of expected life assuming the asset is operated within design parameters and required maintenance is completed. Failure modes for the asset are identified and, where possible, indicators of these failure modes are monitored during preventive inspections or when routine or corrective maintenance is carried out.
The majority of TLC’s assets are assessed on a combination of age and observed condition basis with engineering judgement applied as to when best to renew them.
Reliability Assessment
Overall reliability of the network is monitored using the SAIDI and SAIFI performance targets determined by the Commerce Commission. Detailed analysis of historical faults has been completed in the development of this Asset Management Plan with steps in place to target underperforming asset classes and areas of the network. Network reliability is monitored on a daily, weekly and monthly basis at various levels of the organisation to ensure targeted service levels are achieved.
4.6.5 Asset Risk Assessments and AMP Prioritisation
Risk assessments are completed on in‐service assets to understand the overall effect that a failure of that asset may have on the performance of the network. These risk assessments are also used in the prioritisation of project work within the Asset Management Plan.
The following methodology is used to assess asset related risk:
Likelihood Likelihood Score Probability of
Failure (per annum)
Notes
1 <1% Type of problem has not occurred previously in the industry
2 1‐2% Type of problem has not occurred in TLC but has occurred in the industry
3 2‐10% Type of problem has occurred in TLC previously
4 11‐20% Has occurred at that location previously or a comparable location (similar environment, utilisation, make and model of equipment etc.)
5 >20% Almost assured to occur at that location
Consequence Consequence Score
Consideration Notes
1 No features that make it more likely to attract funding than any other issue
Unlikely to have any noticeable impact
2 Some network performance consequence in one category (e.g. environmental risk)
May affect the backbone of a distribution feeder or be a sub‐transmission asset which has some issues

Approach to Asset Management | 57
Consequence Score
Consideration Notes
3 This issue has been assessed as significant in more than one consequence category (e.g. loss of supply to customers, financial, environment etc)
Likely to have a significant impact on network performance as well as safety, compliance or environmental
4 High level of network performance consequence
May result in a widespread interruption to critical load or long duration of many hours to affected customers.
5 A consequence of high in more than one category
Urgent review is carried out to see whether this work should be expedited.
Detectability Detectability Score
Consideration
1 Will always detect the failure before it occurs
2 High probability of detecting the failure before it occurs. Preceded by a warning most of the time
3 Moderate probability of failure before it occurs. Around 50% likelihood of getting a warning
4 Low probability of detecting a failure before it occurs. Always occurs with little or no warning
5 Remote probability of detecting a failure before it occurs. Always occurs without warning
Mitigation Mitigation Score Consideration
100% The proposed solution will completely resolve the issue and no further work will be needed within the foreseeable future
80% It is likely that further work will be needed in 5‐10 years
40% It is likely that further work will be needed in 2‐5 years
20% There is a high likelihood that further work will be needed within the next two years
The ratings above are combined to provide three metrics, which are used both to determine asset risks profiles and planned project values.
Metrics Metric Description Calculation
Inherent Risk The current risk Likelihood X Consequence X Detectability
Residual Risk Remaining risk once mitigation work is completed Inherent Risk – (Inherent Risk X Mitigation)
Project Value Assessment of the effectiveness of any project work carried out to address the risk
Inherent Risk – Residual Risk
All other things being equal, the higher the project value the more priority that will be given to the proposed work within the AMP.

Approach to Asset Management | 58
Future Risk Modelling
Advanced asset risk modelling is required to fully develop a risk‐based long‐term investment plan. The purpose of such modelling is to provide a credible means to calculate current and predicted future asset probability and consequence of failure in a consistent and systematic manner, and to use this to determine the optimal timing for asset replacement. We have started this process using an asset risk modelling framework which is described below, and have achieved some preliminary results. We plan to continue to develop this work in the coming year.
An Asset Risk Management Model (ARMM) for poles, crossarms and conductors for the distribution network has been developed to indicate which poles, crossarms and conductor sections should be replaced and when to replace them. ARMM is developed based on the principles and calculations outlined in Ofgem Common Methodology2. The essential outcomes of the modelling are asset health indices and risks determined for the individual assets.
Health index (HI) is an asset health score with a continuous scale between 0.5 and 10 where a HI of 0.5 means the asset is in ‘as new’ condition with a very low probability of failure, whereas a HI of 10 means it is at the end of its life with a high probability of failure.
Risk of an asset is calculated based on its probability of failure, criticality factor and average consequence of failure on the dimensions of safety, environmental, network performance and financial.
The interpretation of the asset health index is provided in the table below.
Table 4.6.5: Interpretation of Asset Health Indices
Condition Health Index
Remaining Life Probability of Failure
Good 0‐1 >20 years Very Low 1‐2 2‐3 3‐4
Fair 4‐5 10‐20 years Low 5‐6 6‐7
Poor 7‐8 5‐10 years Medium ‐ High 8‐9
Bad 9‐10 < 5years High 10+ Should have
been replaced Very High
Asset health indices are determined through a comprehensive process based on asset make and type, material, operating environment, age and condition. The probability of failure is derived for individual assets from the HI and the performance of the asset class.
Asset HI profile of TLC pole asset class is shown below based on our current data set. We intend to progress this analysis over the forthcoming 12 months to project the HI profile in 10 years, both without maintenance and renewal, and with defined intervention strategies. Forecasting the future condition and performance of an asset class in this way will enable TLC to verify its long‐term investment requirements to achieve a targeted level of performance.
2 The DNO Common Network Asset Indices Methodology (Common Methodology) published by the UK Ofgem as an open source for electricity network companies to assess asset
health and criticality. It is adopted across all Great Britain DNOs for assessment, forecasting and regulatory reporting of asset risk.

Approach to Asset Management | 59
Figure 4.6.5: Health Indices Profile of Distribution Poles
4.7 Information Systems
4.7.1 Systems Overview
To assist in managing our assets TLC operates four core Information Technology platforms:
BASIX Asset Management.
Navision Financial System.
Gentrack Billing Management.
ESRI GIS Platform.
Key information is exchanged between three of these systems automatically as demonstrated in a simplified format in Figure 4.7.1. The ESRI GIS platform currently operates independently of these systems.
Figure 4.7.1: Overview of System Layout and Interaction
4.7.2 BASIX
BASIX is our core asset management system and used as a tool to support and provide information for our asset management processes and planning. It contains asset data and is used to calculate reliability statistics and regulatory valuations. It also produces reports that align with the network performance criteria.
The system comprises various modules including:
Asset Register.
Works Management.
0
1,000
2,000
3,000
4,000
5,000
6,000
7,000
(0-1) (1-2) (2-3) (3-4) (4-5) (5-6) (6-7) (7-8) (8-9) (9-10) (10+) NoResult
Num
ber
of P
oles
Category
Year 0 Health Index

Approach to Asset Management | 60
Outage and Reliability.
Reporting.
Annual Planning.
Assets are organized into a hierarchy allowing both vertical (e.g. feeder or substation) and horizontal (asset class, e.g. distribution transformer) analysis and reporting.
The asset register is used to access the network data and is broken down into:
Lines.
Installations.
Zone substations.
Transformers.
Switchgear.
Protection and Control.
Network Model.
Property.
Batteries.
SCADA and Radio.
Details of proposed projects that result from the Asset Management Planning process are entered into the annual planning section of the BASIX database providing an ongoing reference and ability to track progress against plan in a structured manner. Financial forecasts are then extracted from the database for AMP and disclosure purposes.
4.7.3 Navision
Navision is the company’s financial system and is also used by the Network Services business unit to track and record costs associated with work carried out for the network and external customers.
4.7.4 Gentrack
Gentrack is the customer billing system. This system will be replaced with the Agility CIS as part of the change to the new Time of Use pricing.
4.7.5 ESRI Geographical Information System (GIS)
The ESRI GIS system primarily records geographical information for TLC’s assets. The system is currently stand alone and is used to identify where assets currently, or may in the future, impact property owners. Investigation is underway to evaluate the benefits of linking the information stored within the GIS system to that held in BASIX to provide a spatial representation of network performance.
4.8 Business Continuity Planning
TLC manages business continuity risk through implementation of an Incident Management Framework. The framework is based on Civil Defence Co‐ordinanted Incident Mangement System (CIMS) and uses the “Four Rs” of emergency preparedness Reduction, Readiness, Response and Recovery.
The Incident Management Framework identifies a Duty Manager who acts as Incident Controller during an incident or emergency event. If necessary an incident management team will be established to ensure that any public and staff safety risk is minimised and that our obligations as a lifeline utility are able to be met with minimal interruption to supply.

Approach to Asset Management | 61
Reduction of business risk is managed through the organisational risk framework detailed in Section 4.4.15. This sees risk management plans implemented to reduce either the likelihood and/or consequence of an event occurring that would have a negative impact on the business. At an asset level, risk is managed through ongoing monitoring, maintenance and renewal of assets as determined in the asset class strategies and this Asset Management Plan.
Readiness for an emergency event is covered at multiple levels through the organisation. The Incident Management Plan provides a generic emergency management work which includes:
• Defined responsibilities for readiness and for response – in particular for incident controllers who are required to co‐ordinate emergency response activities during an event.
• Background and reference information.
• Contact details for internal and external parties and key stakeholders.
• Communication systems, options and protocols.
A number of specific incident response guides are either developed or under development as detailed below:
Serious injury/fatality.
Significant threat to employees.
Environmental incident.
Medical emergency.
Building relocation.
Cyber security breach or IT system failure.
Earthquake.
Volcanic eruption.
Major storm activity.
Significant asset failure.
Network event.
Pandemic.
Desktop emergency exercises are conducted to give staff exposure to the incident management framework and identify any areas of improvement required in either business process or field response during an emergency.
Staff are also encouraged to ensure they and their family are prepared for major natural disasters.
Response to an event is determined depending on the cause and extent. The Incident Management Plan makes provision for establishment of a small incident management team for local events, network event management teams in the event of a major network incident, and a full incident response team involving the Board should it be deemed necessary by the Incident Controller.
Following any activation of the Incident Management Plan an event review is conducted with any learnings incorporated into the Incident Management Framework for use during future events.
Recovery following an incident is managed on a case‐by‐case basis with input from appropriate levels within the organisation as required.

Capital Project Planning and Delivery | 62
Capital Project
Planning and
Delivery
Capital Project Planning and Delivery | 63
5. Capital Project Planning and Delivery Chapter Overview
This chapter explains our approach to planning our network capital investment and provides a summary of the Capex for the next ten years.
5.1 Capital Project Portfolio and Investment Drivers
Our capital projects contribute to the long‐term reliability of our network and supply security as well as risk mitigation. There are three portfolios in our capital projects:
Asset renewal.
Network development.
Customer required work.
Asset renewal projects address areas of asset condition related risk, safety and environmental issues and potential load loss. The investment covers asset renewal and refurbishment.
Network development projects provide additional asset capability to cater for growth and to maintain supply security. These projects also provide improvements that enable greater network automation and improved quality of supply.
Customer required projects are driven by customer specific needs but may also trigger investment in upstream assets to increase system capacity to support that demand.
TLC considers business drivers in capital investment planning and categorises the investment expenditure as per disclosure requirements. The table below shows the association between investment category in disclosure and TLC’s business driver and capital project portfolio. Often one business driver is associated with multiple investment categories and appears in more than one project type.
Table 5.1: Capital Expenditure Portfolio
Portfolio Investment Category (Commerce Commission)
Business Drivers
Asset Renewals Asset replacement and renewal
Reliability, safety and environment
Non‐system fixed assets – atypical
Non‐system fixed assets ‐ routine
Equipment renewals Hazardous equipment Safety
Network Development System growth
Quality of supply
Reliability Security of supply
Customer Required Consumer connection
Asset relocations
Cumulative capacity
5.1.1 Deferral of Investment
TLC has undertaken several innovations that defer asset replacements by easing network constraints.
These include:
Mobile power factor correction capacity banks; which are a bank of capacitors mounted on a trailer that can be deployed across the network at short notice to support network constraints during faults or outages.
Extensive deployment of load control technologies that enables shedding of up to 16MW (25% of our coincident GXP demand) at critical times.

Capital Project Planning and Delivery | 64
5.2 Asset Renewals
5.2.1 Overview
Asset renewals are to address issues representing the highest risks to safety, environmental and network performance for now and the future, and to replace them through the planning period.
5.2.2 Power Transformer Renewals
TLC has 38 Power transformers located at its zone substations that convert 33kV sub‐transmission voltage to 11kV for TLC’s distribution network.
5.2.3 Power Transformer Age Profile
The age profile of TLC’s power transformer assets is summarised below:
Figure 5.2.3: Age of TLC Power Transformers
5.2.4 Power Transformer Condition
Condition of the transformers is largely determined by visual inspection externally, dissolved gas analysis of the transformer oil internally and other electrical tests when the transformers are undergoing maintenance. TLC has three ETEL and two Alstom transformers that are being overhauled due to abnormal deterioration.
0
1
2
3
4
63 57 56 59 54 53 52 51 49 47 39 26 24 22 17 16 11 10 9 8 7 6 4 1
Number of Transform
ers
Age (Years)
Alstom ETEL Other
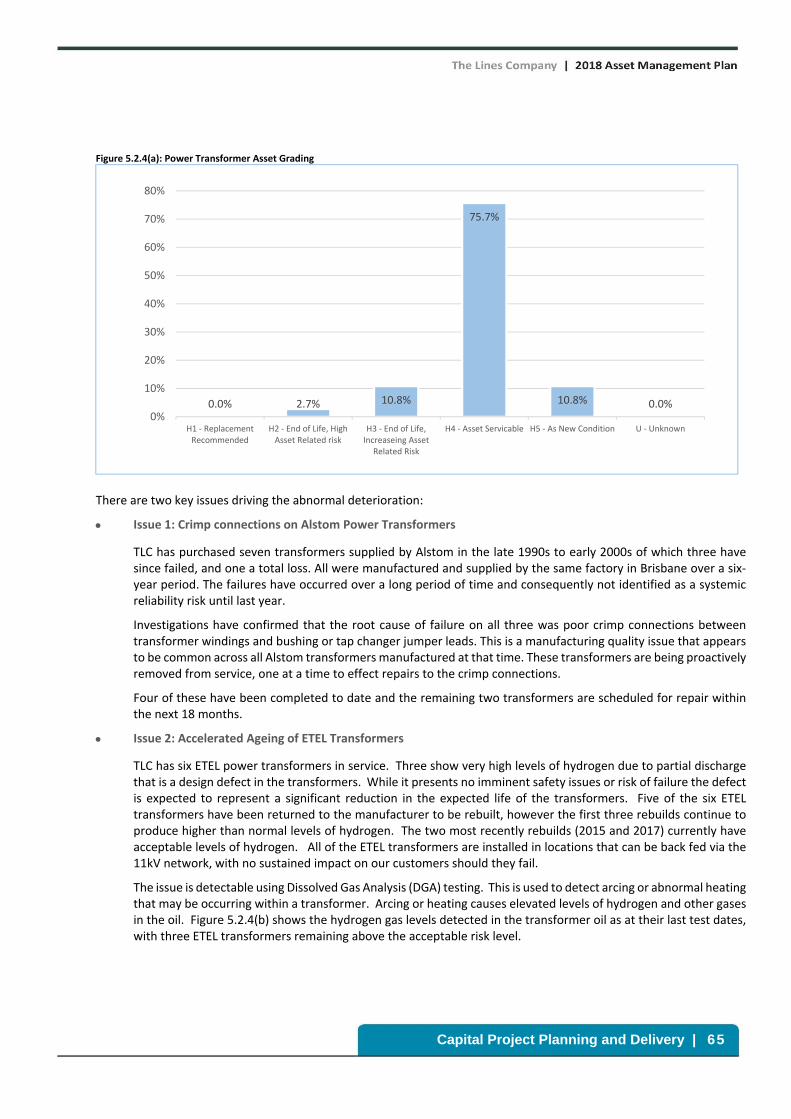
Capital Project Planning and Delivery | 65
Figure 5.2.4(a): Power Transformer Asset Grading
There are two key issues driving the abnormal deterioration:
Issue 1: Crimp connections on Alstom Power Transformers
TLC has purchased seven transformers supplied by Alstom in the late 1990s to early 2000s of which three have since failed, and one a total loss. All were manufactured and supplied by the same factory in Brisbane over a six‐year period. The failures have occurred over a long period of time and consequently not identified as a systemic reliability risk until last year.
Investigations have confirmed that the root cause of failure on all three was poor crimp connections between transformer windings and bushing or tap changer jumper leads. This is a manufacturing quality issue that appears to be common across all Alstom transformers manufactured at that time. These transformers are being proactively removed from service, one at a time to effect repairs to the crimp connections.
Four of these have been completed to date and the remaining two transformers are scheduled for repair within the next 18 months.
Issue 2: Accelerated Ageing of ETEL Transformers
TLC has six ETEL power transformers in service. Three show very high levels of hydrogen due to partial discharge that is a design defect in the transformers. While it presents no imminent safety issues or risk of failure the defect is expected to represent a significant reduction in the expected life of the transformers. Five of the six ETEL transformers have been returned to the manufacturer to be rebuilt, however the first three rebuilds continue to produce higher than normal levels of hydrogen. The two most recently rebuilds (2015 and 2017) currently have acceptable levels of hydrogen. All of the ETEL transformers are installed in locations that can be back fed via the 11kV network, with no sustained impact on our customers should they fail.
The issue is detectable using Dissolved Gas Analysis (DGA) testing. This is used to detect arcing or abnormal heating that may be occurring within a transformer. Arcing or heating causes elevated levels of hydrogen and other gases in the oil. Figure 5.2.4(b) shows the hydrogen gas levels detected in the transformer oil as at their last test dates, with three ETEL transformers remaining above the acceptable risk level.
0.0% 2.7% 10.8%
75.7%
10.8% 0.0%0%
10%
20%
30%
40%
50%
60%
70%
80%
H1 ‐ ReplacementRecommended
H2 ‐ End of Life, HighAsset Related risk
H3 ‐ End of Life,Increaseing Asset
Related Risk
H4 ‐ Asset Servicable H5 ‐ As New Condition U ‐ Unknown
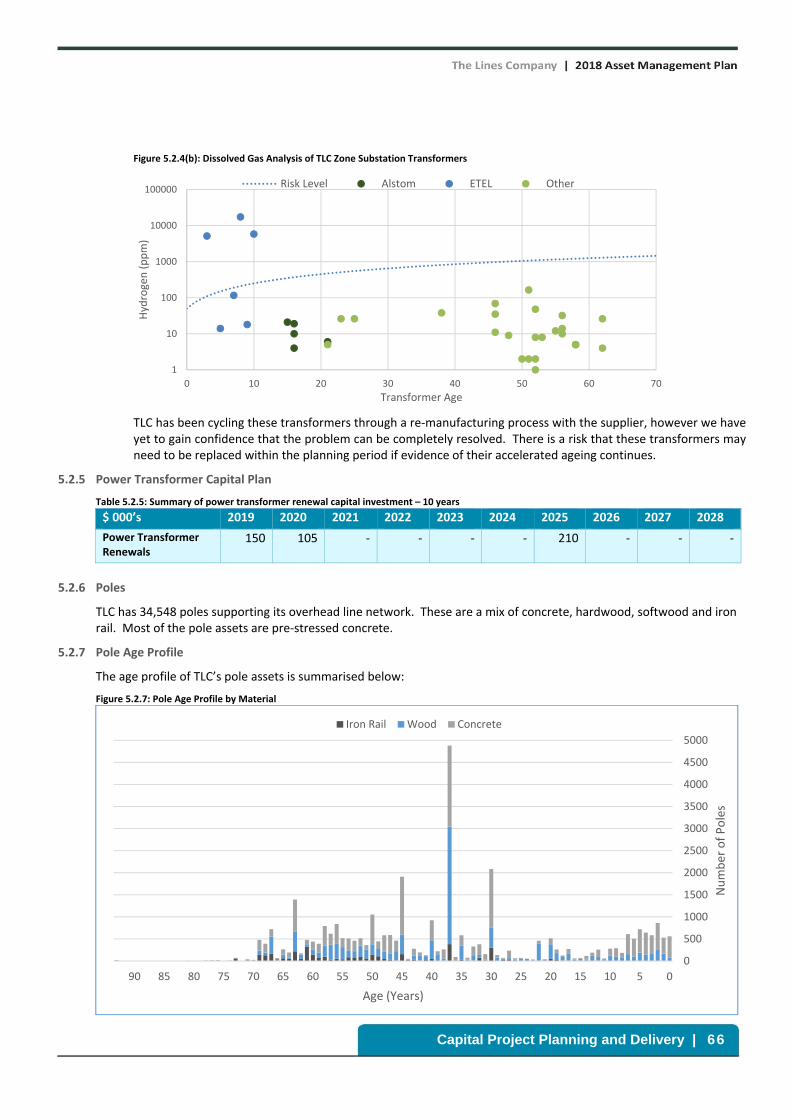
Capital Project Planning and Delivery | 66
Figure 5.2.4(b): Dissolved Gas Analysis of TLC Zone Substation Transformers
TLC has been cycling these transformers through a re‐manufacturing process with the supplier, however we have yet to gain confidence that the problem can be completely resolved. There is a risk that these transformers may need to be replaced within the planning period if evidence of their accelerated ageing continues.
5.2.5 Power Transformer Capital Plan
Table 5.2.5: Summary of power transformer renewal capital investment – 10 years
$ 000’s 2019 2020 2021 2022 2023 2024 2025 2026 2027 2028
Power Transformer Renewals
150 105 ‐ ‐ ‐ ‐ 210 ‐ ‐ ‐
5.2.6 Poles
TLC has 34,548 poles supporting its overhead line network. These are a mix of concrete, hardwood, softwood and iron rail. Most of the pole assets are pre‐stressed concrete.
5.2.7 Pole Age Profile
The age profile of TLC’s pole assets is summarised below:
Figure 5.2.7: Pole Age Profile by Material
1
10
100
1000
10000
100000
0 10 20 30 40 50 60 70
Hydrogen (ppm)
Transformer Age
Risk Level Alstom ETEL Other
0
500
1000
1500
2000
2500
3000
3500
4000
4500
5000
051015202530354045505560657075808590
Number of Poles
Age (Years)
Iron Rail Wood Concrete

Capital Project Planning and Delivery | 67
In some cases our pole data is populated with default rather than actual commissioning date values, which has the effect of showing abnormal pole installation volumes in specific years. Default values were populated when TLC’s records were transferred from paper to digitized format, and it is assumed they represent instances where the commissioning dates were missing from the paper records.
We are seeking to improve these records over time and move towards a risk based approach for asset management going forward.
5.2.8 Pole Condition
We have established initial asset health indices for our distribution poles by combining age, average life expectancy, reliability rating, location factor and condition. A derived asset health index profile for the current year is shown below. The analysis indicates that TLC’s pole assets are in good condition, but that some targeted replacement is also required. The analysis does not show the expected change in condition over time, but this will be developed in future and will enable us to tune our investment and maintenance plan in the future.
This is an early snapshot of our estimated asset condition, which we are seeking to develop further in the 2018/19 year.
Figure 5.2.8: Condition Assessment of Poles in Current Year
5.2.9 Crossarms
TLC has 51,156 crossarms in service, most which are wooden.
5.2.10 Crossarm Age Profile
The age profile of TLC’s crossarm assets is summarised below.
0
1,000
2,000
3,000
4,000
5,000
6,000
7,000
(0-1) (1-2) (2-3) (3-4) (4-5) (5-6) (6-7) (7-8) (8-9) (9-10) (10+) NoResult
Num
ber
of P
oles
Category
Year 0 Health Index Key
Condition Health Index
Remaining Life
Probability of Failure
Good 0‐4 >20 years Very Low
Fair 4‐7 10‐20 years Low
Poor 7‐9 5‐10 years Med ‐ High
Bad 9‐10 < 5years High
10+ Replacement Overdue
Very High

Capital Project Planning and Delivery | 68
Figure 5.2.10: Crossarm Age Profile by Voltage
In some cases our crossarm data is populated with default rather than actual commissioning date values, which has the effect of showing abnormal pole installation volumes in specific years. Default values were populated when TLC’s records were transferred from paper to digitized format, and it is assumed they represent instances where the commissioning dates were missing from the paper records.
We are seeking to improve these records over time and move towards a risk based approach for asset management going forward.
5.2.11 Crossarm Age Condition
We have established initial asset health indices for our crossarms by combining age, average life expectancy, reliability rating, location factor and condition. A derived asset health index profile for the current year is shown below. The analysis indicates that TLC’s crossarm assets are in good condition, but that some targeted replacement is also required. The analysis does not show the expected change in condition over time, but this will be developed in future and will enable us to tune our investment and maintenance plan in the future.
This is an early snapshot of our estimated asset condition, which we are seeking to develop further in the 2018/19 year.
Figure 5.2.11: Distribution Crossarm Health Index Profile
0
1,000
2,000
3,000
4,000
5,000
6,000
7,000
8,000
05101520253035404550556065707580859095
Count
Age (Years)
LV 11kV 33kV
0
1,000
2,000
3,000
4,000
5,000
6,000
7,000
8,000
9,000
(0-1) (1-2) (2-3) (3-4) (4-5) (5-6) (6-7) (7-8) (8-9) (9-10) (10+) NoResult
Num
ber
of C
ross
arm
s
Category
Year 0 Health Index Key
Condition Health Index
Remaining Life
Probability of Failure
Good 0‐4 >20 years Very Low
Fair 4‐7 10‐20 years Low
Poor 7‐9 5‐10 years Med ‐ High
Bad 9‐10 < 5years High
10+ Replacement Overdue
Very High

Capital Project Planning and Delivery | 69
5.2.12 Overhead Conductor
TLC has 4036 km of overhead line conductor, with the majority being 3‐phase 11kV. However TLC has a substantial amount of 33kV (502 km) and 11kV Single wire Earth Return (SWER – 868 km) conductor, which are both proportionally higher than most NZ networks.
5.2.13 Overhead Conductor Age Profile
The age profile of TLC’s overhead conductor assets is summarised below.
Figure 5.2.13: Overheard Conductor Age Profile
In some cases our conductor data is populated with default rather than actual commissioning date values. This has the effect of showing abnormal pole installation volumes in specific years. Default values were populated when TLC’s records were transferred from paper to digitized format and it is assumed they represent instances where the commissioning dates were missing from the paper records.
We are seeking to improve these records over time and move towards a risk‐based approach for asset management going forward.
5.2.14 Overhead Conductor Condition
We have established initial asset health indices for our overhead conductor by combining age, average life expectancy, reliability rating, location factor and condition. A derived asset health index profile for the current year is shown below. The analysis indicates that TLC’s conductor assets are in good condition, but that some targeted replacement is also required. The analysis does not show the expected change in condition over time, but this will be developed in future and will enable us to tune our investment and maintenance plan in the future.
This is an early snapshot of our estimated asset condition which we are seeking to develop further in the 2018/19 year.
0
50
100
150
200
250
300
051015202530354045505560657075808590
Length (km
)
Age (Years)
LV 11kV 33kV

Capital Project Planning and Delivery | 70
Figure 5.2.14: Distribution Conductor Health Indices Profile
5.2.15 Overhead Conductor Risk and Issues
One of the most significant challenges for the business is transforming its line renewal planning to create a sustainable forward management programme. Figure 5.2.15 shows TLC’s rolling average pole age profile. Although this is a crude indicator of risk, it shows that the average age of TLC’s pole asset fleet has been steadily increasing year on year, indicating that the line renewal run rate has not quite kept pace with asset aging over time. Further details of the line age and condition are broken down below by their key components (pole, cross arm and conductor).
Figure 5.2.15: TLC’s Pole Age Profile
As a result, this 2018 Asset Management Plan shows a significant uplift in line renewal expenditure with the intent to improve the overall management of the line assets. At the same time TLC is beginning a systematic predictive asset risk management process. It is expected this will enable an improved understanding of where expenditure should be targeted to reduce overall outage risks. This work is still in its early stages, but will be developed further over the coming year. Currently age remains the main indicator for high level planning purposes with line inspections providing more current condition information.
5.2.16 Line Renewal Capital Plan (Poles, Conductors and Crossarms)
Our line renewal programme is currently based on age and condition as we understand it with the data available to us. We have noted that a large portion of our pole, cross arm and conductor assets have default dates, resulting from the digitisation of historic records. This data is expected to be corrected over the planning period through our annual inspection processes. This process may reveal new information that could impact our future investment decisions.
Key
Condition Health Index
Remaining Life
Probability of Failure
Good 0‐4 >20 years Very Low
Fair 4‐7 10‐20 years Low
Poor 7‐9 5‐10 years Med ‐ High
Bad 9‐10 < 5years High
10+ Replacement Overdue
Very High
020406080
100120140160180200
(0-1) (1-2) (2-3) (3-4) (4-5) (5-6) (6-7) (7-8) (8-9) (9-10) (10+) NoResult
Num
ber
of k
m
Category
Year 0 Health Index

Capital Project Planning and Delivery | 71
Separately, we are setting in place a new condition analysis methodology, to begin driving our renewal investment based on asset condition and risk rather than age. As this work is developed it is likely that our line renewal projects will be re‐scoped or re‐prioritised. This could result in recommendations for adjusting our investment profile.
Table 5.2.16: Summary of line renewal capital investment (poles, conductors and crossarms) – 10 years
$ 000’s 2019 2020 2021 2022 2023 2024 2025 2026 2027 2028
11kV Line Renewals 3,489 3,073 4,395 2,788 2,560 4,429 5,925 6,204 6,511 6,047
33kV Line Renewals 1,205 2,409 1,568 2,061 1,098 444 1,161 753 621 720
LV Line Renewals 1,203 449 1,173 534 1,058 1,834 1,966 2,226 1,084 1,241
33kV Line ‐ safety driven renewal
‐ ‐ ‐ ‐ ‐ 394 ‐ ‐ ‐ ‐
5.2.17 Sub‐transmission Switchgear
TLC has 249 sub‐transmission switches. Some of the assets are located in zone substations and others are in the field on sub‐transmission lines. The switch ages and condition vary and they are renewed when no longer serviceable.
5.2.18 Sub‐transmission Switchgear Age Profile
The age profile of TLC’s switch assets is summarised below.
Figure 5.2.18: Age profile of 33kV Switch Assets
5.2.19 Distribution Switches
TLC has 9.193 distribution switches in service, with the majority being ground mounted.
5.2.20 Distribution Switchgear Age Profile
The age profile of TLC’s distribution switches is summarised below.
0
1
2
3
4
5
6
7
8
9
10
1357911131517192123252729313335373941434547495153555759616365
Number
Age (Years)
Oil SF6 Vacuum

Capital Project Planning and Delivery | 72
Figure 5.2.20: Distribution Switchgear Age Profile
5.2.21 Distribution Switchgear Condition
Condition assessment of distribution switchgear falls into two groups. The first group (ABS, Pole mount fuse switches, pole mounted load break switches, solid links, RTE switch and Transformer tap off fuses) receives visual inspections during routine maintenance and are replaced as required. The second group are devices that have active control relays that need to be tested to prove they still work. A subset of these have oil which needs to be changed periodically. In both cases assessment during the inspection cycle determines any replacement or maintenance actions if required, and the assets are not specifically profiled to maintain a condition level.
Figure 5.2.21: Switchgear Condition Grading
0
50
100
150
200
250
300
350
400
450
05101520253035404550556065
Count
Ground Mounted Pole Mounted
A number of the assets between 36‐40 years are assets of unknown age and carry a default installation date of 1/7/1980.
0.2% 7.3% 0.0%
66.2%
26.0%
0.2%0%
10%
20%
30%
40%
50%
60%
70%
H1 ‐ ReplacementRecommended
H2 ‐ End of Life, HighAsset Related risk
H3 ‐ End of Life,Increaseing Asset
Related Risk
H4 ‐ Asset Servicable H5 ‐ As New Condition U ‐ Unknown

Capital Project Planning and Delivery | 73
5.2.22 Distribution Switchgear Key Risk and Issues
Unsafe‐to‐operate switchgear
TLC has several unsafe‐to‐operate switchgear, known as SDAF‐3 units, in service. In this case unsafe‐to‐operate in this case means the units cannot be switched when live. There have been past occurrences within the international electricity industry of the equipment failing and presenting a high risk of injury to the operating staff.
All these units are tagged as being unsafe to operate and staff are trained not to operate them live. However to eliminate this risk, we intend to replace all of these units on our network within the next year.
5.2.23 Distribution Switchgear Capital Plan
Table 5.2.23: Summary of switchgear renewal investment – 10 years
$ 000’s 2019 2020 2021 2022 2023 2024 2025 2026 2027 2028
11kV Switch Renewal 54 ‐ ‐ 590 93 103 ‐ ‐ ‐ ‐
33kV Switchgear Renewal
‐ ‐ ‐ ‐ 95 ‐ 95 ‐ ‐ ‐
11kV Switchgear ‐ Safety driven renewal
261 ‐ ‐ 329 ‐ 160 ‐ ‐ ‐ ‐
5.2.24 Distribution Transformers
TLC has 5,099 distribution transformers in service, with the majority being pole mounted.
5.2.25 Distribution Transformer Age Profile
The age profile of TLC’s distribution transformers is summarised below.
Figure 5.2.25: Distribution Transformer Age profile (excluding 24% of records with default commissioning dates)
0
50
100
150
200
250
68
65
61
59
57
55
53
51
49
47
45
43
41
39
37
35
33
31
29
27
25
23
21
19
17
15
13
11 9 7 5 3 1
Count
Age (years)
Ground Mounted Pole Mounted
The graph excludes a number of transformers (24%) that have their commissioning date set to a defined default value (1980). This default commissioning date was used for transformers that had no record of commissioning when TLC’s asset records were digitised. It is known that many of these transformers were commissioned after this date, and consequently this business rule has the effect of increasing the average asset age.

Capital Project Planning and Delivery | 74
5.2.26 Distribution Transformer Condition
Figure 5.2.26: Transformer Condition Grading
There are eight H1 transformers, these are all scheduled to be replaced in the coming year in conjunction with the 11kV line renewals.
5.2.27 Distribution Transformer Key Risks and Issues
Issue 1: Ground Mounted Transformers
TLC has 65 ground mounted transformers that are considered high risk because they are enclosed in wooden or tin sheds or are an open enclosure style. These transformers would not meet current standards if constructed today. In most cases these historic housing designs offer no secondary protection against contact with live electrical parts (such as a secondary insulation barrier) if the first protection layer is compromised. As an interim measure protective insulation barriers are being installed to prevent accidental contact with live conductors by staff and contractors who work on this equipment. Transformer replacement is however the optimal solution.
TLC has 13 transformers enclosed in wooden structures. The enclosures usually comprise wooden paling cladding with a tin roof. Inside the transformer terminals are typically exposed. These are classified as high‐risk because they typically have the following features:
Limited security – the wooden battens can be removed with effort
Low ingress rating ‐ i.e. rodents and birds are sometimes able to gain entry, with gaps in the wooden cladding allowing opportunity for fingers and sticks and other foreign objects to penetrate.
Inadequate internal segregation and exposed terminals.
Fire Hazard ‐ being constructed of wood, the enclosures are flammable.
TLC has 45 tin shed transformer enclosures. These have very similar features to the wooden enclosures in that they typically have exposed LV terminals inside the enclosure. They are generally regarded as lower risk than wooden enclosures because of their higher fire resistance and higher degree of security when when compared to the wooden enclosures. The tin enclosure is also earthed to operate protection if the walls or doors contact live equipment. These are classified as high‐risk because they typically have the following features:
Low Ingress rating from rodents, fingers, sticks and snow.
Lack of internal segregation and exposed terminals.
0.1% 0.8% 0.3%
82.5%
16.3%0.0%
0%
10%
20%
30%
40%
50%
60%
70%
80%
90%
H1 ‐ ReplacementRecommended
H2 ‐ End of Life, HighAsset Related risk
H3 ‐ End of Life,Increaseing Asset
Related Risk
H4 ‐ Asset Servicable H5 ‐ As New Condition U ‐ Unknown

Capital Project Planning and Delivery | 75
TLC has seven open‐external transformers. Open‐external refers to an industrial type transformer with termination boxes fitted to accommodate the incoming and outgoing cables without modern mechanical protection for the cables as they enter the transformer. There are several designs of these units, some with side mounted termination boxes and some with unprotected cables between the ground and termination box. The main risks with this design are direct vandalism to the transformer and impact from vehicles.
Figure 5.2.27(a): Typical wooden shed Transformer enclosure
This 2018 Asset Management Plan seeks to address these issues by replacing these transformers over the initial three years of the planning period.
Issue 2: Two pole structures with low equipment
There are a number of legacy two pole structures that have equipment that is below the minimum specified height in current regulations. All sites with dangerously low equipment have been addressed, the remaining sites are very close to regulation height.
5.2.28 Distribution Transformers Capital Plan
Table 5.2.28: Summary of ground mounted transformer safety renewal investment – 10 years
$ 000’s 2019 2020 2021 2022 2023 2024 2025 2026 2027 2028
Ground mount transformer safety renewal programme
710 1,512 1,386 861 ‐ ‐ 47 ‐ ‐ 53
Two pole structure Replacement Programme
29 22 78 78 145 85 158 286 40 ‐
Ground Mount Transformer Renewals
‐ ‐ ‐ ‐ ‐ ‐ 53 ‐ ‐ ‐
This plan focuses on replacing the 65 transformers that have been identified as high risk over a four year period.
5.2.29 Cables
Underground cables form a critical part of our network, they are used largely to mitigate a cascade pole failure scenario around zone substations, and to reticulate the ski‐field areas.
Figure 5.2.27(b): Typical tin shed transformer enclosure
Figure 5.2.27(c): Typical open‐external transformer
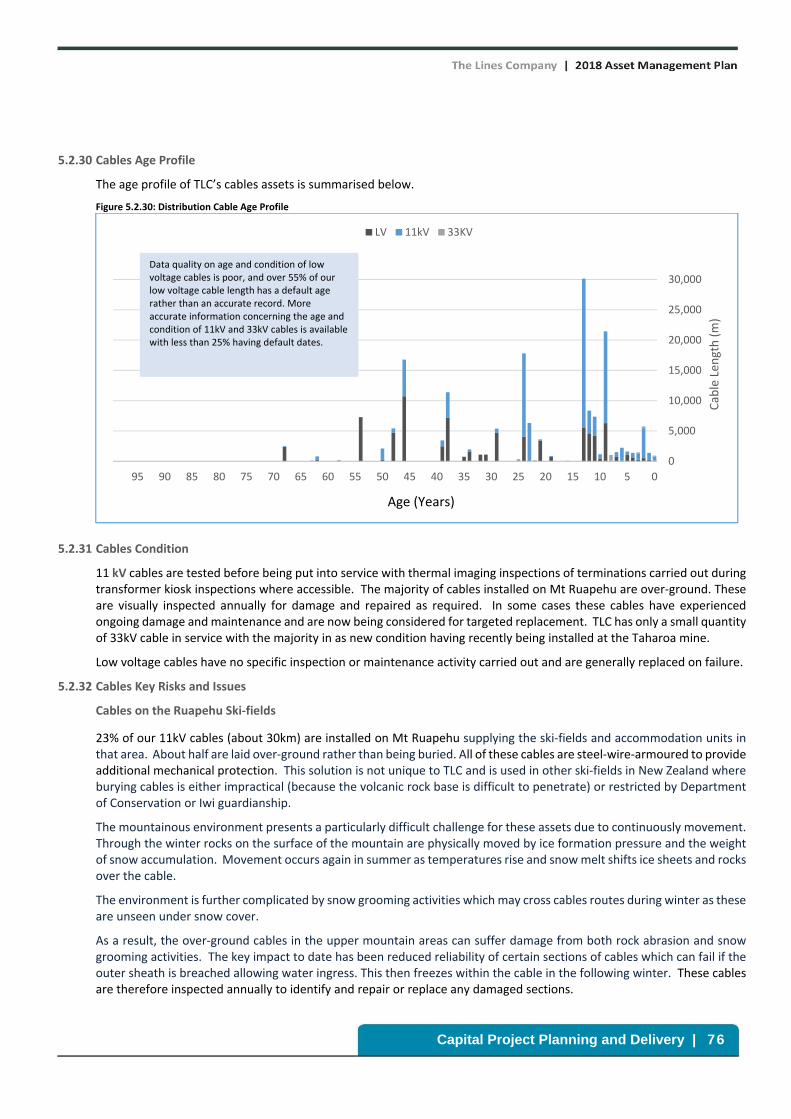
Capital Project Planning and Delivery | 76
5.2.30 Cables Age Profile
The age profile of TLC’s cables assets is summarised below.
Figure 5.2.30: Distribution Cable Age Profile
5.2.31 Cables Condition
11 kV cables are tested before being put into service with thermal imaging inspections of terminations carried out during transformer kiosk inspections where accessible. The majority of cables installed on Mt Ruapehu are over‐ground. These are visually inspected annually for damage and repaired as required. In some cases these cables have experienced ongoing damage and maintenance and are now being considered for targeted replacement. TLC has only a small quantity of 33kV cable in service with the majority in as new condition having recently being installed at the Taharoa mine.
Low voltage cables have no specific inspection or maintenance activity carried out and are generally replaced on failure.
5.2.32 Cables Key Risks and Issues
Cables on the Ruapehu Ski‐fields
23% of our 11kV cables (about 30km) are installed on Mt Ruapehu supplying the ski‐fields and accommodation units in that area. About half are laid over‐ground rather than being buried. All of these cables are steel‐wire‐armoured to provide additional mechanical protection. This solution is not unique to TLC and is used in other ski‐fields in New Zealand where burying cables is either impractical (because the volcanic rock base is difficult to penetrate) or restricted by Department of Conservation or Iwi guardianship.
The mountainous environment presents a particularly difficult challenge for these assets due to continuously movement. Through the winter rocks on the surface of the mountain are physically moved by ice formation pressure and the weight of snow accumulation. Movement occurs again in summer as temperatures rise and snow melt shifts ice sheets and rocks over the cable.
The environment is further complicated by snow grooming activities which may cross cables routes during winter as these are unseen under snow cover.
As a result, the over‐ground cables in the upper mountain areas can suffer damage from both rock abrasion and snow grooming activities. The key impact to date has been reduced reliability of certain sections of cables which can fail if the outer sheath is breached allowing water ingress. This then freezes within the cable in the following winter. These cables are therefore inspected annually to identify and repair or replace any damaged sections.
0
5,000
10,000
15,000
20,000
25,000
30,000
05101520253035404550556065707580859095
Cable Len
gth (m)
LV 11kV 33KV
Age (Years)
Data quality on age and condition of low voltage cables is poor, and over 55% of our low voltage cable length has a default age rather than an accurate record. More accurate information concerning the age and condition of 11kV and 33kV cables is available with less than 25% having default dates.

Capital Project Planning and Delivery | 77
TLC is now seeking to make improvements to minimise damage to the cables and also minimise access to the cable route from public or operational activities on the mountain. Several technical options are being investigated and will require extensive consultation with the ski‐field operator Ruapehu Alpine Lifts, Department of Conservation and Iwi to form a final proposal.
This AMP seeks to develop and implement a technical solution over the initial five years of the planning period.
5.2.33 Cables Capital Plan
The project for upgrading the cables on the Ruapehu Mountain is currently undergoing options analysis. There are a number of possible technical solutions, which range from complete cable replacement and undergrounding, to targeted cable repair and traffic management. Any final solution will require support and consent from multiple stakeholders, including our customers, DOC and Iwi. Our capital plan has assumed that substantial sections (but not all) of the cable will require replacement with some undergrounding.
Table 5.2.33: Summary of cable renewal investment – 10 years
$ 000’s 2019 2020 2021 2022 2023 2024 2025 2026 2027 2028
11kV Cable Renewals 500 ‐ 1,618 1,618 1,618 118 118 433 118 118
LV Cable Renewals ‐ ‐ ‐ ‐ 571 337 399 ‐ ‐ ‐
5.2.34 Zone Substation and Supply Point
Power transformers are primary plant used to feed power to or from our distribution network.
5.2.35 Aged Zone Substation Equipment
Wairere Falls
The current 33kV yard at Wairere is near end of life and unable to be maintained without major outages to customers.
5.2.36 Zone Substation Supply Point Development
These developments include upgrading existing oil bunding and foundations to ensure zone substations and TLC equipment at supply points meet current environmental and seismic standards.
5.2.37 Zone Substation Supply Point Capital Plan
Our capital plan includes upgrading oil bunding and foundations to ensure our zone substations meet current seismic regulations. Costs for this work are estimated in our capital plan, based on relatively limited experience with seismic upgrading projects. The work will be almost fully outsourced, and consequently actual costs are reliant on a number of factors including market demand and supply for this type of work.
Table 5.2.37: Summary of zone substation and supply point renewal investment – 10 years
$ 000’s 2019 2020 2021 2022 2023 2024 2025 2026 2027 2028
Zone Substation Renewals
303 1,155 70 1,000 1,000 ‐ 285 ‐ ‐ ‐
Zone Substation Development
420 ‐ 67 ‐ 110 53 483 53 53 95
Supply Point Development
190 ‐ 105 ‐ ‐ ‐ ‐ ‐ ‐ ‐
5.2.38 Other Assets
General network equipment renewals includes contingencies for transformers, switch gear and secondary relay renewals.
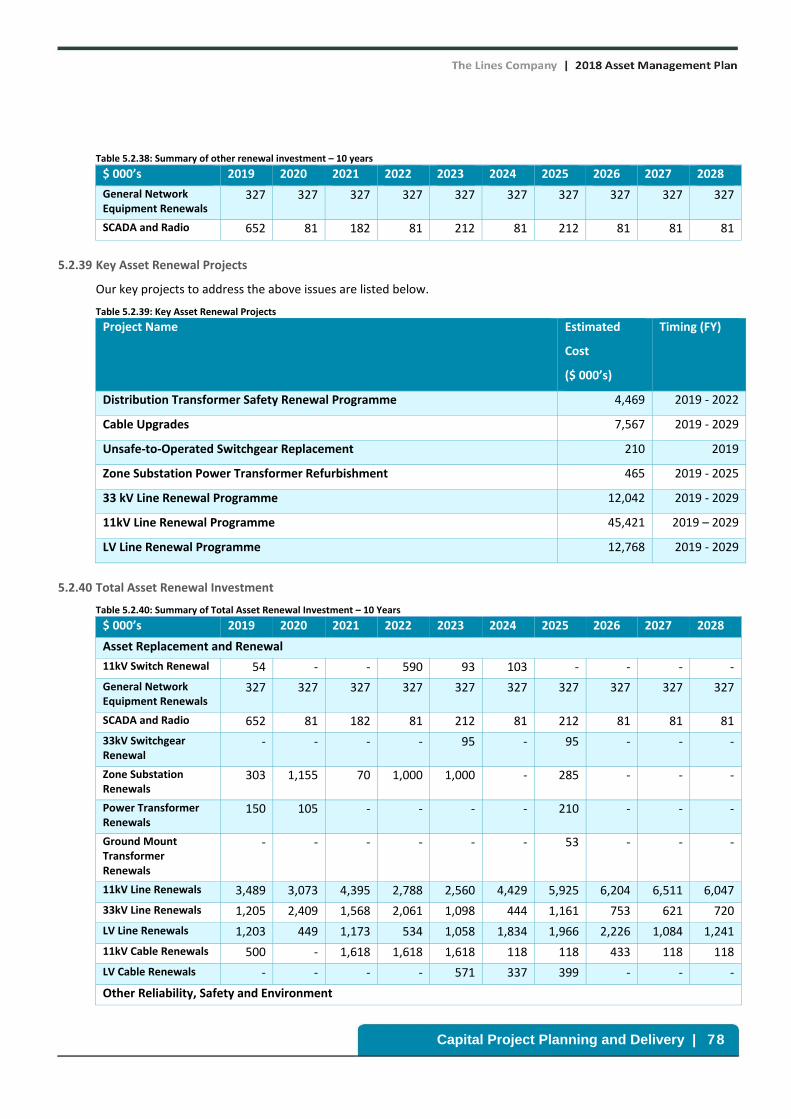
Capital Project Planning and Delivery | 78
Table 5.2.38: Summary of other renewal investment – 10 years
$ 000’s 2019 2020 2021 2022 2023 2024 2025 2026 2027 2028
General Network Equipment Renewals
327 327 327 327 327 327 327 327 327 327
SCADA and Radio 652 81 182 81 212 81 212 81 81 81
5.2.39 Key Asset Renewal Projects
Our key projects to address the above issues are listed below.
Table 5.2.39: Key Asset Renewal Projects
Project Name Estimated
Cost
($ 000’s)
Timing (FY)
Distribution Transformer Safety Renewal Programme 4,469 2019 ‐ 2022
Cable Upgrades 7,567 2019 ‐ 2029
Unsafe‐to‐Operated Switchgear Replacement 210 2019
Zone Substation Power Transformer Refurbishment 465 2019 ‐ 2025
33 kV Line Renewal Programme 12,042 2019 ‐ 2029
11kV Line Renewal Programme 45,421 2019 – 2029
LV Line Renewal Programme 12,768 2019 ‐ 2029
5.2.40 Total Asset Renewal Investment
Table 5.2.40: Summary of Total Asset Renewal Investment – 10 Years
$ 000’s 2019 2020 2021 2022 2023 2024 2025 2026 2027 2028
Asset Replacement and Renewal
11kV Switch Renewal 54 ‐ ‐ 590 93 103 ‐ ‐ ‐ ‐
General Network Equipment Renewals
327 327 327 327 327 327 327 327 327 327
SCADA and Radio 652 81 182 81 212 81 212 81 81 81
33kV Switchgear Renewal
‐ ‐ ‐ ‐ 95 ‐ 95 ‐ ‐ ‐
Zone Substation Renewals
303 1,155 70 1,000 1,000 ‐ 285 ‐ ‐ ‐
Power Transformer Renewals
150 105 ‐ ‐ ‐ ‐ 210 ‐ ‐ ‐
Ground Mount Transformer Renewals
‐ ‐ ‐ ‐ ‐ ‐ 53 ‐ ‐ ‐
11kV Line Renewals 3,489 3,073 4,395 2,788 2,560 4,429 5,925 6,204 6,511 6,047
33kV Line Renewals 1,205 2,409 1,568 2,061 1,098 444 1,161 753 621 720
LV Line Renewals 1,203 449 1,173 534 1,058 1,834 1,966 2,226 1,084 1,241
11kV Cable Renewals 500 ‐ 1,618 1,618 1,618 118 118 433 118 118
LV Cable Renewals ‐ ‐ ‐ ‐ 571 337 399 ‐ ‐ ‐
Other Reliability, Safety and Environment

Capital Project Planning and Delivery | 79
$ 000’s 2019 2020 2021 2022 2023 2024 2025 2026 2027 2028
11kV Switchgear ‐ Safety Driven Renewal
261 ‐ ‐ 329 ‐ 160 ‐ ‐ ‐ ‐
33kV Line ‐ Safety Driven Renewal
‐ ‐ ‐ ‐ ‐ 394 ‐ ‐ ‐ ‐
Zone Substation Development
420 ‐ 67 ‐ 110 53 483 53 53 95
Supply Point Development
190 ‐ 105 ‐ ‐ ‐ ‐ ‐ ‐ ‐
Two Pole Structure Replacement Programme
29 22 78 78 145 85 158 286 40 ‐
Ground Mount Transformer Safety Renewal Programme
710 1,512 1,386 861 ‐ ‐ 47 ‐ ‐ 53
Total 9,493 9,133 10,971 10,268 8,886 8,364 11,439 10,362 8,835 8,681
5.3 Network Development
Network development covers system growth, security of supply and quality of supply.
5.3.1 Key Risks and Issues
TLC is facing a range of short to medium‐term challenges that include security of supply constraints, system incremental growth, quality of supply issues and line upgrade requirements.
Security of Supply
Currently TLC has a range of security of supply issues to address in its Points of Supply (POS) and zone substations. These principally relate to:
Table 5.3.1(a): Security of Supply Issues
Hangatiki GXP TLC’s largest 110/33kV supply point currently operating well above its firm capacity
Ohakune GXP Currently using only one transformer with minimal back‐feed options
Atiamuri POS Is peaking above firm capacity
Te Waireka Serves Otorohanga township and is peaking above its firm capacity
Maraetai The Maraetai substation runs at N security (no back up) with a significant dairy load
Wairere Falls Requires replacement of an ageing 33kV busbar
Waitete Serves the Te Kuiti township and requires a major upgrade of its 11kV busbar
Borough Serves the Taumarunui township, and is peaking at about twice the firm capacity
Figure 5.3.1 shows the security level of TLC’s zone substations. The highlighted substations indicate areas where priority work is required to strengthen security of supply. Together these substations serve ~10,000 customers (~43% of TLC’s customer base). The grey bars show substations that have a single transformer with no immediate backup supply and would result in a sustained outage, ranging from several hours to days if a fault occurs. The light green bars are substations that can be back‐fed from other areas to provide supply, but this may be at a lower level than needed, and the orange bars show substations that have multiple transformers but a single unit cannot supply the full load.

Capital Project Planning and Delivery | 80
Figure 5.3.1: Security Rating of TLC’s Zone substations
This 2018 Asset Management Plan seeks to address these issues through significant substation upgrades over the planning period.
System incremental growth
The TLC network is supplied not only from Transpower grid exit points (GXPs), but also from major Waikato generation plants and seven large (>1MW) distributed hydro generators. The network has long runs of 33 kV lines between distributed generators and GXPs.
The key area of demand growth in the forecast period is expected to be in the northern network region supplied by the Hangatiki GXP. Sources of additional demand are expected from iron sand mining, industrial processing (timber and limestone) and milk processing. All of these projects are in discussion at the time of writing, but have other external dependencies before they can be realised.
Demand Forecasts: Points of Supply
Table 5.3.1(b) shows the demand forecasts at TLC’s points of supply. These forecasts are primarily take into consideration:
Underlying regional growth – based on Statistics NZ population trends and historical demand changes
Step load changes from large customer driven projects
No large scale distributed generation development
No material changes in the availability of installed distributed generation
Demand side management continues at current levels
Table 5.3.1(b): Point of Supply Demand Forecasts (MVA)
Point of Supply 2019 2020 2021 2022 2023 2024 2025 2026 2027 2028
Hangatiki 43.53 50.32 50.57 54.34 54.61 54.89 55.17 55.44 55.73 56.01
Ohakune 7.86 8.01 8.18 8.34 8.51 8.68 8.85 9.03 9.21 9.39
Ongarue 13.11 13.11 13.11 13.11 13.11 13.11 13.11 13.11 13.11 13.11
Tokaanu 10.84 10.90 10.95 11.01 11.06 11.12 11.17 11.23 11.28 11.34
National Park 6.33 6.33 6.33 6.33 6.33 6.33 6.33 6.33 6.33 6.33
0
500
1000
1500
2000
2500
3000
3500
Number of Customers
Zone Substation Security Summary
N N‐1 N‐1 Constrained N‐1 Switched
Over 10,000 customers (around 43%) are impacted by security of supply constraints
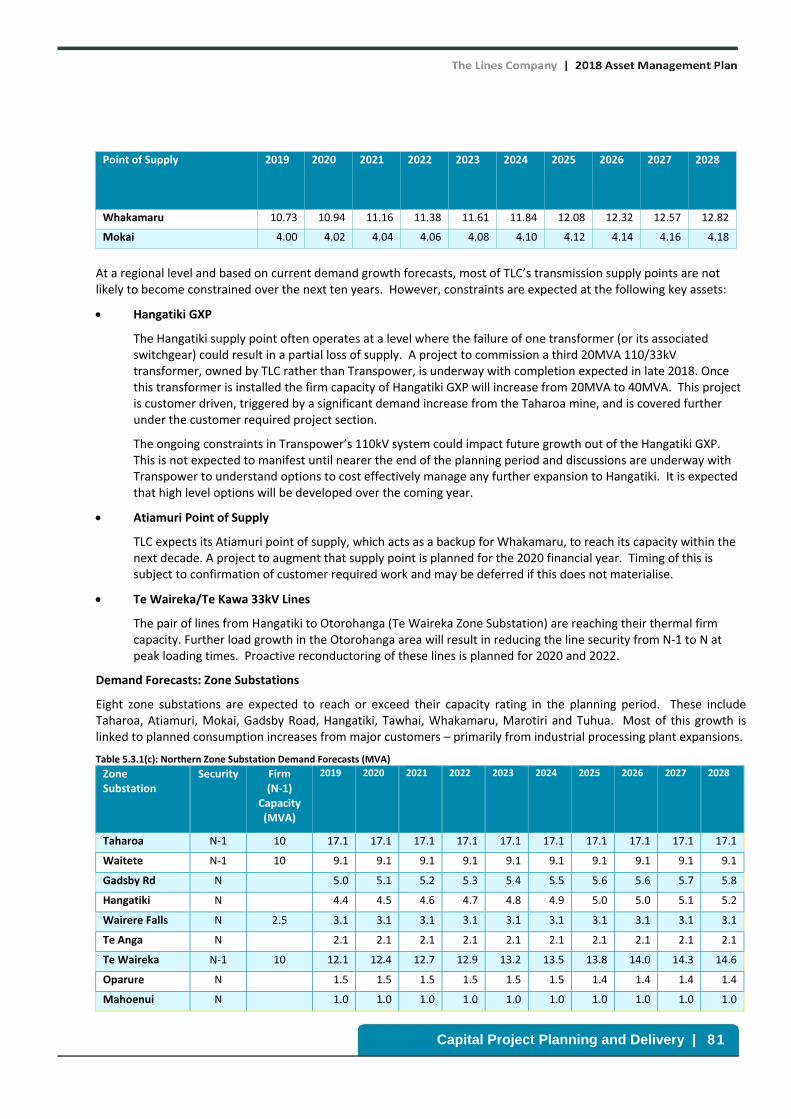
Capital Project Planning and Delivery | 81
Point of Supply 2019 2020 2021 2022 2023 2024 2025 2026 2027 2028
Whakamaru 10.73 10.94 11.16 11.38 11.61 11.84 12.08 12.32 12.57 12.82
Mokai 4.00 4.02 4.04 4.06 4.08 4.10 4.12 4.14 4.16 4.18
At a regional level and based on current demand growth forecasts, most of TLC’s transmission supply points are not likely to become constrained over the next ten years. However, constraints are expected at the following key assets:
Hangatiki GXP
The Hangatiki supply point often operates at a level where the failure of one transformer (or its associated switchgear) could result in a partial loss of supply. A project to commission a third 20MVA 110/33kV transformer, owned by TLC rather than Transpower, is underway with completion expected in late 2018. Once this transformer is installed the firm capacity of Hangatiki GXP will increase from 20MVA to 40MVA. This project is customer driven, triggered by a significant demand increase from the Taharoa mine, and is covered further under the customer required project section.
The ongoing constraints in Transpower’s 110kV system could impact future growth out of the Hangatiki GXP. This is not expected to manifest until nearer the end of the planning period and discussions are underway with Transpower to understand options to cost effectively manage any further expansion to Hangatiki. It is expected that high level options will be developed over the coming year.
Atiamuri Point of Supply
TLC expects its Atiamuri point of supply, which acts as a backup for Whakamaru, to reach its capacity within the next decade. A project to augment that supply point is planned for the 2020 financial year. Timing of this is subject to confirmation of customer required work and may be deferred if this does not materialise.
Te Waireka/Te Kawa 33kV Lines
The pair of lines from Hangatiki to Otorohanga (Te Waireka Zone Substation) are reaching their thermal firm capacity. Further load growth in the Otorohanga area will result in reducing the line security from N‐1 to N at peak loading times. Proactive reconductoring of these lines is planned for 2020 and 2022.
Demand Forecasts: Zone Substations
Eight zone substations are expected to reach or exceed their capacity rating in the planning period. These include Taharoa, Atiamuri, Mokai, Gadsby Road, Hangatiki, Tawhai, Whakamaru, Marotiri and Tuhua. Most of this growth is linked to planned consumption increases from major customers – primarily from industrial processing plant expansions.
Table 5.3.1(c): Northern Zone Substation Demand Forecasts (MVA)
Zone Substation
Security Firm (N‐1)
Capacity (MVA)
2019 2020 2021 2022 2023 2024 2025 2026 2027 2028
Taharoa N‐1 10 17.1 17.1 17.1 17.1 17.1 17.1 17.1 17.1 17.1 17.1
Waitete N‐1 10 9.1 9.1 9.1 9.1 9.1 9.1 9.1 9.1 9.1 9.1
Gadsby Rd N 5.0 5.1 5.2 5.3 5.4 5.5 5.6 5.6 5.7 5.8
Hangatiki N 4.4 4.5 4.6 4.7 4.8 4.9 5.0 5.0 5.1 5.2
Wairere Falls N 2.5 3.1 3.1 3.1 3.1 3.1 3.1 3.1 3.1 3.1 3.1
Te Anga N 2.1 2.1 2.1 2.1 2.1 2.1 2.1 2.1 2.1 2.1
Te Waireka N‐1 10 12.1 12.4 12.7 12.9 13.2 13.5 13.8 14.0 14.3 14.6
Oparure N 1.5 1.5 1.5 1.5 1.5 1.5 1.4 1.4 1.4 1.4
Mahoenui N 1.0 1.0 1.0 1.0 1.0 1.0 1.0 1.0 1.0 1.0

Capital Project Planning and Delivery | 82
Zone Substation
Security Firm (N‐1)
Capacity (MVA)
2019 2020 2021 2022 2023 2024 2025 2026 2027 2028
Taharoa Village N 0.4 0.4 0.4 0.4 0.4 0.4 0.4 0.4 0.4 0.4
Atiamuri N 10.7 10.9 11.2 11.5 11.8 12.0 12.3 12.6 12.8 13.1
Maraetai N 5.3 5.5 5.6 5.8 5.9 6.1 6.2 6.4 6.5 6.7
Mokai N 3.8 3.9 4.0 4.1 4.2 4.3 4.4 4.5 4.6 4.7
Marotiri N 3.2 3.3 3.4 3.5 3.6 3.7 3.8 3.9 4.0 4.1
Arohena N 2.9 3.0 3.1 3.1 3.2 3.3 3.4 3.5 3.6 3.6
Kaahu Tee N 2.0 2.0 2.1 2.1 2.2 2.3 2.3 2.4 2.4 2.5
Tawhai N 5.0 5.0 5.0 5.0 5.0 5.0 5.0 5.0 5.0 5.0
Nat. Park N 2.0 2.0 2.0 2.0 2.0 2.0 2.0 2.0 2.0 2.0
Otukou N 0.2 0.2 0.2 0.2 0.2 0.2 0.2 0.2 0.2 0.2
Borough N‐1 5 8.5 8.5 8.5 8.5 8.5 8.5 8.5 8.5 8.5 8.5
Manunui N 2.6 2.6 2.7 2.8 2.9 2.9 3.0 3.1 3.1 3.2
Tuhua N 1.2 1.2 1.2 1.2 1.2 1.2 1.2 1.2 1.2 1.2
Nihoniho N 0.5 0.5 0.5 0.5 0.5 0.5 0.5 0.5 0.5 0.5
Turangi N‐1 5 4.8 4.8 4.8 4.8 4.9 4.9 4.9 4.9 5.0 5.0
Kuratau N 3 2.8 2.8 2.8 2.8 2.8 2.8 2.8 2.8 2.8 2.8
Kiko Road N 1.5 1.6 1.6 1.6 1.6 1.6 1.6 1.6 1.6 1.7
Awamate N 1.5 1.5 1.5 1.5 1.6 1.6 1.6 1.6 1.6 1.7
Waiotaka N 0.6 0.6 0.6 0.6 0.6 0.6 0.6 0.6 0.6 0.6
Tokaanu N 0.2 0.2 0.2 0.2 0.2 0.2 0.2 0.2 0.2 0.2
Quality of Supply
Quality of supply projects cater for improving network security or improving reliability. There are three key issues.
Ohakune GXP At Ohakune we are supplied by Trustpower from a single 20MVA transformer and a single 11kV circuit breaker. While it was replaced in 2015 our experience with transformers indicate there is a risk of the transformer failing early in its life due to manufacturing defects. Transpower do carry a suitable spare transformer, however it could take up to a week to relocate, install and commission in the event of failure of the existing unit. For a portion of the year we are able to fully back up Ohakune due to an arrangement with Winstone Pulp International to take a limited supply (2.0MVA) from their network at Tangiwai. This is a full back up from November through to the end of March. In winter this backup is only able to reliably supply up to a third of the residential customers in the region.
Maraetai Zone Substation Maraetai zone substation currently relies on a single power transformer and has limited 11kV backup. The
planned additional transformer will improve resilience and allow for maintenance to be carried out on the existing breaker.
Te Waireka and Borough Zone Substations Both of these substations currently operate over their firm N‐1 capacity for periods of the year.
5.3.2 Equipment Capacity
When planning for all growth and security of supply projects the rated nameplate capacity is use for all project planning. The only exception to this is transformers which takes into account their short time overload capacity that is based on
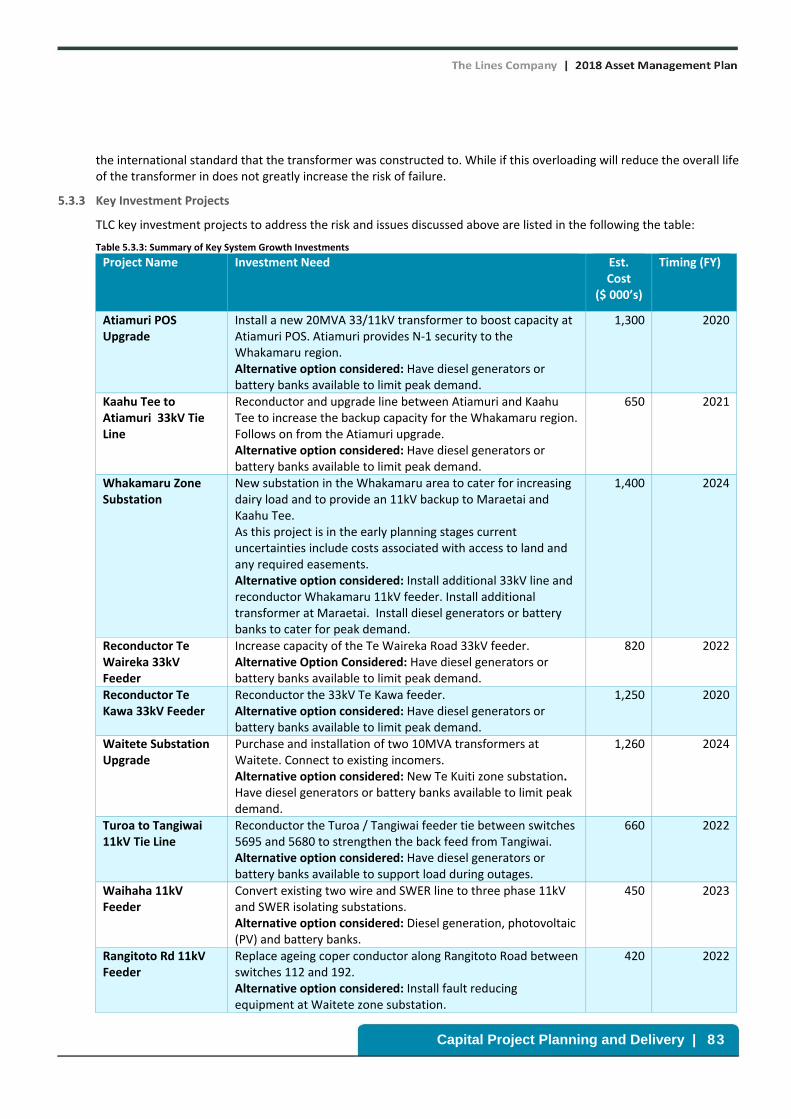
Capital Project Planning and Delivery | 83
the international standard that the transformer was constructed to. While if this overloading will reduce the overall life of the transformer in does not greatly increase the risk of failure.
5.3.3 Key Investment Projects
TLC key investment projects to address the risk and issues discussed above are listed in the following the table:
Table 5.3.3: Summary of Key System Growth Investments
Project Name Investment Need Est. Cost
($ 000’s)
Timing (FY)
Atiamuri POS Upgrade
Install a new 20MVA 33/11kV transformer to boost capacity at Atiamuri POS. Atiamuri provides N‐1 security to the Whakamaru region. Alternative option considered: Have diesel generators or battery banks available to limit peak demand.
1,300 2020
Kaahu Tee to Atiamuri 33kV Tie Line
Reconductor and upgrade line between Atiamuri and Kaahu Tee to increase the backup capacity for the Whakamaru region. Follows on from the Atiamuri upgrade. Alternative option considered: Have diesel generators or battery banks available to limit peak demand.
650 2021
Whakamaru Zone Substation
New substation in the Whakamaru area to cater for increasing dairy load and to provide an 11kV backup to Maraetai and Kaahu Tee. As this project is in the early planning stages current uncertainties include costs associated with access to land and any required easements. Alternative option considered: Install additional 33kV line and reconductor Whakamaru 11kV feeder. Install additional transformer at Maraetai. Install diesel generators or battery banks to cater for peak demand.
1,400 2024
Reconductor Te Waireka 33kV Feeder
Increase capacity of the Te Waireka Road 33kV feeder. Alternative Option Considered: Have diesel generators or battery banks available to limit peak demand.
820 2022
Reconductor Te Kawa 33kV Feeder
Reconductor the 33kV Te Kawa feeder. Alternative option considered: Have diesel generators or battery banks available to limit peak demand.
1,250 2020
Waitete Substation Upgrade
Purchase and installation of two 10MVA transformers at Waitete. Connect to existing incomers. Alternative option considered: New Te Kuiti zone substation. Have diesel generators or battery banks available to limit peak demand.
1,260 2024
Turoa to Tangiwai 11kV Tie Line
Reconductor the Turoa / Tangiwai feeder tie between switches 5695 and 5680 to strengthen the back feed from Tangiwai. Alternative option considered: Have diesel generators or battery banks available to support load during outages.
660 2022
Waihaha 11kV Feeder
Convert existing two wire and SWER line to three phase 11kV and SWER isolating substations. Alternative option considered: Diesel generation, photovoltaic (PV) and battery banks.
450 2023
Rangitoto Rd 11kV Feeder
Replace ageing coper conductor along Rangitoto Road between switches 112 and 192. Alternative option considered: Install fault reducing equipment at Waitete zone substation.
420 2022

Capital Project Planning and Delivery | 84
Project Name Investment Need Est. Cost
($ 000’s)
Timing (FY)
Ohakune GXP Cable Replace existing cable from Transpower’s circuit breaker to TLC’s 11kV bus to remove thermal constraints. Alternative option considered: Have diesel generators or battery banks available to limit peak demand.
190 2019
Te Waireka Substation Upgrade
Completion of project started in 2018 to increase the transformer size to ensure N‐1 security. Alternative option considered: Have diesel generators or battery banks available to limit peak demand.
1,200 2019
Borough Substation Upgrade
Install ex‐Te Waireka transformers at the Borough zone substation to increase the transformer size to ensure N‐1 security. Alternative option considered: Have diesel generators or battery banks available to limit peak demand.
100 2019
Maraetai Dual Transformers
Install a second transformer (ex Borough) to provide N‐1 security. Install new 11kV and 33kV switchgear to cater for the additional transformer. Alternative option considered: Heavy 11kV reconductoring or diesel generator support.
315 2019
Ohakune Alternative Supply
Arrangement to provide N‐1 security to the Ohakune area. At the current time we anticipate providing an alternative supply point for Ohakune, supplied from a single transformer connected to the 220kV network. This is subject to planning discussions with Transpower and other stakeholders, which may see this plan evolve to into a number of options including decommissioning the existing GXP to unload the 110kV network. Under such a scenario, our capital plan may evolve to reflect an increased capital cost, which we assume would be balanced by a reduction in transmission charges from retaining the existing GXP.
2,625 2022 ‐ 2024
5.3.4 Total Network Development
The following table summarises all network development investment. These projects have considered the application of alternative technologies such as PV or battery options. Our analysis indicates that these options are not cost effective at the current time or cannot provide sustained supply to enable them to be a credible option.
We are closely monitoring this technology and have noted that their costs have continued to reduce. However, given that most of our priority projects are planned for implementation in the short to medium term (2‐5 year period) we don’t currently foresee these options being economic in that time frame.
Table 5.3.4: Summary of Total System Growth Investment – 10 Years
$ 000’s 2019 2020 2021 2022 2023 2024 2025 2026 2027 2028
System Growth
11kV Development 802 1,264 135 765 564 82 ‐ 135 ‐ 236
Voltage Regulation ‐ ‐ 126 114 114 110 ‐ ‐ 114 228
33kV Development 190 1,250 ‐ 820 662 ‐ ‐ ‐ ‐ ‐
Zone Substation Development 105 105 ‐ ‐ 205 2,455 158 ‐ ‐ ‐
Supply Point Development ‐ 1,000 300 ‐ ‐ ‐ ‐ ‐ ‐ ‐

Capital Project Planning and Delivery | 85
$ 000’s 2019 2020 2021 2022 2023 2024 2025 2026 2027 2028
Quality of Supply
11kV Reliability and Security Development
‐ 80 120 180 ‐ ‐ ‐ ‐ ‐ ‐
11kV Switchgear Automation 235 ‐ 45 342 492 414 63 463 400 500
33kV Reliability Development 204 ‐ 64 ‐ ‐ ‐ ‐ ‐ ‐ ‐
Zone Substation Security of Supply Development
1,615 ‐ ‐ ‐ 210 ‐ ‐ 194 ‐ ‐
Supply Point Security of Supply Development
‐ ‐ 53 368 1,260 1,260 ‐ ‐ ‐ ‐
TOTALS 3,151 3,699 843 2,589 3,507 4,321 221 792 514 964
5.4 Customer Required Projects
5.4.1 Overview
Customer required projects are projects that have either been requested by customers to provide for their specific needs, or projects where the system demand has risen significantly due to the impact of growth from a specific customer.
There are various processes for customer driven development based around the size of customer needs.
Once a customer need is established concept options are developed. Needs for major customers are normally established by site visits and discussions. Tools such as load flow studies and fault analysis are used to develop the concepts. The network details, down to distribution transformer level, are stored and regularly updated on the ETAP network analysis programme to assist with the process.
Once viable options are determined high‐level costs are estimated and the advantages and disadvantages of each option are articulated. This will include customer consultation so that the benefits of each option can be accurately assessed by the customer. These discussions are used to determine a number of things, including the amount of future‐proofing a developer or industrial customer wants to fund.
Currently TLC has a range of customer driven projects that are in various stages of consultation. TLC has estimated costs for these projects but in most cases these are provisional estimates prior to detailed scoping and design.
5.4.2 Key Projects
The most significant project is the addition of a third 110/33kV transformer at the Hangatiki GXP. This project is driven by the incremental load growth from the Taharoa mine which has increased from less than 10MVA to 15MVA over the past five years. This has pushed system demand above the firm capacity of Transpower’s Hangatiki substation and in response TLC has commenced a project to upgrade the Hangatiki GXP by adding a third 20MVA transformer. This transformer will be located at the Transpower substation but will be owned and operated by TLC.
Other customer driven projects include incremental demand from industrial processing (milk and limestone), the Ruapehu ski‐fields, and expansion of the Mokai Energy Park.
5.4.3 Key Investment Projects
Table 5.4.3: Summary of Key Customer Driven Investments
Project Name Investment Need Est. Cost
($ 000’s)
Timing (FY)
Hangatiki GXP Upgrade
Install a new 20/30MVA 110/33kV transformer to boost capacity at Hangatiki GXP
5,000 2018 ‐ 2019

Capital Project Planning and Delivery | 86
Project Name Investment Need Est. Cost
($ 000’s)
Timing (FY)
Otorohanga West Zone Substation
We are in early planning stages for a new substation to support industrial growth in the western side of Otorohanga.. Our provision estimate is subject to final design, land access and easement confirmation which may significantly adjust the costs indicated
1,675 2019 ‐ 2020
Ruapehu Ski Field Development
Significant development is being undertaken by Ruapehu Alpine Lifts (RAL) to increase infrastructure on the Whakapapa and Turoa ski‐fields. This is likely to drive a significant increase in peak demand for electricity within a 2‐4 year period. Several options are being considered by both TLC and RAL, to support this development. We have nominally assigned $1.9m over a five year period to support this project but this could increase depending on the final technical option decided
1,900 2019 ‐ 2022
Mokai Development Increase firm supply to the Mokai Energy Park 1,600 2019 – 2020
General New Connections and Upgrades
Investment required for new connections and upgrades for customer step‐load changes. This is a provision based on historical levels
5,758 2019 ‐ 2028
Taharoa Expansion A number of changes are being undertaken at the Taharoa mine. These include relocating some assets as well as adding additional assets to lift capacity and strengthen security of supply. Some of these options are in very early planning and as such have not yet been incorporated into our capital planning at this time
268 2020
5.4.4 Total Customer Required Investment
Table 5.4.4: Summary of Total Customer Required Investment – 10 Years
$ 000’s 2019 2020 2021 2022 2023 2024 2025 2026 2027 2028
Consumer Connection
Customer Specific 4,555 3,193 1,595 967 700 700 700 700 700 700
General New Connections and Upgrades
381 381 381 381 381 381 381 381 381 381
Asset Relocation 12 12 12 12 12 12 12 12 12 12
TOTALS 4,948 3,586 1,988 1,360 1,093 1,093 1,093 1,093 1,093 1,093

Capital Project Planning and Delivery | 87
5.5 Summary of Network Capex
The following chart summarises the total network capital expenditure for the next 10 years.
Figure 5.5: Network Capital Investment
5.6 Non-Network Asset Capex
Non‐network capital investment includes work that is not specifically related to network assets, but is required for business support, efficiency or business improvement.
5.6.1 Key projects
Non‐Network capital expenditure is focused in the following areas:
Office Building This investment is centered on establishing a new head office and control building. This is primarily driven by the low earthquake resilience of the current building and the comparatively high cost to renovate the current building to meet current standards. Secondary benefits will be the creation of a modern working environment that will promote a higher degree of interaction between teams and assist in attracting and retaining high calibre staff.
Vehicles Ongoing replacement of vehicle fleet.
Field and Data Systems This covers upgrades to existing software and the development of new systems and major hardware replacements. In particular TLC is seeking to make better use of its core systems that support its asset management processes. These include integrating systems from plan‐to‐field. Specifically TLC is seeking to deploy advanced field tools (i.e. tablets) and integrate these with its asset management (BASIX) and GIS systems.
Electric Vehicle (EV) Charger Project TLC has received funding from the EECA to deploy EV chargers on our network. The project includes installing up to 100 cloud‐connected 9kW or 22kW EV chargers to assist in establishing of a publicly accessible charging network supporting tourism across the King Country region. The intent is to address inherent and significant gaps in existing charging coverage. The project will require engagement with the community to gather support and a
0
2,000
4,000
6,000
8,000
10,000
12,000
14,000
16,000
18,000
20,000
2019 2020 2021 2022 2023 2024 2025 2026 2027 2028
$ 000's
Financial Year
Network Capital Expenditure
Network Development Programme Asset Renewal Programme Customer Required Projects

Capital Project Planning and Delivery | 88
minimum deployment volume. It is possible that this project could materially increase (i.e. may be expanded into a multi‐year initiative) given sufficient community interest, or materially reduce if not adequately supported.
Plant and Equipment Covers the replacement and acquisition of new inspection and testing equipment.
Table 5.6.1: Summary of Total Non‐Network Capital Expenditure – 10 years
$ 000’s 2019 2020 2021 2022 2023 2024 2025 2026 2027 2028
Non‐System Fixed Assets ‐ Routine
Vehicles 150 86 86 86 86 86 86 86 86 86
Data Systems 50 141 197 197 30 30 30 30 30 30
Plant and Equipment 35 35 35 35 35 35 35 35 35 35
Non‐System Fixed Assets ‐ Atypical
Office Building 300 3100
Electric Vehicle Charger Project
250
TOTALS 785 3,362 318 318 151 151 151 151 151 151
Figure 5.6.1: Non‐Network Capital Expenditure
‐
500
1,000
1,500
2,000
2,500
3,000
3,500
4,000
2019 2020 2021 2022 2023 2024 2025 2026 2027 2028
$ 000's
Financial Year
Non‐Network Capital Expenditure
Vehicles Data Systems
Eng & Asset Capital ‐ Office Area Eng & Asset Capital ‐ Vehicle Replacements
EV Charger Project Office Building

Capital Project Planning and Delivery | 89
5.7 Capital Expenditure Summary
Table 5.7: Summary of Total Capital Expenditure – 10 years
$ 000’s 2019 2020 2021 2022 2023 2024 2025 2026 2027 2028
Network
Asset Renewals 9,493 9,133 10,971 10,268 8,886 8,364 11,439 10,362 8,835 8,681
Customer Required
4,948 3,586 1,988 1,361 1,093 1,093 1,093 1,093 1,093 1,093
Network Development
3,151 3,699 843 2,588 3,506 4,320 220 792 514 965
Non‐Network
Routine 235 261 317 317 261 151 151 151 151 151
Atypical 550 3,100 ‐ ‐ ‐ ‐ ‐ ‐ ‐ ‐
Total 18,377 19,779 14,119 14,534 13,746 13,928 12,903 12,398 10,593 10,890
Figure 5.7: All Capital Expenditure
5.8 New Technologies
TLC is actively monitoring the development of new technologies that may emerge as compelling options for alternative means of supply.
TLC has a distributed generation policy in place to support the connection on distributed generation to our network by our customers. The policy describes the technical requirements of our network, and the technical standards by which distributed generation must comply.
Our observation at the current time is that battery and solar technologies as alternative supply options remain economically marginal for general supply services, but are increasingly reaching economic viability in targeted
‐
5,000
10,000
15,000
20,000
25,000
2019 2020 2021 2022 2023 2024 2025 2026 2027 2028
$ 000's
Financial Year
All Capital Expenditure
Asset Renewals Customer Required Network Development Non‐Network Routine Non‐Network Atypical

Capital Project Planning and Delivery | 90
applications. Other technological developments such as electric vehicles and their charging infrastructure are being actively pursued by TLC and are considered to be key enablers for future regional economic and environmental prosperity.
The rapid advance of new technology is expected to impact the economic lives of more traditional distribution assets as customers invest in providing their own energy supplies using photovaic and batteries. In these circumstances it may be necessary to accelerate depreciation on assets that become displaced or stranded to ensure that costs are adequately recovered.
At present TLC has not undertaken scenario analysis of the impact new technologies may impose. However we expect that technology impact analysis will become a necessary part of our asset management planning process in the near term as the economic viability of these options continues to improve.
5.9 Capability to Deliver
The plan for FY 19 is achievable because the underlying human resource reliant budget for this work is approximately in line with prior years completed work.
The main contributors to that outcome are:
• The Hangatiki project is fully outsourced;
• Most other large customer related projects will be outsourced;
• The Te Waireka project includes 0.86m of transformer purchases;
• The ground mount transformer safety renewal programme is outsourced;
• TLC has the option to outsource some of its line renewal or other work if resource constrained.
5.10 Summary of Key Assumptions
The key assumptions that may materially impact this plan are outlined below:
Table 5.10: Summary of Key Assumptions
Asset Renewals
11kV cable renewals A technical solution for the Ruapehu cable upgrade is yet to be finalised with stakeholders. Material uncertainties may arise from formalisation of a design.
Line Renewal programme
Data cleansing of historic records (i.e. clarifying default dates), and further condition analysis work does not result in a significant departure from our line renewal expenditure plan.
Zone substation renewals
Finalisation of designs for remedial substation development to meet seismic regulations does not result in a significant departure from our expenditure plan.
Network Development
Whakamaru Zone Substation
Current uncertainties relating to the planned zone substation to supply Whakamaru (i.e. access to land and any required easements) does not result in a significant departure from our expenditure plan.
Ohakune alternative supply (220kV)
An alternative supply point for Ohakune is agreed with Transpower and remains within our planned cost envelope.
Customer Required Projects
Ruapehu ski field development
A project is formalised with our customers for planned upgrades to support ski‐field infrastructure growth on the Ruapehu ski‐fields, and the expenditure remains approximately in line with plan. Material uncertainties may arise from formalisation of a design and developing customer needs.

Capital Project Planning and Delivery | 91
Asset Renewals
Otorohanga West Zone Substation
A project is formalised with our customers for a new substation to support industrial growth in the western side of Otorohanga. Material uncertainties may arise from formalisation of a design and developing customer needs.
Tahaora mine site expansion and works
Planned upgrades at the Taharoa mine are formalised with our customers and expenditure remains approximately in line with plan. Material uncertainties may arise from changes to design and developing customer needs.
Non Network
EV Charger Project TLC (with EECA) receives sufficient community support to deploy EV charges on its network under the project criteria.

Operations and Maintenance | 92
Operations and
Maintenance

Operations and Maintenance | 93
6. Operations and Maintenance Chapter Overview
This chapter explains the operation and maintenance of our electricity assets. It aims to ensure the safe and reliable performance of our assets over their expected lives. It outlines the planning process for maintenance, vegetation management. and system operations and support activities; how we establish our budgets, and describes how we deliver our operations and maintenance tasks.
6.1 Operations and Maintenance Objectives
Operations and maintenance is an essential part of the asset management process. TLC continually seeks to improve the approach taken to delivering work across the network. This includes:
Assurance that the preventive maintenance strategy continues to provide essential information about the health of the assets, manage down preventable defects and meet all statutory obligations.
Minimisation of breakdown rates of the assets and adjustment of the services delivery or recommendations on asset renewal where the condition of the assets represents a high probability of failure.
Assurance of timeliness of response to urgent work.
Optimisation of scheduled work, including balancing resource commitments between capital projects, preventive maintenance programmes and faults.
Assurance that the personnel delivering services are suitably trained and experienced to be safe in their work and assure high quality for each job.
Assurance that systems remain appropriate to enabling efficient work management and reporting.
6.2 Operations and Maintenance Planning
Operational expenditure work consists of:
Asset Maintenance.
o Preventive maintenance (generated by the BASIX work management system) including:
Scheduled inspections of assets.
Scheduled repairs and improvement work.
Scheduled corrective maintenance to repair defects as they emerge.
o Reactive maintenance for responding to faults.
Vegetation management.
Business, system operation and network support.
6.2.1 Asset Maintenance
Asset maintenance includes both (planned) maintenance and reactive (unplanned) maintenance.
Preventive Maintenance
The intent of planned maintenance is to prevent or minimize risk of failure by removing or reducing failure causes before they accumulate to create fault. Preventive maintenance includes inspections of assets, repairs and correction of known defects.

Operations and Maintenance | 94
Planned maintenance begins at the annual planning stage where an inspection schedule is renewed or developed and the work costed for budgetary approval. Following approval of the expenditure, work packs are developed that include detailed instructions for field staff to carry out the planned inspections or maintenance work. Resources are then scheduled to ensure the work can be carried out within the planning year.
When complete, each job is reviewed and assessed to consider what additional improvements or changes can be made to the maintenance plan to further minmise risk of failure in the future.
Preventive maintenance activities are scheduled annually based on the current understanding of asset condition and performance requirements for the planning period. These activities are incorporated into the annual works plan. Planned maintenance activities are scheduled to avoid resource constraints during peak work times, which often see this work carried out during winter when land access for renewal work is constrained.
The preventive maintenance plan outlines the visual inspection for overhead lines, distribution switches, ground mounted transformers and zone substations. It is also used to monitor the condition of power transformers with regular condition tests. Currently our pole inspections are time rather than condition or risk driven presenting an opportunity for improvement in the pole inspection regime.
Preventive vegetation management programme also links to maintenance with a third of the sub‐transmission and distribution network inspected every year by helicopter. This allows targeted trimming of trees before they encroach on the regulatory growth limits.
Reactive Maintenance
Reactive maintenance refers to the repair of faults, as well as urgent unplanned work that may be required to avoid a safety or environmental issue, or prevent an imminent failure.
Reactive maintenance cannot usually be scheduled and is highly dependent on weather events such as storms or high winds which create conditions that can lead to a failure, e.g. wind loading, tree‐fall, lightning and car‐hits‐pole events. Reactive maintenance uses the same engineering and field staff as planned maintenance and capital works. When it occurs it necessarily breaks into and takes priority over the work schedule. As a result work scheduling continually changes to cater for unplanned events.
An overview of how this work is managed is provided below. Each category of work should be captured separately in the work flow to report the labour requirement and costs of each. This then assists with understanding the optimality of the maintenance strategy.
Figure 6.2.1 Maintenance Workflow

Operations and Maintenance | 95
Preventive Maintenance Schedule
The preventive maintenance schedule sees that routine work scheduled to ensure our assets remain safe, reliable and compliant. The maintenance schedule also seeks to achieve a time‐relevant understanding of the asset condition in order to enable renewal or improvement works at the optimal time. TLC’s preventive maintenance schedule is outlined below.
Overhead Structure and Conductors Key Risks
Key risks for overhead structure and conductors include:
Public safety risk from vehicles colliding with the poles resulting in uncontrolled exposure to live conductors
Insulator failures
Flashover and earth faults caused by animals (birds, opossums etc)
Flashover caused by contact with trees or wind‐blown debris
Public or staff injury from pole collapse caused by rotten pole structure or loss of pole stay wires
Pole, insulator or conductor damage caused by lightning strike
Maintenance Undertaken
Maintenance is centered on conducting visual inspections to identify existing or potential problems which may cause future failures
Asset Class Frequency Scope of Work
Sub‐transmission Lines 12 monthly Helicopter patrols
11 kV and Low Voltage Lines
18 monthly
3 yearly
Drive or foot patrol
Helicopter patrols ‐ Hazard
11 kV Structure and Conductors
15 yearly A full inspection programme including pole testing
Cables Key Risks
Key risks for cables are:
For Mt Ruapehu ski‐field cables public safety and reliability risk caused by rock and snow groomer damage
Mechanical damage from third party excavations
Cable joint failures
Maintenance Undertaken
Maintenance includes visual inspections of over‐ground cables, and repairs as issues are identified.
Asset Class Frequency Scope of Work
Cables (ski‐field areas)
12 monthly Foot patrols through the low valley areas, stream beds, rock movement areas, in/around tracks and high hazard areas
Other Cables 3 yearly Foot patrols of cables and visual inspections of till box integrity
Pillar Box Terminations 5 yearly Inspection

Operations and Maintenance | 96
Pole Mounted Distribution Switches Key Risks
Key risks for pole mounted distribution switches are:
Staff injury from flashover caused by failed switch mechanisms
In service failure resulting in outage
Maintenance Undertaken
Asset Class Frequency Scope of Work
Remote Switchgear Operation
12 monthly Operational check of remote controlled switchgear overhead
Overhead Remote Switch Battery Change
3 yearly Change the battery on all remote switch control units. Check alarms. Visual inspection
Oil Recloser Oil Change 3 yearly
Operation count
Recloser refurbishment at workshop
Ground Mounted Distribution Transformers and Switches Key Risks
Key risks for ground mounted distribution transformers and switches are:
Staff injury from flashover or explosion caused by failed switch mechanisms
Electrocution risk when working on ground mount transformers with exposed conductors (in wooden and tin sheds)
Environmental damage caused by uncontained oil spills
Operational failure caused by deterioration of paper insulation of the windings.
Maintenance Undertaken
Asset Class Frequency Scope of Work
Transformers 5 yearly Inspection
Distribution Substations 2 monthly Visual Inspection. Check, record value and reset MDIs at selected distribution substations
GM Oil Filled HV Switch Service
12 monthly Service oil switches and check operation
Voltage Regulators Key Risks
Key risks for voltage regulators are:
Environmental risk caused by fire damage or uncontained oil spills
Public safety risk caused by compromised fencing and barriers
Injury to staff and public from flashover and explosion caused by faulty equipment
Maintenance Undertaken
Asset Class Frequency Scope of Work
Regulator Inspection 12 monthly Visual inspection
Regulator Thermal Image Survey
12 monthly Thermal image survey of regulator and all associated equipment and connections
Regulator Controller Test 12 monthly Operation and alarm test.
Regulator Internal Inspection
200,000 operations
Internal inspection and change oil in regulators

Operations and Maintenance | 97
Zone Substation Buildings and Grounds Key Risks
Key risks for zone substation buildings and grounds are:
Substation and environmental risk caused by fire damage or uncontained oil spills
Public safety risk caused by compromised fencing and barriers
Water and condensation damage to control circuitry
Maintenance Undertaken
Asset Class Frequency Scope of Work
Buildings and Grounds 2 monthly Inspection and minor repairs without requiring outage
Zone Substation Power Transformers
Key Risks
Key risks for zone substation power transformers are:
Environmental damage caused by uncontained oil spills
Operational failure caused by deterioration of paper insulation of the windings or manufacturing defect.
Flashover caused by wind‐blown debris
Failure caused by windings and packing become loose and wet with age.
Failure caused by fault currents that cause movement and localised heating.
Failure caused by movement which can deform windings and create localised heating, resulting in ionisation of moisture in the transformer windings.
Maintenance Undertaken
Asset Class Frequency Scope of Work
Visual Inspection 2 Monthly Routine visual equipment inspections and checks
Thermal Imaging 12 Monthly Thermal imaging
Transformer Oil Test 2 Yearly Test oil for acidity, power factor, breakdown voltage, moisture content, interfacial tension, colour and dissolved gas analysis (DGA). Furan reading for insulating paper analysis
Tap Changer Service 5 yearly Clean out tap changer to ensure free of arc products and deposits. Replace insulating oil. Check contact alignment and correct operation of tap changer
Transformer Maintenance 5 yearly Close visual inspection, insulation resistance, impedance and Winding Capacitance and power factor test, Buchholz and pressure relief operational test, temperature gauge check, Neutral Earth Resistor test
Test Zone Substation Earthing System
15 years Test zone substation earth mats. Test bonding of equipment and structure

Operations and Maintenance | 98
Zone Substation 33kV Switchgear Key Risks
Key risks for zone substation 33kV switchgear are:
Injury to staff and public from flashover and explosion caused by faulty equipment
Injury to staff from inadvertent operation of unsafe‐to‐operate SDAF switchgear
Injury to staff from incorrect identification and operation of switchgear
Maintenance Undertaken
Asset Class Frequency Scope of Work
Inspection 12 Monthly Routine visual equipment inspections and checks including thermal imaging
Outdoor 33kV Vacuum and SF6 Circuit Breaker servicing
5 Yearly Circuit breaker timing and operational test. Visual inspection of switchgear condition Check SF6 gas pressure
Outdoor Oil Circuit Breaker major servicing
5 Yearly Circuit breaker timing and operational test. Visual inspection of switchgear condition. Breaker service Oil change. Inspect contact.
Indoor Switches 2 Monthly Routine visual equipment inspections and checks.
Thermal Image and Partial Discharge testing
2 Monthly Thermal imaging and partial discharge diagnostic tests
Indoor 11kV Oil Circuit Breaker major servicing
3 Yearly Circuit breaker timing and operational test. Visual inspection of switchgear condition. Breaker service Oil change. Inspect contact
Indoor 11kV Vacuum and SF6 Circuit Breaker servicing
5 Yearly Circuit breaker timing and operational test. Visual inspection of switchgear condition. Check SF6 gas pressure
Field 33kV Switchgear Key Risks
Key risks for field 33kV switchgear are:
Injury to staff and public from flashover and explosion caused by faulty equipment
Injury to staff from incorrect identification and operation of switchgear
In‐service failure resulting in outage
Maintenance Undertaken
Asset Class Frequency Scope of Work
Routine Equipment Inspections
12 monthly Routine visual equipment inspections and checks including thermal imaging
Outdoor 33kV Vacuum and SF6 Circuit Breaker Servicing
5 yearly Circuit breaker timing and operational test. Visual inspection of switchgear condition. Check SF6 gas pressure
Outdoor Oil Circuit Breaker Major Servicing
3 yearly Circuit breaker timing and operational test. Visual inspection of switchgear condition. Breaker service Oil change. Inspect contact

Operations and Maintenance | 99
Outdoor current and voltage transformers Key Risks
Key risks for outdoor current and voltage transformers are:
Arc flash and / or failure caused by wind‐blown debris
Failure or environmental damage caused by oil leaks
Maintenance Undertaken
Asset Class Frequency Scope of Work
Routine Inspections and Checks
12 monthly Routine visual equipment inspections and checks, including thermal imaging
33kV Oil Filled Voltage Transformers and Current Transformers
3 yearly Insulation resistance test. Oil change.
Other assets Maintenance Undertaken
Asset Class Frequency Scope of Work
SCADA and Communications
Radio Site Checks 3 yearly Visual inspection, battery charger and battery impedance tests
Auxiliary Supplies
Battery Maintenance 12 monthly Battery impedance test and charger test. Visual inspection
Protection Relays
Routine Inspections and Checks
12 monthly Routine visual equipment inspections and checks
Protection Testing for Electromechanical/Static Relays
5 yearly Secondary injection tests and check operation
Protection Testing for Numerical Relays
5 yearly Secondary injection tests and check operation
Protection Review Relay attributes check including settings, standards, discrimination and records checks. Check for the impact of any changes in the Network
6.3 Vegetation Management
Our network crosses through dense vegetation and forested areas. TLC has a high exposure to faults resulting from tree fall, particularly during storm events. We invest significantly in vegetation management to maintain reliable supply to our rural customers.
Vegetation management involves tree trimming and removal, inspections to determine the amount of work required and liaising with tree owners regarding the work needed on their property.
The issues and solutions associated with our vegetation management are summarised in the table below:
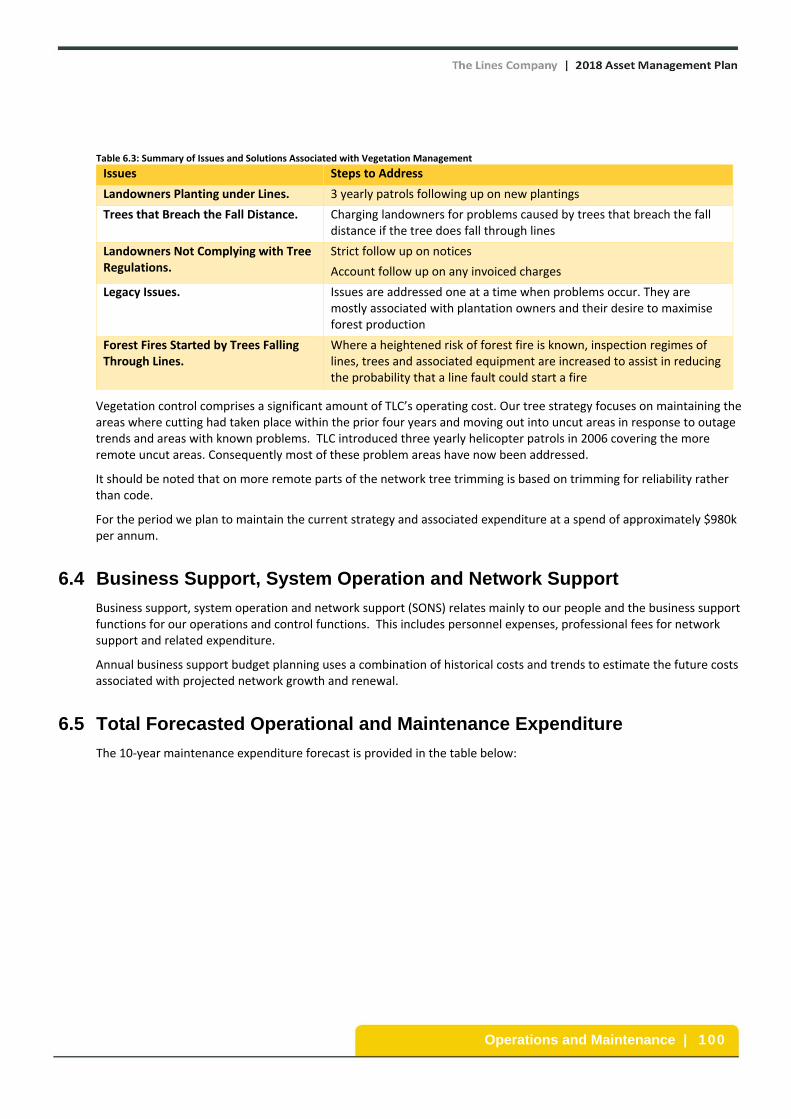
Operations and Maintenance | 100
Table 6.3: Summary of Issues and Solutions Associated with Vegetation Management
Issues Steps to Address
Landowners Planting under Lines. 3 yearly patrols following up on new plantings
Trees that Breach the Fall Distance. Charging landowners for problems caused by trees that breach the fall distance if the tree does fall through lines
Landowners Not Complying with Tree Regulations.
Strict follow up on notices
Account follow up on any invoiced charges
Legacy Issues. Issues are addressed one at a time when problems occur. They are mostly associated with plantation owners and their desire to maximise forest production
Forest Fires Started by Trees Falling Through Lines.
Where a heightened risk of forest fire is known, inspection regimes of lines, trees and associated equipment are increased to assist in reducing the probability that a line fault could start a fire
Vegetation control comprises a significant amount of TLC’s operating cost. Our tree strategy focuses on maintaining the areas where cutting had taken place within the prior four years and moving out into uncut areas in response to outage trends and areas with known problems. TLC introduced three yearly helicopter patrols in 2006 covering the more remote uncut areas. Consequently most of these problem areas have now been addressed.
It should be noted that on more remote parts of the network tree trimming is based on trimming for reliability rather than code.
For the period we plan to maintain the current strategy and associated expenditure at a spend of approximately $980k per annum.
6.4 Business Support, System Operation and Network Support
Business support, system operation and network support (SONS) relates mainly to our people and the business support functions for our operations and control functions. This includes personnel expenses, professional fees for network support and related expenditure.
Annual business support budget planning uses a combination of historical costs and trends to estimate the future costs associated with projected network growth and renewal.
6.5 Total Forecasted Operational and Maintenance Expenditure
The 10‐year maintenance expenditure forecast is provided in the table below:

Operations and Maintenance | 101
Table 6.5: Summary of all Operational and Maintenance Expenditure – 10 years
$ 000’s 2019 2020 2021 2022 2023 2024 2025 2026 2027 2028
Maintenance
Preventive Expenditure
1,199 1,199 1,199 1,199 1,199 1,199 1,199 1,199 1,199 1,199
Reactive Expenditure
1,165 1,165 1,165 1,165 1,165 1,165 1,165 1,165 1,165 1,165
Asset Replacement and Renewal
Planned Expenditure
190 190 190 190 190 190 190 190 190 190
Vegetation Management
Planned Expenditure
984 984 984 984 984 984 984 984 984 984
System Operation and Network Support (SONS)
Planned Expenditure
2,520 2,529 2,535 2,540 2,549 2,558 2,568 2,582 2,591 2,601
Business Support
Planned Expenditure
6,143 5,938 5,707 5,468 5,422 5,439 5,453 5,472 5,492 5,511
Total 12,201 12,005 11,780 11,546 11,509 11,535 11,559 11,592 11,621 11,650
Figure 6.5: Summary of All Operational Expenditure
The forecast decrease in expenditure from year three onwards is due to operational efficiencies following the implementation of the new Time of Use pricing.
‐
2,000
4,000
6,000
8,000
10,000
12,000
14,000
2019 2020 2021 2022 2023 2024 2025 2026 2027 2028
$ 000's
Financial Year
Operational Expenditure
Preventive Maintenance Reactive Maintenance
Asset Replacement and Renewal Vegetation Management
System Operations and Network Support Business Support

Summary of Expenditure & Forecasts | 102
Summary of Expenditure & Forecasts
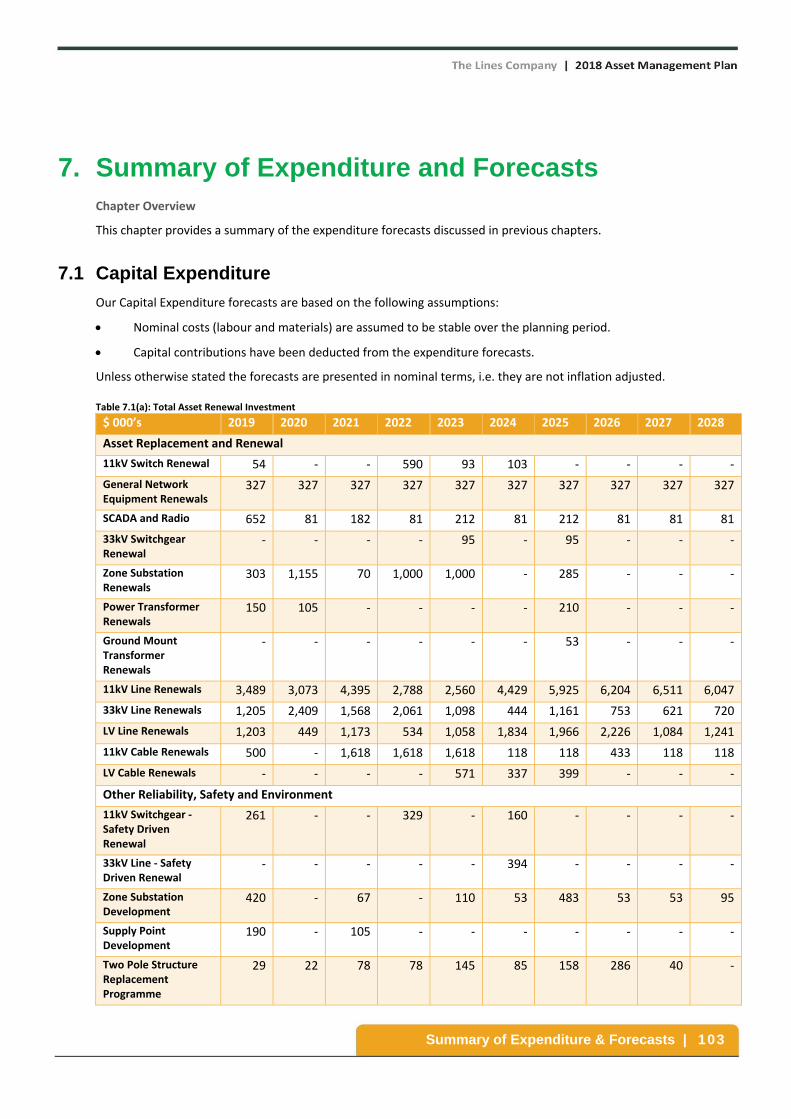
Summary of Expenditure & Forecasts | 103
7. Summary of Expenditure and Forecasts Chapter Overview
This chapter provides a summary of the expenditure forecasts discussed in previous chapters.
7.1 Capital Expenditure
Our Capital Expenditure forecasts are based on the following assumptions:
Nominal costs (labour and materials) are assumed to be stable over the planning period.
Capital contributions have been deducted from the expenditure forecasts.
Unless otherwise stated the forecasts are presented in nominal terms, i.e. they are not inflation adjusted.
Table 7.1(a): Total Asset Renewal Investment
$ 000’s 2019 2020 2021 2022 2023 2024 2025 2026 2027 2028
Asset Replacement and Renewal
11kV Switch Renewal 54 ‐ ‐ 590 93 103 ‐ ‐ ‐ ‐
General Network Equipment Renewals
327 327 327 327 327 327 327 327 327 327
SCADA and Radio 652 81 182 81 212 81 212 81 81 81
33kV Switchgear Renewal
‐ ‐ ‐ ‐ 95 ‐ 95 ‐ ‐ ‐
Zone Substation Renewals
303 1,155 70 1,000 1,000 ‐ 285 ‐ ‐ ‐
Power Transformer Renewals
150 105 ‐ ‐ ‐ ‐ 210 ‐ ‐ ‐
Ground Mount Transformer Renewals
‐ ‐ ‐ ‐ ‐ ‐ 53 ‐ ‐ ‐
11kV Line Renewals 3,489 3,073 4,395 2,788 2,560 4,429 5,925 6,204 6,511 6,047
33kV Line Renewals 1,205 2,409 1,568 2,061 1,098 444 1,161 753 621 720
LV Line Renewals 1,203 449 1,173 534 1,058 1,834 1,966 2,226 1,084 1,241
11kV Cable Renewals 500 ‐ 1,618 1,618 1,618 118 118 433 118 118
LV Cable Renewals ‐ ‐ ‐ ‐ 571 337 399 ‐ ‐ ‐
Other Reliability, Safety and Environment
11kV Switchgear ‐ Safety Driven Renewal
261 ‐ ‐ 329 ‐ 160 ‐ ‐ ‐ ‐
33kV Line ‐ Safety Driven Renewal
‐ ‐ ‐ ‐ ‐ 394 ‐ ‐ ‐ ‐
Zone Substation Development
420 ‐ 67 ‐ 110 53 483 53 53 95
Supply Point Development
190 ‐ 105 ‐ ‐ ‐ ‐ ‐ ‐ ‐
Two Pole Structure Replacement Programme
29 22 78 78 145 85 158 286 40 ‐

Summary of Expenditure & Forecasts | 104
$ 000’s 2019 2020 2021 2022 2023 2024 2025 2026 2027 2028
Ground Mount Transformer Safety Renewal Programme
710 1,512 1,386 861 ‐ ‐ 47 ‐ ‐ 53
Table 7.1(b): Total Network Development Investment
$ 000’s 2019 2020 2021 2022 2023 2024 2025 2026 2027 2028
System Growth
11kV Development 802 1,264 135 765 564 82 ‐ 135 ‐ 236
Voltage Regulation ‐ ‐ 126 114 114 110 ‐ ‐ 114 228
33kV Development 190 1,250 ‐ 820 662 ‐ ‐ ‐ ‐ ‐
Zone Substation Development 105 105 ‐ ‐ 205 2,455 158 ‐ ‐ ‐
Supply Point Development ‐ 1,000 300 ‐ ‐ ‐ ‐ ‐ ‐ ‐
Quality of Supply
11kV Reliability and Security Development
‐ 80 120 180 ‐ ‐ ‐ ‐ ‐ ‐
11kV Switchgear Automation 235 ‐ 45 342 492 414 63 463 400 500
33kV Reliability Development 204 ‐ 64 ‐ ‐ ‐ ‐ ‐ ‐ ‐
Zone Substation Security of Supply Development
1,615 ‐ ‐ ‐ 210 ‐ ‐ 194 ‐ ‐
Supply Point Security of Supply Development
‐ ‐ 53 368 1,260 1,260 ‐ ‐ ‐ ‐
Table 7.1(c): Total Customer Required Investment
$ 000’s 2019 2020 2021 2022 2023 2024 2025 2026 2027 2028
Customer Specific 4,555 3,193 1,595 967 700 700 700 700 700 700
General New Connections and Upgrades
381 381 381 381 381 381 381 381 381 381
Asset Relocation 12 12 12 12 12 12 12 12 12 12
Table 7.1(d): Total Non‐Network Investment
$ 000’s 2019 2020 2021 2022 2023 2024 2025 2026 2027 2028
Office Building 300 3,100 ‐ ‐ ‐ ‐ ‐ ‐ ‐ ‐
Vehicles 150 86 86 86 86 86 86 86 86 86
Data Systems 50 141 197 197 141 30 30 30 30 30
EV Charger Project 250
Plant and Equipment 35 35 35 35 35 35 35 35 35 35
The total capital expenditure for the 10‐year planning period is summarized in the following table:
Table 7.1(e): Capital Expenditure
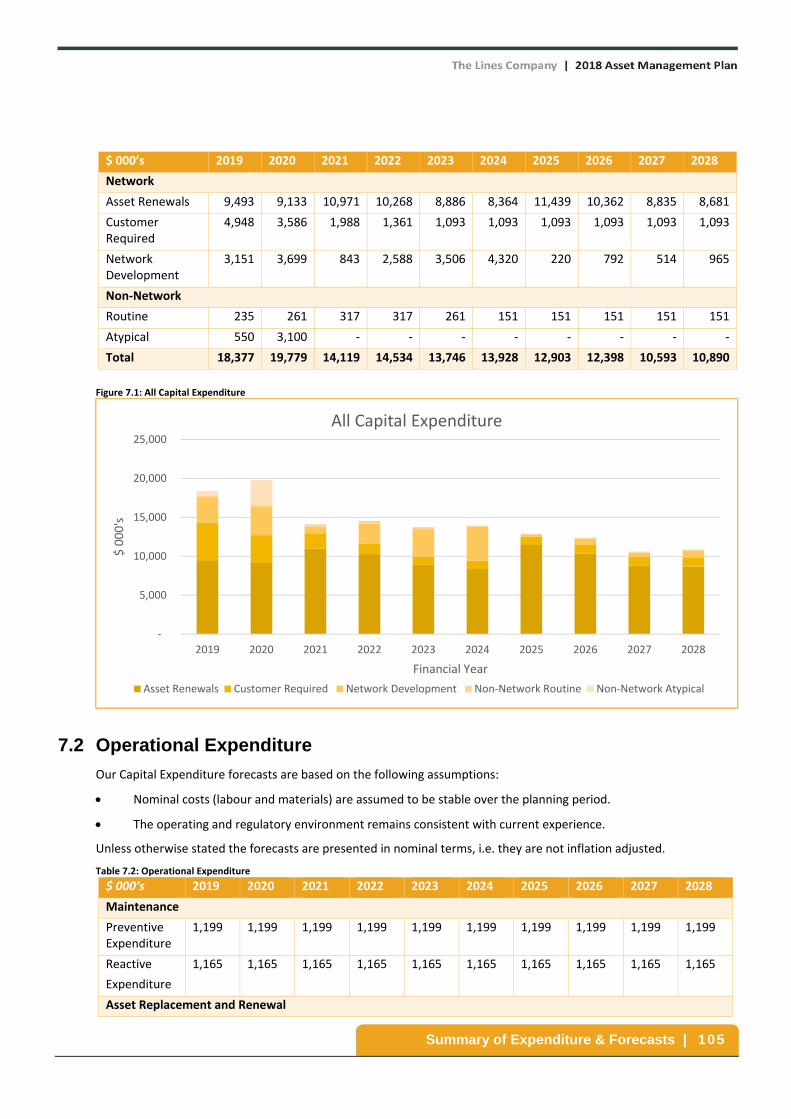
Summary of Expenditure & Forecasts | 105
$ 000’s 2019 2020 2021 2022 2023 2024 2025 2026 2027 2028
Network
Asset Renewals 9,493 9,133 10,971 10,268 8,886 8,364 11,439 10,362 8,835 8,681
Customer Required
4,948 3,586 1,988 1,361 1,093 1,093 1,093 1,093 1,093 1,093
Network Development
3,151 3,699 843 2,588 3,506 4,320 220 792 514 965
Non‐Network
Routine 235 261 317 317 261 151 151 151 151 151
Atypical 550 3,100 ‐ ‐ ‐ ‐ ‐ ‐ ‐ ‐
Total 18,377 19,779 14,119 14,534 13,746 13,928 12,903 12,398 10,593 10,890
Figure 7.1: All Capital Expenditure
7.2 Operational Expenditure
Our Capital Expenditure forecasts are based on the following assumptions:
Nominal costs (labour and materials) are assumed to be stable over the planning period.
The operating and regulatory environment remains consistent with current experience.
Unless otherwise stated the forecasts are presented in nominal terms, i.e. they are not inflation adjusted.
Table 7.2: Operational Expenditure
$ 000’s 2019 2020 2021 2022 2023 2024 2025 2026 2027 2028
Maintenance
Preventive Expenditure
1,199 1,199 1,199 1,199 1,199 1,199 1,199 1,199 1,199 1,199
Reactive
Expenditure
1,165 1,165 1,165 1,165 1,165 1,165 1,165 1,165 1,165 1,165
Asset Replacement and Renewal
‐
5,000
10,000
15,000
20,000
25,000
2019 2020 2021 2022 2023 2024 2025 2026 2027 2028
$ 000's
Financial Year
All Capital Expenditure
Asset Renewals Customer Required Network Development Non‐Network Routine Non‐Network Atypical

Summary of Expenditure & Forecasts | 106
$ 000’s 2019 2020 2021 2022 2023 2024 2025 2026 2027 2028
Planned Expenditure
190 190 190 190 190 190 190 190 190 190
Vegetation Management
Planned Expenditure
984 984 984 984 984 984 984 984 984 984
System Operation and Network Support (SONS) Planned Expenditure
2,520 2,529 2,535 2,540 2,549 2,558 2,568 2,582 2,591 2,601
Business Support Planned Expenditure
6,143 5,938 5,707 5,468 5,422 5,439 5,453 5,472 5,492 5,511
Total 12,201 12,005 11,780 11,546 11,509 11,535 11,559 11,592 11,621 11,650
Figure 7.2: Operational Expenditure
‐
2,000
4,000
6,000
8,000
10,000
12,000
14,000
2019 2020 2021 2022 2023 2024 2025 2026 2027 2028
$ 000's
Financial Year
Operational Expenditure
Preventive Maintenance Reactive Maintenance
Asset Replacement and Renewal Vegetation Management
System Operations and Network Support Business Support

Asset Management Performance | 107
Asset Management Performance

Asset Management Performance | 108
8. Asset Management Performance Chapter Overview
This chapter describes our performance targets for the AMP period 2018‐2027. At the end of each focus area there is a commentary on our current performance.
There are four areas of focus:
Safety.
Customer experience.
Asset Performance.
Cost Efficiency.
The measures outlined in this chapter are based on the current state of our performance monitoring framework. This framework is undergoing significant review to align it with the company’s new strategic direction and it is expected that the measures and targets will change materially as this work is completed. Improvements that will contribute to these changes are identified in each of the categories below. Where appropriate the revised measures and targets will be represented in the 2019 Asset Management Plan.
8.1 Safety
8.1.1 Overview
Safety of our team, our customers and our community is of paramount importance to TLC. We strongly believe that there is no job that is so important that it cannot be completed safely, and that incorporating safety into the design and operation of our assets is the best way to minimise the risk of harm to our team, our customers and our community. Public safety continues to be a key consideration.
Improvement initiatives
An external review comparing TLC health and safety practices against industry peers has recently been completed. A two‐year roadmap has been developed which will focus on improving both our health and safety culture and performance. We are currently revisiting our health and safety metrics and targets to align with industry best practice, however these have yet to be finalised and will be detailed in the 2019 Statement of Corporate intent and Asset Management Plan.
Safety targets for the coming year are:
That there are no notifiable incidents that lead to serious harm.
There is steady improvement in lost time injuries.
That there is continuous improvement in health and safety culture.
Public Safety
A large number of our assets are located within publicly accessible areas. Our design standards incorporate public safety requirements and ongoing inspection and audit of our network ensures that these safety measures remain effective. Areas deemed high public safety risks (e.g. schools, parks, community areas) are inspected on a more regular basis. During execution of work on our assets, our teams are focused on ensuring that all risks and hazards are identified and managed in accordance with industry best practice.
Our public safety target is zero public safety incidents.

Asset Management Performance | 109
8.1.2 Measures and Targets
Table 8.1.2: Safety Targets 2019‐2028
Safety Measures 2019 2020 2021 2022 2023 2024 2025 2026 2027 2028
Lost Time Injuries (LTI) Continued reduction from previous year’s LTI count
Serious Harm Incidents 0 0 0 0 0 0 0 0 0 0
Health and Safety Culture Continual improvement in health and safety culture
Public Safety Incidents 0 0 0 0 0 0 0 0 0 0
8.1.3 Current Performance
Table 8.1.3: Safety Performance 2017 and 2018
Safety Performance 2017 Forecast 2018
Target Actual Variance Target Actual Variance
% %
Lost Time Injuries (LTI) N/A 8 N/A <8 5 37.5
Serious Harm Injuries 0 0 0 0
Health and Safety Culture N/A N/A N/A N/A N/A N/A
Public Safety Incidents 0 0 0 0 0 0
8.2 Customer Experience
8.2.1 Overview
Our customers’ experience dealing with us and the service levels they receive from our network are key elements in how we operate our business. We remain focused on ensuring that our network remains reliable and that when our customers contact us we respond in a timely and professional manner to resolve their queries. We proactively engage our customers through regular customer clinics across the region. Through these we offer advice on improving energy efficiency within the home, tips on managing power bills and general information on the services that we offer as a company. We also solicit feedback on the level of service they receive from us at both a company and a network level.
This year will see a significant change in our pricing methodology as we move from the historical demand‐based billing to the simpler and more transparent Time of Use approach. Input was sought from our customers through direct contact, community meetings and trials in finalising the new approach.
Improvement Initiatives
A review of the measures we use to understand customer perception and satisfaction is currently underway. Work is also underway to further quantify poor reliability asset groups and the underlying causes. The 2019 Asset Management Plan will include targets on these items. We expect that in the short term this will result in around two SAIDI minute reduction in unplanned outages. This will be used to bolster the planned outage allowance for the upcoming investment programme.
We have classified our network into three groups to assist in managing its performance
Total System Average Interruption Duration Index (SAIDI)
Urban.
Rural.
Remote Rural.

Asset Management Performance | 110
8.2.2 Measures and Targets
Table 8.2.2(a): Customer Minutes Targets by Customer Classification
Measure Total % of
customers
Customer minutes/1000
2019 2020 2021 2022 2023 2024 2025 2026 2027 2028
Urban 28% 1,703 1,703 1,703 1,703 1,703 1,703 1,703 1,703 1,703 1,703
Rural 65% 4,349 4,349 4,349 4,349 4,349 4,349 4,349 4,349 4,349 4,349
Remote Rural 8% 896 896 896 896 896 896 896 896 896 896
Total
6,948 6,948 6,948 6,948 6,948 6,948 6,948 6,948 6,948 6,948
Table 8.2.2(b): Network Performance Targets
Compliance SAIDI/SAIFI
2019 2020 2021 2022 2023 2024 2025 2026 2027 2028
Planned SAIDI 58.68 62.19 65.63 69.00 72.30 75.54 78.71 81.82 84.87 87.86
Unplanned SAIDI 175.50 171.99 168.55 165.18 161.88 158.64 155.47 152.36 149.31 146.32
Total SAIDI 234.18 234.18 234.18 234.18 234.18 234.18 234.18 234.18 234.18 234.18
Planned SAIFI 0.87 0.92 0.97 1.02 1.07 1.12 1.17 1.21 1.26 1.30
Unplanned SAIFI 2.6 2.55 2.50 2.45 2.40 2.35 2.30 2.26 2.21 2.17
Total SAIFI 3.47 3.47 3.47 3.47 3.47 3.47 3.47 3.47 3.47 3.47
8.2.3 Current performance
Table 8.2.3(a): Customer Minutes Performance by Customer Classification
Measure
Total % of network customers
Customer Minutes/1000
2015 2016 2017 Forecast 2018
Urban 28% 1,242 1,351 2,424 1,793
Rural 65% 4,570 3,735 4,844 4,246
Remote Rural 8% 1,016 730 786 1,052
Total 6,828 5,816 8,054 7,092
Table 8.2.3(b): Network Performance
Compliance SAIDI/SAIFI 2016 2017 Forecast 2018
Planned SAIDI 33.17 65.09 37.76
Unplanned SAIDI 158.75 186.85 188.93
Total SAIDI 191.92 251.94 226.69
Planned SAIFI 0.20 0.43 0.25
Unplanned SAIFI 3.19 2.95 3.25
Total SAIFI 3.39 3.38 3.50

Asset Management Performance | 111
8.3 Cost Efficiency
8.3.1 Overview
We aim to deliver service from a safe, reliable network to our customers in the most cost effective manner possible. The widely varying nature of our network and its relatively low customer density provides a number of challenges in ensuring that costs remain well controlled. This is primarily driven by the remoteness of (and subsequent access to) a large area of the network and the exposure to significant weather events given our geography.
Improvement Initiatives
A number of changes to the business processes around our works delivery are currently being implemented. It is expected that these will deliver efficiencies in both the planning and execution of planned works. As noted above a predictive risk framework will be implemented across our asset classes. This is also expected to drive better cost efficiency as the risk/performance/cost trade‐off is better articulated at an asset level.
Our cost efficiency targets are:
Opex cost per Customer.
Capital Delivery.
8.3.2 Measures and Targets
Table 8.3.2: Cost efficiency performance targets 2019‐2028
8.3.3 Current Performance
Table 8.3.3: Cost efficiency performance
Cost efficiency 2015 2016 2017 Forecast 2018
Target Actual Var% Target Actual Var % Target Actual Var % Target
OPEX Cost per customer ($) 407 414 2% 427 461 8% 464 485 5% 488
CAPEX ($M) 13,288 10,616 ‐20% 16,905 10,384 ‐39% 14,780 10,403 ‐30% 19,635
8.4 Asset performance
8.4.1 Overview
Performance of our assets is strongly influenced by the decisions we make in the design, construction, operation and maintenance of our assets. Our focus is to ensure that our assets achieve or maintain performance levels at the lowest life cycle cost.
Improvement Initiatives
Our asset management processes are undergoing review and alignment with the ISO 55000 standard to ensure a consistent approach is applied to the management of our assets. Incorporated in this will be the implementation of a risk‐based framework for our major asset classes. This will be used to translate asset condition into risk and project future risk scenarios to ensure that maintenance and/or replacement works are carried out at the optimal risk/performance/cost point. It is expected that the full implementation of this framework will take three years.
The Asset Performance measurement used until the improvement initiatives are implemented are:
GXP Load Factor.
Transformer Utilisation.
Measure 2019 2020 2021 2022 2023 2024 2025 2026 2027 2028
OPEX Cost per customer ($) 502 504 504 504 513 525 536 549 561 574
CAPEX performance % ± 10% ± 10% ± 10% ± 5% ± 5% ± 5% ± 5% ± 5% ± 5% ± 5%

Asset Management Performance | 112
8.4.2 Measures and Targets
Table 8.4.2: Asset Performance Targets 2019‐2028
Measure 2019 2020 2021 2022 2023 2024 2025 2026 2027 2028
Load factor at GXPs >60% >60% >60% >60% >60% >60% >60% >60% >60% >60%
Total Transformer Utilisation >35% >35% >35% >35% >35% >35% >35% >35% >35% >35%
8.4.3 Current Performance
Table 8.4.3: Asset Performance 2017 and 2018
Asset Performance Objectives
2017 Forecast 2018
Target Actual Var % Target Actual Var%
GXP Load Factor 60% 58% (3%) 60% 67% 12%
Transformer Utilisation 35% 33% (6%) 35% 28% (20%)

Continual Improvement | 113
Continual Improvement

Continual Improvement | 114
9. Continual Improvement Chapter Overview
This chapter explains how our current asset management performance is assessed to identify gaps to drive our improvement programme.
9.1 Assessment of Asset Management Performance
9.1.1 Asset Management Maturity Assessment Tool (AMMAT)
The Asset Management Maturity Assessment Tool is a prescribed group of questions set by the Commerce Commission that all electricity distributors in New Zealand must use to assess our asset management capability.
The AMMAT tool is a self‐assessment comprising 31 questions that are grouped into six key areas. The questions relate to the key components of the PAS 55 standard framework for asset management and ranks our maturity level from 0 to 4. We undertake this self‐assessment each year to track and report on our progress in asset management competency.
The AMMAT tool informs us and stakeholders about the level of competency we believe we have reached at the time of assessment. We derive benefit from our internal discussions and views around the level of asset management capability and competency appropriate for our stakeholders and the identification of improvement opportunities.
9.1.2 2018 AMMAT Assessment
Our 2018 assessment is summarised below. Overall, we believe our asset management performance and maturity is still developing, but we have made significant improvements since our last assessment in 2017. This indicates that the initiatives we are undertaking to improve our business systems, structure, and asset management processes are beginning to take effect.
We have a range of initiatives planned for the coming year that are intended to lift our understanding of our assets, their key risks and the way we manage our asset management workflow. We are also continuing to progress our core asset management structure and processes.
Figure 9.1.2 Asset Management Maturity Assessment

Continual Improvement | 115
9.1.3 AM Gaps to Maturity Level 3
An assessment of each functional area of asset management shows the following gaps to competent (Maturity level 3):
Table 9.1.3: AMMAT Improvement Opportunities
ISO 55000 Section Intermediate (Maturity Level 3 – Competent)
2.1 AM Policy Development
Wide engagement with Stakeholders and communication of TLC’s new strategy and policy
Visible alignment between the AMP strategy, AMP Objectives and AMP policy with other organisational plans and policies
Development of a strategic asset management plan (a more technically in‐depth data and knowledge repository) to record and evaluate AMP planning at a granular level
Expectations of each activity within the asset management teams clearly defined with detailed action plans, resources, responsibilities and timeframes
Communication of the Asset Management Plan to TLC’s wider stakeholder group through this AMP document and other stakeholder communication channels
2.2 Levels of Service and Performance Management
Customer Group needs analysed
Customers are consulted on significant service levels and options
2.3 Demand Forecasting
A range of demand scenarios is developed (e.g.: high/medium/ low)
2.4 Asset Register Data
Systematic and documented data collection process in place
High level of confidence in critical asset data
2.5 Asset Condition Condition assessment programme derived from benefit‐ cost analysis of options
Condition assessment of assets documented to allow review of key life cycle decisions and outcomes of Data validation process in place
2.6 Risk Management Risk Framework embedded in the organisation
Risks categories are understood and applied consistently across asset groups
Risks managed consistently across the organisation and reported consistently to the Senior Leadership Team and Board of Directors
Outputs are systematically used as inputs to develop training and competency as these requirements are identified
High‐focus risk actions are actively monitored
3.1 Decision Making Formal decision making and prioritisation techniques are applied to all operational and capital asset programmes within each main budget category.
Critical assumptions and estimates are tested for sensitivity to results.
3.2 Operational Planning
Business continuity plans are developed and embedded as key procedural processes.
Emergency response plans and business continuity plans are routinely reviewed and tested
Documented incident and Root Cause Analysis (RCA)
3.3 Maintenance Planning
Contingency plans for all key maintenance activities
Asset failure modes understood and recorded for future reference
Frequency of major preventative maintenance optimised using benefit‐cost analysis
Life Cycle Planning of all assets
Maintenance Backlog Transparent
3.4 Capital Works Planning
Formal options analysis and business case development are completed for major projects in the 3‐5 year period
Processes for Design, modification and procurement documented including safety aspects
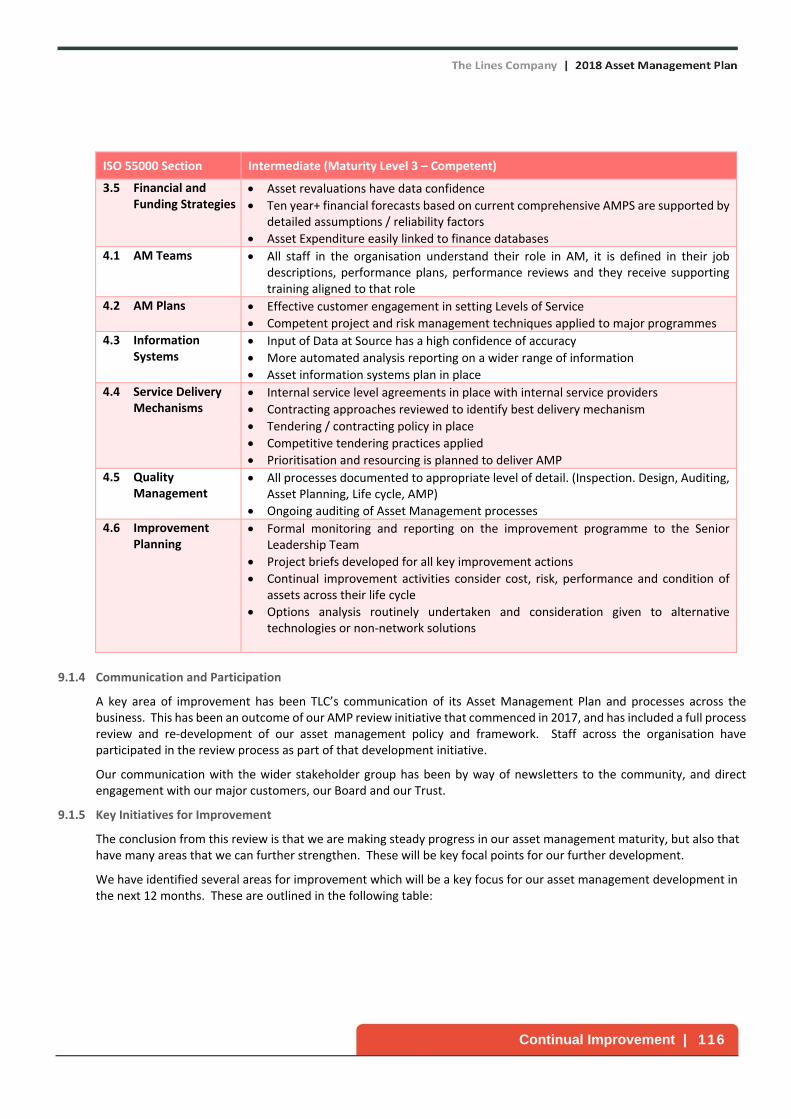
Continual Improvement | 116
ISO 55000 Section Intermediate (Maturity Level 3 – Competent)
3.5 Financial and Funding Strategies
Asset revaluations have data confidence
Ten year+ financial forecasts based on current comprehensive AMPS are supported by detailed assumptions / reliability factors
Asset Expenditure easily linked to finance databases
4.1 AM Teams All staff in the organisation understand their role in AM, it is defined in their job descriptions, performance plans, performance reviews and they receive supporting training aligned to that role
4.2 AM Plans Effective customer engagement in setting Levels of Service
Competent project and risk management techniques applied to major programmes
4.3 Information Systems
Input of Data at Source has a high confidence of accuracy
More automated analysis reporting on a wider range of information
Asset information systems plan in place
4.4 Service Delivery Mechanisms
Internal service level agreements in place with internal service providers
Contracting approaches reviewed to identify best delivery mechanism
Tendering / contracting policy in place
Competitive tendering practices applied
Prioritisation and resourcing is planned to deliver AMP
4.5 Quality Management
All processes documented to appropriate level of detail. (Inspection. Design, Auditing, Asset Planning, Life cycle, AMP)
Ongoing auditing of Asset Management processes
4.6 Improvement Planning
Formal monitoring and reporting on the improvement programme to the Senior Leadership Team
Project briefs developed for all key improvement actions
Continual improvement activities consider cost, risk, performance and condition of assets across their life cycle
Options analysis routinely undertaken and consideration given to alternative technologies or non‐network solutions
9.1.4 Communication and Participation
A key area of improvement has been TLC’s communication of its Asset Management Plan and processes across the business. This has been an outcome of our AMP review initiative that commenced in 2017, and has included a full process review and re‐development of our asset management policy and framework. Staff across the organisation have participated in the review process as part of that development initiative.
Our communication with the wider stakeholder group has been by way of newsletters to the community, and direct engagement with our major customers, our Board and our Trust.
9.1.5 Key Initiatives for Improvement
The conclusion from this review is that we are making steady progress in our asset management maturity, but also that have many areas that we can further strengthen. These will be key focal points for our further development.
We have identified several areas for improvement which will be a key focus for our asset management development in the next 12 months. These are outlined in the following table:

Continual Improvement | 117
Table 9.1.5: Planned AMMAT Improvement Initiatives
Improvement Area Key Initiatives
Safety and Environmental Management
Continue to develop TLC’s safety and environmental processes, and cultural development
Asset Management Process Development
Continue development and documentation of asset management processes, including TLC’s strategic asset management plan, which underpins this Regulatory Asset Management Plan.
Risk Management Embed the Risk Framework into the organisation.
Consistently apply risk management processes across the organisation and in asset management planning activities.
Maintain a risk register that identifies and monitors management of high risks
Emergency Response Planning
Continue development of emergency response and business continuity plans, and ensure they are routinely developed and tested.
Capital Works Planning Improve timeliness and quality of capital works design (work packs)
Improve processes that enable formal options analysis, cost estimation and business case development for major projects
Improve processes that support quality design and project management for large complex projects that are atypical for the business, but are key deliverables in the short to medium term.
Asset Management Team Development
Continue to progress the structure of the asset management and service delivery teams to ensure all staff have a clear understanding of their role in the asset management process.
Ensure these are defined in their job descriptions, performance plans and performance reviews.
Ensure team members are equipped with the necessary tools and training and management support to be effective in their role.
Information Systems Select and deploy automated field tools
Integrate GIS and asset data systems
Further develop asset data systems to provide asset condition and risk insights
Service Delivery Mechanisms
Further develop business scheduling and resource management systems
Review and put in place service level agreements with internal and external service providers.
Develop integrated service delivery reporting mechanisms

Appendices | 118
Appendices
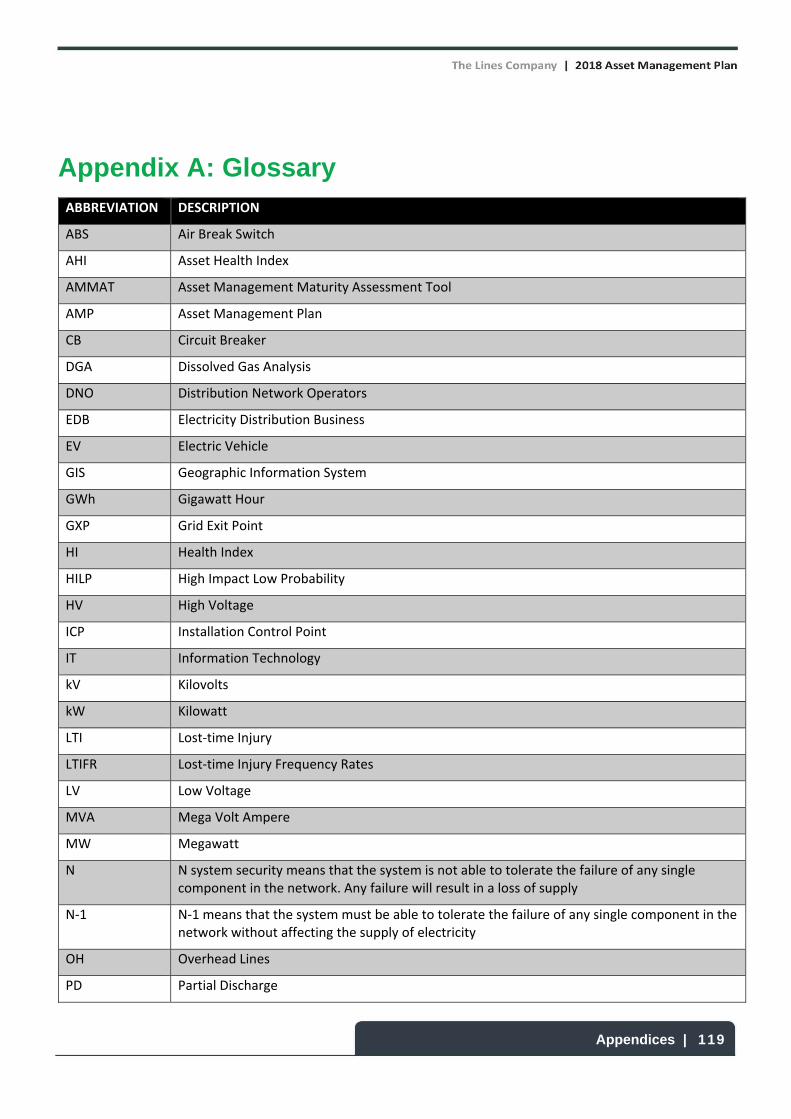
Appendices | 119
Appendix A: Glossary ABBREVIATION DESCRIPTION
ABS Air Break Switch
AHI Asset Health Index
AMMAT Asset Management Maturity Assessment Tool
AMP Asset Management Plan
CB Circuit Breaker
DGA Dissolved Gas Analysis
DNO Distribution Network Operators
EDB Electricity Distribution Business
EV Electric Vehicle
GIS Geographic Information System
GWh Gigawatt Hour
GXP Grid Exit Point
HI Health Index
HILP High Impact Low Probability
HV High Voltage
ICP Installation Control Point
IT Information Technology
kV Kilovolts
kW Kilowatt
LTI Lost‐time Injury
LTIFR Lost‐time Injury Frequency Rates
LV Low Voltage
MVA Mega Volt Ampere
MW Megawatt
N N system security means that the system is not able to tolerate the failure of any single component in the network. Any failure will result in a loss of supply
N‐1 N‐1 means that the system must be able to tolerate the failure of any single component in the network without affecting the supply of electricity
OH Overhead Lines
PD Partial Discharge

Appendices | 120
ABBREVIATION DESCRIPTION
PoF Probability of Failure
PoS Point of Supply
PV Photovoltaic
RCA Root Cause Analysis
SAIDI System Average Interruption Duration Index
SAIFI System Average Interruption Frequency Index
SCADA Supervisory Control and Data Acquisition
SF6 Sulphur Hexafluoride
SONS System Operation and Network Support
TLC The Lines Company
XLPE Cross Linked Polythene

Appendices | 121
Appendix B: Information Disclosure Compliance
REFERENCE REQUIREMENT REF
Summary
3.1 The AMP must include a summary that provides a brief overview of the contents and highlights information that the EDB considers significant.
1
Background and Objectives
3.2 The AMP must include details of the background and objectives of the EDB's asset management and planning processes.
1,
4.3, 6.1
Purpose Statement
3.3 The AMP must include a purpose statement that:
3.3.1 Makes clear the purpose and status of the AMP in the EDB's asset management practices. The purpose statement must also include a statement of the objectives of the asset management and planning processes.
1.1
3.3.2 States the corporate mission or vision as it relates to asset management. 1.1
3.3.3 Identifies the documented plans produced as outputs of the annual business planning process adopted by the EDB.
4.1
3.3.4 States how the different documented plans relate to one another, with particular reference to any plans specifically dealing with asset management.
4.1
3.3.5 Includes a description of the interaction between the objectives of the AMP and other corporate goals, business planning processes, and plans.
4.1, 4.2, 4.3
AMP Period
3.4 The AMP must state that the period covered by the plan is 10 years or more from the commencement of the financial year.
1.2
3.5 The AMP must state the date on which the AMP was approved by the Board of Directors.
1.2
Stakeholder Interests
3.6 The AMP must include a description of stakeholder interests (owners, consumers etc) which identifies important stakeholders and indicates:
3.6.1 How the interests of stakeholders are identified. 2.3.5
3.6.2 What these interests are. 2.3.5
3.6.3 How these interests are accommodated in asset management practices. 2.3.5
3.6.4 How conflicting interests are managed. 2.3.5
Accountabilities and Responsibilities
3.7 The AMP must include a description of the accountabilities and responsibilities for asset management on at least 3 levels, including:

Appendices | 122
3.7.1 Governance ‐ a description of the extent of director approval required for key asset management decisions and the extent to which asset management outcomes are regularly reported to directors.
4.1, 4.4, 4.6
3.7.2 Executive ‐ an indication of how the in‐house asset management and planning organisation is structured.
2.1.4
3.7.3 Field operations ‐ an overview of how field operations are managed, including a description of the extent to which field work is undertaken in‐house and the areas where outsourced contractors are used.
2.1.3
Assumptions
3.8 The AMP must include all significant assumptions. Throughout the document
3.8.1 All significant assumptions must be quantified where possible. 5
3.8.2 All significant assumption must be clearly identified in a manner that makes their significance understandable to interested persons.
1.2.3, 5.10, 7.1, 7.2
3.8.3 The identification of significant assumptions must include a description of changes proposed where the information is not based on the EDB's existing business.
1.2.3, 5.10, 7.1, 7.2
3.8.4 The identification of significant assumptions must include a description of the sources of uncertainty and the potential effect of the uncertainty on the prospective information.
1.2.3, 5.10, 7.1, 7.2
3.8.5 The identification of significant assumptions must include a description of the price inflator assumptions used to prepare the financial information disclosed in nominal New Zealand dollars in the Report on Forecast Capital Expenditure set out in Schedule 11a and the Report on Forecast Operational Expenditure set out in Schedule 11b.
7.1, 7.2?
Material Difference in Information
3.9 The AMP must include a description of the factors that may lead to a material difference between the prospective information disclosed and the corresponding actual information recorded in future disclosures.
1.2.3, 5.10
Asset Management Strategy and Delivery
3.10 The AMP must include an overview of asset management strategy and delivery.
4.1, 4.6, 5
Systems and Information Management Data
3.11 The AMP must include an overview of systems and information management data
4.7
3.12 The AMP must include a statement covering any limitations in the availability or completeness of asset management data and disclose any initiatives intended to improve the quality of this data.
4.7.6, 9.1.3
Asset Management Process

Appendices | 123
3.13 The AMP must include a description of the processes used within the EDB for:
3.13.1 Managing routine asset inspections and network maintenance. 4.6, 6.2
3.13.2 Planning and implementing network development projects. 4.1, 4.6
3.13.3 Measuring network performance. 4.6, 8
3.14 The AMP must include an overview of asset management documentation, controls and review processes.
4.6
Communication Processes
3.15 The AMP must include an overview of communication and participation processes.
9.1.3
Financial Values
3.16 The AMP must present all financial values in constant price New Zealand dollars except where specified otherwise.
Throughout the document
Disclosure Requirements
3.17 The AMP must be structured and presented in a way that the EDB considers will support the purposes of AMP disclosure set out in clause 2.6.2 of the determination.
Throughout the document
Assets Covered
4 The AMP must provide detail of the assets covered, including:
4.1 A high‐level description of the service areas covered by the EDB and the degree to which these are interlinked, including:
1.2
4.1.1 The region(s) covered. 2.3
4.1.2 Identification of large consumers that have a significant impact on network operations or asset management priorities.
2.3
4.1.3 Description of the load characteristics for different parts of the network. 2.3
4.1.4 Peak demand and total energy delivered in the previous year, broken down by sub‐network, if any.
1.3
Network Configuration
4.2 The AMP must provide a description of the network configuration, including:
4.2.1 Identifying bulk electricity supply points and any distributed generation with a capacity greater than 1 MW. State the existing firm supply capacity and current peak load of each bulk electricity supply point.
3.2, 3.3
4.2.2 A description of the sub‐transmission system fed from the bulk electricity supply points, including the capacity of zone substations and the voltage(s) of the sub‐transmission network(s). The AMP must identify the supply security provided at individual zone substations, by describing the extent to which each has n‐x sub‐transmission security or by providing alternative security class ratings.
3.4

Appendices | 124
4.2.3 A description of the distribution system, including the extent to which it is underground.
3.1
4.2.4 A brief description of the network's distribution substation arrangements 3.4
4.2.5 A description of the low voltage network including the extent to which it is underground.
3.1
4.2.6 An overview of secondary assets such as protection relays, ripple injection systems, SCADA and telecommunications systems.
3.1
Sub‐Networks
4.3 If sub‐networks exist, the network configuration information referred to in clause 4.2 must be disclosed for each sub‐network.
N/A
Network Asset Information
4.4 The AMP must describe the network assets by providing the following information for each asset category:
4.4.1 Voltage levels. 3
4.4.2 Description and quantity of assets. 3
4.4.3 Age profile. 5
4.4.4 A discussion of the condition of the assets, further broken down into more detailed categories as considered appropriate. Systemic issues leading to the premature replacement of assets or parts of assets should be discussed.
5
Network Asset Information by Asset Category
4.5 The asset categories discussed in clause 4.4 should include at least the following asset categories:
4.5.1 The categories listed in the Report on Forecast Capital Expenditure in Schedule 11(a).
5
4.5.2 Assets owned by the EDB but installed at bulk electricity supply points owned by others.
3.3
4.5.3 EDB owned mobile substations and generators whose function is to increase supply reliability or reduce peak demand.
3.13
4.5.4 Other generation plant owned by the EDB. 3.3
Service Levels
5 The AMP must clearly identify or define a set of performance indicators for which annual performance targets have been defined. The annual performance targets must be consistent with business strategies and asset management objectives and be provided for each year of the AMP planning period. The targets should reflect what is practically achievable given the current network configuration, condition and planned expenditure levels. The targets should be disclosed for each year of the AMP planning period.
8

Appendices | 125
6 The AMP must include performance indicators for which targets have been defined in clause 5 must include SAIDI values and SAIFI values for the next five disclosure years.
8.2
7 The AMP must include performance indicators for which targets have been defined in clause 5 above should also include:
7.1 Consumer oriented indicators that preferably differentiate between different consumer types.
8.2
7.2 Indicators of asset performance, asset efficiency and effectiveness, and service efficiency, such as technical and financial performance indicators related to the efficiency of asset utilisation and operation.
8.3, 8.4
8 The AMP must describe the basis on which the target level for each performance indicator was determined. Justification for target levels of service includes consumer expectations or demands, legislative, regulatory, and other stakeholders' requirements or considerations. The AMP should demonstrate how stakeholder needs were ascertained and translated into service level targets.
8.3, 8.4
9 Targets should be compared to historic values where available to provide context and scale to the reader.
8.2, 8.3, 8.4
10 Where forecast expenditure is expected to materially affect performance against a target defined in clause 5, the target should be consistent with the expected change in the level of performance.
Network Development Planning
11 AMPs must provide a detailed description of network development plans, including:
11.1 A description of the planning criteria and assumptions for network development.
4.6
11.2 Planning criteria for network developments should be described logically and succinctly. Where probabilistic or scenario‐based planning techniques are used, this should be indicated and the methodology briefly described.
4.6
11.3 A description of strategies or processes (if any) used by the EDB that promote cost efficiency including through the use of standardised assets and designs.
4.61.
11.4 The use of standardised designs. 4.6.1
Network Efficient Operation
11.5 The AMP must include a description of strategies or processes (if any) used by the EDB that promote cost efficiency including through the use of standardised assets and designs.
4.6
Equipment Capacity
11.6 The AMP must include description of the criteria used to determine the capacity of equipment for different types of assets or different parts of the network.
5.3.2
Project Prioritisation
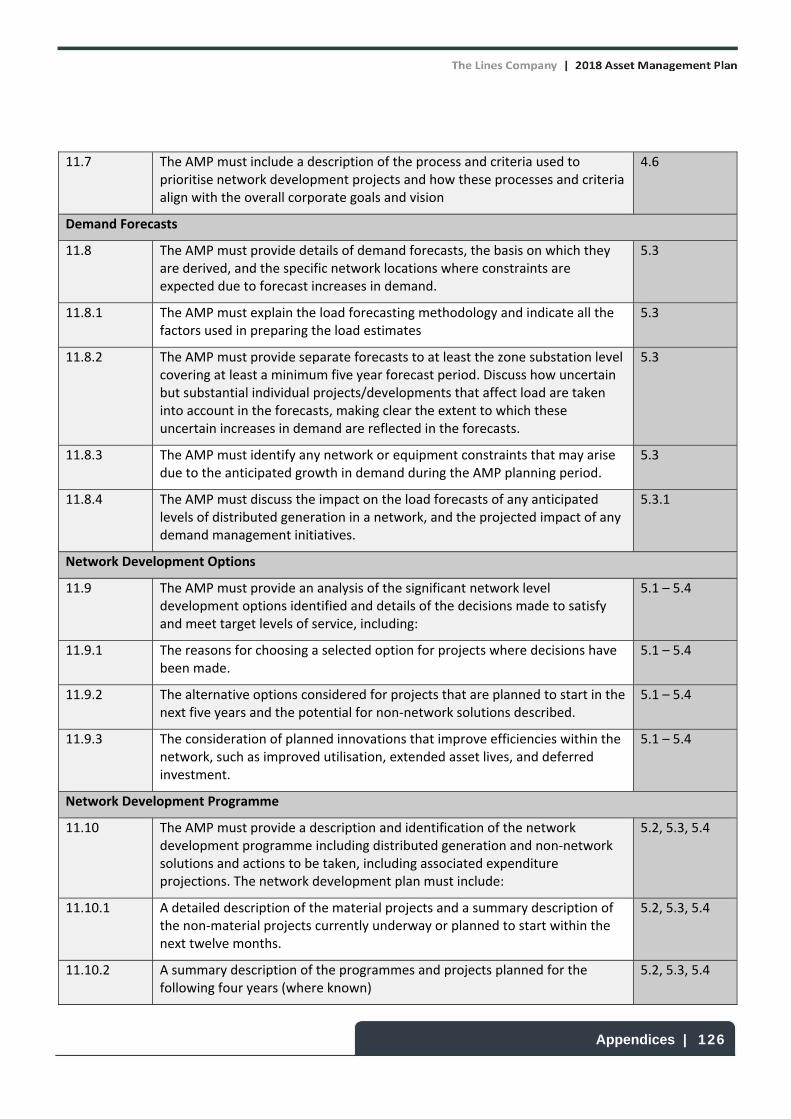
Appendices | 126
11.7 The AMP must include a description of the process and criteria used to prioritise network development projects and how these processes and criteria align with the overall corporate goals and vision
4.6
Demand Forecasts
11.8 The AMP must provide details of demand forecasts, the basis on which they are derived, and the specific network locations where constraints are expected due to forecast increases in demand.
5.3
11.8.1 The AMP must explain the load forecasting methodology and indicate all the factors used in preparing the load estimates
5.3
11.8.2 The AMP must provide separate forecasts to at least the zone substation level covering at least a minimum five year forecast period. Discuss how uncertain but substantial individual projects/developments that affect load are taken into account in the forecasts, making clear the extent to which these uncertain increases in demand are reflected in the forecasts.
5.3
11.8.3 The AMP must identify any network or equipment constraints that may arise due to the anticipated growth in demand during the AMP planning period.
5.3
11.8.4 The AMP must discuss the impact on the load forecasts of any anticipated levels of distributed generation in a network, and the projected impact of any demand management initiatives.
5.3.1
Network Development Options
11.9 The AMP must provide an analysis of the significant network level development options identified and details of the decisions made to satisfy and meet target levels of service, including:
5.1 – 5.4
11.9.1 The reasons for choosing a selected option for projects where decisions have been made.
5.1 – 5.4
11.9.2 The alternative options considered for projects that are planned to start in the next five years and the potential for non‐network solutions described.
5.1 – 5.4
11.9.3 The consideration of planned innovations that improve efficiencies within the network, such as improved utilisation, extended asset lives, and deferred investment.
5.1 – 5.4
Network Development Programme
11.10 The AMP must provide a description and identification of the network development programme including distributed generation and non‐network solutions and actions to be taken, including associated expenditure projections. The network development plan must include:
5.2, 5.3, 5.4
11.10.1 A detailed description of the material projects and a summary description of the non‐material projects currently underway or planned to start within the next twelve months.
5.2, 5.3, 5.4
11.10.2 A summary description of the programmes and projects planned for the following four years (where known)
5.2, 5.3, 5.4
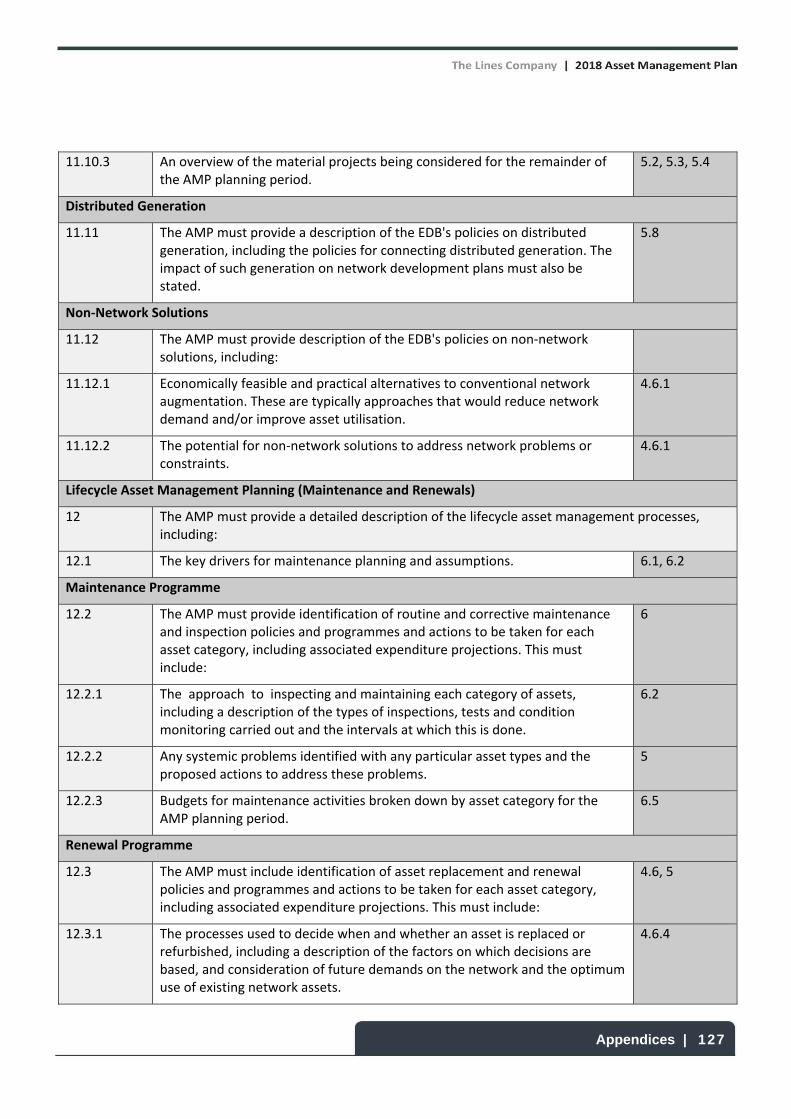
Appendices | 127
11.10.3 An overview of the material projects being considered for the remainder of the AMP planning period.
5.2, 5.3, 5.4
Distributed Generation
11.11 The AMP must provide a description of the EDB's policies on distributed generation, including the policies for connecting distributed generation. The impact of such generation on network development plans must also be stated.
5.8
Non‐Network Solutions
11.12 The AMP must provide description of the EDB's policies on non‐network solutions, including:
11.12.1 Economically feasible and practical alternatives to conventional network augmentation. These are typically approaches that would reduce network demand and/or improve asset utilisation.
4.6.1
11.12.2 The potential for non‐network solutions to address network problems or constraints.
4.6.1
Lifecycle Asset Management Planning (Maintenance and Renewals)
12 The AMP must provide a detailed description of the lifecycle asset management processes, including:
12.1 The key drivers for maintenance planning and assumptions. 6.1, 6.2
Maintenance Programme
12.2 The AMP must provide identification of routine and corrective maintenance and inspection policies and programmes and actions to be taken for each asset category, including associated expenditure projections. This must include:
6
12.2.1 The approach to inspecting and maintaining each category of assets, including a description of the types of inspections, tests and condition monitoring carried out and the intervals at which this is done.
6.2
12.2.2 Any systemic problems identified with any particular asset types and the proposed actions to address these problems.
5
12.2.3 Budgets for maintenance activities broken down by asset category for the AMP planning period.
6.5
Renewal Programme
12.3 The AMP must include identification of asset replacement and renewal policies and programmes and actions to be taken for each asset category, including associated expenditure projections. This must include:
4.6, 5
12.3.1 The processes used to decide when and whether an asset is replaced or refurbished, including a description of the factors on which decisions are based, and consideration of future demands on the network and the optimum use of existing network assets.
4.6.4

Appendices | 128
12.3.2 A description of innovations that have deferred asset replacements. 5.1.1
12.3.3 A description of the projects currently underway or planned for the next twelve months.
5.2
12.3.4 A summary of the projects planned for the following four years (where known).
5.2
12.3.5 An overview of other work being considered for the remainder of the AMP planning period.
5.2
12.4 The asset categories discussed in clauses 12.2 and 12.3 should include at least the categories in clause 4.5.
5.2
Non‐Network Development, Maintenance and Renewal
13 The AMP must provide a summary description of material non‐network development, maintenance and renewal plans, including:
13.1 A description of non‐network assets. 5.6
13.2 Development, maintenance and renewal policies that cover them. 5.6, 6.4
13.3 A description of material capital expenditure projects (where known) planned for the next five years.
5.6
13.4 A description of material maintenance and renewal projects (where known) planned for the next five years.
5.6
Risk Management
14 The AMP must provide details of risk policies, assessment, and mitigation, including:
14.1 Methods, details and conclusions of risk analysis 4.5
14.2 Strategies used to identify areas of the network that are vulnerable to high impact low probability events and a description of the resilience of the network and asset management systems to such events
4.5
14.3 A description of the policies to mitigate or manage the risks of events identified in clause 14.2
4.5
14.4 Details of emergency response and contingency plans 4.8
Evaluation of Performance
15 The AMP must provide details of performance measurement, evaluation, and improvement, including:
15.1 A review of progress against plan, both physical and financial. 8
15.2 An evaluation and comparison of actual service level performance against targeted performance.
8.2
15.3 An evaluation and comparison of the results of the asset management maturity assessment disclosed in the Report on Asset Management Maturity set out in Schedule 13 against relevant objectives of the EDB's asset management and planning processes.
9

Appendices | 129
15.4 An analysis of gaps identified in clauses 15.2 and 15.3. Where significant gaps exist (not caused by one‐off factors), the AMP must describe any planned initiatives to address the situation.
9.1.3
Capability to Deliver
16 The AMP must describe the processes used by the EDB to ensure that:
16.1 It is realistic and the objectives set out in the plan can be achieved 5.9
16.2 The organisation structure and the processes for authorisation and business capabilities will support the implementation of the AMP plans.
2.1, 4.1, 4.4, 4.6
Appendices | 130
Appendix C: Information Disclosure Asset Management Plan Schedules
Number Report Name
11a Forecast Capital Expenditure
11b Forecast Operational Expenditure
12a Asset Condition
12b Forecast Capacity
12c Forecast Network Demand
12d Interruptions and Duration
13 Asset Management Maturity
14a Mandatory Explanatory Notes on Forecast Information

Appendices | 131

Appendices | 132
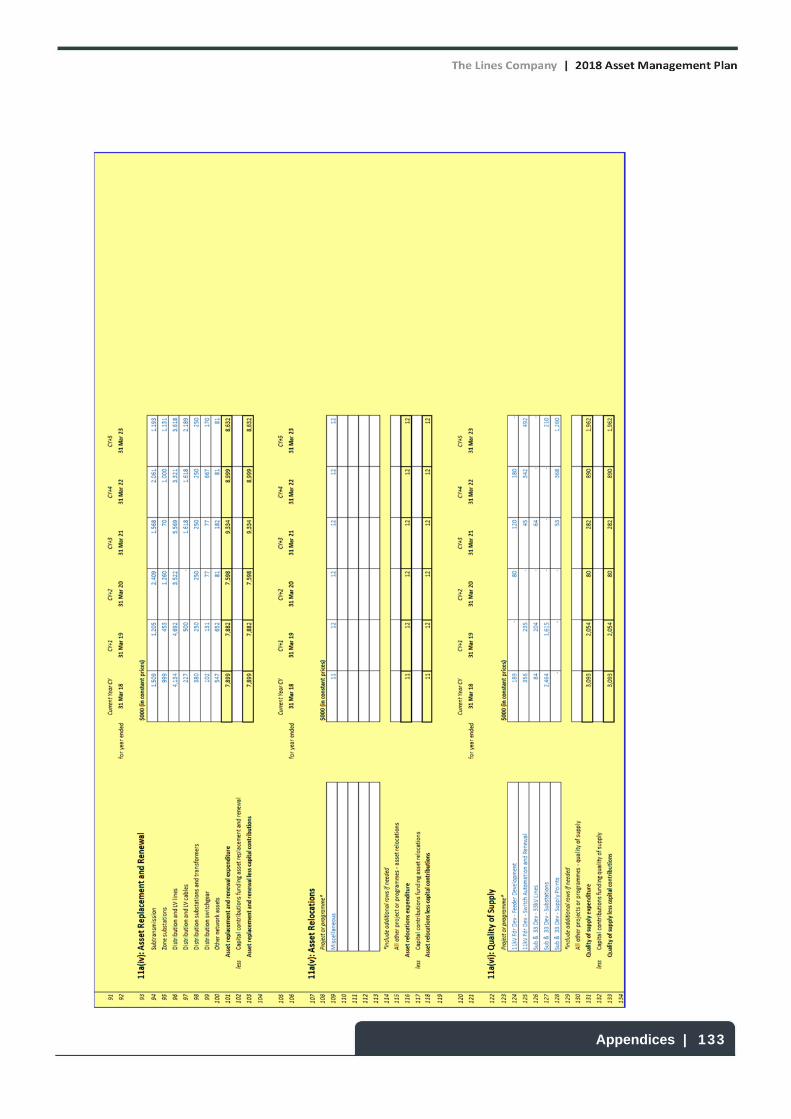
Appendices | 133

Appendices | 134

Appendices | 135

Appendices | 136
Company Nam
e
AMP Planning
Period
SCHED
ULE 12a: R
EPORT
ON ASSET
CONDITION
sch ref
7 8 9
Voltage
Asset category
Asset class
Units
H1
H2
H3
H4
H5
Grade
unkn
own
Data accuracy
(1–4)
10All
Overhead Line
Concrete poles / steel structure
No.
0.48%
0.32%
0.23%
70.00%
14.71%
14.25%
3
0.80%
11All
Overhead Line
Woo
d po
les
No.
2.21%
1.39%
0.45%
44.50%
8.80%
42.64%
2
3.60%
12All
Overhead Line
Other pole type
sNo.
‐‐
‐‐
‐‐N/A
‐
13HV
Subtransmission
Line
Subtransmission
OH up to 66kV cond
uctor
km‐
12.48%
4.14%
82.54%
0.66%
0.17%
212.48%
14HV
Subtransmission
Line
Subtransmission
OH 110kV+ cond
uctor
km‐
‐‐
‐‐
‐N/A
‐
15HV
Subtransmission
Cab
leSubtransmission
UG up to 66kV (XLPE)
km‐
‐‐
9.52%
47.62%
42.86%
2
‐
16HV
Subtransmission
Cab
leSubtransmission
UG up to 66kV (Oil pressurised)
km‐
‐‐
‐‐
‐N/A
‐
17HV
Subtransmission
Cab
leSubtransmission
UG up to 66kV (Gas pressurised
)km
‐‐
‐‐
‐‐N/A
‐
18HV
Subtransmission
Cab
leSubtransmission
UG up to 66kV (PILC)
km‐
‐‐
‐‐
‐N/A
‐
19HV
Subtransmission
Cab
leSubtransmission
UG 110kV+ (XLPE)
km‐
‐‐
‐‐
‐N/A
‐
20HV
Subtransmission
Cab
leSubtransmission
UG 110kV+ (Oil pressurised)
km‐
‐‐
‐‐
‐N/A
‐
21HV
Subtransmission
Cab
leSubtransmission
UG 110kV+ (Gas Pressurised
)km
‐‐
‐‐
‐‐N/A
‐
22HV
Subtransmission
Cab
leSubtransmission
UG 110kV+ (PILC)
km‐
‐‐
‐‐
‐N/A
‐
23HV
Subtransmission
Cab
leSubtransmission
sub
marine cable
km‐
‐‐
‐‐
‐N/A
‐
24HV
Zone
sub
station Bu
ildings
Zone
sub
stations up to 66kV
No.
‐‐
‐‐
7.89%
92.11%
3
‐
25HV
Zone
sub
station Bu
ildings
Zone
sub
stations 110kV+
No.
‐‐
‐‐
‐‐N/A
‐
26HV
Zone
sub
station sw
itchgear
22/33kV CB
(Ind
oor)
No.
‐‐
‐‐
‐‐N/A
‐
27HV
Zone
sub
station sw
itchgear
22/33kV CB
(Outdo
or)
No.
5.36%
‐‐
55.36%
39.29%
‐
35.36%
28HV
Zone
sub
station sw
itchgear
33kV
Switch (G
roun
d Mou
nted
)No.
‐‐
‐‐
‐‐N/A
‐
29HV
Zone
sub
station sw
itchgear
33kV
Switch (P
ole Mou
nted
)No.
1.18%
13.61%
‐
65.09%
19.53%
0.59%
314.79%
30HV
Zone
sub
station sw
itchgear
33kV
RMU
No.
‐‐
‐‐
‐‐N/A
‐
31HV
Zone
sub
station sw
itchgear
50/66/110kV CB
(Ind
oor)
No.
‐‐
‐‐
‐‐N/A
‐
32HV
Zone
sub
station sw
itchgear
50/66/110kV CB
(Outdo
or)
No.
‐‐
‐‐
‐‐N/A
‐
33HV
Zone
sub
station sw
itchgear
3.3/6.6/11/22kV CB
(groun
d mou
nted
) No.
18.31%
‐
‐59.15%
22.54%
‐
318.31%
34HV
Zone
sub
station sw
itchgear
3.3/6.6/11/22kV CB
(pole mou
nted
) No.
‐‐
‐76.19%
23.81%
‐
3‐
35
The Line
s Co
mpa
ny Ltd.
1 April 2018
– 31 March 2028 %
of a
sset
forecast to be
replaced
in
next 5 years
Asset con
dition
at start of plann
ing pe
riod
(percentage of units by grad
e)
This sched
ule requ
ires a breakdo
wn of asset con
dition
by asset class as at the start of the
forecast year. The
data accuracy assessm
ent relates to the
percentage values disclosed
in the
asset con
dition
colum
ns. A
lso requ
ired
is a fo
recast of the
percentage
of units to be
rep
laced in the
next 5 years. All inform
ation shou
ld be consistent with the inform
ation provided
in the
AMP an
d the expe
nditure on
assets forecast in
Sched
ule 11a. All un
its relating
to cable an
d lin
e assets, tha
t are expressed in km, refer
to circuit lengths.

Appendices | 137
36 37 38
Volta
geAsset category
Asset clas
sUn
itsH1
H2H3
H4H5
Grade un
know
nDa
ta ac
curacy
(1–4)
39HV
Zone
Substatio
n Tran
sformer
Zone
Substatio
n Tran
sformers
No.
‐2.70
% 10
.81%
75
.68%
10
.81%
‐
30.85
%
40HV
Distrib
ution Lin
eDistrib
ution OH
Open Wire
Con
ductor
km0.01
% 14
.62%
6.66
% 76
.72%
1.33
% 0.66
% 2
‐
41HV
Distrib
ution Lin
eDistrib
ution OH
Aerial C
able Con
ductor
km‐
‐‐
‐‐
‐N/A
‐
42HV
Distrib
ution Lin
eSW
ER co
nductor
km0.08
% 16
.25%
16
.83%
64
.24%
0.44
% 2.15
% 2
1.96
%
43HV
Distrib
ution Ca
ble
Distrib
ution UG
XLPE o
r PVC
km0.14
% 0.70
% ‐
4.65
% 8.73
% 85
.77%
2
‐
44HV
Distrib
ution Ca
ble
Distrib
ution UG
PILC
km‐
‐‐
‐‐
‐N/A
7.92
%
45HV
Distrib
ution Ca
ble
Distrib
ution Subm
arine C
able
km‐
‐‐
‐‐
‐N/A
‐
46HV
Distrib
ution sw
itchgear
3.3/6.6/11
/22kV CB
(pole m
ounted) ‐ re
closers a
nd se
ctiona
lisers
No.
‐1.96
% ‐
55.39%
41
.67%
0.98
% 2
‐
47HV
Distrib
ution sw
itchgear
3.3/6.6/11
/22kV CB
(Ind
oor)
No.
‐‐
‐25
.00%
75
.00%
‐
30.96
%
48HV
Distrib
ution sw
itchgear
3.3/6.6/11
/22kV Sw
itches a
nd fu
ses (po
le mou
nted)
No.
‐7.92
% 0.03
% 67
.26%
24
.62%
0.16
% 2
‐
49HV
Distrib
ution sw
itchgear
3.3/6.6/11
/22kV Sw
itch (groun
d mou
nted) ‐ ex
cept RMU
No.
‐‐
‐70
.42%
28
.17%
1.41
% 3
1.00
%
50HV
Distrib
ution sw
itchgear
3.3/6.6/11
/22kV RM
UNo
.‐
‐‐
51.38%
48
.62%
‐
3‐
51HV
Distrib
ution Tran
sformer
Pole M
ounted
Tran
sformer
No.
0.11
% 0.85
% 0.38
% 82
.40%
16
.24%
0.02
% 2
25.05%
52HV
Distrib
ution Tran
sformer
Grou
nd M
ounted
Tran
sformer
No.
‐‐
‐83
.55%
16
.45%
‐
3‐
53HV
Distrib
ution Tran
sformer
Volta
ge re
gulators
No.
‐1.00
% 2.00
% 65
.00%
32
.00%
‐
320
.04%
54HV
Distrib
ution Substatio
nsGrou
nd M
ounted
Substatio
n Ho
using
No.
‐‐
‐‐
44.44%
55
.56%
3
0.08
%
55LV
LV Line
LV OH Co
nductor
km0.13
% 24
.92%
7.27
% 55
.73%
1.07
% 10
.87%
2
20.45%
56LV
LV Cab
leLV UG Ca
ble
km‐
‐‐
1.66
% 2.63
% 95
.72%
2
‐
57LV
LV Streetlig
hting
LV OH/UG
Streetlig
ht circuit
km‐
20.04%
3.13
% 27
.62%
0.22
% 48
.98%
2
‐
58LV
Conn
ectio
nsOH
/UG consum
er se
rvice c
onnections
No.
0.08
% ‐
0.03
% 5.35
% 3.34
% 91
.20%
2
‐
59All
Protectio
nProtectio
n relays (electromecha
nical, solid
state a
nd num
eric)
No.
6.69
% 13
.75%
‐
74.72%
4.46
% 0.37
% 3
‐
60All
SCAD
A an
d commun
ications
SCAD
A an
d commun
ications
equipm
ent o
peratin
g as a
single sy
stem
Lot
‐‐
‐10
.53%
84
.21%
5.26
% 3
‐
61All
Capa
citor B
anks
Capa
citors in
clud
ing c
ontro
lsNo
.‐
‐‐
11.11%
88
.89%
‐
4‐
62All
Load
Con
trol
Centralis
ed plant
Lot
‐‐
‐30
.77%
53
.85%
15
.38%
3
‐
63All
Load
Con
trol
Relays
No.
‐‐
‐62
.41%
11
.38%
26
.21%
3
‐
64All
Civils
Cable T
unnels
km‐
‐‐
‐‐
‐N/A
‐
Asset con
ditio
n at start o
f plan
ning
period (percentage of units by g
rade
)
% of as
set
forecast to
be
replaced
in
next 5 ye
ars

Appendices | 138
Company Nam
eThe Lin
es Com
pany
Ltd.
AMP Planning
Period
1 April 20
18 – 31 March 202
8
SCHE
DULE 12b
: REPOR
T ON
FOR
ECAS
T CA
PACITY
sch ref
712
b(i): System Growth ‐ Zone
Sub
stations
8
Existing Zone
Sub
stations
Curren
t Peak Load
(MVA
)
Installed Firm
Capacity
(MVA
)
Security of Sup
ply
Classifica
tion
(type)
Transfer Capacity
(MVA
)
Utilisatio
n of
Installed Firm
Capacity
%
Installed Firm
Capacity +5
years
(MVA
)
Utilisatio
n of
Installed Firm
Capacity + 5yrs
%
Installed Firm
Capacity
Constraint +5 years
(cause)
Explanation
9Aroh
ena
2.8
‐N
1.7
‐‐
‐No
con
straint w
ithin +5 years
10Atiamuri
10.4
‐N
‐‐
‐‐No
con
straint w
ithin +5 years
11Aw
amate
1.5
‐N
1.3
‐‐
‐No
con
straint w
ithin +5 years
12Bo
rough
8.5
5.0
N ‐ 1
2.5
170%
10
.0
85% N
o constraint with
in +5 years
13Ga
dsby
Roa
d4.9
‐N
5.5
‐‐
‐No
con
straint w
ithin +5 years
14Ha
ngatiki
4.3
‐N
1.3
‐‐
‐No
con
straint w
ithin +5 years
15Ka
ahu Tee
1.9
‐N
0.9
‐‐
‐No
con
straint w
ithin +5 years
16Kiko
Roa
d1.5
‐N
0.4
‐‐
‐No
con
straint w
ithin +5 years
17Ku
ratau
2.8
N0.1
‐3.0
93% N
o constraint with
in +5 years
18Mah
oenu
i1.0
‐N
0.5
‐‐
‐No
con
straint w
ithin +5 years
19Man
unui
2.5
‐N
1.2
‐‐
‐No
con
straint w
ithin +5 years
20Maraetai
5.2
‐N
0.5
‐5.0
‐No
con
straint w
ithin +5 years
21Marotiri
3.2
‐N
1.3
‐‐
‐No
con
straint w
ithin +5 years
22Mokai
3.7
‐N
1.1
‐‐
‐No
con
straint w
ithin +5 years
23Na
tiona
l Park
2.0
‐N
1.2
‐‐
‐No
con
straint w
ithin +5 years
24Niho
niho
0.5
‐N
0.7
‐‐
‐No
con
straint w
ithin +5 years
25Opa
rure
1.6
‐N
1.1
‐‐
‐No
con
straint w
ithin +5 years
26Otukou
0.2
‐N
‐‐
‐‐No
con
straint w
ithin +5 years
27Taha
roa
15.2
10.0 N
‐ 1
‐15
2%
10.0
171%
Transform
erMan
aged
by agreem
ent w
ith In
dustrial Customer
28Taha
roa Villa
ge0.4
‐N
‐‐
‐‐No
con
straint w
ithin +5 years
29Tawha
i5.0
‐N
0.7
‐‐
‐No
con
straint w
ithin +5 years
30Te Anga
2.1
‐N
0.2
‐‐
‐No
con
straint w
ithin +5 years
31Te W
aireka
11.9
10.0 N
‐ 1
2.1
119%
15
.0
88% N
o constraint with
in +5 years
32Tokaan
u0.2
‐N
‐‐
‐‐No
con
straint w
ithin +5 years
33Tuhu
a1.2
‐N
0.8
‐‐
‐No
con
straint w
ithin +5 years
34Turangi
4.7
5.0
N ‐ 1
2.0
95%
5.0
97% N
o constraint with
in +5 years
35Waiotaka
0.6
‐N
0.5
‐‐
‐No
con
straint w
ithin +5 years
36Wairere Falls
3.1
2.5
N ‐ 1
1.1
123%
2.5
123%
Transform
er
Distribu
ted generatio
n can be
man
aged
when a tran
sformer is
out of
service.
37Waitete
9.1
10.0 N
‐ 1
3.8
91%
10.0
91% N
o constraint with
in +5 years
38¹ Extend
forecast ca
pacity table as necessary to
disclose all capa
city by
each zone
substatio
n
This schedule requ
ires a breakdo
wn of current and
forecast cap
acity
and
utilisation for e
ach zone
sub
station an
d current d
istribution tran
sformer cap
acity
. The
data provided
sho
uld be
con
sistent w
ith th
e inform
ation provided
in th
e AM
P. In
form
ation provided
in th
is
table shou
ld re
late to
the op
eration of th
e network in its no
rmal stead
y state configuration.

Appendices | 139
Company Nam
e
AMP Planning Period
SCHEDULE 12C: REPORT ON FORECAST NETW
ORK DEMAND
sch ref
712c(i): Consumer Connections
8Number of ICPs connected in year by consumer type
9Current Year CY
CY+1
CY+2
CY+3
CY+4
CY+5
10for year en
ded
31 M
ar 18
31 M
ar 19
31 M
ar 20
31 M
ar 21
31 M
ar 22
31 M
ar 23
11Consum
er types defined
by EDB*
12Standard Connection: Urban
52
39
39
39
39
39
13Standard Connection: Rural
111
82
82
82
82
82
14Standard Connection: Remote Rural
6
9
9
9
9
9
15Non‐Standard Customer Connection
‐‐
1
‐‐
‐
16 17Connections total
169
130
131
130
130
130
18*include additional rows if needed
19Distributed gen
eration
20Number of connections
8
8
8
8
8
8
21Capacity of distributed generation installed in year (M
VA)
0.034
0.034
0.034
0.035
0.035
0.035
2212c(ii) System Demand
23Current Year CY
CY+1
CY+2
CY+3
CY+4
CY+5
24Maxim
um coincident system
demand (M
W)
for year en
ded
31 M
ar 18
31 M
ar 19
31 M
ar 20
31 M
ar 21
31 M
ar 22
31 M
ar 23
25GXP dem
and
60
64
65
71
71
72
26plus
Distributed generation output at HV and above
8
17
17
17
17
17
27Maximum coincident system demand
68
81
82
88
89
89
28less
Net tran
sfers to (from) other ED
Bs at HV and above
‐‐
‐‐
‐‐
29Demand on system for supply to consumers' connection points
68
81
82
88
89
89
30Electricity volumes carried
(GWh)
31Electricity supplied from GXPs
321
323
326
361
363
366
32less
Electricity exports to GXPs
4
5
5
5
5
5
33plus
Electricity supplied from distributed generation
68
84
84
84
84
84
34less
Net electricity supplied to (from) other EDBs
(12)
(12)
(12)
(13)
(13)
(13)
35Electricity entering system for supply to ICPs
397
415
417
452
455
458
36less
Total energy delivered to ICPs
367
386
389
421
424
426
37Losses
29
28
29
31
31
31
38 39Load
factor
67%
58%
58%
59%
59%
58%
40Loss ratio
7.4%
6.8%
6.8%
6.8%
6.8%
6.8%
The Lines Compan
y Ltd.
1 April 2018 – 31 M
arch 2028
Number of connections
This schedule requires a forecast of new connections (by consumer type), peak demand and energy volumes for the disclosure year and a 5 year planning period. The forecasts should be consistent with the supporting inform
ation set out in the
AMP as well as the assumptions used in developing the expenditure forecasts in Schedule 11a and Schedule 11b and the cap
acity and utilisation forecasts in Schedule 12b.

Appendices | 140
Company Nam
e
AMP Planning
Period
Network / S
ub‐network Nam
e
SCHED
ULE 12d
: REP
ORT
FORE
CAST IN
TERR
UPT
IONS AN
D DURA
TION
sch ref
8Current Year CY
CY+1
CY+2
CY+3
CY+4
CY+5
9for year end
ed31
Mar 18
31 M
ar 19
31 M
ar 20
31 M
ar 21
31 M
ar 22
31 M
ar 23
10SA
IDI
11Class B (plann
ed in
terrup
tion
s on
the
network)
37.8
58.7
62.2
65.6
69.0
72.3
12Class C (unp
lann
ed in
terrup
tion
s on
the
network)
188.9
175.5
172.0
168.6
165.2
161.9
13SA
IFI
14Class B (plann
ed in
terrup
tion
s on
the
network)
0.25
0.87
0.92
0.97
1.02
1.07
15Class C (unp
lann
ed in
terrup
tion
s on
the
network)
3.25
2.60
2.55
2.50
2.45
2.40
The Line
s Co
mpa
ny Ltd.
1 April 2018
– 31 March 2028
This sched
ule requ
ires a fo
recast of SAIFI and
SAIDI for disclosure an
d a 5 year plann
ing pe
riod
. The
forecasts shou
ld be consistent with the supp
orting
inform
ation set ou
t in the
AMP as well as the assumed
impa
ct of
plan
ned an
d un
plan
ned SA
IFI and
SAIDI o
n the expe
nditures fo
recast provide
d in Sched
ule 11a an
d Sche
dule 11b
.
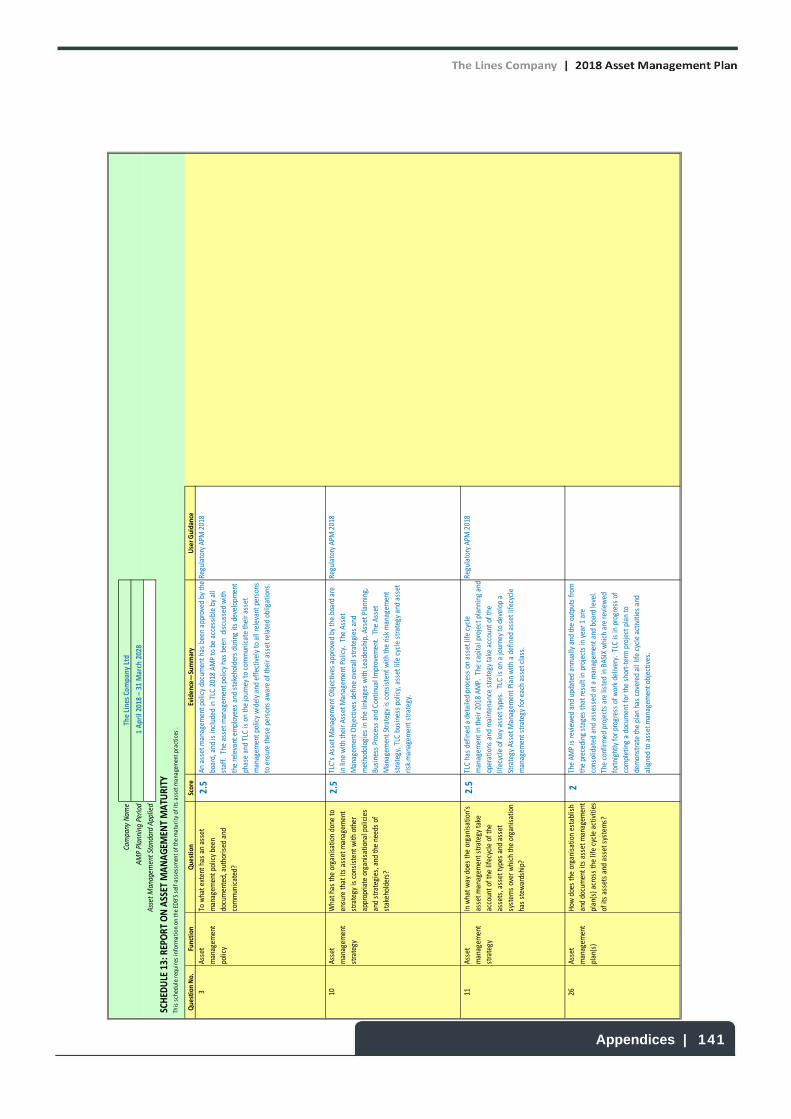
Appendices | 141
Company Nam
e
AMP Planning
Period
Asset M
anagem
ent Standard Ap
plied
SCHED
ULE 13: REPORT
ON ASSET M
ANAGEM
ENT MATU
RITY
Que
stion No.
Function
Que
stion
Score
Eviden
ce—Summary
User G
uidance
3Asset
managem
ent
policy
To what e
xtent h
as an asset
managem
ent p
olicy been
documented, authorised
and
communicated?
2.5
An asset managem
ent p
olicy document h
as been approved
by the
board, and
is included
in TLC
2018 AM
P to be accessible by all
staff. The
asset managem
ent p
olicy has been
discussed
with
the relevant employees and stakeholders during its
development
phase and TLC is on the journey to com
municate their a
sset
managem
ent p
olicy widely and effectively to all relevant persons
to ensure these persons aw
are of th
eir a
sset re
lated obligations.
Regulatory APM
2018
10Asset
managem
ent
strategy
What h
as th
e organisatio
n done
to
ensure th
at its asset m
anagem
ent
strategy is consistent w
ith other
appropria
te organisational policies
and strategies, and
the needs of
stakeholders?
2.5
TLC’s Asset M
anagem
ent O
bjectives approved by th
e board are
in line
with
their A
sset M
anagem
ent P
olicy. The
Asset
Managem
ent O
bjectives define overall strategies and
methodologies in
the linkages with
Leadership, Asset Planning,
Business Process and
Contin
ual Improvem
ent. The
Asset
Managem
ent Strategy is consistent w
ith th
e risk managem
ent
strategy, TLC
business policy, asset life cycle strategy and asset
risk managem
ent strategy.
Regulatory APM
2018
11Asset
managem
ent
strategy
In what w
ay does the organisatio
n's
asset m
anagem
ent strategy take
account o
f the
lifecycle of th
e
assets, asset types and asset
system
s over which th
e organisatio
n
has stew
ardship?
2.5
TLC has defin
ed a detailed process on
asset life cycle
managem
ent in their 2
018 AM
P. The
capita
l project planning and
operations and
maintenance strategy take account of the
lifecycle of key asset types. TLC
is on a journey to develop
a
Strategy Asset M
anagem
ent P
lan with
a defined
asset lifecycle
managem
ent strategy for e
ach asset class.
Regulatory APM
2018
26Asset
managem
ent
plan(s)
How
does the organisatio
n establish
and document its asset managem
ent
plan(s) a
cross the life cycle activities
of its assets and
asset systems?
2The AM
P is re
view
ed and
updated
annually and
the outputs from
the preceding stages th
at re
sult in projects in year 1
are
consolidated
and
assessed at a managem
ent a
nd board level.
The confirm
ed projects are listed in BASIX which are re
view
ed
fortnightly
for p
rogress of work delivery. TLC
is in
progress of
completing a document for th
e short‐term
project plan to
demonstrate th
e plan
has covered
all life cycle activities and
aligned to asset managem
ent o
bjectives.
The Line
s Co
mpa
ny Ltd
1 April 2018
– 31 March
2028
This schedule requ
ires in
form
ation on
the ED
B’S self‐assessm
ent o
f the
maturity of its asset m
anagem
ent p
ractices .

Appendices | 142
Company Nam
e
AMP Planning
Period
Asset M
anagem
ent Standard Applied
SCHED
ULE 13: REPORT ON ASSET M
ANAGEM
ENT MATU
RITY (con
t)
Que
stion No.
Function
Que
stion
Score
Eviden
ce—Summary
User G
uidance
27Asset
managem
ent
plan(s)
How
has the
organisation
communicated
its plan(s) to all
relevant parties to a level of detail
appropriate to the
receiver's role in
their delivery?
3At the start of each financial year com
pleted
copies of the
AMP
are distributed to TLC's Trust shareholders, Board of Directors,
Finance Team
, Com
munications Team, A
sset and
Engineering
Team
, Network Services Team and
various regulatory bodies.
Electronic copies of the
AMP are available for all employees on
TLC's Network. A
n electronic copy of the
AMPs available on
the
TLC website for customers and mem
bers of the public, bound
paper copies are available by request. TLC
keeps an up
to date
record of all distributed
AMPs.
AMP is accessible from
TLC's
website
29Asset
managem
ent
plan(s)
How
are designated responsibilities
for delivery of asset plan actions
documented?
2Asset managem
ent accountabilities are designated
throughout
the organizatio
n from
the
top
managem
ent to asset engineers.
TLC is in
the
process of more form
ally docum
enting
responsibilities with adequate detail to enable delivery of actions
in the
strategy asset managem
ent plan.
Designated asset managem
ent
accountabilities can be
found
in the
2018 AMP
31Asset
managem
ent
plan(s)
What has the organisatio
n done
to
ensure that appropriate
arrangem
ents are made available for
the efficient and
cost effective
implem
entation
of the plan(s)?
(Note this is about resources and
enabling support)
2.5
TLC recognises there is an issue with insufficient staff num
bers
and is in
the
process to identify the
required resources both
internal and
external to ensure that the asset managem
ent plan
can be
implem
ented in an efficient and cost‐effective manner.
TLC has planned
to increase the
internal resource significantly by
hiring
more new staff and
is also looking for competent
contractors for outsourcing work. TLC
has started
addressing the
resource and
timescale required realistically in
asset
managem
ent p
lanning and identifying changes needed
to the
company's business process.
33Contin
gency
planning
What plan(s) and procedure(s) does
the organisation
have for identifying
and responding
to incidents and
emergency situations and
ensuring
continuity of critical asset
managem
ent a
ctivities?
2TLC has an event p
lan in place and
is in
the
process of
developing
Business Continuity Plan
and
establishing
Emergency
Managem
ent Fram
ework based on
Civil Defence Co‐ordinanted
Incident M
angement System
(CIM
S). The Em
ergency
Managem
ent fram
ework identifies a Duty Manager who
is able
act as Incident Controller during
an em
ergency event.
Section 3.7 in 2018 AMP
1 April 2018 – 31
March
2028
The Line
s Co
mpany
Ltd
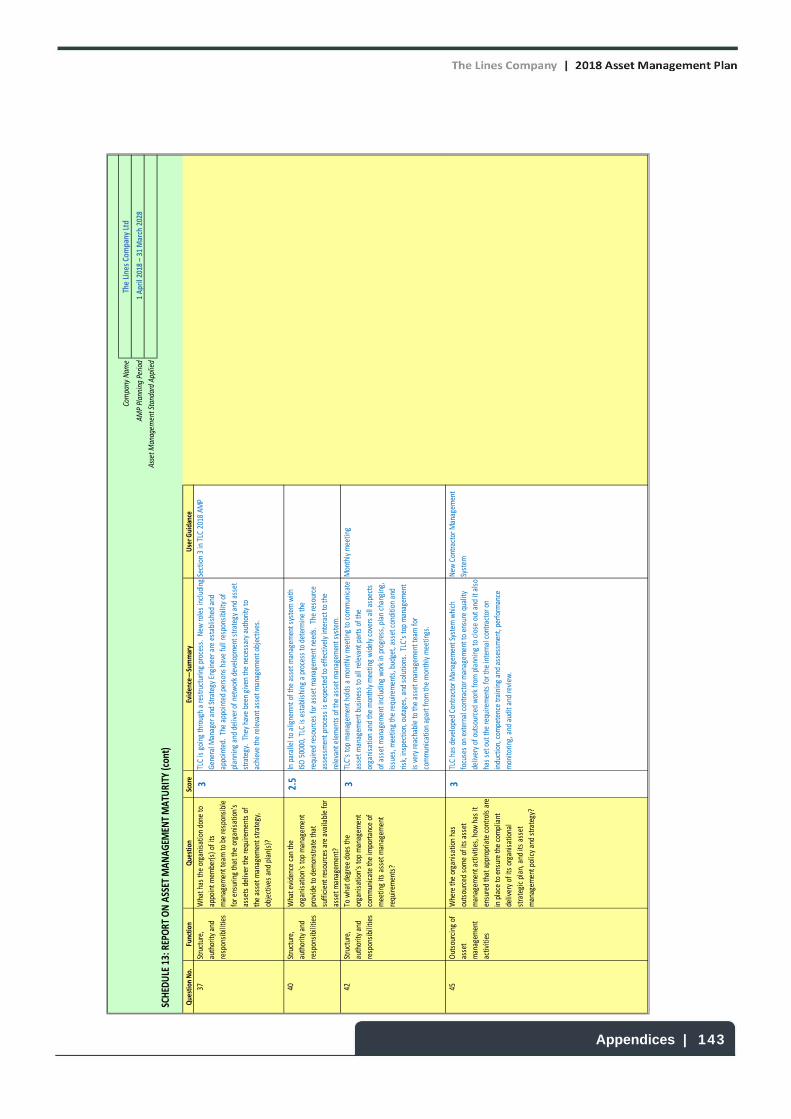
Appendices | 143
Company Nam
e
AMP Planning
Period
Asset M
anagem
ent Standard Ap
plied
SCHED
ULE 13: REPORT
ON ASSET M
ANAGEM
ENT MATU
RITY
(con
t)
Que
stion No.
Functio
nQue
stion
Score
Eviden
ce—Summary
User G
uidance
37Structure,
authority
and
responsibilities
What h
as th
e organisatio
n done
to
appoint m
ember(s) of its
managem
ent team to
be responsible
for e
nsuring that th
e organisatio
n's
assets deliver th
e require
ments of
the asset m
anagem
ent strategy,
objectives and
plan(s)?
3TLC is going
through a restructuring process. N
ew ro
les including
General M
anager and
Strategy Engineer are established and
appointed. The
appointed
persons have full responsibility of
planning
and
deliver of n
etwork developm
ent strategy and asset
strategy. They have been
given
the necessary authority
to
achieve the relevant asset managem
ent o
bjectives.
Section 3 in TLC
2018 AM
P
40Structure,
authority
and
responsibilities
What e
vidence can the
organisatio
n's top managem
ent
provide to dem
onstrate th
at
sufficient re
sources are available for
asset m
anagem
ent?
2.5
In parallel to alignemnt of the
asset managem
ent system with
ISO 50000, TLC
is establishing
a process to
determine the
require
d resources for a
sset managem
ent n
eeds. The resource
assessment p
rocess is expected to effectively interact to
the
relevant elements of the
asset managem
ent system.
42Structure,
authority
and
responsibilities
To what d
egree does th
e
organisatio
n's top managem
ent
communicate the importance of
meetin
g its
asset managem
ent
require
ments?
3TLC's top managem
ent h
olds a monthly meetin
g to com
municate
asset m
anagem
ent b
usiness to all relevant parts of the
organisatio
n and the monthly meetin
g widely covers all aspects
of asset managem
ent including
work in progress, plan changing,
issues, m
eetin
g the require
ments, budget, asset conditio
n and
risk, inspectio
n, outages, and
solutions. TLC's top managem
ent
is very reachable to th
e asset m
anagem
ent team fo
r
communication apart from th
e monthly meetin
gs.
Monthly meetin
g
45Outsourcing
of
asset
managem
ent
activities
Where th
e organisatio
n has
outsourced
som
e of its asset
managem
ent a
ctivities, how
has it
ensured that appropriate controls are
in place to
ensure the compliant
delivery of its organisatio
nal
strategic plan, and
its asset
managem
ent p
olicy and strategy?
3TLC has developed Co
ntractor M
anagem
ent System which
focuses on
external contractor m
anagem
ent to ensure quality
delivery of outsourced work from
planning to close out and
it also
has set o
ut th
e require
ments fo
r the
internal contractor o
n
induction, com
petence training
and
assessm
ent, performance
monito
ring, and
audit and review
.
New
Contractor M
anagem
ent
System
The Line
s Co
mpany
Ltd
1 April 2018
– 31 March
2028

Appendices | 144
Company Nam
e
AMP Planning
Period
Asset M
anagem
ent Standard Ap
plied
SCHED
ULE 13: REPORT
ON ASSET M
ANAGEM
ENT MATU
RITY
(con
t)
Que
stion No.
Function
Que
stion
Score
Eviden
ce—Summary
User G
uidance
48Training,
awareness and
competence
How
does the organisatio
n develop
plan(s) for th
e human
resources
require
d to undertake asset
managem
ent a
ctivities ‐ including
the developm
ent a
nd delivery of
asset m
anagem
ent strategy,
process(es), objectives and
plan(s)?
2TLC is in
the process of re
view
ing the resource re
quire
ment to
meet a
sset managem
ent n
eeds and
enhancing
the process to
plan, provide
and
record th
e training
necessary to
achieve th
e
competencies.
49Training,
awareness and
competence
How
does the organisatio
n identify
competency require
ments and
then
plan, provide
and
record th
e training
necessary to achieve th
e
competencies?
2TLC uses th
e understandings gained from
risk assessm
ents and
the performance of risk control strategies to identify the
competency require
ments and
then
plan, provide
and
record th
e
training
necessary to
achieve th
e competency level. TLC supports
personal development a
nd training
of a
ll em
ployees.
50Training,
awareness and
competence
How
does the organizatio
n ensure
that persons under its direct control
undertaking asset m
anagem
ent
related activities have an
appropria
te level of com
petence in
term
s of educatio
n, training
or
experie
nce?
2.5
TLC is in
the process of determining require
d resources for a
sset
managem
ent n
eeds which includes to
enhance th
e process to
assess staff com
petency level and
provide
require
d training
to
meet the
asset managem
ent requirement.
The Line
s Co
mpany
Ltd
1 April 2018
– 31 March
2028
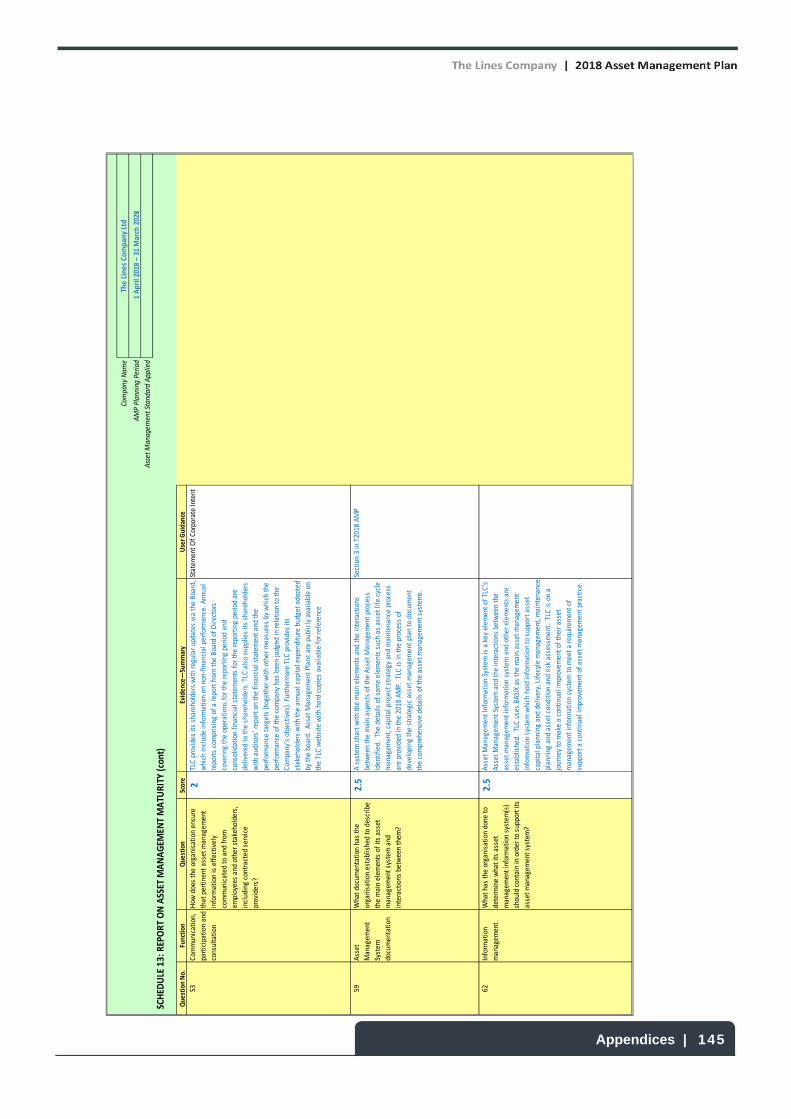
Appendices | 145
Company Nam
e
AMP Planning
Period
Asset M
anagem
ent Standard Applied
SCHED
ULE 13: REPORT ON ASSET M
ANAGEM
ENT MATU
RITY (con
t)
Que
stion No.
Function
Que
stion
Score
Eviden
ce—Summary
User G
uidance
53Com
munication,
participation and
consultation
How
does the organisation
ensure
that pertin
ent asset managem
ent
inform
ation is effectively
communicated
to and from
employees and other stakeholders,
including contracted
service
providers?
2TLC provides its shareholders with regular updates via the Board,
which include inform
ation on
non
‐financial perform
ance. A
nnual
reports comprising of a report from
the
Board of Directors
covering
the
operations for the reporting period
and
consolidation financial statements for the
reporting
period are
delivered
to the shareholders. TLC
also supplies its shareholders
with auditors’ report on
the
financial statement and the
performance targets (together with other measures by which the
performance of the company has been judged
in relation to the
Com
pany’s objectives). Furthermore TLC provides its
stakeholders with the annual capital expenditure budget adopted
by the
board. Asset M
anagem
ent Plans are publicly available on
the TLC website with hard copies available for reference
Statem
ent Of Corporate Intent
59Asset
Managem
ent
System
documentation
What documentation
has the
organisatio
n established to describe
the main elem
ents of its asset
managem
ent system and
interactions between them
?
2.5
A system chart with the main elem
ents and
the
interactions
between the main aspects of the
Asset M
anagem
ent process
identified. The details of some elem
ents such as asset life cycle
managem
ent, capital project strategy and maintenance process
are provided
in the
2018 AMP. TLC
is in
the
process of
developing
the
strategic asset managem
ent plan
to document
the comprehensive details of the asset managem
ent system
s.
Section 3 in T2018
AMP
62Inform
ation
managem
ent
What has the organisation
done to
determ
ine what its asset
managem
ent information system
(s)
should contain in
order to support its
asset managem
ent system?
2.5
Asset M
anagem
ent Inform
ation System
is a key element of TLC’s
Asset M
anagem
ent System
and
the
interactions between the
asset managem
ent inform
ation system
and
other elements are
established. TLC
uses BASIX as the
main asset managem
ent
inform
ation system
which hold inform
ation to support asset
capital planning and delivery, Lifecyle managem
ent, maintenance
planning
and
asset condition
and
risk assessment. TLC
is on a
journey to make a continual improvem
ent of their asset
managem
ent inform
ation system
to meet a
requirement of
support a continual improvem
ent of asset managem
ent practice.
The Line
s Co
mpany
Ltd
1 April 2018 – 31
March
2028

Appendices | 146
Company Nam
e
AMP Planning
Period
Asset M
anagem
ent Standard Ap
plied
SCHED
ULE 13: REPORT
ON ASSET M
ANAGEM
ENT MATU
RITY
(con
t)
Que
stion No.
Function
Que
stion
Score
Eviden
ce—Summary
User G
uidance
63Inform
ation
managem
ent
How
does the organisatio
n maintain
its asset managem
ent information
system
(s) a
nd ensure that th
e data
held with
in it (them) is of th
e
requisite
quality and accuracy and
is
consistent?
2.5
The data in
Basix is stored in various SQL server ta
bles th
at are
view
ed and
written to by the vario
us Basix user interface fo
rms.
Reports are run in SQL to pick up
variances between actual data
and the system
held data. C
ontrol of the
database is maintained
by assigning
individuals different levels of authority. M
andatory
field are set up in th
e Ba
six database, this means th
at when new
assets are entered
into th
e database th
ese fie
lds must b
e
populated before th
e program allows you to save the asset. All
asset changes are tracked through an
audit tracker that is built
into th
e database.
64Inform
ation
managem
ent
How
has th
e organisatio
n's ensured
its asset managem
ent information
system
is re
levant to
its needs?
2.5
TLC's asset m
anagem
ent information system
is re
view
ed and
aligned with
current asset managem
ent requirements, it a
lso
aligns with
the increasing
regulatory and
safety managem
ent
require
ment. TLC has included
in th
e annual plan a budget fo
r
inform
ation system
upgrades and maintenance, the
asset
managem
ent information system
is re
gularly
review
ed and
improved
when necessary.
69Risk
managem
ent
process(es)
How
has th
e organisatio
n
documented process(es) a
nd/or
procedure(s) fo
r the
identification
and assessment o
f asset and
asset
managem
ent related
risks
throughout th
e asset life
cycle?
2.5
TLC has introduced
a Ofgem
Com
mon
Methodology to
assess
asset related
risks. The
prin
ciples and
process are docum
ented
in Asset Life
cycle Managem
ent a
nd th
ree models have been
developed to assess and forecasting risk for d
istribution poles,
conductors, and
crossarms. This advanced
asset risk modelling
is to
support to
fully develop
a risk based
long
term
investment
plan
to determine the optim
al timing for a
sset re
placem
ent.
79Use and
maintenance of
asset risk
inform
ation
How
does the organisatio
n ensure
that th
e results
of risk assessments
provide input into the identification
of adequate resources and training
and competency needs?
2TLC review
s and analyses th
e results
of the
risk assessm
ent,
once an understanding is gained the results
are th
en used to help
identify the resources, training
and
com
petency require
ments to
achieve the asset m
anagem
ent strategy. TLC
believes on
‐going
training, assessm
ent a
nd monito
ring is im
portant to ensure staff
are competent to
com
plete assigned
tasks.
82Legal and
other
require
ments
What p
rocedure does the
organisatio
n have to
identify and
provide access to
its legal,
regulatory, statutory and
other asset
managem
ent requirements, and
how
is re
quire
ments incorporated
into th
e
asset m
anagem
ent system?
2The Asset M
anagem
ent P
olicy identifies TLC's legal, regulatory
and statutory require
ments. It a
lso identifies the regulatory
compliance documentatio
n that must b
e prepared
and
published
by th
e asset a
nd engineerin
g team
. Electronic copies of TLC's
regulatory docum
ents are available on
the TLC website and
bound paper copies are available be
by request.
1 April 2018
– 31 March
2028
The Line
s Co
mpany
Ltd

Appendices | 147
Company Nam
e
AMP Planning
Period
Asset M
anagem
ent Standard Applied
SCHED
ULE 13: REPORT ON ASSET M
ANAGEM
ENT MATU
RITY (con
t)
Que
stion No.
Function
Que
stion
Score
Eviden
ce—Summary
User G
uidance
88Life Cycle
Activities
How
does the organisatio
n establish
implem
ent and maintain process(es)
for the implem
entation
of its asset
managem
ent plan(s) and control of
activities across the creation,
acquisition or enhancement of
assets. This includes design,
modification, procurement,
construction
and
com
missioning
activities?
2TLC is in
the
process of putting in place processes and
procedures to manage and control the
delivery of asset
managem
ent plans. The
design, modification, construction and
commissioning activities are set out in
TLC's distribution
standards and the operations of assets are covered
by the
operating procedures. The
Basix database is used to record the
creation, acquisitio
n, procurement and enhancem
ent of network
assets as well as recording asset inform
ation, condition
and
expenditure.
91Life Cycle
Activities
How
does the organisatio
n ensure
that process(es) and/or procedure(s)
for the implem
entation
of asset
managem
ent plan(s) and control of
activities during maintenance (and
inspection) of assets are sufficient to
ensure activities are carried out
under specified conditions, are
consistent with
asset managem
ent
2TLC’s process and
procedures are review
ed regularly; the
asset
managem
ent procedure, distribution standard and
operating
procedure are review
ed every 12‐18
months. Due
to the
increasing
regulatory requirem
ent the Basix database is
constantly reviewed
and
updated
to ensure it is effective and
efficient as well as ensuring
it aligns with the asset managem
ent
policy, strategy and objectives and
the
asset managem
ent plan.
AMP, Distribution Standard,
Operating
Procedures, Basix
Database
95Performance and
condition
monitoring
How
does the organisatio
n measure
the performance and
conditio
n of its
assets?
2Reliability monitoring is done via the Basix system. Fault
inform
ation is entered
from daily reporting
sheets, which in
turn
are completed
from a variety of sources including SCADA, the
telephone database and
control room data. M
onthly perform
ance
reports are generated and review
ed at managem
ent level and
reported
at board level. Equipm
ent failures in the
various
sections of the network and the SAIDI/SAIFI effects of these are
monitored
closely. Reports are set up in the
Basix system to
produce the regulatory and
internal perform
ance data, including
Com
merce Com
mission
Decision reports. The
BASIX system
is
used
to report asset perform
ance and
effectiveness such as
voltage complaints and system
com
ponent fa
ilures. The
ratio of
billed kVA to the sum of the kVA of distribution
transform
ers is
determ
ined
from BASIX and the billing
data system
running
sequel server reports. N
etwork technical losses are calculated
using models that include the effects of generation. The
BASIX
system
is also used
to report on the custom
er service levels.
These include time to restore supply and maximum
num
ber of
shutdowns.
AMP, Basix Database
The Line
s Co
mpany
Ltd
1 April 2018 – 31
March
2028

Appendices | 148
Company Nam
e
AMP Planning
Period
Asset M
anagem
ent Standard Applied
SCHED
ULE 13: REPORT ON ASSET M
ANAGEM
ENT MATU
RITY (con
t)
Que
stion No.
Function
Que
stion
Score
Eviden
ce—Summary
User G
uidance
99Investigation of
asset‐related
failures,
incidents and
nonconform
ities
How
does the organisation
ensure
responsibility and the authority for
the handling, investigation and
mitigation of asset‐related
failures,
incidents and em
ergency situations
and non conformances is clear,
unam
biguous, understood and
communicated?
2.5
The responsibility and the authority for the handling,
investigation and mitigation of asset‐related
failures, incidents
and em
ergency situations and
non
‐conform
ances are
documented and outlined
in TLC's Accidents/Incident
Managem
ent Procedure and the Network Access and Operating
Com
petency Procedure. The
Accidents/Incident Managem
ent
Procedure is com
municated
to em
ployees during
the
com
pany
induction. The
Network Access and Operating
Com
petency
Procedure is com
municated
during the network induction
Process. TLC
recognises there are some inconsistencies in
investigation of asset‐related
failures, incidents and
nonconform
ities.
Accidents/Incident
Managem
ent Procedure.
Network Access and Operating
Com
petency
105
Audit
What has the organisation
done to
establish procedure(s) for the
audit
of its asset managem
ent system
(process(es))?
2TLC recognises and understands the need
for systematic checks,
especially of the effectiveness of its asset managem
ent process.
Currently the
asset managem
ent procedures and
processes are
review
ed every 12‐18
months; changes to the procedures and
processes are made to reflect the
outcomes of the review
.
Review Log
for Processes and
Procedure
109
Corrective &
Preventative
action
How
does the organisation
instigate
appropriate corrective and/or
preventive actions to eliminate or
prevent the causes of identified
poor
performance and
non
conform
ance?
2Investigation and mitigation of asset‐related
failures, incidents
and em
ergency situations and
non
‐conform
ances are
documented in TLC's Accidents/Incident Managem
ent Procedure
and the Network Access and Operating
Com
petency Procedure.
As part of the accident/incident investigation a Root Cause
Analysis (RCA) is conducted
is to identify the
factors that
resulted
in the
nature, the
magnitude, the
location, and
the
timing of the
harmful outcomes (consequences) of one
or more
past events in order to identify what behaviours, actions,
inactions, or conditions need to be changed to prevent recurrence
of similar harm
ful outcomes and
to identify the
lessons to be
learned to promote the achievem
ent of better consequences.
Nonconformities and incidents
are outline in operating
procedure 12
‐ appendix D.
Root Cause Analysis is carried
out on
asset related
failure.
113
Continual
Improvem
ent
How
does the organisation
achieve
continual improvem
ent in the
optimal com
bination
of costs, asset
related risks and the performance
and condition of assets and asset
system
s across the
whole life cycle?
2.5
TLC has started
a journey to im
prove their asset managem
ent
practice using
ISO 55000
guideline and an
improved
asset
managem
ent system
is established based on
the
requirements
outlined
in ISO 55001. Continuous Improvem
ent is an elem
ent of
the system
which is interacting with asset lifecycle and
performance. TLC has assessed asset health and
risk
system
ically to identify continuous improvem
ent opportunities in
life cycle for selected
asset types and
with the system
put in
place the process will apply to more asset types.
Performance Target, B
asix
database im
provem
ents
The Line
s Co
mpany
Ltd
1 April 2018 – 31
March
2028

Appendices | 149
Company Nam
e
AMP Planning
Period
Asset M
anagem
ent Standard Ap
plied
SCHE
DULE 13: REPOR
T ON AS
SET M
ANAG
EMEN
T MAT
URITY (con
t)
Questio
n No
.Functio
nQu
estio
nScore
Eviden
ce—Summary
User Guidance
115
Continual
Improvem
ent
How does th
e organisatio
n seek and
acquire
know
ledge about n
ew asset
managem
ent related
technology and
practices, and
evaluate their
potential benefit to th
e organisatio
n?
2.5
TLC acquire
s knowledge
about new
asset managem
ent related
technology and
practice
s by researching
international papers a
nd
standard to
identify b
enchmarks fo
r asset managem
ent p
ractice
s,
as well as s
ending
engineerin
g staff o
n conferences a
nd fo
rums
to gain know
ledge of new
and
innovative asset m
anagem
ent
techniques and
practice
s. TLC also active
ly engage
in industry
discussio
ns with
other netwo
rking companies, professional
bodies and
regulatory bodies a
bout what a
re th
e best asset
managem
ent system, technology a
nd practice
s.
R&D documents.
The Lin
es Com
pany
Ltd
1 April 2018
– 31 March
2028

Appendices | 150
SCHEDULE 14A: MANDATORY EXPLANATORY NOTES ON FORECAST INFORMATION
1. This Schedule requires EDBs to provide explanatory notes to reports prepared in accordance with clause 2.6.6.
2. This Schedule is mandatory – EDBs must provide the explanatory comment specified below, in accordance with clause 2.7.2. This information is not part of the audited disclosure information, and so is not subject to the assurance requirements specified in section 2.8.
Commentary on difference between nominal and constant price capital expenditure forecasts (Schedule 11a).
3. In the box below, comment on the difference between nominal and constant price capital expenditure for the current disclosure year and 10 year planning period, as disclosed in Schedule 11a.
Commentary on difference between nominal and constant price capital expenditure forecasts (Schedule 11a).
4. In the box below, comment on the difference between nominal and constant price operational expenditure for the current disclosure year and 10 year planning period, as disclosed in Schedule 11b.
Box 1: Commentary on difference between nominal and constant price capital expenditure forecasts:
Inflation of 2% has been applied across the planning period commencing in year 2.
Box 2: Commentary on difference between nominal and constant price operational expenditure forecasts:
Inflation of 2% has been applied across the planning period commencing in year 2.

Appendices | 151
Appendix D: Director Certification
SCHEDULE 17: CERTIFICATION FOR YEAR‐BEGINNING DISCLOSURE
Pursuant to Clause 2.9.1 of Section 2.9
We, RICHARD KROGH and ROGER SUTTON, being directors of The Lines Company Limited certify that, having made all reasonable enquiry, to the best of our knowledge:
a) The following attached information of The Lines Company Limited prepared for the purposes of clauses 2.6.1, 2.6.3, 2.6.6 and 2.7.2 of the Electricity Distribution Information Disclosure Determination 2012 in all material respects complies with that determination.
b) The prospective financial or non‐financial information included in the attached information has been measured on a basis consistent with regulatory requirements or recognised industry standards.
c) The forecasts in Schedules 11a, 11b, 12a, 12b, 12c and 12d are based on objective and reasonable assumptions which both align with The Lines Company’s corporate vision and strategy and are documented in retained records.
DIRECTOR
Date: 28 March 2018
DIRECTOR
Date: 28 March 2018


