2018 First Quarter Results Presentation29 May 2018

Disclaimer
2
This information has been prepared solely for the purpose of assisting the recipient (the “Recipient”) in starting to conduct its own independent evaluation and analysis of Grupo Antolín-Irausa,
S.A. and its subsidiaries (the “Group”). No representation or warranty (whether express or implied) is given in respect of any information in this presentation or that this presentation is suitable for
the Recipient’s purposes.
The information herein is not all-inclusive nor does it contain all information that may be desirable or required in order to properly evaluate the Group. Neither the Group nor any of its officers,
directors, employees, affiliates or advisors will have any liability with respect to any use of, or reliance upon, any of the information herein. The Recipient acknowledges and agrees that it is
responsible for making an independent judgment in relation to information contained herein and for obtaining all necessary financial, legal, accounting, regulatory, tax, investment and other advice
that it deems necessary or appropriate. Neither the Group nor any of its officers, directors, employees, affiliates or advisors is responsible as a fiduciary and is not acting as an advisor (as to
financial, legal, accounting, regulatory, tax, investment or any other matters) to the Recipient. The Group has no obligation whatsoever to update any of the information or the conclusions
contained herein or to correct any inaccuracies which may become apparent subsequent to the date hereof.
This presentation does not constitute or form part of and should not be construed as, an offer to sell or issue or the solicitation of an offer to buy or acquire securities of any entity of the Group, in
the United States of America or in any other jurisdiction or an inducement to enter into investment activity. No part of this presentation, nor the fact of its distribution, should form the basis of, or be
relied on in connection with, any contract or commitment or investment decision whatsoever. Any decision to invest in any securities of the Group or otherwise participate in any financing of the
Group should not be based on information contained in this presentation. This presentation is only for persons having professional experience in matters relating to investments and must not be
acted or relied on by any persons. Solicitations resulting from this presentation will only be responded to if the person concerned is a person having professional experience in matters relating to
investments. This presentation does not constitute a recommendation regarding the securities of the Group.
This presentation includes statements, estimates, opinions and projections with respect to anticipated future performance of the Group (“forward looking statements”), which reflect various
assumptions concerning anticipated results taken from the current business plan of the Group or from public sources which may or may not prove to be correct. These forward looking statements
contain the works “anticipate”, “believe”, “intend”, “estimate”, “expect” and words of similar meaning. Such forward-looking statements reflect current expectations based on the current business
plan and various other assumptions and involve significant risks and uncertainties, and should not be read as guarantees of future performance or results and will not necessarily be accurate
indications of whether or not such results will be achieved. The Group is not under any obligation to update or revise such forward-looking statements to reflect new events or circumstances.
Certain financial data included in this presentation consists of “non-GAAP financial measures.” These non-GAAP financial measures may not be comparable to similarly titled measures presented
by other entities, nor should they be construed as an alternative to other financial measures determined in accordance with International Financial Reporting Standards. Although the Group
believes these non-GAAP financial measures provide useful information to users in measuring the financial performance and condition of its business, users are cautioned not to place undue
reliance on any non-GAAP financial measures and ratios included in this presentation. Market and competitive position data in this presentation has generally been obtained from studies
conducted by third-party sources. There are limitations with respect to the availability, accuracy, completeness and comparability of such data. The Group has not independently verified such data
and can provide no assurance of its accuracy or completeness. Certain statements in this presentation regarding the market and competitive position data are based on the internal analyses of
the Group, which involves certain assumptions and estimates. These internal analyses have not been verified by any independent sources and there can be no assurance that the assumptions or
estimates are accurate.

3
Participants
� Jesús Pascual, Chief Executive Officer
� Cristina Blanco, Chief Financial Officer
� Carlos Garcia-Mendoza, Capital Markets and IR

4
Q1 2018 Operating Highlights
� Sales of EUR 1.3bn, down 3.1% from Q1 2017 and versus -0.7%* industry production growth
� Excluding FX impact, sales up 2.4%
� EBITDA of EUR 84m down 42.3% from Q1 2017, margin of 6.5%
� Excluding FX impact, EBITDA down 38.2%
� EBIT of EUR 38m down 63.7% from Q1 2017, margin of 2.9%
*Source: LMC Global Automotive Production. Quarter 1, 2018

5
Sales Breakdown
� Doors and Lighting driving sales growth
� Headliners impacted by slower sales in US and product launches and plant closure in Central Europe
� Cockpits reflects slowdown in some UK-produced models
� FX impact represents c. € 74m of decreased sales
� Strong performance in APAC helped compensate European weakness
� European sales principally reflect UK sales declines
� NAFTA sales reflect slower US sales due to project completions offset by stronger
Mexico sales
� China quarterly sales up 18% vs market production down 1.7% in Q1 ‘18**
*Q1 2017 data excludes Seating Business Unit
**Source: LMC Global Automotive Production. Quarter 1, 2018
533 501
412 440
82 91
305 259
Q1 2017* Q1 2018
Overheads Doors Lighting Cockpits
1,333 1,291
EU
Rm
- 6%
-3.1%
+ 7%
+11%
-15%
733 679
454451
121132
19 23
Q1 2017* Q1 2018
Europe NAFTA APAC Mercosur Africa
EU
Rm
+20%
-7%
+9%
-1%

6
EBITDA Breakdown
68
34
58
44
19
17
24
20
(23) (31)
Q1 2017* Q1 2018
Overheads Doors Lighting Cockpits Others**
146
84
EU
Rm
� EBITDA impacted by expected higher launch costs, resulting from successful commercial efforts following the Magna Interiors acquisition
� Overheads impacted by facilities in Austria, Hungary and US
� Doors affected by UK sales declines, project launches in Czech Republic and
Shelby start-up costs
� Lighting reflects project launches in Central Europe
� Cockpits reflects Tianjin launch and lower sales in the UK
� Personnel costs and operating expenses increased as a result of new
launches:
� 6 New factories in ‘18 vs. 2 in ‘17
� 68% more projects launched in ‘Q1 18 vs. Q1 ’17
� Underperformance in the USA related to launches in Kentucky and sales declines in Michigan
� FX impact on EBITDA totaled €6 million
10.9%Margin 6.5%
-24%
+35%
-42%
-50%
-9%
*Q 2017 data excludes Seating Business Unit
**Group structure costs not allocated by Business Unit
-16%
Facility Location BusinessUnit
ConstructionStart
ConstructionEnd / SOP
Full YearProduction
Run rate(# of veh/y)
Description of main projects
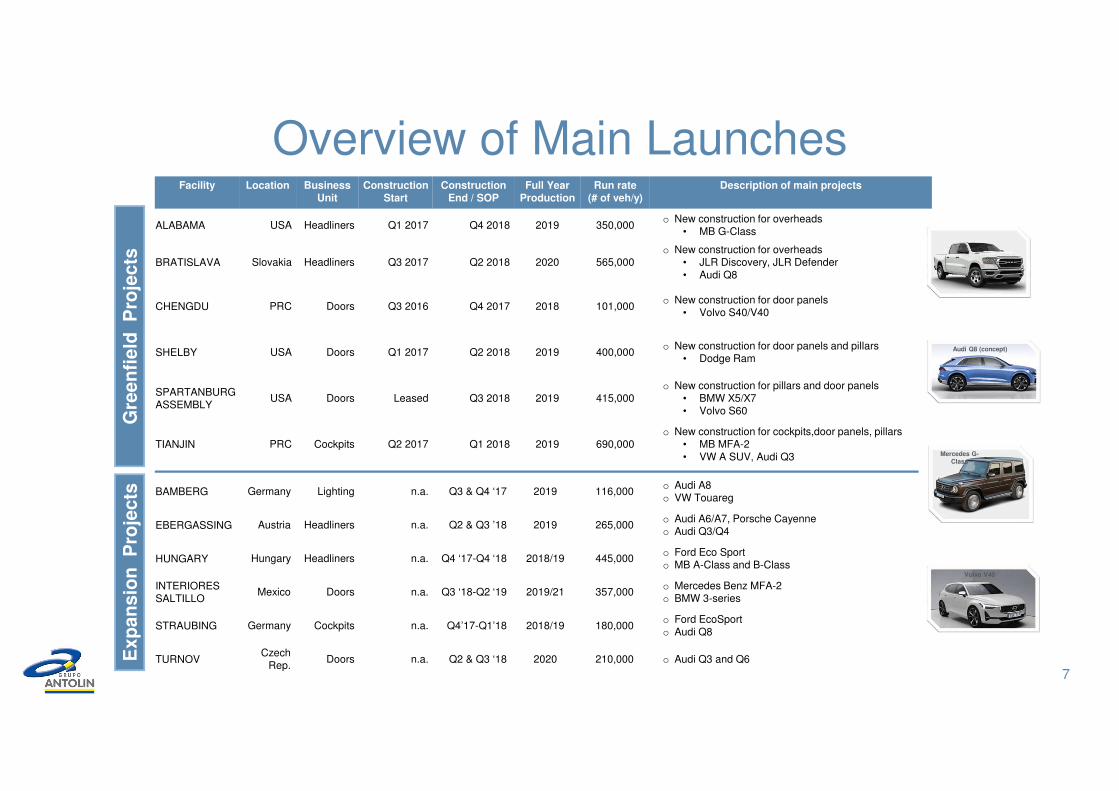
ALABAMA USA Headliners Q1 2017 Q4 2018 2019 350,000o New construction for overheads
• MB G-Class
BRATISLAVA Slovakia Headliners Q3 2017 Q2 2018 2020 565,000o New construction for overheads
• JLR Discovery, JLR Defender• Audi Q8
CHENGDU PRC Doors Q3 2016 Q4 2017 2018 101,000o New construction for door panels
• Volvo S40/V40
SHELBY USA Doors Q1 2017 Q2 2018 2019 400,000o New construction for door panels and pillars
• Dodge Ram
SPARTANBURG ASSEMBLY
USA Doors Leased Q3 2018 2019 415,000o New construction for pillars and door panels
• BMW X5/X7• Volvo S60
TIANJIN PRC Cockpits Q2 2017 Q1 2018 2019 690,000o New construction for cockpits,door panels, pillars
• MB MFA-2 • VW A SUV, Audi Q3
Gre
en
field
Pro
jects
BAMBERG Germany Lighting n.a. Q3 & Q4 ‘17 2019 116,000o Audi A8o VW Touareg
EBERGASSING Austria Headliners n.a. Q2 & Q3 ’18 2019 265,000o Audi A6/A7, Porsche Cayenneo Audi Q3/Q4
HUNGARY Hungary Headliners n.a. Q4 ‘17-Q4 ‘18 2018/19 445,000o Ford Eco Sport o MB A-Class and B-Class
INTERIORESSALTILLO
Mexico Doors n.a. Q3 ‘18-Q2 ‘19 2019/21 357,000o Mercedes Benz MFA-2 o BMW 3-series
STRAUBING Germany Cockpits n.a. Q4’17-Q1’18 2018/19 180,000o Ford EcoSporto Audi Q8
TURNOVCzech
Rep. Doors n.a. Q2 & Q3 ‘18 2020 210,000 o Audi Q3 and Q6 E
xp
an
sio
nP
roje
cts
Overview of Main Launches
7
Audi Q8 (concept)
Volvo V40
Mercedes G-Class

8
Guidance maintained
� Q1 2018 performance is in line with budget
� Numerous launches are expected to ramp up in H2 2018
� Significant project launches are consolidating Grupo Antolin’s position as supplier of choice for vehicle
interiors
� FY 2018 guidance remains unchanged
� Revenue ≈ € 5.1 bn
� EBITDA margin ≈ 8.75%
� Capex ≈ 7.0% of revenues
� Working Capital stable at c. 10% of sales
� Leverage is expected to remain below 2.0x
at year end
� Dividend ≈ € 30m
146
84
13
14 11
8 6
10
-
20
40
60
80
100
120
140
160
Q1
'17
New
Fa
cto
rie
s
New
Lau
nch
es
US
A
UK
Sale
sD
eclin
es
FX
Oth
ers
*
Q1
'18
EBITDA Developments
*Others includes provisions, consolidation adjustments, operating expenses and other minor launches, among others

9
Q1 2018 Financial Highlights
� Cash available of EUR 242m
� Available revolving credit facilities of EUR 239m
� LTM EBITDA of EUR 404m and Net Debt to EBITDA of 2.47x

10
Balanced, long term capital structure
Gross debt 31 March 2018€1,262m
Net debt 31 March 2018€1,020m
� €800m senior secured notes
� €369m senior financing
� €4m soft loans with cost; €20m soft loans with no cost
� €59m other facilities, of which €45m are credit lines
� €10m accrued interests
� Cash available of €242m
� For covenant purposes, Net debt totalled € 998 million (excludes soft
loans without financial cost, includes cash using 12 month FX average).
� €200m undrawn syndicated revolving credit facility, and €39m undrawn
local credit lines
Covenants
2.47x Net Debt/Adjusted EBITDA 9.18x EBITDA/Financial expenses
Covenant: under 3.50x Covenant: over 4.00x
€ 404m
March 2018 LTM EBITDA
2018 2019 2020 2021 2022 2023 2024 2025
Term Loan Soft loans Leasings SSN 22 Other loans ST Credit & Interests SSN 24
77
233
405 402
1
52
89
2

11
Amortization schedule as of 30th April 2018
2018 2019 2020 2021 2022 2023 2024 2025 2026
Term Loan* Soft loans Leasings SSN 22 Other loans ST Credit & Interests SSN 24 SSN 26
6121
537
402
250
23 22
187
1
*Excludes additional € 50 million committed and undrawn funds signed on 17 April 2018
Working capital
12
Free Cash Flow
911 985
883 979
-1.186 -1.259
-1.500
-1.000
-500
0
500
1.000
1.500
2.000
2.500
December 2017 ** March 2018**
+96
+75
-73
+97
WC as % of LTM Sales* 7.7%
EU
Rm
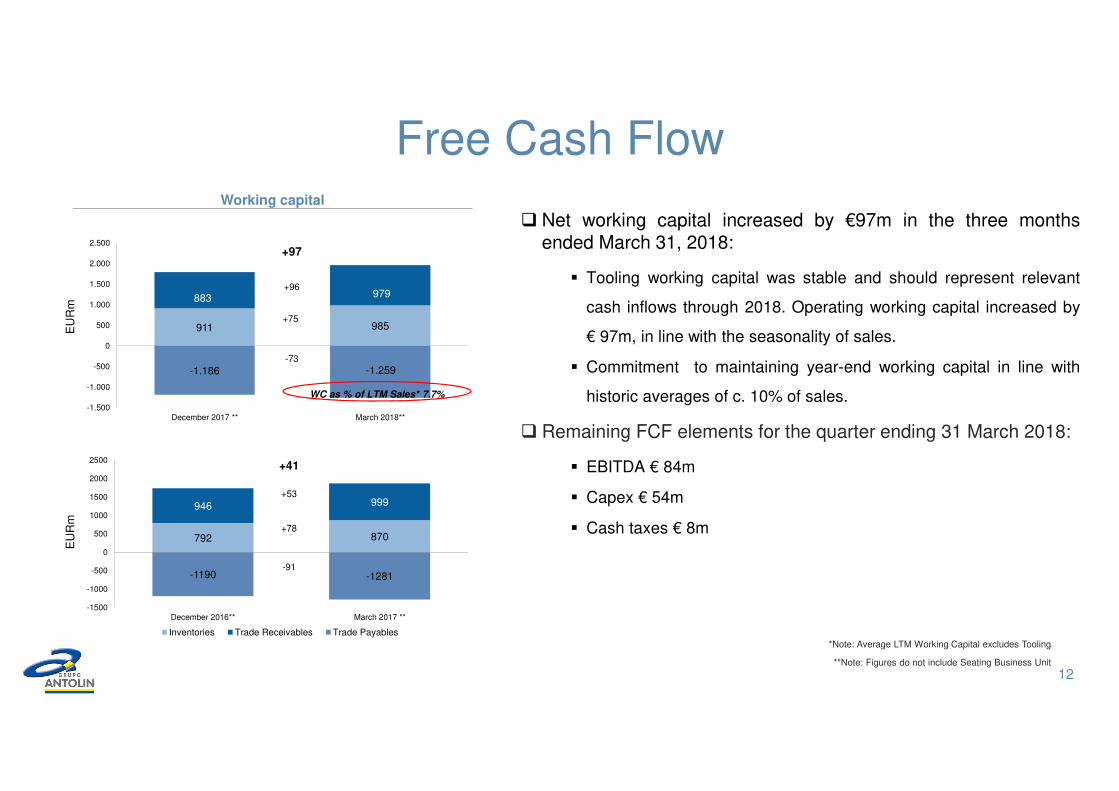
� Net working capital increased by €97m in the three monthsended March 31, 2018:
� Tooling working capital was stable and should represent relevant
cash inflows through 2018. Operating working capital increased by
€ 97m, in line with the seasonality of sales.
� Commitment to maintaining year-end working capital in line with
historic averages of c. 10% of sales.
� Remaining FCF elements for the quarter ending 31 March 2018:
� EBITDA € 84m
� Capex € 54m
� Cash taxes € 8m
*Note: Average LTM Working Capital excludes Tooling
**Note: Figures do not include Seating Business Unit
792 870
946 999
-1190 -1281
-1500
-1000
-500
0
500
1000
1500
2000
2500
December 2016** March 2017 **
Inventories Trade Receivables Trade Payables
+53
+78
-91
+41
EU
Rm

Q&A