
#TrustBarometer
2019 EDELMAN
TRUST BAROMETER
AUSTRALIA
Methodology
19th ANNUAL
EDELMAN TRUST
BAROMETER
Online Survey in 27 Markets
33,000+ respondents total
All fieldwork was conducted between
October 19 and November 16, 2018
27-market global data margin of error: General population +/- 0.6%
(N=31,050), informed public +/- 1.3% (N=6,000), mass population +/-
0.6% (26,000+), half-sample global general online population +/- 0.8
(N=15,525).
Market-specific data margin of error: General population +/- 2.9
(N=1,150), informed public +/- 6.9% (N=min 200, varies by market,
China and U.S. +/- 4.4% (N=500), mass population +/- 3.0 to 3.6 (N
=min 739, varies by market).
Employee MOE: 27-market = +/- 0.8% (N=16,944)
Market-specific = +/- 3.2 to 4.6% (N=min 446, varies by market)2
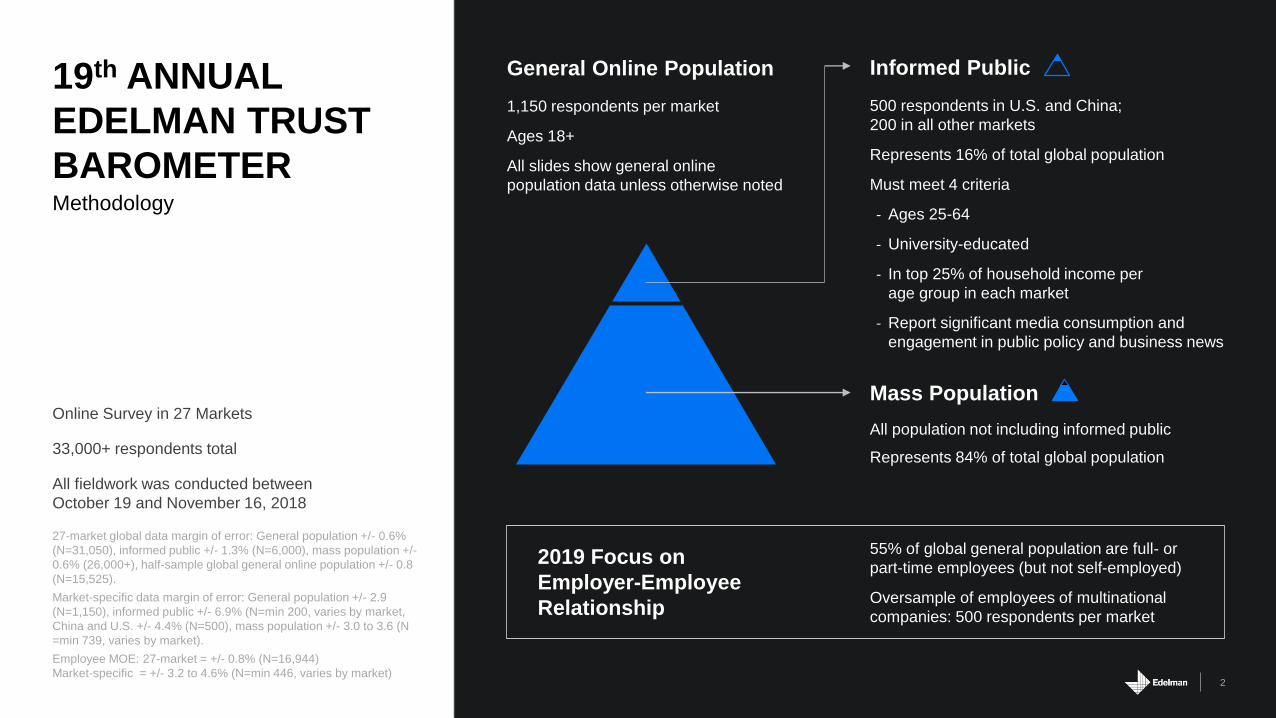
General Online Population
1,150 respondents per market
Ages 18+
All slides show general online
population data unless otherwise noted
Mass Population
All population not including informed public
Represents 84% of total global population
Informed Public
500 respondents in U.S. and China;
200 in all other markets
Represents 16% of total global population
Must meet 4 criteria
- Ages 25-64
- University-educated
- In top 25% of household income per
age group in each market
- Report significant media consumption and
engagement in public policy and business news
2019 Focus on
Employer-Employee
Relationship
55% of global general population are full- or
part-time employees (but not self-employed)
Oversample of employees of multinational
companies: 500 respondents per market

3
Global Trust Index increases 3 pts to neutral
15 of 26 markets are distrusters,
down 3 from 2018
2019 Edelman Trust Barometer. The Trust Index is the average
percent trust in NGOs, business, government and media. TRU_INS.
Below is a list of institutions. For each one, please indicate how
much you trust that institution to do what is right using a nine-point
scale where one means that you “do not trust them at all” and nine
means that you “trust them a great deal.” 9-point scale; top 4 box,
trust. General population, 26-market global average.
DISTRUST
CONTINUESTrust Index
Biggest changes in
49 Global 26
74 China
71 Indonesia
68 India
66 UAE
58 Singapore
54 Mexico
54 The Netherlands
53 Malaysia
49 Canada
47 Argentina
47 Colombia
47 Spain
46 Turkey
45 Hong Kong
44 Brazil
44 S. Korea
43 Italy
43 U.S.
41 Germany
40 Australia
40 France
39 U.K.
38 Ireland
38 S. Africa
37 Japan
36 Russia
Hong Kong +10
Australia +8
Canada +7
S. Africa +7
Russia -7
Spain -7
52 Global 26
79 China
73 Indonesia
72 India
71 UAE
62 Singapore
59 Malaysia
58 Mexico
56 Canada
55 Hong Kong
54 The Netherlands
52 Colombia
49 U.S.
48 Australia
46 Argentina
46 Brazil
46 Italy
46 S. Korea
45 S. Africa
45 Turkey
44 France
44 Germany
43 U.K.
42 Ireland
40 Spain
39 Japan
29 Russia
2018General Population
2019General Population Trust
(60-100)
Neutral
(50-59)
Distrust
(1-49)
63 Global 26
88 China
83 India
83 Indonesia
83 UAE
74 Canada
70 Malaysia
69 Singapore
68 Mexico
67 The Netherlands
66 Hong Kong
64 U.K.
61 S. Korea
60 Germany
60 U.S.
59 Australia
59 France
56 Colombia
53 Argentina
53 Italy
53 Japan
53 S. Africa
53 Turkey
51 Brazil
48 Ireland
47 Spain
35 Russia
59 Global 26
83 China
81 Indonesia
77 India
76 UAE
70 Singapore
67 The Netherlands
65 Malaysia
65 Mexico
62 Canada
60 Argentina
57 Italy
57 Turkey
56 France
55 Australia
55 Germany
55 Spain
52 U.K.
51 Brazil
50 Colombia
49 Hong Kong
49 S. Korea
48 Ireland
47 Russia
46 Japan
45 S. Africa
45 U.S.
4
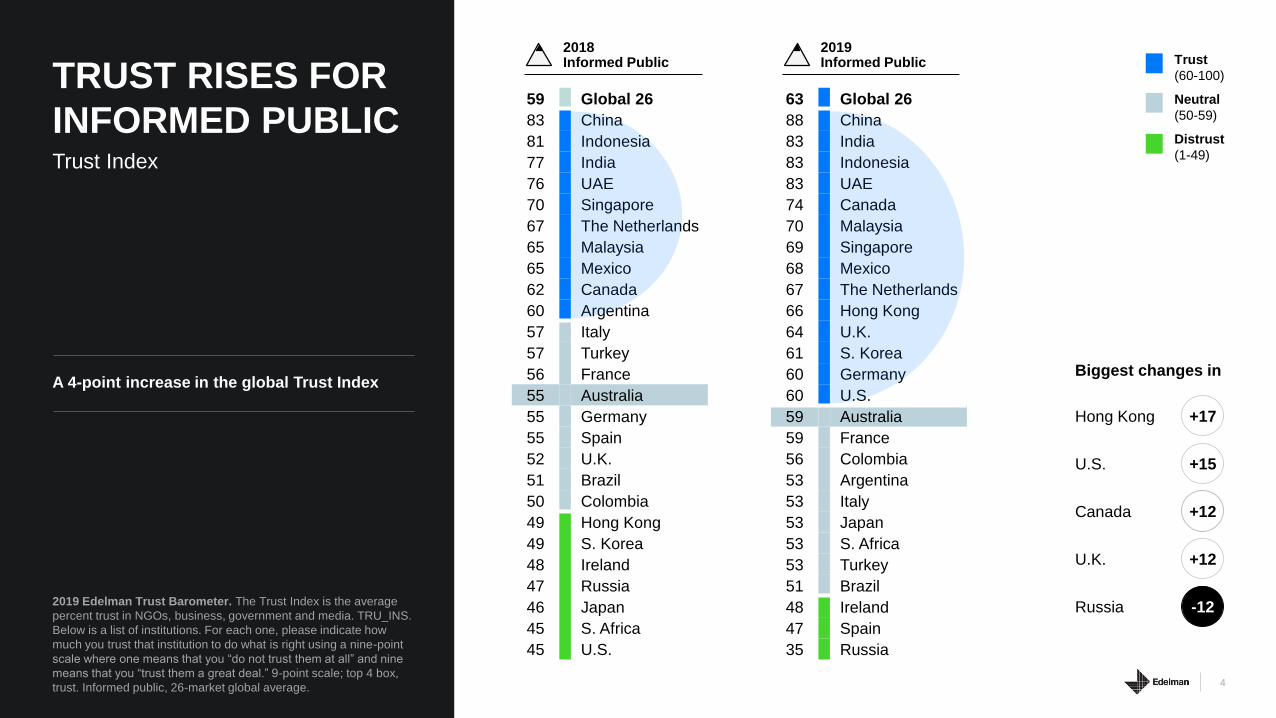
A 4-point increase in the global Trust Index
2019 Edelman Trust Barometer. The Trust Index is the average
percent trust in NGOs, business, government and media. TRU_INS.
Below is a list of institutions. For each one, please indicate how
much you trust that institution to do what is right using a nine-point
scale where one means that you “do not trust them at all” and nine
means that you “trust them a great deal.” 9-point scale; top 4 box,
trust. Informed public, 26-market global average.
TRUST RISES FOR
INFORMED PUBLICTrust Index
2018Informed Public
2019Informed Public Trust
(60-100)
Neutral
(50-59)
Distrust
(1-49)
Biggest changes in
Hong Kong +17
U.S. +15
Canada +12
U.K. +12
Russia -12

48 45
3531
5652
42 40
52019 Edelman Trust Barometer. TRU_INS. Below is a list of institutions. For each one, please indicate how much you trust that institution to do what is right using a nine-point scale where one
means that you “do not trust them at all” and nine means that you “trust them a great deal.” 9-point scale; top 4 box, trust. Informed public and general population, Australia.
Percent trust
NO INSTITUTION IN TRUSTOR TERRITORY FOR
GENERAL POPULATION
Business MediaNGOs Government
65
57
47 50
6762
54 51
General population
Informed public
+2 +5 +7 +1
+8 +7 +7 +9
2018 2019 2018 2019 2018 2019 2018 2019
2018 2019 2018 2019 2018 2019 2018 2019
Government and media still distrusted
Y-to-Y Change- +0
TrustNeutralDistrust

Trust Index
TRUST INEQUALITY FALLING IN AUSTRALIA
6
2019 Edelman Trust Barometer. The Trust Index is the average percent trust in NGOs, business, government and media. TRU_INS. Below is a list of institutions. For each one, please indicate
how much you trust that institution to do what is right using a nine-point scale where one means that you “do not trust them at all” and nine means that you “trust them a great deal.” 9-point scale;
top 4 box, trust. Informed public and mass population, Australia.
14pt gap
Informed
Public
Mass
Population
13pt gap
Trust
(60-100)
Neutral
(50-59)
Distrust
(1-49)Previous high
16pt gap
53
49
58
52
63
5455
59
3938
4341
47
4039
46
2012 2013 2014 2015 2016 2017 2018 2019
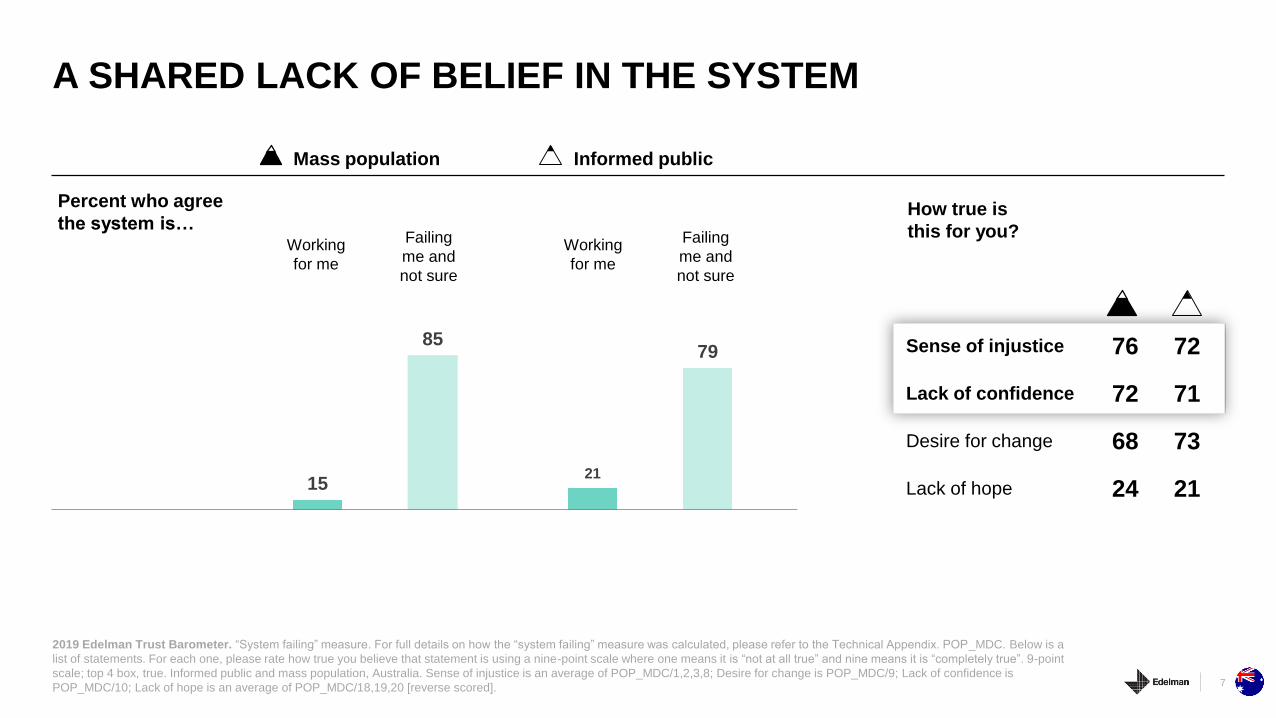
A SHARED LACK OF BELIEF IN THE SYSTEM
7
2019 Edelman Trust Barometer. “System failing” measure. For full details on how the “system failing” measure was calculated, please refer to the Technical Appendix. POP_MDC. Below is a
list of statements. For each one, please rate how true you believe that statement is using a nine-point scale where one means it is “not at all true” and nine means it is “completely true”. 9-point
scale; top 4 box, true. Informed public and mass population, Australia. Sense of injustice is an average of POP_MDC/1,2,3,8; Desire for change is POP_MDC/9; Lack of confidence is
POP_MDC/10; Lack of hope is an average of POP_MDC/18,19,20 [reverse scored].
Sense of injustice 76 72
Lack of confidence 72 71
Desire for change 68 73
Lack of hope 24 21
Mass population
15
85
21
79
Percent who agree
the system is…
Informed public
How true is
this for you?Working
for me
Failing
me and
not sure
Working
for me
Failing
me and
not sure

Traditional media
Search engines*
Owned media
Social media
8
2019 Edelman Trust Barometer. ATT_MED_AGR. Below is a list of statements. For each one, please rate how much you agree or disagree with that statement using a nine-point scale where one means “strongly
disagree” and nine means “strongly agree”. 9-point scale; top 4 box, agree. Question asked of half of the sample. COM_MCL. When looking for general news and information, how much would you trust each type of source
for general news and information? Please use a nine-point scale where one means that you “do not trust it at all” and nine means that you “trust it a great deal.” 9-point scale; top 4 box, trust. Question asked of half of the
sample. General population, Australia.
*From 2012-2015, “Online Search Engines” were included as a media type. In 2016, this was changed to “Search Engines.”
**From 2012-2015, “Hybrid Media” was included as a media type. In 2016, this was changed to “Online-Only media.”
Percent trust in each source for general news and information
TRADITIONAL MEDIA MOST TRUSTED
AUSTRALIANS JOINT LEAST TRUSTING OF SOCIAL MEDIA
57
4953
4951
46
61 61
57
48
54 55 5558
47
57
31
2324
31
32
28
2326
34
2628
28
36
2926
35
2012 2013 2014 2015 2016 2017 2018 2019
worry about false
information or fake news
being used as a weapon
64%
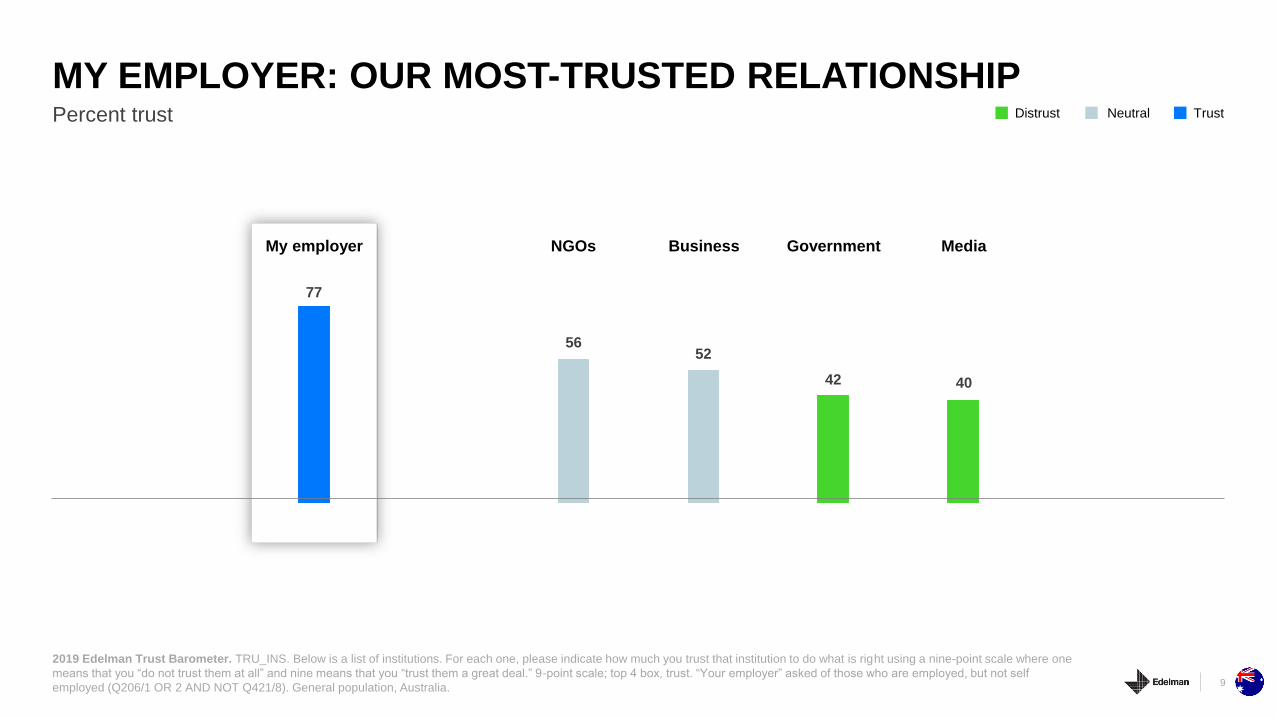
77
5652
42 40
9
2019 Edelman Trust Barometer. TRU_INS. Below is a list of institutions. For each one, please indicate how much you trust that institution to do what is right using a nine-point scale where one
means that you “do not trust them at all” and nine means that you “trust them a great deal.” 9-point scale; top 4 box, trust. “Your employer” asked of those who are employed, but not self
employed (Q206/1 OR 2 AND NOT Q421/8). General population, Australia.
Percent trust
MY EMPLOYER: OUR MOST-TRUSTED RELATIONSHIP
Business MediaNGOs GovernmentMy employer
TrustNeutralDistrust
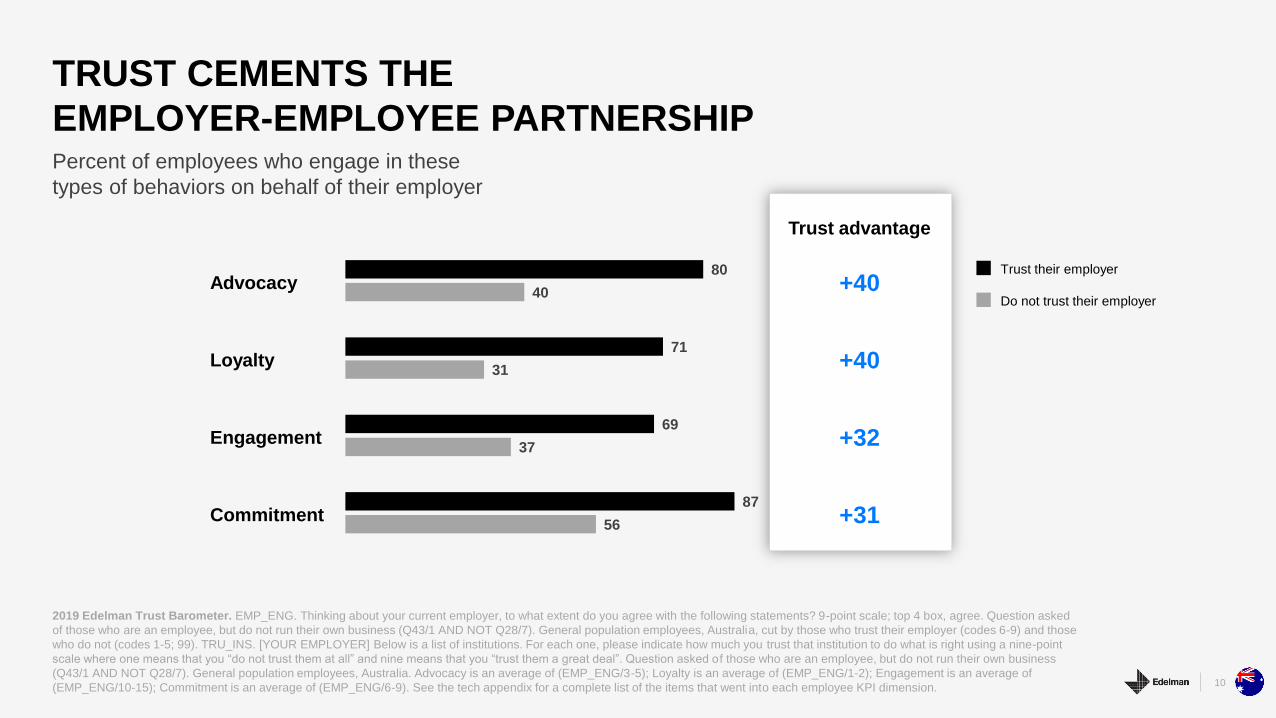
Percent of employees who engage in these
types of behaviors on behalf of their employer
TRUST CEMENTS THE
EMPLOYER-EMPLOYEE PARTNERSHIP
10
2019 Edelman Trust Barometer. EMP_ENG. Thinking about your current employer, to what extent do you agree with the following statements? 9-point scale; top 4 box, agree. Question asked
of those who are an employee, but do not run their own business (Q43/1 AND NOT Q28/7). General population employees, Australia, cut by those who trust their employer (codes 6-9) and those
who do not (codes 1-5; 99). TRU_INS. [YOUR EMPLOYER] Below is a list of institutions. For each one, please indicate how much you trust that institution to do what is right using a nine-point
scale where one means that you “do not trust them at all” and nine means that you “trust them a great deal”. Question asked of those who are an employee, but do not run their own business
(Q43/1 AND NOT Q28/7). General population employees, Australia. Advocacy is an average of (EMP_ENG/3-5); Loyalty is an average of (EMP_ENG/1-2); Engagement is an average of
(EMP_ENG/10-15); Commitment is an average of (EMP_ENG/6-9). See the tech appendix for a complete list of the items that went into each employee KPI dimension.
Trust advantage
Advocacy +40
Loyalty +40
Engagement +32
Commitment +31
37
69
31
71
40
80
56
87
Trust their employer
Do not trust their employer

44
21
46
33
45
30
Percent of employees who expect
each from a prospective employer
EMPLOYEE EXPECTATIONS NOW
INCLUDE SOCIETAL CHANGE
11
2019 Edelman Trust Barometer. TMA_SIE_SHV. Please indicate how much you agree or disagree with the following statements. 9-point scale; top 4 box, agree.
Question asked of half the sample. General population, 26-market average.
EMP_IMP. When considering an organization as a potential place of employment, how important is each of the following to you in deciding whether or not you would accept a job offer there?
Question asked of those who are an employee, but do not run their own business (Q43/1 AND NOT Q28/7). General population employees, Australia. Buckets are the sum of the average of
codes 1 & 2 for the items that make up each dimension. For details on the full list of items that went into each of the three dimensions, please refer to the Appendix.
Strong expectation
You would have to pay me
a lot more to work for an
organization that does not
offer this
Deal breaker
I would never work for an
organization
that does not offer this
Job Opportunity
My employer offers wage
growth, training, career growth
and work which I find
interesting & fulfilling
Personal Empowerment
I know what is going on, I am part
of the planning process, and I have
a voice in key decisions; the culture
is values-driven and inclusive
Shared Action
My employer has a greater
purpose, and my work has
a meaningful societal
impact
65% 75%
79%
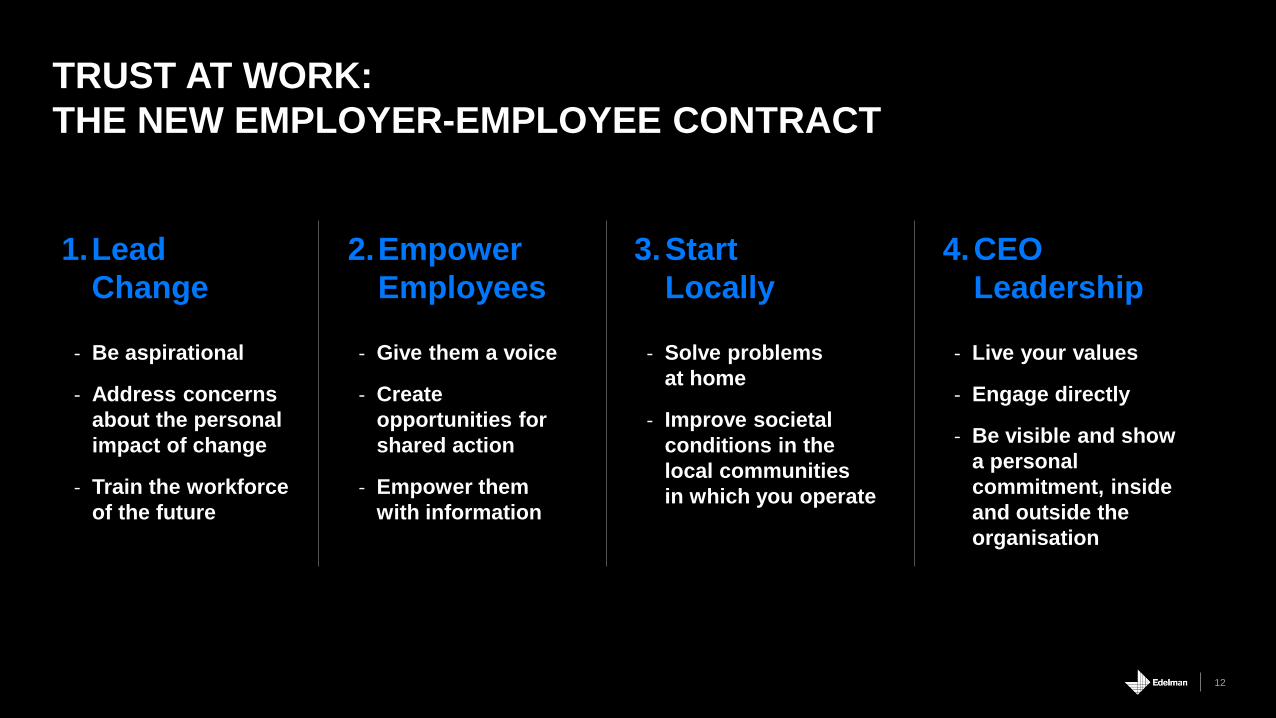
12
TRUST AT WORK:
THE NEW EMPLOYER-EMPLOYEE CONTRACT
1.Lead
Change
2.Empower
Employees
3.Start
Locally
4.CEO
Leadership
- Be aspirational
- Address concerns
about the personal
impact of change
- Train the workforce
of the future
- Give them a voice
- Create
opportunities for
shared action
- Empower them
with information
- Solve problems
at home
- Improve societal
conditions in the
local communities
in which you operate
- Live your values
- Engage directly
- Be visible and show
a personal
commitment, inside
and outside the
organisation

13
For further information:
Steven Spurr
Chief Executive Officer
Edelman Australia


