
Strategic Update James P. Gorman, Chairman and Chief Executive Officer January 17, 2019

NoticeThe information provided herein includes certain non-GAAP financial measures. The definition of such measures and/or the reconciliation of such measures to the comparable U.S. GAAP figures are included in this presentation, or in the Company’s Annual Report on Form 10-K, Definitive Proxy Statement, Quarterly Reports on Form 10-Q and the Company’s Current Reports on Form 8-K, as applicable, including any amendments thereto, which are available on www.morganstanley.com.This presentation may contain forward-looking statements including the attainment of certain financial and other targets, and objectives and goals. You are cautioned not to place undue reliance on forward-looking statements, which speak only as of the date on which they are made, which reflect management’s current estimates, projections, expectations, assumptions, interpretation or beliefs and which are subject to risks and uncertainties that may cause actual results to differ materially. The Company does not undertake to update the forward-looking statements to reflect the impact of circumstances or events that may arise after the date of forward-looking statements. For a discussion of risks and uncertainties that may affect the future results of the Company, please see the Company’s most recent Annual Report on Form 10-K, Quarterly Reports on Form 10-Q and Current Reports on Form 8-K, as applicable, which are available on www.morganstanley.com. This presentation is not an offer to buy or sell any security.The End Notes are an integral part of this Presentation. See slides 18-23 at the back of this presentation for information related to the financial metrics in this presentation.Please note this presentation is available at www.morganstanley.com.
2
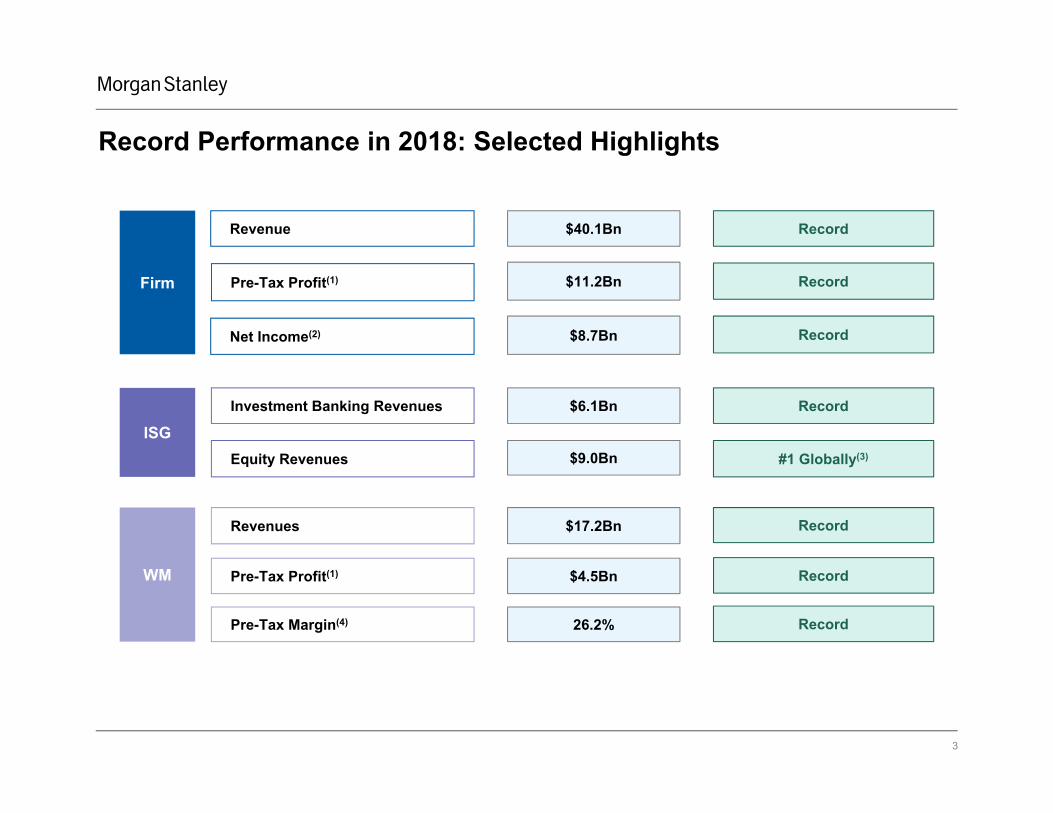
Record Performance in 2018: Selected Highlights
Revenue
Firm
ISG
WM
Record$40.1Bn
Pre-Tax Profit(1)
Net Income(2)
$11.2Bn
$8.7Bn
Equity Revenues
$6.1BnInvestment Banking Revenues
$9.0Bn
Revenues
Pre-Tax Profit(1)
Pre-Tax Margin(4)
$17.2Bn
$4.5Bn
26.2%
#1 Globally(3)
Record
Record
Record
Record
Record
Record
3

Mark to Market: 2018 – 2019 Strategic Objectives(1)
1 Deliver Wealth Mgmt. Pre-Tax Margin(2) of 26-28%
2 Expand Institutional Securities Penetration and Leadership
3 Position Investment Management for Growth
4 Realize Firm Expense Efficiency Ratio(5) of ≤73%
ROE(7): 10%-13% ROTCE(8): 11.5%-14.5%
2018 – 2019 Objectives
5 Maintain Attractive Capital Return Profile
Medium Term
• Pre-Tax Margin(2) of 26.2%
2018 Results
• 8% net revenue operating growth(3)
• Wallet share expansion across Sales & Trading and Investment Banking
• 9% asset management revenue operating growth(3)
• Positive long-term net flows(4)
• Efficiency ratio(5) of 72.0%
• Maintained $6.8Bn aggregate distribution(6)
• ROE(7): 11.5%
• ROTCE(8): 13.2%
Ongoing
-
4
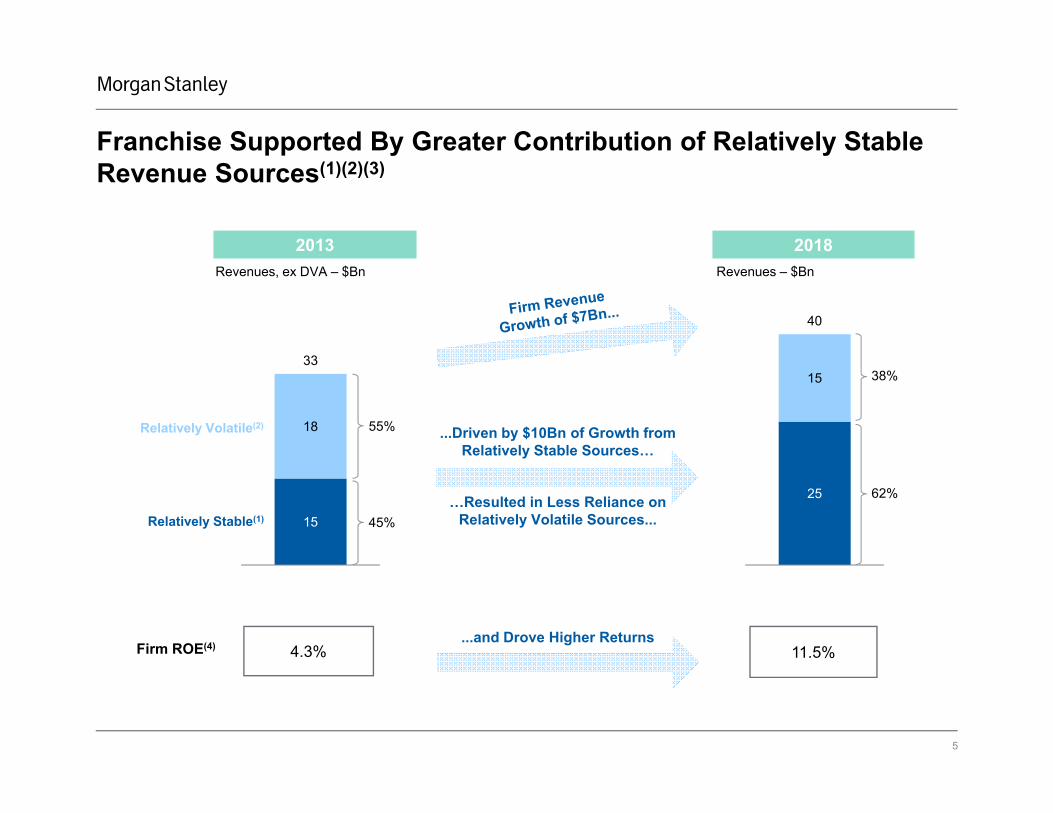
Franchise Supported By Greater Contribution of Relatively Stable Revenue Sources(1)(2)(3)
2013
Firm ROE(4) 4.3% 11.5%
2018
5
...and Drove Higher Returns
15
18
33
Relatively Stable(1)
Relatively Volatile(2) 55%
45%
25
15
40
...Driven by $10Bn of Growth from Relatively Stable Sources…
Revenues, ex DVA – $Bn Revenues – $Bn
62%
38%
…Resulted in Less Reliance on Relatively Volatile Sources...
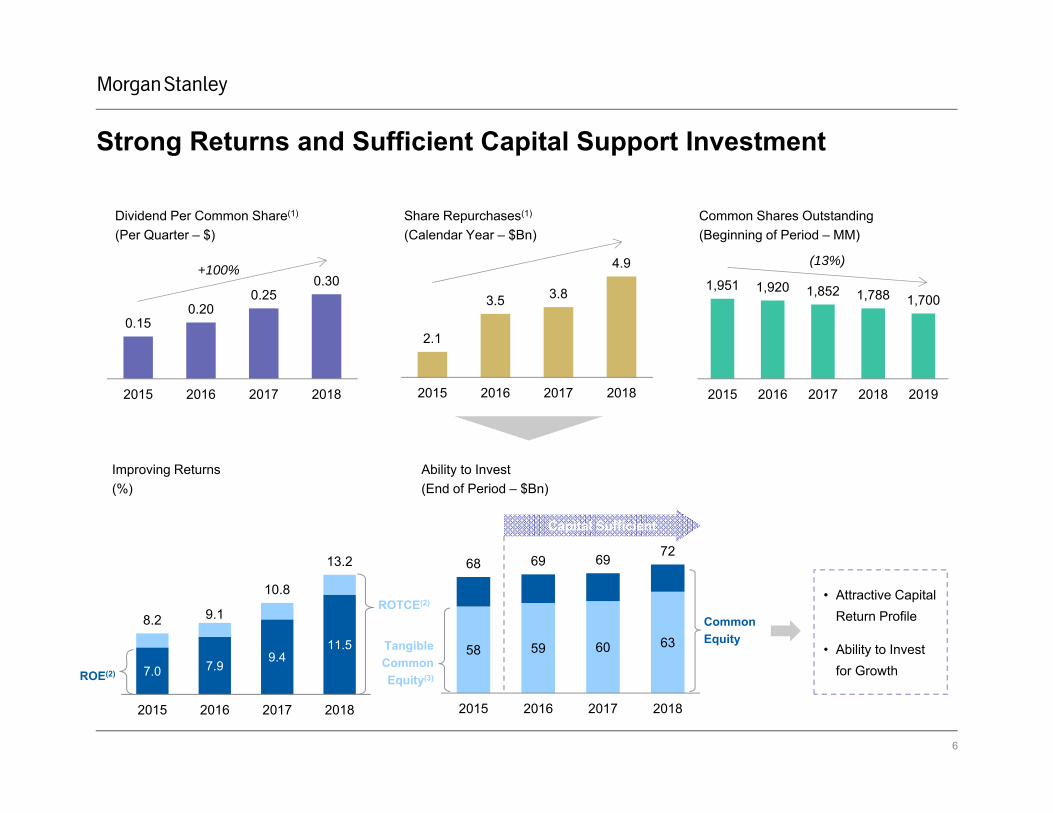
1,951 1,920 1,852 1,788 1,700
2015 2016 2017 2018 2019
58 59 60 63
68 69 69 72
2015 2016 2017 2018
Strong Returns and Sufficient Capital Support Investment
7.0 7.99.4
11.5
8.2 9.1
10.8
13.2
2015 2016 2017 2018
Improving Returns(%)
Ability to Invest(End of Period – $Bn)
ROE(2)
ROTCE(2)
Tangible CommonEquity(3)
Common Equity
Capital Sufficient
Dividend Per Common Share(1)
(Per Quarter – $)
0.150.20
0.250.30
2015 2016 2017 2018
(13%)
Common Shares Outstanding(Beginning of Period – MM)
+100%
Share Repurchases(1)
(Calendar Year – $Bn)
• Attractive Capital Return Profile
• Ability to Invest for Growth
2.1
3.5 3.8
4.9
2015 2016 2017 2018
6

Initiatives Focused on Dual Mission of Driving Growth and Enhancing Stability
• Expand Leadership in Investment Banking• Continue Targeted Growth in Lending to Institutional
Securities Group (“ISG”) Clients
Drives Growth & Enhances StabilityObjective
ISG
• Attract Client Assets Held Away
• Increase Lending Penetration with Existing Clients
• Invest and Grow Digital Offering
WM
• Enhance Client Partnerships
• Pursue Product Innovation
• Explore “Fill-In” Acquisitions (e.g., Mesa West)
IM
1
2
4
U.S.Bank(1)
3
Manage Expenses and Capital5
7

6%6%
7%
8%
8%9%
2013 2014 2015 2016 2017 2018E
Institutional Securities Businesses Gaining Wallet Share(1)(2)(3)
Wallet Share, ex DVA (%)
11%
12%12%
12%
13%
14%
2013 2014 2015 2016 2017 2018E
Wallet Share (%)
16%17%
18%
20%21% 21%
2013 2014 2015 2016 2017 2018E
Wallet Share, ex DVA (%)
1
Investment Banking Equity Sales & Trading(5)Fixed Income Sales & Trading(4)
8
(6) (6)(6)
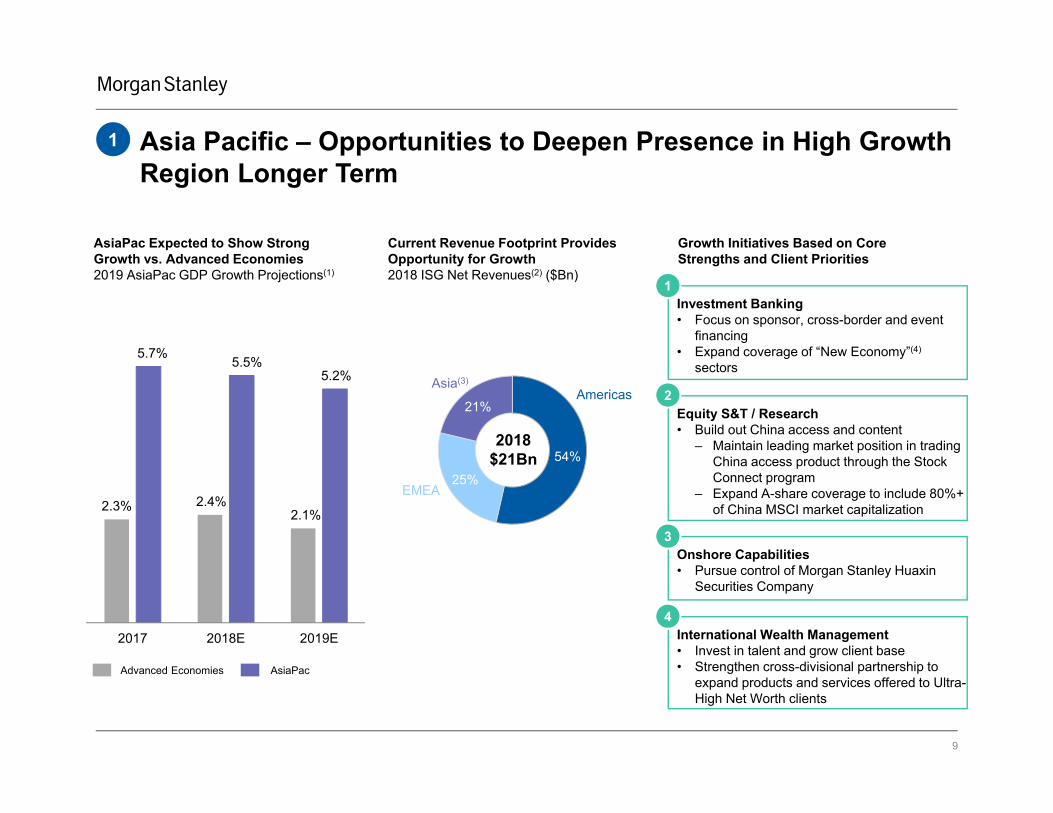
Asia Pacific – Opportunities to Deepen Presence in High Growth Region Longer Term
Current Revenue Footprint Provides Opportunity for Growth2018 ISG Net Revenues(2) ($Bn)
54%
25%
21%
2018$21Bn
AsiaPac Expected to Show StrongGrowth vs. Advanced Economies 2019 AsiaPac GDP Growth Projections(1)
Growth Initiatives Based on Core Strengths and Client Priorities
Equity S&T / Research• Build out China access and content
‒ Maintain leading market position in trading China access product through the Stock Connect program
‒ Expand A-share coverage to include 80%+ of China MSCI market capitalization
2
International Wealth Management• Invest in talent and grow client base• Strengthen cross-divisional partnership to
expand products and services offered to Ultra-High Net Worth clients
4
Investment Banking• Focus on sponsor, cross-border and event
financing• Expand coverage of “New Economy”(4)
sectors
1
2.3% 2.4%2.1%
5.7%5.5%
5.2%
2017 2018E 2019E
Onshore Capabilities• Pursue control of Morgan Stanley Huaxin
Securities Company
3
Advanced Economies AsiaPac
1
Asia(3)
Americas
EMEA
9
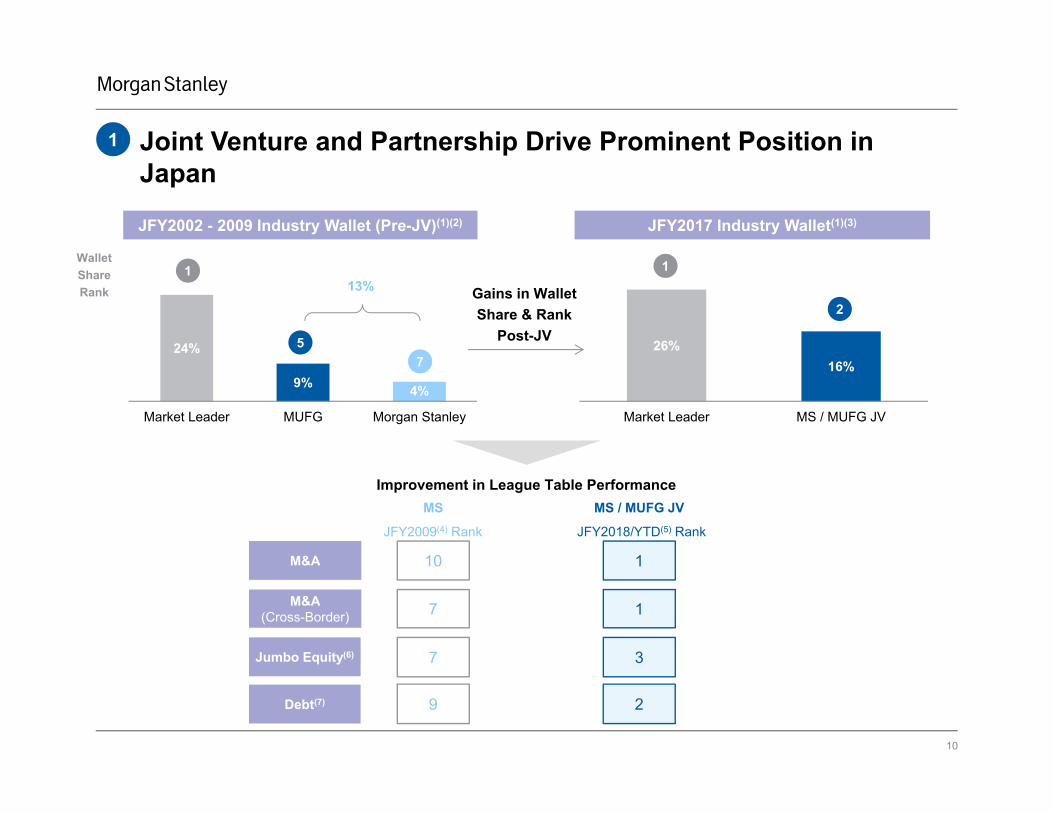
Joint Venture and Partnership Drive Prominent Position in Japan
1
JFY2002 - 2009 Industry Wallet (Pre-JV)(1)(2) JFY2017 Industry Wallet(1)(3)
10
24%
9% 4%
Market Leader MUFG Morgan Stanley
26%16%
Market Leader MS / MUFG JV
MS MS / MUFG JV
M&A
M&A(Cross-Border)
10
7
1
1
Jumbo Equity(6)
Improvement in League Table Performance
7 3
1
57
1
2
Wallet Share Rank
JFY2018/YTD(5) Rank JFY2009(4) Rank
13% Gains in Wallet Share & Rank
Post-JV
Debt(7) 9 2

2013
Average Daily
Revenues$56MM
Pre-Tax Profit(2) $2.6Bn
Net Income $1.5Bn
ROE(3) 10%
$69MM
$4.5Bn
$3.5Bn
+22%
+74%
+136%
2018
20%
Wealth Management Continues to Demonstrate Stability2
+100%
Solid Revenue Growth
Scale Matters
Tax Act Additive
Increased Returns
...Coupled with Benefits of Scale Provides Ballast
2015 20182013
57% 8%$50MM - $60MM 73%
58%$60MM - $70MM 16%
2% 33%$70MM+ 3%
Rising Proportion of Daily Revenues(1) of $70MM+...
0% 0%<$50MM 8%
40%
11
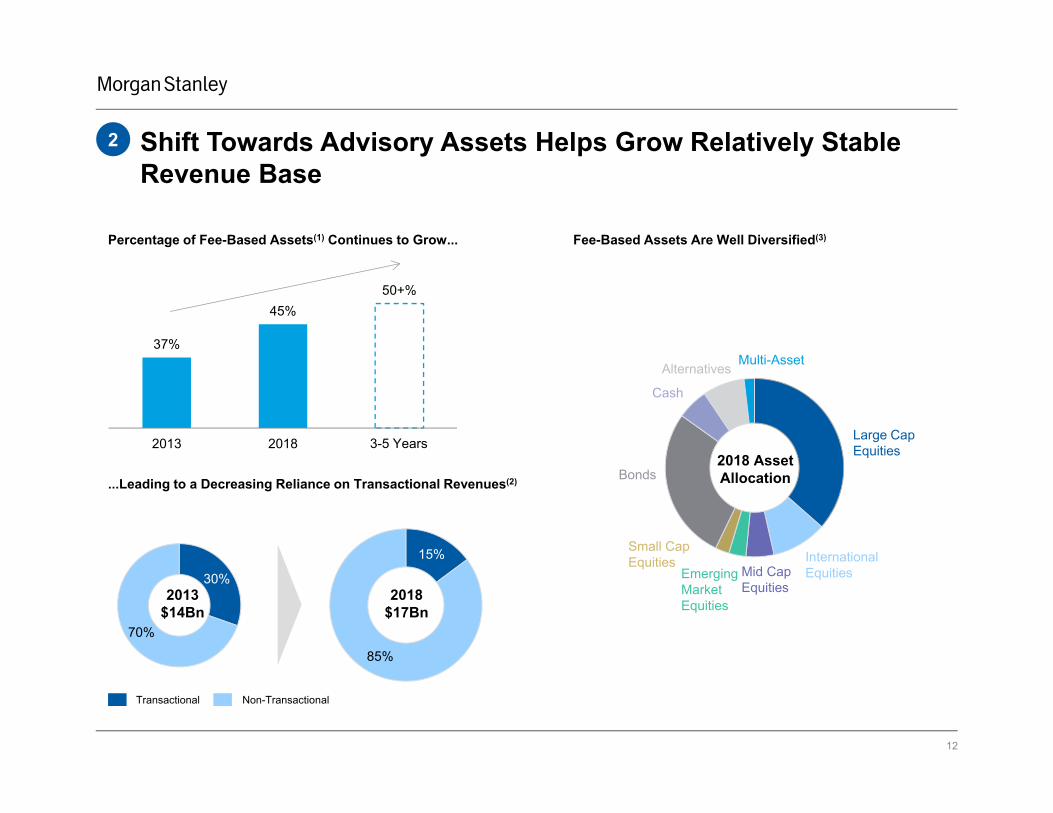
Shift Towards Advisory Assets Helps Grow Relatively Stable Revenue Base
37%
45%50+%
2013 2018
Percentage of Fee-Based Assets(1) Continues to Grow...
...Leading to a Decreasing Reliance on Transactional Revenues(2)
2
12
3-5 Years
30%
70%
2013$14Bn
15%
85%
2018$17Bn
Transactional Non-Transactional
Fee-Based Assets Are Well Diversified(3)
Cash
Multi-Asset
Large Cap Equities
Bonds
International Equities
Alternatives
Mid Cap Equities
2018 Asset Allocation
Small Cap Equities
Emerging Market Equities

Legacy Systems / SB Integration
Wealth Management’s Focus on Capturing Assets to Drive Growth
Drive Client and Advisor
Adoption
Invest in Productivity
Enhancing Tools
2009-2014 2015-2018
• Address legacy infrastructure and systems
• Create unified advisor platform for Morgan Stanley and Smith Barney advisors
• Realize merger synergies
• Significant direct investments and partnerships to create industry leading applications
‒ Goals Based
‒ Asset Aggregation
‒ Risk / Predictive Analytics
• Maintain investment in order to drive technology adoption and consolidate assets held away
• Expand banking and lending offerings and increase client penetration
• Acquire new households through digital workplace wealth solutions
18.4% 20.0%22.1% 22.4%
25.5% 26.2%
2013 2014 2015 2016 2017 2018
... While Expanding Pre-Tax Profit and MarginInvesting in Growth…
2019 & Beyond
2
2.63.0
3.3 3.4
4.3 4.5
2013 2014 2015 2016 2017 2018
Pre-Tax Margin(2) (%)
Pre-Tax Profit(1) ($Bn)
+12% CAGR
13
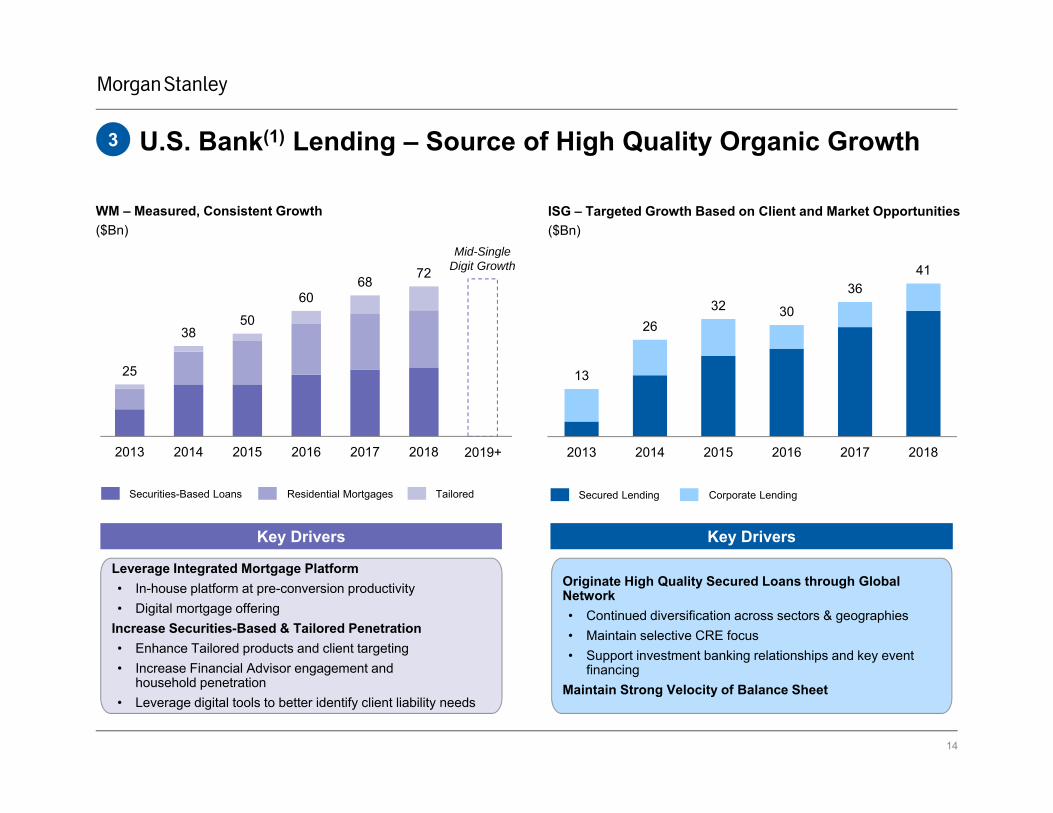
25
3850
6068
72
2013 2014 2015 2016 2017 2018
WM – Measured, Consistent Growth($Bn)
ISG – Targeted Growth Based on Client and Market Opportunities($Bn)
U.S. Bank(1) Lending – Source of High Quality Organic Growth
Secured Lending Corporate LendingTailoredSecurities-Based Loans Residential Mortgages
Mid-SingleDigit Growth
Key Drivers Key Drivers
13
2632 30
3641
2013 2014 2015 2016 2017 2018
3
14
2019+
Leverage Integrated Mortgage Platform • In-house platform at pre-conversion productivity • Digital mortgage offering
Increase Securities-Based & Tailored Penetration• Enhance Tailored products and client targeting• Increase Financial Advisor engagement and
household penetration • Leverage digital tools to better identify client liability needs
Originate High Quality Secured Loans through Global Network• Continued diversification across sectors & geographies• Maintain selective CRE focus • Support investment banking relationships and key event
financingMaintain Strong Velocity of Balance Sheet
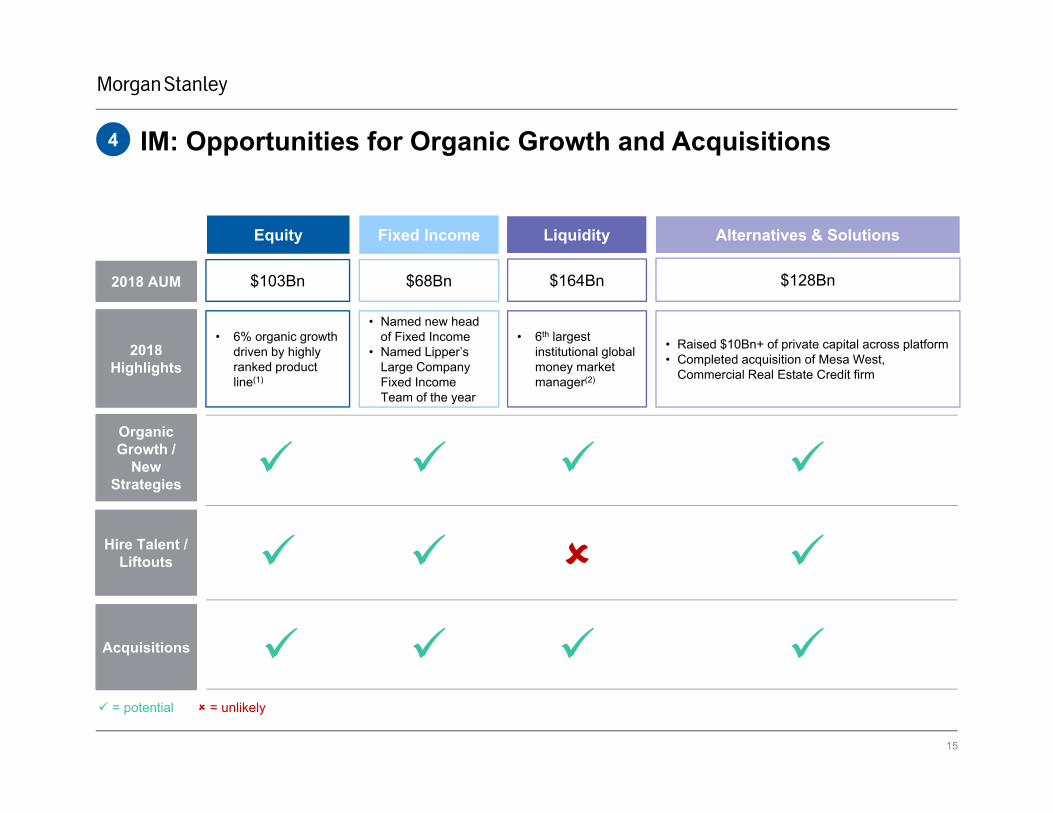
IM: Opportunities for Organic Growth and Acquisitions4
Equity Fixed Income
Organic Growth /
New Strategies
Hire Talent / Liftouts
Acquisitions
= potential = unlikely
Alternatives & Solutions
• 6% organic growth driven by highly ranked product line(1)
• Named new head of Fixed Income
• Named Lipper’s Large Company Fixed Income Team of the year
• 6th largest institutional global money market manager(2)
• Raised $10Bn+ of private capital across platform• Completed acquisition of Mesa West,
Commercial Real Estate Credit firm
2018Highlights
Liquidity
$103Bn $68Bn $128Bn2018 AUM $164Bn
15
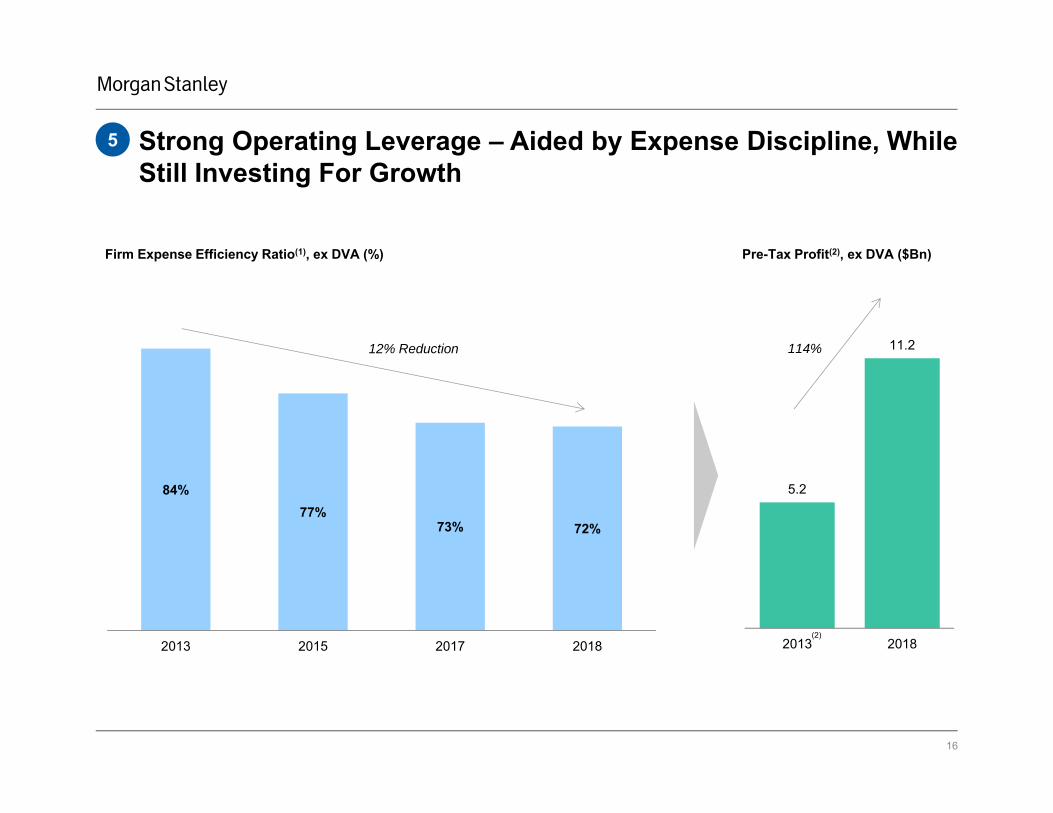
5 Strong Operating Leverage – Aided by Expense Discipline, While Still Investing For Growth
Firm Expense Efficiency Ratio(1), ex DVA (%)
5.2
11.2
2013 2018
Pre-Tax Profit(2), ex DVA ($Bn)
114%
84%77%
73% 72%
2013 2015 2017 2018
12% Reduction
16
(2)

Strategic Objectives(1)
17
Opportunities
“Fill-In” Acquisitions for Wealth and Investment Management Businesses
100% Payout Ratio, Absent Acquisitions and Subject to Regulatory Approval(4)
Leverage Capital Base to Support Organic Business Initiatives
2
3
11 Deliver Wealth Mgmt. Pre-Tax Margin(2) of
26-28%
2 Expand ISG Penetration and Leadership
3 Position Investment Management for Growth
4 Realize Firm Expense Efficiency Ratio(3) of ≤73%
2018 – 2019 Strategic Objectives
5 Maintain Attractive Capital Return Profile
ROE(5): 10%-13% ROTCE(6): 11.5%-14.5%

End Notes
These notes refer to the financial metrics presented on Slide 3.
1. Pre-Tax Profit is defined as income from continuing operations before income taxes.2. Represents net income applicable to Morgan Stanley.3. Estimated by combining the actual results for peers that have reported full-year 2018 results as of January 16, 2019, and for the European peers that have not yet reported
2018 results, nine months of 2018 annualized.4. Pre-Tax Margin represents income (loss) from continuing operations before taxes divided by net revenues. Pre-Tax Margin is a non-GAAP financial measure that the Firm
considers useful for investors to assess operating performance.
These notes refer to the financial metrics presented on Slide 4.
1. Represents results against the 2018-2019 Strategic Objectives established at the beginning of 2018.2. Pre-Tax Margin represents income (loss) from continuing operations before taxes divided by net revenues. Pre-Tax Margin is a non-GAAP financial measure that the Firm
considers useful for investors to assess operating performance.3. Operating growth rate percentages for Institutional Securities (‘ISG’) net revenues and Investment Management (‘IM’) asset management revenues exclude the impact of the
2018 gross ups which resulted from the adoption of the accounting update, Revenue from Contracts with Customers (‘Revenue Recognition’). See Note 2 to the financial statements included in our Quarterly Report on Form 10-Q for the quarterly period ended March 31, 2018 (‘March 2018 10-Q’) for information on the adoption of the Revenue Recognition accounting update. In determining the growth rate percentages approximately $320 million was excluded from ISG 2018 net revenues and approximately $78 million was excluded from IM 2018 asset management revenues. Growth rate percentages excluding the impact of the adoption of the RevenueRecognition accounting update are non-GAAP financial measures the Firm considers useful for investors to assess year-over-year operating performance.
4. Long-term net flows include the equity, fixed income and alternative/other asset classes and exclude the liquidity asset class.5. Firm Expense Efficiency Ratio represents total non-interest expenses as a percentage of net revenues.6. In June 2018, we received a conditional non-objection to our Capital Plan, where the only condition was that our capital distributions not exceed the greater of the actual
distributions we made over the previous four calendar quarters, or the annualized average of actual distributions over the previous eight calendar quarters. Our 2018 Capital Plan includes the repurchase of up to $4.7 billion of outstanding common stock for the four quarters beginning in the third quarter of 2018 through the end of the second quarter of 2019, as well as an increase in the Firm’s quarterly common stock dividend to $0.30 per share from the previous $0.25 per share that commenced with the dividend announced on June 28, 2018. The total amount of expected 2018 capital distributions is consistent with the $6.8 billion of actual dividends and gross share repurchases included in our 2017 Capital Plan.
7. The calculation of return on average common equity (‘ROE’), for both the medium term target and 2018 results, utilizes net income applicable to Morgan Stanley less preferred dividends as a percentage of average common equity, exclusive of intermittent discrete tax items. The 2018 ROE result excludes intermittent net discrete tax benefits of approximately $203 million, which resulted in an approximate 30 basis point reduction in ROE. When excluding intermittent net discrete tax benefits, both the ROE numerator and denominator are adjusted. ROE excluding intermittent discrete tax items is a non-GAAP financial measure that the Firm considers useful for investors to assess operating performance.
8. The calculation of return on average tangible common equity (‘ROTCE’), for both the medium term target and 2018 results, utilizes net income applicable to Morgan Stanley less preferred dividends as a percentage of average tangible common equity, exclusive of intermittent discrete tax items. Tangible Common Equity (‘TCE’) equals common equity less goodwill and intangible assets net of allowable mortgage servicing rights. The 2018 ROTCE result excludes intermittent net discrete tax benefits of approximately $203 million, which resulted in an approximate 30 basis point reduction in ROTCE. When excluding intermittent net discrete tax benefits, both the ROTCE numerator and denominator are adjusted. ROTCE excluding intermittent discrete tax items and TCE are non-GAAP financial measures that the Firm considers useful for investors to assess operating performance.
18

End Notes
These notes refer to the financial metrics presented on Slide 5.
1. Relatively stable revenue sources represent revenues associated with fee-based pricing arrangements, financing and lending that are generally less susceptible to significant fluctuation as a result of market volatility when compared to other Firm revenues, and are comprised of: Asset Management revenues in the Wealth and Investment Management segments; revenues from Financing and Secured Lending activities in the ISG and Wealth Management (‘WM’) segments; and revenues from Investment Banking Advisory services.
2. Relatively volatile revenues comprise the remainder of Firm revenues, including revenues from: Sales and Trading activities (excluding the ISG Financing and Secured Lending activities noted above); Investment Banking Underwriting and Lending activities; WM Transactional activities; Investments; other Lending activities; and any other sources.
3. The percentages of total net revenues are calculated as relatively stable or relatively volatile revenue sources, respectively as a percentage of total net revenues for the period indicated. Total net revenues of approximately $33 billion utilized as the denominator in the 2013 calculation excludes the negative impact of approximately $681 million from Debt Valuation Adjustment (‘DVA’). DVA represents the change in fair value resulting from fluctuations in our credit spreads and other credit factors related to liabilities carried under the fair value option. Net revenues excluding DVA is a non-GAAP financial measure that the Firm considers useful for investors to assess year-over-year operating performance.
4. The calculation of ROE utilizes net income applicable to Morgan Stanley less preferred dividends as a percentage of average common equity, exclusive of intermittent discrete tax items. The 2018 and 2013 ROE percentages exclude intermittent net discrete tax benefits of approximately $203 million (an approximate 30 basis point reduction in ROE) and approximately $407 million (approximate 60 basis point reduction in ROE), respectively. Beginning in 2017, income tax consequences associated with employee share-based awards are recognized in the provision for income taxes in the income statement, but are excluded from the intermittent net discrete tax items adjustment, as we anticipate conversion activity each year. See Note 2 to the financial statements included in our 2017 Form 10-K for information on the adoption of the accounting update, Improvements to Employee Share-Based Payment Accounting. The calculation of ROE for 2013 also excludes the negative net of tax impact of approximately $452 million from DVA (approximate 60 basis point increase in ROE). When excluding intermittent net discrete tax benefits and DVA, both the ROE numerator and denominator are adjusted. The calculations of ROE, excluding intermittent discrete tax items and DVA are non-GAAP financial measures that the Firm considers useful for investors to assess year-over-year operating performance.
These notes refer to the financial metrics presented on Slide 6.
1. Dividends are reflected based on the amount increased to within the calendar period noted. Share repurchases represent actual shares re-acquired during the year noted, representing a blend of two sequential CCAR cycles.
2. The calculations of ROE and ROTCE for each year utilize net income applicable to Morgan Stanley less preferred dividends as a percentage of average common equity and average tangible common equity, respectively, exclusive of intermittent discrete tax items. The calculations for 2015 also exclude the impact of DVA. The 2018 ROE and ROTCE percentages exclude intermittent net discrete tax benefits of approximately $203 million (an approximate 30 basis point reduction). For reconciliations of ROE and ROTCE, excluding intermittent discrete tax items and DVA for the years 2015 through 2017, see pages 37 and 38 of the 2017 Form 10-K. When excluding intermittent net discrete tax items and DVA, both the ROE and ROTCE numerators and denominators are adjusted. Beginning in 2017, income tax consequences associated with employee share-based awards are recognized in the provision for income taxes in the income statement, but are excluded from the intermittent net discrete tax items adjustment, as we anticipate conversion activity each year. ROE and ROTCE, excluding intermittent discrete tax items and DVA are non-GAAP financial measures that the Firm considers useful for investors to assess year-over-year operating performance.
3. Tangible Common Equity (‘TCE’) equals common equity less goodwill and intangible assets net of allowable mortgage servicing rights. TCE is a non-GAAP financial measure that the Firm considers useful for investors to assess capital adequacy.
19

End Notes
These notes refer to the financial metrics presented on Slide 7.
1. U.S. Bank represents the Firm’s U.S. Bank operating subsidiaries, Morgan Stanley Bank, N.A. and Morgan Stanley Private Bank, National Association. We provide loans to a variety of clients and customers primarily through our U.S. Bank.
These notes refer to the financial metrics presented on Slide 8.
1. Wallet represents the aggregated reported net revenues of Morgan Stanley and the following peers: Goldman Sachs, JP Morgan, Bank of America, Citigroup, UBS, Deutsche Bank, Credit Suisse, and Barclays. Morgan Stanley’s Wallet Share is calculated as the percentage of Morgan Stanley’s net revenues, excluding DVA (where applicable) to the Wallet.
2. European peer results were translated to USD using average exchange rates for the appropriate period; sourced from Bloomberg.3. Peer data has been adjusted for DVA, where it is reported and where applicable. Goldman Sachs’ Equity Sales & Trading results also exclude the Americas Reinsurance
business which was sold in 2013.4. Fixed Income Sales & Trading net revenues, exclude: for 2013, the negative impact from DVA of $603 million; for 2014, the positive impact from DVA of $419 million; for
2015, the positive impact from DVA of $455 million. Fixed Income Sales & Trading Net Revenues, excluding DVA is a non-GAAP financial measure the Firm considers useful for investors to allow better comparability of period to period operating performance.
5. Equity Sales & Trading net revenues, exclude: for 2013, the negative impact from DVA of $78 million; for 2014, the positive impact from DVA of $232 million; for 2015, the positive impact from DVA of $163 million. Equity Sales & Trading Net Revenues, excluding DVA is a non-GAAP financial measure the Firm considers useful for investors to allow better comparability of period to period operating performance.
6. The 2018 Wallet estimates utilize actual results for peers that have reported full-year 2018 results as of January 16, 2019. For the European peers that have not yet reported 2018 results, the full year estimate is derived by assuming the aggregate share of the European peers for the first nine months remains constant in the fourth quarter of 2018.
These notes refer to the financial metrics presented on Slide 9.
1. Source: Indicators from the World Economic Outlook published October 2018 by the International Monetary Fund2. ISG operates in both U.S. and non-U.S. markets, with non-U.S. business activities principally conducted and managed through EMEA and Asia locations. The net revenues
presented reflect the regional view of ISG’s net revenues on a managed basis, based on the following methodology: advisory and equity underwriting—client location; debt underwriting—revenue recording location; sales and trading—trading desk location.
3. Asia region includes Asia Pacific and Japan.4. New Economy sectors are defined by Morgan Stanley Research as Consumer, IT, Media & Entertainment and Healthcare.
20

End Notes
These notes refer to the financial metrics presented on Slide 10.
1. JFY denotes Japanese Fiscal Year, which starts on April 1.2. JFY 2002 – 2009 Industry Wallet represents the average reported revenues from JFY 2002 to JFY 2009 (where available) from the Japanese securities divisions of the
following entities and legacy entities: Nomura, Daiwa, Mizuho, SMBC Nikko, Mitsubishi UFJ Securities, Goldman Sachs, Morgan Stanley, Citigroup, Deutsche Bank, Merrill Lynch, UBS, JP Morgan, Credit Suisse BNP Paribas, Barclays and Mitsubishi UFJ Morgan Stanley PB Securities. Where reported revenues were not available for the entire period JFY 2002 to JFY 2009, a shorter period average was utilized. Wallet Shares for Market Leader, MUFG and Morgan Stanley are calculated as the percentage of the average revenues from JFY 2002 to JFY 2009 from the Japanese securities divisions of Nomura, Mitsubishi UFJ Securities and Morgan Stanley, respectively, to the Wallet.
3. JFY 2017 Industry Wallet represents the JFY 2017 reported revenues from the Japanese securities divisions (where available) of the following entities: Nomura, Morgan Stanley MUFG Securities, Mitsubishi UFJ Morgan Stanley Securities (consolidated with Mitsubishi UFJ Morgan Stanley PB Securities), SMBC Nikko, Daiwa, Mizuho, Goldman Sachs, JP Morgan, Deutsche Bank, Citigroup, Merrill Lynch, Barclays, Credit Suisse, BNP Paribas and UBS. Where only calendar year reported results were available for the Japanese securities divisions of the noted entities, such calendar year results were utilized. Wallet Share for Market Leader is calculated as the percentage of revenues from the Japanese securities divisions of Nomura to the Wallet. Wallet Share for MS / MUFG JV is calculated as a percentage of the revenues from the Japanese securities divisions of Mitsubishi UFJ Morgan Stanley Securities and Morgan Stanley MUFG Securities to the Wallet.
4. Source is Thomson Reuters.5. From April 1, 2018 to December 31, 2018. Source is Thomson Reuters.6. Includes IPOs and Follow On transactions over Yen 100 billion. Source is Thomson Reuters.7. Includes Yen domestic bond issuances and non-Yen issuances by Japanese issuers. Domestic debt is defined as JPY issuances of straight corporate bonds, zaito institution
bonds and municipal bonds from Japanese issuers. Non-Yen issuances are USD/EUR deals of US$250MM / EUR250MM and above. Excludes deals with sole bookrunnersand excludes issuances by non-Japanese subsidiaries of Japanese companies for which issuance decisions are made outside Japan. Source is Morgan Stanley’s analysis of Thomson Reuters, IFR and Bloomberg data.
These notes refer to the financial metrics presented on Slide 11.
1. The daily revenue distribution reflects net revenues for the WM segment attributed as follows: Transactional revenues on the day the revenue was recorded; and Asset Management, Net Interest and Other revenues based on a daily average, where the reported revenue for the period is divided by the number of calendar days in the period.
2. Pre-Tax Profit is defined as income from continuing operations before income taxes.3. The calculation of ROE for the WM segment uses net income applicable to Morgan Stanley from WM less preferred dividends allocated to WM as a percentage of average
common equity allocated to WM. The Firm's capital estimation and attribution to business segments are based on the Required Capital framework, an internal capital adequacy measure. This framework is a risk based and leverage use‐of‐capital measure, which is compared with the Firm's regulatory capital to ensure that the Firm maintains an amount of going concern capital after absorbing potential losses from stress events, where applicable, at a point in time. The common equity estimation and attribution to business segments is based on the Firm's fully phased‐in regulatory capital requirements, including supplementary leverage, and incorporates the Firm's internal stress tests.
21

End Notes
These notes refer to the financial metrics presented on Slide 12.
1. Wealth Management fee‐based client account assets represent the amount of assets in client accounts where the basis of payment for services is a fee calculated on those assets.
2. Transactional revenues include investment banking, trading, and commissions and fee revenues.3. Portfolio of managed assets.
These notes refer to the financial metrics presented on Slide 13.
1. Pre-Tax Profit is defined as income from continuing operations before income taxes.2. Pre-Tax Margin represents income (loss) from continuing operations before taxes divided by net revenues. Pre-Tax Margin is a non-GAAP financial measure that the Firm
considers useful for investors to assess operating performance.
These notes refer to the financial metrics presented on Slide 14.
1. U.S. Bank represents the Firm’s U.S. Bank operating subsidiaries, Morgan Stanley Bank, N.A. and Morgan Stanley Private Bank, National Association.
These notes refer to the financial metrics presented on Slide 15.
1. Organic growth represents net long-term flows divided by beginning long-term AUM, in the equity asset class. The 6% organic growth in the equity asset class is driven by top performing funds compiled by Morningstar.
2. Rank is based on assets compiled by iMoneyNet as of December 31, 2018.
These notes refer to the financial metrics presented on Slide 16.
1. Firm Expense Efficiency ratio represents total non-interest expenses as a percentage of net revenues (or in 2013 and 2015, Net Revenues, excluding DVA). For 2013, the Expense Efficiency ratio was calculated as non-interest expenses of $27,935 million, divided by net revenues of $33,174, which excludes the negative impact of $681 million from DVA. For 2015, the Expense Efficiency ratio was calculated as non-interest expenses of $26,660 million, divided by net revenues of $34,537, which excludes the positive impact of $618 million from DVA. The Expense Efficiency ratio, excluding DVA is a non-GAAP financial measure the Firm considers useful for investors to assess year-over-year operating performance.
2. Pre-Tax Profit is defined as income from continuing operations before income taxes. Pre-Tax Profit for 2013 excludes the negative impact of $681 million from DVA. Income from continuing operations before income taxes, excluding DVA is a non-GAAP financial measure the Firm considers useful for investors to assess year-over-year operating performance.
22

End Notes
These notes refer to the financial metrics presented on Slide 17.
1. The attainment of these objectives may be impacted by external factors that cannot be predicted at this time, including macroeconomic and market conditions and future regulations.
2. Pre-Tax Margin represents income (loss) from continuing operations before taxes divided by net revenues. Pre-Tax Margin is a non-GAAP financial measure that the Firm considers useful for investors to assess operating performance.
3. Firm Expense Efficiency ratio represents total non-interest expenses as a percentage of net revenues.4. Capital returns are subject to regulatory approval.5. The calculation of ROE uses net income applicable to Morgan Stanley less preferred dividends as a percentage of average common equity. The ROE target of 10% to 13%
excludes intermittent discrete tax items. ROE target, excluding intermittent discrete tax items, is a non-GAAP financial measure that the Firm considers useful for investors to assess operating performance.
6. The calculation of ROTCE uses net income applicable to Morgan Stanley less preferred dividends as a percentage of average tangible common equity. TCE equals common equity less goodwill and intangible assets net of allowable mortgage servicing rights. The ROTCE target of 11.5% to 14.5% excludes intermittent discrete tax items. ROTCE excluding intermittent discrete tax items and TCE are non-GAAP financial measures that the Firm considers useful for investors to assess operating performance.
23

Strategic Update James P. Gorman, Chairman and Chief Executive Officer January 17, 2019


