
Paper 228-29
Automated Testing and Real-time Event Management: An Enterprise Notification System
Greg Barnes Nelson, Danny Grasse & Jeff Wright
ThotWave Technologies, LLC. – Cary, NC
ABSTRACT
Data manipulation is a delicate activity, particularly when complex operations are performed on massive amounts
of information. Accuracy of results—the forte of the SAS System—is critical for interpreting, forecasting, and
decision-making. In addition, when iterative steps are required before data can be utilized, the opportunity for
lost or incorrect data, including the possibility of premature processes halting, increases. As time and technology
advance, the less likely we will possess prescient knowledge of myriad variables that can affect the algorithms in
an enterprise-wide system. However, we can be prepared to manage problems in a timely manner. Event
management is a proactive way to identify, track, and resolve these issues.
This paper discusses a specific design to monitor the conditions SAS programs encounter. It explores the
concepts of automated tests through assertions, events and their attributes, event status management, and
automatic notification of events to interested parties. These concepts are presented from the perspective of the
SAS programmer and the systems analyst.
BACKGROUND
This paper provides some background explanation of a system we created to help provide a layer of robustness
and manageability for SAS applications. We built the system described in this paper with the purpose of
supporting some fundamental business issues discovered while developing and deploying enterprise SAS
applications. Specifically, it was our desire to:
• Have a convenient way to see what was happening in SAS jobs without parsing the logs to look for strings
of “stuff”.
• Find out about issues before the SAS job was finished. This was particularly important because in large,
enterprise applications, a data warehouse/ analytic process may take several hours. When errors
occurred, we wanted to know about them in real-time.
• Provide a controlled way to start, stop and restart SAS jobs, even though this method could mean starting
a job mid-stream (i.e., after several of its predecessors had run successfully) and not have to rerun
everything from scratch.
• Develop an API allowing us to add our own user defined events (in addition to WARNINGS and
ERRORS) that could be utilized to define test cases and/or business rules, which could be attached or
associated with an event.
SUGI 29 Systems Architecture
• Generate events that could be stored in a database, sent out on a message queue, written to an audit trail
and/or emailed (along with attachments) to a list of interested parties.
• Provide a method for viewing events for a particular system “run” and drill down into event levels
(ERRORS, WARNINGS, INFO, etc.), event categories (a user/system defined method to follow the lineage
of a program – similar to a tree), and event types (descriptive information that categorizes the problem
into one of several user-defined buckets.)
While our goals were fairly ambitious, we knew if we could accomplish them, significant value would be added to
the applications we build for clients. In addition, we knew that much of the time and energy developers put into
creating automated test scripts and error handling routines could be reduced, since most of the work would be
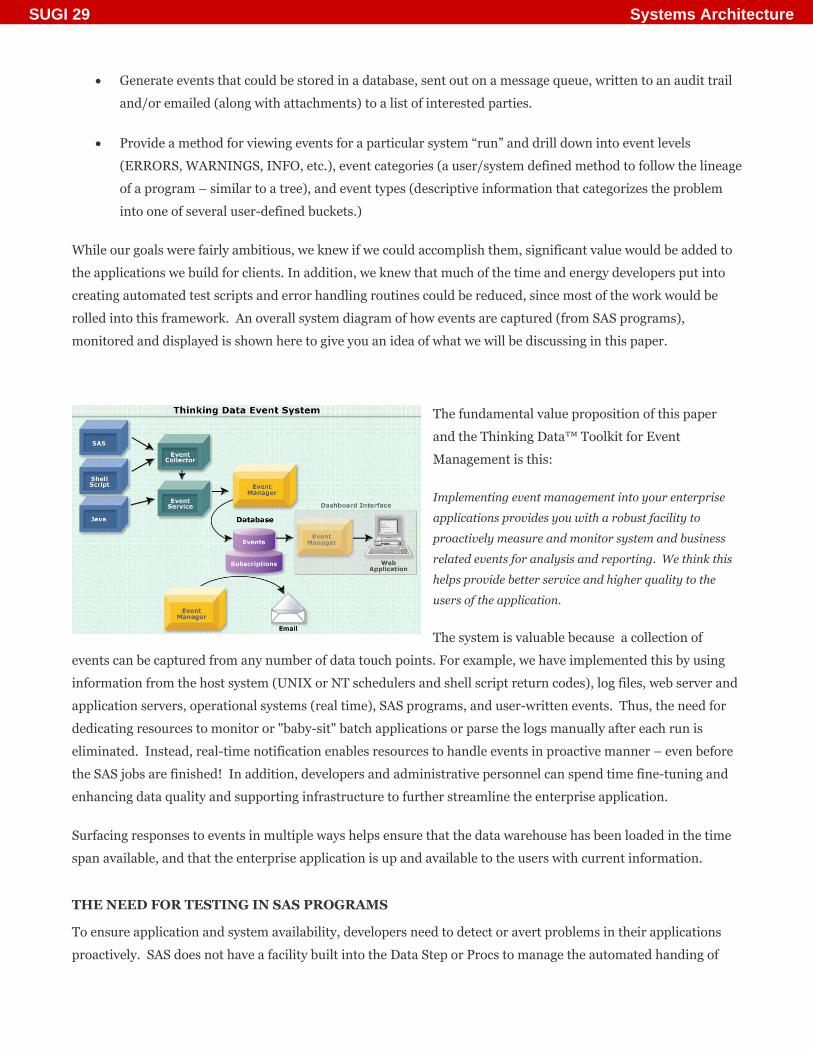
rolled into this framework. An overall system diagram of how events are captured (from SAS programs),
monitored and displayed is shown here to give you an idea of what we will be discussing in this paper.
The fundamental value proposition of this paper
and the Thinking Data™ Toolkit for Event
Management is this:
Implementing event management into your enterprise
applications provides you with a robust facility to
proactively measure and monitor system and business
related events for analysis and reporting. We think this
helps provide better service and higher quality to the
users of the application.
The system is valuable because a collection of
events can be captured from any number of data touch points. For example, we have implemented this by using
information from the host system (UNIX or NT schedulers and shell script return codes), log files, web server and
application servers, operational systems (real time), SAS programs, and user-written events. Thus, the need for
dedicating resources to monitor or "baby-sit" batch applications or parse the logs manually after each run is
eliminated. Instead, real-time notification enables resources to handle events in proactive manner – even before
the SAS jobs are finished! In addition, developers and administrative personnel can spend time fine-tuning and
enhancing data quality and supporting infrastructure to further streamline the enterprise application.
Surfacing responses to events in multiple ways helps ensure that the data warehouse has been loaded in the time
span available, and that the enterprise application is up and available to the users with current information.
THE NEED FOR TESTING IN SAS PROGRAMS
To ensure application and system availability, developers need to detect or avert problems in their applications
proactively. SAS does not have a facility built into the Data Step or Procs to manage the automated handing of
SUGI 29 Systems Architecture

errors. Much of this responsibility falls on the developer to write code, ensuring that if something is supposed to
happen (a dataset should have more than 0 observations, for example), it does so without problems.
Typically, in large-team development environments, there is little code reuse across teams and within large
organizations as the developer tends to write unique “utility” functions to accomplish his or her goal. Rather, it is
the developer’s responsibility to test for conditions and capture return codes that can result in errors. This
method is subjective, confusing, usually results in extra coding; further, it may return non-standard results.
Having experienced how other languages provide a method to introduce automated test cases within the code
base itself, we perceived an opportunity that required good, solid design. The imperative was to create a built-in
facility (or API) allowing the developer to “assert” events when something was or wasn’t true. For example, when
ensuring that a dataset has more than 0 observations, we want to be able to test the conditions that:
• the dataset exists;
• the dataset is “readable” by the current program
• and the dataset has 1 or more observations
Instead of letting each and every programmer figure out how to test these conditions—and spend costly coding
time—we developed a standard interface that allows us to manage the automated testing, error handling and
event notification. In addition, this interface gives the user an opportunity to report a fatal error, produce a
warning or generate an informational note about the condition. Furthermore, auxiliary information such as the
dataset or output (from ODS or other methods) can be attached to the event so that it can be used later to review
the information more fully without spending time in search for the root cause. Of course the power of these
interfaces lies in their support of any number of tests. Common types of event-generating assertions include:
Is equal and not equal – tests the condition of value equality. The values that can be tested often
include testing if two datasets have the same number of observations, two variables, macro values, etc.
Is zero and not zero – tests the condition for a value of zero (or not zero). This is useful in evaluating if
a dataset has zero observations or the expected value of something is or is not zero (such as return codes,
observations).
Is null and not null – tests whether a variable contains a value.
Is empty and not empty – tests whether or not a dataset is empty.
Creating Events in SAS
By merely applying the Event System to a SAS application, a complete event trail for all WARNINGS and
ERRORS is generated by SAS. Of course, the real power is being able to trigger your own messages and events. To
SUGI 29 Systems Architecture

do this, we have developed an assertion-based API for creating events. This not only produces an audit trail, but
also provides for a robust testing framework for SAS programs.
To provide automatic unit tests each time a program is executed was an important criterion, but we also wanted to
be able to ascertain the context of the program. In other words, we needed to be able to both run individual
programs and test the various conditions, as well as “trace” the flow of the program from step to step. By fulfilling
these objectives, we knew we could provide much more descriptive information about which program called
subsequent programs or macros during the entire job sequence. We now find this information extremely helpful
in debugging problems that might have been caused by an upstream data issue or dependency upon something
else (results from previous steps, intermediate datasets, macro values, etc.
The event context includes the category for the current program and the SAS call stack, reflecting the chain of
programs that were called leading up to and including the current program. To establish a valid event context, we
developed a methodology that allows the event system to know where the event occurred and in what context.
This is particularly useful for debugging programs and macros that may be called by any number of other
programs. Most of this methodology is hidden from the programmer, given one of our goals was ease of use for
developers to add to existing legacy applications.
Furthermore, as assertions are executed, messages can be sent to SAS indicating whether or not the error is
severe enough to warrant complete stoppage of the program and the program stream. This information can be
used as a return code in shell scripts, run management systems and schedulers (such as the UNIX cron facility or
LSF Scheduler).
EVENT MANAGEMENT: GETTING TO ISSUES BEFORE USERS DO
Traditional techniques for getting at the log are useful if you have a single driver program or simple set of things
to look for in your logs. Some techniques use tools like perl, awk and sed to post-process the log and parse out the
ERRORS and WARNINGS. These have two fundamental problems that we sought to overcome:
1. Occasionally the SAS program would take several hours to complete – we wanted to know about it much
sooner if a problem existed.
2. Although an indication of an individual log with errors is convenient, this didn’t provide enough
information about (a) their context and (b) other types of events – such as informational or business rule
violations.
In the next section, we will introduce you to the concept of the SAS Program Agent. This agent is responsible for
listening to SAS “events,” then passing them onto a collector through one of several defined adaptors. These
events are captured as each program executes, without waiting for the batch to complete.
SUGI 29 Systems Architecture
RUN CONTROL: A FRAMEWORK FOR ENTERPRISE SAS APPLICATIONS
One of the characteristics that makes the SAS Program Agent work so well is the ability to integrate with an
existing scheduling facility or to use an on-demand script that can be run at any time. Recall the requirements
that we wanted to fulfill – to be able to start, stop and restart jobs. The technology that makes this perform so well
is the modeling of the dependencies of the job(s) using XML. Think of this model as a hierarchy of jobs – some of
which can be run in parallel and some requiring specific sequencing (explicit dependencies). When we assert an
event (through a SAS macro call), we indicate what should happen if the assertion is not true – i.e., if it fails,
should we stop it. By modeling the complexity in XML, we can visualize the context of the programs and our
restart points. To restart, we simply run the SAS Program Agent via command line (or launched from a web
browser) and execution continues, assuming that your problems that caused the fatal error have been fixed.
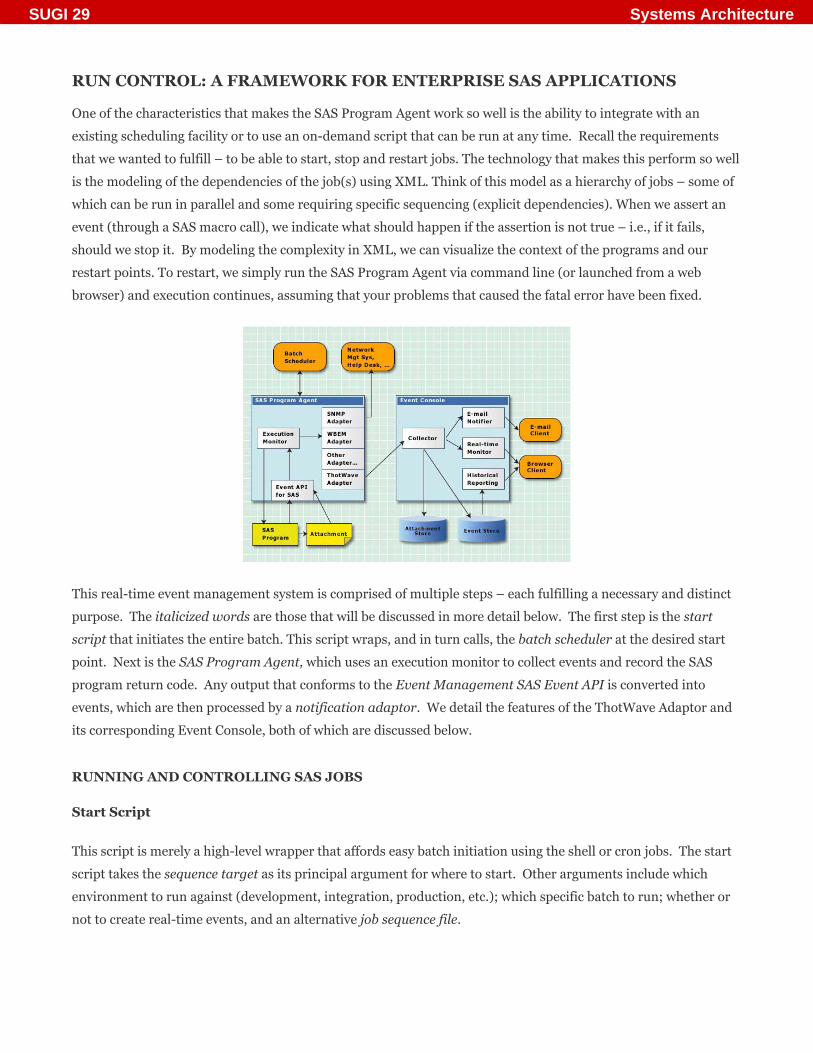
This real-time event management system is comprised of multiple steps – each fulfilling a necessary and distinct
purpose. The italicized words are those that will be discussed in more detail below. The first step is the start
script that initiates the entire batch. This script wraps, and in turn calls, the batch scheduler at the desired start
point. Next is the SAS Program Agent, which uses an execution monitor to collect events and record the SAS
program return code. Any output that conforms to the Event Management SAS Event API is converted into
events, which are then processed by a notification adaptor. We detail the features of the ThotWave Adaptor and
its corresponding Event Console, both of which are discussed below.
RUNNING AND CONTROLLING SAS JOBS
Start Script
This script is merely a high-level wrapper that affords easy batch initiation using the shell or cron jobs. The start
script takes the sequence target as its principal argument for where to start. Other arguments include which
environment to run against (development, integration, production, etc.); which specific batch to run; whether or
not to create real-time events, and an alternative job sequence file.
SUGI 29 Systems Architecture

Batch Scheduler
Apache Ant is a Java-based build tool. It is typically used in the development world to describe tasks such as
compiling, testing, source-control handling, build error notification, etc. However, its use of XML and its
sequencing features make it ideal for our run control system. These desirable features include:
1. named start points, or sequence targets, from where to start individual runs
2. parallel threading support to allow for mutually exclusive SAS programs to be run concurrently
3. external process execution used to call the SAS Program Agent
4. return code checking to allow aborting of the entire run if appropriate
5. expression language support to allow for conditional logic
Using Ant XML syntax, we describe the order in which the batch is to run. Additionally, we use its expression
language support to define discreet sections of the batch sequence to be run as a logical unit. That is, at times, it is
useful to define both start points and stop points. When this happens, one needs the capability to restart the
process at any of the logical units after the application has failed. For testing purposes, running one or more
sections in the process without running to completion is desirable.
The Ant XML document utilized is based on the environment in which the batch is run. This flexibility allows us
to effectively use source control management across many environments. For example, we can postpone pushing
SAS program changes from the development server to the integration test server until the sequence description
has been appropriately updated and committed.
Also, as stated above, one of the optional arguments we allow in the run system is use of a sequence file. This
allows unit test updates to the XML before committing them to source control. We simply tell the start script to
use our local version of a sequence instead of using the default.
The example below shows just a piece of the XML that is used to manage the dependencies among code “tasks”. In
this example, we have an extract that is not dependent on anyting else except the “init” program. This program is
then launched immediately along with any other programs that do not have dependencies.
<target name='100T_PsoftExtract' depends='init'
description=''
>
…..
</target>
In this second snipet, we see there is a job that has multiple “children” that can all be run in parallel. This flexible
modeling technique allows us to shave off hours from the run times by thinking about the problem as a set of
dependencies.
SUGI 29 Systems Architecture

<target name='treas_setup2' depends='init'
description='Runs secondary Treasury Setup jobs'
>
<parallel>
<antcall target='000T_holiday_schedule'/>
<antcall target='000T_issuer'/>
<antcall target='000T_instrument'/>
<antcall target='000T_psoftsammapkeys'/>
<antcall target='000T_psoftinterest'/>
</parallel>
</target>
The Ant documentation expressly states that it is not meant as a process flow control tool, and this is certainly
true for highly complex needs. However, it was perfectly suited for our purposes, given that our developers
already understood it; further, Ant was easily configured by others who were familiar with XML structure.
Ant is available for download at http://ant.apache.org.
SAS Program Agent
The Ant file invokes this agent and passes in, among other arguments, which SAS program to run. Internal logic
handles where to write the logged SAS output, whether or not to record events, and checks the SAS return code
against a defined maximum.
The output is sent to a directory / file structure whose naming convention is based on the SAS program name and
run time / date stamp. This proves very useful in quickly locating the specific log in an environment where many
runs may have been started (read: development and test).
To allow for the batch to continue running in certain non-error-free situations, a maximum allowable return code
is set. For example, the SAS return code is ‘1’ when there are specific WARNING messages. Unless the maximum
bound is breached, the program agent returns ‘0’ to the job sequence. Otherwise, it returns the actual return
code, at which time the batch aborts. Once appropriate fixes are made, the job sequence target facility allows for
re-starting the run at this target, instead of re-running the entire batch from the top again. Additionally, if the
SAS program that failed is part of a group of concurrently-running programs which all terminate successfully, the
one offending program can be run alone to ensure correct behavior. At this point, the batch can then be restarted
at the target following the one defining the parallel processes.
Event System SAS Event API
Explicit calls to the assert macros that make up the Event API are passed to the Execution Monitor. The
Execution Monitor gathers all of the details of the event context and records the event by passing it along to
SUGI 29 Systems Architecture

whatever adaptors have been configured for use. We discuss this powerful feature below in the Automated
Testing section.
The Execution Monitor also detects when SAS errors and warnings occur, without a specific call to the Event API.
For example, SAS generates a warning when duplicate values prevent a format from being uniquely resolved.
With the Event System, this results in creation of an implicit event.
AUTOMATED TESTING
Automated testing can be accomplished via predefined rules or checks that test for specific conditions such as: is
equal and not equal, is zero and not zero, is null and not null, is empty and not empty. This set of automated tests
saves the developer time from coding mundane and repetitive tests and provides valuable information for
troubleshooting. An event is created when the test condition is met. The event should contain relevant message
content, the call stack, the level of ERROR, and optionally attached data for debugging support. Based on the
level specified, the run message can be sent to SAS indicating what action needs to be taken in regard to the job
stream. These assert macros add information to the SAS output, which is read by the SAS Program Agent and
converted into events. This facility allows for the creation of customized events in addition to the standard events
generated by SAS ERROR and WARNING messages. They also attach relevant files to the event objects for closer
human scrutiny. The attached files are in HTML table format with the data in question. These files can be HTML,
RTF, CSV or any other output that can be programmatically created by SAS. These attachments can provide quick
insight to the problem by exposing a pattern or missing values in the data that assist in resolution of the event.
As stated earlier, the start script allows for an optional argument switch that tells the run control system to either
process events or not. We find that using the run control in this manner is very useful at times. Typically the SAS
programs have been properly unit tested and are being put through integration testing. In this case, we are not as
interested in reporting data issues as much as we are focused on debugging the batch as a whole.
EVENT HANDLING AND EXCEPTION REPORTING
Proper event handling and exception reporting supplies users with the time-sensitive information they need to
take action. For example, imagine that a company has an 8-hour window to load a data warehouse with data from
several operational systems. If the load from one of these systems fails, it is imperative that the proper person is
notified with the correct level of urgency, stack trace, message, time of failure, and attachments. Armed with this
information, the user can then take the necessary action to get the data warehouse loaded within the window. The
user may choose to bypass the load from that particular operational system or opt to get the operational system
on-line and restart the load.
REAL-TIME NOTIFICATION
Increasingly, windows for processing data have grown smaller and real-time notification can maximize the
effectiveness of the time available. Using event management allows the job stream to be stopped when a fatal
error is encountered. This allows the problem to be corrected up-front without having to wait for the entire job
stream to complete.
SUGI 29 Systems Architecture

Because of the tremendous volume of data we encounter, one of our
biggest challenges is obtaining and delivering useful information to
the right people in real time. The Thinking Data Toolkit for Event
Management captures a variety of data and is able to parse
proprietary logs from different vendors. In addition to getting the
specific content from triggered events, we can also route system
events to any number of places. The most obvious is email (and
other wireless devices), but we also support message queues,
databases and our own Thinking Data Business Intelligence
platform. Combined with real-time tickers for alerts, our dashboard
can provide the details for reporting and analytics appropriate for
problem determination and resolution.
Subscriptions to Notification
One of the keys to successful real-time notification is not to overwhelm the
users with frivolous events or data. The users need to have personalized
information pushed to them. This is accomplished by giving them the ability
to subscribe to the notifications at whatever level and category they need. A
manager may just want notification that the data warehouse load has
completed but a database administrator may subscribe to all errors and
warnings pertaining to source system extracts.
The subscription notification feature allows users to subscribe both
themselves and other users to events triggered by the system. As
events are captured in the database, a separate process sends out
email notifications according to the rules defined in the subscription
table. The subscribed users then receive the email. The users see that
the email will contain important metadata about the event that was
triggered, such as the program where the error occurred. The stack
trace (the context in which the event occurred), the event message
describing the error and attachments may also be included in the
email, which will usually consist of datasets, HTML output or other
files that may be of help to resolve an error.
We created this feature by using several, configurable, pluggable modules of our Event Console, which is fed by
our ThotWave Adaptor. Other adaptors may send the event data using other protocols and environments. The
SUGI 29 Systems Architecture

basic components are the Collector and Monitors. The Collector is the central location for receiving events and
knows how to store event data and attachments. Monitors either poll or receive pushed events. We concentrate
on the polling aspect in this document.
COLLECTOR
This module acts as a central receiving and staging location. It controls details such as persisting
the event data and attachments, as well as providing real-time event notification to subscribed
recipients.
Once Monitors successfully retrieve new events, they are flagged in the persistent store as
‘Acknowledged’ and are not available for further notification. They are of course, accessible via a
Historical Reporting module that surfaces all persisted events.
Once events are properly resolved, if necessary, they may be flagged as ‘Resolved’. This status
change allows for easy query ‘where’ constraints.
MONITORS
The Email Monitor receives new events from the Collector and sends any requests available to appropriately
subscribed recipients. We allow subscriptions to be based on 3 orthogonal attributes of the events; namely the
error level, the category, and the type.
Error Level
This is a simple concept denoting the magnitude of the
event’s urgency. We use graduated levels typical to
loggers: ERROR, WARNING, INFO, DEBUG, etc. Our
subscription logic is such that recipients are automatically
subscribed to all levels equal-to-or-greater-than their
subscribed level. For example, if you are subscribed to the
level WARNING, you receive both WARNING and ERROR
event notifications
Category
This field describes the process context of the offending
program. This is accomplished by adding calls to auxiliary
macros at the beginning and the end of every program (or,
in the next release, at the SAS Program Agent Level for legacy code). As programs and macros are invoked, both
from the SAS Program Agent and from each other, the system understands the context in which these programs
SUGI 29 Systems Architecture

operate. The Event System SAS Event API then maintains this category stack for use. When an event is triggered,
the Event System SAS Event API adds this category info to the event.
Since we separate each category fragrment with a delimiter, it is easy to provide ‘scoped’ category subscriptions.
That is, if the offending code was in the process phase ‘analytics_load’, which was part of ‘analytics_init’, which
was in turn part of ‘run_init’, the category would be ‘run_init.analytics_init.analytics_load’. Recipients may
subscribe to whatever level of category they desire. If one is subscribed to ‘run_init.analytics_init.analytics_load’,
or ‘run_init.analytics_init’, or simply ‘run_init’, then this example event would be sent. The subscription model
provides a very flexible way to manage how people are notified if an event occurs. This is what we call ‘scoped’ or
‘hierarchical’ category subscription.
Type
This field describes the type of event that took place. The type is additional, user-defined metadata about the
event to aid in quick event resolution. For example: the event type might distinguish between UNIX command
failure, create file failure, and update table failure.
All subscriptions are resolved using a logical AND across constraints and all subscriptions may be wild-carded.
That is, if one is subscribed to the Error Level = *, then he or she would not be constrained on Error Level at all.
CONCLUSION
The Thinking Data Toolkit for Event Management is a powerful tool designed to help organizations monitor
mission critical systems. Designed on a framework for full life-cycle application and business rules monitoring,
the Event System enables developers and business users alike to monitor, manage and subscribe to enterprise
application events from a central location. The Event System appears as a web page on your Intranet, integrating
seamlessly with various APIs (application programming interfaces) such as SAS, shell scripts (UNIX) and Java. As
a result, the Event System is easy to deploy, since users access the events without having to download special
software.
The Event System allows all parts of the enterprise to report events that can be recorded and monitored from a
common interface. As events are generated from various programming environments (SAS, Java) and operating
system shell environments, they are pushed to collectors that serve as conduits to the Event System. Here, the
events are collected, added to the system and stored in the database. After the events are stored, a separate
process scans the event database and sends out email notifications according to the rules defined in the
subscription table.
SUGI 29 Systems Architecture

ACKNOWLEDGMENTS
The authors would like to sincerely thank Dave Hamilton and Jodi Barnes Nelson for their guidance and
thoughtful review of this manuscript.
CONTACT INFORMATION
Your comments and questions are valued and encouraged. Please feel free to contact the author at:
Greg Barnes Nelson
2054 Kildaire Farm Rd, #322
Cary, NC 27511
800.584-2819 – Phone/ Fax
SUGI 29 Systems Architecture


