
Waste and Material Flows Final workshop
29 March 2012, Marseilles

The programme’s scope
1) Need to develop new methods for prospective studies
2) Develop policy drivers to
address environmental pressures from waste
2
Part I) The programme’s scope

The Driver’s
1) Act on BP mandate set in the Strategic intervention framework 2007-2015:
Characterise municipal waste management in the Mediterranean
Provide indications of any changes in rate and composition of
household waste Provide elements for political leverage in recycling 2) Almeira declaration: Barcelona Convention COP (Jan 2008) Attenuation strategies for climate change to include an eco-
systemic approach to managing risks.
3

3) The Mediterranean legal arsenal
Mediterranean Strategy for Sustainable Development 2015 targets in promoting sustainable urban development
Reduce the rate of growth of municipal waste by 50%
Increase the part of recycling and disposal in
engineered landfills
Reduce by half the generataion of hazardous wastes
4
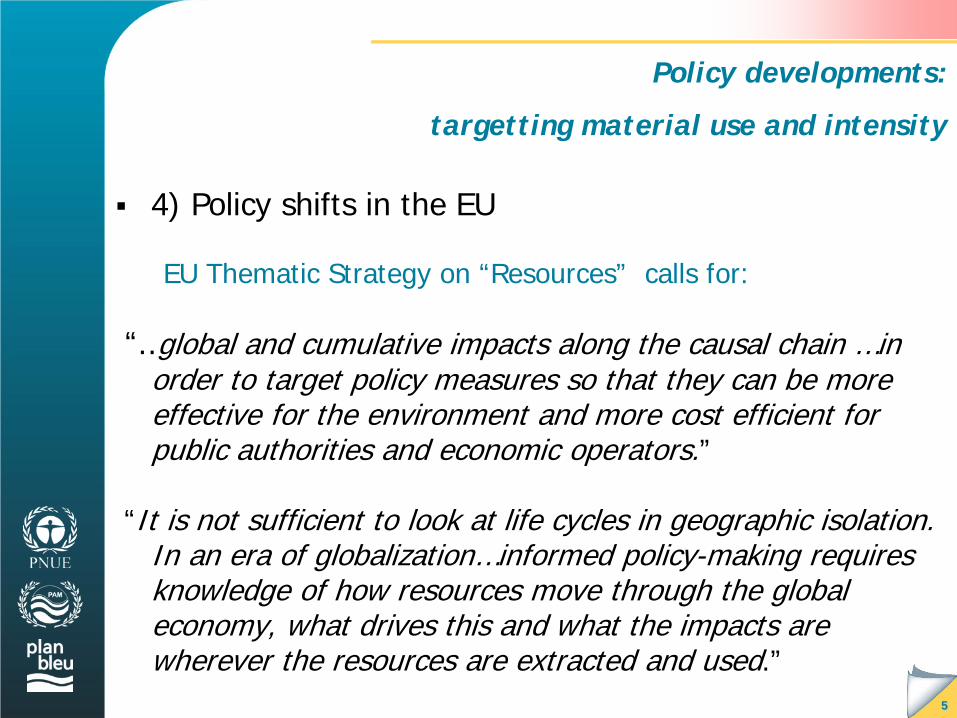
Policy developments:
targetting material use and intensity
4) Policy shifts in the EU EU Thematic Strategy on “Resources” calls for:
“..global and cumulative impacts along the causal chain …in order to target policy measures so that they can be more effective for the environment and more cost efficient for public authorities and economic operators.”
“It is not sufficient to look at life cycles in geographic isolation. In an era of globalization…informed policy-making requires knowledge of how resources move through the global economy, what drives this and what the impacts are wherever the resources are extracted and used.” 5

The programme’s scope
6
5) Changing policy priorities: cacophony of definitions and shift of indicators
Public health > focus on service coverage; Waste management > externality driven
classification/separation, collection rate, treatment rate and performance
Waste prevention > waste intensity (volume/hazard) of output and consumption, levels of reuse recycling or recovery
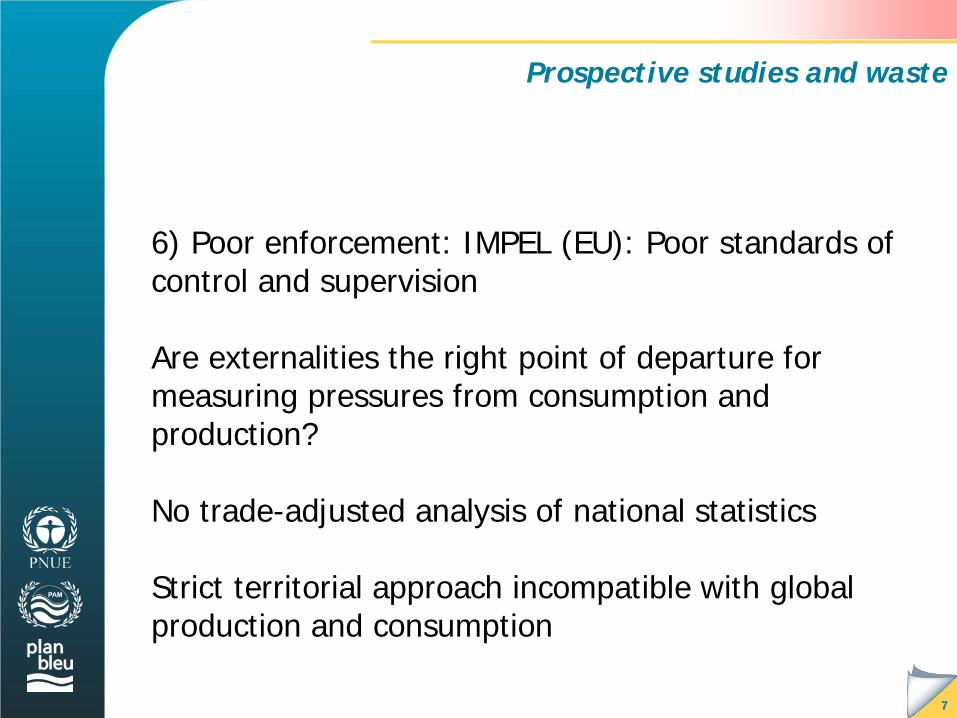
Prospective studies and waste
6) Poor enforcement: IMPEL (EU): Poor standards of
control and supervision Are externalities the right point of departure for
measuring pressures from consumption and production?
No trade-adjusted analysis of national statistics Strict territorial approach incompatible with global
production and consumption 7

Prospective studies and waste
Some structural issues prospective studies
8

Trend scenario
The LBS Protocol: inroads to protecting the “Commons”
The LBS protocol covers the Mediterranean Sea Area, the hydrologic basin of the Mediterranean Sea Area; inland waters up to the freshwater limit; brackish waters, coastal salt waters including marshes and coastal lagoons, and ground waters communicating with the Mediterranean Sea.
9
The LBS protocol applies to: Discharges originating from land-based: - point sources - diffuse sources - activities that may affect directly or indirectly the Mediterranean Sea Area

Policy developments:
targetting material use and resource intensity
Waste Framework Directive 2008: 2020: 50% reuse and recycling by weight, 70% for C&D
waste 2013: National waste prevention programmes:
quantification, impacts and fate, future arisings. 2013: Waste Packaging directive: 60 % overall recovery
and 55 % overall recycling). Material specific targets (60 % for glass and paper/cardboard – 50 % for metals – 22.5 % for plastics – 15 % for wood packaging). 2013 (weight-based targets)
10

Policy developments:
“choice editing” product and substances
ROHS – Restriction in use of hazardous substances REACH – Registration evaluation authorisation of
chemical substances CP RAC: Trade and carbon leakage
COM (94) 670 Directions for the EU on environmental
indicators and greening national accounting
11

Trend scenarioh
Programme structure and objectives (1/2)
f) The Blue Plan’s Waste and Material Flows programme structure
Module 1: National studies (Egypt, Syria, Tunisia, Turkey)
Prevailing paradigmes in waste management.
Hardwear and and corresponding indicators
Case study of a typical municipality.
Gap anlysis: policies for bridging the gap
Module 2: Regional studies
A) MFA approach applied to testing the the use of trade flows of household consumer goods as proxy for:
- Estimating waste and it’s characterisation
- Hazardous content of flows and origin
12
Trend scenarioh
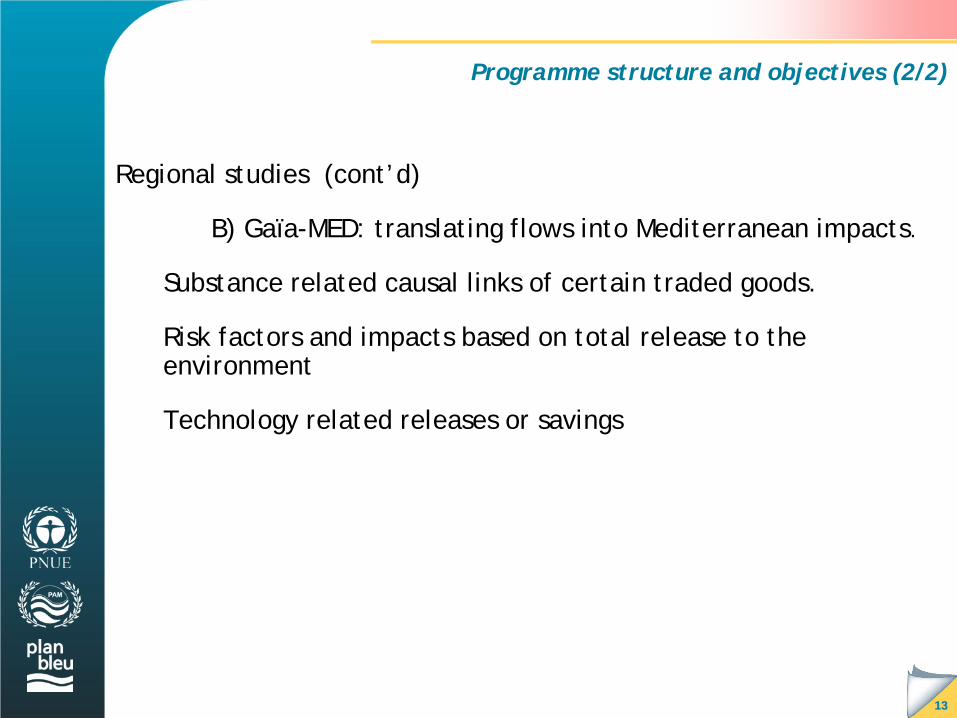
Programme structure and objectives (2/2)
Regional studies (cont’d)
B) Gaïa-MED: translating flows into Mediterranean impacts.
Substance related causal links of certain traded goods.
Risk factors and impacts based on total release to the environment
Technology related releases or savings
13
Part II) Material Flow Analysis as a proxy to estimating waste
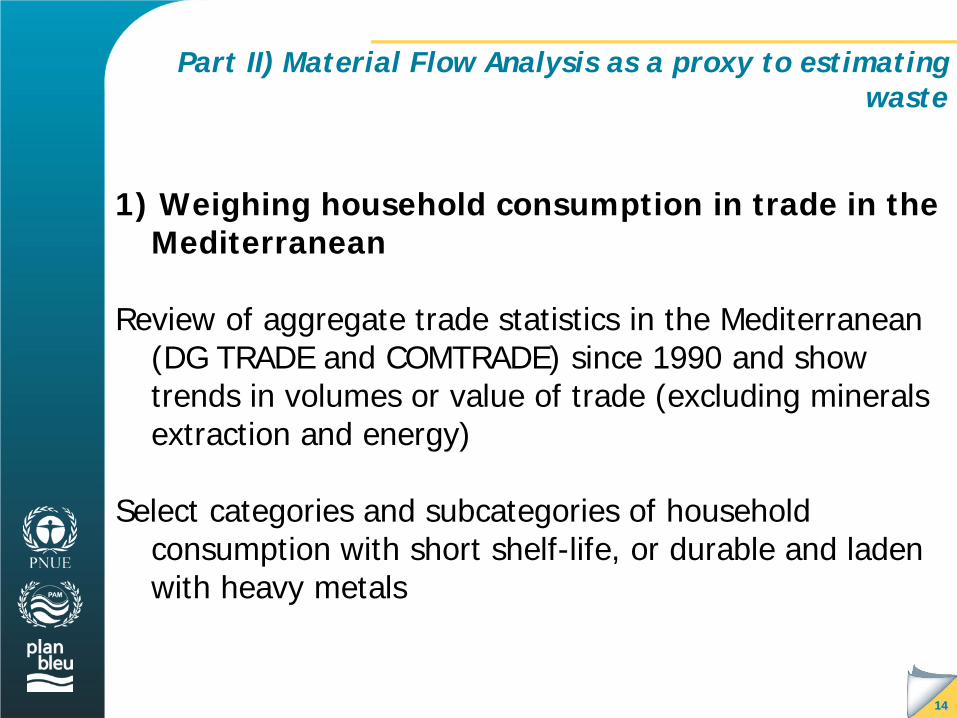
1) Weighing household consumption in trade in the Mediterranean
Review of aggregate trade statistics in the Mediterranean
(DG TRADE and COMTRADE) since 1990 and show trends in volumes or value of trade (excluding minerals extraction and energy)
Select categories and subcategories of household consumption with short shelf-life, or durable and laden with heavy metals
14
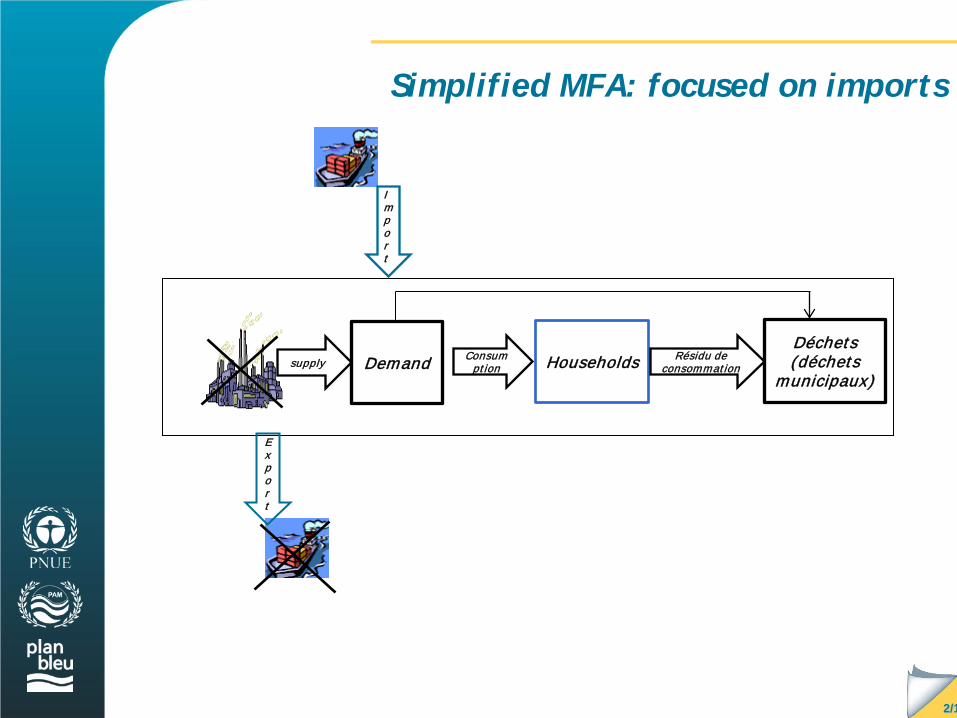
Simplified MFA: focused on imports
Import
Export
Demand supply Households Déchets (déchets
municipaux)
Consumption
Résidu de consommation
2/1

Trend scenarioh
List of products
COMTRADE
SITC
16
Type de consomma
tion
Durée de vie
Catégorie de produits
Code STIC
Description
Consommation finale
Non durable
Produits alimentaires y compris les boissons
022 Lait et produit écrème autre que beurre et le fromage
037 Préparation ou conserve de fruits de mer (poisson, crustacé, mollusques)
048 Préparation de céréale / préparation de farine ou d’amidon de fruits ou de légumes
056 Légumes, racines et tubercules préparés ou conservés
058 Fruits, conserves et préparations de fruits (excepté les jus de fruits)
059 Jus de fruit ou de légumes, non fermentés, sans addition d’alcool, avec ou sans sucre
071 Café et succédanés du café 073 Chocolat et autre préparation contenant du cacao
074 Thé et dérivés 098 Autres Préparation et Produit comestible
111 Boissons non alcoolisées 112 Boisson alcoolisées
Journaux & publicités
892.2 Journaux, revues ou périodique illustrés ou non ; ou contenant de matériel publicitaire
Produits cosmétiques et d’entretien
553 Parfumerie, cosmétique et préparations pour toilette sauf savon
554 Savon et produit de nettoyage et de cirage
642.95 Serviettes hygiéniques en papier ou ouate de cellulose, même sous enveloppe de gaze, doublures de couches pour bébé en papier ou ouate de cellulose et articles sanitaires similaires
Durable Produits d’équipement électroniques et électrique
752.2 Machine automatiques de traitement de l’information, portable, n’excédant pas 10kg
7611 Récepteur de télévision couleurs 76411 Appareils de téléphoniques (téléphone mobiles)
775.2 Réfrigérateur, congélateur de type ménager
Consommation intermédiaire
Produits à priori destinés à la fabrication d’emballages
2511 Déchets et débris de papier ou de carton
2883 Déchets et débris d’aluminium 5711 polyéthylène 582 Plaques, feuilles, pellicules, bandes et lames… en matière plastiques sous forme non primaire
579 Déchets, rognures et débris de matières plastiques
64141 Papier kraft et carton sans revêtement
Produits à priori destinés aux impressions journaux
6411 Papier journal en rouleaux ou en feuilles

Trend scenarioh
Typology of waste streams
17
Tableau 1. Catégories de produits de consommation et flux de déchets solides ménagers
Aliments et boissons manufacturés
Equipements électriques et électroniques
Produits de soins
Journaux magazines
Packaging (PKG)
DEEE
Déchets journaux magazines
Déchets à potentiel infectieux
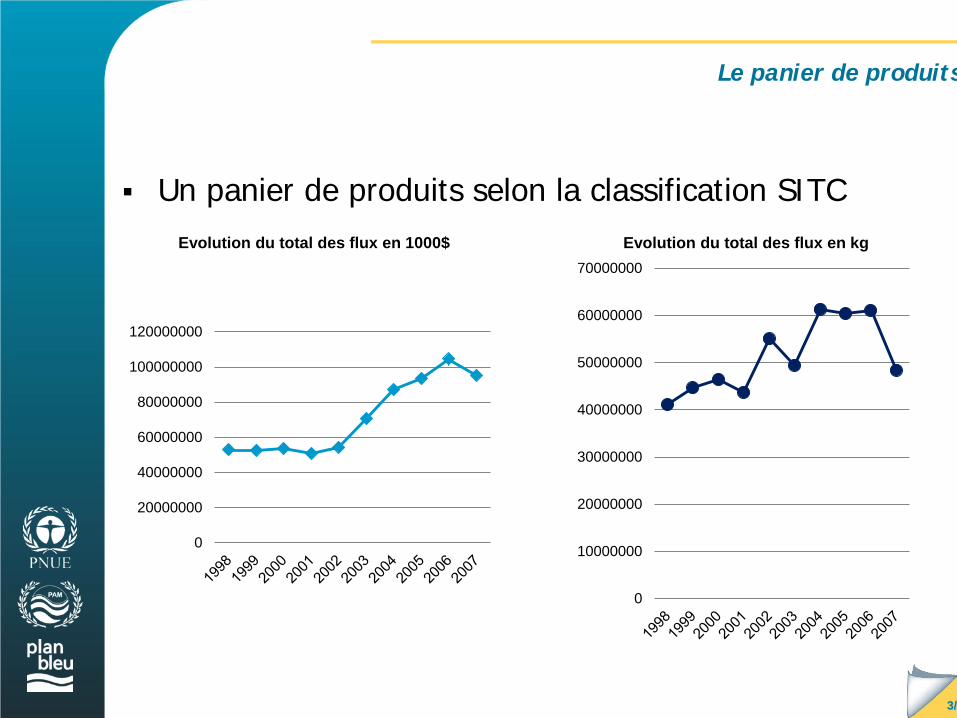
Le panier de produits
Un panier de produits selon la classification SITC
0
20000000
40000000
60000000
80000000
100000000
120000000
Evolution du total des flux en 1000$
0
10000000
20000000
30000000
40000000
50000000
60000000
70000000
Evolution du total des flux en kg
3/
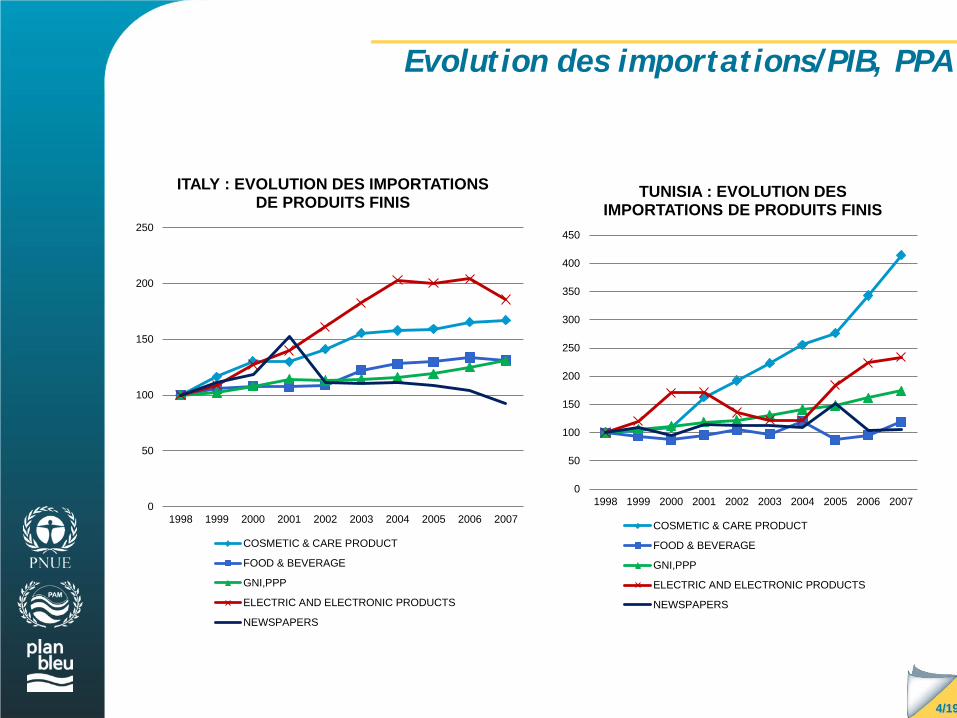
Evolution des importations/PIB, PPA
0
50
100
150
200
250
1998 1999 2000 2001 2002 2003 2004 2005 2006 2007
ITALY : EVOLUTION DES IMPORTATIONS DE PRODUITS FINIS
COSMETIC & CARE PRODUCT
FOOD & BEVERAGE
GNI,PPP
ELECTRIC AND ELECTRONIC PRODUCTS
NEWSPAPERS
0
50
100
150
200
250
300
350
400
450
1998 1999 2000 2001 2002 2003 2004 2005 2006 2007
TUNISIA : EVOLUTION DES IMPORTATIONS DE PRODUITS FINIS
COSMETIC & CARE PRODUCT
FOOD & BEVERAGE
GNI,PPP
ELECTRIC AND ELECTRONIC PRODUCTS
NEWSPAPERS
4/19

Weight of intra-Med trade
Découpage 1: sous régions méditerranéennes
5/19
Analyse descriptive des flux de produits

Case of PSEM in % traded volumes
0
10
20
30
40
50
60
70
80
1998 1999 2000 2001 2002 2003 2004 2005 2006 2007
PSEM : COSMETIC & CARE PRODUCT
CPCC.EU MED EU MED PSEM PSM W
0
10
20
30
40
50
60
70
80
90
100
1998 1999 2000 2001 2002 2003 2004 2005 2006 2007
PSEM : ELECTRIC & ELECTRONIC PRODUCT
CPCC.EU MED EU MED PSEM PSM W
0
10
20
30
40
50
60
70
80
90
1998 1999 2000 2001 2002 2003 2004 2005 2006 2007
PSEM : FOOD & BAVERAGE
CPCC.EU MED EU MED PSEM PSM W
0
10
20
30
40
50
60
70
80
90
100
1998 1999 2000 2001 2002 2003 2004 2005 2006 2007
PSEM : NEWSPAPERS
CPCC.EU MED EU MED PSEM PSM W
6/
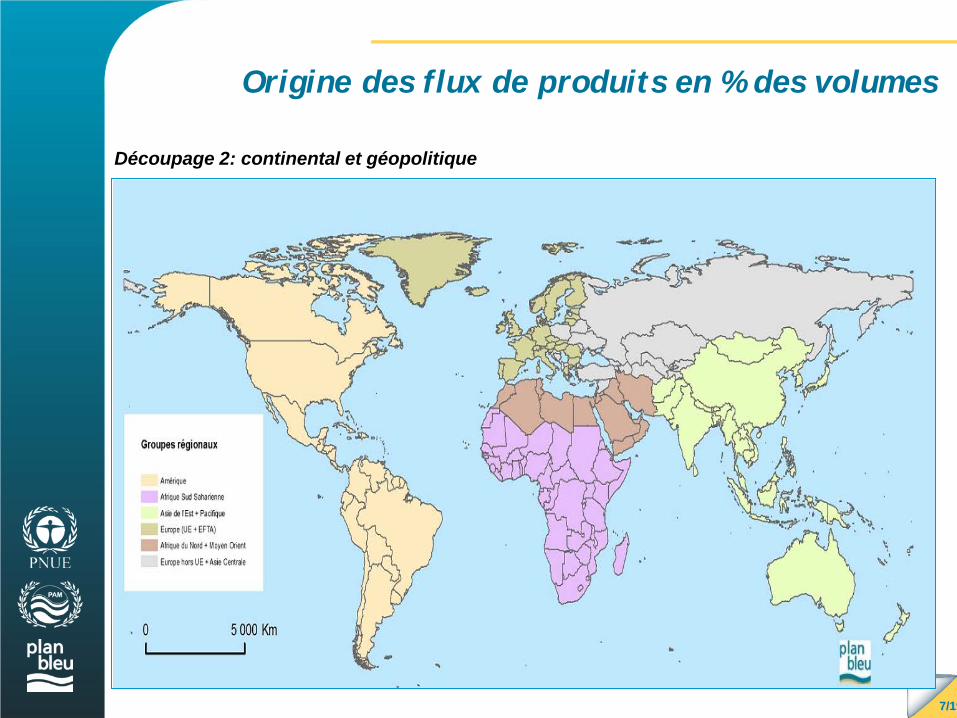
Origine des flux de produits en % des volumes
Découpage 2: continental et géopolitique
7/19
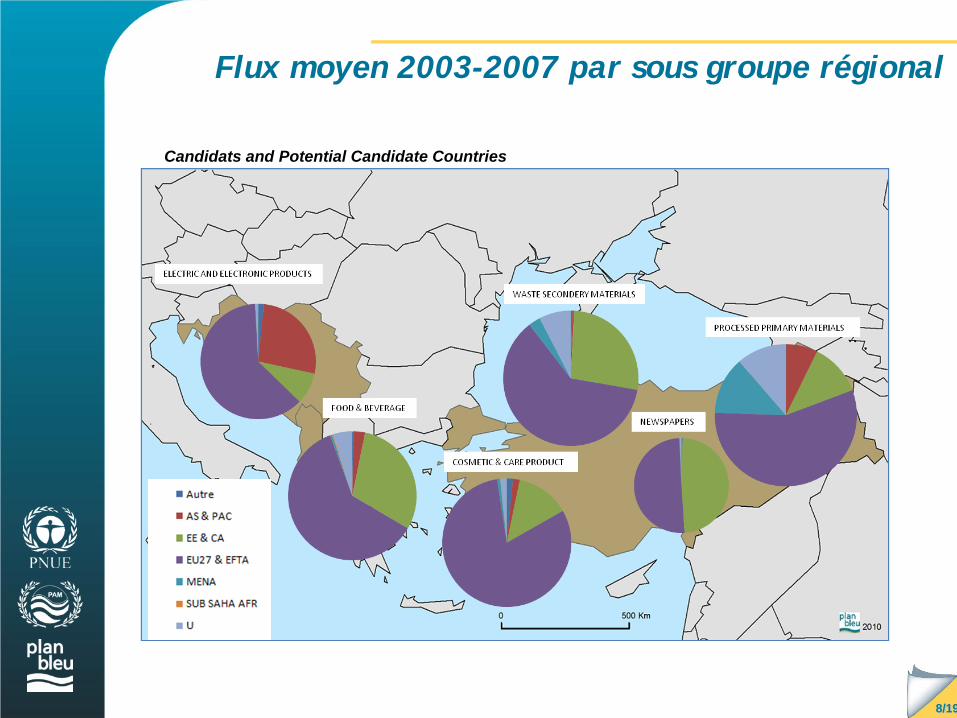
Flux moyen 2003-2007 par sous groupe régional
8/19
Candidats and Potential Candidate Countries
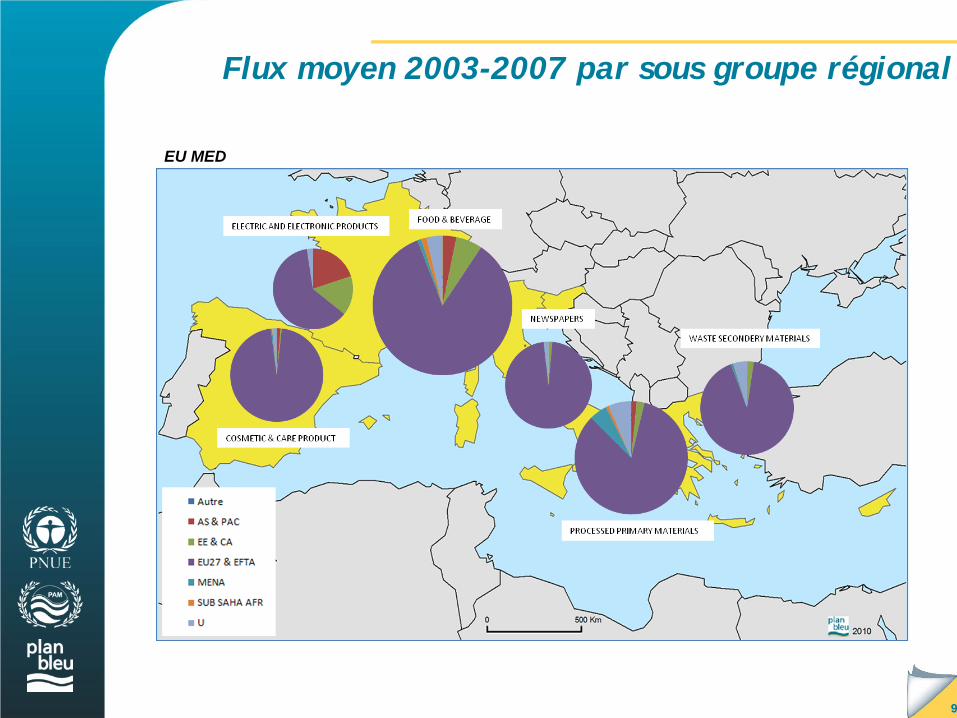
Flux moyen 2003-2007 par sous groupe régional
9/
EU MED

Flux moyen 2003-2007 par sous groupe régional
10/19
PSEM

Flux moyen 2003-2007 par sous groupe régional
11/19
PSM

Le calcul du potentiel de déchet
Importations Coefficients de déchets par produits
Potentiel de déchets d’emballage (PKG)
Potentiel de déchets d’équipements électroniques et électriques (DEEE)
Potentiel de déchets d’impression (PRINTINGS)
Potentiel de déchets de textiles sanitaires avec ou sans cellulose (CELLULOSE_SANT_TEXT)
12/19
Tableau n° 2 : Taux de conversion selon types d’emballage Composite ELA (Emballage Liquide Alimentaire) 3% Autres emballages composite 4% Carton 21% Plastique 6% Métaux (acier & aluminium) 19% Verre 36%

Evolution 1998-2006 / région du potentiel déchet issu de la consommation
14/19
4.063.515 t
6.358.538 t 137.602 t
350.328 t
274.252 t
173.351 t
91.822 t
218.391 t

La part de ces déchets importés dans nos poubelles
France, cela correspond à 58kg/hab/an, soit 10% de la production des déchets ménagers (ou 20% sans fraction humide)
20kg/hab/an pour l’Italie (3.5% des déchets des ménages.
1.5kg/hab, Turquie (0.6% des déchets ménagers/hab/an.
800g/hab/an, en Tunisie soit 0.3% des déchets ménages.
29

Un stock de déchets à la recherche d’un responsable
Les emballages en Méditerrannée s’élèvent à 5.7 Mt. la part qui résulte des importations originaires de l’UE et
EFTA vers les PSEM et PSM est passé de 265,000 tonnes en 1998 à 492,000 tonnes en 2006
pour les CPCC EU, 60% du potentiel de déchet (213 000 t sur 350,000 en 2006 est originaire de l’UE27 + EFTA)
et environ 50% des frigos (20kt/ 40kt) du potentiel déchet sont issus des importations de l’UE27+EFTA.
Les pays UE Med importent un tiers des 736kt d’équipements électriques et électroniques et frigidaires dés pays d’Asie orientale.
30

Type de sensibilité Nature de la variation du RNB/hab, ppa
Impacte sur les types de déchets
significativité Part de la variance expliquée
Elasticité augmentation de 1%
augmentation de 1,36% des déchets d’emballage (PKG)
< 1% 18%
augmentation de 1,78% des DEEE
< 1% 29%
augmentation de 1,08% des PRINTINGS
< 2% 7%
augmentation de 2,22% des déchets CELLULOSE_SANT_TEXT
< 1% 25%
17/19
Les pays méditerranéens qui ont un un RNB/hab, ppa < 15 000 $ voient leur DEEE et CELLULOSE_SANT_TEXT augmenter plus vite que la moyenne de la région
Correlation PIB /hab, ppa et le potentiel de déchet

17/19
Pérsistence et cumul temporel du potentile déchet
Tableau : cumul du potentiel de déchet 1998-2006
PSEM
Type de déchets
Total en tonne
PSM
Type de déchets
Total en tonne
DEEE 392 165 DEEE 311 108
PKG 1 899 924 PKG 727 255


