
1


100 million patients
300 million patients
New
application
areas with
single-use
visualisation
Better
health
economy
More
decision-
power to
patients
Positive
impact
on more
lives


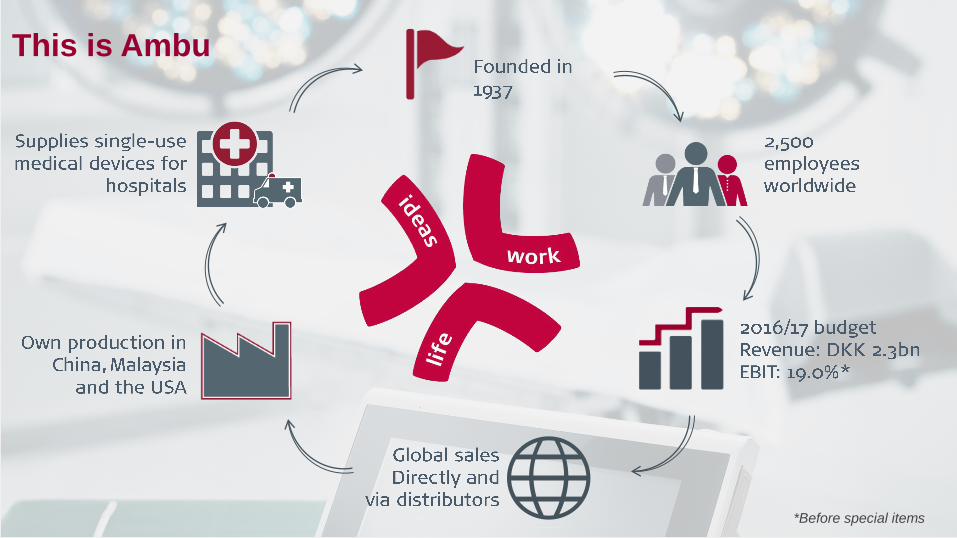
This is Ambu
*Before special items
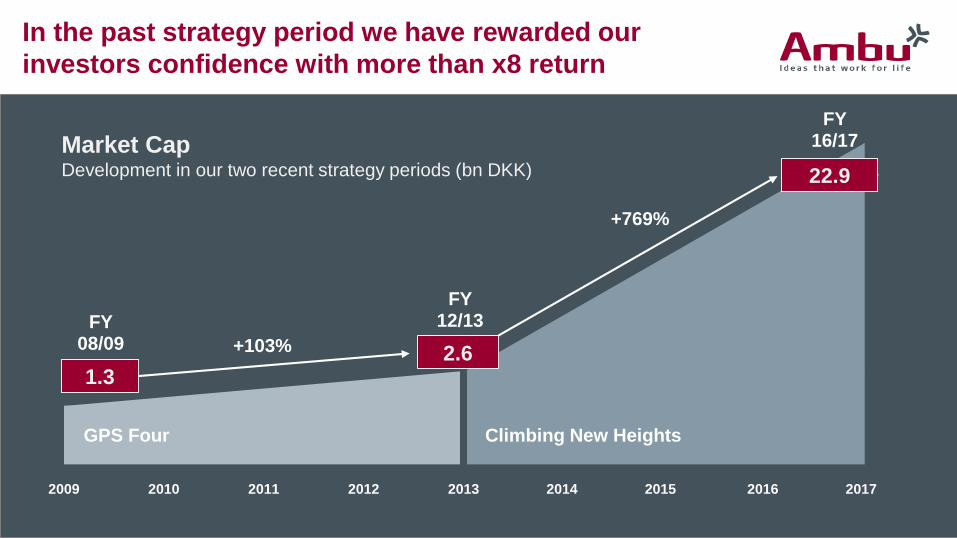
In the past strategy period we have rewarded our
investors confidence with more than x8 return
2010 2011 2012 20132009 201720162014 2015
GPS Four
1.32.6
22.9
FY 08/09
FY 12/13
FY 16/17
+103%
+769%
Climbing New Heights
Market CapDevelopment in our two recent strategy periods (bn DKK)

2010 2011 2012 20132009
1.0
2.0
2017
Revenuebn DKK
20162014 2015
Since 2008 we have expanded by ~x3 and increased
our profitability 4 times
Fix cost base
Get infrastructure in place
Lift growth to +10% level
Invest throughout entire value chain
Turn around & infrastructure Invest for growth
Revenue: 2.3bn DKK
EBIT margin: 19.0%
Revenue: 0.9bn DKK
EBIT margin: 12.5%
FY 08/09
FY 12/13
FY 16/17
Revenue: 1.4bn DKK
EBIT margin: 11.6%

We are closing in on competition on earnings
Our global
Research &
Development team
has been close to
doubled in size
over the past years
We have
substantially
increased our
market footprint
with dedicated sales
forces for Core &
Visualisation in the
US & EU
Note 2: Expected EBIT margin in FY 16/17Note 1: EBIT margin is based on FY16
Coloplast
CR Bard
ICU Medical
Medtronic
Sonova
Teleflex
William Demant
GN
Natus Medical
Smith & Nephew
Olympus
Geting
Conmed
Ambu, FY16/172
7,1%
11,3%
11,6%
13,1%
13,6%
14,8%
16,3%
17,6%
17,9%
19,0%
19,5%
20,8%
22,6%
24,7%
33,0%
Ambu, FY12/13
+7,4%
point
Following significant
investments in
production sites and
technology our
capacity is
secured for next 5
years
R&D Production Sales
…and with the investments made over the
past 4 years we are now more robust than everAmbu EBIT margin vs. Peers1

On top line growth Ambu is in a league of its own
14.6%
Revenue growth % (CAGR FY 13-16)
0-5%
5-10%
10-12%

Our ability to make successful transformations as
a company is what sets Ambu apart

…And we are set to transform Ambu once again
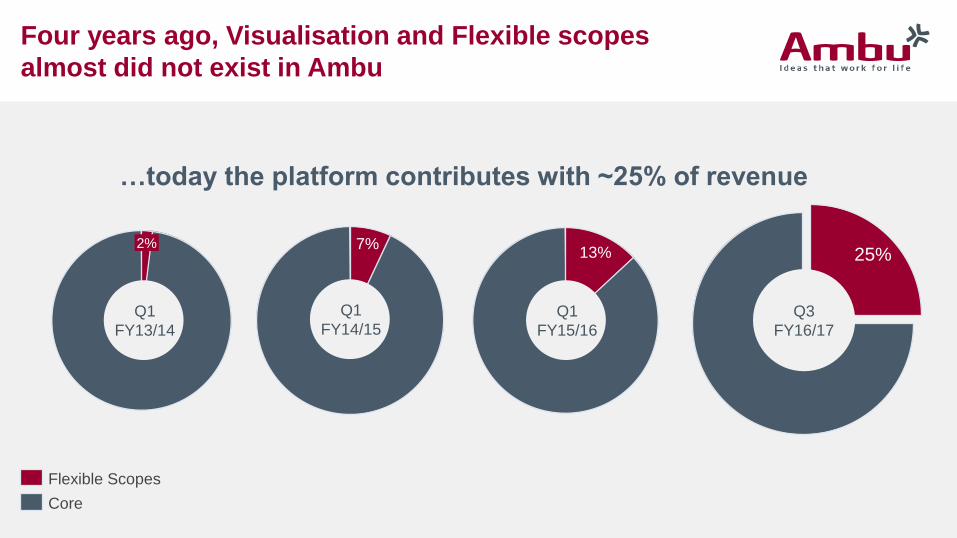
Four years ago, Visualisation and Flexible scopes
almost did not exist in Ambu
2% 7%13% 25%
Core
Flexible Scopes
Q1
FY13/14
Q1
FY14/15Q1
FY15/16
Q3
FY16/17
…today the platform contributes with ~25% of revenue

Ambu is more relevant than ever!
1. Infusion Errors Can Be Deadly If Simple Safety Steps Are
Overlooked
2. Inadequate Cleaning of Complex Reusable
Instruments Can Lead to Infections
3. Missed Ventilator Alarms Can Lead to Patient Harm
4. Undetected Opioid-Induced Respiratory Depression
5. Infection Risks with Heater-Cooler Devices Used in
Cardiothoracic Surgery
6. Software Management Gaps Put Patients, and Patient Data, at
Risk
7. Occupational Radiation Hazards in Hybrid ORs
8. Automated Dispensing Cabinet Setup and Use Errors May
Cause Medication Mishaps
9. Surgical Stapler Misuse and Malfunctions
10. Device Failures Caused by Cleaning Products and Practices
Top 10 Health Technology
Hazards 2017*
Disposable scopes address one
of the top global health concerns….
…And have a strong set of additional value
propositions that increase its relevance to hospitals

Ambu aScope platform continues strong momentum
and we continue to expand the potential
The disposable revolution continues
its in-roads in hospitals world wide
Act Quantity
OR ICU Bronch suite
1,2 1,8 ~2,0 ~5,0# Procedures (m)
Call point
aScope 1-2
aScope 3
aScope 3 Large
Vivasight
aScope 4
And with aScope 4 we now cover the entire Airways market
2012/13 2013/14 2014/15 2015/16 2016/17
100.000
200.000
300.000

With aScope 4 we’ve opened the diagnostic field of endo-
scopy and are ready to step up our game in Visualisation
aScope 1aScope 2
aScope 3
aScope 4
aScope 5
aScope 6
Therapeutic
Diagnostic
With aScope 4 we will…
Accelerate our penetration
of the Pulmonary market
Expand our addressable
market in Pulmonary by
+50% through access to
the Bronch suite
Help provide access to
new indication areas
aScope 4 marks a new era with
significantly better image qualityand mechanical performance

•
•
•
•
•


• Global R&D doubled in size
• Production capacity expanded manifold
• Expanded & dedicated sales forces
• Visualisation becoming the main
contributor stabilizing our business
• Scale in our business and added
7%-points on EBIT since start of
Climbing New Heights strategy
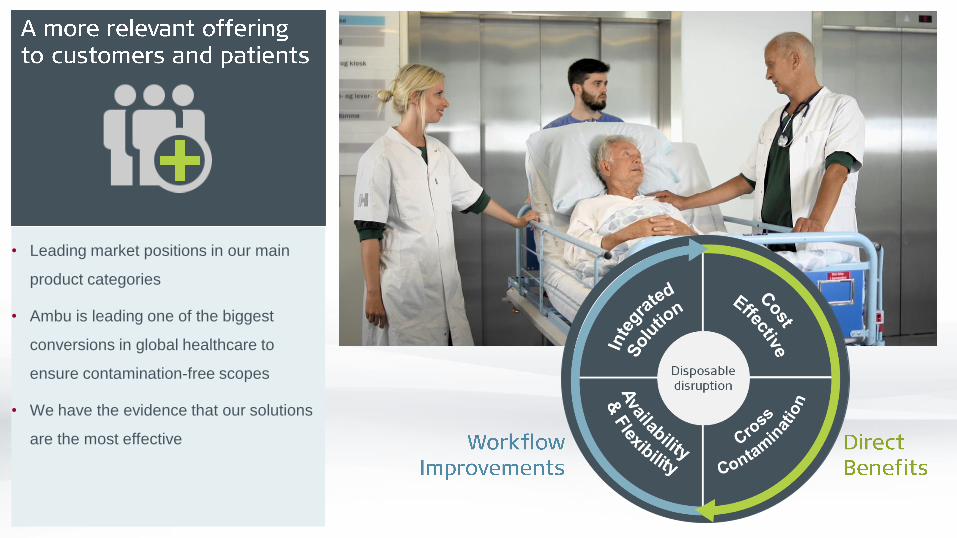
• Leading market positions in our main
product categories
• Ambu is leading one of the biggest
conversions in global healthcare to
ensure contamination-free scopes
• We have the evidence that our solutions
are the most effective

• 1 of 10 procedures in the OR/ICU globally
being performed with a disposable scope
• aScope 4 Broncho increases our direct
addressable market by 50%
(from ~3m to ~5m annual procedures)
• The upgraded platform also provides
access to diagnostic endoscopy areas
aScope 1aScope 2
aScope 3
aScope 4
Broncho
aScope 5
aScope 6
Therapeutic
Diagnostic

• Dedicated sales forces in our main sales
territories now in place
• Increased specialization in our
Visualisation business
• Global sales force increased by almost
20%, we are now approx. 400 people in
Sales

• Outgrowing most of our peers by a factor
+5
• We have scale in our production
• Significant know-how buildup throughout
our organization
Revenue growth % (CAGR FY 13-16)

Turnaround & infrastructure
Positioned for
big potentialInvest for growth
2010 2011 2012 20132009
1.0
2.0
3.0
4.0
5.0
2017 2018 2019 2020
RevenuebnDKK
20162014 2015
We are ready to go for the big potentials!
Fix cost base
Get infrastructure in place
Lift growth to +10% level
Invest throughout value chain
Capitalize on investments
to lift EBIT to new level


•
•
•
•

Ambu
current focus
~5 m procedures
Ambu
2020 focus
~50 m procedures
The full
potential
~150 m procedures

5m procedures +50m procedures
We’re going for
the potential in
Visualisation!

•
•
•

•
•
•
•

•
•
•

•
•
•
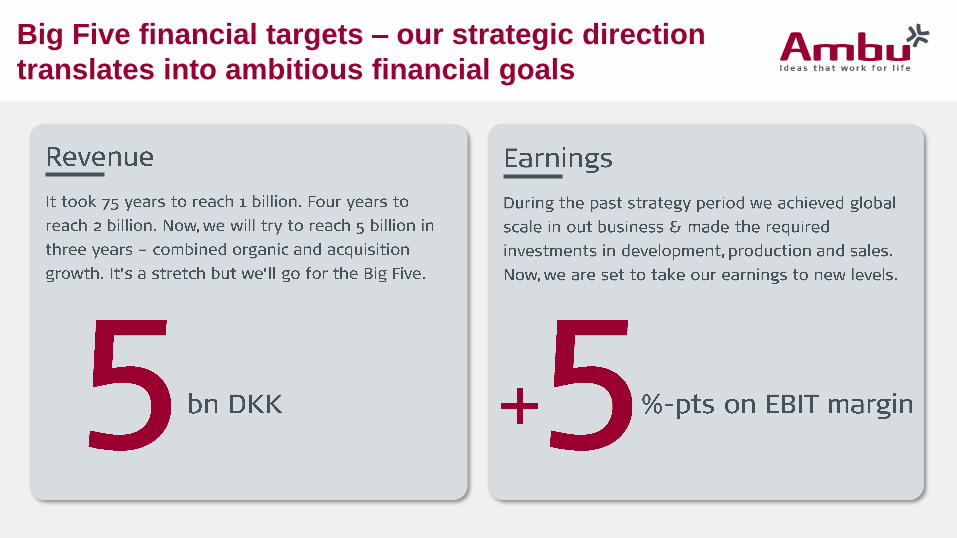
Big Five financial targets – our strategic direction
translates into ambitious financial goals


Growth
Financial 2020 guidance –- Based on organic growth and excluding acquisitions
Growth EBIT margin
~14% 13-15% ~19% ~24-25%~300m
15%* 18%
5% growth from
and
50% of
revenue from
visualisation in FY 19/20…
… and more than
1.000.000 units sold
16/17 19/20 16/17 19/20 16/17 19/20
FY FY FY
* FCF% of 15% is excluding DKK
40m of investments in buildings.
GrowthFree cash
flow DKK

We have the capital structure to deliver on our
2020 ambition
Acquisition
capacity today in
range of DKK 2bn
Current gearing level Dividend policy
Free Cash Flow
Target gearing towards
FY 19/20 below 3.0x EBITDA
Gearing end FY 16/17
~1.4x EBITDA
A strong free cash flow
generation
towards FY 19/20
Unchanged dividend
policy towards FY 19/20
Target gearing

Growth
Financial outlook for FY 17/18 –- Based on organic growth and excluding acquisitions
GrowthGrowth EBIT marginFree cash
flow DKK
16/17 17/18 16/17 17/18 16/17 17/18
~14% ~13% ~19% ~20-21% ~300m ~275-
300m
5% growth from
and
+30%share of
revenue from
visualisation in FY 17/18…
… and more than
500.000 units sold
FY FY FY
* FCF% of 15% is excluding DKK 40m
/ 75m of investments in buildings.
15%* 14%*


Despite high aScope account usage, we continue to
see plenty of room to grow
SALES
EXCELLENCE
SEGMENTATION
& TARGETING
RESOURCE &
ACTIVITY LEVEL
QUALITY OF
INTERACTION
=
x
xMove from
initial penetration
Full
conversion 3
2
Win new
accounts1
17%
Market Share Market Share
7%
Europe & Aus United States
Account
penetration
~37%
Account
penetration
~25%

Ambu is making the largest sales territory
expansion in the company’s history in the US
INVEST GROWEXPAND
WHY DO WE INVEST NOW?
Tomorrow – US
Today – US
US currently is our largest sales territory with
+6,000 hospitals
Today, majority of revenue still comes from
Anaestesia and PMD, but the majority of sales
time is allocated towards Visualisation
aScope segments have different call
points & stakeholders limiting the synergies
Doubling our number of reps & splitting the
existing direct sales force will ensure a clear focus
for aScope penetration & growing Anesthesia
=
x
x

The new structure will ensure focus & increased
specialization to drive deep account penetration
•
•
•
•
•
•
•
•
•


The Ambu case
With aScope 4,
we increase our
Pulmonary market
potential
We will increase our
Visualisation
market by a factor 10
We will outgrow the
market in Core
by a factor 2
We are set for another
transformation making
Visualisation +50% of our
business
We will grow organically
13-15% We will reach
5 bn DKK
We will add
+5% points to our EBIT margin


