Download - 523405 JMFINANCIL Corporate Presentation

JM Financial LimitedCorporate Identity Number: L67120MH1986PLC038784
Regd. Office: 7th Floor, Cnergy, Appasaheb Marathe Marg, Prabhadevi, Mumbai 400 025. T: +91 22 6630 3030 F: +91 22 6630 3223 www.jmfl.com
November 15, 2021
BSE Limited Department of Corporate Services 1st Floor, New Trading Ring Rotunda Building, P J Towers Dalal Street, Fort, Mumbai 400001
Security Code: 523405
National Stock Exchange of India Limited Exchange Plaza Plot No.C-1, G Block Bandra-Kurla Complex Bandra (East) Mumbai – 400 051
Symbol: JMFINANCIL
Dear Sirs,
Sub: Corporate Presentation
Pursuant to Regulation 30 of the Securities and Exchange Board of India (Listing Obligations and Disclosure Requirements) Regulations, 2015, read with Para A of Part A of Schedule III thereto, we wish to inform you that a corporate presentation of JM Financial Credit Solutions Limited, a material subsidiary, is being uploaded on the website of the Company viz., www.jmfl.com for information of the investors. A copy of the said presentation is attached.
We request you to disseminate the above presentation on your website.
Thank You.
Yours faithfully, for JM Financial Limited
Prashant Choksi Group Head – Compliance, Legal & Company Secretary
Encl.: as above.

JM Financial Credit Solutions Limited
September 2021

Safe Harbour
This presentation have been prepared solely for information purposes and do not constitute an offer to sell or,
recommendation or solicitation of an offer to subscribe for or purchase any securities and nothing contained herein shall
form the basis of any contract or commitment whatsoever.
This presentation and the following discussion may contain “forward looking statements” by JM Financial Credit
Solutions Limited (“JMFCSL” or the “Company”) that are not historical in nature. These forward looking statements,
which may include statements relating to future results of operations, financial condition, business prospects, plans and
objectives are based on the current beliefs, assumptions, expectations, estimates and projections of the management of
JMFCSL about the business, industry and markets in which JMFCSL operates. The information set out herein may be
subject to updating, completion, revision, verification and amendment and such information may change materially. It
should be understood that subsequent developments may affect the information contained in this presentation, which the
Company is under no obligation to update, revise or affirm. Any liability or claim in respect of this Presentation or any
inaccuracy therein or omission therefrom which might otherwise arise is hereby expressly disclaimed.
These statements are not guarantees of future performance and are subject to known and unknown risks, uncertainties
and other factors, some of which are beyond JMFCSL’s control and difficult to predict, that could cause actual results,
performance or achievements to differ materially from those in the forward looking statements.
Such statements are not and should not be construed as a representation of future performance or achievements of
JMFCSL. In particular, such statements should not be regarded as a projection of future performance of JMFCSL. It
should be noted that the actual performance or achievements of JMFCSL may vary significantly from such statements.
2

Business Overview1

Overview
4
JM Financial Group overview
• Presence of over four decades
• Established financial services player with presence in fund
based activities, investment banking and securities
business, alternative asset management and asset
management businesses
• Relationships across the corporate, institutional, HNI and the
retail client base
JM Financial Credit
Solutions Limited
(NBFC)
46.68%(1)
Strong Financial Profile(As of September 2021)
Strong Financial Profile
Revenue
Rs. 1,962 Cr
PAT
Rs. 378 Cr
Shareholders equity(2)
Rs. 10,006 Cr
Total Assets
Rs.22,581 Cr
JM Financial Credit Solutions Limited overview
• A wholesale finance NBFC providing integrated financial
solutions to real estate developers with a focus on residential
project financing such as funding real estate developers at
various stages in the life cycle of a real estate project.
Networth of Rs. 3,777 Cr as of September 2021
Other Shareholders• INH Mauritius 1- 48.96%
• Other Shareholders – 4.36%
53.32%
• Geographic presence : Mumbai, Thane, Pune, Bangalore,
Chennai, Hyderabad, NCR and Kolkata
Notes
1. JM Financial Limited controlled entity with effective ownership of 46.68%
2. Including minority interests;
Key Statistics as of September 30 2021
Loan book
Rs. 6,595 CrGNPA NNPA
2.49% 1.68%
H1FY22 PAT
127.6 CrNo. of Borrowers
64
Gross D / Eq- 1.2
Net D / Eq- 0.7
CRAR 43.79%
ROE ROA
6.9% 3.0%

Key Products
5
50.2%
18.1%
12.7%
8.1%
10.8%
Construction /Project finance
Loan againstproperty
Loan againstsecurities
Project at earlystage loans
Loans against land
Product
wise split
of loan
book –
Sep 2021
Construction / Project finance
✓ This includes offering loans to developers for construction of residential or
commercial projects.
Loans against property
✓ This includes loans against the residential or commercial properties with
occupation certificate.
Loans against securities
✓ This includes loans to promoters against the listed or unlisted shares /
securities of corporates
Project at early stage loans
✓ This is primarily undertaken against projects which are expected to be
launched soon
Loans against land
✓ This funding is primarily undertaken for land acquisition or against land
parcels which are not expected to be launched in the near future

Key Lending Philosophy
6
✓ To be senior secured lender at all times together with focus on risk adjusted profitable growth
✓ Avoid entering into consortium arrangements
✓ In most cases, we conduct micro market surveys and lend largely to residential projects
✓ We ensure that both developers and residential projects are not subject to any concentration risk
✓ Key developer screening criteria
− Stringent eligibility criteria for borrowers such as minimum delivery track record, experience,
commercial presence, net worth and profitability
− Meeting at an appropriate stage with management, promoter reference checks and site visits
✓ Typical loan tenure ranging from 24 to 60 months
✓ Secured on the back of collateral; 76.4% are cash flow backed advances as of end of Sep 2021
✓ Timely repayment in escrow account through an escrow mechanism
1
2
3
4
5
Key
Lending
Philosophy
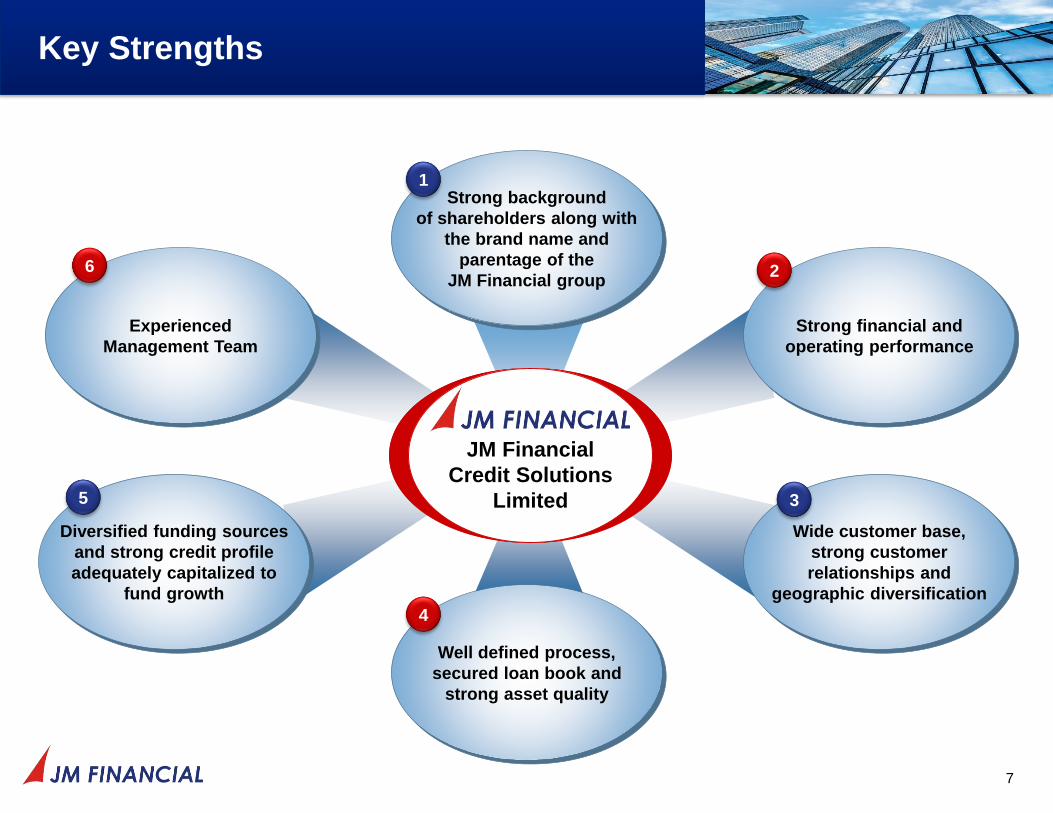
Key Strengths
7
Strong background
of shareholders along with
the brand name and
parentage of the
JM Financial group
Strong financial and
operating performance
Wide customer base,
strong customer
relationships and
geographic diversification
Well defined process,
secured loan book and
strong asset quality
Diversified funding sources
and strong credit profile
adequately capitalized to
fund growth
Experienced
Management Team
JM Financial
Credit Solutions
Limited
1
2
3
4
5
6

Net Total Income (1)
Rs Cr
Gross Loan Book (1)
Rs. Cr
Strong financial and operating
performance
8
345
476 550
700 761
718
346
100
300
500
700
900
FY16 FY17 FY18 FY19 FY20 FY21 H1FY22
4,074
5,658
7,339
8,123
7,342 7,219
6,595
3,000
6,000
9,000
FY16 FY17 FY18 FY19 FY20 FY21 H1FY22
Notes
1. Financial and operating information upto FY17 is based on IGAAP.
PAT (1)
Rs Cr
Cost to net total income (1)
(%)
10.3%
9.2%8.6%
8.3%
7.4% 7.6%
9.1%
5%
9%
13%
FY16 FY17 FY18 FY19 FY20 FY21 H1FY22
198
277315
406382
359
128
100
200
300
400
500
FY16 FY17 FY18 FY19 FY20 FY21 H1FY22
Gross loan book calculated without impact of EIR, Interest accrued and ECL

Asset Quality (1)
Gross NPA (%), Net NPA (%) and SMA2 (%) (PCR %)
Strong financial and operating
performance (cont’d)
9
Return Ratios (1,2)
(%)
Leverage Analysis (1)
Rs Cr
6.5% 5.6% 5.2% 4.7% 4.4% 4.4%3.0%
19.0%21.8% 20.8%
17.9%
12.2%10.3%
6.9%
0%
5%
10%
15%
20%
25%
FY16 FY17 FY18 FY19 FY20 FY21 H1FY22
ROA % ROE %
Notes
1. Financial and operating information upto FY17 is based on IGAAP.
2. Ratios for FY19 are on an annualized / weighted average basis (on account of equity funds raised in September 2018)
Yields and Margins(1,2)
Yields, Cost of Borrowing, Net Interest Margin (NIM)(%)
16.6% 15.7%14.7% 14.2%
14.8% 14.9% 14.7%
9.9%
9.8%9.2% 9.5%
10.1% 10.4% 10.0%10.4%
8.8%8.0%
7.3%7.9%
8.6%7.9%
5%
10%
15%
20%
FY16 FY17 FY18 FY19 FY20 FY21 H1FY22
Yields Cost of Borrowing NIM
2,9694,138
5,661 5,605 4,853
5,507 4,675
1,136
1,413
1,668 2,909
3,291 3,650
3,777
2.62.9
3.4
1.91.5 1.5
1.2
2.5
2.9
3.3
1.81.2
0.9 0.7
0.0
0.7
1.4
2.1
2.8
3.5
0
2,000
4,000
6,000
8,000
10,000
FY16 FY17 FY18 FY19 FY20 FY21 H1FY22
Debt Networth Gross D/E Net D/E
- -
1.0% 1.1%
2.1%
4.0%
2.5%
- -
0.9% 0.9%
1.4%
2.3%
1.7%
-
3.3%
1.4%1.8%
2.1%
3.5%
5.1%
FY16 FY17 FY18 FY19 FY20 FY21 H1FY22
Gross NPA % Net NPA % SMA 2 %
0.7% 0.8% 0.9% 5.4%2.8% 7.0%

Wide customer base, strong customer
relationships and geographic diversification
10
Geography wise split of loan book – September 2021
Mumbai37.1%
Pune9.2%
Thane10.1%
Bangalore12.0%
Chennai14.4%
Hyderabad1.3%
NCR8.9%
Kolkata5.2%
Others1.8%
✓ 64 borrower groups*
✓ Predominant focus on financing residential
development
✓ Advances towards residential projects
represented 76.6% of total advances and cash
flow backed advances represented 76.4% of
total advances*
✓ Average ticket size of advances per borrower
group - Rs. 103 crore*
✓ Average asset cover - 2.5 times
*As of September 30, 2021
West –
58.2%
South –
27.7%
North –
8.9%
East –
5.2%

Sr No Group LocationAs on Sep 30, 2021
(Rs. Cr)% of total
1 API Group Mumbai 395 6.0%
2 Spenta Mumbai 374 5.7%
3 Kalpataru Group Mumbai 354 5.4%
4 Divyasree Group Bangalore 296 4.5%
5 Pashmina Group Mumbai 289 4.4%
6 Casa Grande Chennai 285 4.3%
7 JSW Group Mumbai 255 3.9%
8 Subhash Goel Group & Marvel Group Pune 237 3.6%
9 Karle Group Bangalore 220 3.3%
10 Bhattad Group Mumbai 200 3.0%
2,905 44.0%
Concentration Analysis – Top 10
Accounts Group-wise
11

Loan book details
12
12
Book Size
(Rs Cr.)
2,562
605
669
793
953
586
344
6,595
83
GNPA %
0.72%
-
-
-
1.77%
-
-
2.49%
-
GNPA
(Rs Cr.)
48
-
-
-
116
-
-
164
-
Locations
Mumbai / Others
Pune
Thane
Bangalore
Chennai
NCR
Kolkata
Total
Hyderabad
SMA2
(Rs Cr.)
185
6
31
-
86
-
28
336
-
SMA2 %
2.80%
0.09%
0.48%
-
1.30%
-
0.42%
5.09%
-
Average Cover
(In times)
2.35
1.96
2.15
3.89
2.23
3.16
2.56
2.54
2.28

NPA accounts
13
Developer
Principal
Sanction
in Crore
Principal
O/s in
Crore
% to total
loan book
Provision
%
Security
CoverResolution Mechanism
Resolution
expected by
NPA
Mumbai Developer 47.3 47.2 0.72% 29.03% 1.1 SARFAESI action Dec 21 – Mar 22
Mumbai Developer 35.0 0.7 0.01% 56.01% 12.1 Promoter equity / Sale of assets Dec 21
Chennai Developer 84.0 46.6 0.71% 33.53% 1.9 SWAMIH Fund & sale of assets Starting Mar 22
Chennai Developer 88.0 39.5 0.60% 33.18% 2.0 Sale of assets / SARFAESI action Oct 21 - Mar 22
Chennai Developer 23.0 11.8 0.18% 32.03% 11.7 Sale of assets Oct 21 - Mar 22
Chennai Developer 10.9 10.9 0.17% 31.64% 1.8 SWAMIH Fund & sale of assets Oct 21 - Mar 22
Chennai Developer 10.0 6.3 0.10% 50.15% 5.1 Sale of Completed Inventory Oct 21 - Mar 22
Chennai Developer 1.7 1.2 0.02% 30.00% 1.9 Sale of assets Oct 21 - Mar 22
Total 472.2 164.4 2.49% 32.63%

SMA2 accounts
14
Developer
Principal
Sanctioned
in Crore
Principal
O/s in
Crore
% to total
loan book
Provision
%
Security
CoverResolution Mechanism
Resolution
expected by
SMA2
Mumbai Developer 175.0 169.7 2.57% 77.27% 1.1 DM / JDA with strong developer Dec 21 – Mar 22
Mumbai Developer 17.5 14.7 0.22% 32.08% 1.3 Promoter equity / Sale of assets Oct 21 – Dec 21
Chennai Developer 90.0 85.9 1.30% 45.03% 0.7 Sale of Inventory Starting Oct 21
Pune Developer 34.0 6.0 0.09% 16.03% 4.7 Sale of mortgaged assets Dec – 21
Thane Developer 125.0 31.4 0.48% 19.04% 2.1 Recovery from project cashflow Dec – 21
Kolkata Developer 51.2 28.0 0.42% 17.67% 1.3 Refinance/sale of mortgaged assets Dec 21 – Mar 22
Total 492.7 335.7 5.09% 55.54%

Diversified funding sources and strong credit
profile – Adequately capitalized to fund growth
Note
1. Financial and operating information upto FY17 is based on IGAAP.
Bo
rro
win
g B
rea
ku
p
31.5% 34.2% 39.7%48.6%
62.8% 61.9% 65.5%
40.9%45.2%
45.4%39.6%
34.7%20.0%
28.3%4.9%
0.0%0.0% 0.0%
0.0%14.5% 0.0%
17.6% 19.0% 13.9% 9.4%1.8% 5.6%5.1% 1.6% 1.0%
2.4%2.6% 1.8% 0.6%
2.62.9
3.4
1.9
1.5 1.51.2
2.5
2.93.3
1.8
1.2 0.9
0.7
FY16 FY17 FY18 FY19 FY20 FY21 H1FY22
NCD TL ICD CP Cash Credit / WCDL Gross D/E Net D/E
Long
77%Long
79%
Long
85%
Long
87%
Short
23%Short
21%
Short
15%Short
13%
Long
97%
Short
3%
2,969 4,138 5,661 5,605 4,853
Short
18%
Long
82%
5,507 4,675
Short
6%
Long
94%
Strong Credit Rating:
• Long term debt rating:
– ICRA AA / STABLE
– India Ratings AA / STABLE
• Short term debt rating:
– ICRA A1+
– India Ratings A1+
Liquidity✓ Surplus liquidity of Rs. 1,888 crore as on Sep 30 2021 comprising of
bank balances/FDs/ liquid mutual funds/Government securities and
excluding unutilised bank lines of Rs.148 crore.
✓ Current ratio as on September 30, 2021 – 4.0x
Gearing Philosophy✓ Gearing of maximum 3 times
✓ Effective April 2019, the CP borrowing has been capped to 10% of the
total borrowing except for opportunity based short term spikes towards
short term assets subject to max cap of 20%
15
Bank funding constitutes 39 % of total borrowing

Structural Liquidity (ALM 2) – Sep 2021
16
(Rs. in Crore)1 to 7
days
8 to 14
days
Over 15
days to
one month
1-2
months
2-3
months
3-6
months
6 months
- 1 year
1-3
years
3 - 5
years
Over 5
years Total
OUTFLOWS
1. Networth - - - - - - - - - 3,777 3,777
2. Borrowings 30 - 6 - 36 44 905 2,380 431 881 4,714
3. Current Liabilities & provisions 13 0 0 25 22 8 84 8 7 467 634
A.TOTAL OUTFLOWS (A) 43 - 6 25 58 52 989 2,388 438 5,125 9,125
B. Cumulative Outflows 43 43 49 74 132 184 1,173 3,561 3,999 9,125 9,125
INFLOWS
4. Cash & Balances with banks 60 - - - - - - - - - 60
5. Investment* - 40 200 700 150 439 300 - - 267 2,096
6. Advances - - 50 70 99 411 1,609 3,260 873 195 6,567
7. Others - 0 - - 82 - 2 40 1 128 249
8. Committed Line of Credit 130 18 - - - - - - - - 148
C. TOTAL INFLOWS 190 58 250 770 331 850 1,911 3,300 874 590 9,125
D. Mismatch (C - A) 147 58 244 744 273 798 904 917 436 -4,535
E. Mismatch as % to Outflows (D
as % of A)343% - 3,906% 2,927% 470% 1,537% 90% 38% 99% -88%
F. Cumulative Mismatch 147 205 449 1,193 1,466 2,264 3,187 4,099 4,535 -
G. Cumulative Mismatch as % to
Cum. Outflows (F as % of B)343% 479% 916% 1,603% 1,107% 1,228% 272% 115% 113% -
* Includes investments in various liquid schemes of mutual fund amounting to Rs.1,779 cr and in government securities amounting
to Rs.49 cr

Current Board of Directors
17
Mr. Vikram PanditNon-Executive
Chairman
• Nominee Director representing INH Mauritius 1 in the
Company since January 6, 2015.
• He is also the Non-Executive Chairman of the Company.
He also serves as a Director on the Board of Bombardier
Inc., and EXL Service.
Mr. Hariharan AiyarNon-Executive Vice
Chairman
• Nominee Director representing INH Mauritius 1 in the Company
since November 20, 2014.
• He is also the Non-Executive Vice Chairman of the Company
• He serves as a Director on the Board of JM Financial Home
Loans Limited, SV India Opportunities Advisors Private Limited,
INH Mauritius 1, INH Mauritius 2, Sical Infra Assets Limited and
Managing Partner in Build India Capital Advisors LLP.
Ms. Dipti NeelakantanNon-Executive Director
• Nominee Director representing JM Financial Limited in the
Company since October 28, 2015.She is also on the
Board of several companies such as JM Financial
Services Limited, JM Financial Institutional Securities
Limited and Infinite India Investment Management Limited
Mr. Vishal KampaniVice Chairman &
Managing Director
• Nominee Director representing JM Financial Limited in the
Company since August 1, 2019.
• He is also the Vice Chairman & Managing Director of the
Company and Non- Executive Vice Chairman of JM
Financial Limited, the Group’s flagship company.
• Launched the Asset Reconstruction business in 2008 and
the Real Estate Finance business in 2009.
• Expanded the International Operations and built a global
profile.
Dr. Anup ShahIndependent Director
• Independent Director of our Company since March 29,
2016. He serves as a Director on the Board of several
companies such as JM Financial Services Limited, JM
Financial Capital Limited, JM Financial Home Loans
Limited, Claris Limited and Claris Lifesciences Limited.
Mr. V P ShettyNon-Executive Director
• Nominee Director representing JM Financial Limited in the
Company since July 15, 2014. He is also on the Board of
JM Financial Asset Reconstruction Company Limited, JM
Financial Products Limited, JM Financial Home Loans
Limited and JM Financial Asset Management Limited.
Mr. Satish Chand
MathurIndependent Director
• Independent Director of our Company since August 1,
2019. He is also on the Board of several companies such
as JM Financial Asset Reconstruction Company Limited,
Indiabulls Housing Finance Limited, Tilaknagar Industries
Limited and JBF Industries Limited.
Mr. K. G.
KrishnamurthyIndependent Director
• Independent Director of our Company since August 25,
2021. He is also on the Board of several companies such
as Vascon Engineers Limited, Shriram Properties Limited
and Puravankara Limited.
It may be noted that Mr. Darius E. Udwadia has resigned as an Independent Director of the Company with effect from October 20, 2021.

18
Annexure – Financial Information 2
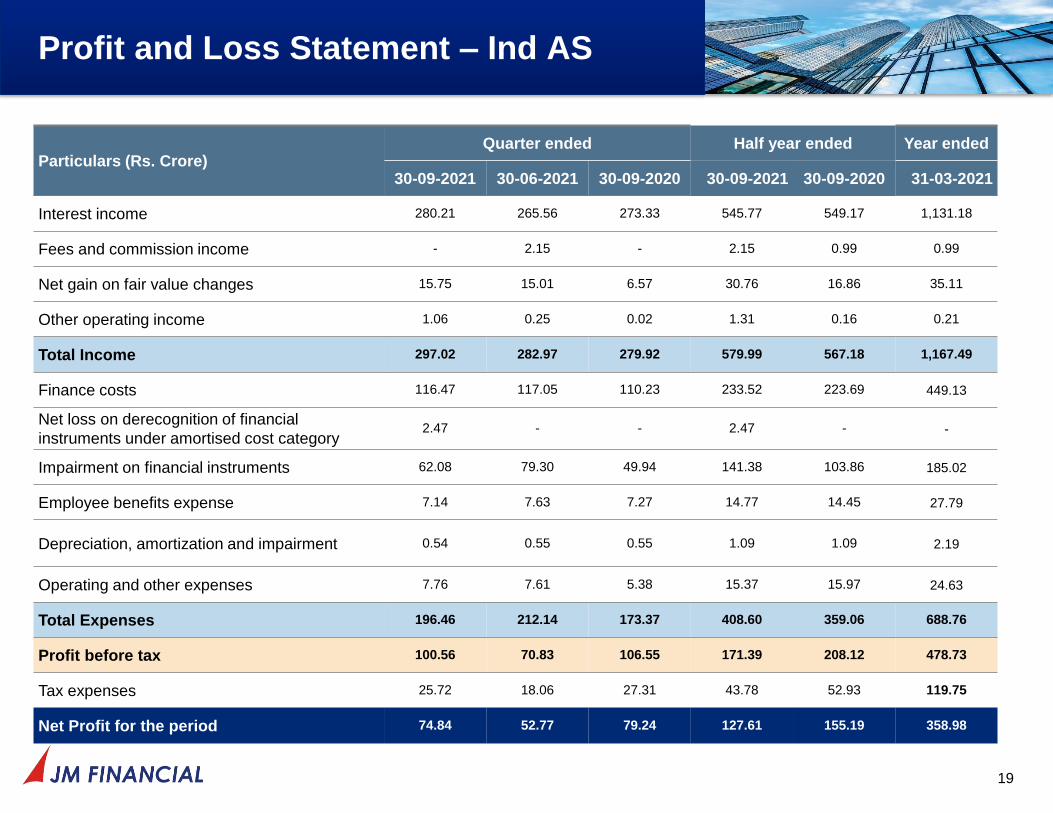
Profit and Loss Statement – Ind AS
19
Particulars (Rs. Crore)Quarter ended Half year ended Year ended
30-09-2021 30-06-2021 30-09-2020 30-09-2021 30-09-2020 31-03-2021
Interest income 280.21 265.56 273.33 545.77 549.17 1,131.18
Fees and commission income - 2.15 - 2.15 0.99 0.99
Net gain on fair value changes 15.75 15.01 6.57 30.76 16.86 35.11
Other operating income 1.06 0.25 0.02 1.31 0.16 0.21
Total Income 297.02 282.97 279.92 579.99 567.18 1,167.49
Finance costs 116.47 117.05 110.23 233.52 223.69 449.13
Net loss on derecognition of financial
instruments under amortised cost category2.47 - - 2.47 - -
Impairment on financial instruments 62.08 79.30 49.94 141.38 103.86 185.02
Employee benefits expense 7.14 7.63 7.27 14.77 14.45 27.79
Depreciation, amortization and impairment 0.54 0.55 0.55 1.09 1.09 2.19
Operating and other expenses 7.76 7.61 5.38 15.37 15.97 24.63
Total Expenses 196.46 212.14 173.37 408.60 359.06 688.76
Profit before tax 100.56 70.83 106.55 171.39 208.12 478.73
Tax expenses 25.72 18.06 27.31 43.78 52.93 119.75
Net Profit for the period 74.84 52.77 79.24 127.61 155.19 358.98

Balance Sheet – Ind AS
Particulars (Rs Crore)As at As at
September 30, 2021 March 31, 2021
ASSETS
Financial Assets
Cash and cash equivalents (CCE) 59.55 232.60
Bank Balance other than CCE 5.08 0.25
Loans 6,187.74 6,830.71
Investments 2,056.03 2,027.70
Other Financial assets 54.08 5.93
Total Financial Assets 8,362.48 9,097.19
Non-financial Assets
Current tax assets (net) 9.29 16.72
Deferred tax Assets (Net) 128.39 88.71
Property, Plant and Equipment 14.14 15.19
Other Intangible assets 0.05 0.09
Other non-financial assets 1.51 2.28
Total Non-financial Assets 153.38 122.99
TOTAL 8,515.86 9,220.18
20

Balance Sheet – Ind AS (cont’d)
21
Particulars (Rs Crore)As at As at
September 30, 2021 March 31, 2021
LIABILITIES AND EQUITY
LIABILITIES
Financial Liabilities
Trade Payables 13.41 7.86
Debt Securities 3,323.01 3,507.66
Borrowings (Other than Debt Securities) 1,352.28 1,999.45
Lease liabilities 15.30 15.83
Other financial liabilities 30.51 33.35
Total Financial Liabilities 4,734.51 5,564.15
Non-Financial Liabilities
Provisions 2.16 2.19
Other non-financial liabilities 2.38 3.98
Total Non-Financial Liabilities 4.54 6.17
EQUITY
Equity Share capital 2.83 2.83
Other Equity 3,773.98 3,647.03
Total Equity 3,776.81 3,649.86
TOTAL 8,515.86 9,220.18

For Further Queries
Mr. Gagan Kothari
Chief Financial Officer
Email: [email protected]
Contact No: 022 66303360
22


