
3,350+OPEN ACCESS BOOKS
108,000+INTERNATIONAL
AUTHORS AND EDITORS115+ MILLION
DOWNLOADS
BOOKSDELIVERED TO
151 COUNTRIES
AUTHORS AMONG
TOP 1%MOST CITED SCIENTIST
12.2%AUTHORS AND EDITORS
FROM TOP 500 UNIVERSITIES
Selection of our books indexed in theBook Citation Index in Web of Science™
Core Collection (BKCI)
Chapter from the book Thermodynamics - Interaction Studies - Solids , Liquids andGasesDownloaded from: http://www.intechopen.com/books/thermodynamics-interaction-studies-solids-liquids-and-gases
PUBLISHED BY
World's largest Science,Technology & Medicine
Open Access book publisher
Interested in publishing with IntechOpen?Contact us at [email protected]
16
Effect of Stagnation Temperature on Supersonic Flow Parameters with
Application for Air in Nozzles
Toufik Zebbiche University SAAD Dahleb of Blida,
Algeria
1. Introduction
The obtained results of a supersonic perfect gas flow presented in (Anderson, 1982, 1988 &
Ryhming, 1984), are valid under some assumptions. One of the assumptions is that the gas is
regarded as a calorically perfect, i. e., the specific heats CP is constant and does not depend
on the temperature, which is not valid in the real case when the temperature increases
(Zebbiche & Youbi, 2005b, 2006, Zebbiche, 2010a, 2010b). The aim of this research is to
develop a mathematical model of the gas flow by adding the variation effect of CP and γ
with the temperature. In this case, the gas is named by calorically imperfect gas or gas at high
temperature. There are tables for air (Peterson & Hill, 1965) for example) that contain the
values of CP and γ versus the temperature in interval 55 K to 3550 K. We carried out a
polynomial interpolation of these values in order to find an analytical form for the function CP(T).
The presented mathematical relations are valid in the general case independently of the interpolation form and the substance, but the results are illustrated by a polynomial interpolation of the 9th degree. The obtained mathematical relations are in the form of nonlinear algebraic equations, and so analytical integration was impossible. Thus, our interest is directed towards to the determination of numerical solutions. The dichotomy method for the solution of the nonlinear algebraic equations is used; the Simpson’s algorithm (Démidovitch & Maron, 1987 & Zebbiche & Youbi, 2006, Zebbiche, 2010a, 2010b) for numerical integration of the found functions is applied. The integrated functions have high gradients of the interval extremity, where the Simpson’s algorithm requires a very high discretization to have a suitable precision. The solution of this problem is made by introduction of a condensation procedure in order to refine the points at the place where there is high gradient. The Robert’s condensation formula presented in (Fletcher, 1988) was chosen. The application for the air in the supersonic field is limited by the threshold of the molecules dissociation. The comparison is made with the calorically perfect gas model. The problem encounters in the aeronautical experiments where the use of the nozzle designed on the basis of the perfect gas assumption, degrades the performances. If during the experiment measurements are carried out it will be found that measured parameters are differed from the calculated, especially for the high stagnation temperature. Several reasons
www.intechopen.com

Thermodynamics – Interaction Studies – Solids, Liquids and Gases
422
are responsible for this deviation. Our flow is regarded as perfect, permanent and non-rotational. The gas is regarded as calorically imperfect and thermally perfect. The theory of perfect gas does not take account of this temperature. To determine the application limits of the perfect gas model, the error given by this model is compared with our results.
2. Mathematical formulation
The development is based on the use of the conservation equations in differential form. We assume that the state equation of perfect gas (P=ρRT) remains valid, with R=287.102 J/(kg K). For the adiabatic flow, the temperature and the density of a perfect gas are related by the following differential equation (Moran, 2007 & Oosthuisen & Carscallen, 1997 & Zuker & Bilbarz, 2002, Zebbiche, 2010a, 2010b).
0PC RTdT dρ
γ ρ (1)
Using relationship between CP and γ [CP=γR/(γ-1)], the equation (1) can be written at the following form:
[ ( ) 1]
dρ dT
ρ T T (2)
The integration of the relation (2) gives the adiabatic equation of a perfect gas at high temperature. The sound velocity is (Ryhming, 1984),
2
tanentropy cons t
dPa
d (3)
The differentiation of the state equation of a perfect gas gives:
dP dTρ R R Tdρ dρ
(4)
Substituting the relationship (2) in the equation (4), we obtain after transformation:
2( ) ( ) a T γ T R T (5)
Equation (5) proves that the relation of speed of sound of perfect gas remains always valid
for the model at high temperature, but it is necessary to take into account the variation of the
ratio γ(T).
The equation of the energy conservation in differential form (Anderson, 1988 & Moran,
2007) is written as:
0PC dT V dV (6)
The integration between the stagnation state (V0 ≈ 0, T0) and supersonic state (V, T) gives:
www.intechopen.com

Effect of Stagnation Temperature on Supersonic Flow Parameters with Application for Air in Nozzles
423
2 2 ( )V H T (7)
Where
0( ) P
T
T
H T C T dT (8)
Dividing the equation (6) by V2 and substituting the relation (7) in the obtained result, we
obtain:
( )
2 ( )
PC TdVdT
V H T (9)
Dividing the relation (7) by the sound velocity, we obtain an expression connecting the
Mach number with the enthalpy and the temperature:
2 ( )
( )( )
H TM T
a T (10)
The relation (10) shows the variation of the Mach number with the temperature for
calorically imperfect gas.
The momentum equation in differential form can be written as (Moran, 2007, Peterson &
Hill1, 1965, & Oosthuisen & Carscallen, 1997):
0dP
V dVρ
(11)
Using the expression (3), the relationship (10), can be written as:
( ) ρdρ
F T dTρ (12)
Where
2
( )( )
( )P
ρC T
F Ta T
(13)
The density ratio relative to the temperature T0 can be obtained by integration of
the function (13) between the stagnation state (ρ0,T0) and the concerned supersonic state
(ρ,T):
0
0
ρ
T
T
ρ Expρ F T dT
(14)
The pressure ratio is obtained by using the relation of the perfect gas state:
www.intechopen.com

Thermodynamics – Interaction Studies – Solids, Liquids and Gases
424
0 0 0
ρ TP
P ρ T
(15)
The mass conservation equation is written as (Anderson, 1988 & Moran, 2007)
tanρ V A cons t (16)
The taking logarithm and then differentiating of relation (16), and also using of the relations
(9) and (12), one can receive the following equation:
( ) A
dAF T dT
A (17)Where
2
1 1( ) ( )
2 ( )( )A PF T C T
H Ta T
(18)
The integration of equation (17) between the critical state (A*, T*) and the supersonic state (A,
T) gives the cross-section areas ratio:
*T
T
dTTFA*
ExpA
A (19)
To find parameters ρ and A, the integrals of functions Fρ(T) and FA(T) should be found. As
the analytical procedure is impossible, our interest is directed towards the numerical
calculation. All parameters M, ρ and A depend on the temperature.
The critical mass flow rate (Moran, 2007, Zebbiche & Youbi, 2005a, 2005b) can be written in
non-dimensional form:
* 0 0 0 0 *.
cosA
m a dAMA a a A
(20)
As the mass flow rate through the throat is constant, we can calculate it at the throat. In this
section, we have ρ=ρ*, a=a*, M=1, θ=0 and A=A*. Therefore, the relation (20) is reduced to:
0 0 0 0
* *
*
ρ am A ρ a ρ a
(21)
The determination of the velocity sound ratio is done by the relation (5). Thus,
1 2 1 2
0 0 0
( )
( )
/ /γ Ta T
a γ T T
(22)
The parameters T, P, ρ and A for the perfect gas are connected explicitly with the Mach
number, which is the basic variable for that model. For our model, the basic variable is the
temperature because of the implicit equation (10) connecting M and T, where the reverse
analytical expression does not exist.
www.intechopen.com

Effect of Stagnation Temperature on Supersonic Flow Parameters with Application for Air in Nozzles
425
3. Calculation procedure
In the first case, one presents the table of variation of CP and γ versus the temperature for air (Peterson & Hill, 1965, Zebbiche 2010a, 2010b). The values are presented in the table 1.
T (K) CP
(J/(KgK)γ(T) T (K)
CP
(J/(Kg K) γ(T) T (K)
CP
J/(Kg K) γ(T)
55.538 1001.104 1.402 833.316 1107.192 1.350 2111.094 1256.813 1.296
. . . 888.872 1119.078 1.345 2222.205 1263.410 1.294
222.205 1001.101 1.402 944.427 1131.314 1.340 2333.316 1270.097 1.292
277.761 1002.885 1.401 999.983 1141.365 1.336 2444.427 1273.476 1.291
305.538 1004.675 1.400 1055.538 1151.658 1.332 2555.538 1276.877 1.290
333.316 1006.473 1.399 1111.094 1162.202 1.328 2666.650 1283.751 1.288
361.094 1008.281 1.398 1166.650 1170.280 1.325 2777.761 1287.224 1.287
388.872 1011.923 1.396 1222.205 1178.509 1.322 2888.872 1290.721 1.286
416.650 1015.603 1.394 1277.761 1186.893 1.319 2999.983 1294.242 1.285
444.427 1019.320 1.392 1333.316 1192.570 1.317 3111.094 1297.789 1.284
499.983 1028.781 1.387 1444.427 1204.142 1.313 3222.205 1301.360 1.283
555.538 1054.563 1.374 1555.538 1216.014 1.309 3333.316 1304.957 1.282
611.094 1054.563 1.370 1666.650 1225.121 1.306 3444.427 1304.957 1.282
666.650 1067.077 1.368 1777.761 1234.409 1.303 3555.538 1308.580 1.281
722.205 1080.005 1.362 1888.872 1243.883 1.300
777.761 1093.370 1.356 1999.983 1250.305 1.298
Table 1. Variation of CP(T) and γ(T) versus the temperature for air.
For a perfect gas, the γ and CP values are equal to γ=1.402 and CP=1001.28932 J/(kgK) (Oosthuisen & Carscallen, 1997, Moran, 2007 & Zuker & Bilbarz, 2002).. The interpolation of the CP values according to the temperature is presented by relation (23) in the form of Horner scheme to minimize the mathematical operations number (Zebbiche, 2010a, 2010b):
1 2 3 4 5 6 7 8 9 10(( ) ( ( ( ( ( ( ( ( )))))))))PC T a T a T a T a T a T a T a T a T a T a (23)
The interpolation (ai i=1, 2, …, 10) of constants are illustrated in table 2.
I ai I ai
1 1001.1058 6 3.069773 10-12
2 0.04066128 7 -1.350935 10-15
3 -0.000633769 8 3.472262 10-19
4 2.747475 10-6 9 -4.846753 10-23
5 -4.033845 10-9 10 2.841187 10-27
Table 2. Coefficients of the polynomial CP(T).
www.intechopen.com

Thermodynamics – Interaction Studies – Solids, Liquids and Gases
426
A relationship (23) gives undulated dependence for temperature approximately low
than T 240 K . So for this field, the table value (Peterson & Hill, 1965), was taken
1001 15868 J / (kg KP pC C T . )
Thus:
for T T , we have ( )P PC T C
for T T , relation (23) is used. The selected interpolation gives an error less than ε=10-3 between the table and interpolated values. Once the interpolation is made, we determine the function H(T) of the relation (8), by integrating the function CP(T) in the interval [T, T0]. Then, H(T) is a function with a parameter T0 and it is defined when T≤T0. Substituting the relation (23) in (8) and writing the integration results in the form of Horner scheme, the following expression for enthalpy is obtained
0
1 2 3 4 5 6 7 8 9 10
( )
[ ( ( ( ( ( ( ( ( )))))))))]
H T H -
c T c T c T c T c Tc T c T c T c T c
(24)
Where
0 0 1 0 2 0 3 0 4 0 5 0 6
0 7 0 8 0 9 0 10
( ( ( ( ( (
( ( ( ( ))))))))))
H T c T c T c T c T c T c
T c T c T c T c
(25)
and
( 1, 2, 3, ..., 10)ii
ac i
i
0 100 200 300 400 500
T (K)
0.00
0.01
0.02
0.03
0.04
Fig. 1. Variation of function Fρ(T) in the interval [TS,T0] versusT0.
www.intechopen.com
Effect of Stagnation Temperature on Supersonic Flow Parameters with Application for Air in Nozzles
427
Taking into account the correction made to the function CP(T), the function H(T) has the following form:
For 0T T , 0( ) PH T C T T
For 0T T ,we have two cases:
if : ( ) relation (24)T T H T
if : ( ) ( ) ( )PT T H T C T T H T
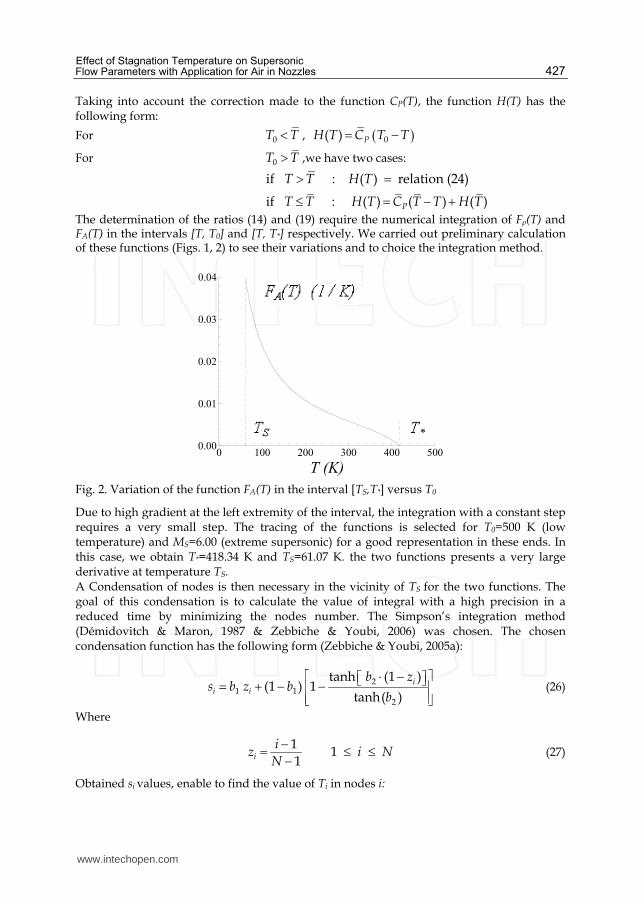
The determination of the ratios (14) and (19) require the numerical integration of Fρ(T) and FA(T) in the intervals [T, T0] and [T, T*] respectively. We carried out preliminary calculation of these functions (Figs. 1, 2) to see their variations and to choice the integration method.
0 100 200 300 400 500
T (K)
0.00
0.01
0.02
0.03
0.04
Fig. 2. Variation of the function FA(T) in the interval [TS,T*] versus T0
Due to high gradient at the left extremity of the interval, the integration with a constant step requires a very small step. The tracing of the functions is selected for T0=500 K (low temperature) and MS=6.00 (extreme supersonic) for a good representation in these ends. In this case, we obtain T*=418.34 K and TS=61.07 K. the two functions presents a very large derivative at temperature TS. A Condensation of nodes is then necessary in the vicinity of TS for the two functions. The goal of this condensation is to calculate the value of integral with a high precision in a reduced time by minimizing the nodes number. The Simpson’s integration method (Démidovitch & Maron, 1987 & Zebbiche & Youbi, 2006) was chosen. The chosen condensation function has the following form (Zebbiche & Youbi, 2005a):
2
1 1
2
tanh (1 )(1 ) 1
tanh( )
ii i
b zs b z b
b
(26)
Where
1
1 1i
iz i N
N
(27)
Obtained si values, enable to find the value of Ti in nodes i:
www.intechopen.com

Thermodynamics – Interaction Studies – Solids, Liquids and Gases
428
( )i i D G GT s T T T (28)
The temperature TD is equal to T0 for Fρ(T), and equal to T* for FA(T). The temperature TG is equal to T* for the critical parameter, and equal to TS for the supersonic parameter. Taking a value b1 near zero (b1=0.1, for example) and b2=2.0, it can condense the nodes towards left edge TS of the interval, see figure 3.
b1=0.1 , b2=2.0
b1=1.0 , b2=2.0
b1=1.9 , b2=2.0
Fig. 3. Presentation of the condensation of nodes
3.1 Critical parameters
The stagnation state is given by M=0. Then, the critical parameters correspond to M=1.00, for example at the throat of a supersonic nozzle, summarize by: When M=1.00 we have T=T*. These conditions in the relation (10), we obtain:
2* *2 ( ) ( ) 0 H T a T (29)
The resolution of equation (29) is made by the use of the dichotomy algorithm (Démidovitch & Maron, 1987 & Zebbiche & Youbi, 2006), with T*<T0. It can choose the interval [T1,T2] containing T* by T1=0 K and T2=T0. The value T* can be given with a precision ε if the interval of subdivision number K is satisfied by the following condition:
0 1 4426 1T
K . Log (30)
If ε=10-8 is taken, the number K cannot exceed 39. Consequently, the temperature ratio T*/T0 can be calculated. Taking T=T* and ρ=ρ* in the relation (14) and integrating the function Fρ(T) by using the Simpson’s formula with condensation of nodes towards the left end, the critical density ratio is obtained. The critical ratios of the pressures and the sound velocity can be calculated by using the relations (15) and (22) respectively, by replacing T=T*, ρ=ρ*, P=P* and a=a*,
3.2 Parameters for a supersonic Mach number For a given supersonic cross-section, the parameters ρ=ρS, P=PS, A=AS, and T=TS can be determined according to the Mach number M=MS. Replacing T=TS and M=MS in relation (10) gives
2 22 ( ) ( ) 0 S S S H T M a T (31)
The determination of TS of equation (31) is done always by the dichotomy algorithm,
excepting TS<T*. We can take the interval [T1,T2] containing TS, by (T1=0 K, and T2=T*.
Replacing T=TS and ρ=ρS in relation (14) and integrating the function Fρ(T) by using the Simpson’s method with condensation of nodes towards the left end, the density ratio can be obtained.
www.intechopen.com
Effect of Stagnation Temperature on Supersonic Flow Parameters with Application for Air in Nozzles
429
The ratios of pressures, speed of sound and the sections corresponding to M=MS can be calculated respectively by using the relations (15), (22) and (19) by replacing T=TS, ρ=ρS, P=PS, a=aS and A=AS. The integration results of the ratios ρ* / ρ0, ρS/ρ0 and AS/A* primarily depend on the values of N, b1 and b2.
3.3 Supersonic nozzle conception
For supersonic nozzle application, it is necessary to determine the thrust coefficient. For nozzles giving a uniform and parallel flow at the exit section, the thrust coefficient is (Peterson & Hill, 1965 & Zebbiche, Youbi, 2005b)
0 *
F
FC
P A (32)
Where
E E EF m V m M a (33)
The introduction of relations (21), (22) into (32) gives as the following relation:
* *0
0 * 0
EF E
a aC T M
a a
(34)
The design of the nozzle is made on the basis of its application. For rockets and missiles applications, the design is made to obtain nozzles having largest possible exit Mach number, which gives largest thrust coefficient, and smallest possible length, which give smallest possible mass of structure. For the application of blowers, we make the design on the basis to obtain the smallest
possible temperature at the exit section, to not to destroy the measuring instruments, and to
save the ambient conditions. Another condition requested is to have possible largest ray of
the exit section for the site of instruments. Between the two possibilities of construction, we
prefer the first one.
3.4 Error of perfect gas model
The mathematical perfect gas model is developed on the basis to regarding the specific heat
CP and ratio γ as constants, which gives acceptable results for low temperature. According to
this study, we can notice a difference on the given results between the perfect gas model and
developed here model.The error given by the PG model compared to our HT model can be
calculated for each parameter. Then, for each value (T0, M), the ε error can be evaluated by
the following relationship:
0
0
0
( )( ) 1 100
( )PG
y
HT
y T , Mε T , M y T , M
(35)
The letter y in the expression (35) can represent all above-mentioned parameters. As a rule
for the aerodynamic applications, the error should be lower than 5%.
www.intechopen.com
Thermodynamics – Interaction Studies – Solids, Liquids and Gases
430
4. Application
The design of a supersonic propulsion nozzle can be considered as example. The use of the obtained dimensioned nozzle shape based on the application of the PG model given a supersonic uniform Mach number MS at the exit section of rockets, degrades the desired performances (exit Mach number, pressure force), especially if the temperature T0 of the combustion chamber is higher. We recall here that the form of the nozzle structure does not change, except the thermodynamic behaviour of the air which changes with T0. Two situations can be presented. The first situation presented is that, if we wants to preserve the same variation of the Mach number throughout the nozzle, and consequently, the same exit Mach number ME, is necessary to determine by the application of our model, the ray of each section and in particular the ray of the exit section, which will give the same variation of the Mach number, and consequently another shape of the nozzle will be obtained.
( ) ( )S S M HT M PG (36)
( )
( )
2 [ ]( )
[ ]
S HT
S
S HT
H T M PG
a T (37)
* *
( )( ) ( )
A
S S
T*
TS HT
F T dTA A
HT e PG A A
(38)
The relation (36) indicates that the Mach number of the PG model is preserved for each
section in our calculation. Initially, we determine the temperature at each section; witch
presents the solution of equation (37). To determine the ratio of the sections, we use the
relation (38). The ratio of the section obtained by our model will be superior that that
determined by the PG model as present equation (38). Then the shape of the nozzle obtained
by PG model is included in the nozzle obtained by our model. The temperature T0 presented
in equation (38) is that correspond to the temperature T0 for our model.
The second situation consists to preserving the shape of the nozzle dimensioned on the basis of PG model for the aeronautical applications considered the HT model.
* *
( ) ( )S SA AHT PG
A A (39)
( ) ( )S S M HT M PG (40)
The relation (39) presents this situation. In this case, the nozzle will deliver a Mach number lower than desired, as shows the relation (40). The correction of the Mach number for HT model is initially made by the determination of the temperature TS as solution of equation (38), then determine the exit Mach number as solution of relation (37). The resolution of equation (38) is done by combining the dichotomy method with Simpson’s algorithm.
www.intechopen.com

Effect of Stagnation Temperature on Supersonic Flow Parameters with Application for Air in Nozzles
431
5. Results and comments
Figures 4 and 5 respectively represent the variation of specific heat CP(T) and the ratio γ(T) of the air versus the temperature up to 3550 K for HT and PG models. The graphs at high temperature are presented by using the polynomial interpolation (23). We can say that at low temperature until approximately 240 K, the gas can be regarded as calorically perfect, because of the invariance of specific heat CP(T) and the ratio γ(T). But if T0 increases, we can see the difference between these values and it influences on the thermodynamic parameters of the flow.
0 1000 2000 3000 4000
Stagnation Temperature (K)
950
1000
1050
1100
1150
1200
1250
1300
1350
Fig. 4. Variation of the specific heat for constant pressure versus stagnation temperature T0.
0 1000 2000 3000 4000
Stagnation Temperature (K)
1.24
1.28
1.32
1.36
1.40
1.44
Fig. 5. Variation of the specific heats ratio versus T0.
www.intechopen.com

Thermodynamics – Interaction Studies – Solids, Liquids and Gases
432
5.1 Results for the critical parameters
Figures 6, 7 and 8 represent the variation of the critical thermodynamic ratios versus T0. It
can be seen that with enhancement T0, the critical parameters vary, and this variation
becomes considerable for high values of T0 unlike to the PG model, where they do not
depend on T0.. For example, the value of the temperature ratio given by the HT model is
always higher than the value given by the PG model. The ratios are determined by the
choice of N=300000, b1=0.1 and b2=2.0 to have a precision better than ε=10 -5. The obtained
numerical values of the critical parameters are presented in the table 3.
0 1000 2000 3000 4000
Stagnation Temperature (K)
0.82
0.83
0.84
0.85
0.86
0.87
0.88
0.89
Fig. 6. Variation of T* /T0 versus T0.
0 1000 2000 3000 4000
Stagnation temperature (K)
0.620
0.624
0.628
0.632
0.636
0.640
Fig. 7. Variation of ρ* /ρ0 versus T0.
www.intechopen.com
Effect of Stagnation Temperature on Supersonic Flow Parameters with Application for Air in Nozzles
433
0 1000 2000 3000 4000
Stagnation Temperature (K)
0.52
0.53
0.53
0.54
0.54
0.55
0.55
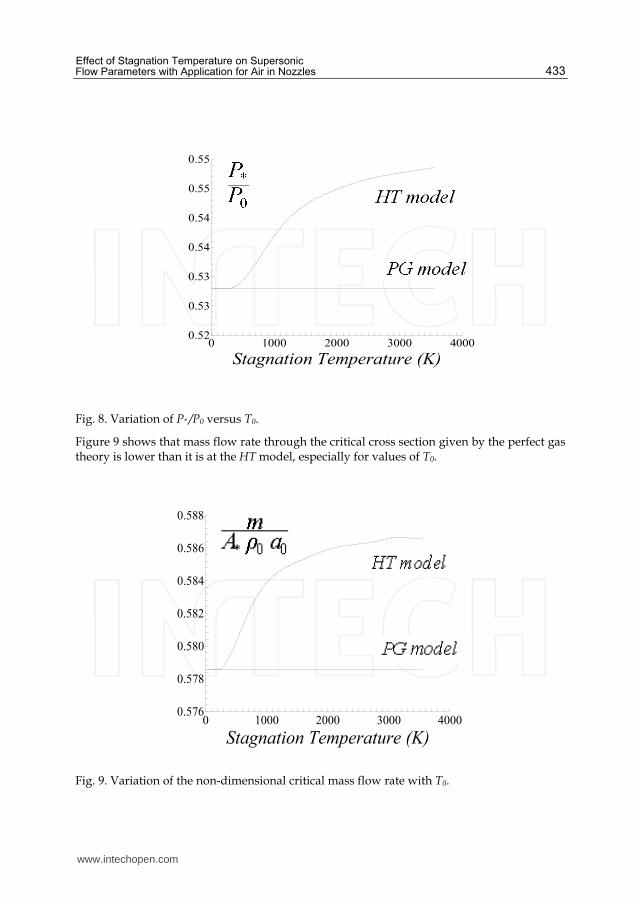
Fig. 8. Variation of P* /P0 versus T0.
Figure 9 shows that mass flow rate through the critical cross section given by the perfect gas theory is lower than it is at the HT model, especially for values of T0.
0 1000 2000 3000 4000
Stagnation Temperature (K)
0.576
0.578
0.580
0.582
0.584
0.586
0.588
Fig. 9. Variation of the non-dimensional critical mass flow rate with T0.
www.intechopen.com
Thermodynamics – Interaction Studies – Solids, Liquids and Gases
434
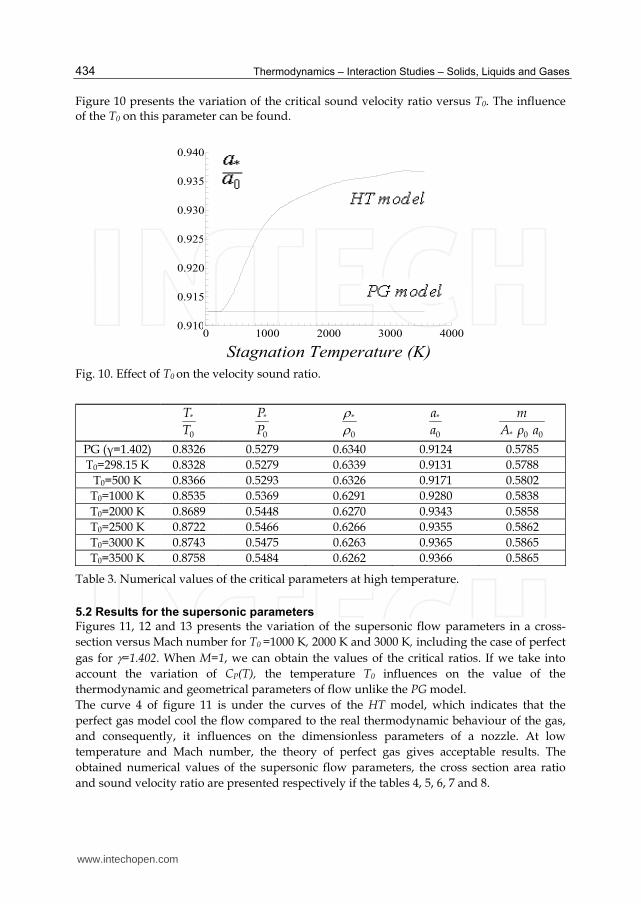
Figure 10 presents the variation of the critical sound velocity ratio versus T0. The influence of the T0 on this parameter can be found.
0 1000 2000 3000 4000
Stagnation Temperature (K)
0.910
0.915
0.920
0.925
0.930
0.935
0.940
Fig. 10. Effect of T0 on the velocity sound ratio.
0
*T
T
0
*P
P
0
* 0
*a
a
0 0 *
m
A ρ a
PG (γ=1.402) 0.8326 0.5279 0.6340 0.9124 0.5785
T0=298.15 K 0.8328 0.5279 0.6339 0.9131 0.5788
T0=500 K 0.8366 0.5293 0.6326 0.9171 0.5802
T0=1000 K 0.8535 0.5369 0.6291 0.9280 0.5838
T0=2000 K 0.8689 0.5448 0.6270 0.9343 0.5858
T0=2500 K 0.8722 0.5466 0.6266 0.9355 0.5862
T0=3000 K 0.8743 0.5475 0.6263 0.9365 0.5865
T0=3500 K 0.8758 0.5484 0.6262 0.9366 0.5865
Table 3. Numerical values of the critical parameters at high temperature.
5.2 Results for the supersonic parameters
Figures 11, 12 and 13 presents the variation of the supersonic flow parameters in a cross-
section versus Mach number for T0 =1000 K, 2000 K and 3000 K, including the case of perfect
gas for =1.402. When M=1, we can obtain the values of the critical ratios. If we take into
account the variation of CP(T), the temperature T0 influences on the value of the
thermodynamic and geometrical parameters of flow unlike the PG model.
The curve 4 of figure 11 is under the curves of the HT model, which indicates that the
perfect gas model cool the flow compared to the real thermodynamic behaviour of the gas,
and consequently, it influences on the dimensionless parameters of a nozzle. At low
temperature and Mach number, the theory of perfect gas gives acceptable results. The
obtained numerical values of the supersonic flow parameters, the cross section area ratio
and sound velocity ratio are presented respectively if the tables 4, 5, 6, 7 and 8.
www.intechopen.com

Effect of Stagnation Temperature on Supersonic Flow Parameters with Application for Air in Nozzles
435
T/T0 M=2.00 M=3.00 M=4.00 M=5.00 M=6.00
PG (γ=1.402) 0.5543 0.3560 0.2371 0.1659 0.1214
T0=298.15 K 0.5544 0.3560 0.2372 0.1659 0.1214
T0=500 K 0.5577 0.3581 0.2386 0.1669 0.1221
T0=1000 K 0.5810 0.3731 0.2481 0.1736 0.1269
T0=1500 K 0.6031 0.3911 0.2594 0.1810 0.1323
T0=2000 K 0.6163 0.4058 0.2694 0.1873 0.1366
T0=2500 K 0.6245 0.4162 0.2778 0.1928 0.1403
T0=3000 K 0.6301 0.4233 0.2848 0.1977 0.1473
T0=3500 K 0.6340 0.4285 0.2901 0.2018 0.1462
Table 4. Numerical values of the temperature ratio at high temperature
1 2 3 4 5 6
Mach number
0.0
0.1
0.2
0.3
0.4
0.5
0.6
0.7
0.8
0.9
1.0
43
2
1
Fig. 11. Variation of T/T0 versus Mach number.
ρ/ρ0 M=2.00 M=3.00 M=4.00 M=5.00 M=6.00
PG (γ=1.402) 0.2304 0.0765 0.0278 0.0114 0.0052
T0=298.15 K 0.2304 0.0765 0.0278 0.0114 0.0052
T0=500 K 0.2283 0.0758 0.0276 0.0113 0.0052
T0=1000 K 0.2181 0.0696 0.0250 0.0103 0.0047
T0=1500 K 0.2116 0.0636 0.0220 0.0089 0.0041
T0=2000 K 0.2087 0.0601 0.0197 0.0077 0.0035
T0=2500 K 0.2069 0.0581 0.0182 0.0069 0.0030
T0=3000 K 0.2057 0.0569 0.0173 0.0063 0.0027
T0=3500 K 0.2049 0.0560 0.0166 0.0058 0.0024
Table 5. Numerical values of the density ratio at high temperature
www.intechopen.com
Thermodynamics – Interaction Studies – Solids, Liquids and Gases
436
1 2 3 4 5 6
Mach number
0.0
0.1
0.2
0.3
0.4
0.5
0.6
0.7
1
2
3
4
Fig. 12. Variation of ρ/ρ0 versus Mach number.
P/P0 M=2.00 M=3.00 M=4.00 M=5.00 M=6.00
PG (γ=1.402) 0.1277 0.0272 0.0066 0.0019 0.0006
T0=298.15 K 0.1277 0.0272 0.0066 0.0019 0.0006
T0=500 K 0.1273 0.0271 0.0065 0.0018 0.0006
T0=1000 K 0.1267 0.0259 0.0062 0.0017 0.0006
T0=1500 K 0.1276 0.0248 0.0057 0.0016 0.0005
T0=2000 K 0.1286 0.0244 0.0053 0.0014 0.0004
T0=2500 K 0.1292 0.0242 0.0050 0.0013 0.0004
T0=3000 K 0.1296 0.0240 0.0049 0.0004 0.0003
T0=3500 K 0.1299 0.0240 0.0048 0.0011 0.0003
Table 6. Numerical values of the Pressure ratio at high temperature.
1 2 3 4 5 6
Mach number
0.0
0.1
0.2
0.3
0.4
0.5
0.6
4
32
1
Fig. 13. Variation of P/P0 versus Mach number.
www.intechopen.com
Effect of Stagnation Temperature on Supersonic Flow Parameters with Application for Air in Nozzles
437
A/A* M=2.00 M=3.00 M=4.00 M=5.00 M=6.00
PG (γ=1.402) 1.6859 4.2200 10.6470 24.7491 52.4769
T0=298.15 K 1.6859 4.2195 10.6444 24.7401 52.4516
T0=500 K 1.6916 4.2373 10.6895 24.8447 52.6735
T0=1000 K 1.7295 4.4739 11.3996 26.5019 56.1887
T0=1500 K 1.7582 4.7822 12.6397 29.7769 63.2133
T0=2000 K 1.7711 4.9930 13.8617 33.5860 72.0795
T0=2500 K 1.7795 5.1217 14.8227 37.2104 81.2941
T0=3000 K 1.7851 5.2091 15.5040 40.3844 90.4168
T0=3500 K 1.7889 5.2727 16.0098 43.0001 98.7953
Table 7. Numerical Values of the cross section area ratio at high temperature.
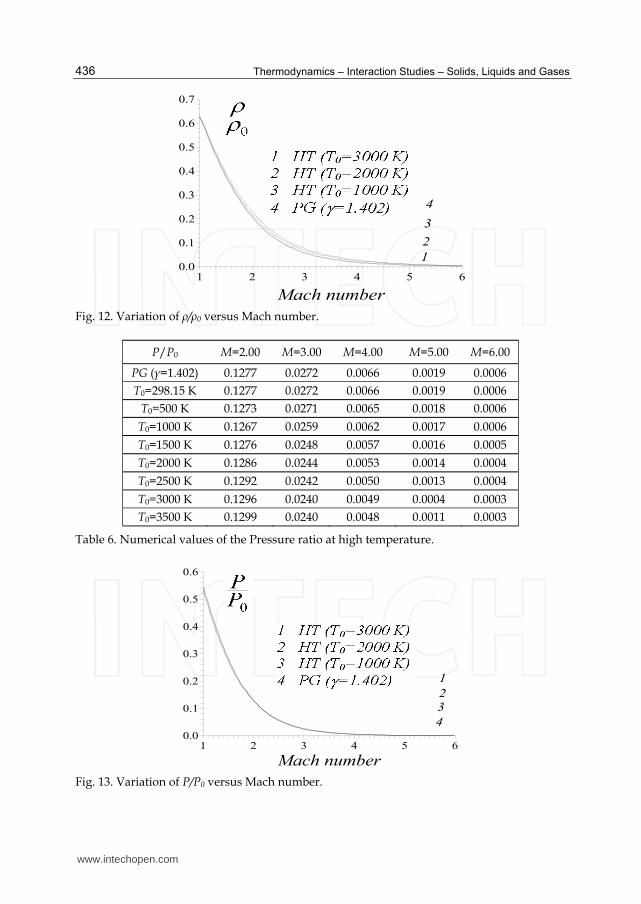
Figure 14 represent the variation of the critical cross-section area section ratio versus Mach
number at high temperature. For low values of Mach number and T0, the four curves fuses
and start to be differs when M>2.00. We can see that the curves 3 and 4 are almost
superposed for any value of T0. This result shows that the PG model can be used for
T0<1000 K.
Figure 15 presents the variation of the sound velocity ratio versus Mach number at high
temperature. T0 value influences on this parameter.
Figure 16 shows the variation of the thrust coefficient versus exit Mach number for various
values of T0. It can be seen the effect of T0 on this parameter. We can found that all the four
curves are almost confounded when ME<2.00 approximately. After this value, the curves
begin to separates progressively. The numerical values of the thrust coefficient are presented
in the table 9.
1 2 3 4 5 6
Mach number
0
10
20
30
40
50
60
70
80
90
1
2
3
4
Fig. 14. Variation of the critical cross-section area ratio versus Mach number.
www.intechopen.com

Thermodynamics – Interaction Studies – Solids, Liquids and Gases
438
a/a0 M=2.00 M=3.00 M=4.00 M=5.00 M=6.00
PG (γ=1.402) 0.7445 0.5966 0.4870 0.4074 0.3484
T0=298.15 K 0.7450 0.5970 0.4873 0.4076 0.3486
T0=500 K 0.7510 0.6019 0.4913 0.4110 0.3515
T0=1000 K 0.7739 0.6245 0.5103 0.4268 0.3651
T0=1500 K 0.7862 0.6408 0.5254 0.4398 0.3762
T0=2000 K 0.7923 0.6501 0.5354 0.4489 0.3841
T0=2500 K 0.7959 0.6556 0.5420 0.4553 0.3898
T0=3000 K 0.7985 0.6595 0.5465 0.4600 0.3942
T0=3500 K 0.7998 0.6618 0.5495 0.4632 0.3973
Table 8. Numerical values of the sound velocity ratio at high temperature.
1 2 3 4 5 6
Mach number
0.2
0.3
0.4
0.5
0.6
0.7
0.8
0.9
1.0
1.1
1
23
4
Fig. 15. Variation of the ratio of the velocity sound versus Mach number.
www.intechopen.com

Effect of Stagnation Temperature on Supersonic Flow Parameters with Application for Air in Nozzles
439
CF M=2.00 M=3.00 M=4.00 M=5.00 M=6.00
PG (γ=1.402) 1.2078 1.4519 1.5802 1.6523 1.6959
T0=298.15 K 1.2078 1.4518 1.5800 1.6521 1.6957
T0=500 K 1.2076 1.4519 1.5802 1.6523 1.6958
T0=1000 K 1.2072 1.4613 1.5919 1.6646 1.7085
T0=1500 K 1.2062 1.4748 1.6123 1.6871 1.7317
T0=2000 K 1.2048 1.4832 1.6288 1.7069 1.7527
T0=2500 K 1.2042 1.4879 1.6401 1.7221 1.7694
T0=3000 K 1.2038 1.4912 1.6479 1.7337 1.7828
T0=3500 K 1.2033 1.4936 1.6533 1.7422 1.7932
Table 9. Numerical values of the thrust coefficient at high temperature
1 2 3 4 5 6
Exit Mach number
0.0
0.5
1.0
1.5
2.0
43
2
1
Fig. 16. Variation of CF versus exit Mach number.
5.3 Results for the error given by the perfect gas model
Figure 17 presents the relative error of the thermodynamic and geometrical parameters
between the PG and the HT models for several T0 values.
It can be seen that the error depends on the values of T0 and M. For example, if T0=2000 K
and M=3.00, the use of the PG model will give a relative error equal to ε=14.27 % for the
temperatures ratio, ε=27.30 % for the density ratio, error ε=15.48 % for the critical sections
ratio and ε=2.11 % for the thrust coefficient. For lower values of M and T0, the error ε is
weak. The curve 3 in the figure 17 is under the error 5% independently of the Mach number,
which is interpreted by the use potential of the PG model when T0<1000 K.
We can deduce for the error given by the thrust coefficient that it is equal to ε=0.0 %, if
ME=2.00 approximately independently of T0. There is no intersection of the three curves in
the same time. When ME=2.00.
www.intechopen.com

Thermodynamics – Interaction Studies – Solids, Liquids and Gases
440
1 2 3 4 5 6
Mach number
5
10
15
20
1
2
3
(a)
1 2 3 4 5 6
Mach number
0
20
40
60
80
100
1
2
3
(b)
1 2 3 4 5 6
Mach number
0
10
20
30
40
50
1
2
3
(c)
1 2 3 4 5 6
Exit Mach number
0.0
0.5
1.0
1.5
2.0
2.5
3.0
3.5
4.0
4.5
5.0
3
2
11
2
3
(d)
Curve 1 Error compared to HT model for (T0=3000 K)
Curve 2 Error compared to HT model for (T0=2000 K) Curve 3 Error compared to HT model for (T0=1000 K) (a): Temperature ratio. (b): Density ratio. (c): Critical sections ratio. (d): Thrust coefficient.
Fig. 17. Variation of the relative error given by supersonic parameters of PG versus Mach number.
5.4 Results for the supersonic nozzle application
Figure 18 presents the variation of the Mach number through the nozzle for T0=1000 K, 2000 K and 3000 K, including the case of perfect gas presented by curve 4. The example is selected for MS=3.00 for the PG model. If T0 is taken into account, we will see a fall in Mach number of the dimensioned nozzle in comparison with the PG model. The more is the temperature T0, the more it is this fall. Consequently, the thermodynamics parameters force to design the nozzle with different dimensions than it is predicted by use the PG model. It should be noticed that the difference becomes considerable if the value T0 exceeds 1000 K. Figure 19 present the correction of the Mach number of nozzle giving exit Mach number MS, dimensioned on the basis of the PG model for various values of T0. One can see that the curves confound until Mach number MS=2.0 for the whole range of T0. From this value, the difference between the three curves 1, 2 and 3, start to increase. The curves 3 and 4 are almost confounded whatever the Mach number if the value of T0 is lower than 1000 K. For example, if the nozzle delivers a Mach number MS=3.00 at the exit section, on the assumption of the PG model, the HT model gives Mach number equal to MS=2.93, 2.84 and 2.81 for T0=1000 K, 2000 K and 3000 K respectively. The numerical values of the correction of the exit Mach number of the nozzle are presented in the table 10.
www.intechopen.com
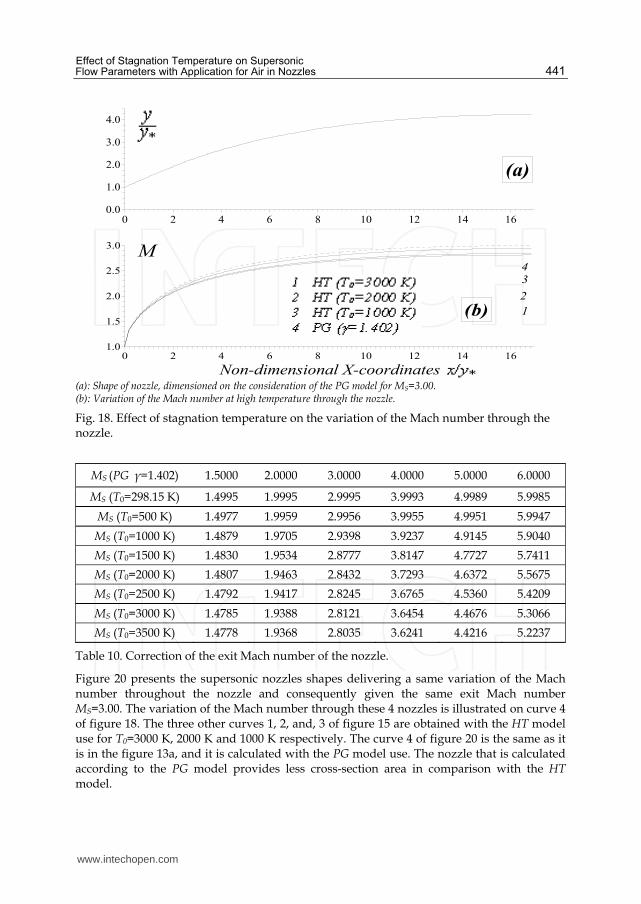
Effect of Stagnation Temperature on Supersonic Flow Parameters with Application for Air in Nozzles
441
0 2 4 6 8 10 12 14 160.0
1.0
2.0
3.0
4.0
(a)
0 2 4 6 8 10 12 14 16
Non-dimensional X-coordinates
1.0
1.5
2.0
2.5
3.0 M43
2
1(b)
(a): Shape of nozzle, dimensioned on the consideration of the PG model for MS=3.00. (b): Variation of the Mach number at high temperature through the nozzle.
Fig. 18. Effect of stagnation temperature on the variation of the Mach number through the nozzle.
MS (PG γ=1.402) 1.5000 2.0000 3.0000 4.0000 5.0000 6.0000
MS (T0=298.15 K) 1.4995 1.9995 2.9995 3.9993 4.9989 5.9985
MS (T0=500 K) 1.4977 1.9959 2.9956 3.9955 4.9951 5.9947
MS (T0=1000 K) 1.4879 1.9705 2.9398 3.9237 4.9145 5.9040
MS (T0=1500 K) 1.4830 1.9534 2.8777 3.8147 4.7727 5.7411
MS (T0=2000 K) 1.4807 1.9463 2.8432 3.7293 4.6372 5.5675
MS (T0=2500 K) 1.4792 1.9417 2.8245 3.6765 4.5360 5.4209
MS (T0=3000 K) 1.4785 1.9388 2.8121 3.6454 4.4676 5.3066
MS (T0=3500 K) 1.4778 1.9368 2.8035 3.6241 4.4216 5.2237
Table 10. Correction of the exit Mach number of the nozzle.
Figure 20 presents the supersonic nozzles shapes delivering a same variation of the Mach number throughout the nozzle and consequently given the same exit Mach number MS=3.00. The variation of the Mach number through these 4 nozzles is illustrated on curve 4 of figure 18. The three other curves 1, 2, and, 3 of figure 15 are obtained with the HT model use for T0=3000 K, 2000 K and 1000 K respectively. The curve 4 of figure 20 is the same as it is in the figure 13a, and it is calculated with the PG model use. The nozzle that is calculated according to the PG model provides less cross-section area in comparison with the HT model.
www.intechopen.com

Thermodynamics – Interaction Studies – Solids, Liquids and Gases
442
1 2 3 4 5 6
Mach number for Perfect Gas
0
1
2
3
4
5
6M (HT)
1
234
Fig. 19. Correction of the Mach number at High Temperature of a nozzle dimensioned on the perfect gas model.
0 2 4 6 8 10 12 14 16
Non-dimensional X-coordinates
0.0
1.0
2.0
3.0
4.0
5.0
4
3
21
Fig. 20. Shapes of nozzles at high temperature corresponding to same Mach number variation througout the nozzle and given MS=3.00 at the exit.
6. Conclusion
From this study, we can quote the following points: If we accept an error lower than 5%, we can study a supersonic flow using a perfect gas
relations, if the stagnation temperature T0 is lower than 1000 K for any value of Mach
number, or when the Mach number is lower than 2.0 for any value of T0 up to
approximately 3000 K.
The PG model is represented by an explicit and simple relations, and do not request a high
time to make calculation, unlike the proposed model, which requires the resolution of a
nonlinear algebraic equations, and integration of two complex analytical functions. It takes
more time for calculation and for data processing.
The basic variable for our model is the temperature and for the PG model is the Mach number because of a nonlinear implicit equation connecting the parameters T and M.
www.intechopen.com

Effect of Stagnation Temperature on Supersonic Flow Parameters with Application for Air in Nozzles
443
The relations presented in this study are valid for any interpolation chosen for the function
CP(T). The essential one is that the selected interpolation gives small error.
We can choose another substance instead of the air. The relations remain valid, except that it is necessary to have the table of variation of CP and γ according to the temperature and to make a suitable interpolation. The cross section area ratio presented by the relation (19) can be used as a source of
comparison for verification of the dimensions calculation of various supersonic nozzles. It provides a
uniform and parallel flow at the exit section by the method of characteristics and the Prandtl
Meyer function (Zebbiche & Youbi, 2005a, 2005b, Zebbiche, 2007, Zebbiche, 2010a &
Zebbiche, 2010b). The thermodynamic ratios can be used to determine the design
parameters of the various shapes of nozzles under the basis of the HT model.
We can obtain the relations of a perfect gas starting from the relations of our model by
annulling all constants of interpolation except the first. In this case, the PG model becomes a
particular case of our model.
7. Acknowledgment
The author acknowledges Djamel, Khaoula, Abdelghani Amine, Ritadj Zebbiche and
Fettoum Mebrek for granting time to prepare this manuscript.
8. References
Anderson J. D. Jr.. (1982), Modern Compressible Flow. With Historical Perspective, (2nd edition), Mc Graw-Hill Book Company, ISBN 0-07-001673-9. New York, USA.
Anderson J. D. Jr. (1988), Fundamentals of Aerodynamics, (2nd edition), Mc Graw-Hill Book Company, ISBN 0-07-001656-9, New York, USA.
Démidovitch B. et Maron I. (1987), Eléments de calcul numérique, Editions MIR, ISBN 978-2-7298-9461-0, Moscou, USSR.
Fletcher C. A. J. (1988), Computational Techniques for Fluid Dynamics: Specific Techniques for Different Flow Categories, Vol. II, Springer Verlag, ISBN 0-387-18759-6, Berlin, Heidelberg.
Moran M. J., (2007). Fundamentals of Engineering Thermodynamics, John Wiley & Sons Inc., 6th Edition, ISBN 978-8-0471787358, USA
Oosthuisen P. H. & Carscallen W. E., (1997), Compressible Fluid Flow. Mc Grw-Hill, ISBN 0-07-0158752-9, New York, USA.
Peterson C.R. & Hill P. G. (1965), Mechanics and Thermodynamics of Propulsion, Addition-Wesley Publishing Company Inc., ISBN 0-201-02838-7, New York, USA.
Ralston A. & Rabinowitz P. A. (1985). A First Course in Numerical Analysis. (2nd Edition), McGraw-Hill Book Company, ISBN 0-07-051158-6, New York, USA.
Ryhming I. L. (1984), Dynamique des fluides, Presses Polytechniques Romandes, Lausanne, ISBN 2-88074-224-2, Suisse.
Zebbiche T. (2007). Stagnation Temperature Effect on the Prandtl Meyer Function. AIAA Journal, Vol. 45 N° 04, PP. 952-954, April 2007, ISSN 0001-1452, USA
Zebbiche T. & Youbi Z. (2005a). Supersonic Flow Parameters at High Temperature. Application for Air in nozzles. German Aerospace Congress 2005, DGLR-2005-0256, 26-29 Sep. 2005, ISBN 978-3-8322-7492-4, Friendrichshafen, Germany.
www.intechopen.com
Thermodynamics – Interaction Studies – Solids, Liquids and Gases
444
Zebbiche T. & Youbi Z., (2005b). Supersonic Two-Dimensional Minimum Length Nozzle Conception. Application for Air. German Aerospace Congress 2005, DGLR-2005-0257, 26-29 Sep. 2005, ISBN 978-3-8322-7492-4, Friendrichshafen, Germany.
Zebbiche T. & Youbi Z. (2006), Supersonic Plug Nozzle Design at High Temperature. Application for Air, AIAA Paper 2006-0592, 44th AIAA Aerospace Sciences Meeting and Exhibit, 9-12 Jan. 2006, ISBN 978-1-56347-893-2, Reno Nevada, Hilton, USA.
Zebbiche T., (2010a). Supersonic Axisymetric Minimum Length Conception at High Temperature with Application for Air. Journal of British Interplanetary Society (JBIS), Vol. 63, N° 04-05, PP. 171-192, May-June 2010, ISBN 0007-084X, 2010.
Zebbiche T., (2010b). Tuyères Supersoniques à Haute Température. Editions Universitaires Européennes. ISBN 978-613-1-50997-1, Dudweiler Landstrabe, Sarrebruck, Germany.
Zuker R. D. & Bilbarz O. (2002). Fundamentals of Gas Dynamics, John Wiley & Sons. ISBN 0-471-05967-6, New York, USA
www.intechopen.com

Thermodynamics - Interaction Studies - Solids, Liquids and GasesEdited by Dr. Juan Carlos Moreno Piraján
ISBN 978-953-307-563-1Hard cover, 918 pagesPublisher InTechPublished online 02, November, 2011Published in print edition November, 2011
InTech EuropeUniversity Campus STeP Ri Slavka Krautzeka 83/A 51000 Rijeka, Croatia Phone: +385 (51) 770 447 Fax: +385 (51) 686 166www.intechopen.com
InTech ChinaUnit 405, Office Block, Hotel Equatorial Shanghai No.65, Yan An Road (West), Shanghai, 200040, China Phone: +86-21-62489820 Fax: +86-21-62489821
Thermodynamics is one of the most exciting branches of physical chemistry which has greatly contributed tothe modern science. Being concentrated on a wide range of applications of thermodynamics, this book gathersa series of contributions by the finest scientists in the world, gathered in an orderly manner. It can be used inpost-graduate courses for students and as a reference book, as it is written in a language pleasing to thereader. It can also serve as a reference material for researchers to whom the thermodynamics is one of thearea of interest.
How to referenceIn order to correctly reference this scholarly work, feel free to copy and paste the following:
Toufik Zebbiche (2011). Effect of Stagnation Temperature on Supersonic Flow Parameters with Application forAir in Nozzles, Thermodynamics - Interaction Studies - Solids, Liquids and Gases, Dr. Juan Carlos MorenoPiraján (Ed.), ISBN: 978-953-307-563-1, InTech, Available from:http://www.intechopen.com/books/thermodynamics-interaction-studies-solids-liquids-and-gases/effect-of-stagnation-temperature-on-supersonic-flow-parameters-with-application-for-air-in-nozzles

![New *Abdelkader Noui , Toufik Karech and Tayeb Bouzid3) · 2018. 8. 19. · shallow foundation resting on liquefiable soil of Boudouaou [Boumerdes-Algeria] (Bouafia 2014) with and](https://cdn.vdocument.in/doc/165x107/606d168e81832a32d404916a/new-abdelkader-noui-toufik-karech-and-tayeb-bouzid3-2018-8-19-shallow-foundation.jpg)


![Toufik Ayoub, Leila Cohenengineering.nyu.edu/mechatronics/smart/pdf... · Microsoft PowerPoint - Ppt0000001.ppt [Compatibility Mode] Author: MELAB Created Date: 1/28/2010 2:24:07](https://cdn.vdocument.in/doc/165x107/5f3e1fbc0e573906315300ab/toufik-ayoub-leila-microsoft-powerpoint-ppt0000001ppt-compatibility-mode-author.jpg)

