
141
8.7. Solid – liquid extraction
8.7.1. Theoretical background
Solid – liquid extraction (or leaching) is the separation of a solid solute from a
mixture of solids by dissolving it in a liquid phase. Basically, there are three com-
ponents in leaching: solid solute, insoluble solids and solvent. In most cases, the
diffusion of intra-particle soluble component(s) controls the extraction rate. There-
fore the process is often called as diffusion extraction.
Solid – liquid extraction is widely used in food (e.g. extraction of sugar from sug-
ar cane or sugar beet; isolation of vegetable oils from different seeds) and pharma-
ceutical industries (e.g. extraction of active components from medicinal plants),
and in hydrometallurgy (e.g. leaching of metal ions from ores).
For mathematical modeling of leaching an ideal solid – liquid extraction is de-
fined. The solvent added to the dry raw material is partly taken up by the solid ma-
terial and the soluble ingredients are instantaneously dissolved. Often all the so-
lute is already dissolved (e.g. sugar in sugar beet). The solution is then split into
two parts. The external solution is called extract and the internal one raffinate (in
the case of plant materials this is cell liquor).
The simplifying assumptions are defined as follows:
1. For batch extraction the mass ratio of extract (B) and raffinate (A) does not
change during extraction (liquid ratio: f B A =constant). In a continuous
system the mass flow rate ratio of extract and raffinate remains constant
throughout the equipment.
2. The densities of solutions remain practically constant during extraction.
3. The solid matrix has no absorptive properties. Hence, after infinite time the
concentrations in the extract and raffinate phases are the same.
4. The surface of solid material available for mass transfer does not change with
time.
5. The concentration of the raffinate (cell liquor) is initially the same throughout
the solid matrix: x0 (kg solute/ kg raffinate).
6. The solid phase consists of regular particles of the same shape and size: plates
(leaves of plants), infinitely long cylinders (e.g. stems), or spheres (e.g. ground
plant material). The shape and size of particles does not change during extrac-
tion.

142
7. The interior of the solid matrix is isotropic in all direction of diffusion, thus a
constant „apparent or effective” diffusion coefficient ( Deff
) can be defined for
the given material.
8. In a batch system the extract phase is mixed, hence, the concentration gradient
is zero in every direction in the system. If the extract is circulated or continuous
system is used this gradient is zero in the direction perpendicular to the fluid
flow.
For the calculation of any of the operations mentioned we may start from Fick’s
equation of diffusion.
8.7.1.1. Batch operation mode
If the diffusion coefficient ( Deff
) of the solutes inside the solid particles can be
considered as constant, Fick’s second law may be written as
Dx
r
C
r
x
r
x
teff
2
2
1
(8.7-1)
Where x concentration of raffinate (kg/kg),
r coordinate relative to the axis of symmetry (m),
t time (s),
C factor of geometrical symmetry ( C =1 for plates/planes, C =2 for cyl-
inders, C =3 for spheres).
The surface to volume ratio of particles can be expressed as:
F
V
C
R
p
p
(8.7-2)
Where p
F surface of particle (m2),
p
V volume of particle (m3),
R half thickness or half diameter of solid particles (m).
The boundary conditions:
1. At the phase boundary the concentration in the raffinate phase is equal to con-
centration of the extract phase, since the resistance of mass transfer in the ex-
tract phase may be neglected (the mass transfer coefficient in the extract phase
is much more higher than that in raffinate phase).
x r R t y t , (8.7-3)

143
2. The second boundary condition at 0r arises from the symmetry of particles.
The concentration passes through a maximum at symmetric plane, axis or
point.
dx
drr
0
0 (8.7-4)
8.7.1.2. Solute balance for batch operation
Ax By Ax By0 0 (8.7-5)
Where x0 initial concentration of cell liquor (kg/kg),
y0 initial concentration of solvent (kg/kg),
x mean solute concentration inside the particles (kg/kg).
For infinite time the concentrations in both phases become identical.
y xx fy
f
0
1 (8.7-6)
The mass transferred at the phase boundary can be given by the Fick’s first law
Bdy
dtD F
dx
dreff A
r R
(8.7-7)
where A
density of raffinate (kg/m3).
Figure 8.7-1.
The concentration profile of solute inside the particle and in extract phase
The surface through which the diffusion occurs
extract raffinate
distance
144
F FC
RV
p p (8.7-8)
where liquid hold-up inside the particles (m3/m
3):
A
VA p
(8.7-9)
substituting into equation (8.7-8) gives
FAC
RA
(8.7-10)
From equations (8.7-3), (8.7-7) and (8.7-10) we obtain
fR
CD
x
t
x
reff r R r R
(8.7-11)
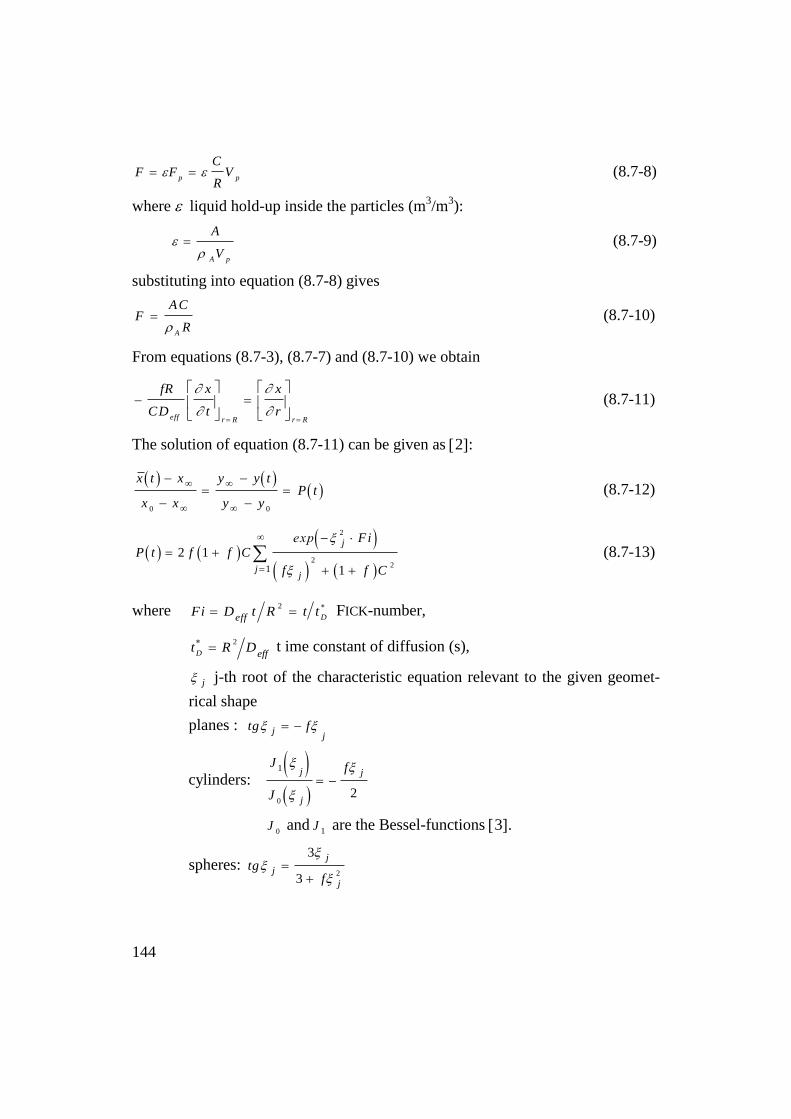
The solution of equation (8.7-11) can be given as 2:
x t x
x x
y y t
y yP t
0 0
(8.7-12)
P t f f C
Fi
f f C
j
jj
2 1
1
2
22
1
exp
(8.7-13)
where Fi D t R t teff D
2 FICK-number,
effDRt
D
2
t ime constant of diffusion (s),
j j-th root of the characteristic equation relevant to the given geomet-
rical shape
planes : tg fjj
cylinders:
J
J
fj
j
j1
02
J0 and J 1
are the Bessel-functions 3.
spheres: tgf
j
j
j
3
32

145
The values of y y t
y y
0
term as a function of Fick-number for spherical particles
are presented in Figure 8.7-2.
Figure 8.7-2.
Batch extraction of spherical particles
P(t)
Fi
P ty y t
y y
0
Fit
tD
*
146
The expressions for the concentration in a continuous countercurrent operation
are formally very similar to batch extraction. The relative loss of solute 0
x
xn
(where n
x is the solute concentration in the solid phase leaving the extractor) is
plotted versus the Fick-number in Figure 8.7-3. For continuous system the Fick-
number is defined as 2R/tDFi
eff , where t is the mean residence time of solid
material (assuming plug flow). The time constant of diffusion (eff
DRtD
2
) is
the same for both batch and continuous operations. It includes the characteristics
of solid – liquid system (material properties, structures). It is independent of time,
liquid – solid ratio, and is only slightly affected by the flow characteristics. Hence,
Dt can be determined from simple batch experiment, and it can be used for design
of continuous extraction unit.

147
Figure 8.7-3. Continuous extraction of spherical particles
Fi

148
8.7.2. Objectives
Laboratory batch extraction is carried out to determine the time constant of diffu-
sion effD
DRt2
. From the experimental t
D
value the effective diffusion coef-
ficient (eff
D ) can be calculated, if the geometry and size of the particles are
known.
8.7.3. Equipment
The experimental set-up is presented in Figure 8.7-4.
Figure 8.7-4.
1. Thermostated extraction column
2. Vessel for solvent feed
3. Conductivity cell
4. Connection to conductivity meter
5. Three-way cock
6. Thee-way cock
7. Throttle valve
8. Liquid level
9. Pump
10. Rotameter
11. Liquid inflow
Figure 8.7-4.
Flow diagram of a laboratory solid – liquid extractor
149
The thermostated extraction column (1) is filled with porous Al O2 3
tablets,
which are saturated with NaCl solution. The diameter of the tablets is 8 mm (R =
4 mm), and they are approximated as spheres. The inner diameter of the column is
40 mm, The height of the column is 500 mm, and the packed height is 400 mm.
The solvent is circulated with a gear pump (9). The liquid flow rate is measured by
a rotameter (10), which is calibrated with water (unit is dm3/h). The flow rate can
be controlled by throttle valve (7). The concentration of extract is measured by
conductivity meter (4).
8.7.4. Experimental procedure
The previous group filled the extractor tube with NaCl solution, so that the tablets
were soaked for one day or more. The mass values of dry and soaked tablets are
given at the notice board near to the extraction unit. The NaCl solution is dis-
charged from the extractor column, and the initial concentration is determined by
measurement of conductivity. The surface of tablets is wetted with concentrated
NaCl solution, which should be rinsed with about 100 ml distilled water.
The conductivity cell is put into the holder. The calibrated solvent vessel is
filled with distilled water. The operation of gear pump should be checked by mov-
ing the belt by hand. The proper positions of three-way cocks (presented on notice
board) should be checked before filling the extractor. Any mistake may result that
the measurement can not be carried out the same day.
The extractor is filled with distilled water. The gear pump is started, and the
flow rate will be given by the instructor. The extraction starts with the circulation
of liquid. The extract concentration is read at certain time intervals (every 2
minutes between 0 – 20 min; every 5 minutes between 20 – 50 min; and every 10
minutes until the end of measurement).
The readings are taken till the concentration becomes stable and steady. The to-
tal extraction time is about 90…120 min, depending on liquid flow rate and tem-
perature. After steady concentration is reached, the pump is stopped and the appa-
ratus is emptied. The system is washed with distilled water by circulation in the
apparatus for some minutes. Then the washing liquid is discharged and the extrac-
tion column is filled with NaCl solution to be prepared for the next experiment.
The filling of pump or circulation tube with NaCl solution should be avoided.

150
8.7.5. Data analysis
The extract concentration ( y ) can be read directly from the conductivity meter.
The density of the sodium chloride solution can be taken as 1 g/cm3-nek through-
out. The measured y
value is the last reading. The measured final extract con-
centration should be compared with that calculated from the component balance
equation (8.7-6).
Plot the extract concentrations against time ( y - t diagram). Plot the calculated
time constant of diffusion versus time (
Dt - t diagram), and determine the mean
value in the range where it is really constant. Calculate the effective diffusion co-
efficient from the mean value of
Dt (please note, that 4R mm). Compare the
effective diffusion coefficient with the molecular diffusion coefficient of NaCl,
measured in pure water at 20 °C (D = scm1039125
. ).
The following Table should be completed and attached to the report:
Dry mass of tablets: g
Mass of tablets saturated with NaCl: g
Mass of raffinate (A): g
Mass of extract (B): g
Phase ratio ( ABf ):
Rotameter scale: dm3/h
Temperature: °C
Initial concentration of raffinate ( x0): g/kg
Measured final extract concentration y
: g/kg
Calculated final extract concentration (Eq. 8.7-6) y
: g/kg
D Deff :
Set up a Table with the headings for determination of the time constant (
Dt )!
Time
(min)
y
g
kg
y y
y
Fi
tD
(min)

151
8.7.6. Design of continuous extraction
On the basis of batch experiment the mean residence time in a continuous ex-
traction unit can be designed. The steady value of
Dt is determined from batch
laboratory experiment. The relative loss and extract concentration are given by the
instructor. If neat solvent ( y0
0 ) is used for extraction, the phase rate ratio can
be calculated from the material balance of continuous extraction
outoutyfxx
0 (8.7-14)
where outy and outx are the outlet concentrations in the extract and raffinate, re-
spectively. The Fick-number can be read in Figure 8.7-3.
The results should be summarized in the following Table:
Given Determined
Relative loss ( 0xxout ): Phase flow rate ratio (f):
Relative extract concentration (0
x/y out ): Fick - number ( t textr D
):
Time constant of diffusion (
Dt ) Mean extraction time ( t ):
References
1 Fourier, J. B. J.: Théorie analytique de la chaleur, 1808.
2 Akszelrud, G. A.: Zsurnal Fizicseszkoj Himii, 33, 2316 (1959)
3 Crank J.: The mathematics of diffusion, Clarendon Press, Oxford, 1956.


