
A better approach to investingin an uncertain world
Montgomery Global Investment Management
Montgomery
Global FundChristopher DemasiPortfolio Manager

The times of “easy money” are behind us
Last 30 years
Interest rates Declining
Profit margins Increasing
Debt levels Increasing
Demographics More favourable
Equity returns ~9% p.a. (~3% p.a. above average)*
Future equity returns are likely to be lower than in the past
*Source: McKinsey Global Institute 2

The times of “easy money” are behind us
Last 30 years Next 30 years
Interest rates Declining Flat/increasing
Profit margins Increasing Flat/declining
Debt levels Increasing Deleveraging?
Demographics More favourable Less favourable
Equity returns ~9% p.a. (~3% p.a. above average)* ?
Future equity returns are likely to be lower than in the past
*Source: McKinsey Global Institute 3

We are living in extremely uncertain times
Global equity markets have rallied 25% from their 2016 lows amid heightened uncertainty
Source: Bloomberg
1,400
1,450
1,500
1,550
1,600
1,650
1,700
1,750
1,800
1,850
1,900
MSCI World Index since 1 January 2016
4

The most important things for investors today
1. Downside protection • Capital preservation primary concern• Market downturns• Currency risks
2. Alpha generation • Relatively larger share of total return• Broad and diverse opportunity set• Flexibility: all-cap, sector, geography, long/short• Active management
3. Low correlation • Independent of markets• Complementary to other managers
Investors require a unique investment approach
5

Montaka’s unique approach
ImplicationsAssets Funding
Long(15-30 stocks)
Short(25-40 stocks)
Cash
Client NAV
• Company-specific, bottom-up approach to value-investing:− High-quality
businesses− Attractive prospects− Acquired at discount
to intrinsic value
• Nature-specific approach to short portfolio management:− Thematics/structural
declines− Divergent expectations− Asymmetries− Misperceptions
• Variable net exposure:− Driven primarily by availability of bottom-
up long and short opportunities− Informed by top-down systematic process− Typically 30-70%
6
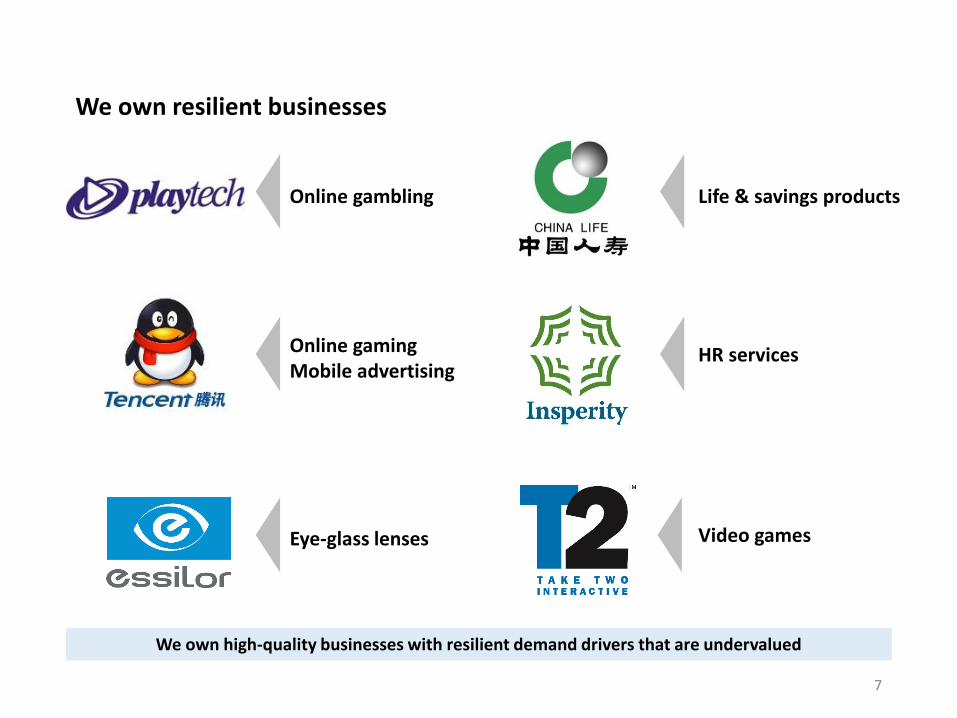
We own resilient businesses
Implications
Online gambling Life & savings products
HR services
Eye-glass lenses
Online gaming Mobile advertising
Video games
We own high-quality businesses with resilient demand drivers that are undervalued
7
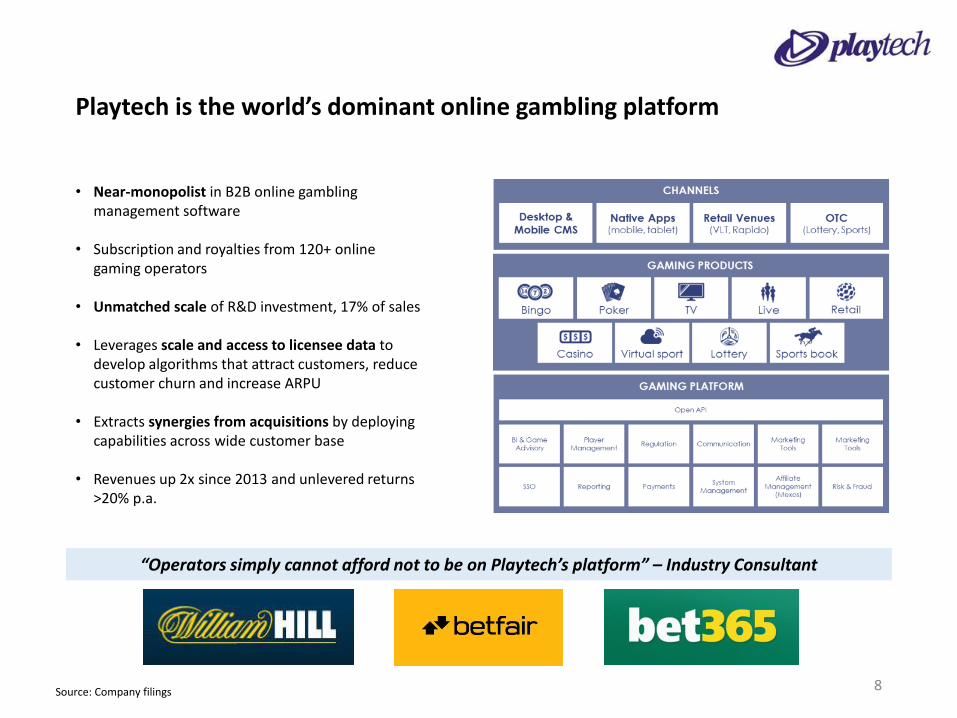
Playtech is the world’s dominant online gambling platform
• Near-monopolist in B2B online gambling management software
• Subscription and royalties from 120+ online gaming operators
• Unmatched scale of R&D investment, 17% of sales
• Leverages scale and access to licensee data to develop algorithms that attract customers, reduce customer churn and increase ARPU
• Extracts synergies from acquisitions by deploying capabilities across wide customer base
• Revenues up 2x since 2013 and unlevered returns >20% p.a.
“Operators simply cannot afford not to be on Playtech’s platform” – Industry Consultant
8Source: Company filings

Resilient fundamentals drive Playtech’s growth
• Global gambling revenues are highly stable and continued to grow during the Great Recession
• Online gambling represents only ~10% of total gambling revenues globally
• Online gambling market growing >10% p.a. as gamblers move online and to mobile
• Playtech’s take rate increasing, up 3x in last decade but still <2%
In the face of global uncertainty online gambling revenues are growing reliably with a long runway
9Source: Company filings; Morgan Stanley; Statista

Playtech’s share price has followed its growth trend upwards
0
100
200
300
400
500
600
700
800
200
300
400
500
600
700
800
900
1,000
Jan-12 Jan-13 Jan-14 Jan-15 Jan-16 Jan-17
Playtech share price and LTM revenues
Share price (GBp) Sales (GBPm)
10Source: Company filings; Bloomberg
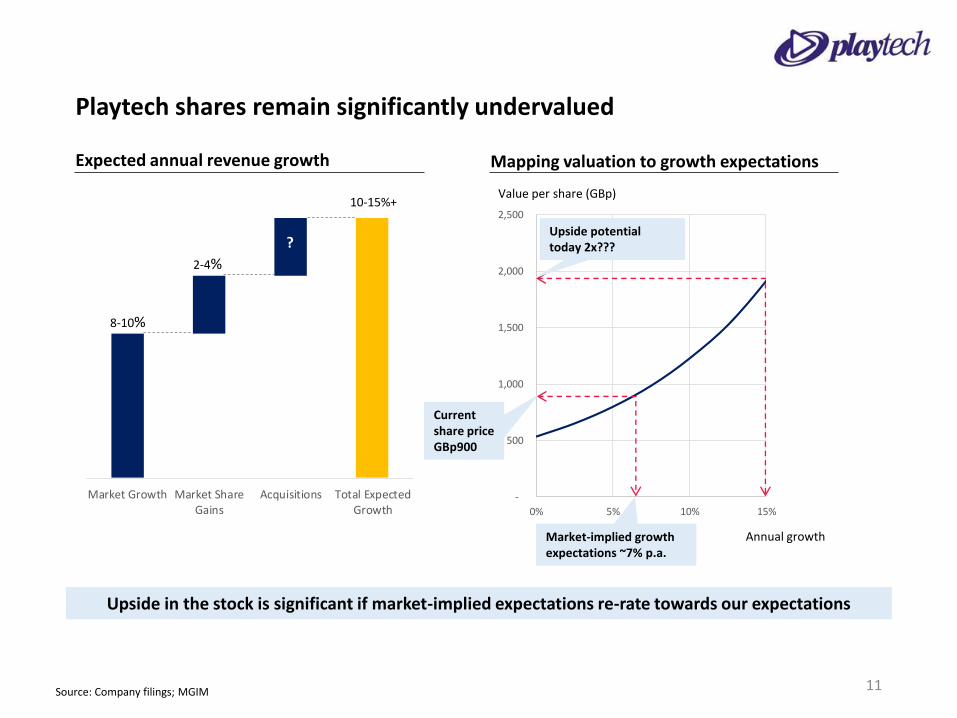
Playtech shares remain significantly undervalued
Expected annual revenue growth
Market Growth Market ShareGains
Acquisitions Total ExpectedGrowth
Mapping valuation to growth expectations
-
500
1,000
1,500
2,000
2,500
0% 5% 10% 15%
Market-implied growth expectations ~7% p.a.
Current share price GBp900
Upside potential today 2x???
8-10%
2-4%
?
10-15%+Value per share (GBp)
Annual growth
Upside in the stock is significant if market-implied expectations re-rate towards our expectations
11Source: Company filings; MGIM
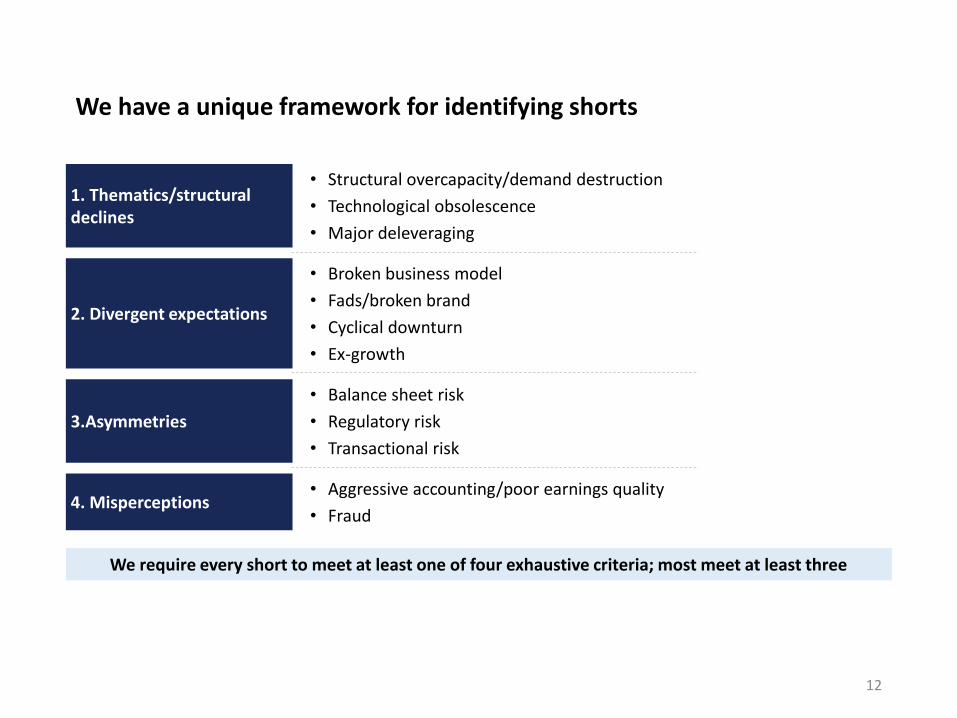
We have a unique framework for identifying shorts
1. Thematics/structural declines
• Structural overcapacity/demand destruction
• Technological obsolescence
• Major deleveraging
2. Divergent expectations
• Broken business model
• Fads/broken brand
• Cyclical downturn
• Ex-growth
3.Asymmetries
• Balance sheet risk
• Regulatory risk
• Transactional risk
4. Misperceptions• Aggressive accounting/poor earnings quality
• Fraud
We require every short to meet at least one of four exhaustive criteria; most meet at least three
12
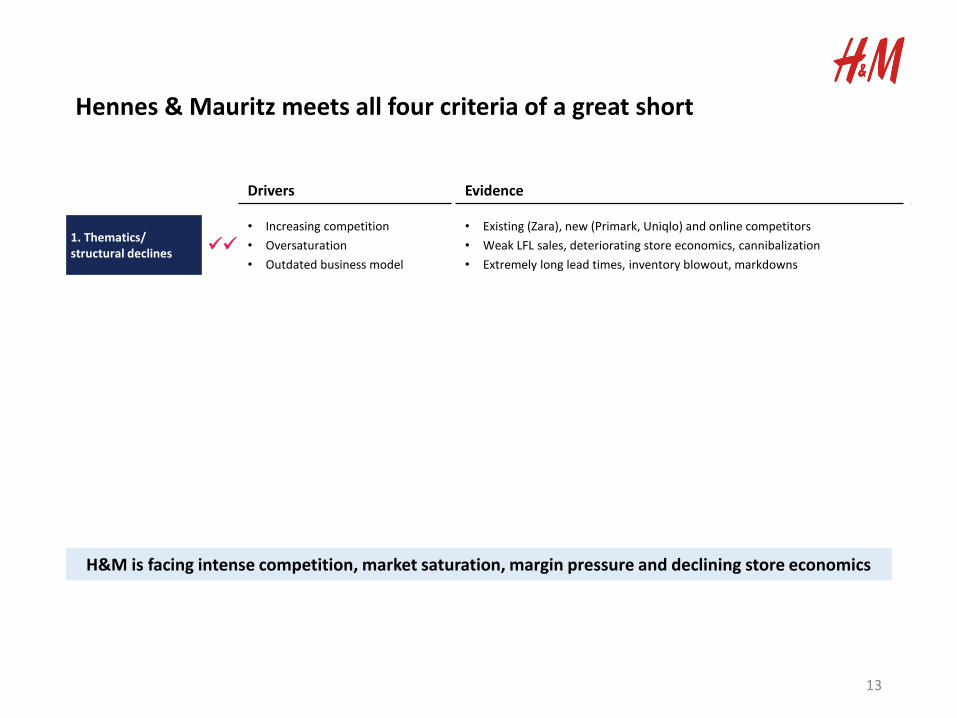
Hennes & Mauritz meets all four criteria of a great short
Drivers Evidence
1. Thematics/ structural declines
• Increasing competition
• Oversaturation
• Outdated business model
• Existing (Zara), new (Primark, Uniqlo) and online competitors
• Weak LFL sales, deteriorating store economics, cannibalization
• Extremely long lead times, inventory blowout, markdowns
H&M is facing intense competition, market saturation, margin pressure and declining store economics
13
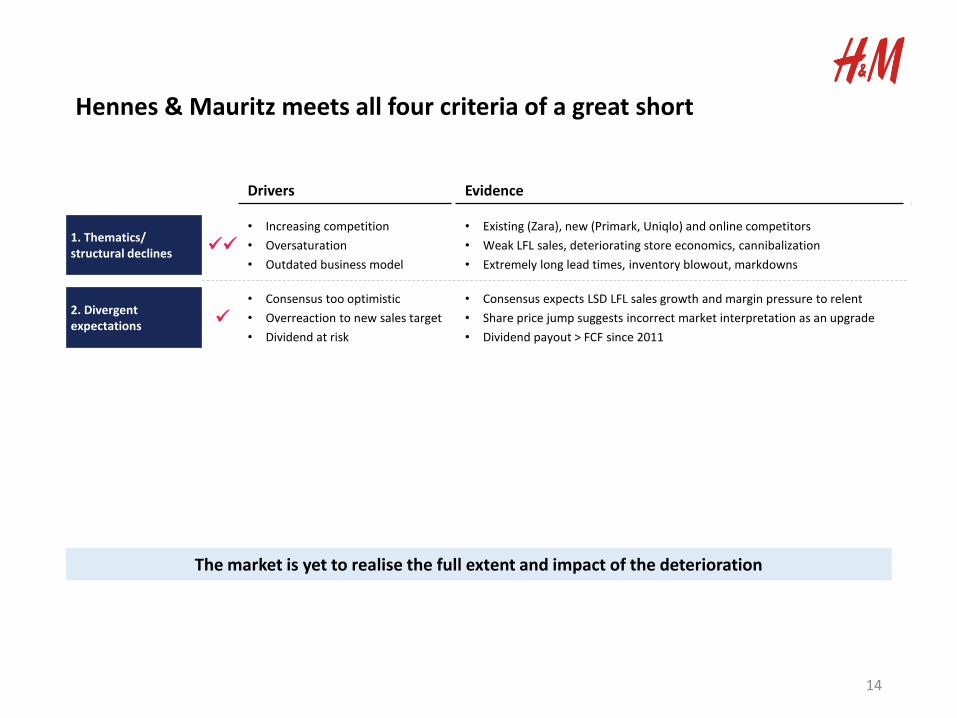
Hennes & Mauritz meets all four criteria of a great short
Drivers Evidence
1. Thematics/ structural declines
• Increasing competition
• Oversaturation
• Outdated business model
• Existing (Zara), new (Primark, Uniqlo) and online competitors
• Weak LFL sales, deteriorating store economics, cannibalization
• Extremely long lead times, inventory blowout, markdowns
2. Divergent expectations
• Consensus too optimistic
• Overreaction to new sales target
• Dividend at risk
• Consensus expects LSD LFL sales growth and margin pressure to relent
• Share price jump suggests incorrect market interpretation as an upgrade
• Dividend payout > FCF since 2011
The market is yet to realise the full extent and impact of the deterioration
14
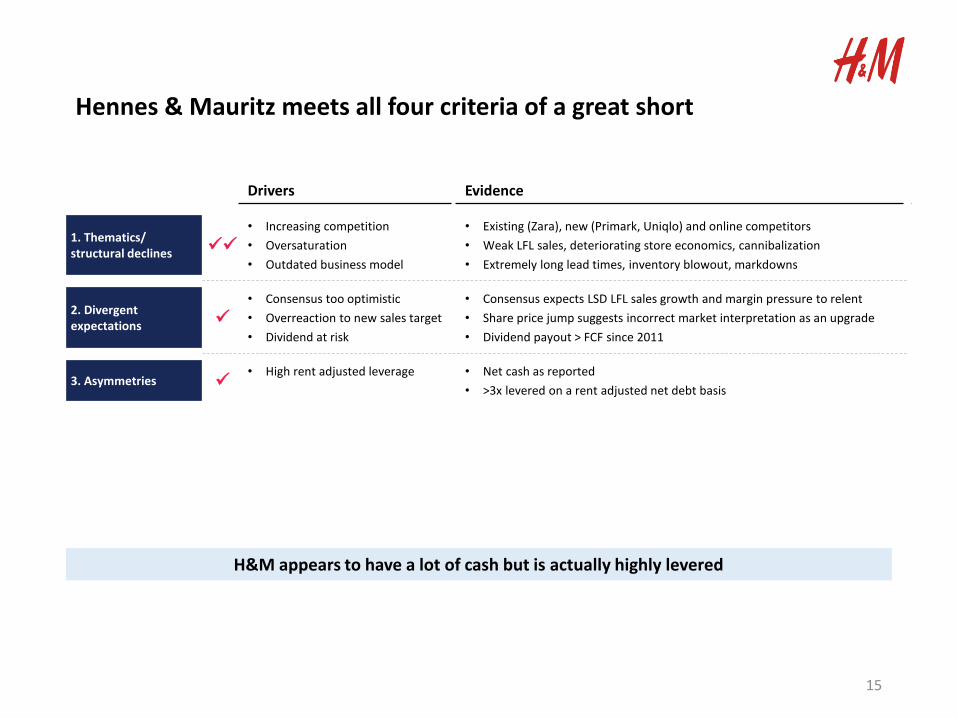
Hennes & Mauritz meets all four criteria of a great short
Drivers Evidence
1. Thematics/ structural declines
• Increasing competition
• Oversaturation
• Outdated business model
• Existing (Zara), new (Primark, Uniqlo) and online competitors
• Weak LFL sales, deteriorating store economics, cannibalization
• Extremely long lead times, inventory blowout, markdowns
2. Divergent expectations
• Consensus too optimistic
• Overreaction to new sales target
• Dividend at risk
• Consensus expects LSD LFL sales growth and margin pressure to relent
• Share price jump suggests incorrect market interpretation as an upgrade
• Dividend payout > FCF since 2011
3. Asymmetries • High rent adjusted leverage • Net cash as reported
• >3x levered on a rent adjusted net debt basis
H&M appears to have a lot of cash but is actually highly levered
15

Hennes & Mauritz meets all four criteria of a great short
Drivers Evidence
1. Thematics/ structural declines
• Increasing competition
• Oversaturation
• Outdated business model
• Existing (Zara), new (Primark, Uniqlo) and online competitors
• Weak LFL sales, deteriorating store economics, cannibalization
• Extremely long lead times, inventory blowout, markdowns
2. Divergent expectations
• Consensus too optimistic
• Overreaction to new sales target
• Dividend at risk
• Consensus expects LSD LFL sales growth and margin pressure to relent
• Share price jump suggests incorrect market interpretation as an upgrade
• Dividend payout > FCF since 2011
3. Asymmetries • High rent adjusted leverage • Net cash as reported
• >3x levered on a rent adjusted net debt basis
4. Misperceptions
• Aggressive store rollout
• Weak LFL sales and declining profit density masked
• Online sales unprofitable
• >90% of sales growth from new selling space vs LFL sales since 2007
• Operating profit gains driven by selling space growth > decline in profit/m2
• Online sales are likely cannibalizing in-store sales while requiring additional expense and investment
H&M’s aggressive store rollout and online expansion is masking the true economics of the business
16

H&M’s misperceived growth is slowly being uncovered
100
150
200
250
300
350
400
Hennes & Mauritz share price (SEK)
We believe there is much more downside to come
17Source: Bloomberg

We manage currency exposure to maximize global purchasing power
(20%) (10%) 0% 10% 20% 30% 40%
LATAM
Australia
Japan
China
EU
UK
US
Short Long
Currency exposure (look-through earnings basis)
% of net asset value
= net exposure
GBP exposure hedged ahead of Brexit
EUR exposure hedged ahead of Italian Referendum
We protected investor capital by actively hedging currencies ahead of extreme macro/political events
1.20
1.25
1.30
1.35
1.40
1.45
1.50
Apr-16 May-16 Jun-16 Jul-16 Aug-16 Sep-16
GBP in USD
1.00
1.02
1.04
1.06
1.08
1.10
1.12
1.14
Jul-16 Aug-16 Sep-16 Oct-16 Nov-16 Dec-16
EUR in USD
18Source: MGIM; Bloomberg
Note: currency exposure of investments based on month-end February 2017
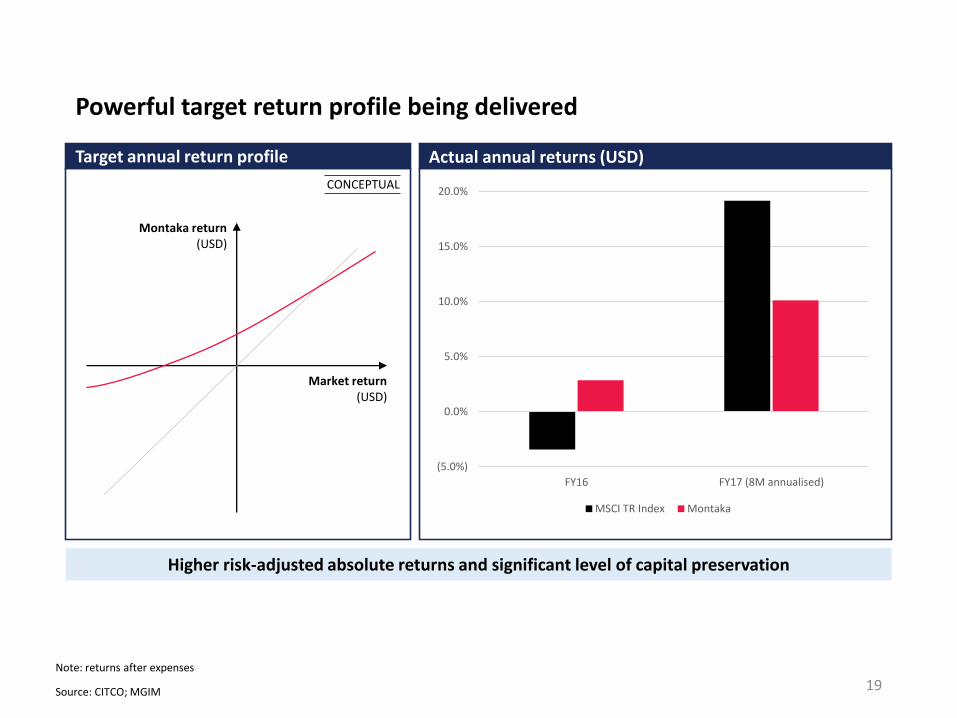
Powerful target return profile being delivered
Higher risk-adjusted absolute returns and significant level of capital preservation
(5.0%)
0.0%
5.0%
10.0%
15.0%
20.0%
FY16 FY17 (8M annualised)
MSCI TR Index Montaka
Target annual return profile Actual annual returns (USD)
Market return(USD)
Montaka return(USD)
CONCEPTUAL
19Source: CITCO; MGIM
Note: returns after expenses
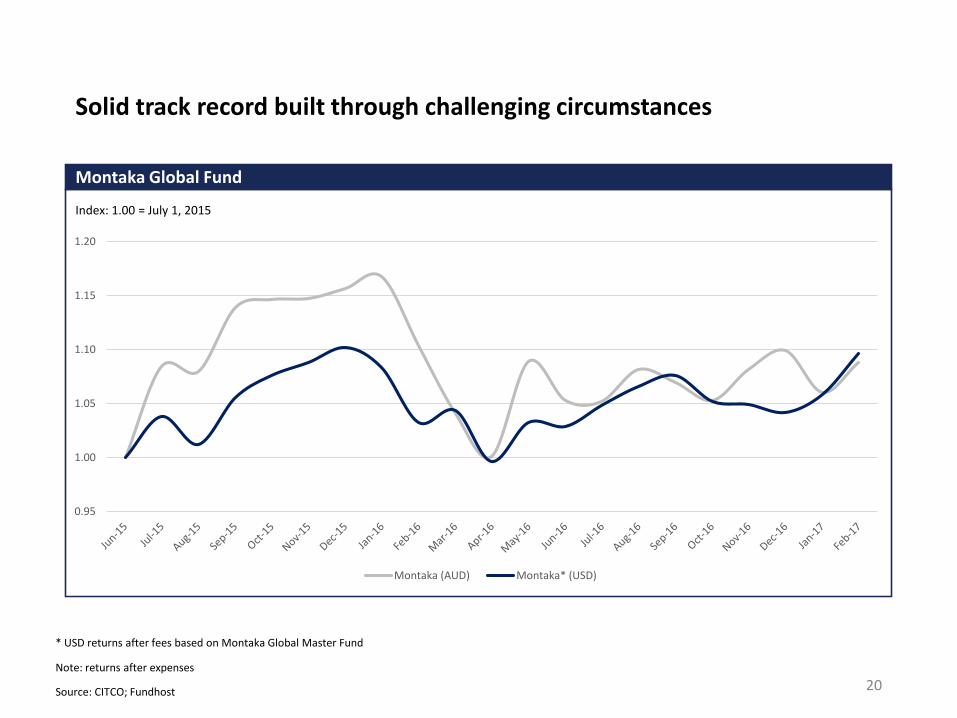
Solid track record built through challenging circumstances
0.95
1.00
1.05
1.10
1.15
1.20
Montaka (AUD) Montaka* (USD)
Montaka Global Fund
Index: 1.00 = July 1, 2015
20Source: CITCO; Fundhost
Note: returns after expenses
* USD returns after fees based on Montaka Global Master Fund

Solid track record built through challenging circumstances
0.95
1.00
1.05
1.10
1.15
1.20
Montaka (AUD) Montaka* (USD)
Montaka Global Fund
Index: 1.00 = July 1, 2015
21Source: CITCO; Fundhost
Note: returns after expenses
* USD returns after fees based on Montaka Global Master Fund
Launched Montaka Global Access Fund

Montaka is a top performer compared to peers
One of the highest performers in the marketplace with an attractive and complementary return profile
22
Performance comparison
Correlation matrix — Montaka clearly stands apart from the peer group
Montaka
Montaka correlation with peers just 28-53%
0% 5% 10% 15% 20%
Peer 5
Peer 4
Peer 3
Peer 2
Montaka Global Fund
Peer 1
Upside-downside capture
Source: Morningstar; MGIM
Note: peer group includes Antipodes, K2, Morphic, Platinum, PM Capital; fund performance in A$ after expenses from 1 July 2015 to 28 February 2017

Introducing the Montgomery Global Fund
Montgomery
Global Fund
Assets Funding
Long(15-30 stocks)
Cash
Client NAV
• Same long portfolio as Montakao All capo All geographieso All sectors
• Flexible cash weighting 0-30% (max 50%)o Driven primarily bottom-up,
informed by top-down processo Protect downsideo “Dry powder”
• Same currency hedging policy as Montaka
• Synergy benefits with short research process underlying Montaka
23
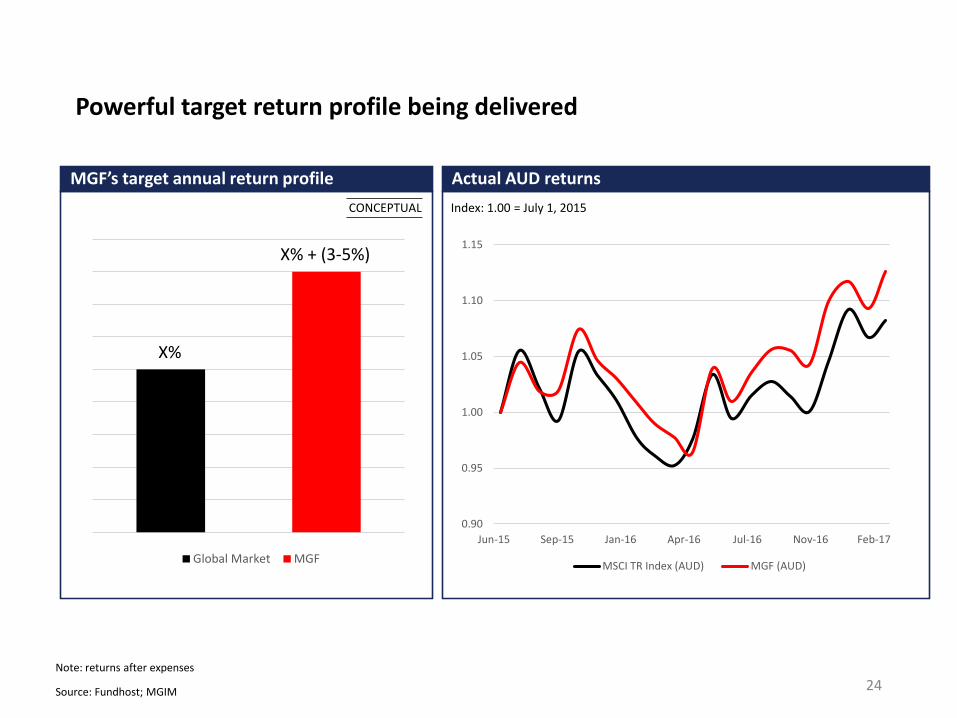
Powerful target return profile being delivered
MGF’s target annual return profile Actual AUD returns
CONCEPTUAL Index: 1.00 = July 1, 2015
Global Market MGF
X%
X% + (3-5%)
0.90
0.95
1.00
1.05
1.10
1.15
Jun-15 Sep-15 Jan-16 Apr-16 Jul-16 Nov-16 Feb-17
MSCI TR Index (AUD) MGF (AUD)
24Source: Fundhost; MGIM
Note: returns after expenses
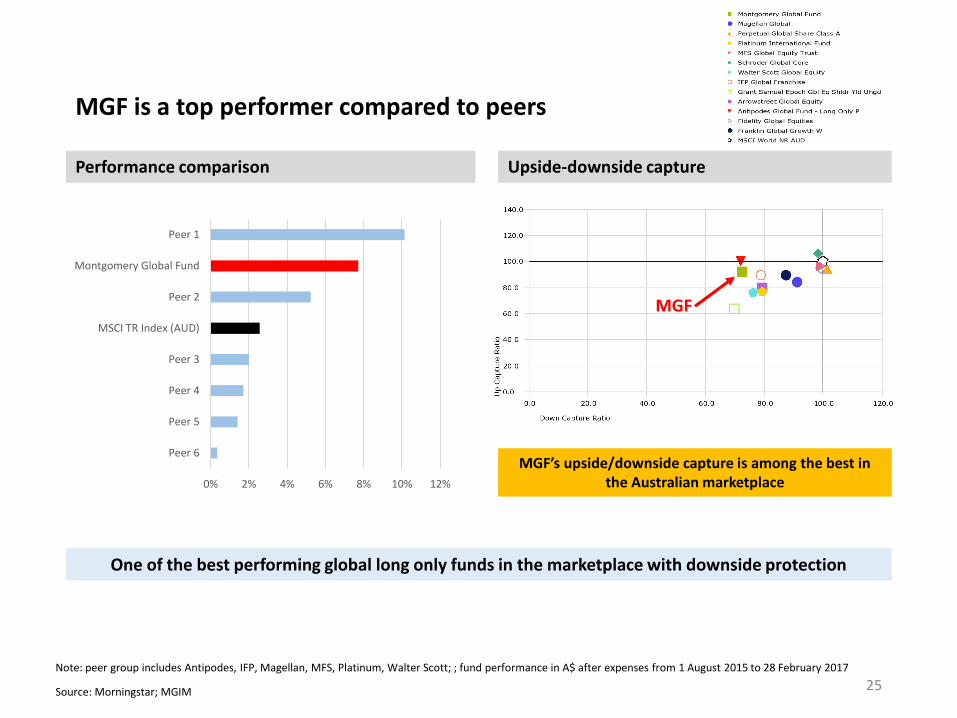
MGF is a top performer compared to peers
Upside-downside capture
MGF
0% 2% 4% 6% 8% 10% 12%
Peer 6
Peer 5
Peer 4
Peer 3
MSCI TR Index (AUD)
Peer 2
Montgomery Global Fund
Peer 1
MGF’s upside/downside capture is among the best in the Australian marketplace
Performance comparison
One of the best performing global long only funds in the marketplace with downside protection
25Source: Morningstar; MGIM
Note: peer group includes Antipodes, IFP, Magellan, MFS, Platinum, Walter Scott; ; fund performance in A$ after expenses from 1 August 2015 to 28 February 2017

Our dedicated global team
• Andrew Macken, Chief Investment Officer• Launched Montaka/MGF July 2015• Formerly at Kynikos Associates, New York, under Jim
Chanos• MBA, Applied Value Investing Program, Columbia
Business School, New York• Master of Commerce, High Distinction, University of New
South Wales (UNSW), Sydney• Bachelor of Engineering, First Class Honours, Academic
Scholarship, UNSW, Sydney
• Christopher Demasi, Portfolio Manager• Launched Montaka/MGF July 2015• Formerly at LFG, the private investment group of
the Lowy family, New York• Formerly One East Partners, New York; and
Goldman Sachs, Sydney• Bachelor of Commerce, Academic Scholarship,
UNSW, Sydney
• Daniel Wu, Research Analyst• Joined Montgomery Global in June 2016• Formerly Analyst at Goldman Sachs and UBS
investment banking divisions, Sydney• Bachelor of Commerce, Distinction, University of
Sydney, Sydney• Bachelor or Laws, University of Sydney, Sydney
• Paul Mason, Chief Financial & Operating Officer• Launched Montaka July 2015 • Formerly COO AMBATA Capital Partners, a global private equity firm, New York• Formerly COO Credit Suisse Standard Securities (JV Credit Suisse / Standard Bank), Johannesburg• Formerly COO Credit Suisse European Prime Services, London
• George Hadjia, Research Analyst• Joined Montgomery Global in August 2015• Formerly Analyst at Private Portfolio Managers, a global
equity fund manager, Sydney• Bachelor of Commerce, Distinction, University of Sydney,
Sydney• Bachelor or Laws, University of Sydney, Sydney
26
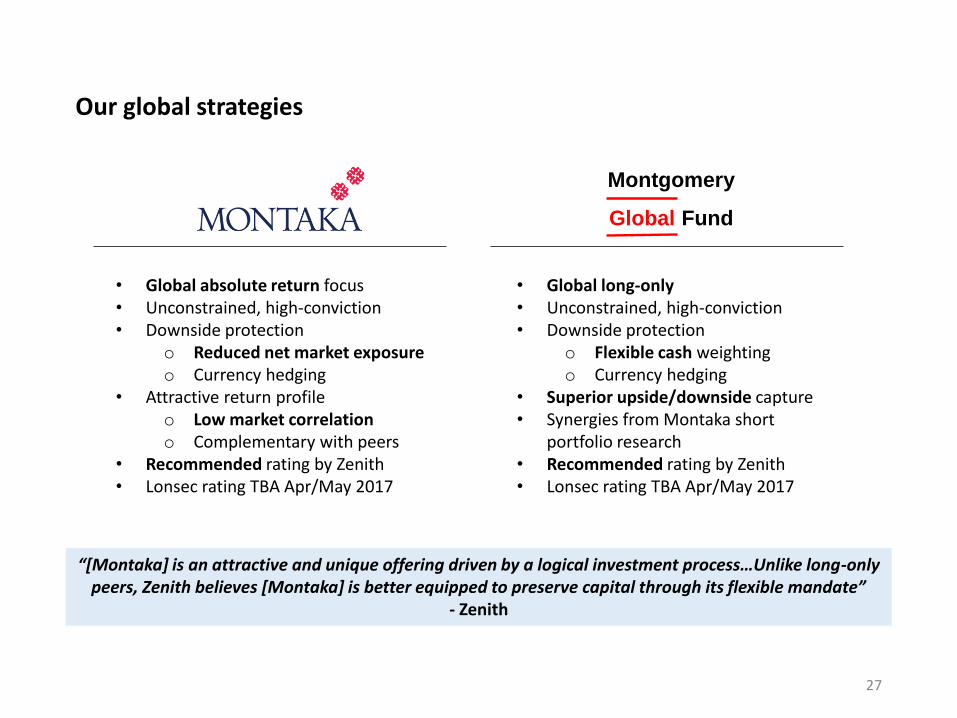
Our global strategies
27
• Global absolute return focus• Unconstrained, high-conviction• Downside protection
o Reduced net market exposureo Currency hedging
• Attractive return profileo Low market correlationo Complementary with peers
• Recommended rating by Zenith• Lonsec rating TBA Apr/May 2017
Montgomery
Global Fund
• Global long-only• Unconstrained, high-conviction• Downside protection
o Flexible cash weightingo Currency hedging
• Superior upside/downside capture• Synergies from Montaka short
portfolio research• Recommended rating by Zenith• Lonsec rating TBA Apr/May 2017
“[Montaka] is an attractive and unique offering driven by a logical investment process…Unlike long-only peers, Zenith believes [Montaka] is better equipped to preserve capital through its flexible mandate”
- Zenith

Thank You
Montgomery Global Investment Management
Montgomery
Global Fund
28


