
Portland State University Portland State University
PDXScholar PDXScholar
Dissertations and Theses Dissertations and Theses
5-5-1992
A Comparison of Two Kindergarten Screening A Comparison of Two Kindergarten Screening
Instruments in One Population Instruments in One Population
Therese Marie Westrup Portland State University
Follow this and additional works at: https://pdxscholar.library.pdx.edu/open_access_etds
Part of the Speech and Rhetorical Studies Commons
Let us know how access to this document benefits you.
Recommended Citation Recommended Citation Westrup, Therese Marie, "A Comparison of Two Kindergarten Screening Instruments in One Population" (1992). Dissertations and Theses. Paper 4525. https://doi.org/10.15760/etd.6409
This Thesis is brought to you for free and open access. It has been accepted for inclusion in Dissertations and Theses by an authorized administrator of PDXScholar. Please contact us if we can make this document more accessible: [email protected].

.~
AN ABSTRACT OF THE THESIS OF Therese Marie Westrup for the
Master of Science in Speech Communication, with an emphasis
in Speech Pathology, presented May 5, 1992.
Title: A Comparison of Two Kindergarten Screening
Instruments in One Population.
APPROVED BY THE MEMBERS OF THE THESIS COMMITTEE:
The purpose of this study was to compare thirty-two
childrens' performances on the Daberon-2 Screening for
School Readiness and the Early Screening Inventory <ESI>, as
well as determine whether there was a correlation between
the tests. This study responded to the needs of the local
Portland, Oregon area schools, some of which use these
tests, to investigate the tests, and explore the possibility
of using the shorter ESI over the longer Daberon. The
reasoning behind the goal of the study was to determine that
if the two tests showed a strong, positive correlation and
identified the same children as needing further assessment,
then perhaps the test which was shorter to administer could
be used with confidence as a faster, but equally reliable
2
pre-kindergarten screening tool. In other words, if a child
"passes" the Daberon, one could assume that the child would
most likely "pass" the ESI as well. Based on the results of
this study, one can make this assumption with a reasonable
amount of confidence.
The subjects in this study included 16 males and 16
females. All were preschool students, ranging in age from
4-6 to 5-6 with a mean age of 5-1 years. The subjects were
given the two tests in a counterbalanced order, which also
varied as to sex so that not all of one sex received one
test first. The standard scores and whether or not each
subject "passed" or "failed" each screen was determined. The
correlation between the two tests was also determined.
The Pearson product moment correlation coefficient
<Pearson L> was used to determine the degree of relatedness
between the tests. A high positive correlation of .73 was
found between the Daberon and the ESI, with a shared
variance <L2 ) of 53.3%.
In determining how the tests identify children needing
further evaluation, a cut-off criteria of greater than one
standard deviation below the mean for each screen was
defined as a "fail," with scores at or above one standard

deviation below the mean categorized as a "pass." The
results indicated that only 2 of the 32 children in this
study showed a need for further evaluation. One child was
identified by both the Daberon and the ESI, and one child
was identified only by the ESI. The findings indicate that,
based on these study results alone, one can reasonably
assume that the ESI can be used in lieu of the similar, but
longer, Daberon test. These results may have been affected
by the small sample used for this study.
3

A COMPARISON OF TWO KINDERGARTEN SCREENING
INSTRUMENTS IN ONE POPULATION
by
THERESE MARIE WESTRUP
A thesis submitted in partial fulfillment of the requirements for the degree of
MASTER OF SCIENCE IN SPEECH COMMUNICATION: with an emphasis in
SPEECH PATHOLOGY
Portland State University 1992

i ! I i k I
J i
TO THE OFFICE OF GRADUATE STUDIES:
The members of the Committee approve the thesis of
Therese Marie Westrup presented May 5, 1992.
APPROVED:
' · .... __
~~ McMahon, Chair
Steve Brannan
Theodore G. Grove, Chair, Department of Speech Communication
C. William Savery, and Research

ACKNOWLEDGMENTS
I wish to express my gratitude and appreciation to Joan
McMahon, my thesis and graduate advisor, for her support in
this project. Her comments, suggestions, and creative ideas
were essential to the completion of this thesis. They were
also helpful for my peace of mind, which isn't easy to
attain during graduate school.
extend special thanks also to Mary T. Withers, my
committee member whose fresh approach helped me formulate
important points regarding the scoring and data analysis. In
addition, Mary was extremely helpful in clinical and
personal matters during graduate school. Her warm and caring
personality traits are assets that do not go unnoticed among
the graduate students at PSU, and she is well-liked.
thank the principals, teachers, parents, and children
who were involved in allowing me to collect my data.
were all very supportive, enthusiastic, and helpful.
They
Additional thanks go to Larry Gohl, my off-campus
speech pathology mentor whose helpful advice, technical
experience, and true faith in me kept me going.
To my parents, Marjorie and Dick Westrup, go my love
and deep appreciation for their tremendous support and
encouragement over the years.
I dedicate this thesis to my wonderful husband,

·ayqJssod 40J~asaJ
SJ4+ ap~w 'aouapJJUOO pu~ '+Joddns 'a~or aso4M 'li~PU~H

TABLE OF CONTENTS
PAGE
ACKNOWLEDGEMENTS .................................. . i i i
LIST OF TABLES .................................... . vii
LIST OF FIGURES ................................... . viii
CHAPTER
INTRODUCTION ............................ .
Statement of Purpose................ 2
I I REVIEW OF THE LITERATURE ................ .
Readiness Instruments .............. .
Characteristics of exemplary tests .. .
Testing measures used in this study ..
4
4
8
I I I METHODS .................................. .
11
15
15
15
16
17
17
18
18
20
Subjects
Criteria for selection ............. .
Instrumentation .................•...
Testing Environment ................ .
Procedures ......................... .
Research Design .................... .
Scoring and Data Analysis .......... .
IV RESULTS AND DISCUSSION
Results . . . . . . . . . . . . . . . . . . . . . . . . . . . . . 20
Discussion . . . . . . . . . . . . . . . . . . . . . . . . . . 22
V SUMMARY AND IMPLICATIONS.................. 29

vi
Summary . . . . . . . . . . . . . . • . . . • . . . • . • • . • • 28
Research Implications 30
Clinical Implications 31
REFERENCES 32
APPENDICES 34
A PERMISSION FORM .................... . 34
B DABERON-2 SCREENING FOR SCHOOL READ I NESS ......................... . 36
c EARLY SCREENING INVENTORY .......... . 39
D RAW SCORES OF TESTS ................ . 43
E EVALUATION FORM .................... . 45

LIST OF TABLES
TABLE Page
Ranges Among Raw Test Scores 20
II Mean Test Standard Scores and Standard Deviations . . . . . . . . . . . . . . . . . . . . • . . . . . . . . . . . . . . . . 21
I I I Teacher Evaluation of Success in Current Preschool Setting .............•........•..•. 26
IV Subjects' Formal Test Results versus Teacher Ratings ......................•...•.. 26

FIGURE
1 .
LIST OF FIGURES
The shared variance among the Daberon-2 and the ESI, representing the amount of aspects common to the two tests ..... .
PAGE
22

CHAPTER I
INTRODUCTION
Kindergarten screening tests are often used to identify
children with potential basic concept and language
limitations. The purpose of screening is to quickly
identify children with speech/language problems while
avoiding indepth testing of "normal" children. Presently,
many school systems are attempting to identify kindergarten
children who may be at risk using screening instruments
supplemented with other procedures such as teacher referral.
This has become more important than ever since Congress
passed Public Law 99-457, which emphasizes the importance of
early intervention in children at risk for learning (and
other) disabilities, by extending all rights and protections
afforded by Public Law 94-142 to children aged 3 to 5
<Salvia and Ysseldyke, 1991).
The Early Screening Inventory <ESl) (1983> and the
Daberon-2 Screening for School Readiness <1991) are two
well-known and preferred instruments currently in use as
screening devices in the Portland Public Schools. The ESI is
a developmental screening instrument which assesses a
child's potential for success in school <Meisels & Wiske,
1983). This screening test samples developmental

2
accomplishments and is intended to identify children who are
in need of further diagnostic evaluation <Meisels & Wiske,
1983; Langhorst, 1989). The locally developed Daberon
assesses learning readiness and is intended to sample the
knowledge and skills of children as they begin school
<Danzer, Gerber, & Lyons, 1982).
Screening instruments with superior norms and
standardization are preferred over those without such
characteristics. The Daberon was standardized in 1980;
published literature regarding its standardization quality
is in the test manual of the Daberon-~ <Danzer, Gerber,
Lyons, & Voress, 1991). The ESI's normative information has
been rated fair in the past, but new research and updated
standardization are now available from the authors. If the
two screens identified the same children as,needing further
assessment, then there would be a good rationale for using
the screen which has the shorter administration time.
STATEMENT OF PURPOSE
The purpose of this study was to compare the
performance of 32 children, between the ages of 4.6 and 5.6,
on two screening devices: the Daberon-2 and the Early
Screening Inventory. The questions to be answered were:
1. Would there be a significant difference in their scores
on the two tests? 2. What was the relationship between the
two instruments, that is, the extent to which the scores

could be statistically correlated?
The first question investigated whether there would be
a significant difference in the number of children who
"passed" or "failed" the two screening tests. The dependent
variable in this question was the standard test score of
each screening instrument. This variable was recorded for
each student and then the two results were compared. The
independent variables were the two screening instruments.
The second question sought to determine the statistical
correlation between the two screening instruments. For this
question, the independent variables were the two tests, and
the dependent variables were the scores between the two
tests.
3

CHAPTER II
REVIEW OF THE LITERATURE
READINESS INSTRUMENTS
The purpose of school readiness testing is to assess a
child's existing knowledge and skills so that direction in
what needs to be taught can be provided. Also, information
on the ability levels of groups of students is supplied so
that school policy decisions on curriculum planning is made
available <Langhorst, 1989). The content of a readiness
instrument should be judged in terms of how useful the
results are in providing information about specific areas
which should be addressed for a particular child <Langhorst,
1989).
Readiness Testing and Academic Achievement
Many studies in the literature show a correlation
between readiness testing and later school achievement. Ilg,
Ames, Haines, and Haines <1978) performed a longitudinal
study examining several factors related to school readiness.
The researchers examined their original group, tested in
kindergarten, to determine how each had placed in the sixth
grade. The sixth grade group had been divided, on the basis
of general abilities and school performance, into 4 groups,

5
with the most excellent students in Group 1, and the least
excellent in Group 4. Sixty-seven percent of the children
who had been considered "ready" were found to be in Group 1.
Of those who were originally found to be "unready" or
"questionable", 6% were in Group 1, 47% were in Group 2, 35%
were in Group 3, and 12% were in Group 4, or had only
advanced to the fifth grade level.
A study by Gullo, Clements, and Robertson <1984)
examined how well the McCarthy Screening Test <MST> <1978)
and the Metropolitan Readiness Test <MRT) (1976) were able
to predict readiness at the end of kindergarten, and
academic achievement at the end of first grade. Eighty-eight
children were screened upon entering kindergarten with the
MST. The MRT was administered at the end of kindergarten. As
a measure of achievement the Scott and Foresman Achievement
Test CSFAT> <1973) was given at the end of first grade. The
results of the study indicate that the MST significantly
predicted children's scores on the MRT and the SFAT. In
addition, the MRT was a significant predictor of the SFAT,
indicating that this readiness test was an important
indicator of future academic success as measured by the
SFAT.
Telegdy <1977) examined the effectiveness of selected
readiness tests to predict first grade success. Four
readiness tests were administered to 56 children at the end
of their kindergarten year. One year later, the children

were reassessed with two standardized achievement tests. In
this study, the best predictors of school achievement were
the MRT and the Screening Test QL Academic Readiness <STAR>
(1966). The other two readiness tests, namely the First
Grade Screening Test <FGST> <1966) and the Bender Gestalt
Test <BGT) (1937) were found not to have good predictive
validity in terms of first grade achievement. An
interesting sideline conclusion in the research was noted.
Of the skills measured by the various readiness tests, the
"letter knowledge" turned out to be the most predictive
component of actual first grade achievement. Telegdy <1977>
also concluded that teacher predictions were efficient
predictors of first grade achievement; he suggested that
these predictions can complement formal tests.
The McCarthy Scales £L Children's Abilities CMSCA)
<1972) is a norm-referenced test which measures cognitive
ability for children 2-6 to 8-6 <Keith, 1985). Harrison
<1973) administered this test to 65 first grade children.
Nine months later the Metropolitan Achievement Test (1970)
was given to determine whether the MSCA could serve as a
good predictor of first grade achievement. One subtest of
the MSCA, the McCarthy General Cognitive Index, emerged as a
significant predictor of achievement in multiple regression
analysis.
Another aspect in the arena of children's academic
achievement is the concept of reading. Success or failure
6

in the early grades depends on a child's ability to learn to
read <Randel, Fry, & Ralls, 1977). Randel et al. ( 1 977)
conducted a study to compare the predictive effectiveness of
the ABC Inventory <1965), a preschool screening device, and
the Metropolitan Readiness Test <MRT) which is a widely used
reading-readiness test. The purpose was to assess the
effectiveness of the two instruments in predicting first-and
third-grade reading achievement. They found that the MRT,
when using a middle-class sample of kindergarten children,
was a good predictor of both first- and third-grade reading
performance, with the highest predictive validity occurring
at the third grade level.
Teacher Referral and Testing Instruments
Teachers' judgments are frequently used as the criteria
for evaluating the validity of testing instruments
<Langhorst, 1989>. Thus it is pertinent to ask whether
formal assessment tools are useful to teachers. According to
Langhorst <1989), the type of information provided by formal
readiness testing is useful to teachers because it provides
them with specific instructional planning ideas. In
addition, the instruments provide a way for teachers'
observations to be structured so that the same information
is obtained consistently for all children <Langhorst, 1989).
Bolig and Fletcher <1973) performed a study with
kindergartners in North Pennsylvania School District,
Lansdale, Pennsylvania, which compared the Metropolitan
7

Readiness Test <MRT> as a predictor of first grade success
to teacher judgments predicting the same students' first
grade success. First grade success was defined as either a
score on the Stanford Achievement Test <SAT> or a rating
made by the teacher observing the student's first grade
performance. The results showed that the MRT as a predictor
of first grade success was as good or better than the
ratings of teachers on the six skills which the MRT measures
<Bolig & Fletcher, 1973).
CHARACTERISTICS OF EXEMPLARY TESTS
Speech-Language pathologists, teachers, psychologists
and other professionals are often in positions that require
the testing of individuals for the purposes of evaluation or
assessment in a particular area. Concern about the technical
quality of tests or screening measures is based on an
awareness that these instruments can be very powerful,
useful tools when used correctly. Conversely, poor-quality
tests can have damaging consequences or, at a minimum,
provide the examiner with useless or misleading information
<Walsh & Betz, 1985).
For a test to be considered "good," or of high-quality,
it must possess certain characteristics. These psychometric
characteristics can be built into tests by sound and
creative test construction <Kline, 1986). The first
requirement for a good test is reliability. An instrument
8

is said to be reliable if it is consistent, stable,
replicable, and repeatable <Walsh & Betz, 1985). The more
repeatable a test is, the greater will be its reliability.
In psychometrics, there are two types of reliability.
The first is self-consistency. For a test to measure what it
claims to measure, it must be internally consistent. As
Kline Cl986) stated, "If part of the test is measuring a
certain variable, then the other parts, if not consistent
with it cannot be measuring that variable" Cp. 2).
Test-retest reliability is the second type, and is also
known as "stability" <Walsh & Betz, 1985). It is essential
for a test to yield the same score for a subject on
different occasions.
The second major characteristic of a good test is its
validity <Kline, 1986>. A test is valid if it measures what
it claims to measure. If a test is designed to measure
school readiness, and it measures something else, then it is
not a valid test for readiness. There are various ways to
demonstrate test validity. Concurrent validity is assessed
by correlating the test with other similar tests that are
known to have good validity. Predictive validity is a type
9
of criterion-related validity, and is generally recognized
as the most accurate way to judge validity <Murphy &
Davidshofer, 1988). According to Kline <1986>, "To establish
predictive validity of a test, correlations are obtained
between the test given on one occasion and some later

10
criterion" Cp. 5). The problem with this type of validity is
finding a relevant criterion with which to correlate it.
Another type of validity which is meaningful in test
construction is content validity. Content validity refers
to how well an instrument tests the specific behaviors from
which inferences will be drawn. For example, a test for
school readiness should sample a pre-school child's level of
functioning. This would include the ability to cope with the
school environment physically, socially, and academically,
without undue stress. Overall then, a testing instrument
should demonstrate high performance, or validity, in
carrying out its basic function <Lichtenstein & Ireton,
1984).
A further characteristic of high-quality tests is good
norms. Norms are sets of scores from clearly defined samples
CKline, 1986). Normative data indicates how individuals of
various ages might be expected to perform on a given test
(Shames & Wiig, 1986). They are therefore essential to
meaningful interpretation of the obtained data. The
development and procedures for obtaining these scores
constitutes the test standardization <Kline, 1986).
Norm-referenced standardized tests are available for
both screening and diagnostic purposes. Screening tests
typically bestow "cut-off" scores. If an individual's
performance falls below the cut-off, further evaluation is
warranted. A diagnostic or screening test that is poorly
standardized may provide very limited useful information
<Shames & Wiig, 1986).
11
No one instrument will meet all the possible criteria
that could be outlined for screening readiness assessment or
developmental potential. The most important criteria is how
useful the information will be in leading to beneficial
changes in the educational development of a particular child
<Langhorst, 1989).
TESTING MEASURES USED IN THIS STUDY
The Daberon-2 Screening for School Readiness <1991> was
designed as a screening and prescriptive instrument. Thus it
can provide information which is useful for the teacher in
planning a given child's educational agenda. It is currently
in use in Portland public schools. According to the manual,
a high percentage of accurate responses indicates school
readiness. This tool is not an all-inclusive test of a
child's abilities. It is a screening device designed to
sample the knowledge and skills of four-, five-, and
six-year-old children as they begin school. It assesses
various language skills, including knowledge of body parts,
color and number concepts, functional use of plurals and
prepositions, and the ability to follow directions. It also
surveys general knowledge, gross motor development, and the
ability to categorize <Hamilton, 1974). Information gained
from this test may be used to identify future problem areas,

the need for further diagnostic study, and information that
needs to be taught in the classroom <Danzer et al., 1972).
The Daberon may also be used for baseline purposes in
assessing educational progress.
12
When the Daberon was first published in 1972 and put to
use as a screening instrument, it lacked standardization and
no mention of reliability or validity studies was made in
the test manual. In 1980, the Daberon was standardized so
that pre-school and school-aged children's functioning
skills could be quantified. This provided data-based
evidence of school readiness or nonreadiness, and also gave
the instrument needed psychometric data. The sample size was
1,358 children, aged 2 to 9 years, with the majority falling
in the 3.1 to 6.5 age range. The children tested were from
16 different states. National standardization such as this
ensures a cross-section of curriculum and social patterns.
An equivalency age score is obtained which denotes
a child's level of school readiness. This level of readiness
indicates how a child compares to other children of the same
age in the standardization sample. The equivalency age score
does not represent a mental age. Rather, it indicates where
a given child's performance is compared to the other
children in the standardization sample (Danzer et al.,
1982) .
The Early Screening Inventory CESI> was designed to
identify children who may have a learning difficulty or a

13
handicapping condition that could affect their potential
success in school <Meisels, Wiske, & Tuvnan, 1984). This
screening inventory is currently in use in Portland public
schools. The instrument is administered individually and is
composed of 30 items covering an age range of 4 to 6 years.
The developmental areas examine visual-motor tasks which
include fine motor control, eye-hand coordination, memory of
visual sequences and ability to reproduce structures.
Language, verbal reasoning, the ability to count and
remember auditory sequences is also included. In addition,
items which evaluate gross motor coordination and imitation
of body positions are examined (Meisels, Henderson, Liaw,
Browning, & Ten Have, 1991).
The new standardization sample consisted of 2,746
children between the ages of 4-0 and 5-11. The sample
characteristics were defined as being collected from 45
educational sites in 11 states, and consisted primarily of
Caucasian children, with 34% being nonwhite. Fifty-five
percent of the sample were middle to high SES, with 45
percent of low SES.
An important component of the ESI screening process
includes the parent questionnaire. As part of a recent
standardization study, the questionnaire was found to have
moderate to high reliability (alpha= .72) with regard to
its internal consistency <Meisels et al., 1991). When used
in combination with the test itself, the specificity and

14
false positive ratios both improve so that the screening
process correctly excludes 94 percent of those children who
do not need further assessment <Meisels et al., 1991>.
Information gained from this screen can be used to
accurately identify and refer children who are at
developmental risk for subsequent problems in school
<Meisels et al., 1991). This is important because although
a wealth of information exists in the literature about
developmental screening and the importance of early
intervention, very few reliable and valid screening
instruments exist <Meisels et al., 1991>.

CHAPTER III
METHODS
SUBJECTS
Thirty-two children, (16 girls and 16 boys) enrolled in
Portland, Oregon area preschools were chosen for this
project. The age range was from 4-6 to 5-6 years. The
children were assumed to be of normal intelligence based on
teacher report.
CRITERIA FOR SELECTION
In order for a child to have been included in the
study, the following criteria were met:
1. The child's parent signed a form giving permission
for the child to take part in the study. <See Appendix A).
2. The child was able to respond to the items on the
Daberon and the ESI. Specifically, the child understood
English reasonably well, and possessed enough cognitive
skills to attempt to respond appropriately.
3. The subject had not been exposed to or had not taken
the ESI or the Daberon previously.
4. Each child passed a puretone audiometric screening
test at 25 dB HL at frequencies of 500, 1000, 2000, and 4000
Hz.

5. The child showed no obvious intellectual deficits
as judged by teacher observation and report.
INSTRUMENTATION
16
A portable Maico audiometer model # MA-16 was used for
the hearing screening.
The Daberon is comprised of 124 items appropriate for
children aged 3 through 6. Four and five year olds were the
priority age groups in the standardization data. Various
types of responses are required and include verbal responses
to questions, color identification, counting, a working
knowledge of prepositions, demonstration of gross and fine
motor movements, copying figures, and placing items in an
appropriate category. The test takes approximately 45
minutes to administer. <See Appendix B).
The ESI is appropriate for ages 4-0 to 6-0. It surveys
abilities in speech, language, cognition, perception, and
gross and fine motor skills. This test is comprised of 36
items and takes approximately 20 minutes to administer. CSee
Appendix C).
TESTING ENVIRONMENT
Before formal testing, rapport was established through
brief casual conversation. The environment during testing
was a quiet, well-lit room at their preschool free from
clutter and other people. The children were tested one at a

time, seated at a table on the examiner's left side. The
stimulus items were placed between the examiner and the
subject. Items not in use were kept out of sight to avoid
possible distraction. The room chosen was large enough to
permit the evaluation of gross motor activities.
PROCEDURES
Criteria Testing
17
Once permission was granted for the child to take part
in the study, the hearing screen was performed on each
potential candidate. The child was tested at each of the
frequencies previously mentioned.
Test Administration
During the formal test administration, verbal
reinforcement such as "Good listening" was used
intermittently. Both tests were administered in full,
including the parent questionnaire on the ESI, and scored
according to the respective manuals.
The ESI was administered according to the test
directions in the manual. The test items are not arranged
developmentally.
The tests were conducted by giving the hearing screen
and one test on one day, and the other test on another day,
with the testing instruments and the hearing screen all
being presented within a 6-week period. To control for a
learning effect, the order of test administration was
18
counterbalanced. To insure that all of either sex was not
administered a particular test first, the order of
presentation to males and females was also counterbalanced.
RESEARCH DESIGN
This was a correlational study of two screening
instruments. Such a design was appropriate for examining
the question of the degree of relationship, if any, that
exists between the Daberon-2 and the Early Screening
Inventory.
SCORING AND DATA ANALYSIS
The standard scores of the Daberon-2 and the ESI were
calculated according to the instructions presented by the
respective test manuals. The information determined by
scoring included the standard scores of the two instruments.
<See Appendix E>.
The research questions presented in the statement of
purpose were analyzed using two different types of data
analysis. The study sought to determine whether the same
children in a given sample would require further assessment
as determined by their results on the two screens. Thus, a
reasonable pass/fail criterion for each screening device was
designated by the investigator. A "failure" on the Daberon-2
was defined as a score that was greater than one standard
deviation below the mean for a given age group. A "pass"

19
was any score at or above 1.0 standard deviation below the
mean. For the Early Screening Inventory, a failure included
scores falling in the "rescreen" or "refer" range; these
were scores lower than one standard deviation below the mean
for each age range. A pass included all scores at or above
one standard deviation below the mean.
The first question investigated whether the same
children would pass or fail the two screens.
this, descriptive statistics were utilized.
To examine
The use of inferential statistics was appropriate for
the second question, which examined the possible correlation
between the two screening instruments. Thus the Pearson
product moment correlation coefficient (L) was used to
determine the degree of relationship between the devices.
Also, the amount of shared variance between the tests was
determined by calculating r 2 •

CHAPTER IV
RESULTS AND DISCUSSION
RESULTS
The purpose of this investigation was to compare the
performance of 32 preschool children on the Daberon-2 with
their performance on the ESI. The first question posed was:
Would there be a significant difference in the number of
children passing or failing the two tests? In order to
answer this, the data were analyzed using descriptive
statistics. The raw test scores appear in Appendix F.
The ranges of raw test scores and mean standard scores
with standard deviations appear in Tables and II
respectively.
TABLE I
RANGES AMONG RAW TEST SCORES ===========================================================
Scores DABERON-2 ESI
High 119 30
Low 75 11
RANGE 44 19
n = 32

21
TABLE II
MEAN TEST STANDARD SCORES AND STANDARD DEVIATIONS ========================================================
Test MS SD
DABERON-2 107.68 9.53
ESI 25.53 3.86
The second question in this study examined the
statistical correlation between the ESI and the Daberon.
The correlation coefficient between the two tests was .73,
indicating a high positive relationship. This Pearson ~ is
statistically significant beyond the .001 level of
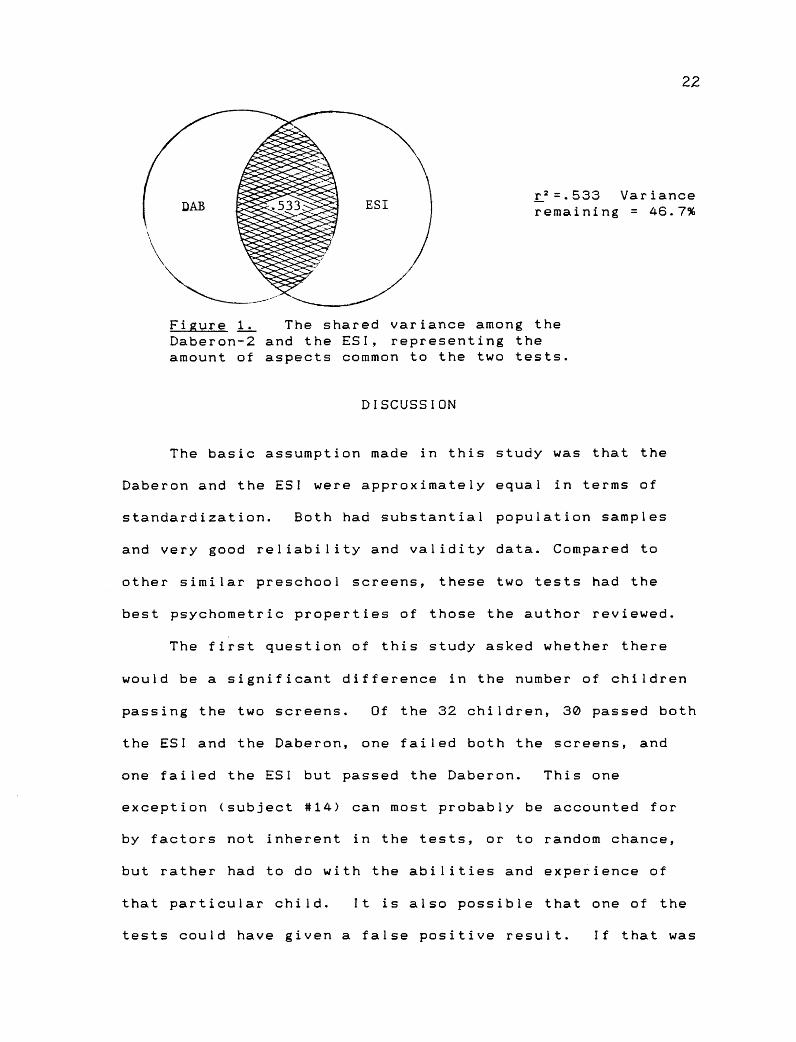
confidence. Additionally, the amount of shared variance
between the tests was determined by computing ~2 • Shared
variance identifies the percentage of aspects common to the
two tests being correlated.
In Figure 1, the area which is shaded represents the
amount of shared aspects between the tests, with the white
areas showing the amount which is not accounted for. The
percentage of shared variance between the Daberon-2 and the
ESI was 53.3.
22
DAB L 2 =.533 Variance remaining = 46.7%
\ \ \
~ ----Figure ~ The shared variance among the Daberon-2 and the ESI, representing the amount of aspects common to the two tests.
DISCUSSION
The basic assumption made in this study was that the
Daberon and the ESI were approximately equal in terms of
standardization. Both had substantial population samples
and very good reliability and validity data. Compared to
other similar preschool screens, these two tests had the
best psychometric properties of those the author reviewed.
The first question of this study asked whether there
would be a significant difference in the number of children
passing the two screens. Of the 32 children, 30 passed both
the ESI and the Daberon, one failed both the screens, and
one failed the ESI but passed the Daberon. This one
exception <subject #14) can most probably be accounted for
by factors not inherent in the tests, or to random chance,
but rather had to do with the abilities and experience of
that particular child. It is also possible that one of the
tests could have given a false positive result. If that was

23
the case, the child would be falsely identified as needing
further evaluation, when in fact this may not be necessary.
This would require additional unnecessary work for the test
administrator, who would be obliged to test the child
further, and perhaps communicate the apparent problem with
teachers, parents, and other faculty members. It is also
possible that one of the tests failed to select out a child
in need of further assessment. This child could therefore
remain undetected until some later time in school when
problems may become apparent. Molnar <1984) relates that
the early identification of learning problems is important
in the development of educational programs. He further
asserts that if a student's capacities and limitations are
identified early, effective intervention programs can be
implemented. If a large percentage of preschoolers had been
left undetected by one of the tests, this researcher would
not support the use of that test.
To summarize the data, 93.7% of the sample children
passed both the screens, 3.2% failed both tests, and 3.2%
failed one but not the other. Thus, there was not a
significant difference in the number of children who passed
or failed both screening instruments.
Since all of the children but one passed or failed both
of the screens, there is a good basis for using the shorter
ESI test. It is relatively inexpensive, quick to administer,
and currently in use in the area. It has good

standardization data, and when it was compared to another
valid, standardized test <the Daberon), virtually the same
number of children were identified. Thus there is good
reason to use the ESI over the Daberon which takes much
longer to administer.
24
The correlation coefficient determined between the
Daberon and the ESI was .73, which is significant beyond the
.001 level of confidence. This high correlation indicates a
close association, or a high index of relationship, between
the two tests. As an aside, it is interesting to note that
some of the test items are identical on both screens. The
high statistical correlation lends confidence to the
assumption that the two tests are comparable, and that a
high <or low) score on one test means a high <or low) score
on the other.
The amount of shared variance between the tests was
determined by calculating r 2 • The shared variance was high,
indicating that 53.3% of aspects were common to the two
tests.
In addition to screening instruments, teachers have
first hand experience in determining a particular child's
potential for learning and their readiness for the school
environment. Formal, standardized testing does not take into
consideration all of the factors that are involved in
determining a child's readiness to participate in a school
setting. Although not a part of the questions examined by

25
this study, the investiga~or wanted to incorporate tne
importance of teachers' opinions regarding childrens'
apparent success, or lack of it, in a preschool setting, and
correlate this with the standardized test results. An
independent criterion in the form of a teacher evaluation
was compared with the two tests to determine if this would
correlate with the results on one or both of the test
instruments. The subjective evaluation was completed by the
pre-school teacher and required a judgement as to each
child's current preschool success. Each child was rated as
"successful," "unsuccessful." or "somewhat successful" in
their current preschool setting. CSee Appendix E).
Descriptive statistics were used to analyze the
relationship between the standardized tests and the teacher
evaluations. As can be seen in Table III, the teacher
evaluations of each child's apparent success in his or her
current preschool setting correlated fairly well with the
results of the formal tests.
Twenty-eight subjects were rated by the teacher as
"successful." Four were rated "somewhat successful," with
all of these passing both the Daberon and the ESI. Only one
subject failed both the screens; she received a teacher
evaluation of "successful". One child failed the ESI, but
passed the Daberon, and received a "successful" rating by
the teacher. None of the children were rated as "not
successful" by the teachers.

TABLE Ill
TEACHER EVALUATION OF SUCCESS IN CURRENT PRESCHOOL SETTING
26
============================================================
Passed DAB Failed ESI
Passed ESI Failed DAB
Passed both
Failed both
Totals
Teacher Evaluation
Successful Somewhat Successful
1 0
0 0
26 4
1 0
28 4
Not Successful
0
0
0
0
0
Table IV shows that the teacher evaluations correlated
well with the standard test results of both the Daberon and
the ES I.
TABLE IV
SUBJECTS' FORMAL TEST RESULTS VERSUS TEACHER RATINGS ============================================================
Daberon
Pass 31
Fail 1
n = 32
ESI
30
2
Teacher rating of "successful" or "somewhat successful"
32
0
In this investigation, all but 1 <of 32) teacher's

27
evaluations correlated with how a particular child performed
on the standardized tests. However, there were 4 children
who were rated "somewhat successful" and all of these passed
both of the formal tests. One child who failed both the
screens was rated "successful." Informal probing on the
author's part as to the reason a child might be rated
"somewhat successful" versus "successful" revealed that
teachers considered several factors before rating a given
child. Emotional and psychological factors, social skills,
and behavioral aspects were included in their decision-
making process. These factors are not measured by either of
the standardized tests, but are obviously important in
deciding how well a particular child is doing in school.
Another possible reason for the one subject failing both
formal tests and yet receiving a "successful" rating is that
the evaluator's skills in this area may be lacking. Not all
teachers make sound judgments all of the time. For the most
part, the respective teachers' judgements of the children's
success were consistent with the results of both of the
screens, and their evaluations served to validate the tests
with which they were consistent.
The investigator realizes the limitations of the
methods used to collect the preceding data. In retrospect,
the criteria for the subjective teacher evaluation should
have been more specific. No criteria were attached to the
rating, other than the child was considered to have a
"normal level of intelligence," thus eliminating this as a
factor. Perhaps a rating system which listed specific
criteria used to evaluate each subject would have been more
appropriate.
28
CHAPTER V
SUMMARY AND IMPLICATIONS
SUMMARY
The Early Screening Inventory and the Daberon-2
Screening for School Readiness are two preschool screening
instruments that are well-standardized and currently in use
in Portland public schools. The purpose of this study was to
determine whether the same number of children would pass or
fail the two tests, as well as to determine the relationship
between the instruments. If there was a strong positive
correlation between the instruments and virtually the same
number of children passed or failed both the tests, the test
which is shorter to administer could be used with confidence
as a reliable instrument for screening preschoolers. Based
on the results of this study, this is a valid assumption.
The subjects in this study included 16 females and 16
males. All were preschool students, ranging in age from 4-6
to 5-6. The children were given the two tests in
counterbalanced order. The standard scores, standard
deviations, and ranges were determined for both tests.
The degree of relatedness between the tests was
determined using the Pearson product moment correlation
coefficient <Pearson L)· A strong positive correlation of

. 73 was found between the tests. Shar·ed var·iance (r_'2
between the tests was 53.3%.
In determining how the tests identify those needing
further evaluation, a pre-designated cut-off of less than
one standard deviation below the mean tor each test was
considered a "fail," with those above this cut-off being
considered a "pass." The results indicated that only 2 of
the 32 children failed. One child was identified by both
30
tests, and the other was identified only by the ESI. These
results indicate that, at least based on this study alone,
results on the Daberon can be used as a predictor of results
on the ESI, and that therefore the ESI should be used since
it is a much shorter test.
RESEARCH IMPLICATIONS
Some research and other possible implications of this
study are noteworthy. Since these two tests were found to
be reiated, <that is, the Pearson product moment coefficient
was fairly high) this study provides additional validity to
the Daberon and the ESI as screening instruments. Whenever·
two tests are compared, and significant numbers are obtained
statistically, it serves to validate a test <Nordlund~
1989) • Further research could compare the ESI and Daberon
to other standardized kindergarten screens, and serve to
either validate them or provide data that questions their
validity.
31
CLINICAL IMPLICATIONS
The important clinical implication is that the first
question was supported, that is, there was not a significant
difference in the number of children who were identified by
both instruments. This number (1) was small, so that the use
of the ESI as a kindergarten screening device would be
encouraged among speech-language pathologists who are
screening in schools. Mass screenings of kindergartners take
place in most, it not all, of the Portland Public Schools.
It is important to accomplish this in a timely manner, and
with as little classroom disruption as possible. The ES I is
shorter to administer, correlates well with the Daberon, and
has good standardization data. Also, knowledge of
chiidr~n?s sco~~~ qn lh~ ~WR ~n~trHm~nl~ ~~ ~mpRrt~nt ~n
clinical decisions regarding possible remediation and
intervention for a particular child or group of children.
REFERENCES
Bolig, J., & Fletcher, G. <1973). The MRT vs. ratings of kindergarten teachers as predictors of success in first grade. Educational Leadership, 30, 637-689.
Danzer, V., Gerber, M., & Lyons, T. (1972). Daberon: ~ screening device for school readiness. Portland, OR: Daberon Research.
Danzer, V., Gerber, M., & Lyons, T. <1982). Daberon revised: ~screening device for school readiness. Portland OR: Daberon Research.
Danzer, V., Gerber, M., & Lyons, T., with Voress, J. K., <1991). Daberon-2: Screening for school readiness. Austin, TX: Pro-Ed.
Gullo, D., Clements, D., & Robertson, L. <1984). Prediction of academic achievement with the McCarthy Screening Test and Metropolitan Readiness Test. Psychology in the Schools, 21, 264-269.
Hamilton, P. A., <1974). Validation Q£ the Oregon School Entrance Speech Screening Test. Unpublished thesis. Portland State University, Portland, OR.
Harrison, P. L. (1973). Mercer's Adaptive Behavior Inventory, the McCarthy Scales, and dental development as predictors of first grade achievement. Journal QL Educational Psychology, 73, 78-86.
Ilg, F., Ames, L., Haines, G., & Haines J. <1978). School readiness: Behavior tests used at the Gesell Institute. NY: Harper & Row.
Kline, P. <1986). ~handbook~ test construction. New York: Methuen & Co. Ltd.
Langhorst, B. H., < 1989). education: ~consumer's Educational Laboratory.
Assessment in early childhood guide. Northwest Regional Portland, OR.

33
Liechtenstein, R. & Ireton, H. (1984). Preschool screening: Identifying young children with developmental and educational problems. Orlando: Grune & Stratton, Inc.
Meisels~ S., & Wiske, M., <1983). Early Screening Inventory. Hagerstown, MD: Teachers College Press.
Meisels, S., Wiske, M., & Tivnan, T. < 1984). Predicting school performance with the early screening inventory. Psychology in the Schools, ~' 25-33.
Meisels, S., Henderson, L., Liaw, F., Browning, K., & Ten Have, T. (1991). New evidence for the effectiveness £L the Early Screening Inventory Unpublished manuscript, University of Michigan, University of North Carolina at Chapel Hill, & Educational Testing Service.
Molnar, G. <1984). Kindergarten screening: A tool for early intervention £L learning problems. Paper presented at the meeting of the National Association of School Psychologists, Philadelphia, PA.
Murphy, K. & Davidshofer, C. <1988). Psychological testing: Principles and applications. Englewood Cliffs, Nj: Prentice-Hall.
Nordlund, A. <1989). Correlation QL preschoolers' performance ~ three language comprehension tests. Unpublished thesis, Portland State University, Portland, OR.
Randel, M., Fry, M., & Ralls, E. <1977). Two readiness measures as predictors of first- and third-grade reading achievement. Psychology in the Schools, ~ 37-41.
Salvia, J., & Ysseldyke, J. <1991). Assessment <5th ed.). Boston: Houghton Mifflin Company.
Shames G., & Wiig, E. <1986). Human communication disorders <2"d ed. ). Columbus: Charles E. Merrill Publishing Co.
Telegdy, G. <1977). The effectiveness of four readiness tests as predictors of first grade academic achievement. Psychology in the schools, ~ 4-11.
Walsh, B., & Betz, N. < 1985). Test and assessment. Englewood Cliffs, NJ: Prentice-Hall, Inc.

W~O:I NOISSIW~3d
Y XIGN3dd'V

35
Dear Parent, As a graduate student at Portland State University, I am currently investigating two different Kindergarten Screening Tests. The Daberon-2 is a kindergarten readiness test, and the Early Screening Inventory tests developmental abilities. A comparison study is being made whereby a child will be given both tests. I would appreciate your permission to include your child in this project.
The testing will involve the instruments mentioned above and a hearing screening. In addition, the teacher will be asked to provide input regarding your child's success in his/her current pre-school setting. Your child's participation in this study will present no physical or psychological risks. All data obtained during the course of study will remain confidential. Published material will not reveal the name of your child.
If you decide to allow your child to participate in this study, please fill out the appropriate portion of this form. Please return your reply to your child's teacher/daycare worker as soon as possible. If you choose to allow your child to participate, you are free to withdraw him/her from the study at any time without affecting services provided at his/her school or from Portland State University. This study will benefit children with language, physical, and/or cognitive delays by providing new information to the speechlanguage-pathologists working with them.
I have read and understand the above statements and I agree to let my child participate in this study.
DATE PARENT PHONE #:
Your child's testing for this study will be conducted at his or her pre-school. The results will be available upon request.
The child must be between 4.6 and 5.6 years old. Birthdate:
Child's
If you experience problems that are the result of your participation in this study, please contact the secretary of the Human Subjects Research Review Committee, Office of Grants and Contracts, 303 Cramer Hall, Portland State University, 725-3417. For more information about this study, you may contact Therese Westrup at 282-5270 <H> or 725-3602 <School).
SS3NIGV3CI 'lOOH:JS
~Od ~NIN33~;)S Z-N0~38VG
8 XIGN3dd'v'

J7
DABERON A Screening Device for School Readiness
Virginia A. Danzer, M. Ed. Theresa M. Lyons, M.A. Mary Frances Gerber, M. Ed.
The Daberon Screenmg Device for four, f1ve and ~·•·year-old children surveys knowledge of body pans. color and number concepts, functional use of prepositions and plurals, the ability to follow d~rect1ons, general knowledge, v1sual perception, p•oss motor development, and the ability to categonze. A high percentage of accurate responses indicates school readoness. Inaccurate items may indicate future problem areas, the need for funher d1agnostic and prognostic study. mformat1on that needs to be taught, and/or needed med1cal or psychological attention.
Name Boy __ Girl __ _
Date of Test
Date of Birth
Age
Last
Year Month
First Middle
Day
Examiner Clinician-----------
Major Language: English Other------------
School Attended Grade ___ Room A.M. P.M. ___ All Day __
Needs Helo Needs Help 1. Bodv Parts 6. Plurals
2 Color Conceots 7. General KnowledQe
3. Number Conceots 8. Visual Perception 4. Prepositions 9. Gross Motor Development
5. Follows Directions 10. Categories Scoring: A • right or correct response; W • wrong or incorrect response; N • no response: I • inappropriate response (I.e .• child may echo examiner,
response not relevant to question, atc.l Instructions to examiner are enclosed in parentheses and should not be verbalized to child. Unintelligible response • Place star in I column on test form.
All Ages
1. What is your first name?
2. What is your last name?
3. How old are you? Fingers Used 0 All Three Year Olds , 4. Put your finger on your eye.
5. Put your finger on your neck.
6. Put your finger on your shoulder.
7. Put your finger on your elbow.
All Five Year Olds
8. What do you call this? (earl
9. What do you call this? (finger)
10. What do you call this? (knee)
11. What do you call this? (hair)
T2. What do you do with your eyes?
13. What do you do with your ears?
14. What do you do with your legs?
15. What do you do with your mouth?
All Ages
16. Give me one this color. (red)
17. Give me one this color. Jblue)
18. Give me one this color. (yellow)
19. Give me one this color. (green)
All Four Y ur Olds
20. Show me the blue one.
21. Show me the red one.
22. Show me the green one.
23. Show me the yellow one.
Copyright C 1972 by Daberon Research All righu reserved. 4202 S.W. 44th Ave.
R W N I 24. What color is this? (red)
25. What color is this? (green)
26. What color is this? (yellow)
27. What color is this? (blue)
All Five Year Olds
28. What color is this? (black)
29. What color is this? (brown)
30. What color is this? (orange)
31. What color is this? (white)
All Four Yur Olds
32. Counts to five. 12345
33. Counts to ten. 6 7 8 9 10
I 34. Give me one block.
35. Give me three blocks.
36. Give me two blocks.
I 37. Give me five blocks.
! 38. Give me four blocks.
I 39. How many do I have? (one)
I 40. How many do I have? (three)
41. How many do I hive? (five)
I 42. How many do I have? (seven)
All Four Yur Dlds
I I 43. Which is more? (4 and 10 blocks)
I 44. Give me all the blocks.
45. Which is less/fewer? (4 and 10 blocks)
I 46. How many eyes do you have?
I 47. How many teet does a dog have?
I l 48. How many wheels on a tricycle?
Portland, Oregon 97221 Phone (503) 292-9861 or 292-9460
R W N I
I
I I
i
I
I

38
R'W: N: I I i lwjN 11 I R ---r~
All Five Y ur Olds .--- - ~-~
All Five Year Olds i 1 ! ; I
49. Put your finger on the one in the middle. (Picture 1) : 89. What 1s a chair made of?
50. Put your fmger on the first one. (Picture 2) ! : I 90. What is a coat made of? :
-i
51. Put your finger on the tan one. i : : 91. What is a house made of? I i .
52. Put your finger on the second one. I : i All Six Y11r Olds I 53. Put your finger on the next tt' the last one. i 92. How are a spoon and a shoe different?
All Three Year Olds I I
I 93. How are a b1rd and a dog different?
54. P<Jt the car in the box. I I 94. How are wood and glass different? 1 ; ---4--,__ 55. Put the airplane under the box. ;
I : Can Copy: I i 56. Put the car behind the airplane. I 95. 3 years Circle
57. Put the car on the box. I 96. 4-4Y, years Cross
58. Put the car in front of the airplane. i i 97. 4Y. years Square I I
t I
59. Put the airplane next to the box. 98. 4·5 years X l
All ThrH Year Olds 99. 5 years Triangle I i I -60. Stand up. 100. 6 years 3-line cross I
f- ~-f--61. Sit down. 101. 3 years 3 block pyramid
62. Stand up and walk forward. 102. 3 years 5 block train
63. Walk backward. 103. 4 years 6 block pyramid
64. Raise your hand. 104. 5 years 10 block pyramid
65. Walk around your chair and sit down. 105. Handedness Right 0 Left 0 66. Clap your hands, take the ball, and go to the door. 106. Pencilgrasp Normal 0 Other 0 67. Show me the boys. (Picture 2) 107. Stands on one foot. (8 seconds) 68. Put your hands on the table. 108. Hops with both feet together. (7 or 8 hops) 69. Show me the wings. (airplane) 109. Hops on right foot. (3 or4 hops) 70. What's in the box? (cars) 110. Hops on left foot. (3 or 4 hops) 71. What are these? (blocks) 111. Gallops. (15 teet) 72. What's in my hand? (buttons) 112. Skips. (15 feet)
All FiYI Y•r Dlds 113. Sitting position catches rolled ball.
73. Which is bigger, a tree or a flower? I 114. Sitting position rolls ball to examiner.
74. Which is slower, a car or a bicycle? 115. Standing position catches bounced ball.
75. Which is heavier, a stove or a sock? 116. Standing position bounces ball to examiner. 76. Where do we buy gas? 117. Standing position throws ball. (overhand)
77. Where would you find a cow? 118. Standing position catches ball.
78. Whom do you go to when you are sick? All Five Year Dlds
79. What does a fireman do? Put these pictures where they belong.
80. What does a dentist do? I 119. Food
All Four Y •r Dlds
I 120. Clothing
81. What do you do when you are sleepy? 121. Animals
82. What do you do when you are hungry? What are these things called? -83. What do you do when you are thirsty? 122. Food 84. What are books for? 123. Clothing 85. What is a stove for? 124. Animals 86. What is a key for? Date: Total Correct 87. What is an umbrella tor? Date: Total Correct 88. What are houses for?
I Date: Total Correct
-- -
Comments:
A~O~N3ANI ~NIN33~~S A1~V3
~ XIGN3dd\i

ESl Early Screening Invento1y
S. f. Meisels and M. S. Wi.\ke
SCORE SHEET
Child's name------------------------- s~hool
Date of screening --- ----.,...--1 ----- TeJchcr -----------------------~·.-o~r rnunrh ,, .. ~.
Date of birth '·-- Screener __________________________________________ _ fCdf monrh '''"' Current age I ----;;;;;;;;I
Sex: male __ female __ Parent questionnzire completed! yes__ no __ __ ,. .... u
Tttrt!l 'ft•lt~l l'oH_, lr~il Rrfuu ruinU ruin I.< Comment.<
I. INITIAL ScREENING ITEMS rn<<ihl~ Rrai1·rrl
Draw a Person IS parts} ~
1 A.
B. Name or Other Letters !Ill 'IIU~'~II 11. VtS.UAi·MotoR/ AO.\rTIVE
A. Copy Forms \Il\l~~~~\~~~~lT&ill~\\\\I~ 1. CopyO 1
2. ·Copy+ 1
.1. Copy 0 'I
4. Copy 6 1
Copyri~Jn e 19@3 hy Teachers Collc~e. Columbia University. All riV.ts resernd. N., rsn of th!s pub!ication may be rrrroduccd or trJMn:imd In any form or b)' any means, clecuo:tic or mechanical, includin& photo.:opy, Clr any information uou&e lind u:triev:l S)'5tem, without ~rmiuion from the: J)Ublishrr. In ran Ill, C, Verbal Reuoninp:. opposite anlllo&ics I, 3, and 4 and their scorin& ue from L r.t Terman a.M. A. Mcnill, Stanford· Binet lntdligcncc Scale (BoJton: Jlou&hton Miffli:t, 1973), rp. 136, 148. Reprinted by permission of The Riverside Puhlishin& Company.
ISBN 0 11077-WI!O .\ 1k1tl ISBN 0 R077-f>0$3-IC frcfllll
I
<+:' 0

II. VJSUAL·MuroR/AuArTIVE (continued)
D. Visu:~l Sequcnti:JI Memory
I. + 0
2. 0 + 0
or + 0 0 (if fail)
c. Block Building
Gate (screen)
or Gate (imitate) (if fail)
or Bridge (screen) (if fail)
Ill. lANGUAGE AND COGNITION
A. Number Concept
I. Count 10 blocks
or Count 5 blocks (if fail)
2. How many altogether~
B. Verbal Expression N11mt CIII!IT
Ball
Dutton
Block
Car
Total Score for Verbal Expression ___
---- ~--
T11t11! P11ss Fall lltfuJr: ruin:s
rouilolt
0
I
I
tftifffft: ~tift{ ~!ffftftffif. ffltfffiffiJt 3
2
I
t!f!!ll!!tlft ~!fffM!f!If{. =tttttfftftt. t?J(.1·:.ift. iflfJtfif Wfffflffffffftf
2
I
I
Slwrt U.tt Orhn
Points Received (0-3)
0-5 "" 0 pts.,
6-20 .,. I pt;
21-35 == 2 pts.,
36+ "" 3 pts.
Torn/ ruin IS
Rtcrivtd
Iffftf[f!@!f[.
ifff!ff!fft!fi: ~ttfft!fttr
. \ ~j~j~~j~~~jj~jj~~~~j ~ li~l~l~~~~~~~Ill~ tmnrtt ·:·:·:·:·:·:·:·:·:·:·:·
~~\fi~f~?~[ !~I~t~~t~~t~
Commcr.rs
Comment.~
+I-'

,------------------------Torcll Tore~/
C. Verbal Reasoning Po.u Foil R~fu<c Pninrs Poinu C~"''""'"'~ Pm.<ihl~ P.ccdv~d
I. B,rothc.r is a boy; 1 SISter IS a
2. A horse i~ big; 1 a mouse IS
3. A table is made of wood; 1 a window of .
4. A ~ird flies; a fish 1
D. Auditory Sequential Memory ifJJfff} 1JJjff[f: =fJff!JftfJliJJffjJJJfffJffJff{ !fJff§JjfffJJjJj{
I. 9-3 0
2. 5-1-6 1
or 6-2-8 lrf/oill I
J. 2-7-4-9 2
or 5-9-6-J li/ (oi/J 2
IV. GROSS MoToR/BoDY AWARENESS ~}Jt ifi!ffi!t!!f: ;tf!!fftffffftf[ f!Ifffifff f!it?f!!{f!fff A. Balance 12 of 3 attempts) !!i!fftftff!f i{i}Jffff iffi}}Jf f{J}fifftff ifif!Jififf?Jf{!;
10 seconds 2
or 5 seconds 1
B. Imitate Movements f{!i!!ffJ! f!}f!f !}}f!ff[J! !ffJ!fft!!!fJ!ff) ;J}!il!Jff{ Smooth: 2 or less corrected errors 2
or Hesitant: more than 2 corrected errors I
or More than 2 uncorrected 0 errNs
C. Hop i!fJ}[f!;;.!fjfififftf! !JJ!JJ!J}: )JJi!{f{!!J!i}: =;{}f}ff{ Five times on each foot 2
(;; Twice on either foot 1
~-[)· Skip WJ!t ?iff Hfti JNHiN~ JMft& Two·footed 2
or One·footed 1
TOTAL SCREENING SCORE +=l\)

S~S3~ ~0 S3~0~S MV~
a XIGN3ddV
44
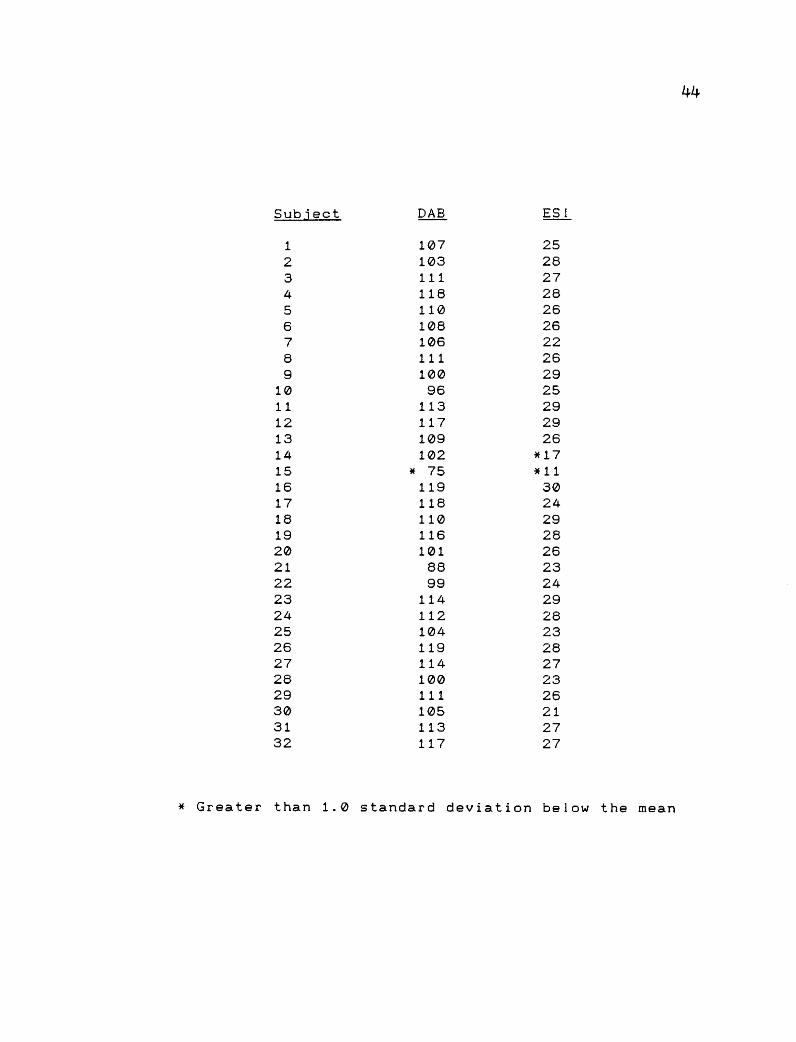
Subject DAB ESI
1 107 25 2 103 28 3 111 27 4 118 28 5 110 26 6 108 26 7 106 22 8 111 26 9 100 29
10 96 25 11 113 29 12 117 29 13 109 26 14 102 *17 15 * 75 *11 16 119 30 17 118 24 18 110 29 19 116 28 20 101 26 21 88 23 22 99 24 23 114 29 24 112 28 25 104 23 26 119 28 27 114 27 28 100 23 29 111 26 30 105 21 31 113 27 32 117 27
* Greater than 1.0 standard deviation below the mean

W'80.::I NOI~'v'n1'v'/\3
3 XIGN3dd'v'

46
Evaluator's Name
Child's Name
Date
Day Care Center/Nursery
Please check the word that applies regarding your opinion of this child's success in their current pre-school setting. Your results will be kept confidential.
Successful
Unsuccessful
Somewhat successful


