A Comparison of Variance Estimatesfor Schools and Students Using Taylor Series
and Replicate Weighting
Ellen Scheib, Peter H. Siegel, and James R. Chromy RTI International
Presented atThird International Conference on Establishment Surveys (ICES-III)
June 21, 2007
RTI International is a trade name of Research Triangle Institute
3040 Cornwallis Road ■ P.O. Box 12194 ■ Research Triangle Park, NC 27709Phone 919-541-6000 e-mail [email protected]

2
Acknowledgements
The data used in this presentation were produced for the U.S. Department of Education, National Center for Education Statistics (NCES), under Project no. 0207818
The views expressed in this presentation do not necessarily reflect the official policies of NCES or RTI International; nor does mention of trade names, commercial practices, or organizations imply endorsement by the U.S. Government

3
Introduction – Background and Purpose
Choices with replication
● One or two sampling stages
● Some or all weight adjustments
● Overall or replicate-level control totals
● Finite population correction (fpc)
Replication examples in NCES studies
● National Postsecondary Student Aid Study (NPSAS)
● School and Staffing Survey (SASS)
● Education Longitudinal Study of 2002 (ELS:2002)

4
Introduction – Variance Estimation Methods
Taylor series linearization
Replication
● Jackknife
● Bootstrap
● BRR

5
Introduction – Overview of ELS:2002
Sample design
● Base-year
● First follow-up
● Transcript
● Second follow-up
■ Weighting
● Nonresponse adjustment
● Poststratification/calibration

6
Replication of School Sampling Stage
Formed strata and PSUs for all sample schools
Collapsed strata
200 replicates
FPC not necessary

7
Replication of Student Sampling Stage
Same strata and PSUs as for schools
Used school BRR weight to help compute initial student BRR weight
Used prior round BRR weight as starting point for current round BRR weight

8
Replication of Nonresponse Adjustment
1 adjustment for the school weight
2 adjustments for each student weight
Deleted variables from the model, where necessary, to achieve convergence

9
Replication of Poststratification/Calibration
Base year schools poststratified to population totals
Base year students not poststratified
Students in follow-up rounds calibrated to previous round weight sums
Replicate-level control totals
- Computed weight sums for each replicate
Deleted variables from the model, where necessary, to achieve convergence

10
Comparison of Variance Estimates
Variance estimates influenced by:
● Unequal weighting
● Stratification
● Clustering
● Nonresponse adjustment
● Poststratification

11
Comparison of Variance Estimates (cont.)
Poststratification to “known” population totals causes the sampling variance for estimates of the totals to go to zero
Repeating the poststratification step on each half sample replicate ensures that the variance estimates for the control total estimates are zero
Calibration to previous round half sample data causes the variance estimates for the control total estimates to not be zero

12
Comparison of Variance Estimates (cont.)
Compared standard errors computed using both the Taylor series and BRR variance estimation methods
BRR standard errors more conservative
BRR and Taylor series standard errors larger than simple random sample standard errors

13
Base Year School Standard Errors
School weight Estimates compared 44 Estimates with BRR standard error less than Taylor series standard error
14 (31.8%)
Estimates with simple random sample standard error less than Taylor series and BRR standard errors
33 (75.0%)

14
Base Year School Design Effects
0.0
1.0
2.0
3.0
4.0
5.0
6.0
BRR Taylor Series
School Weight
Des
ign
Eff
ect
25th Percentile Minimum Mean 50th Percentile Maximum 75th Percentile

15
Base Year Student Standard Errors
Student weight Estimates compared 204 Estimates with BRR standard error less than Taylor series standard error
40 (19.6%)
Estimates with simple random sample standard error less than Taylor series and BRR standard errors
196 (96.1%)

16
Base Year Student Design Effects
0.0
1.0
2.0
3.0
4.0
5.0
6.0
7.0
8.0
9.0
BRR Taylor Series
Student Weight
Des
ign
Eff
ect
25th Percentile Minimum Mean 50th Percentile Maximum 75th Percentile

17
First Follow-Up Standard Errors
Cross-sectional student weight
Estimates compared 86 Estimates with BRR standard error less than Taylor series standard error
22 (25.6%)
Estimates with simple random sample standard error less than Taylor series and BRR standard errors
82 (95.3%)

18
First Follow-Up Design Effects
0.0
0.5
1.0
1.5
2.0
2.5
3.0
BRR Taylor Series
Cross-sectional Student Weight
Des
ign
Eff
ect
25th Percentile Minimum Mean 50th Percentile Maximum 75th Percentile

19
Second Follow-Up Standard Errors
Cross-sectional student weight
Estimates compared 58 Estimates with BRR standard error less than Taylor series standard error
14 (24.1%)
Estimates with simple random sample standard error less than Taylor series and BRR standard errors
57 (98.3%)
20
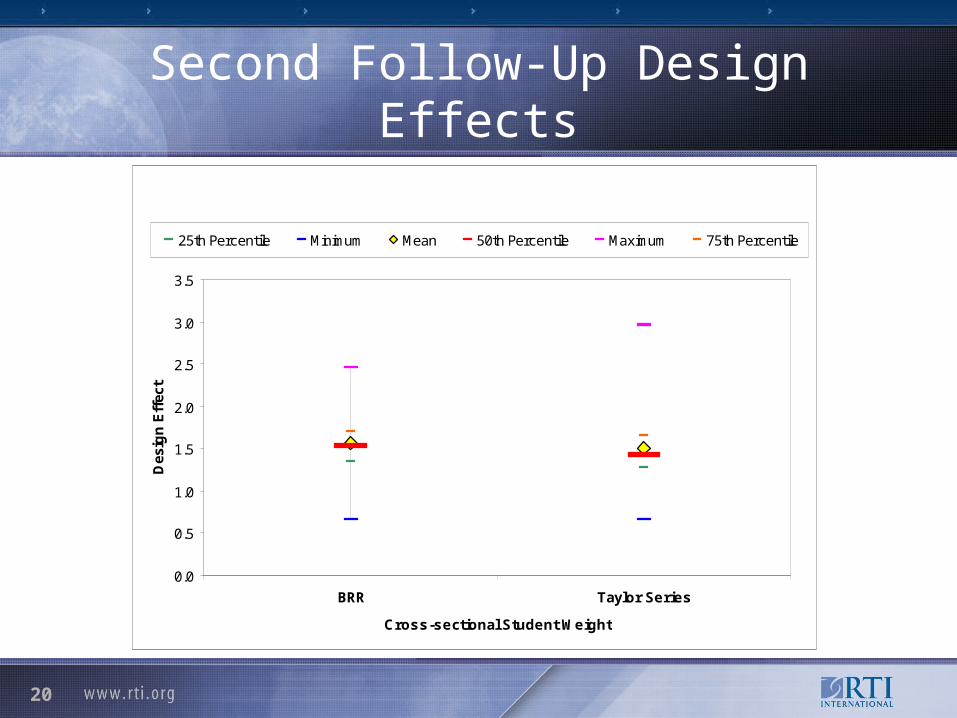
Second Follow-Up Design Effects
0.0
0.5
1.0
1.5
2.0
2.5
3.0
3.5
BRR Taylor Series
Cross-sectional Student Weight
Des
ign
Eff
ect
25th Percentile Minimum Mean 50th Percentile Maximum 75th Percentile

21
Conclusions
BRR takes into account the variance due to weight adjustments, so these results are expected
Controlling to replicate-level totals recognizes variance in base year totals due to sampling variability, so the results are more conservative
Worthwhile to replicate all stages and all adjustments if time permits


