
A COMPONENT-BASED APPROACH TO MODELLING BEAM-END BUCKLING ADJACENT TO BEAM-COLUMN CONNECTIONS IN
FIRE
A thesis submitted for the degree of
Doctor of Philosophy
In the Faculty of Engineering of
The University of Sheffield
by
GUAN QUAN
Department of Civil and Structural Engineering The University of Sheffield
August, 2016

I
ACKNOWLEGEMENTS
My special thanks go to Professor Ian Burgess and Dr Shan-Shan Huang for their
guidance, inspiration and dedication in supervising me throughout my research project.
Their continuous awareness and rich experience made this PhD project nowhere near
a lofty mountain, but near a highway. My thanks also go to their financial support on
my international conferences, which are great opportunities to present my own work
and to communicate with worldwide researchers. The financial support provided by
CSC program and by the University of Sheffield is also greatly appreciated.
My thanks also go to my colleagues and friends in the Structural Fire Engineering
Research Group for the precious friendship we developed; and to Dr Ruirui Sun for his
continuous advice on the development of Vulcan. I would like to express my
gratefulness to my family for their love, understanding and sharing during the course
of my PhD. Thanks to my boyfriend Dr Jun Ye. We have been together for more than
six years from Wuhan University to Zhejiang University in China and to the University
of Sheffield in the UK. Thank you for your love, accompany and support. I’m glad that
we are going to put an end to our PhD courses as well as our single states together.

II
DECLARATION
I certify that this thesis submitted for the degree of Doctor of Philosophy is the result
of my own research, except where otherwise acknowledged. No portion of the work
presented in this thesis has been submitted for another degree or qualification to this,
or any other university or institution.
Guan QUAN
(Signature of candidate) 28th August, 2016
III
ABSTRACT
The investigation of the collapse of “7 World Trade” as part of the events of 11
September 2001 in New York City (Gann, 2008) indicated that connections were
among the most vulnerable elements of steel-framed or composite buildings, and their
characteristics can determine whether such buildings survive in extreme scenarios
such as fire. In this case total collapse of the building was triggered by the fracture of
beam-to-column connections caused largely by thermal expansion of long-span
beams. This emphasized the importance of investigating the complex mechanisms
through which forces are transferred from the adjacent parts of a structure to the
connections under fire conditions.
The Cardington fire tests in 1995-96 (Newman, 2000) provided ample evidence that
both shear buckling of beam webs and beam bottom-flange buckling, near to the ends
of steel beams, are very prevalent under fire conditions. Both of these phenomena
could affect the force distribution at the adjacent column-face connection bolt rows,
and therefore the sequence of fracture of components. However, there is a distinct
lack of practical research investigating the post-buckling behaviour of beams of Classes
1 and 2 sections adjacent to connections at elevated temperatures.
In this PhD thesis, the development of analytical models of pure beam-web shear
buckling and a combination of both beam-web shear buckling and bottom-flange
buckling of beams of Classes 1 and 2 sections are reported. The analytical models are
able to predict the post-buckling behaviour of the beam-end buckling panels in the
vicinity of beam-column connections at elevated temperatures. A transition criterion,
to distinguish between cases in which pure beam-web shear buckling occurs and those
in which the instability is a combination of shear buckling and bottom-flange buckling,
IV
has been proposed, including a calculation procedure to detect the transition length
between these two buckling modes. A component-based buckling element has been
created and implemented in the three-dimensional structural fire analysis software
Vulcan. The influence of the buckling elements on the bolt row force redistribution of
the adjacent connections has been investigated in isolated beams and a simple two-
span two-floor frame. It is expected that the buckling element will be involved in more
complex performance-based frame analysis for design, and that it will be used with an
explicit dynamic procedure to simulate local and progressive collapse of whole
buildings.
V
PUBLICATIONS
Journal papers:
1. Quan, G., Huang, S.-S. & Burgess, I.W., 2015. An Analytical Approach to Modelling
Shear Panels in Steel Beams at Elevated Temperatures. Engineering Structures, 85,
73-82.
2. Quan, G., Huang, S.-S. and Burgess, I.W., 2016. Component-Based Model of Buckling
Panels of Steel Beams at Elevated Temperatures. Journal of Constructional Steel
Research, 118, 91–104.
3. Quan, G., Huang, S.S. and Burgess, I.W., 2016. Parametric Studies on the
Component-Based Approach to Modelling Beam Bottom Flange Buckling at Elevated
Temperatures. Acta Polytechnica,56(2), 132–137.
4. Quan, G., Huang, S.-S. and Burgess, I.W., 2016. The Behaviour and Effects of Beam-
End Buckling in Fire using a Component-Based Method. Acc. Engineering Structures.
Conference papers:
1. Quan, G., Huang, S.-S. and Burgess, I.W., 2014. Shear Panel Component in the
Vicinity of Beam-Column Connections in Fire. Proc. Structures in Fire Conference,
Shanghai, China, 827-835.
2. Quan, G., Huang, S.-S. and Burgess, I.W., 2014. Shear Panel in the Vicinity of Beam-
Column Connections - Component-Based Modelling. Proc. Eurosteel 2014, Naples,
Italy, 218-225.
3. Quan, G., Huang, S.-S. and Burgess, I.W., 2015. A Parametric Investigation of the
Transition Between Beam-Web Shear Buckling and Bottom-Flange Buckling at
Elevated Temperatures, Proc. CONFAB 2015, Glasgow, UK, 273-278.
4. Quan, G., Huang, S.S. and Burgess, I.W., 2015. A Component-Based Approach to
Modelling Beam Bottom Flange Buckling at Elevated Temperatures, Proc. ASFE 2015,
Dubrovnik, Croatia, 19-24.
5. Quan, G., Huang, S.S. and Burgess, I.W., 2016. Component-Based Element of Beam
Local Buckling Adjacent to Connections in Fire. Proc. Structures in Fire Conference,
Princeton, USA, 352-359.
VI
TABLE OF CONTENTS
ACKNOWLEGEMENTS ................................................................................................ I
DECLARATION .......................................................................................................... II
ABSTRACT ............................................................................................................... III
PUBLICATIONS ......................................................................................................... V
TABLE OF CONTENTS ............................................................................................... VI
......................................................................................................................... 1 1.
INTRODUCTION ........................................................................................................ 1
1.1 BACKGROUND 2
1.2 RESEARCH MOTIVATIONS 7
1.3 SCOPE OF THIS RESEARCH 9
....................................................................................................................... 11 2.
LITERATURE REVIEW .............................................................................................. 11
2.1 MATERIAL PROPERTIES 12
2.2 FIRE RESISTANCE DESIGN METHODS 15
2.3 RESEARCH INSPIRED BY CARDINGTON FIRE TESTS 17
2.3.1 The Cardington Fire Tests .......................................................................................... 17
2.3.2 Steel beam and concrete slab research inspired by the Cardington Fire Tests ......... 19
2.4 FRAME NUMERICAL MODELLING 21
2.5 PROGRESSIVE COLLAPSE OF WTC7 BUILDING 24
2.6 JOINT MODELS 25
2.7 SHEAR BUCKLING OF PLATE GIRDERS 29
2.8 BOTTOM-FLANGE BUCKLING YIELD LINE MODELS 31
2.9 CONCLUSION 34
....................................................................................................................... 36 3.
AN ANALYTICAL APPROACH TO MODELLING SHEAR PANELS IN THE POST-BUCKLING
STAGE AT ELEVATED TEMPERATURES ..................................................................... 36
3.1 INTRODUCTION 37
3.2 DEVELOPMENT OF ANALYTICAL MODEL 37
3.2.1 The deflection at mid-span ........................................................................................ 41
3.2.2 Shear resistance of the beam .................................................................................... 43
3.3 VALIDATION AGAINST FINITE ELEMENT MODELLING 53
3.4 CONCLUSION 58
....................................................................................................................... 60 4.
COMBINING THE EFFECTS OF SHEAR BUCKLING AND BOTTOM-FLANGE BUCKLING IN
THE POST-BUCKLING STAGE ................................................................................... 60
4.1. INTRODUCTION 61
4.2. DEVELOPMENT OF ANALYTICAL MODEL 64
4.2.1 Pre-buckling stage and plateau.................................................................................. 65
VII
4.2.2 Post-buckling stage ................................................................................................... 65
4.3 VALIDATION AGAINST FINITE ELEMENT MODELLING 78
4.3.1 Validation of FE model against experimental results................................................ 78
4.3.2 Comparison between the proposed analytical model, Dharma’s model and FEA ... 84
4.3.3 Integration into a full beam model ........................................................................... 94
4.4 CONCLUSION 96
....................................................................................................................... 98 5.
A PARAMETRIC INVESTIGATION OF THE TRANSITION LENGTH BETWEEN BEAM-WEB
SHEAR BUCKLING AND BOTTOM - FLANGE BUCKLING AT ELEVATED TEMPERATUR .. 98
5.1 INTRODUCTION 99
5.2 CALCULATION PROCEDURE TO DETECT THE TRANSITION LENGTH 100
5.3 VALIDATION AGAINST ABAQUS MODELS 101
5.3 COMPARISON WITH THE ANALYTICAL MODEL AND TRANSFER CRITERION 103
5.4 CONCLUSION 107
..................................................................................................................... 109 6.
THE BEHAVIOUR AND EFFECTS OF BEAM-END BUCKLING IN FIRE USING A
COMPONENT-BASED METHOD ............................................................................. 109
6.1 INTRODUCTION 110
6.2 CREATION OF THE COMPONENT-BASED MODEL 110
6.3 LOADING AND UNLOADING PATHS OF THE BUCKLING ELEMENT 113
6.3.1 At constant temperature ........................................................................................ 114
6.3.2 During transient heating ......................................................................................... 122
6.4 RESULTS 126
6.4.1 Verification of the Vulcan models ........................................................................... 126
6.4.2 Illustrative examples of beams with buckling and connection elements ............... 142
6.4.3 Frame analysis ......................................................................................................... 148
6.5 CONCLUSION 152
..................................................................................................................... 155 7.
SUMMARY, DISCUSSION, CONCLUSIONS AND RECOMMENDATIONS FOR FURTHER
WORK .................................................................................................................. 155
7.1 SUMMARY 156
7.2 DISCUSSION AND CONCLUSIONS 159
7.3 RECOMMENDATIONS FOR FURTHER WORK 161
7.3.1 Behaviour of connections in fire ............................................................................. 161
7.3.2 Progressive collapse of buildings ............................................................................ 162
7.3.3 Three-dimensional composite beam analysis at non-uniformly distributed
temperatures ................................................................................................................... 163
7.3.4 Buckling of cellular beams ....................................................................................... 165
REFERENCES ......................................................................................................... 167
APPENDIX ............................................................................................................. 173
VIII
LIST OF FIGURES
Figure 1-1 Flange buckling and beam-web shear buckling in combination (Newman et al., 2000)
8
Figure 2-1 Sequence of descriptions of 3D structure in fire 12
Figure 2-2 Stress-strain relationship for carbon steel at elevated 13
Figure 2-3 Reduction factors for the stiffness and strength of carbon steel at elevated
temperatures 14
Figure 2-4 Typical floor plan (NIST, 2008) 25
Figure 3-1 Comparisons of web panel behaviour for plate girders and Beams of Class 1 and 2
sections under shear and bending 38
Figure 3-2 Schematic tri-linear force-deflection curve of a shear panel 39
Figure 3-3 Stress-strain relationship of structural steel; (a) at ambient temperature; (b) at
elevated temperatures 41
Figure 3-4 Representative strip and arbitrary point 42
Figure 3-5 Possibilities for the position of plastic hinges; (a) Case 1; (b) Case 2; (c) Case 3 43
Figure 3-6 Case 1: (a) Geometric relationship; (b) Movement relationship in Region B 44
Figure 3-7 Case 3: (a) Geometric relationship; (b) Movement relationship in Region B 46
Figure 3-8 Struts representing compressive strips 50
Figure 3-9 Cross section of one strut 51
Figure 3-10 Finite element model; (a) Image of finite element model; (b) Boundary conditions;
(c) Cross section dimensions (in mm) 54
Figure 3-11 Comparison of force-displacement curves between ABAQUS and theoretical
analysis 56
Figure 3-12 Distance between plastic hinges calculated from the analytical model 57
Figure 3-13 Shear buckling of 3m beam 58
Figure 3-14 Bottom flange buckling of 6m beam 58
Figure 4-1 Flange buckling and beam-web shear buckling in combination (Newman et al., 2000)
61
Figure 4-2 Stress-strain relationship of structural steel 65
Figure 4-3 Schematic force-deflection curve of a beam-end buckling model 65
Figure 4-4 Plastic Buckling Mechanism 66
Figure 4-5 The effects of flange buckling and beam-web shear buckling on beam vertical
deflection (a) bottom-flange buckling; (b) shear buckling; (c) total deflection 67
Figure 4-6 Flange yield line mechanism (a) bottom flange; (b) top flange 68
Figure 4-7 Deformation compatibility between bottom flange and beam web (a) real-beam
deformation; (b) deformation in the model 68
Figure 4-8 Beam-web yield line pattern 69
Figure 4-9 Beam-web behaviour under shear force (a) Overall behaviour; (b) Tensile strips; (c)
Compressive strips 70
Figure 4-10 Mohr’s circle for one yield line (7-8) 73
Figure 4-11 Strut representing an arbitrary compressive strip 75
Figure 4-12 Deformed shape caused by shear buckling of the beam web 76
Figure 4-13 Deformed shape caused by bottom-flange buckling 76
IX
Figure 4-14 Test set-up (Dharma and Tan, 2008) 79
Figure 4-15 Mesh sensitivity analysis 81
Figure 4-16 Finite element model. (a) Image of finite element model; (b) cross section
dimensions (in mm) 82
Figure 4-17 Load-deflection comparison between FEA and test results 83
Figure 4-18 Comparison of failure modes of Test 3-2 (Dharma and Tan, 2008) and FEA 84
Figure 4-19 The finite element model 85
Figure 4-20 Comparison between the analytical model, Dharma’s model and FE analysis 87
Figure 4-21 Comparison of predictions of the new model and Dharma’s model: (a) FEA1; (b)
FEA2 89
Figure 4-22 The analytical model 90
Figure 4-23 Finite element model: (a) image of finite element model; (b) cross-section
dimension 91
Figure 4-24 Comparison between the analytical model, Dharma’s model and FE analysis (web
thickness varies) 92
Figure 4-25 Comparison between the proposed analytical model and Dharma’s model (flange
thickness varies) 93
Figure 4-26 Deformed shape: (a) ABAQUS contour; (b) Simplified theoretical deformed shape
95
Figure 4-27 Force-deflection relationship of the example beam 96
Figure 5-1 Flowchart of calculation procedure of the buckling transition criterion 100
Figure 5-2 ABAQUS image, loading conditions and boundary conditions of Group A&B 102
Figure 5-3 Comparison between the analytical and FE models for Group A 103
Figure 5-4 ABAQUS result visualization of Group B (a). L=750mm; (b). L=2000mm 105
Figure 5-5 Comparison between the analytical and FE models for Group C 106
Figure 5-6 ABAQUS result visualization for Group B (a). L=2000mm; (b). L=6000mm 106
Figure 6-1 The effects of (a) bottom-flange buckling, (b) shear buckling and (c) total deflection
on beam vertical deflection. 111
Figure 6-2 Component-based column-face connection and beam-end buckling elements 112
Figure 6-3 A schematic illustration of application of the Masing Rule 114
Figure 6-4 Moment-rotation relationship of the buckling element 115
Figure 6-5 Schematic characteristics of the compression spring on the buckling flange 116
Figure 6-6 New unloading-loading curves at different stages: (a) pre-buckling stage; (b) plateau;
(c) post-buckling stage 119
Figure 6-7 Schematic characteristics of the tension spring 121
Figure 6-8 Loading and unloading procedure when temperature increases: (a) at temperature
; (b) at temperature ( > ) 123
Figure 6-9 Flowchart of the developed procedure for modelling the compression spring 124
Figure 6-10 Comparison of Vulcan models: (a) beam with buckling elements; (b) beam with
beam elements only 127
Figure 6-11 Comparison of ABAQUS models: (a) beam with shell elements; (b) beam with line
elements only 128
Figure 6-12 Force-deformation relationship of the springs in the buckling element: (a) bottom
spring; (b) top spring 130
Figure 6-13 The development of mid-span deflection as temperature rises for 6m beams: (a)
for load ratio = 0.4; (b) for load ratio = 0.5; (c) for load ratio = 0.6 132
1T 2T 2T 1T
X
Figure 6-14 The development of mid-span deflection as temperature rises for 9m beams: (a)
for load ratio = 0.4; (b) for load ratio = 0.5; (c) for load ratio = 0.6 133
Figure 6-15 Comparisons of axial net force against temperature for 6m beams: (a) for load
ratio = 0.4; (b) for load ratio = 0.5; (c) for load ratio = 0.6 135
Figure 6-16 Comparisons of axial net force against temperature for 9m beams 137
Figure 6-17 Comparisons of beam-end bending moment against temperature for 6m beams
139
Figure 6-18 Comparisons of beam-end bending moment against temperature for 9m beams
140
Figure 6-19 Comparison of the ABAQUS results 142
Figure 6-20 Details of the analysed endplate connections: (a) for 6m beams; (b) for 9m beams
143
Figure 6-21 Bolt row force distribution for 6m beams 146
Figure 6-22 Bolt row force distribution for 9m beams 147
Figure 6-23 Studied frame dimension 149
Figure 6-24 Deflections of Node 1 for cases with and without the buckling element 149
Figure 6-25 Axial forces in different components of the analysed connection 150
Figure 6-26 Detailed bolt-row forces at Node 2 151
Figure 6-27 Vertical displacement of Node 2 152
Figure 6-28 Horizontal displacement of Node 2 152

XI
LIST OF TABLES
Table 2-1 Collapse yield line mechanisms in the post-buckling stage ........................................ 33
Table 3-1 Material Properties of the FE model at ambient temperature .................................. 54
Table 4-1 Components of internal plastic work for plastic squash zones .................................. 72
Table 4-2 Components of internal plastic work for yield lines ................................................... 72
Table 4-3 Results of tensile coupon tests at ambient temperature (MPa) 79
Table 4-4 Measured cross-section dimensions (in mm) and test temperature (in °C) 82
Table 4-5 Detailed group information ........................................................................................ 86
Table 4-6 Material Properties ..................................................................................................... 91
Table 5-1 Cross-section dimensions of the beams analysed .................................................... 101

XII
LIST OF SYMBOLS
distance between plastic hinges along the bottom flange
flange width
half flange width
depth of a beam web
Length of an arbitrary tensile strip
young’s modulus of steel at elevated temperatures
vertical shear force at the end of the buckling zone
shear resistance of the beam at the end of elasticity
maximum reaction force
vertical reaction force at the initiation of plastic shear buckling
vertical reaction force when plastic bending moment resistance is
reached
ultimate shear resistance of the beam
reduction factor for Young’s modulus
half length of the beam
full length of a beam
Lm full length of a member
bending moment at the end of the buckling zone
plastic bending moment capacity of one flange
reduced plastic bending moment capacity of one flange
bending moment resistance of one beam-web compressive strut
axial force resistance of one beam-web compressive strut
heating time
thickness of the beam flange
thickness of the beam web
temperature of the furnace atmosphere next to the specimen
ambient temperature
the internal work of tensile strips in Region A
the internal work of tensile strips in Region B
the internal work of the beam web caused by compression
the external work of the beam
the internal work of the plastic hinges on the beam flanges
the internal work of the beam web caused by tension
the angle between tensile strips and the deformed upper flange
the angle between diagonal of the shear panel and deformed upper
a
b
c
d
e
,E
F
eF
maxF
,p SF
,p TF
uF
,Ek
l
L
M
0M
1M
pM
cP
t
ft
wt
T
0T
AtW
BtW
CW
eW
fW
TW
XIII
flange
elongation of an arbitrary tensile strip
elongation of the tensile strip in Region A
elongation of the tensile strip in Region B
out-of-plane deflection of one strut
mid-span deflection at the end of elasticity
temperature-induced elongation
mid-span deflection at the initiation of plastic shear buckling
the resultant movement of the right point of the representative
strip in Region B
the resultant movement of the right edge of the shear panel
ultimate mid-span deflection
mid-span deflection caused by bending moment
the vertical movement of the right point of the representative strip
in Region B
the vertical movement of the mid span caused by shear force
the vertical movement of the right edge of the shear panel
limiting strain for yield strength at elevated temperatures
strain at the proportional limit at elevated temperatures
tensile strain of a tensile strip
ultimate strain of steel at elevated temperatures
yield strain of steel at elevated temperatures
the rotation caused by bottom-flange buckling
the rotation caused by shear buckling
steel temperature
compressive stress in the compressive strips
compressive stress in the flange along beam length
yield strength of the flange considering reduction caused by axial
stresses and shear stresses
yield strength of the flange considering reduction caused by axial
stress parallel to yield lines
stress normal to the yield lines
tensile stress in the tensile strips
tensile stress in the flange along beam length
stress at the proportional limit at elevated temperatures
yield strength of steel at elevated temperatures
e
tA
tB
e
mL
p
rB
rs
u
vb
vB
vm
vs
,l
,p
t
,u
y,
1
2
a
c
cf
eq
1eq
r
t
tf
p,
y,

XIV
yield strength of the flange without considering reduction at
elevated temperatures
yield strength of steel web at elevated temperatures
shear force parallel to the yield lines
,yf
,yw
r

1
1.
INTRODUCTION
1. Introduction
2
1.1 BACKGROUND
Steel is one of the most popular construction materials for buildings world-wide. Its
high strength-to-weight character enables steel structures to be built using longer
spans with smaller foundations, which allow high flexibility in layout for architects. The
fast erection sequences make steel construction more time-efficient than competing
systems. However, due to the high thermal expansion coefficient of steel, high axial
forces will be produced in members of steel structures when they are heated, due to
restraint to thermal expansion. Moreover, the strength and stiffness of steel both
decrease at a faster rate than those of other structural materials at high temperatures.
This emphasizes the necessity to provide additional protection to steel structures
against fire.
The main objectives of fire protection are usually fulfilled by applying active and
passive measures, either alone or in combination. Active measures include detection,
alarms and sprinklers, which come into operation only in the event of fire; whereas
passive measures include escape provisions, compartmentation and structural
protection, as part of the built system. Structural fire engineers are involved in the
specification of passive fire protection to ensure that the structure is designed and
constructed such that its stability will be maintained for an appropriate period (CEN,
2005b). For steel-framed structures, the most commonly used form of passive fire
protection is to apply a layer of insulating material to provide adequate thermal
insulation to steel members. Although this approach has proved adequate, it can be
extremely conservative. Also, application of protective materials can be relatively
expensive compared with the frame cost, and can affect the appearance of a building.
It is preferable that intensive fire protection should only be applied to critical elements.
1. Introduction
3
Therefore, it is very important for fire engineers to further develop their
understanding of the behaviour of steel structures when affected by fire, in order to
distinguish critical elements, and to promote the efficient use of steel protection in
construction.
The establishment of the British Fire Protection Committee (BFPC) at the end of the
20th century initiated a scientific approach to research into structural fire resistance.
In the UK, the primary corresponding national standard is BS 5950-8:1990: Structural
use of steelwork in building (BS, 1990). The more recent CEN 1993-1-2 (CEN, 2005b)
and CEN 1994-1-2 (CEN, 2005d), which supersede BS 5950-8, present structural fire
design in terms of general concepts, material properties and calculation procedures.
However, the current fire design codes (Standard, 1990, CEN, 2005b, CEN, 2005d)
were developed from standard fire tests on isolated elements, and these tests ignore
the interactions between elements. However, the importance of considering the
interactions between elements in structural fire design was revealed in the late 19th
century.
Several full-scale fire tests were carried out within a fire research programme
conducted on modern multi-storey composite structures built within the BRE large
scale test facility at Cardington during 1995-96. The tested structures included an
eight-storey steel-framed composite building (Newman et al., 2000) and a seven-
storey reinforced concrete building (Bailey and Moore, 2000a, Bailey and Moore,
2000b). The Cardington tests revealed that the performance of a whole building in real
fires is much better than that of isolated members in standard fire conditions. This
generated an awareness that the interactions between the structural members should
be fully taken into consideration in fire-resistant design, since structural performance
in fire is controlled by high geometrical and material nonlinearity. The large deflections
1. Introduction
4
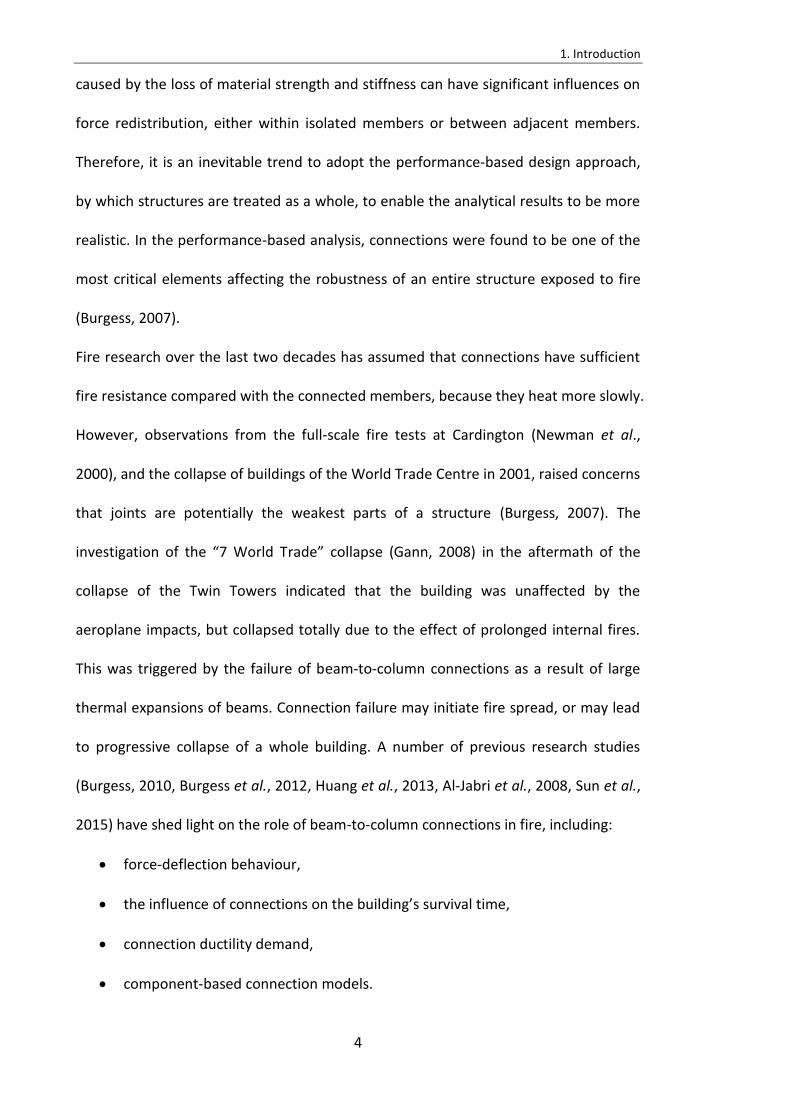
caused by the loss of material strength and stiffness can have significant influences on
force redistribution, either within isolated members or between adjacent members.
Therefore, it is an inevitable trend to adopt the performance-based design approach,
by which structures are treated as a whole, to enable the analytical results to be more
realistic. In the performance-based analysis, connections were found to be one of the
most critical elements affecting the robustness of an entire structure exposed to fire
(Burgess, 2007).
Fire research over the last two decades has assumed that connections have sufficient
fire resistance compared with the connected members, because they heat more slowly.
However, observations from the full-scale fire tests at Cardington (Newman et al.,
2000), and the collapse of buildings of the World Trade Centre in 2001, raised concerns
that joints are potentially the weakest parts of a structure (Burgess, 2007). The
investigation of the “7 World Trade” collapse (Gann, 2008) in the aftermath of the
collapse of the Twin Towers indicated that the building was unaffected by the
aeroplane impacts, but collapsed totally due to the effect of prolonged internal fires.
This was triggered by the failure of beam-to-column connections as a result of large
thermal expansions of beams. Connection failure may initiate fire spread, or may lead
to progressive collapse of a whole building. A number of previous research studies
(Burgess, 2010, Burgess et al., 2012, Huang et al., 2013, Al-Jabri et al., 2008, Sun et al.,
2015) have shed light on the role of beam-to-column connections in fire, including:
force-deflection behaviour,
the influence of connections on the building’s survival time,
connection ductility demand,
component-based connection models.
1. Introduction
5
The characteristics of connections, especially their ductilities, can influence the
robustness of a whole building, and therefore, need to be paid special attention to.
There is a great variation of the definitions of robustness used for technical
applications; a robust solution in an optimization problem is the one that has the best
performance under its worst case (Kouvelis and Yu, 2013); the robustness in control
theory is the degree to which a system is insensitive to effects that are not considered
in the design (Slotine and Li, 1991); a procedure can also be said to be robust if the
results are stable, convergent and accurate relative to the input (Sun et al., 2012b). In
structural engineering, a structure is said to be robust if initial local damage does not
extend to a progressive collapse or other damages, which violates the key structure
performance (Starossek and Haberland, 2010).
Design methods to ensure a robust structure have been categorized into two types,
namely the direct and indirect approaches. Direct robustness design aims at resisting
collapse by verifying that the key structure elements meet specified performance
objectives subjected to specified hazard scenarios. This can be achieved using an
alternative load path, in which the key structural components are able to resist local
initial damage. In other words, direct design strongly relies on local structural
resistance. On the other side, the indirect design approach focuses on enhancing
structural robustness through continuity, redundancy and ductility.
Robustness of structures under extreme loading has been recognized as a desirable
property of structures and structural systems since the collapse of the Ronan Point
apartment building in 1968. In this incident, a gas explosion on the 18th floor led the
entire southeast part of the apartment block to collapse (Pearson and Delatte, 2005).
Renewed interest in this topic was generated as a result of the attack on the World
Trade Center in New York in 2001 (Gann, 2005), in which simultaneous post-flashover
1. Introduction
6
fires on several adjacent storeys eventually triggered complete collapse. Fire disasters
of this kind can induce massive loss of life, severe damages to properties, large
economic losses and the disruption of education and public services.
The software Vulcan (Vulcan Solution Ltd, 2015), developed by the Structural Fire
Engineering Research Group at the University of Sheffield is a three-dimensional
program which allows engineers to conduct three-dimensional structural robustness
assessments (Huang et al., 1999a). A variety of elements (beam-column (Huang et al.,
2000), shear connector (Huang et al., 1999b) and slab (Huang et al., 2003a)) are
implemented in this software. The basic static solver is based on the Newton-Raphson
method (Süli and Mayers, 2003). Since the collapse of “7 World Trade” aroused
concerns about the fire resistance of connections and progressive collapse of buildings
in fire, semi-rigid component-based connection elements and a combination of static
and explicit dynamic solvers have been implemented into Vulcan. The software has
recently been used to model the progressive collapse in fire of structural frames
connected by semi-rigid connections which are modelled using component-based
elements.
Component-based models of connection behaviour were first introduced by
Tschemmernegg et al. (1987) to model the small-rotation behaviour of joints at
ambient temperature, and after much development the method is now included in
EUROCODE 3-1.8 (CEN, 2005c) as a standard tool to calculate semi-rigid joint stiffness
and plastic capacity at ambient temperature. The component-based method considers
each connection as an assembly of individual nonlinear springs with predefined force-
deformation characteristics. The component-based semi-rigid connection element can
represent the real behaviour of semi-rigid connections in terms of force and deflection
relationships as well as ductility demand and fracture (Block, 2006, Dong et al., 2015)
1. Introduction
7
with very acceptable accuracy. The component-based method offers considerable time
savings compared to detailed FE modelling and is considerably more economical than
prohibitively expensive fire tests. It is one of the most practical approaches in
considering the robustness of connections in frame analysis under fire conditions.
Sun et al. (2015) developed a static-dynamic solution procedure for Vulcan. This
procedure is able to capture re-stabilization after initial instability has occurred as a
result of local failure. For instance, the procedure can be used to track the sequential
failure of different connection components during progressive collapse of a whole
structure. Sufficient validations (Huang et al., 2000, Najjar and Burgess, 1996) have
been carried out to demonstrate that Vulcan is an accurate and computationally-
efficient software to be used in performance-based fire engineering design. This has
provided later researchers with a convenient platform which can be used as a
foundation on which to further develop new elements and to implement these to
investigate the collapse in fire of either isolated members or whole structures.
1.2 RESEARCH MOTIVATIONS
The ductility and robustness of connections can influence the survival time of a
building; a connection fracture may either be kept within a certain range or be
extended to a connection failure, which may trigger complete detachment of the
connected members, leading to progressive collapse of the whole building. Since it has
been stated that performance-based fire design has been widely accepted as the most
realistic design method compared with isolated element design, interactions between
adjacent members can have significant effects on the overall structural performance.
1. Introduction
8
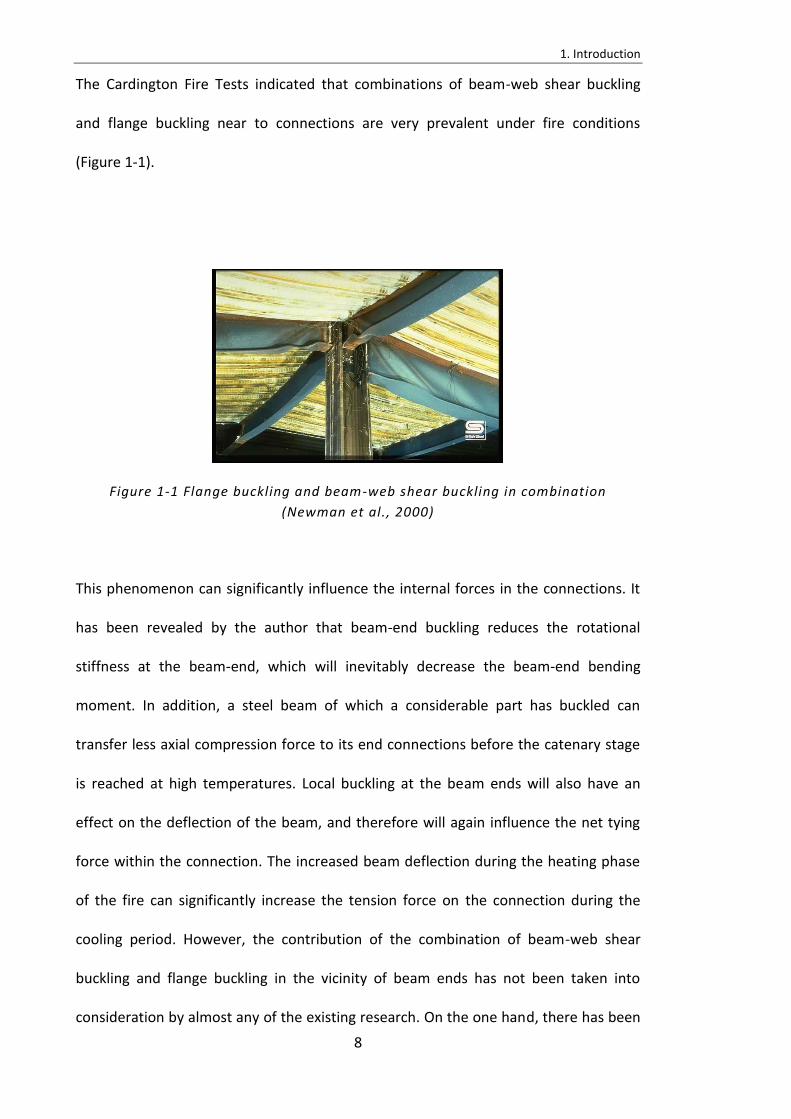
The Cardington Fire Tests indicated that combinations of beam-web shear buckling
and flange buckling near to connections are very prevalent under fire conditions
(Figure 1-1).
Figure 1-1 Flange buckling and beam-web shear buckling in combination
(Newman et al., 2000)
This phenomenon can significantly influence the internal forces in the connections. It
has been revealed by the author that beam-end buckling reduces the rotational
stiffness at the beam-end, which will inevitably decrease the beam-end bending
moment. In addition, a steel beam of which a considerable part has buckled can
transfer less axial compression force to its end connections before the catenary stage
is reached at high temperatures. Local buckling at the beam ends will also have an
effect on the deflection of the beam, and therefore will again influence the net tying
force within the connection. The increased beam deflection during the heating phase
of the fire can significantly increase the tension force on the connection during the
cooling period. However, the contribution of the combination of beam-web shear
buckling and flange buckling in the vicinity of beam ends has not been taken into
consideration by almost any of the existing research. On the one hand, there has been
1. Introduction
9
a lack of theoretical models which can represent the plastic post-buckling behaviour of
stocky (Class 1 or 2) sections at elevated temperatures. On the other hand, although
detailed modelling using commercial FEA packages, such as ABAQUS or ANSYS, can
account for the beam-end buckling phenomenon, this is computationally very
demanding, and is not feasible when a global frame analysis is required to enable
performance-based structural fire engineering design. Therefore, it has become
essential to develop a simplified model which can simulate the beam-end buckling
phenomenon sufficiently accurately within an acceptable computing run-time and
integrate it into global frame analysis. In this study this has been achieved by
developing a new buckling element and integrating it into Vulcan. Based on the
existing element types (beam-column, slab, semi-rigid connection, etc) and the
development of the static and static-dynamic approaches, Vulcan is capable of
considering the influence of the buckling panel adjacent to the beam-column face
connections with a full progressive collapse capability if the buckling elements are to
be implemented as component-based models.
1.3 SCOPE OF THIS RESEARCH
The objective of this research is to investigate the influence of beam-web shear
buckling and bottom-flange buckling at the ends of steel beams on the robustness of
the adjacent connections, and to use this to study the inherent robustness of steel-
framed buildings in fire. In order to achieve these targets there are five main research
activities:
I. To investigate the post-buckling behaviour of beams with Class 1 and 2 sections
at elevated temperatures in the aftermath of beam-web shear buckling, based
1. Introduction
10
on the existing “tension field theory” for plate girders. To create an analytical
model for the pure shear buckling behaviour.
II. To investigate the post-buckling behaviour after combined beam-web shear
buckling and bottom-flange buckling of Class 1 and 2 sections at elevated
temperatures, based on Dharma’s (2007) yield-line mechanism. To create an
analytical model for the combination of these two buckling phenomena.
III. To provide a transition criterion to distinguish between cases in which pure
beam-web shear buckling occurs and those in which the instability is a
combination of shear buckling and bottom-flange buckling.
IV. To create a component-based beam-end buckling element, which considers
beam-web shear buckling and bottom-flange buckling at the beam end within
the beam-end buckling zone. To implement the new element in Vulcan,
adjacent to the existing component-based connection element. The
component-based model should be able to consider the post-buckling
descending force-deflection relationship of the bottom spring, which simulates
the bottom-flange buckling behaviour.
V. To perform case studies for both single beams and frames, to investigate the
influence of the buckling element on the robustness of adjacent connections
and on the survival of steel structures in fire.
11
2.
LITERATURE REVIEW
2. Literature Review
12
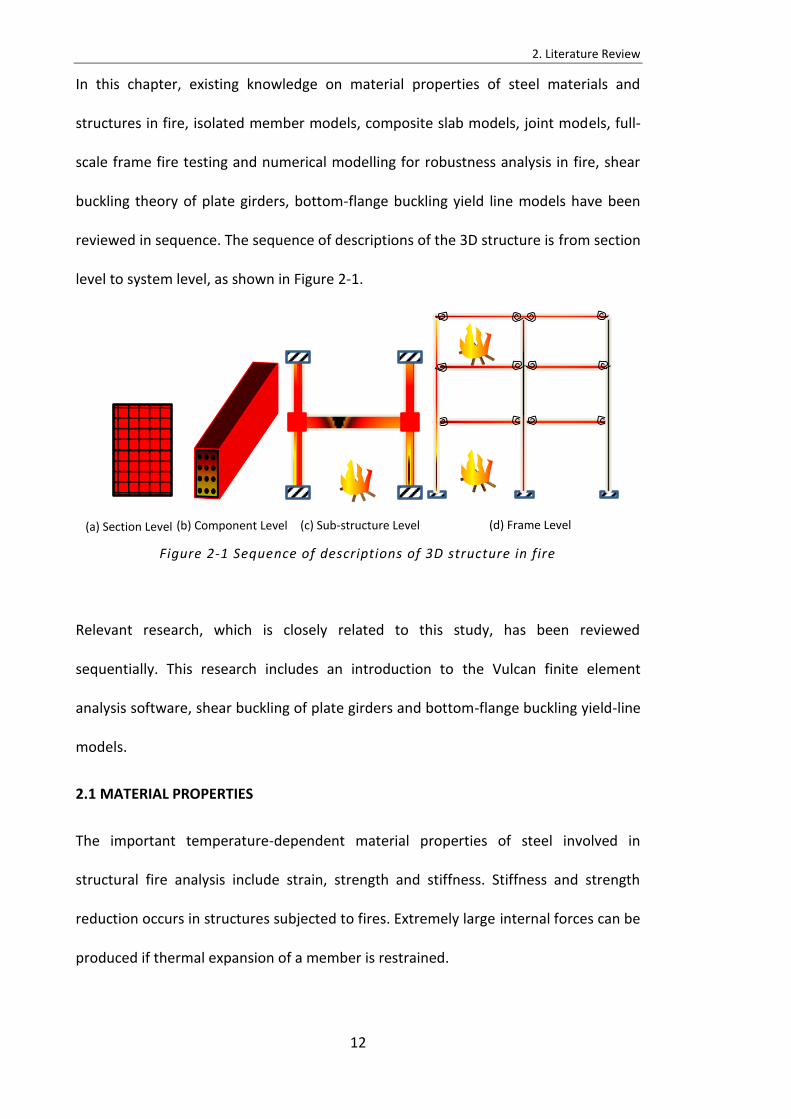
In this chapter, existing knowledge on material properties of steel materials and
structures in fire, isolated member models, composite slab models, joint models, full-
scale frame fire testing and numerical modelling for robustness analysis in fire, shear
buckling theory of plate girders, bottom-flange buckling yield line models have been
reviewed in sequence. The sequence of descriptions of the 3D structure is from section
level to system level, as shown in Figure 2-1.
Figure 2-1 Sequence of descriptions of 3D structure in fire
Relevant research, which is closely related to this study, has been reviewed
sequentially. This research includes an introduction to the Vulcan finite element
analysis software, shear buckling of plate girders and bottom-flange buckling yield-line
models.
2.1 MATERIAL PROPERTIES
The important temperature-dependent material properties of steel involved in
structural fire analysis include strain, strength and stiffness. Stiffness and strength
reduction occurs in structures subjected to fires. Extremely large internal forces can be
produced if thermal expansion of a member is restrained.
(a)Section level
(b) component level
(c)Sub-structure level
(d) system level (a) Section Level (b) Component Level (c) Sub-structure Level (d) Frame Level
2. Literature Review
13
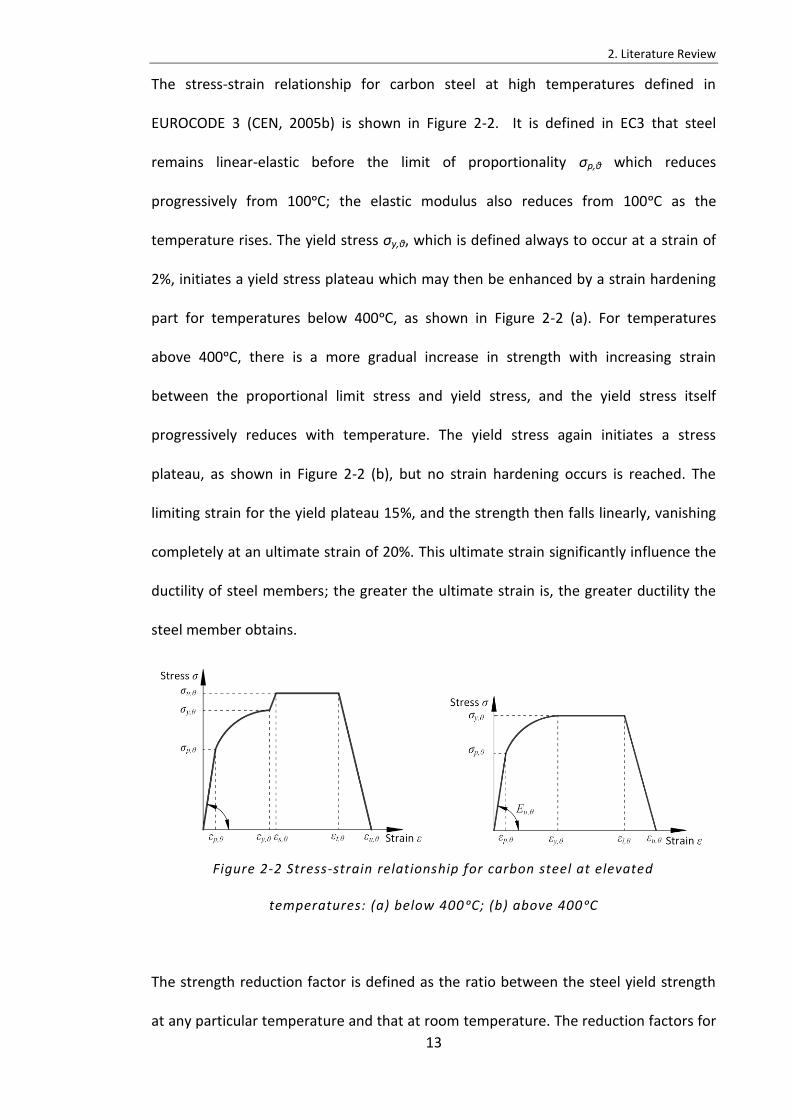
The stress-strain relationship for carbon steel at high temperatures defined in
EUROCODE 3 (CEN, 2005b) is shown in Figure 2-2. It is defined in EC3 that steel
remains linear-elastic before the limit of proportionality σp,θ which reduces
progressively from 100ᵒC; the elastic modulus also reduces from 100ᵒC as the
temperature rises. The yield stress σy,θ, which is defined always to occur at a strain of
2%, initiates a yield stress plateau which may then be enhanced by a strain hardening
part for temperatures below 400ᵒC, as shown in Figure 2-2 (a). For temperatures
above 400ᵒC, there is a more gradual increase in strength with increasing strain
between the proportional limit stress and yield stress, and the yield stress itself
progressively reduces with temperature. The yield stress again initiates a stress
plateau, as shown in Figure 2-2 (b), but no strain hardening occurs is reached. The
limiting strain for the yield plateau 15%, and the strength then falls linearly, vanishing
completely at an ultimate strain of 20%. This ultimate strain significantly influence the
ductility of steel members; the greater the ultimate strain is, the greater ductility the
steel member obtains.
Figure 2-2 Stress-strain relationship for carbon steel at elevated
temperatures: (a) below 400ᵒC; (b) above 400ᵒC
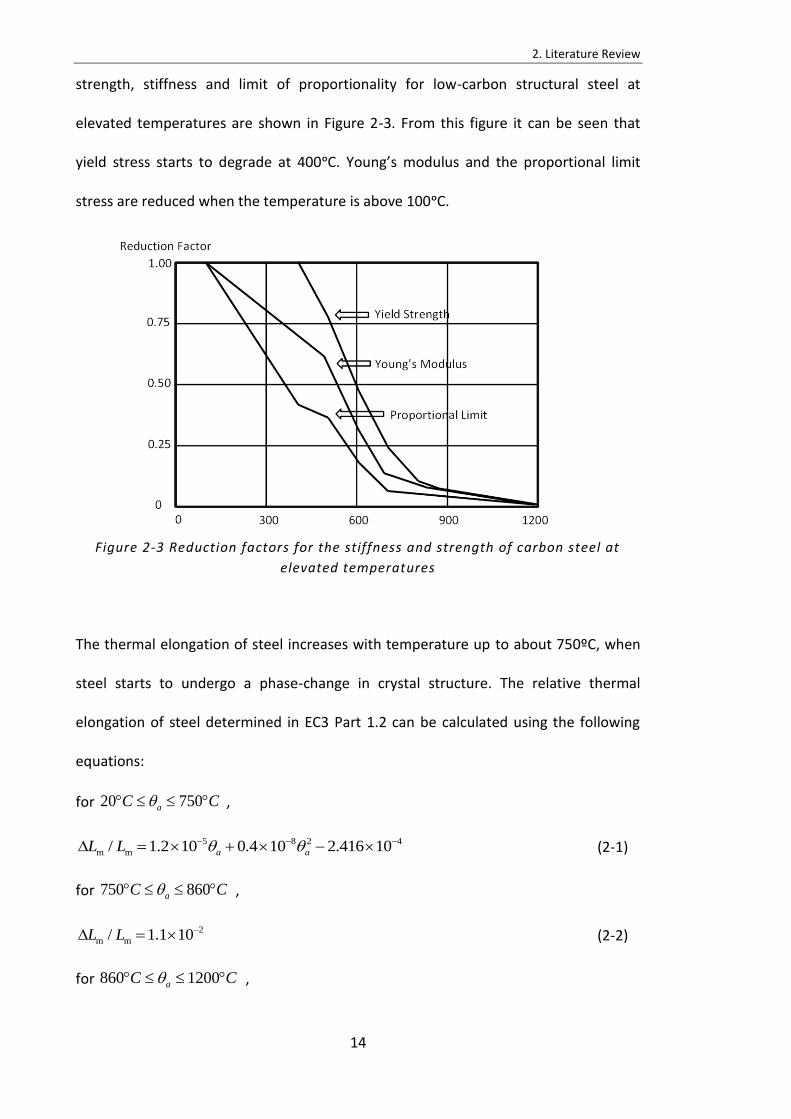
The strength reduction factor is defined as the ratio between the steel yield strength
at any particular temperature and that at room temperature. The reduction factors for
2. Literature Review
14
strength, stiffness and limit of proportionality for low-carbon structural steel at
elevated temperatures are shown in Figure 2-3. From this figure it can be seen that
yield stress starts to degrade at 400ᵒC. Young’s modulus and the proportional limit
stress are reduced when the temperature is above 100ᵒC.
Figure 2-3 Reduction factors for the stiffness and strength of carbon steel at
elevated temperatures
The thermal elongation of steel increases with temperature up to about 750ºC, when
steel starts to undergo a phase-change in crystal structure. The relative thermal
elongation of steel determined in EC3 Part 1.2 can be calculated using the following
equations:
for ,
(2-1)
for ,
(2-2)
for ,
20 750aC C
5 8 2 4
m m/ 1.2 10 0.4 10 2.416 10a aL L
750 860aC C
2
m m/ 1.1 10L L
860 1200aC C
2. Literature Review
15
(2-3)
The thermal elongation can play a negative role on the tensile resistance of steel
members. Taking a connection bolt-row that fractures in tension as an example: the
ultimate (fracture) strain is fixed for a bolt and the total strain in the bolt is the
summation of the strain due to thermal elongation and that due to tensile stress. Once
the bolt elongates due to thermal expansion, there will be a reduced deformability left
to cope with the elongation due to tensile stress, and so the total strain can reach the
ultimate strain, resulting in fracture, at a lower tensile stress level.
At high temperatures, a member can experience different temperatures distributions
at different locations, depending on their distances from fire source and the relative
massivity of different parts of the cross-section. In order to allow for the different
thermal strains and material properties which accompany different temperature
distributions across member cross-sections, the cross-section of a member can be
divided into a matrix of segments (Najjar and Burgess, 1996). Each segment can have
its own temperature, thermal and mechanical strains, and temperature-dependent
material properties at each analytical stage. In this way rather complex nonlinear
structural behaviour, such as thermal expansion and material degradation at elevated
temperatures can be taken into account in the segmented cross-section, as shown in
Figure 2-1 (a).
2.2 FIRE RESISTANCE DESIGN METHODS
The concept of structural fire engineering design has experienced two main stages:
isolated member design based on furnace testing using the standard fire curve, and
performance-based structural fire design.
5 3
m m/ 2 10 -6.2 10aL L
2. Literature Review
16
The Standard Fire curve was first standardized in 1932 (Malhotra, 1980), in the form
expressed using the following equation:
(2-4)
The structural member fire resistance defined in the current design guides BS 476
(1987), BS 5950 (1990), EC3 (2005c) and EC4 (2005e) are based on the standard fire
testing of isolated members, in which a loaded single member is heated in a furnace
according to ISO834 Standard Fire (1975) exposure. Standard fire testing has been
used to assess the behaviour of walls, floors, columns and beams. There are three
possible failure criteria for structures in fire; Resistance failure (which applies to all
member types), Insulation and Integrity failure (which apply only to separating
elements such as walls and floors). For resistance failure of a beam the criterion is that
the maximum deflection reaches a prescribed limit, such as (span/30) or (span/20); the
fire resistance rating of the member is the time of standard fire exposure at which the
failure criterion is reached.
In the UK, the Yellow Book (ASFP, 2010) provides a guide to passive structural fire
protection on the basis of fire test data, in accordance with BS 476. In the first and
second editions of this publication, the thickness of fire protection was specified such
that the maximum temperatures of 550°C for columns, and 620°C for beams
(supporting concrete floors), were not exceeded for a given period of fire resistance.
The time at which the appropriate one of these member temperatures occurs under
the Standard Fire Curve is the member fire resistance. Since the third edition, the
limiting temperatures of 550°C and 620°C have been recommended for general use,
although more detailed critical temperatures, taking account of different load ratios,
building types and exposure conditions, have been considered. For each fire protection
0= +345log(0.133 1)T T t
2. Literature Review
17
system, the effect of a specified thickness of fire protection on the heating rate is
simply measured by a parameter called the “section factor”. The section factor is the
ratio of the exposed surface area per unit length to the volume of the member within
this length. For various member types and fire protection materials, fire resistance
periods and section factors can be calculated, and therefore appropriate fire
protection material thicknesses can be found in the Yellow Book.
The standard fire resistance test is often criticized as not representing a real fire
scenario. This suspicion came from the fact that buildings can be affected by severe
fire scenarios, in which member temperatures are far above the critical temperatures
defined in the design codes. In the late 20th century, a series of full-scale fire tests
were carried out at Cardington, UK. In these tests it was found that a composite
building survived in severe natural fire scenarios, even when many beams were
unprotected. These fire tests revealed that the standard fire test can be very
conservative, because it ignores any interaction between members, although this
interaction may not always be advantageous. Therefore, performance-based design,
which fully considers the likely fire behaviour, heat transfer to the structure and the
structural response including member interactions, has become more popular in
structural fire design.
2.3 RESEARCH INSPIRED BY CARDINGTON FIRE TESTS
2.3.1 The Cardington Fire Tests
A fire research programme on a modern multi-storey composite steel framed structure
built within the BRE large scale test facility at Cardington (O'Connor and Martin, 1998)
was carried out by British Steel’s Swinden Technology Centre, co-sponsored by the
European Coal and Steel Community (ECSC) with TNO (The Netherlands) and CTICM
2. Literature Review
18
(France) as partners, between 1995 and 1997. This research programme aimed to
understand the results of the large-scale fire tests at Cardington in order to develop
rational design guidance for composite steel frameworks at the fire limit state. Six
major fire tests were carried out during 1995-96 on different parts of the frame. They
were: a restrained beam test, a plane frame test, two corner compartment tests, a
large compartment test and an office fire (demonstration) test. In the first and second
of these tests, particular elements of interest were heated by gas fires. In all the other
tests, wooden cribs were ignited in the compartments in order to model natural fires.
In one case a ventilation shutter was used to control the compartment temperature.
For the final test of this series, a fire in a simulated office environment was created in
order to subject the structure to a fire which could be related to a real scenario
(Usmani et al., 2000).
Another large-scale fire test at Cardington was carried out on the same steel–concrete
composite framed building in 2003 (Wald et al., 2006). The test took place as a result
of a collaborative research project between Czech Technical University (Czech
Republic), University of Coimbra (Portugal), Slovak Technical University (Slovak
Republic) and Building Research Establishment (United Kingdom). The test was carried
out as part of a European collaborative research project: Tensile membrane action and
robustness of structural steel joints under natural fire. The project concentrated on the
investigation of the structural integrity of a compartment subjected to natural fire
conditions. The test results are reported by Lennon and Moore (2004).
Two of the main observations from the Cardington fire tests were that the steel beams
did not “run away” as predicted by furnace fire tests, and the composite slabs did not
collapse. In order to reveal the reasons for these phenomena, experimental and
numerical studies were conducted on steel beams and composite slabs, considering
2. Literature Review
19
their beam-end restraint and slab-edge support. Theories of catenary action for steel
beams and tensile membrane action for composite slabs became the main
explanations of what actually occurs in beams and slabs subjected to large deflection
at high temperatures.
2.3.2 Steel beam and concrete slab research inspired by the Cardington Fire Tests
Liu et al. (2002) conducted restrained steel beam fire tests in the Fire Laboratory at
Manchester. In these experiments, small-section I-beams were supported between
two columns in a “rugby-post” arrangement. In some tests additional horizontal
restraint stiffnesses were applied to the ends of the beams to simulate the restraining
effect from surrounding structure. The behaviour was studied under different beam
load ratios.
Yin and Wang (2004, 2005) developed methods to describe the catenary action of steel
beams at elevated temperatures both theoretically and numerically. In traditional
isolated beam analysis, only the flexural capacities were checked, without considering
any axial restraint at the beams ends. The beams were predicted to “run away” when
the applied load exceeded the beam’s bending moment capacity. However, it has been
proved that beams can experience catenary action when the temperature is above
their limiting temperatures, which are governed by their bending resistance provided
that enough axial restraint has been provided. Therefore, a beam’s loading-carrying
system progressively becomes catenary action, experiencing increasing tension force.
Eventually the vertical components of this tension force, along the highly-deflected
beam, are responsible for balancing the vertical external load. Consideration of
catenary action in design can reduce construction cost by saving fire protection to
2. Literature Review
20
steel beams, as they will not collapse unless the beam-end axial restraints are not
strong enough.
Tan and Huang (2005) applied FE modelling to investigate the structural response of
steel beams with axial restraint in fire. The behaviour of both pin-ended and semi-rigid
restrained beams was investigated. The dominant factors considered included thermal
gradient, load utilization factor, beam slenderness ratio and axial restraint ratio. Their
analysis demonstrated that axial restraints provide beams with axial tying capacity,
which enables these beams to experience catenary action instead of collapse at high
temperatures.
Li and Guo (2008) conducted experiments on two restrained steel beams exposed to
fire during both the heating and cooling phases. Obvious catenary action was observed
during these experiments.
In all the elevated-temperature steel beam tests mentioned above, sufficient axial
restraint was provided so that catenary action of steel beams could occur. However, in
real structures, such a level of axial restraint can only exist if the beam-to-column
connections are of sufficient strength and ductility. The buckling at the beam ends,
frequently seen from the Cardington Fire Tests, on the one hand, can change the force
distribution between the connection bolt rows. Therefore, the design bolt-row forces
can reach their strengths and ultimate strain at a different temperature level. The
buckling elements can influence the fracture temperature the bolt rows of their
adjacent connection. On the other hand, the buckling element can also change the
surviving temperature of the beam when no sufficient axial restraint from the
connection can be provided. This inspires the research reported in this thesis.
Another main breakthrough from the Cardington Fire Tests was the Tensile Membrane
Action of concrete slabs.
2. Literature Review
21
Huang et al. (2000) presented a three-dimensional, nonlinear finite-element procedure
for modelling composite and steel-framed building behaviour in fire. He also reported
theoretical and numerical research to predict the response of reinforced concrete
slabs subjected to fire (2003a, 2003b). This procedure was based on thick plate theory.
The influences of different thermal expansion characteristics, differential temperature
distributions through the slab thickness and tensile membrane action were
investigated. It was shown that the proposed model could properly simulate
membrane action of concrete slabs in fire.
Bailey et al. (2000a, 2004) proposed a tensile membrane action method for designing
composite slabs at elevated temperatures. Burgess et al. (2014, 2016) presented an
initial re-examination of the mechanisms of tensile membrane action of thin concrete
floor slabs, attempting to remove the arbitrary assumptions from Bailey’s TMA
method, and to analyse the slab’s developing deflections kinematically.
2.4 FRAME NUMERICAL MODELLING
Numerical Modelling and theoretical investigation
Saab and Nethercot (1991) presented a formulation for the bilinear analysis of two-
dimensional steel frames under fire conditions. This was one of the initial attempts to
carry out numerical frame analysis in fire. Their work was capable of considering the
effects of geometric nonlinearity, temperature-dependent nonlinear material
behaviour and temperature distributions through each member.
Najjar and Burgess (1996) described the principles of a three-dimensional frame
analysis for fire conditions using a program which was at that time named 3DFIRE,
which aimed at modelling the behaviour of skeletal frames under fire conditions. The
program was based on an existing two-dimensional program INSTAF which had been
2. Literature Review
22
written for nonlinear ‘spread of yield’ analysis of two-dimensional rigid steel
frameworks at ambient temperature. High material nonlinearities could be taken into
account by this program. Temperature distributions, which could induce differential
thermal expansion, could be adopted. Various test cases correlated well with previous
independent analytical studies. However, the program did not include composite
action, plate elements or semi-rigid connections.
Rotter et al. (1999) discussed the response of a structural element under fire
conditions within a large, highly redundant, building. Aspects such as thermal
expansion, the relative stiffnesses of adjacent parts of the structure, material strength
degradation, development of large deflections, buckling and temperature gradients
were illustrated with simple examples. The significance of these findings for the design
of large buildings was briefly investigated and explained.
Usmani et al. (2001) attempted to illustrate some of the most important and
fundamental principles that dominate the behaviour of composite-framed structures
in fire. The descriptions were developed in the context of numerical modelling of the
full-scale Cardington fire tests. Fundamental principles, concerning the evolution of
internal forces and displacements in real structures with acceptable simplifications,
were presented in this work.
Liew et al. (2004) developed a numerical approach for inelastic transient analysis of
steel-framed structures subjected to explosive loading followed by fire. This approach
enabled realistic overall frame modelling by adopting the use of beam-column
elements utilizing fibre cross-section representations. Verification examples indicated
that the proposed analysis could be effectively used to solve structural explosion and
thermal response problems. However, their work was limited to two-dimensional
frames, and could not avoid singularity at the onset of local buckling.
2. Literature Review
23
Lien et al. (2010) used the Vector Formed Intrinsic Finite Element (VFIFE) method to
carry out structural analysis in fire. This method is based on Newton's Laws of Motion,
and discretizes the structural system into particles. Large deformation and catenary
action of structures can be well simulated without forming a structural stiffness matrix.
This is an alternative way of avoiding the singularity problem when local structural
failure occurs.
Franssen et al. developed a computer program known as SAFIR (2011). This software
has been used by many researchers. For instance, Junior and Creus (2007) extended
the “plastic hinge concept” into fire analysis. They developed an alternative simplified
procedure to analyse the behaviour of three-dimensional frames under elevated
temperatures. The model was compared with results from SAFIR and experimental
results, and was shown to be accurate, with low computational cost.
Sun et al. (2012b) developed a static-dynamic procedure and extended it within the
Vulcan software to model the behaviour of steel-framed buildings during both local
and global progressive collapse under fire conditions. An explicit integration method
was adopted in the dynamic part of this procedure, in order to make the analysis
continue beyond local, temporary instabilities. This procedure enables the modelling
to automatically switch between static and dynamic analysis, which allows Vulcan to
investigate initial stable behaviour, local failure, restabilization and progressive
collapse of buildings. The work has subsequently been extended (Sun et al., 2012a,
Sun et al., 2015).
It has been found that the research on frame behaviour in fire has been extended from
two-dimensional to three-dimensional, intending to consider more and more realistic
interactions between the structural elements of a frame. Carrying out performance-
based fire design through FEA frame analysis is an obvious solution. However, its
2. Literature Review
24
extremely high computational cost makes it impractical, given that each connection
consists of many different components and a frame contains many connections.
Therefore, a practical and accurate enough alternative method, which is to use
component-based method to model the connections, is adopted.
2.5 PROGRESSIVE COLLAPSE OF WTC7 BUILDING
On September 11th 2001, the twin towers of the World Trade Centre in New York
were attacked (McAllister and Corley, 2002) by terrorists with hijacked jet airliners.
One of the aircraft was flown into the face of the North Tower (WTC1), and the other
crashed into the South Tower (WTC2). Later, at 5:21 p.m. on the same day, WTC
building 7 collapsed because of fires which had started as a result of the collapse of
WTC 1. The progressive collapse of WTC 7 is of significant interest, as the collapse was
triggered by the failure of beam-to-column connections under fire conditions rather
than by impact damage from the collapsing towers.
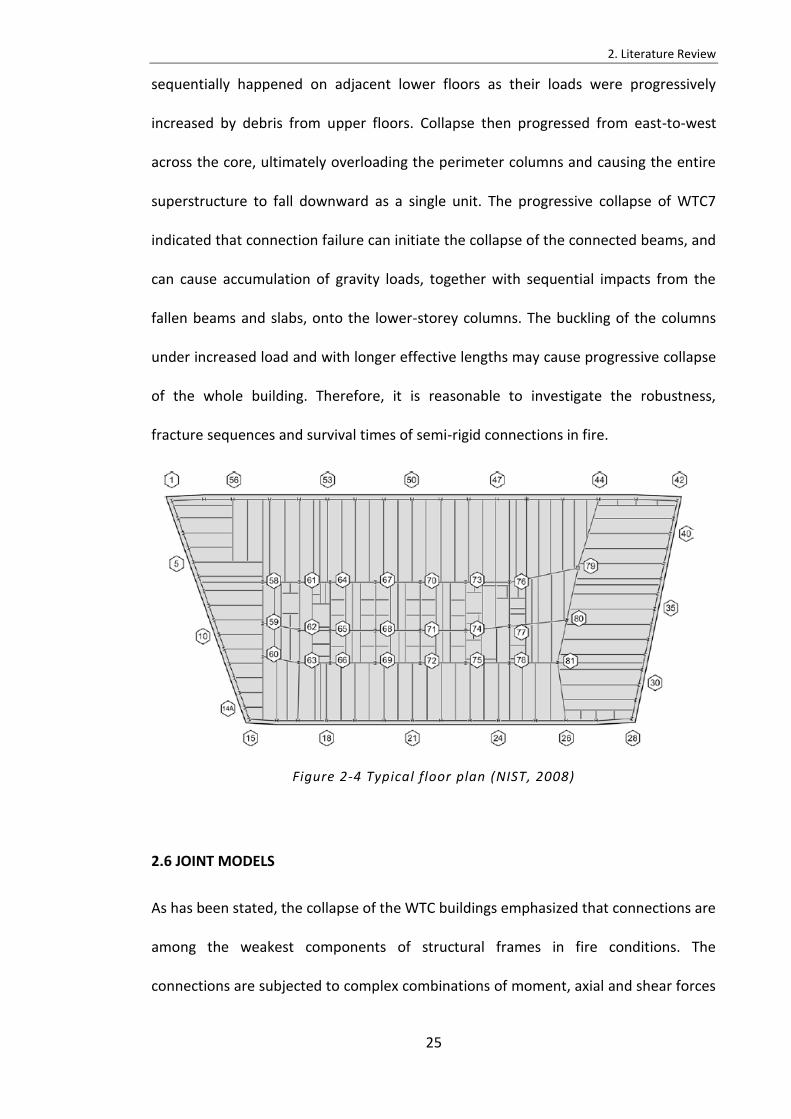
The floor plan of Floors 12-14 of WTC 7 is shown in Figure 2-4. Particular attention was
paid (NIST, 2008) to the connection of a non-composite primary beam to Column 79.
The primary beam (44/79) supported several protected composite secondary beams
with long spans, on only one side. During the fire these fully protected secondary
beams were heated to between 500ᵒC and 600ᵒC, which would have produced
approximately 100mm of free thermal expansion. In order to restrain the secondary
beams, large horizontal shear resistance needs to be provided by the column-face
connection of the primary beam. However, the connection was only designed to resist
gravity load. The locating bolts at this connection were easily fractured, as they had
little horizontal shear resistance. The primary beam was separated from Column 79
soon after the shear resistance of the connection was reached. This separation
2. Literature Review
25
sequentially happened on adjacent lower floors as their loads were progressively
increased by debris from upper floors. Collapse then progressed from east-to-west
across the core, ultimately overloading the perimeter columns and causing the entire
superstructure to fall downward as a single unit. The progressive collapse of WTC7
indicated that connection failure can initiate the collapse of the connected beams, and
can cause accumulation of gravity loads, together with sequential impacts from the
fallen beams and slabs, onto the lower-storey columns. The buckling of the columns
under increased load and with longer effective lengths may cause progressive collapse
of the whole building. Therefore, it is reasonable to investigate the robustness,
fracture sequences and survival times of semi-rigid connections in fire.
Figure 2-4 Typical floor plan (NIST, 2008)
2.6 JOINT MODELS
As has been stated, the collapse of the WTC buildings emphasized that connections are
among the weakest components of structural frames in fire conditions. The
connections are subjected to complex combinations of moment, axial and shear forces
2. Literature Review
26
transferred from adjacent beams and slabs under fire conditions. If the joint is with
sufficient strength and ductility, the joint is able to provide sufficient axial restraint to
the beam. In this case, the steel beam can experience catenary tension at high
temperatures and dramatically increases the survival temperature of the beam. On the
other side, a joint with insufficient strength and ductility may suffer from a fracture,
which leads to an additional load onto the lower floor when the steel beam falls. This
may trigger a ‘pancake’ effect and finally lead to the progressive collapse of the whole
building. That is why when investigateng steel beams with brittle connections, the
beam survival temperature is always assumed to be the temperature, at which the net
tying force in the connection turns from compression to tension (when catenary action
initiates).
In traditional analysis, joints are assumed to be either ‘pinned’ or ‘rigid’, ‘pinned’ joints
have almost no rotational stiffness while ‘rigid’ joints are of infinite rotational stiffness,
without any relative rotation between beams and columns. Nevertheless, the majority
of practical joints are semi-rigid. This is mainly because components, each with a finite
flexibility, tend to be connected in series, forming even more flexible assemblies.
Al-Jabri (2011) presented an overview of numerical modelling and simulation methods
to summarise the behaviour of beam-column joints at elevated temperatures. He
classified these models as finite element models, curve-fit models, component-based
models, and artificial neural network models. However, in assessment of the
robustness of composite structures in fire, a stable, simple and reasonably accurate
model is sufficient to model the overall behaviour. A mature way is to develop
component-based models, which are capable of predicting the behaviour of semi-rigid
beam-column connections, and to incorporate them into global structural analysis
programs.
2. Literature Review
27
Anderson and Najafi (1994) reported the results of five ambient-temperature tests on
composite beam-to-column connections, and six bare-steel connections of the same
type. Parameters such as the quantity of reinforcement and the depth of the steel
section, which are both related to the moment capacity and stiffness of composite
connections, were investigated. A simple spring model was proposed to predict a
bilinear approximation of the moment-rotation relationship of these connections.
Da Silva et al. (2001) described a type of component-based model for the behaviour of
semi-rigid steel joints. These mechanical models consist of extensional springs and
rigid links. The springs exhibit a bi-linear force-deformation characteristic. This model
was used to model a cruciform steel flush end-plate beam-to-column joint experiment.
The analytical procedure produced by da Silva is able to predict the moment-rotation
relationships of semi-rigid steel connections under fire conditions.
A large number of tests were conducted by Spyrou et al. (2004a, 2004b) to investigate
the behaviour of the tension and compression zones of semi-rigid connection
components at high temperatures. He further developed component-based force-
displacement models for the tension and compression zones of connection elements.
These models were combined to represent the behaviour of a whole component-
based connection element at elevated temperatures.
Al-Jabri et al. (2005) conducted five series of tests to investigate the rotational
behaviour of semi-rigid joints at elevated temperatures. Moment-rotation curves were
derived at different high temperatures. His tests offered more fundamental
experimental data for later researchers to compare with.
Block et al. (2007) further developed the component model for endplate connections,
based on the earlier work by Spyrou. In his work, the joint model was assembled from
components representing bolts in tension, the column web in compression, the
2. Literature Review
28
endplate in bending and the column flanges in bending. A shear spring was included to
transfer the vertical shear force between the two nodes of the connection element.
However, this shear spring was assumed to be rigid.
Yu et al. (2009a) divided semi-rigid endplate connection components into T-stub
models. An optimum yield-line model was developed, based on the plastic work-
balance principle, to capture the behaviour of endplate connections at large
deformations up to failure. The model was validated against experiments at both
ambient and elevated temperatures. A number of validation studies were carried out
comparing finite element analysis with the analytical model, which indicated that the
analytical model was able to represent the behaviour of endplate connections well at
both ambient and high temperatures. She then developed a component-based model
(Yu et al., 2009b, 2009c) to model the behaviour of web cleat joints at elevated
temperatures subjected to tying forces. In this model, the effect of opening of the
angles was considered as forming a four-plastic-hinge mechanism. The model was
again validated against FEM and both ambient- and high-temperature tests.
In order to investigate the relative robustness of different types of steel joints in steel-
framed structures in fire, Wang et al. (2011) carried out ten fire tests on medium-scale
partially-restrained steel “rugby goalpost” frames with five different types of joint,
including web cleat, fin plate, flexible endplate, flush endplate and extended endplate
connections. Their structural fire response, including joint failure modes, the
development of beam mid-span deflections and axial forces in the joints at high
temperatures were investigated.
Hantouche et al. (2016) conducted studies to investigate the main parameters that
affect the behaviour of web cleat connections in fire. The characteristics and behaviour
of these connection types were compared at high temperatures. This study helped to
2. Literature Review
29
extend the understanding of the factors controlling the deformation capacity and
strength of web cleat connections in fire.
The robustness of beam connections in the direct vicinity of the column face is vitally
significant to the fire resistance of steel-framed/composite buildings. In recent years, a
large number of experiments have been conducted to investigate the behaviour of
steel connections at elevated temperatures, in order to validate the proposed
component-based models. Numerical simulation is also a good way to conduct
parametric studies. Since realistic tests may be costly in both time and money, robust
numerical simulations have been the preferred tool of many researchers. Beam-web
shear buckling and bottom-flange buckling near to the ends of beams have been
consistently observed in the full-scale fire tests at Cardington and in the aftermath of
accidental fires. These phenomena may have effects on the stress distribution of the
adjacent column-face connection bolt rows, as well as the survival temperature of the
connected beam when beam-end connections of insufficient ductilities have been
used. Therefore, it is important to include these buckling phenomena in structural fire
analysis.
2.7 SHEAR BUCKLING OF PLATE GIRDERS
As early as 1886, the possibility of utilizing the post-buckling strength of plate in
bridges was considered by Wilson (1886). Later Wagner (1931) presented a diagonal
tension theory concerning buckling and post-buckling behaviour for aircraft structures
in 1931. However, the post-buckling behaviour of beam web panels was not
considered as a design concept until the 1960s; until this time the elastic buckling load
was used as the only design limit criterion. In the 1960s, Basler et al. (1960, 1961a,
1961b) presented a method of calculating the ambient-temperature post-buckling
2. Literature Review
30
capacity of the webs of plate girders subject to shear; this work was later used as the
basis of a design method (ASIC, 1963) introduced by the American Institute of Steel
Construction (AISC). However, in this theory, the flanges of plate girders were assumed
to be too flexible to carry significant bending moments, which led to conservative
results. Subsequently, Fujii (1968) presented a modification of Basler’s theory,
considering the contribution of flanges to the total post-buckling load capacity. In the
1970s, Rockey et al. (1968, 1972, 1978, 1987) presented a systematic study of, and a
design method for, plate girders subject both to pure shear and to combined shear
and bending. Their theory further improved Basler’s theory by considering the
strength of flanges. The theories above are all classified as ‘tension field theory’ or its
derivatives, because the fundamental assumption is that, after elastic buckling, any
additional load is carried by a tensile membrane field. Tension field theory only deals
with web panels with aspect ratios less than 3 (Galambos, 1998). Hereafter, the term
‘aspect ratio’ refers to the ratio of the distance between adjacent transverse stiffeners
to the depth of the web panel. The theory was later shown, by Lee and Yoo (2008), to
be able to predict well the post-buckling strength under pure shear of panels of aspect
ratios smaller than 1.5, but to lose accuracy for higher aspect ratios. This indicates that
tension field theory should only be used to represent plate girders with transverse
stiffeners. Lee and Yoo (1998, 2006, 2008) carried out a series of finite element studies
to investigate the post-buckling behaviour. They modified the existing formulations to
decrease the discrepancy between tension field theory and their finite element
modelling. They also proposed empirical amendments to classical tension field theory
for web panels with aspect ratios higher than 3. Vimonsatit et al. (2007a, 2007b)
extended the classical ambient-temperature tension field model for plate girders, to
account for elevated-temperature behaviour, by changing material properties and
2. Literature Review
31
incorporating the effect of compressive forces due to axial restraint. However, the
“tension field theory” developed for plate girders can not be directly used for the
analysis of the beam-web shear buckling of Class 1 and 2 sections. This is because that
the beam-web shear buckling length of a plate girder is predefined by the distance
between two adjacent stiffeners, which do not exist for most Class 1 and 2 sections.
Therefore, the shear buckling lengths of Class 1 and 2 sections have to be calculated.
Moreover, as the webs of plate girders are very thin (usually classified as Class 4
sections), buckling would usually occur in the linear-elastic phase, whereas, for the
Class 1 and 2 sections, nonlinear buckling will often occur. Therefore, the tension field
theory needs to be revised to model the beam-web shear buckling of Class 1 and 2
sections, as described in Chapter 3.
2.8 BOTTOM-FLANGE BUCKLING YIELD LINE MODELS
A body of research has been carried out to investigate the local in-plane flange
buckling phenomenon, including both the pre- and post-buckling stages. Recent
research has a common solution for the pre-buckling stage, while different collapse
models of the post-buckling stage have been proposed since 1965. The evolution
mainly focused on the attempts to transform the yield line mechanism from
experimental observation to analytical and numerical models. In all the assuming yield-
line mechanisms, the buckling zone consisted of plastic zone and yield lines. The
calculations were all based on the energy principles. There were two basic types of
yield line models, which were symmetric collapse plastic mechanism and asymmetrical
collapse mechanism.
Climenhaga and Johnson (1972) presented an approximate method to predict the
moment-rotation relationship of an I-shape beam when local flange buckling was
2. Literature Review
32
developed. In their theory, the collapse model was perfectly symmetric, and the length
of the flange plastic zone equals to the flange width. Comparisons between the
theoretical predictions and several test curves showed consistently conservative, but
reasonable agreement.
Kuhlmann’s model (1986) was on the basis that there were only yield lines at the
buckled flange. There assumed to be a plastic zone, which can be squashed, and
several yield lines at the beam web. However, Kuhlmann’s model is performing
unreasonable in terms of deformation compatibility since if there was any squash
within the beam-web plastic zone, the buckled flange couldn’t be squashed as there
was no relevant plastic zone on the flange.
The mechanisms mentioned above are symmetric collapse plastic mechanisms.
The most recent developed yield line mechanisms consist in a more suitable buckling
shape for the beam flange and web.
A more careful examination of experimental results observed that the width of the
web plastic zone is different from the flange width. Gioncu and Petcu (1997) improved
the length of the yield-line mechanism by carrying out experimental observation and
numerical modelling. A most recent yield line mechanism was reported by Gioncu and
Mazzolani (2003). The parameters defining the shape of the mechanism, apart from its
length, were determined based on the principle of the minimum of the total potential
energy.
All the yield line mechanisms mentioned above are suitable for ambient-temperature
analysis. A summary of the yield line mechanisms is shown in Table 2-1.
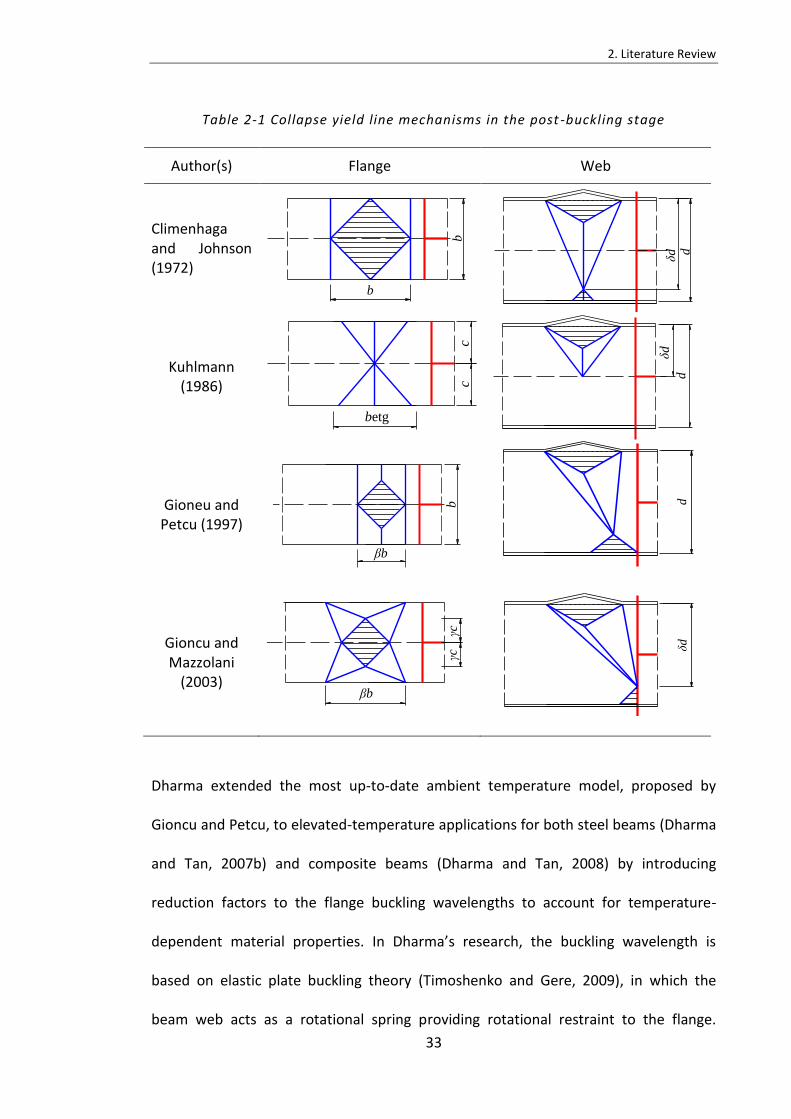
2. Literature Review
33
Table 2-1 Collapse yield line mechanisms in the post -buckling stage
Author(s) Flange Web
Climenhaga and Johnson (1972)
Kuhlmann (1986)
Gioneu and Petcu (1997)
Gioncu and Mazzolani
(2003)
Dharma extended the most up-to-date ambient temperature model, proposed by
Gioncu and Petcu, to elevated-temperature applications for both steel beams (Dharma
and Tan, 2007b) and composite beams (Dharma and Tan, 2008) by introducing
reduction factors to the flange buckling wavelengths to account for temperature-
dependent material properties. In Dharma’s research, the buckling wavelength is
based on elastic plate buckling theory (Timoshenko and Gere, 2009), in which the
beam web acts as a rotational spring providing rotational restraint to the flange.
b
b
b
b
δd
d
c c
betg
betg
δd
d
βb
b
d
d
βb
γc
γc
βb
δd
2. Literature Review
34
However, this assumption tends to over-estimate the flange wavelength when the
beam web is relatively thin (but may still be classified as Class 1 or 2 according to EC3
Part 1.1 (CEN, 2005a). The results derived from Dharma’s research have been shown
to be extremely conservative for thin-web beams at elevated temperatures (Dharma,
2007). Moreover, Dharma’s model considers the beam-web buckling as a passive
movement, which is caused by the rotation of the web-flange intersection when flange
buckling occurs; and so the beam-web buckling wave is vertical rather than diagonal
(what the shear buckling wave should be, as observed in the majority of images from
the Cardington Tests). The beam-web shear buckling is likely to be independent of
flange buckling, and is triggered at least in part by shear force. The occurrence of shear
buckling depends on various factors, such as the relative slenderness of the beam web
and flanges and the ratio between the shear force and bending moment at the beam
ends. Therefore, Dharma’s model is not suitable to be further utilised, such as to be
converted to a component-based model, before relative corrections have been made.
2.9 CONCLUSION
As the connection is one of the most critical components in a structure under fire
conditions, and the existence of the beam-end buckling phenomenon can influence
the survival time of the connection, it is important to involve the beam-end buckling
behaviour in structural fire analysis. It has been presented that the most updated
Dharma’s model tends to over-estimate the resistance of the buckling element when
the beam web is relatively thin. Therefore, it is necessary that a new analytical model
is created based on Dharma’s model to fully consider the interaction and
independency between the beam-web shear buckling and bottom-flange buckling, and

2. Literature Review
35
to provide good accuracy of results in all the beam-web slenderness ranges for the
Class 1 and 2 beams.
36
3.
AN ANALYTICAL APPROACH TO MODELLING
SHEAR PANELS IN THE POST-BUCKLING STAGE
AT ELEVATED TEMPERATURES
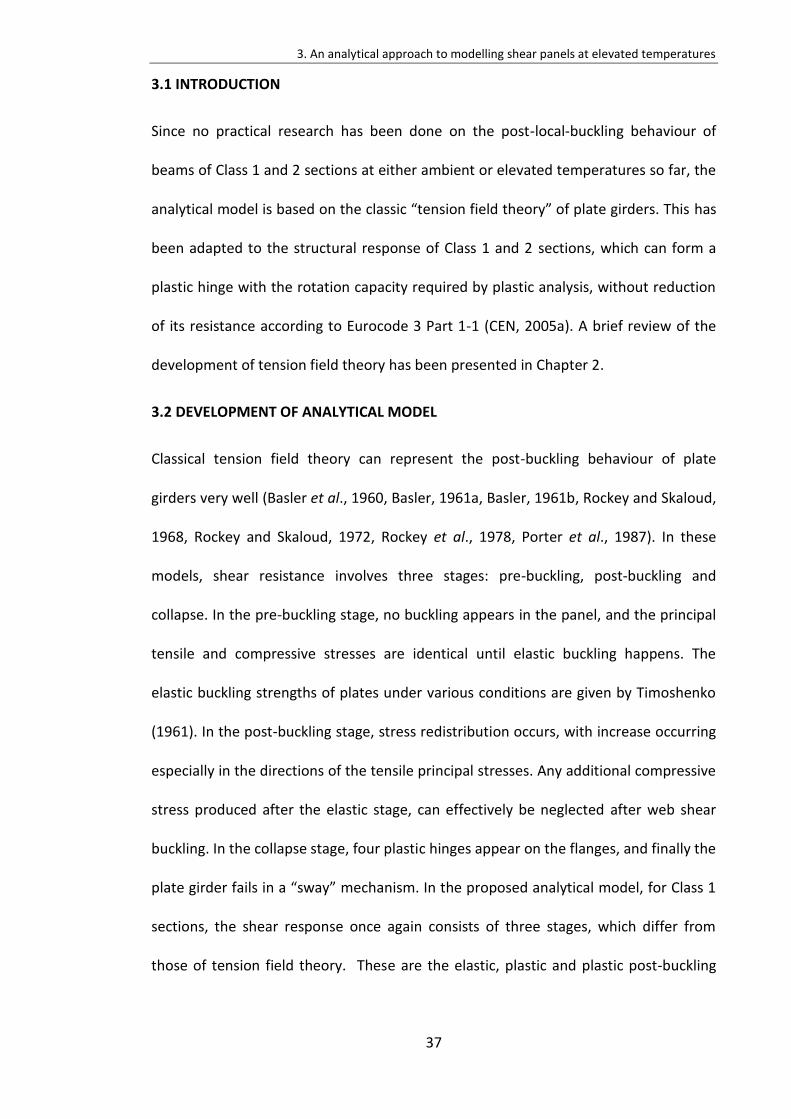
3. An analytical approach to modelling shear panels at elevated temperatures
37
3.1 INTRODUCTION
Since no practical research has been done on the post-local-buckling behaviour of
beams of Class 1 and 2 sections at either ambient or elevated temperatures so far, the
analytical model is based on the classic “tension field theory” of plate girders. This has
been adapted to the structural response of Class 1 and 2 sections, which can form a
plastic hinge with the rotation capacity required by plastic analysis, without reduction
of its resistance according to Eurocode 3 Part 1-1 (CEN, 2005a). A brief review of the
development of tension field theory has been presented in Chapter 2.
3.2 DEVELOPMENT OF ANALYTICAL MODEL
Classical tension field theory can represent the post-buckling behaviour of plate
girders very well (Basler et al., 1960, Basler, 1961a, Basler, 1961b, Rockey and Skaloud,
1968, Rockey and Skaloud, 1972, Rockey et al., 1978, Porter et al., 1987). In these
models, shear resistance involves three stages: pre-buckling, post-buckling and
collapse. In the pre-buckling stage, no buckling appears in the panel, and the principal
tensile and compressive stresses are identical until elastic buckling happens. The
elastic buckling strengths of plates under various conditions are given by Timoshenko
(1961). In the post-buckling stage, stress redistribution occurs, with increase occurring
especially in the directions of the tensile principal stresses. Any additional compressive
stress produced after the elastic stage, can effectively be neglected after web shear
buckling. In the collapse stage, four plastic hinges appear on the flanges, and finally the
plate girder fails in a “sway” mechanism. In the proposed analytical model, for Class 1
sections, the shear response once again consists of three stages, which differ from
those of tension field theory. These are the elastic, plastic and plastic post-buckling
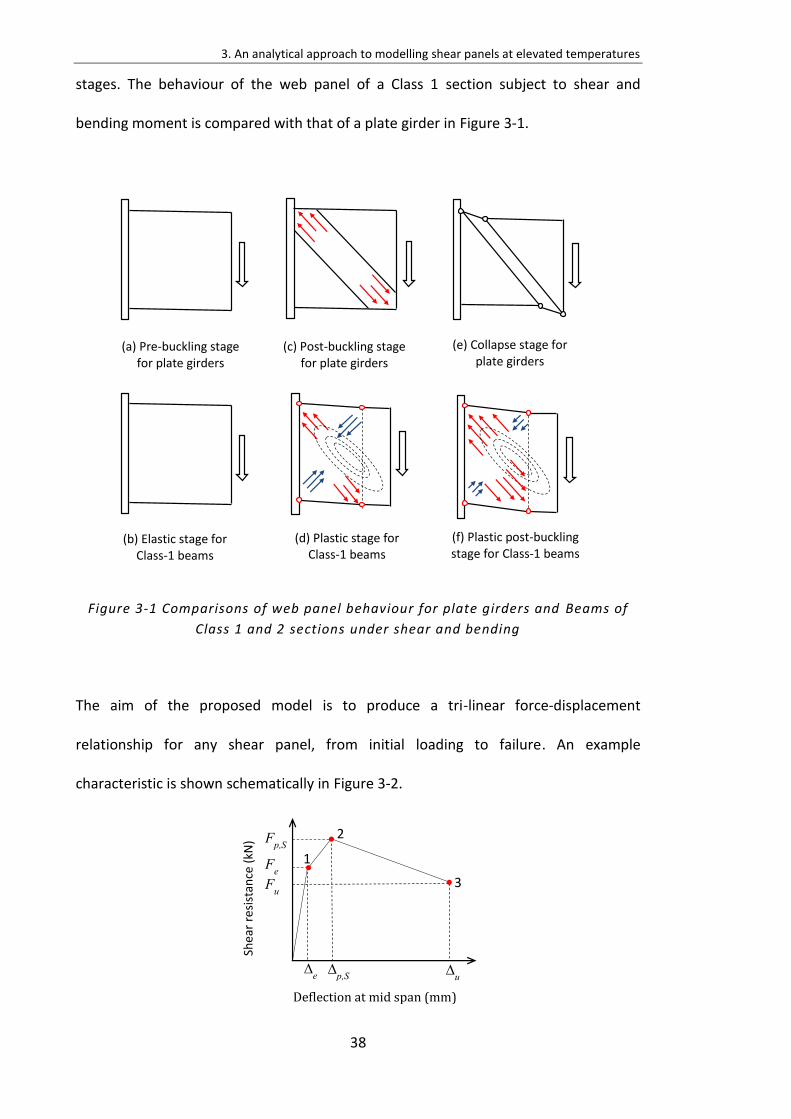
3. An analytical approach to modelling shear panels at elevated temperatures
38
stages. The behaviour of the web panel of a Class 1 section subject to shear and
bending moment is compared with that of a plate girder in Figure 3-1.
Figure 3-1 Comparisons of web panel behaviour for plate girders and Beams of
Class 1 and 2 sections under shear and bending
The aim of the proposed model is to produce a tri-linear force-displacement
relationship for any shear panel, from initial loading to failure. An example
characteristic is shown schematically in Figure 3-2.
(a) Pre-buckling stage for plate girders
(b) Elastic stage for Class-1 beams
(c) Post-buckling stage for plate girders
(d) Plastic stage for Class-1 beams
(e) Collapse stage for plate girders
(f) Plastic post-buckling stage for Class-1 beams
Deflection at mid span (mm)
1
2
3
Shea
r re
sist
ance
(kN
)
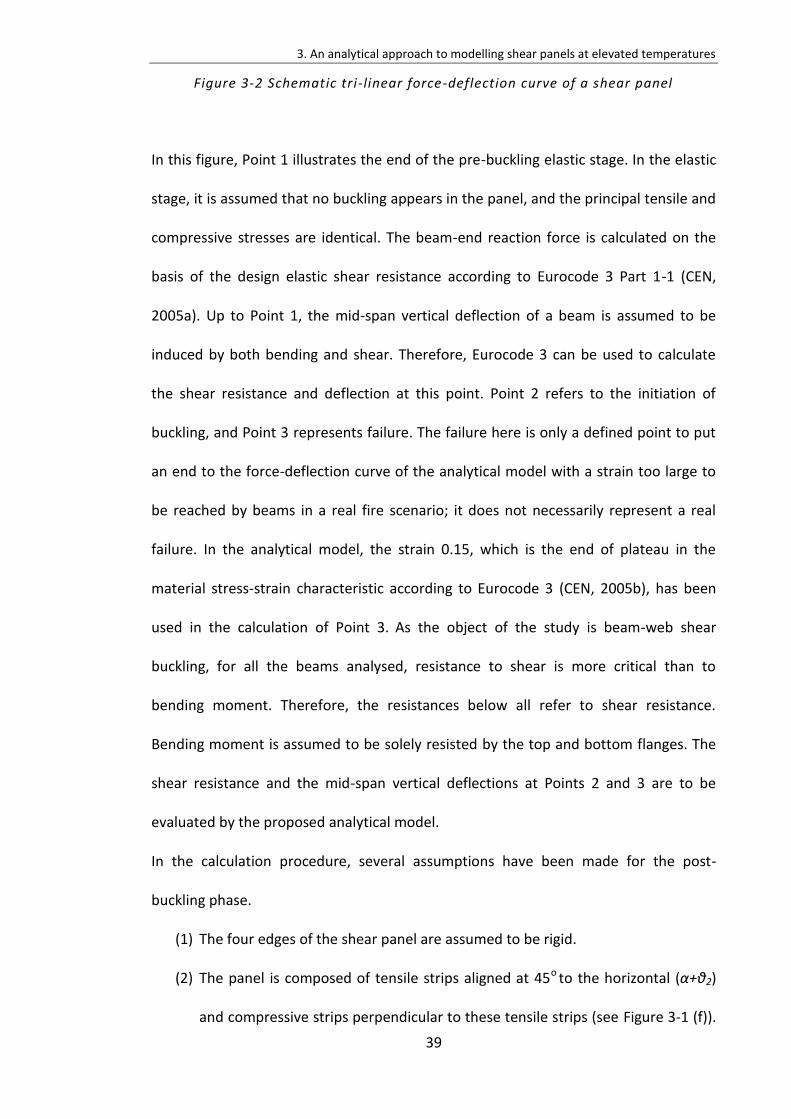
3. An analytical approach to modelling shear panels at elevated temperatures
39
Figure 3-2 Schematic tri-linear force-deflection curve of a shear panel
In this figure, Point 1 illustrates the end of the pre-buckling elastic stage. In the elastic
stage, it is assumed that no buckling appears in the panel, and the principal tensile and
compressive stresses are identical. The beam-end reaction force is calculated on the
basis of the design elastic shear resistance according to Eurocode 3 Part 1-1 (CEN,
2005a). Up to Point 1, the mid-span vertical deflection of a beam is assumed to be
induced by both bending and shear. Therefore, Eurocode 3 can be used to calculate
the shear resistance and deflection at this point. Point 2 refers to the initiation of
buckling, and Point 3 represents failure. The failure here is only a defined point to put
an end to the force-deflection curve of the analytical model with a strain too large to
be reached by beams in a real fire scenario; it does not necessarily represent a real
failure. In the analytical model, the strain 0.15, which is the end of plateau in the
material stress-strain characteristic according to Eurocode 3 (CEN, 2005b), has been
used in the calculation of Point 3. As the object of the study is beam-web shear
buckling, for all the beams analysed, resistance to shear is more critical than to
bending moment. Therefore, the resistances below all refer to shear resistance.
Bending moment is assumed to be solely resisted by the top and bottom flanges. The
shear resistance and the mid-span vertical deflections at Points 2 and 3 are to be
evaluated by the proposed analytical model.
In the calculation procedure, several assumptions have been made for the post-
buckling phase.
(1) The four edges of the shear panel are assumed to be rigid.
(2) The panel is composed of tensile strips aligned at 45o to the horizontal (α+θ2)
and compressive strips perpendicular to these tensile strips (see Figure 3-1 (f)).
3. An analytical approach to modelling shear panels at elevated temperatures
40
α is the angle between the tensile strip and the upper edge of the shear panel
while θ2 is the angle between the upper edge of the shear panel to horizontal.
The stresses within all the tensile strips are identical, as are the stresses within
all the compressive strips.
(3) The bending moment of the buckling panel is only resisted by compressing or
stretching the top and bottom flanges. There is no bending deformation on the
beam web.
The stress-strain relationship for structural steel at high temperatures is based on
Eurocode 3 Part 1-2 (CEN, 2005b) , for which the model is shown in Figure 3-3 (b);
however the curvilinear inelastic development phase of the Eurocode curve is replaced
by a sharp transition from elasticity to plasticity, as only the two end points of the
sharp transition (corresponding to proportional limit state and the initiation of yield
state) have been used in the analytical model; the path in between these two points
does not affect the result of the key points in the analytical model. The reduction
factors for yield strength and Young’s modulus at high temperatures from this code
have been used in the analytical model. At ambient temperature, the stress-strain
relationship is based on the same general constitutive model. To be consistent with
the stress-strain relationships at high temperatures, the same limiting strain at yield
,l and the same ultimate strain,u are applied to the stress-strain curve at ambient
temperature. The stress-strain relationship for structural steel at ambient temperature
is shown in Figure 3-3 (a).
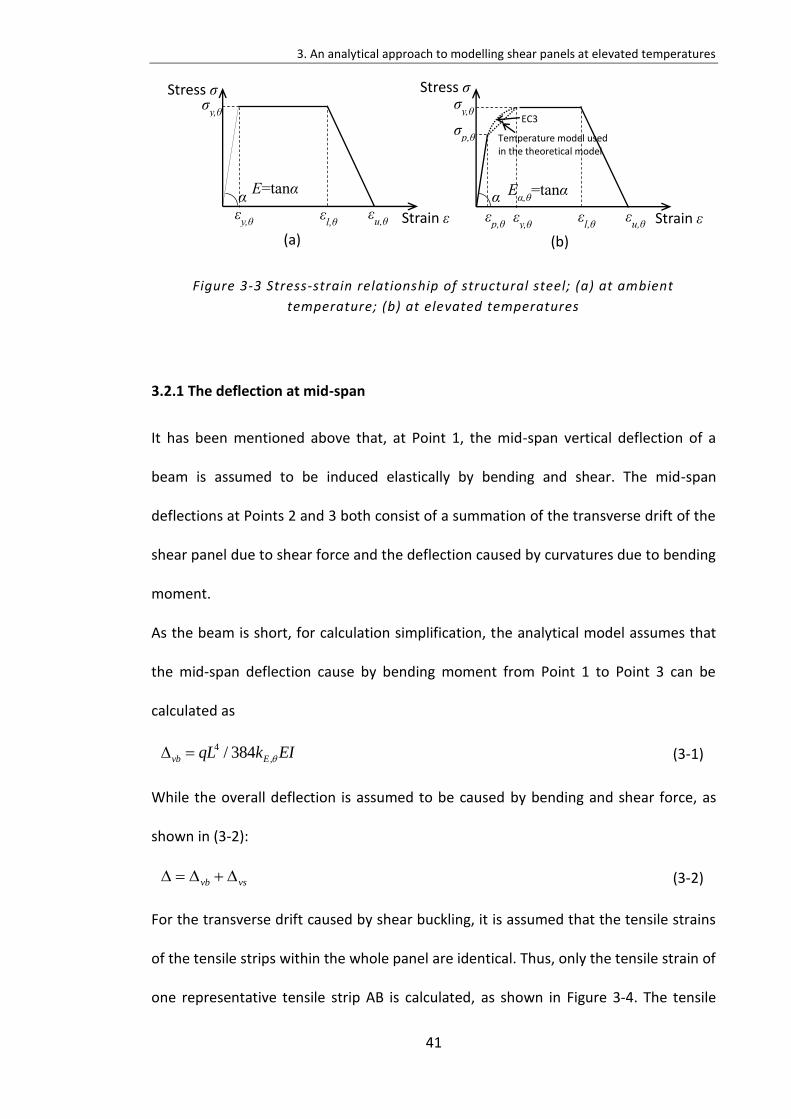
3. An analytical approach to modelling shear panels at elevated temperatures
41
Figure 3-3 Stress-strain relationship of structural steel; (a) at ambient
temperature; (b) at elevated temperatures
3.2.1 The deflection at mid-span
It has been mentioned above that, at Point 1, the mid-span vertical deflection of a
beam is assumed to be induced elastically by bending and shear. The mid-span
deflections at Points 2 and 3 both consist of a summation of the transverse drift of the
shear panel due to shear force and the deflection caused by curvatures due to bending
moment.
As the beam is short, for calculation simplification, the analytical model assumes that
the mid-span deflection cause by bending moment from Point 1 to Point 3 can be
calculated as
4
,/ 384vb EqL k EI (3-1)
While the overall deflection is assumed to be caused by bending and shear force, as
shown in (3-2):
vb vs (3-2)
For the transverse drift caused by shear buckling, it is assumed that the tensile strains
of the tensile strips within the whole panel are identical. Thus, only the tensile strain of
one representative tensile strip AB is calculated, as shown in Figure 3-4. The tensile
Stress
Strain
Stress
Strain
EC3
Temperature model used in the theoretical model
(a) (b)
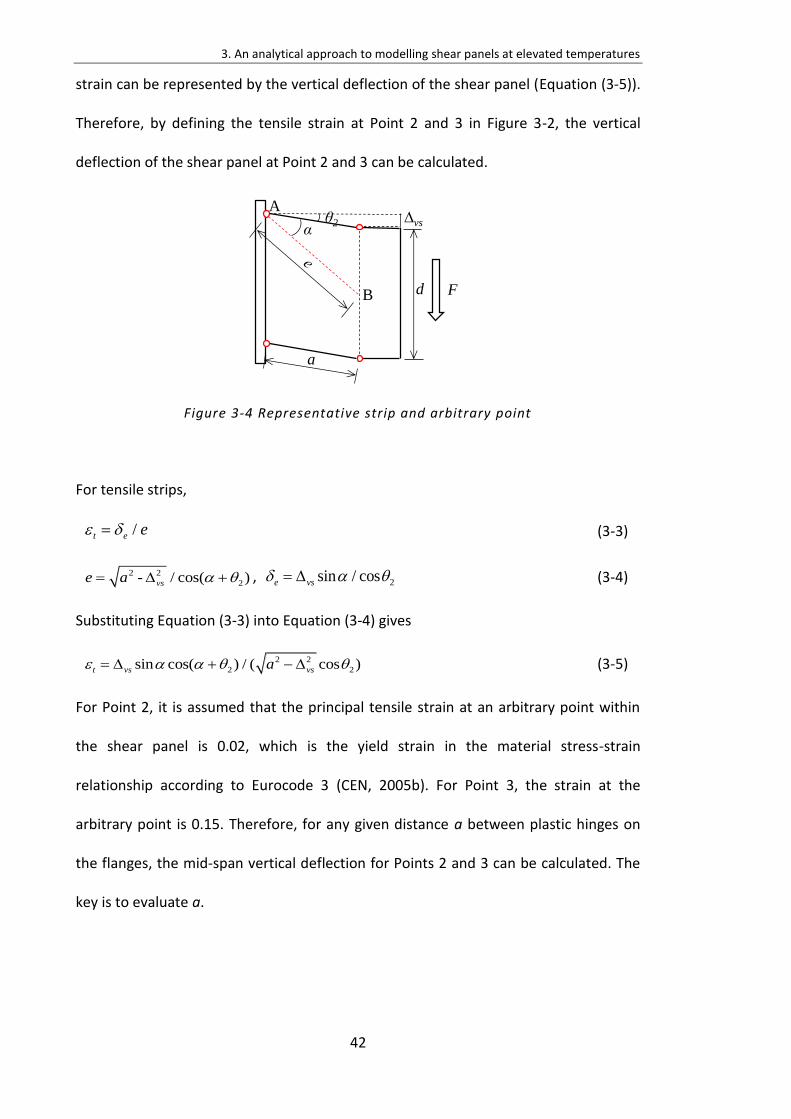
3. An analytical approach to modelling shear panels at elevated temperatures
42
strain can be represented by the vertical deflection of the shear panel (Equation (3-5)).
Therefore, by defining the tensile strain at Point 2 and 3 in Figure 3-2, the vertical
deflection of the shear panel at Point 2 and 3 can be calculated.
Figure 3-4 Representative strip and arbitrary point
For tensile strips,
/t e e (3-3)
2 2
2- / cos( )vse a , 2sin / cose vs (3-4)
Substituting Equation (3-3) into Equation (3-4) gives
2 2
2 2sin cos( ) / ( cos )t vs vsa (3-5)
For Point 2, it is assumed that the principal tensile strain at an arbitrary point within
the shear panel is 0.02, which is the yield strain in the material stress-strain
relationship according to Eurocode 3 (CEN, 2005b). For Point 3, the strain at the
arbitrary point is 0.15. Therefore, for any given distance a between plastic hinges on
the flanges, the mid-span vertical deflection for Points 2 and 3 can be calculated. The
key is to evaluate a.
A
B
vs
a
θ2
d
α
F
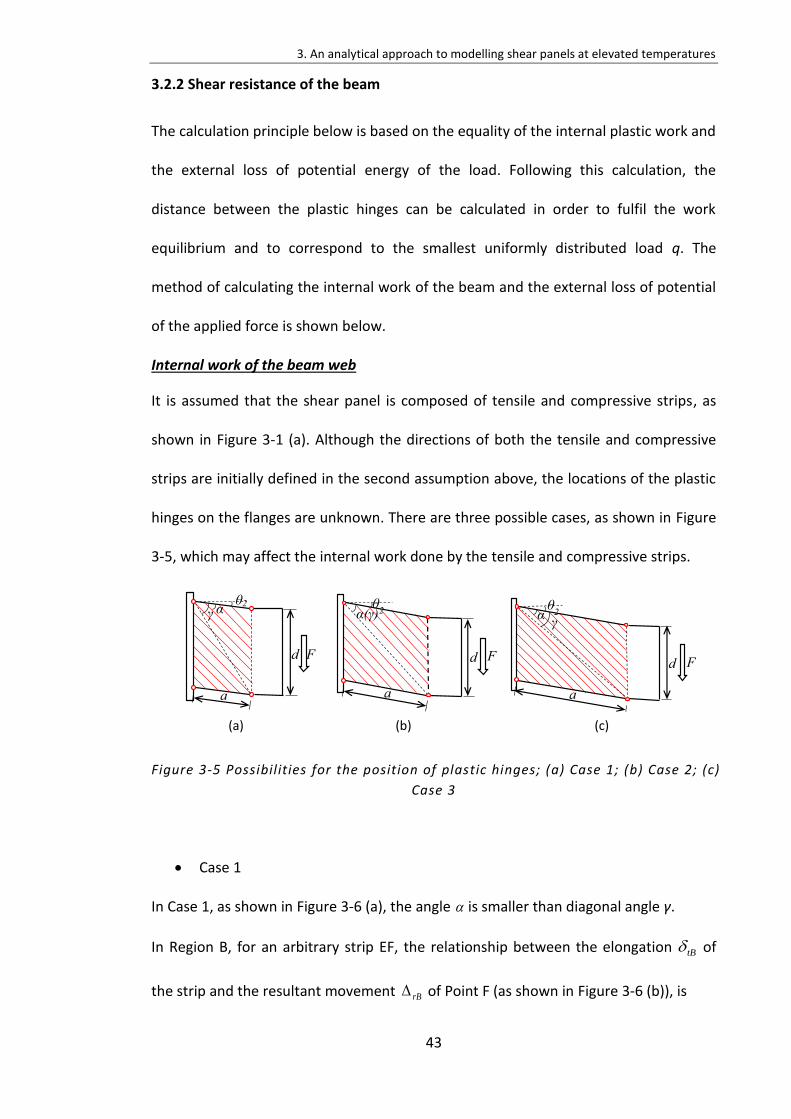
3. An analytical approach to modelling shear panels at elevated temperatures
43
3.2.2 Shear resistance of the beam
The calculation principle below is based on the equality of the internal plastic work and
the external loss of potential energy of the load. Following this calculation, the
distance between the plastic hinges can be calculated in order to fulfil the work
equilibrium and to correspond to the smallest uniformly distributed load q. The
method of calculating the internal work of the beam and the external loss of potential
of the applied force is shown below.
Internal work of the beam web
It is assumed that the shear panel is composed of tensile and compressive strips, as
shown in Figure 3-1 (a). Although the directions of both the tensile and compressive
strips are initially defined in the second assumption above, the locations of the plastic
hinges on the flanges are unknown. There are three possible cases, as shown in Figure
3-5, which may affect the internal work done by the tensile and compressive strips.
Figure 3-5 Possibilities for the position of plastic hinges; (a) Case 1; (b) Case 2; (c)
Case 3
Case 1
In Case 1, as shown in Figure 3-6 (a), the angle is smaller than diagonal angle γ.
In Region B, for an arbitrary strip EF, the relationship between the elongation tB of
the strip and the resultant movement rB of Point F (as shown in Figure 3-6 (b)), is
(a) (b) (c)
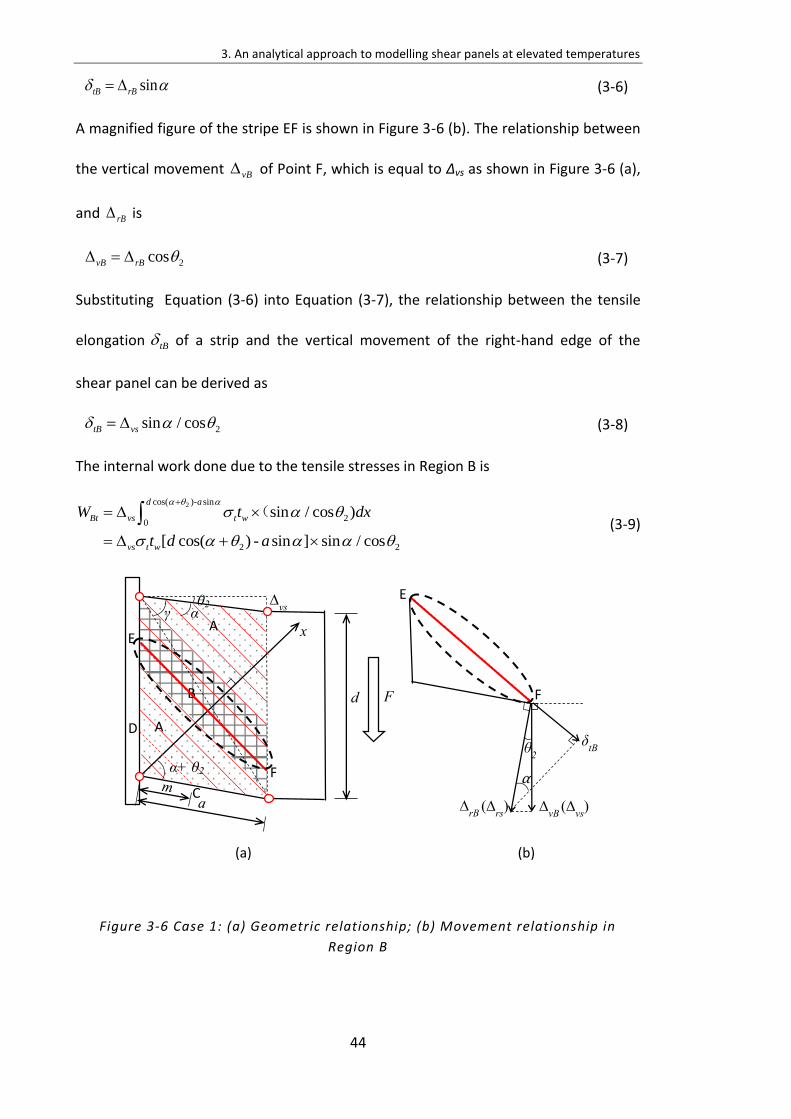
3. An analytical approach to modelling shear panels at elevated temperatures
44
sintB rB (3-6)
A magnified figure of the stripe EF is shown in Figure 3-6 (b). The relationship between
the vertical movement vB of Point F, which is equal to ∆vs as shown in Figure 3-6 (a),
and rB is
2cosvB rB (3-7)
Substituting Equation (3-6) into Equation (3-7), the relationship between the tensile
elongation tB of a strip and the vertical movement of the right-hand edge of the
shear panel can be derived as
2sin / costB vs (3-8)
The internal work done due to the tensile stresses in Region B is
2cos( )- sin
20
2 2
sin / cos )
[ cos( ) - sin ] sin / cos
d a
Bt vs t w
vs t w
W t dx
t d a
( (3-9)
Figure 3-6 Case 1: (a) Geometric relationship; (b) Movement relationship in
Region B
1
2
F
E
C
D
A
A
B
E
F
(a) (b)
2
2
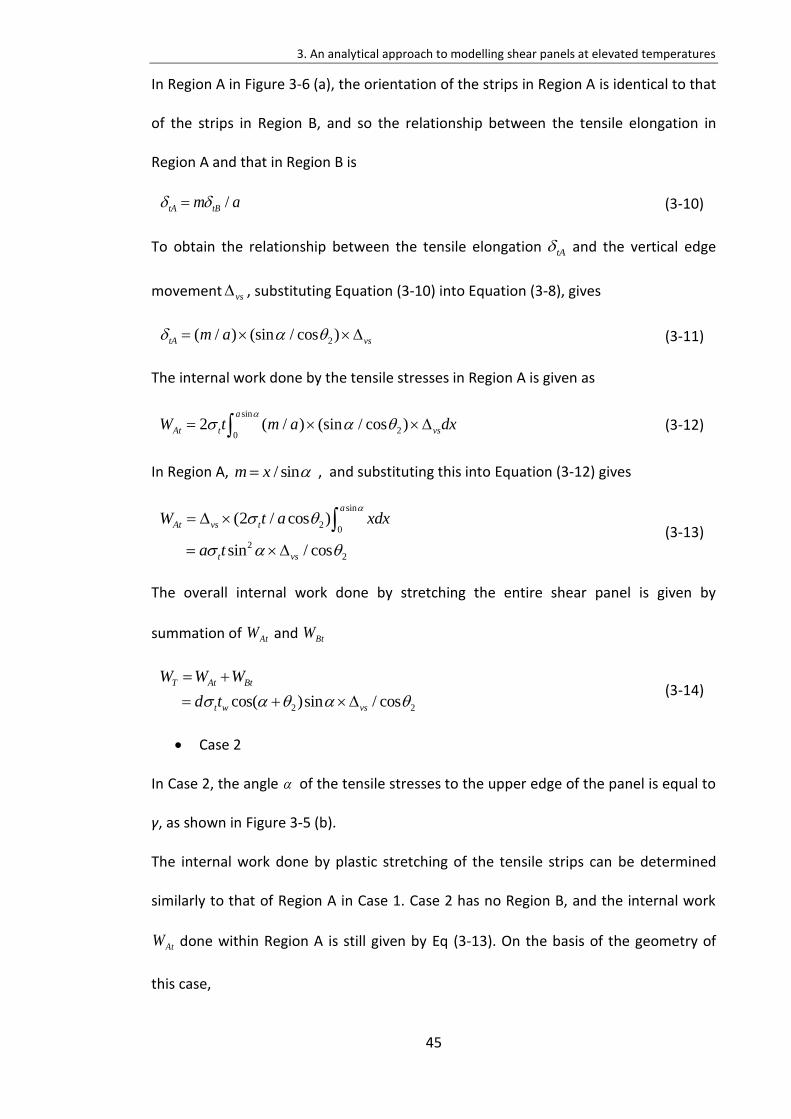
3. An analytical approach to modelling shear panels at elevated temperatures
45
In Region A in Figure 3-6 (a), the orientation of the strips in Region A is identical to that
of the strips in Region B, and so the relationship between the tensile elongation in
Region A and that in Region B is
/tA tBm a (3-10)
To obtain the relationship between the tensile elongation tA and the vertical edge
movement vs , substituting Equation (3-10) into Equation (3-8), gives
2( / ) (sin / cos )tA vsm a (3-11)
The internal work done by the tensile stresses in Region A is given as
sin
20
2 ( / ) (sin / cos )a
At t vsW t m a dx
(3-12)
In Region A, / sinm x , and substituting this into Equation (3-12) gives
sin
20
2
2
(2 / cos )
sin / cos
a
At vs t
t vs
W t a xdx
a t
(3-13)
The overall internal work done by stretching the entire shear panel is given by
summation of AtW and BtW
2 2cos( )sin / cos
T At Bt
t w vs
W W W
d t
(3-14)
Case 2
In Case 2, the angle of the tensile stresses to the upper edge of the panel is equal to
γ, as shown in Figure 3-5 (b).
The internal work done by plastic stretching of the tensile strips can be determined
similarly to that of Region A in Case 1. Case 2 has no Region B, and the internal work
AtW done within Region A is still given by Eq (3-13). On the basis of the geometry of
this case,
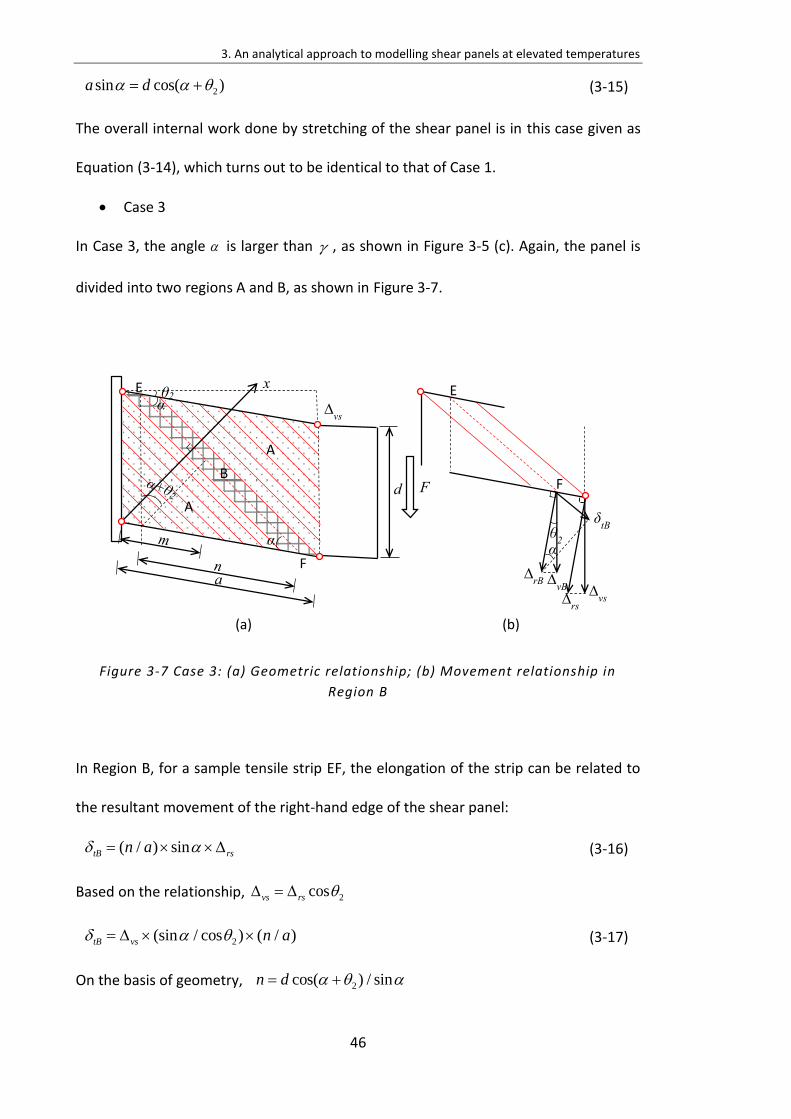
3. An analytical approach to modelling shear panels at elevated temperatures
46
2sin cos( )a d (3-15)
The overall internal work done by stretching of the shear panel is in this case given as
Equation (3-14), which turns out to be identical to that of Case 1.
Case 3
In Case 3, the angle is larger than , as shown in Figure 3-5 (c). Again, the panel is
divided into two regions A and B, as shown in Figure 3-7.
Figure 3-7 Case 3: (a) Geometric relationship; (b) Movement relationship in
Region B
In Region B, for a sample tensile strip EF, the elongation of the strip can be related to
the resultant movement of the right-hand edge of the shear panel:
( / ) sintB rsn a (3-16)
Based on the relationship, 2cosvs rs
2(sin / cos ) ( / )tB vs n a (3-17)
On the basis of geometry, 2cos( ) / sinn d
E
F
2
A
A
B
E
F
(a) (b)
2
3. An analytical approach to modelling shear panels at elevated temperatures
47
The relationship between the tensile elongation of a strip in Region B and the resultant
movement of the right-hand edge of the panel ∆vs is
2 2(sin / cos ) cos( ) / (sin / )tB vs d a (3-18)
The internal work done by the tensile stresses in Region B is therefore
2sin - cos( )
2 20
2 2
2 2 2 2
(sin / cos ) cos( ) / (sin / )
[ cos( )sin / cos cos ( ) / ( cos )]
a d
Bt vs t w
vs t w t w
W t d a dx
t d t d a
(3-19)
The internal work of Region A is given as,
2cos( )
20
2 ( / ) (sin / cos )d
At t w vsW t m a dx
(3-20)
In Region A, / sinm x , and substituting this into Equation (3-20) gives
2cos( )
20
2 2
2 2
(2 / cos )
cos ( ) / ( cos )
d
At vs t w
t w vs
W t a xdx
t d a
(3-21)
Then adding AtW and BtW gives the total internal work done by plastic stretching of
the shear panel in this case.
2 2cos( )sin / cosT t w vsW d t (3-22)
It can be seen that the formulation of the internal work done by tension turns out to
be the same for all the three cases. This shows that the tensile resistance of a shear
panel is not sensitive to the locations of plastic hinges.
For compressive strips, there are also three cases depending on the locations of plastic
hinges. Similarly to the tensile resistance, it can also be proved that the compressive
capacity of a shear panel is not sensitive to the locations of the plastic hinges. For all
three cases, the formulation of the internal work of the compressive strips is identical,
and is given as
2 2sin( )cos / cosC c w vsW d t (3-23)
3. An analytical approach to modelling shear panels at elevated temperatures
48
Therefore, the internal work of the web in the post-buckling stage is
2 2 2 2cos( )sin / cos sin( )cos / cos
W T C
t w vs c w vs
W W W
d t d t
(3-24)
It is not surprising to see that the three cases have an identical relationship for internal
work since, when the entire panel is in uniform tension in one direction and in
compression in the perpendicular direction, the internal work is derived similarly.
Internal work of the top and bottom flanges
The internal work of the flanges is the work done in deforming the four plastic hinges
on the top and bottom flanges of the beam. The plastic moment resistance of each of
the four hinges is
2
0 , / 4y fM bt (3-25)
In this equation 0M does not account for the effect of the axial stresses in the flanges
caused by bending of the overall beam cross-section, which reduces the flange
moment capacity. The reduced moment capacity due to overall bending is given as
2
1 0 ( ) ,
2 2
, ,
[1 ( / ) ]
[1 ( 0.5 ( 0.5 ) / ( )) ] / 4
t c y
y f r f y
M M
bt M d t I
( )
( )
(3-26)
Where Mr is the applied bending moment of the section
The internal work done by the plastic hinges in the flanges is therefore
2 2
1 2 , , 24 [1 (0.5 ( 0.5 ) / ) ]f y f r f yW M bt M d t I (3-27)
Total internal work of the beam
The analytical model can calculate the distance between the plastic hinges on the
flanges. The calculated value indicates whether plastic hinges have been formed;
1 0M
1 0M 1 0M
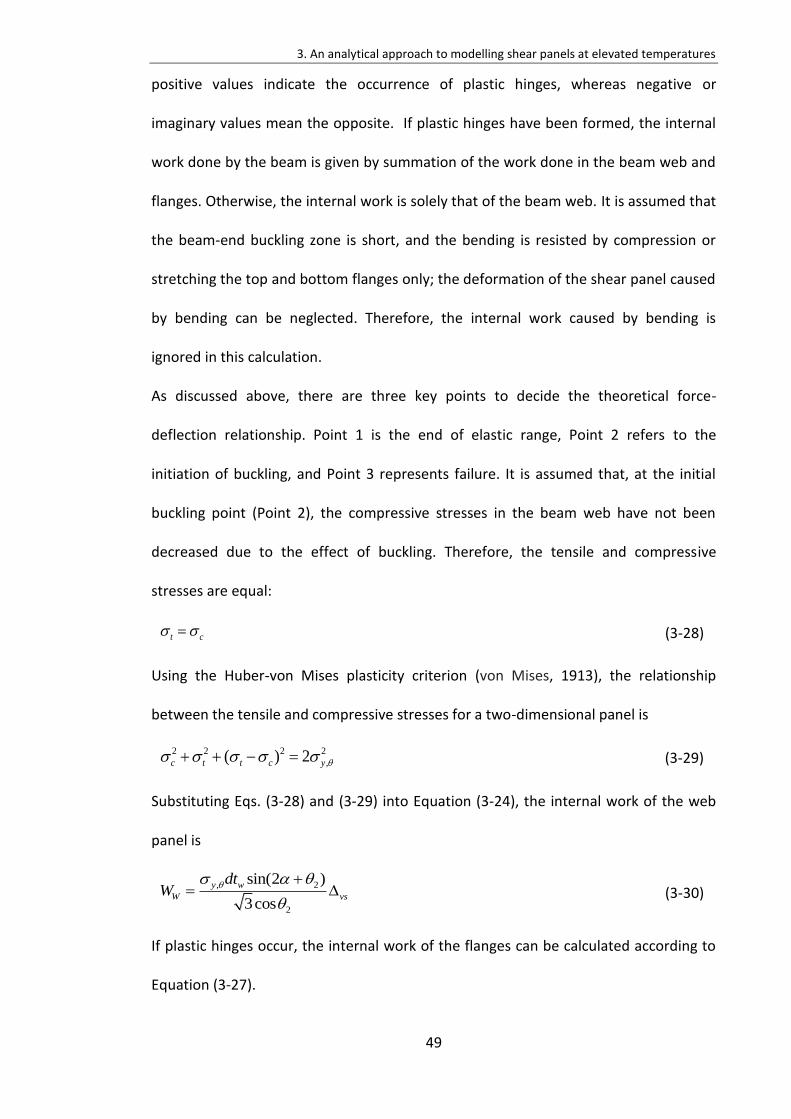
3. An analytical approach to modelling shear panels at elevated temperatures
49
positive values indicate the occurrence of plastic hinges, whereas negative or
imaginary values mean the opposite. If plastic hinges have been formed, the internal
work done by the beam is given by summation of the work done in the beam web and
flanges. Otherwise, the internal work is solely that of the beam web. It is assumed that
the beam-end buckling zone is short, and the bending is resisted by compression or
stretching the top and bottom flanges only; the deformation of the shear panel caused
by bending can be neglected. Therefore, the internal work caused by bending is
ignored in this calculation.
As discussed above, there are three key points to decide the theoretical force-
deflection relationship. Point 1 is the end of elastic range, Point 2 refers to the
initiation of buckling, and Point 3 represents failure. It is assumed that, at the initial
buckling point (Point 2), the compressive stresses in the beam web have not been
decreased due to the effect of buckling. Therefore, the tensile and compressive
stresses are equal:
t c (3-28)
Using the Huber-von Mises plasticity criterion (von Mises, 1913), the relationship
between the tensile and compressive stresses for a two-dimensional panel is
2 2 2 2
,( ) 2c t t c y (3-29)
Substituting Eqs. (3-28) and (3-29) into Equation (3-24), the internal work of the web
panel is
, 2
2
sin(2 )
3cos
y w
W vs
dtW
(3-30)
If plastic hinges occur, the internal work of the flanges can be calculated according to
Equation (3-27).
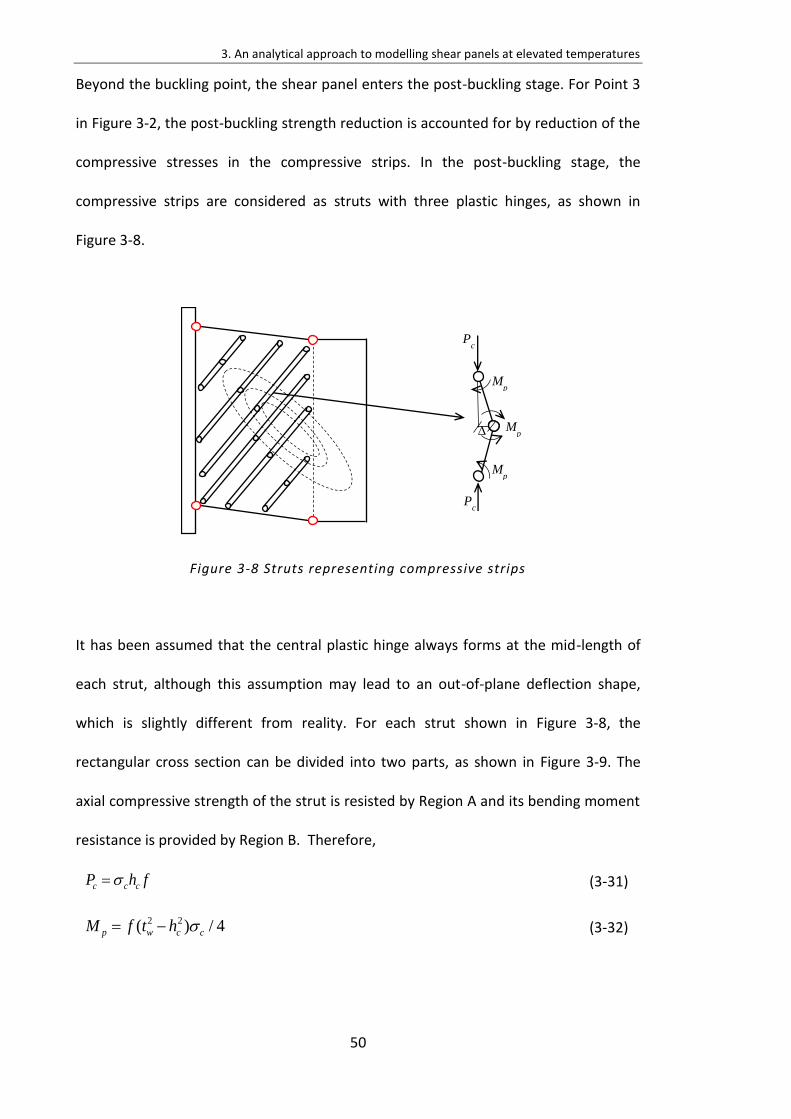
3. An analytical approach to modelling shear panels at elevated temperatures
50
Beyond the buckling point, the shear panel enters the post-buckling stage. For Point 3
in Figure 3-2, the post-buckling strength reduction is accounted for by reduction of the
compressive stresses in the compressive strips. In the post-buckling stage, the
compressive strips are considered as struts with three plastic hinges, as shown in
Figure 3-8.
Figure 3-8 Struts representing compressive strips
It has been assumed that the central plastic hinge always forms at the mid-length of
each strut, although this assumption may lead to an out-of-plane deflection shape,
which is slightly different from reality. For each strut shown in Figure 3-8, the
rectangular cross section can be divided into two parts, as shown in Figure 3-9. The
axial compressive strength of the strut is resisted by Region A and its bending moment
resistance is provided by Region B. Therefore,
c c cP h f (3-31)
2 2( ) / 4p w c cM f t h (3-32)
Pc
Mp
Mp
Mp
Pc
∆
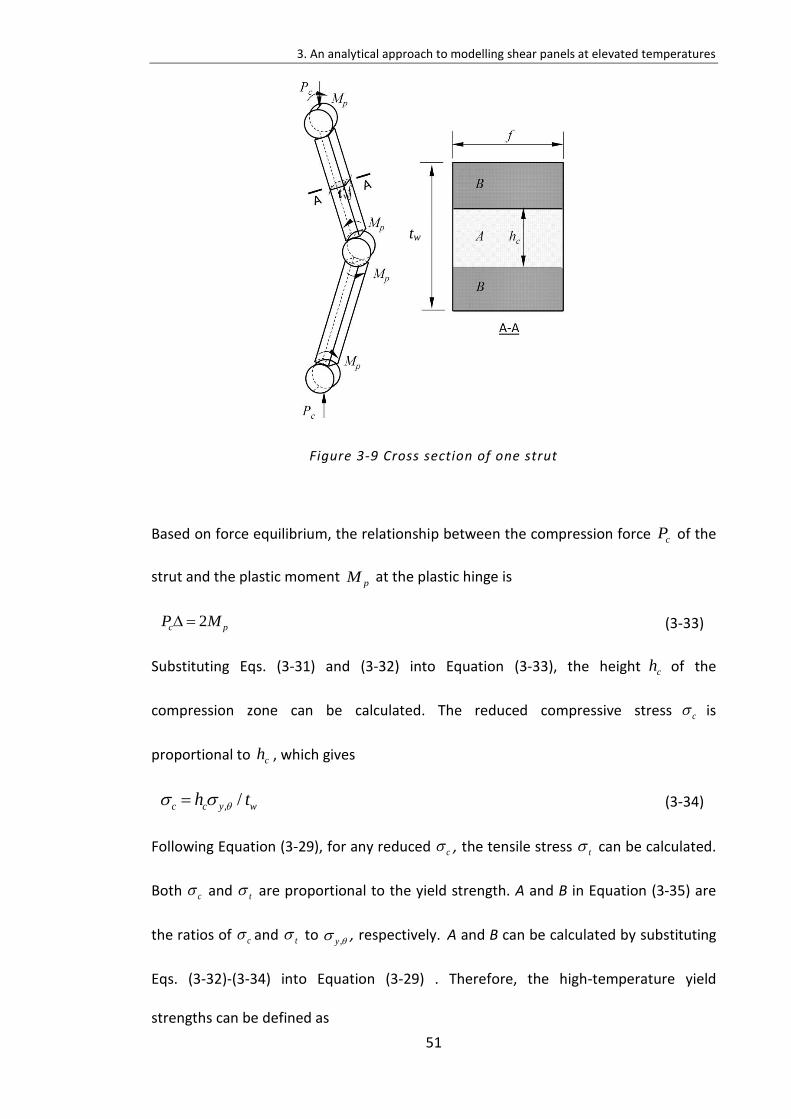
3. An analytical approach to modelling shear panels at elevated temperatures
51
Figure 3-9 Cross section of one strut
Based on force equilibrium, the relationship between the compression force cP of the
strut and the plastic moment pM at the plastic hinge is
2c pP M (3-33)
Substituting Eqs. (3-31) and (3-32) into Equation (3-33), the height ch of the
compression zone can be calculated. The reduced compressive stress c is
proportional to ch , which gives
, /c c y wh t (3-34)
Following Equation (3-29), for any reduced c , the tensile stress t can be calculated.
Both c and t are proportional to the yield strength. A and B in Equation (3-35) are
the ratios of c and t to ,y , respectively. A and B can be calculated by substituting
Eqs. (3-32)-(3-34) into Equation (3-29) . Therefore, the high-temperature yield
strengths can be defined as
tw
3. An analytical approach to modelling shear panels at elevated temperatures
52
,c yA and ,t yB (3-35)
Substituting Equation (3-35) into Equation (3-24) gives
2 2 2
, 2 , 2 2
, 2 2 2
sin cos( ) sin( )cos / cos
sin cos( ) sin( )cos / cos
[0.5 ( )sin(2 ) 0.5 ( )sin ] / cos
W T C t w c w vs
y w y w vs
y w vs
W W W t d t d
A t d B t d
t d A B B A
(3-36)
As has been presented above, for each a the transverse drift vs of the shear panel
can be calculated. This can influence the reduction of compressive stress, which in
return changes the calculated value of the distance between the plastic hinges.
Therefore, an iterative process is used here to balance the value of a .
External work
If a beam is subjected to uniformly distributed load, the external work is given as
/ 2 ( ) ( / 2)e vs vs vsW aq q l a q l a (3-37)
It has been explained above that internal work is only related to the distance a
between plastic hinges, rather than the length of the shear buckling wave. This is also
the case for the external work, as indicated by Equation (3-37).
As the calculation principle is based on equality of the internal plastic work and the
external loss of potential energy of the load, the summation of the internal work of the
shear panel web and flange is equal to the external work, as shown in Equation (3-38).
W f eW W W (3-38)
The distance a between plastic hinges on one flange can be calculated from Equation
(3-38). As the uniformly distributed load q progressively increases, there will
eventually be an a and the corresponding smallest q that fulfil Equation (3-38). It can
be proved mathematically by solving the nonlinear Equation (3-38) that a is not related
to either the yield stress or to Young’s modulus. In other words, a is not related to
temperature. It is worth noting that the distance a is related to the loading conditions.
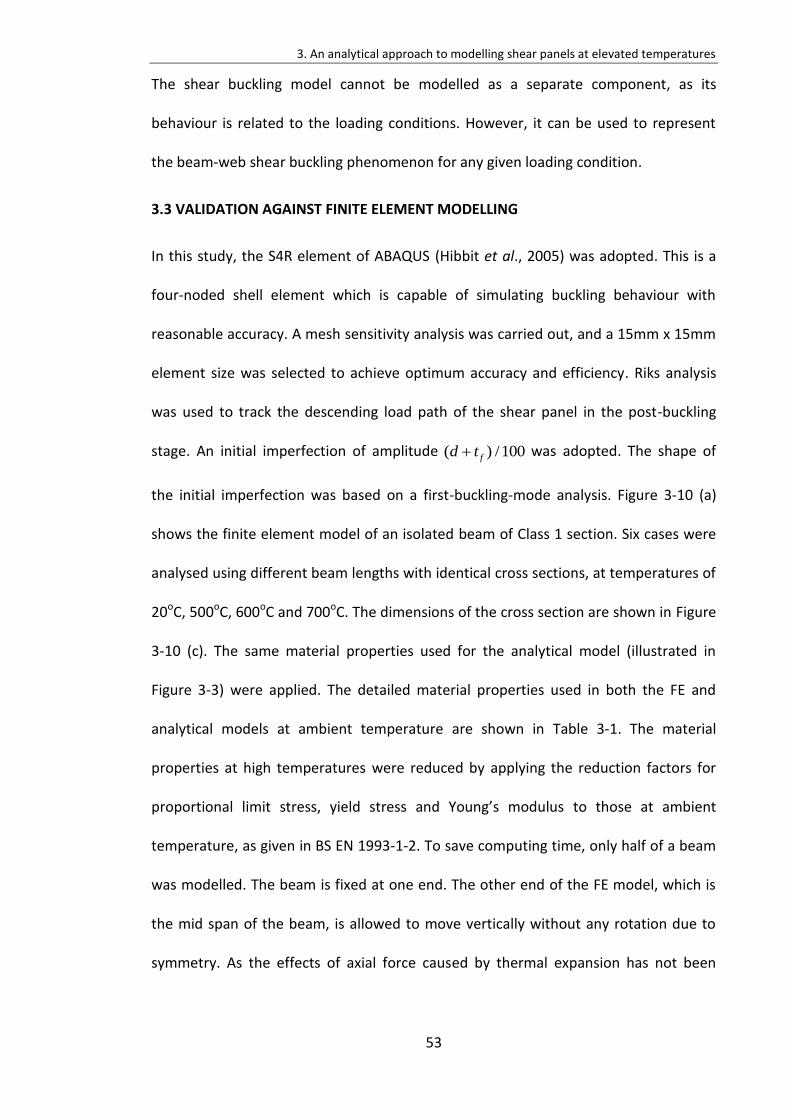
3. An analytical approach to modelling shear panels at elevated temperatures
53
The shear buckling model cannot be modelled as a separate component, as its
behaviour is related to the loading conditions. However, it can be used to represent
the beam-web shear buckling phenomenon for any given loading condition.
3.3 VALIDATION AGAINST FINITE ELEMENT MODELLING
In this study, the S4R element of ABAQUS (Hibbit et al., 2005) was adopted. This is a
four-noded shell element which is capable of simulating buckling behaviour with
reasonable accuracy. A mesh sensitivity analysis was carried out, and a 15mm x 15mm
element size was selected to achieve optimum accuracy and efficiency. Riks analysis
was used to track the descending load path of the shear panel in the post-buckling
stage. An initial imperfection of amplitude ( ) /100fd t was adopted. The shape of
the initial imperfection was based on a first-buckling-mode analysis. Figure 3-10 (a)
shows the finite element model of an isolated beam of Class 1 section. Six cases were
analysed using different beam lengths with identical cross sections, at temperatures of
20oC, 500oC, 600oC and 700oC. The dimensions of the cross section are shown in Figure
3-10 (c). The same material properties used for the analytical model (illustrated in
Figure 3-3) were applied. The detailed material properties used in both the FE and
analytical models at ambient temperature are shown in Table 3-1. The material
properties at high temperatures were reduced by applying the reduction factors for
proportional limit stress, yield stress and Young’s modulus to those at ambient
temperature, as given in BS EN 1993-1-2. To save computing time, only half of a beam
was modelled. The beam is fixed at one end. The other end of the FE model, which is
the mid span of the beam, is allowed to move vertically without any rotation due to
symmetry. As the effects of axial force caused by thermal expansion has not been
3. An analytical approach to modelling shear panels at elevated temperatures
54
considered in the analytical model, the mid span is allowed to move horizontally in the
FE model. Boundary conditions are shown in Figure 3-10 (b).
Figure 3-10 Finite element model; (a) Image of finite element model; (b)
Boundary conditions; (c) Cross section dimensions (in mm)
Table 3-1 Material Properties of the FE model at ambient temperature
y (N/mm2) E (N/mm2) ,y (%) ,t (%)
,u (%)
275 2.1e5 2 15 20
Since no practical experimental results exist for the shear buckling of Class 1 and 2
sections, the ABAQUS models cannot be validated against experiments directly. In
order to verify the accuracy of the ABAQUS models, similar models in Chapter 4 were
validated against experimental results at elevated temperatures. The ABAQUS models
in this chapter were created on the basis of those in Chapter 4, by changing the
loading and boundary conditions. The force-displacement relationships given by the
analytical model and the ABAQUS analysis are compared in Figure 3-11, at
Beam end Mid span
Beam end Mid span
01.
3 .7
7
210
10.
(a)
(b)
(c)
17.4
3. An analytical approach to modelling shear panels at elevated temperatures
55
temperatures varying from 20oC to 700oC. The solid lines represent ABAQUS results,
whereas the three round markers in each part of this figure show Points 1 to 3 given
by the analytical model. As can be seen from Figure 3-11, the beam-end reaction
forces given by the analytical model generally compare well with those from the
ABAQUS model at all three stages. The theoretical results are always on the safe side
for the cases analysed. More validations of the analytical models against ABAQUS
model with different cross-section dimensions will be presented in Chapter 5.
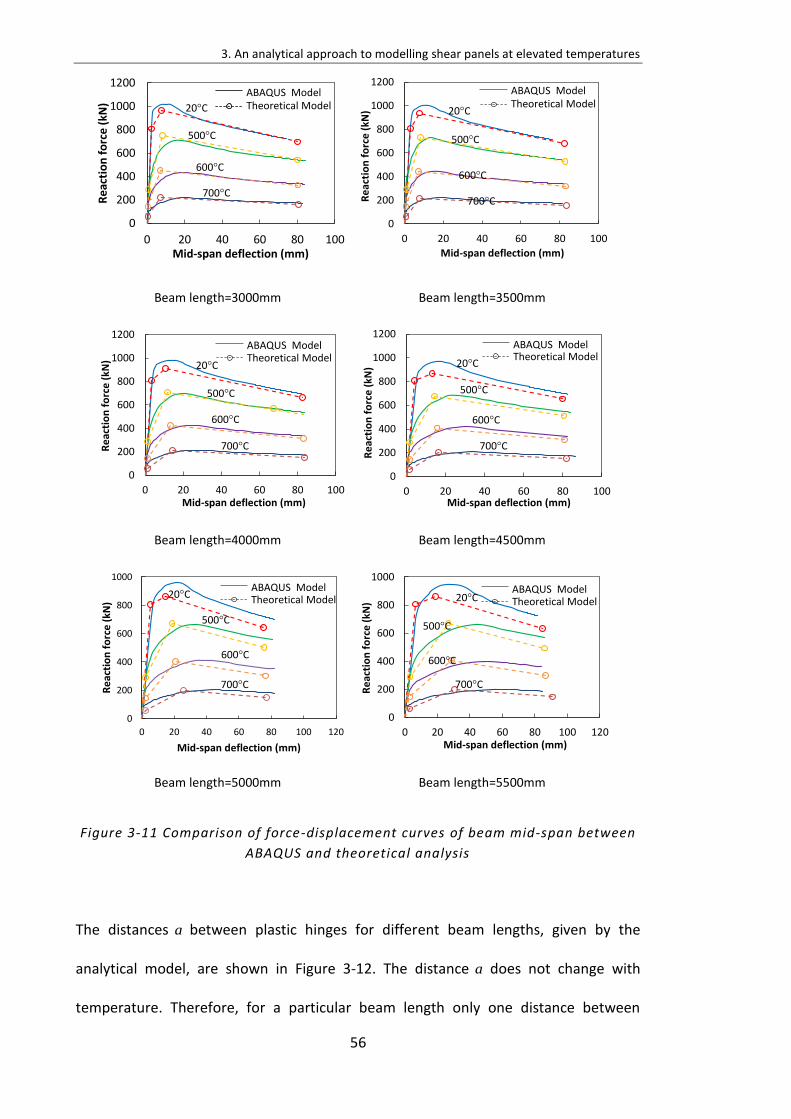
3. An analytical approach to modelling shear panels at elevated temperatures
56
Figure 3-11 Comparison of force-displacement curves of beam mid-span between
ABAQUS and theoretical analysis
The distances a between plastic hinges for different beam lengths, given by the
analytical model, are shown in Figure 3-12. The distance a does not change with
temperature. Therefore, for a particular beam length only one distance between
Beam length=3000mm Beam length=3500mm
Beam length=4000mm Beam length=4500mm
Beam length=5000mm Beam length=5500mm
0
200
400
600
800
1000
1200
0 20 40 60 80 100
Re
acti
on
fo
rce
(kN
)
Mid-span deflection (mm)
Theoretical ModelABAQUS Model
20 C
500 C
600 C
700 C
0
200
400
600
800
1000
1200
0 20 40 60 80 100
Re
acti
on
fo
rce
(kN
)
Mid-span deflection (mm)
20 C
500 C
600 C
700 C
Theoretical ModelABAQUS Model
0
200
400
600
800
1000
1200
0 20 40 60 80 100
Re
acti
on
fo
rce
(kN
)
Mid-span deflection (mm)
20 C
500 C
600 C
700 C
Theoretical ModelABAQUS Model
0
200
400
600
800
1000
1200
0 20 40 60 80 100
Re
acti
on
fo
rce
(kN
)
Mid-span deflection (mm)
20 C
500 C
600 C
700 C
Theoretical ModelABAQUS Model
0
200
400
600
800
1000
0 20 40 60 80 100 120
Re
acti
on
fo
rce
(kN
)
Mid-span deflection (mm)
20 C
500 C
600 C
700 C
Theoretical ModelABAQUS Model
0
200
400
600
800
1000
0 20 40 60 80 100 120
Re
acti
on
fo
rce
(kN
)
Mid-span deflection (mm)
20 C
500 C
600 C
700 C
Theoretical ModelABAQUS Model
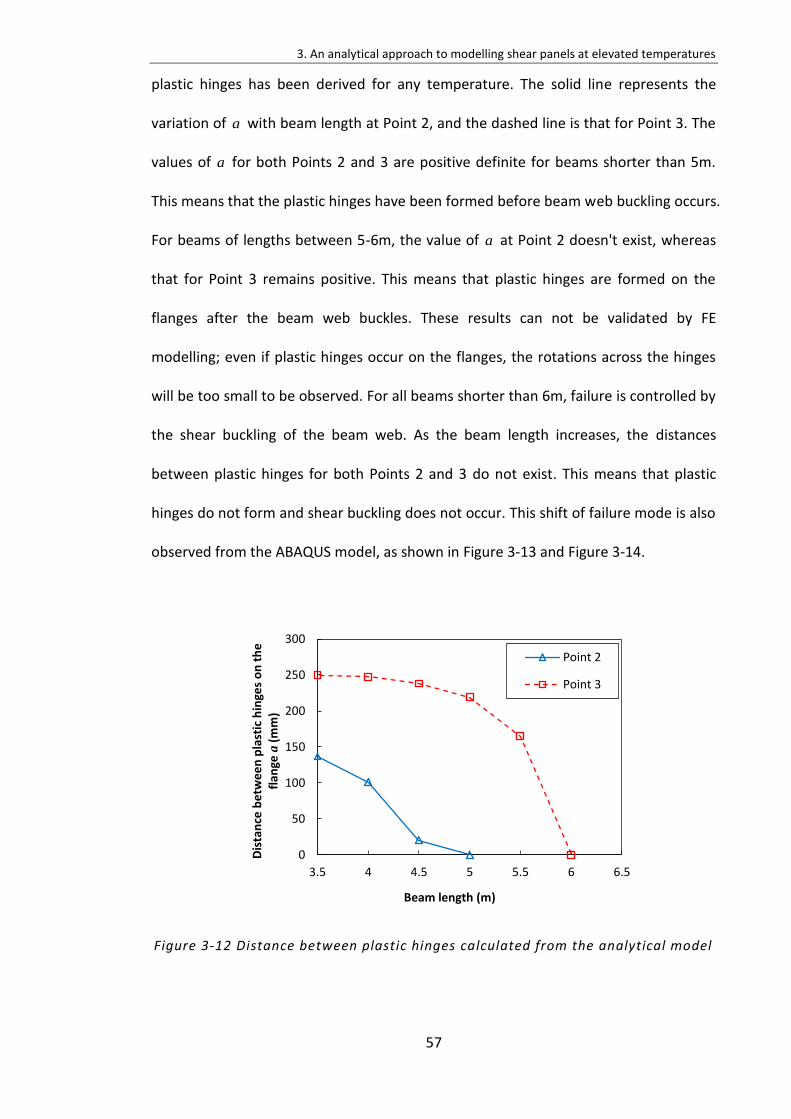
3. An analytical approach to modelling shear panels at elevated temperatures
57
plastic hinges has been derived for any temperature. The solid line represents the
variation of a with beam length at Point 2, and the dashed line is that for Point 3. The
values of a for both Points 2 and 3 are positive definite for beams shorter than 5m.
This means that the plastic hinges have been formed before beam web buckling occurs.
For beams of lengths between 5-6m, the value of a at Point 2 doesn't exist, whereas
that for Point 3 remains positive. This means that plastic hinges are formed on the
flanges after the beam web buckles. These results can not be validated by FE
modelling; even if plastic hinges occur on the flanges, the rotations across the hinges
will be too small to be observed. For all beams shorter than 6m, failure is controlled by
the shear buckling of the beam web. As the beam length increases, the distances
between plastic hinges for both Points 2 and 3 do not exist. This means that plastic
hinges do not form and shear buckling does not occur. This shift of failure mode is also
observed from the ABAQUS model, as shown in Figure 3-13 and Figure 3-14.
Figure 3-12 Distance between plastic hinges calculated from the analytical model
0
50
100
150
200
250
300
3.5 4 4.5 5 5.5 6 6.5
Dis
tan
ce b
etw
ee
n p
last
ic h
inge
s o
n t
he
fl
ange
a (
mm
)
Beam length (m)
Point 2
Point 3
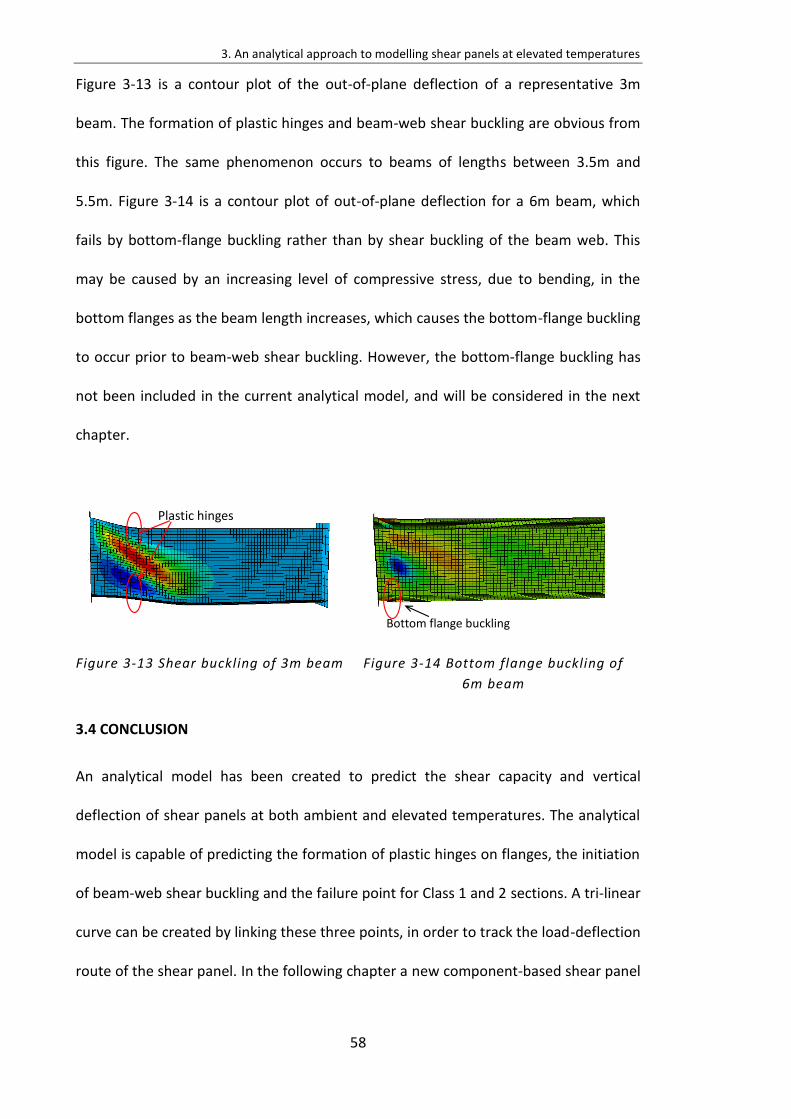
3. An analytical approach to modelling shear panels at elevated temperatures
58
Figure 3-13 is a contour plot of the out-of-plane deflection of a representative 3m
beam. The formation of plastic hinges and beam-web shear buckling are obvious from
this figure. The same phenomenon occurs to beams of lengths between 3.5m and
5.5m. Figure 3-14 is a contour plot of out-of-plane deflection for a 6m beam, which
fails by bottom-flange buckling rather than by shear buckling of the beam web. This
may be caused by an increasing level of compressive stress, due to bending, in the
bottom flanges as the beam length increases, which causes the bottom-flange buckling
to occur prior to beam-web shear buckling. However, the bottom-flange buckling has
not been included in the current analytical model, and will be considered in the next
chapter.
Figure 3-13 Shear buckling of 3m beam Figure 3-14 Bottom flange buckling of
6m beam
3.4 CONCLUSION
An analytical model has been created to predict the shear capacity and vertical
deflection of shear panels at both ambient and elevated temperatures. The analytical
model is capable of predicting the formation of plastic hinges on flanges, the initiation
of beam-web shear buckling and the failure point for Class 1 and 2 sections. A tri-linear
curve can be created by linking these three points, in order to track the load-deflection
route of the shear panel. In the following chapter a new component-based shear panel
lastic hinges
Bottom flange buckling
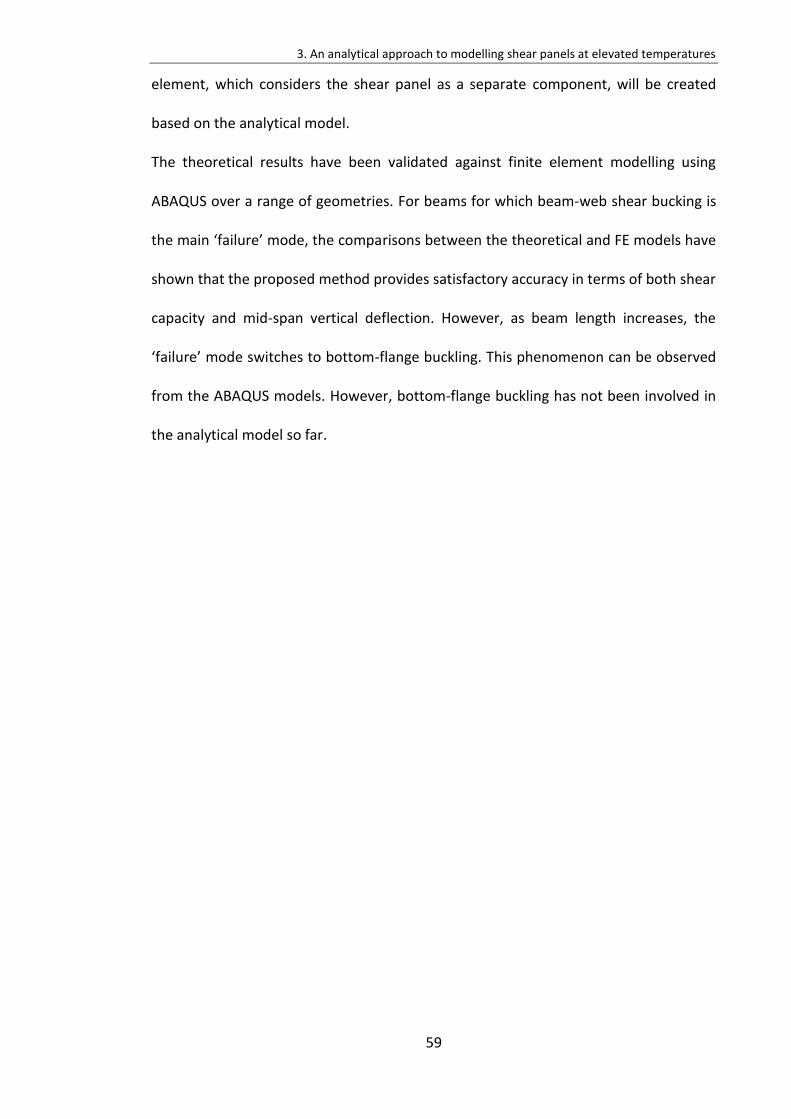
3. An analytical approach to modelling shear panels at elevated temperatures
59
element, which considers the shear panel as a separate component, will be created
based on the analytical model.
The theoretical results have been validated against finite element modelling using
ABAQUS over a range of geometries. For beams for which beam-web shear bucking is
the main ‘failure’ mode, the comparisons between the theoretical and FE models have
shown that the proposed method provides satisfactory accuracy in terms of both shear
capacity and mid-span vertical deflection. However, as beam length increases, the
‘failure’ mode switches to bottom-flange buckling. This phenomenon can be observed
from the ABAQUS models. However, bottom-flange buckling has not been involved in
the analytical model so far.
60
4.
COMBINING THE EFFECTS OF SHEAR
BUCKLING AND BOTTOM-FLANGE BUCKLING
IN THE POST-BUCKLING STAGE
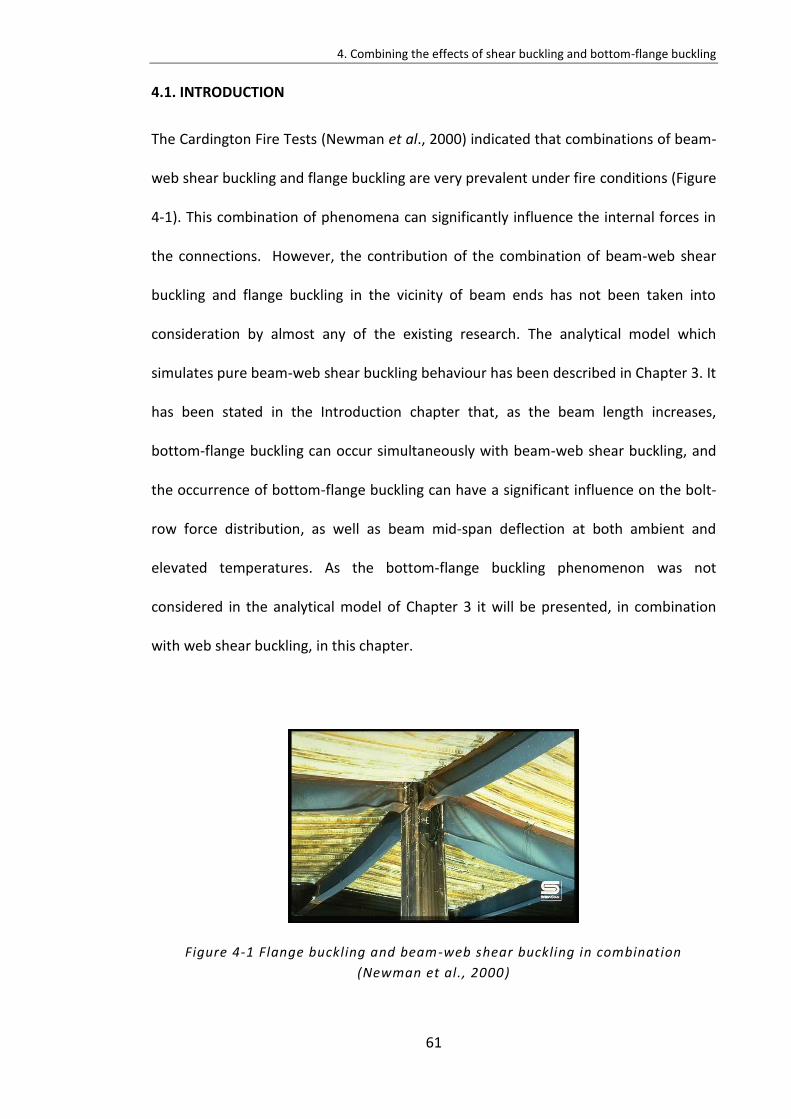
4. Combining the effects of shear buckling and bottom-flange buckling
61
4.1. INTRODUCTION
The Cardington Fire Tests (Newman et al., 2000) indicated that combinations of beam-
web shear buckling and flange buckling are very prevalent under fire conditions (Figure
4-1). This combination of phenomena can significantly influence the internal forces in
the connections. However, the contribution of the combination of beam-web shear
buckling and flange buckling in the vicinity of beam ends has not been taken into
consideration by almost any of the existing research. The analytical model which
simulates pure beam-web shear buckling behaviour has been described in Chapter 3. It
has been stated in the Introduction chapter that, as the beam length increases,
bottom-flange buckling can occur simultaneously with beam-web shear buckling, and
the occurrence of bottom-flange buckling can have a significant influence on the bolt-
row force distribution, as well as beam mid-span deflection at both ambient and
elevated temperatures. As the bottom-flange buckling phenomenon was not
considered in the analytical model of Chapter 3 it will be presented, in combination
with web shear buckling, in this chapter.
Figure 4-1 Flange buckling and beam-web shear buckling in combination
(Newman et al., 2000)
4. Combining the effects of shear buckling and bottom-flange buckling
62
Elghazouli et al. (1999) implemented a local-buckling model within a frame analysis
program to investigate the influence of local buckling at the beam ends on the fire
response of frame members and sub-assemblies. This study indicated that, although
local buckling at the beam ends may not directly trigger overall structural collapse, it
can have detrimental effects on the deflections of, and load re-distributions between,
structural elements. This could influence the fire resistance of the structure. However,
the local buckling model presented in Elghazouli’s work is based on elastic plate
buckling theory, which is not appropriate for representing the buckling behaviour of
Class 1 and 2 sections. No sufficient validation of the local-buckling model presented in
his paper has been provided. A body of research (Kato, 1965, Climenhaga and Johnson,
1972, Gioncu and Petcu, 1995, Gioncu and Petcu, 1997, Gioncu and Mazzolani, 2003)
has been carried out to investigate the local in-plane flange buckling phenomenon,
including both the pre- and post-buckling stages. Recent research has a common
solution for the pre-buckling stage, while different collapse models of the post-
buckling stage have been proposed since 1965 (Kato, 1965). The local buckling collapse
mechanisms in all these models are composed of yield lines and plastic zones. The
choices of possible yield line patterns are based on experimental observations. All
models assume that the yield lines, formed within the elastic buckling wavelength, will
not change their positions in the post-buckling stage. However, these studies nearly all
focus on the effects of local buckling on the rotational capacity and ductility of beam-
ends, rather than on its influence on the global structural behaviour. Dharma extended
the most up-to-date ambient temperature model, proposed by Gioncu and Petcu
(2003), to elevated-temperature applications for both steel beams (Dharma and Tan,
2007b) and composite beams (Dharma and Tan, 2008). However, Dharma’s research
has been shown to be extremely conservative for thin-web beams at elevated
4. Combining the effects of shear buckling and bottom-flange buckling
63
temperatures (Dharma, 2007). The detailed gap between the existing Dharma’s model
and the analytical model needed has been introduced in Chapter 2.
In this chapter, the new analytical model (1) considers the combination and interaction
of flange buckling and web shear buckling; and (2) adopts a revised calculation
approach for flange buckling wavelength to represent slender beams. Two comparison
cased were considered to compare the analytical model with Dharma’s model and
finite element (FE) models using ABAQUS. In the first comparison case, the FEA
analyses a short cantilever with a fixed length of 2 d at the end of the beam. It is able
to consider any loading condition, without uniformly distributed load on top of the
buckling panel, by varying the combination of shear force and bending moment
transferred to the end of the buckling panel. In the second comparison case, the FEA
analyses a short cantilever with the length from the beam end to its adjacent point of
contraflexure. It is able to consider any loading condition, with uniformly distributed
load on top of the buckling panel, by varying the shear force at the end of the
cantilever and the uniformly distributed load on top of the beam. After validation, the
analytical model has been implemented in calculating the deflection of a full-length
beam, and this has been compared with an equivalent ABAQUS model. The analytical
model will eventually be integrated into the software Vulcan, to be placed in structural
models between the existing connection element, which is assumed to exist at the
column-face, and the beam element, using a component-based approach.
Performance-based analysis will then be carried out to investigate the overall
structural behaviour under fire conditions.
4. Combining the effects of shear buckling and bottom-flange buckling
64
4.2. DEVELOPMENT OF ANALYTICAL MODEL
The proposed analytical model uses a short cantilever to represent the beam-end
buckling zone; the length of this cantilever is considered as equal to the beam depth d .
By applying different combinations of moment and shear force at its free end, this
model can represent the bucking panel at the end of a beam of any length, and with
arbitrary loading and boundary conditions. The corresponding shear force F and
bending moment M at the end of the buckling element can be transferred from the
adjacent part of the beam. No horizontal restraint is applied to the buckling panel ends.
In order words, the analytical model does not consider the axial force caused by
restraint to thermal expansion. This model aims to deal with the post-buckling phase
when the full yield line mechanism has developed under certain loading conditions
and temperatures. If these loading conditions cannot be fulfilled (for example when,
for a simple beam, the bending moment is not large enough to trigger bottom-flange
buckling), the proposed buckling element will remain a part of a normal beam. The
complete force-deflection relationship of the buckling element includes three stages:
non-linear pre-buckling, plateau and post-buckling. If the material properties (Figure
4-2) for steel at temperatures higher than 400°C are used, the vertical force-deflection
relationship of the buckling element without considering the axial force can be
illustrated schematically as in Figure 4-3.
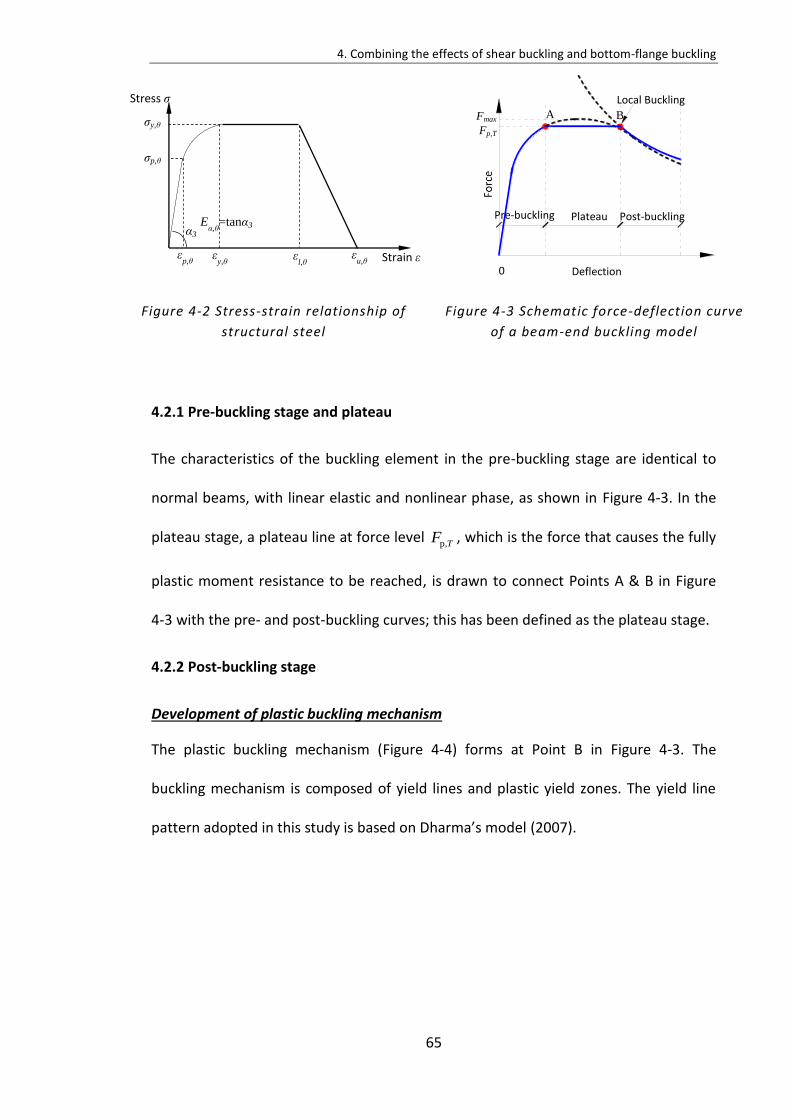
4. Combining the effects of shear buckling and bottom-flange buckling
65
Figure 4-2 Stress-strain relationship of
structural steel
Figure 4-3 Schematic force-deflection curve
of a beam-end buckling model
4.2.1 Pre-buckling stage and plateau
The characteristics of the buckling element in the pre-buckling stage are identical to
normal beams, with linear elastic and nonlinear phase, as shown in Figure 4-3. In the
plateau stage, a plateau line at force level p,TF , which is the force that causes the fully
plastic moment resistance to be reached, is drawn to connect Points A & B in Figure
4-3 with the pre- and post-buckling curves; this has been defined as the plateau stage.
4.2.2 Post-buckling stage
Development of plastic buckling mechanism
The plastic buckling mechanism (Figure 4-4) forms at Point B in Figure 4-3. The
buckling mechanism is composed of yield lines and plastic yield zones. The yield line
pattern adopted in this study is based on Dharma’s model (2007).
Stress σ
Strain ε
σy,θ
σp,θ
α3 Eα,θ
=tanα3
εp,θ
εy,θ
εl,θ
εu,θ
Stress σ
Strain ε
σy,θ
σp,θ
α3 Eα,θ
=tanα3
εp,θ
εy,θ
εl,θ
εu,θ
Local Buckling
Pre-buckling Plateau Post-buckling
0 Deflection
A B
Fp,T
Fmax
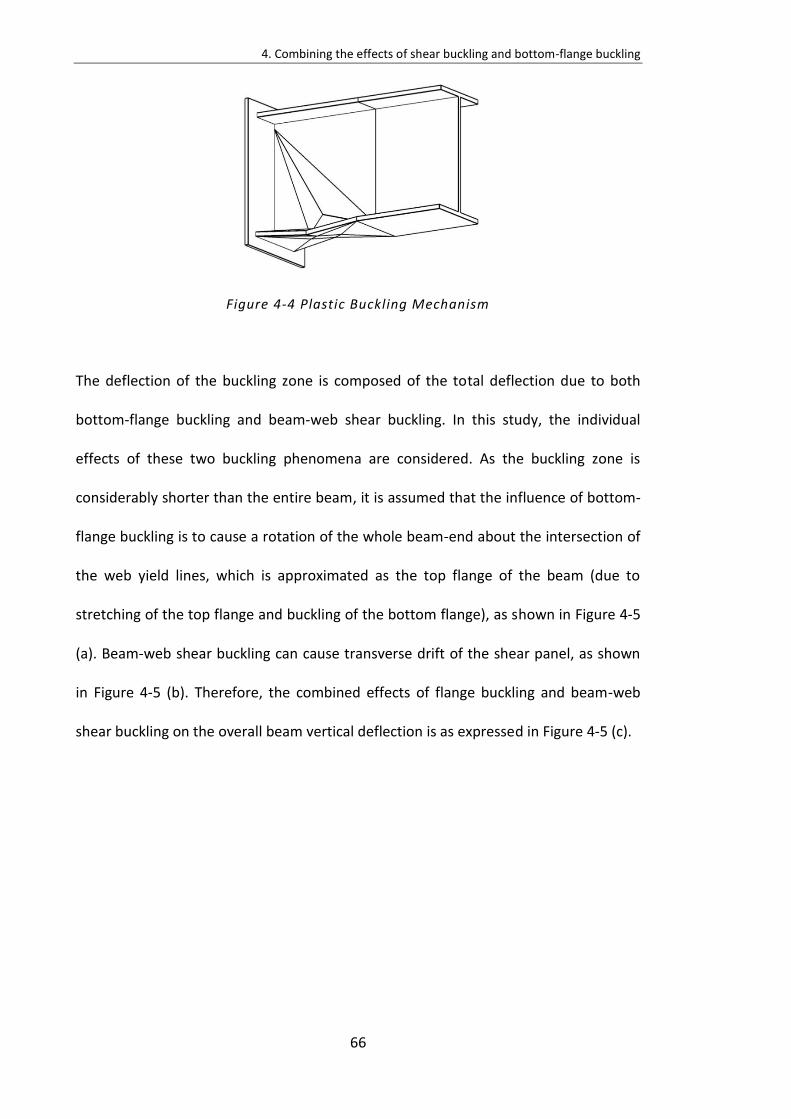
4. Combining the effects of shear buckling and bottom-flange buckling
66
Figure 4-4 Plastic Buckling Mechanism
The deflection of the buckling zone is composed of the total deflection due to both
bottom-flange buckling and beam-web shear buckling. In this study, the individual
effects of these two buckling phenomena are considered. As the buckling zone is
considerably shorter than the entire beam, it is assumed that the influence of bottom-
flange buckling is to cause a rotation of the whole beam-end about the intersection of
the web yield lines, which is approximated as the top flange of the beam (due to
stretching of the top flange and buckling of the bottom flange), as shown in Figure 4-5
(a). Beam-web shear buckling can cause transverse drift of the shear panel, as shown
in Figure 4-5 (b). Therefore, the combined effects of flange buckling and beam-web
shear buckling on the overall beam vertical deflection is as expressed in Figure 4-5 (c).
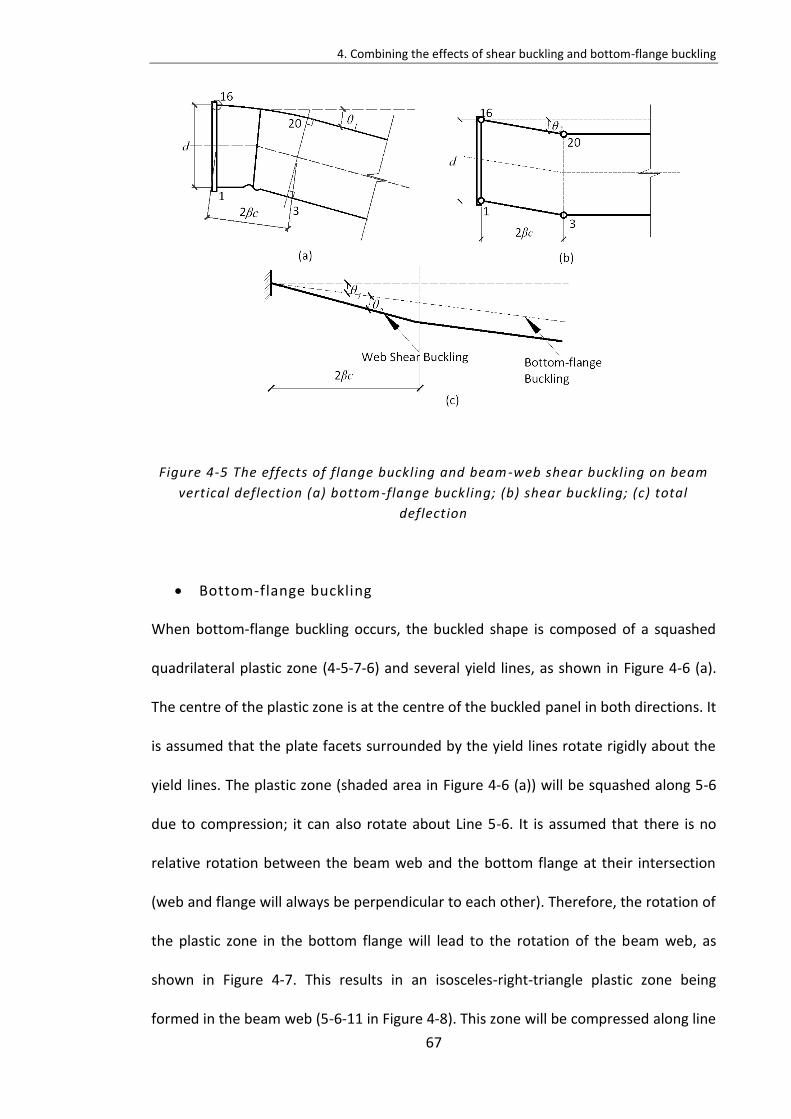
4. Combining the effects of shear buckling and bottom-flange buckling
67
Figure 4-5 The effects of flange buckling and beam -web shear buckling on beam
vertical deflection (a) bottom-flange buckling; (b) shear buckling; (c) total
deflection
Bottom-flange buckling
When bottom-flange buckling occurs, the buckled shape is composed of a squashed
quadrilateral plastic zone (4-5-7-6) and several yield lines, as shown in Figure 4-6 (a).
The centre of the plastic zone is at the centre of the buckled panel in both directions. It
is assumed that the plate facets surrounded by the yield lines rotate rigidly about the
yield lines. The plastic zone (shaded area in Figure 4-6 (a)) will be squashed along 5-6
due to compression; it can also rotate about Line 5-6. It is assumed that there is no
relative rotation between the beam web and the bottom flange at their intersection
(web and flange will always be perpendicular to each other). Therefore, the rotation of
the plastic zone in the bottom flange will lead to the rotation of the beam web, as
shown in Figure 4-7. This results in an isosceles-right-triangle plastic zone being
formed in the beam web (5-6-11 in Figure 4-8). This zone will be compressed along line
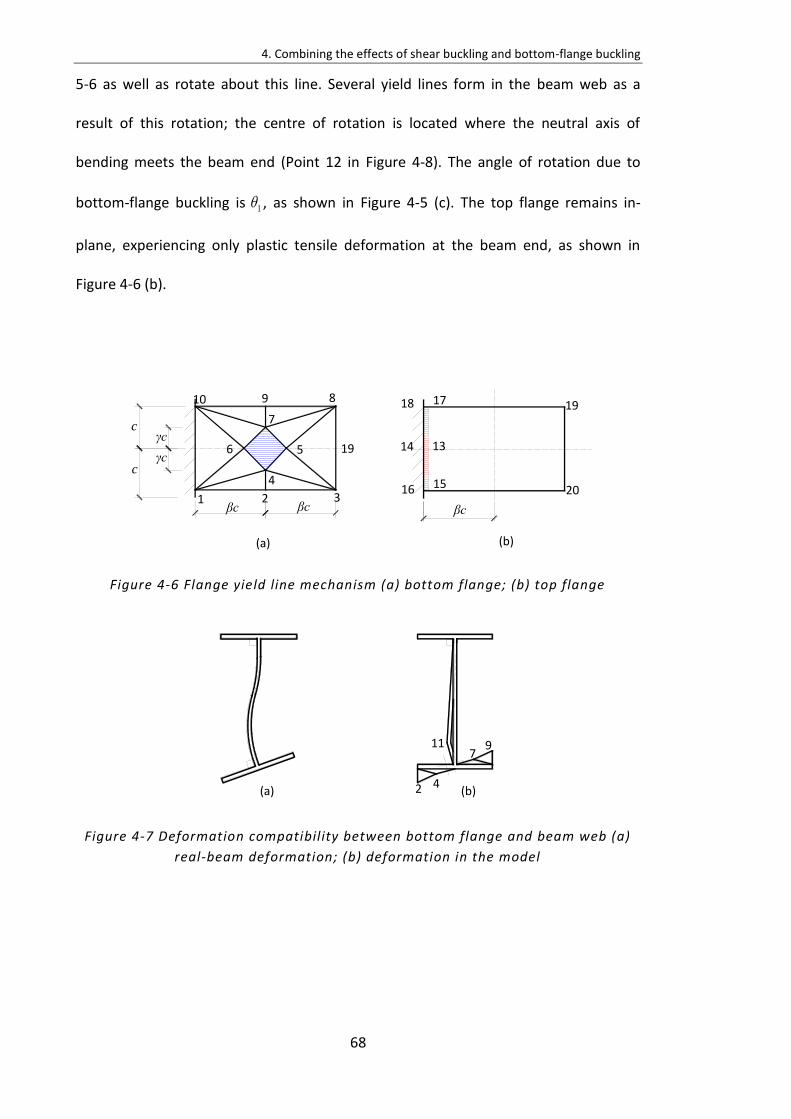
4. Combining the effects of shear buckling and bottom-flange buckling
68
5-6 as well as rotate about this line. Several yield lines form in the beam web as a
result of this rotation; the centre of rotation is located where the neutral axis of
bending meets the beam end (Point 12 in Figure 4-8). The angle of rotation due to
bottom-flange buckling is 1 , as shown in Figure 4-5 (c). The top flange remains in-
plane, experiencing only plastic tensile deformation at the beam end, as shown in
Figure 4-6 (b).
Figure 4-6 Flange yield line mechanism (a) bottom flange; (b) top flange
Figure 4-7 Deformation compatibility between bottom flange and beam web (a)
real-beam deformation; (b) deformation in the model
(a) (b)
βc βc 2
8 9 10
7
6 5
4
βc
γc
γc c
c
1 3 15 16
13 14
17 18
20
19
19
(a) (b)
11
4 2
7 9
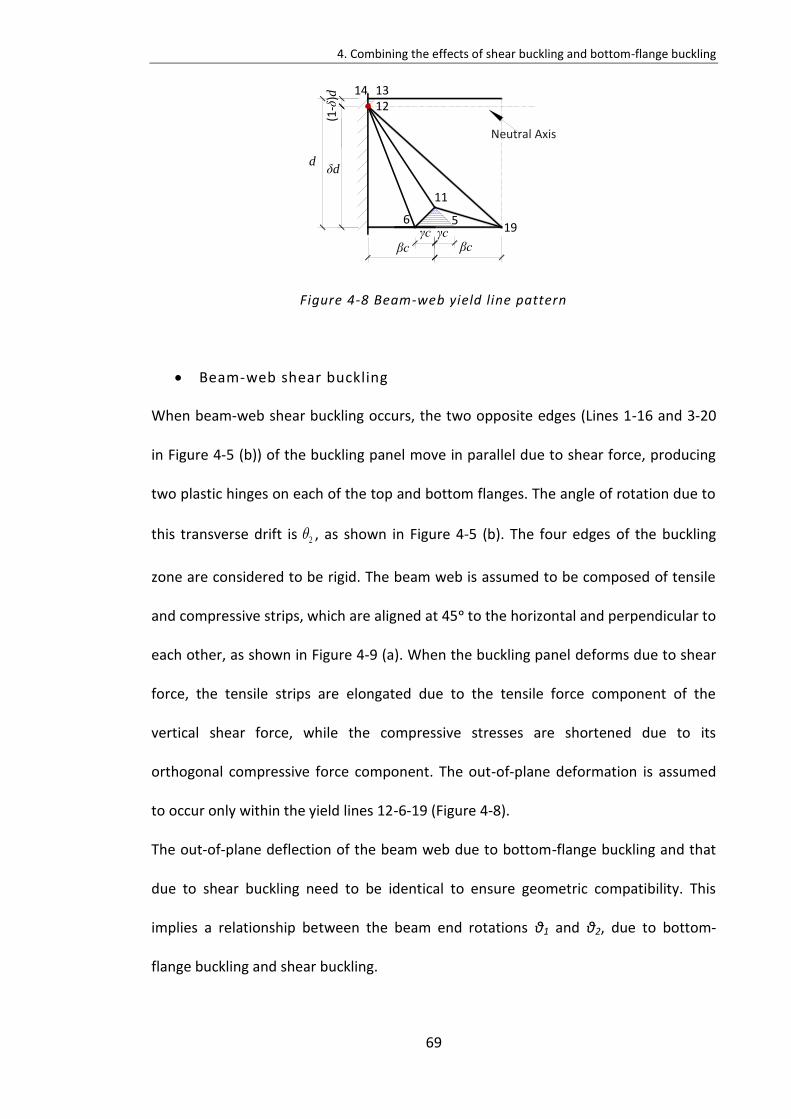
4. Combining the effects of shear buckling and bottom-flange buckling
69
Figure 4-8 Beam-web yield line pattern
Beam-web shear buckling
When beam-web shear buckling occurs, the two opposite edges (Lines 1-16 and 3-20
in Figure 4-5 (b)) of the buckling panel move in parallel due to shear force, producing
two plastic hinges on each of the top and bottom flanges. The angle of rotation due to
this transverse drift is 2 , as shown in Figure 4-5 (b). The four edges of the buckling
zone are considered to be rigid. The beam web is assumed to be composed of tensile
and compressive strips, which are aligned at 45ᵒ to the horizontal and perpendicular to
each other, as shown in Figure 4-9 (a). When the buckling panel deforms due to shear
force, the tensile strips are elongated due to the tensile force component of the
vertical shear force, while the compressive stresses are shortened due to its
orthogonal compressive force component. The out-of-plane deformation is assumed
to occur only within the yield lines 12-6-19 (Figure 4-8).
The out-of-plane deflection of the beam web due to bottom-flange buckling and that
due to shear buckling need to be identical to ensure geometric compatibility. This
implies a relationship between the beam end rotations θ1 and θ2, due to bottom-
flange buckling and shear buckling.
βc βc
6 5
11
12 14 13
γc γc
d δd
d
(1-δ
)d
Neutral Axis
19
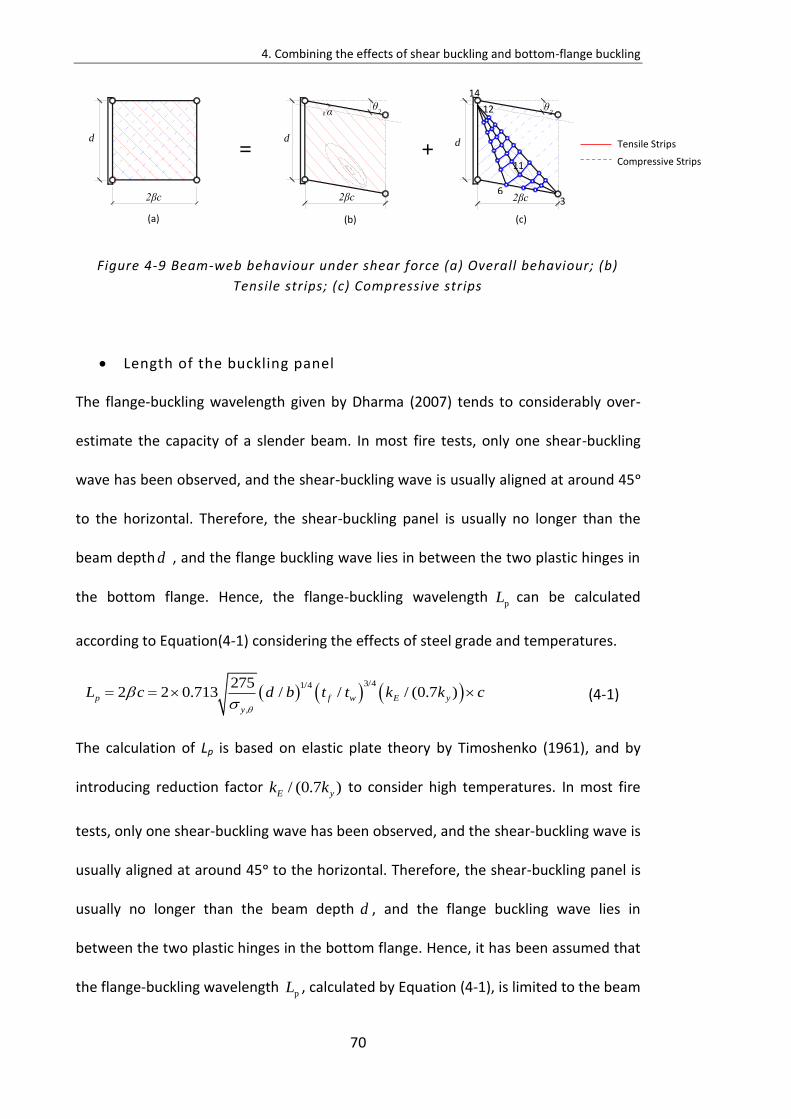
4. Combining the effects of shear buckling and bottom-flange buckling
70
Figure 4-9 Beam-web behaviour under shear force (a) Overall behaviour; (b)
Tensile strips; (c) Compressive strips
Length of the buckling panel
The flange-buckling wavelength given by Dharma (2007) tends to considerably over-
estimate the capacity of a slender beam. In most fire tests, only one shear-buckling
wave has been observed, and the shear-buckling wave is usually aligned at around 45ᵒ
to the horizontal. Therefore, the shear-buckling panel is usually no longer than the
beam depth d , and the flange buckling wave lies in between the two plastic hinges in
the bottom flange. Hence, the flange-buckling wavelength pL can be calculated
according to Equation(4-1) considering the effects of steel grade and temperatures.
3/41/4
,
2752 2 0.713 / / / (0.7 )p f w E y
y
L c d b t t k k c
(4-1)
The calculation of Lp is based on elastic plate theory by Timoshenko (1961), and by
introducing reduction factor / (0.7 )E yk k to consider high temperatures. In most fire
tests, only one shear-buckling wave has been observed, and the shear-buckling wave is
usually aligned at around 45ᵒ to the horizontal. Therefore, the shear-buckling panel is
usually no longer than the beam depth d , and the flange buckling wave lies in
between the two plastic hinges in the bottom flange. Hence, it has been assumed that
the flange-buckling wavelength pL , calculated by Equation (4-1), is limited to the beam
(a) (c) (b)
d
βc
θ2 θ
2
βc
d d
βc
= +
6
11
14
3
12 α
Tensile Strips
Compressive Strips
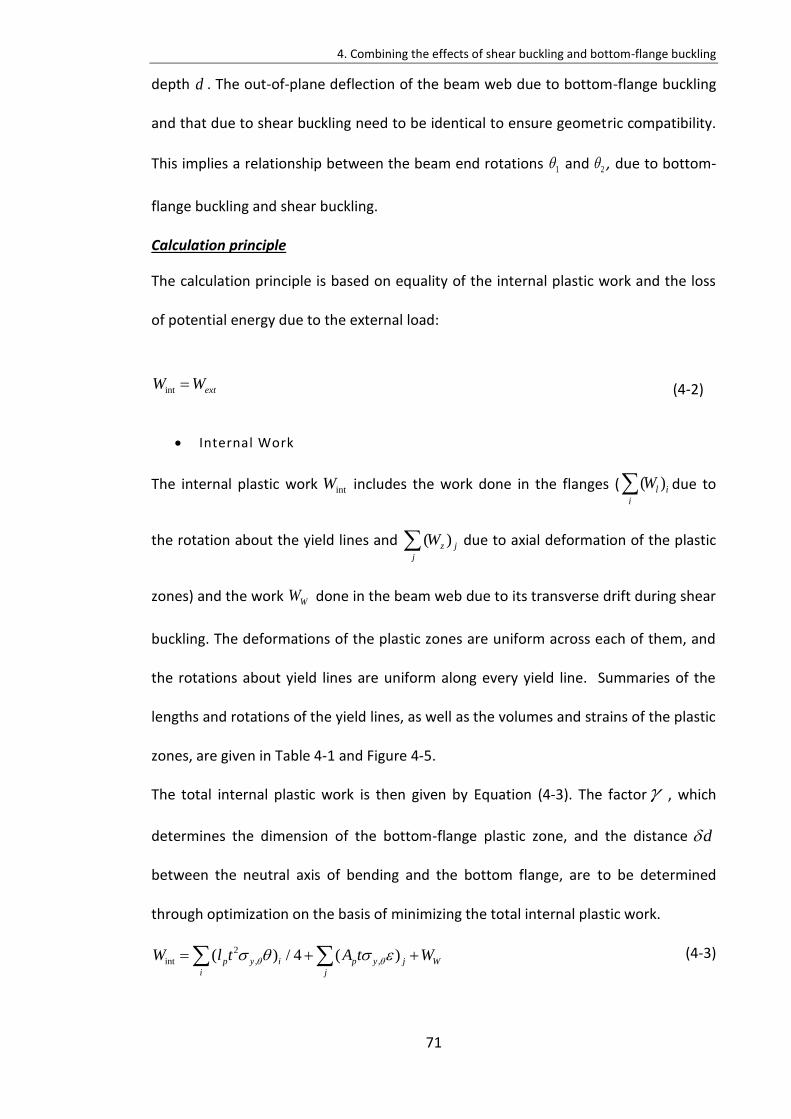
4. Combining the effects of shear buckling and bottom-flange buckling
71
depth d . The out-of-plane deflection of the beam web due to bottom-flange buckling
and that due to shear buckling need to be identical to ensure geometric compatibility.
This implies a relationship between the beam end rotations 1 and 2 , due to bottom-
flange buckling and shear buckling.
Calculation principle
The calculation principle is based on equality of the internal plastic work and the loss
of potential energy due to the external load:
int extW W (4-2)
Internal Work
The internal plastic work intW includes the work done in the flanges ( ( )l i
i
W due to
the rotation about the yield lines and ( )z j
j
W due to axial deformation of the plastic
zones) and the work WW done in the beam web due to its transverse drift during shear
buckling. The deformations of the plastic zones are uniform across each of them, and
the rotations about yield lines are uniform along every yield line. Summaries of the
lengths and rotations of the yield lines, as well as the volumes and strains of the plastic
zones, are given in Table 4-1 and Figure 4-5.
The total internal plastic work is then given by Equation (4-3). The factor , which
determines the dimension of the bottom-flange plastic zone, and the distance d
between the neutral axis of bending and the bottom flange, are to be determined
through optimization on the basis of minimizing the total internal plastic work.
2
int , ,( ) / 4 ( )p y i p y j W
i j
W l t A t W (4-3)
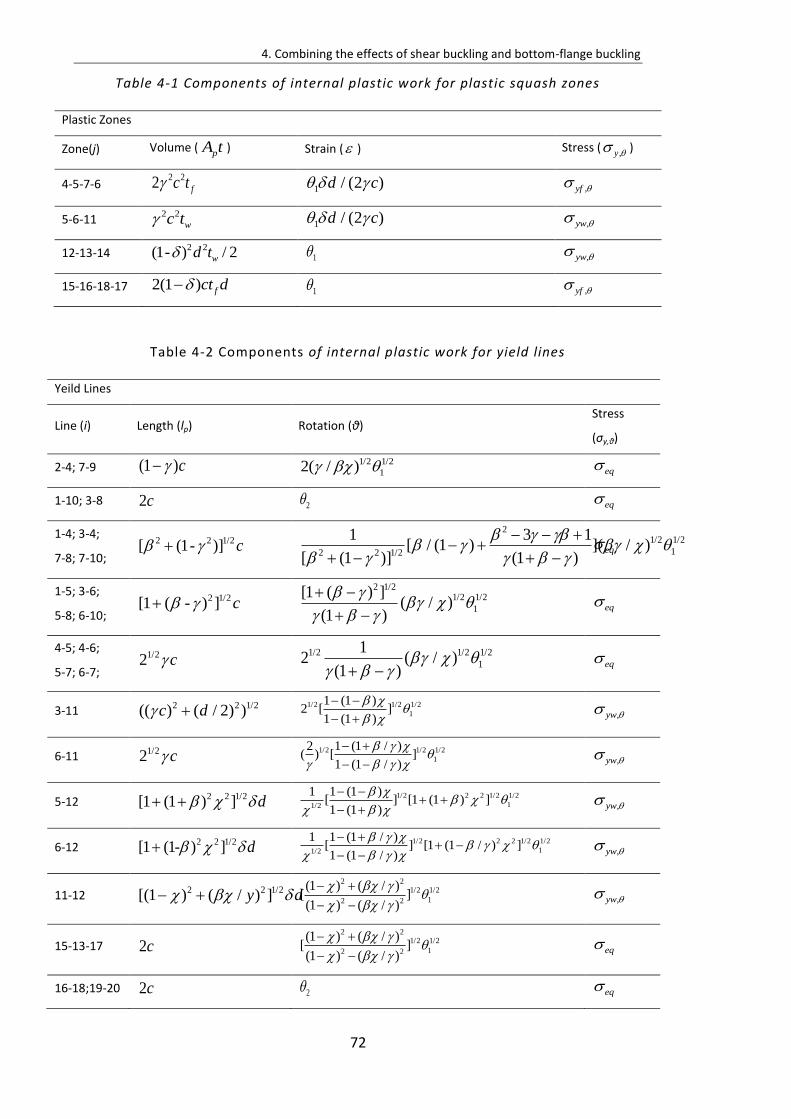
4. Combining the effects of shear buckling and bottom-flange buckling
72
Table 4-1 Components of internal plastic work for plastic squash zones
Plastic Zones
Zone(j) Volume (pA t ) Strain ( ) Stress (
,y )
4-5-7-6 2 22 fc t 1 / (2 )d c ,yf
5-6-11 2 2
wc t 1 / (2 )d c ,yw
12-13-14 2 2(1- ) / 2wd t 1 ,yw
15-16-18-17 2(1 ) fct d 1 ,yf
Table 4-2 Components of internal plastic work for yield lines
Yeild Lines
Line (i) Length (lp) Rotation (θ) Stress
(σy,θ)
2-4; 7-9 (1 )c 1/2 1/2
12( / ) eq
1-10; 3-8 2c 2 eq
1-4; 3-4;
7-8; 7-10;
2 2 1/2[ (1- )] c
21/2 1/2
12 2 1/2
1 3 1[ / (1 ) ]( / )
[ (1 )] (1 )
eq
1-5; 3-6;
5-8; 6-10;
2 1/2[1 ( - ) ] c
2 1/21/2 1/2
1
[1 ( ) ]( / )
(1 )
eq
4-5; 4-6;
5-7; 6-7;
1/22 c 1/2 1/2 1/2
1
12 ( / )
(1 )
eq
3-11 2 2 1/2(( ) ( / 2) )c d ,yw
6-11 1/22 c ,yw
5-12 2 2 1/2[1 (1 ) ] d ,yw
6-12 2 2 1/2[1 (1- ) ] d ,yw
11-12 2 2 1/2[(1 ) ( / ) ]y d ,yw
15-13-17 2c eq
16-18;19-20 2c 2 eq
1/2 1/2 1/2
1
1 (1 )2 [ ]
1 (1 )
1/2 1/2 1/2
1
2 1 (1 / )( ) [ ]
1 (1 / )
1/2 2 2 1/2 1/2
11/2
1 1 (1 )[ ] [1 (1 ) ]1 (1 )
1/2 2 2 1/2 1/2
11/2
1 1 (1 / )[ ] [1 (1 / ) ]1 (1 / )
2 21/2 1/2
12 2
(1 ) ( / )[ ](1 ) ( / )
2 21/2 1/2
12 2
(1 ) ( / )[ ](1 ) ( / )
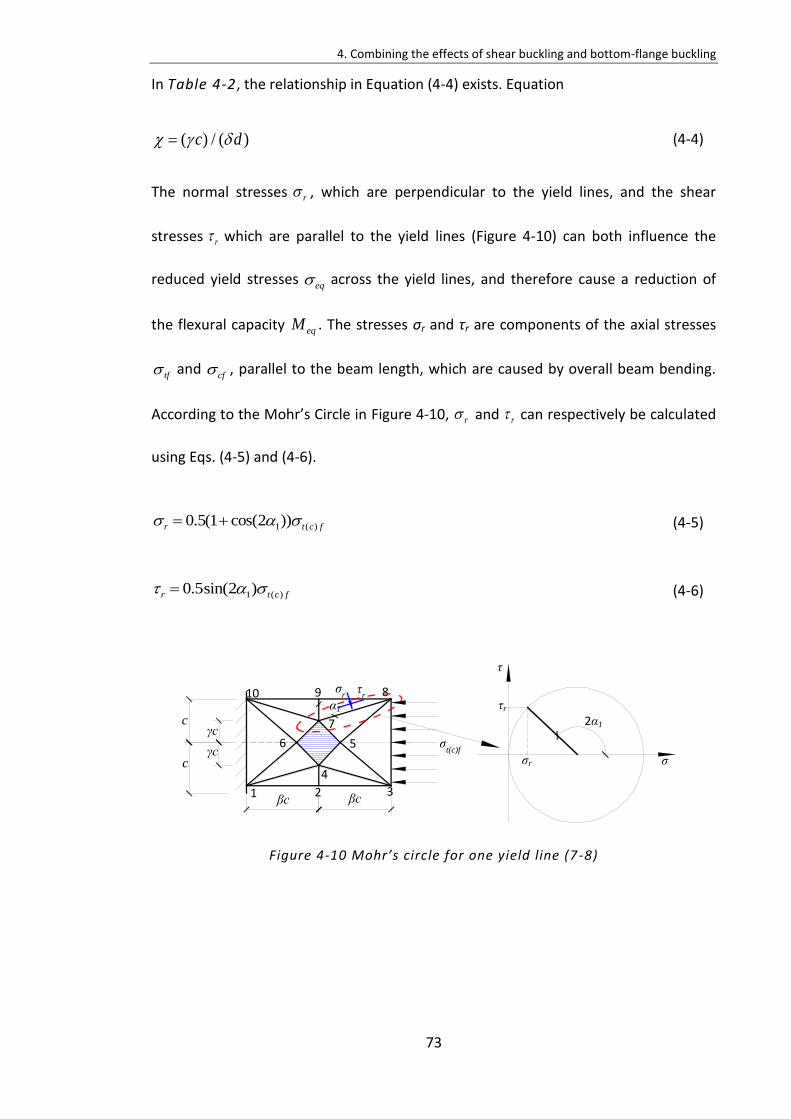
4. Combining the effects of shear buckling and bottom-flange buckling
73
In Table 4-2, the relationship in Equation (4-4) exists. Equation
(4-4)
The normal stresses r , which are perpendicular to the yield lines, and the shear
stresses r which are parallel to the yield lines (Figure 4-10) can both influence the
reduced yield stresses eq across the yield lines, and therefore cause a reduction of
the flexural capacity eqM . The stresses σr and τr are components of the axial stresses
tf and cf , parallel to the beam length, which are caused by overall beam bending.
According to the Mohr’s Circle in Figure 4-10, r and r can respectively be calculated
using Eqs. (4-5) and (4-6).
1 ( )0.5(1 cos(2 ))r t c f (4-5)
1 ( )0.5sin(2 )r t c f (4-6)
Figure 4-10 Mohr’s circle for one yield line (7 -8)
( ) / ( )c d
α1
τ
σ σr
τr 2α1
2
8 9 10
7
6 5
4
βc βc
γc
γc c
c
1 3
τr σ
r
σt(c)f

4. Combining the effects of shear buckling and bottom-flange buckling
74
in which 1 is the acute angle between the yield line and the vertical axis. The yield
stress 1eq of the yield lines, considering only the effect of r , is given as Equation
(4-7).
2
1 , ( ) ,
2
, 1 ( ) ,
[1 ( / ) ]
[1 ((0.5(1 cos(2 )) / ) ]
eq yf t c f yf
yf t c f yf
(4-7)
The relationship between the shear stress r and the reduced equivalent yield stress
eq can be expressed as Equation (4-8).
2 2
1 1( / ) ( / ) 1eq eq r eq (4-8)
where 1 1 / 3eq eq .
Substituting Equation (4-7) into Equation(4-8) gives
2 2 1/2
, 1 ( ) , 1[1 (0.5(1 cos(2 )) / ) ][1 (0.5sin(2 ) / 3) ]eq yf t c f yf (4-9)
It has previously been ascertained in Chapter 3 that the internal work of the deformed
beam web due to shear buckling is given by:
2 2 2( sin cos( ) sin( )cos ) / cosW T C t c vsW W W td td (4-10)
where is the angle between the tensile strips and the upper edge of the shear-
buckling panel, as shown in Figure 4-10 (b). vs is the vertical displacement of the
shear-panel edge, which is equal to 22 c . According to the Huber-von Mises
plasticity criterion (von Mises, 1913), the relationship between the tensile and
compressive stresses for a two-dimensional panel is given by
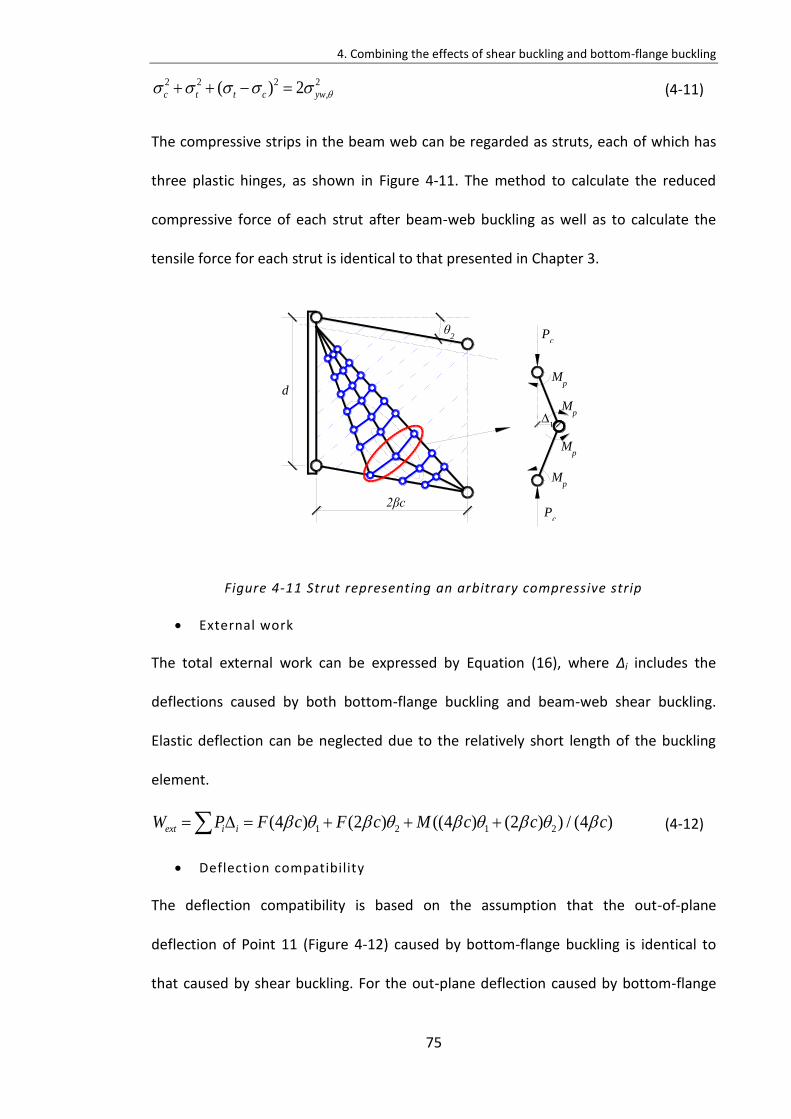
4. Combining the effects of shear buckling and bottom-flange buckling
75
(4-11)
The compressive strips in the beam web can be regarded as struts, each of which has
three plastic hinges, as shown in Figure 4-11. The method to calculate the reduced
compressive force of each strut after beam-web buckling as well as to calculate the
tensile force for each strut is identical to that presented in Chapter 3.
Figure 4-11 Strut representing an arbitrary compressive strip
External work
The total external work can be expressed by Equation (16), where ∆i includes the
deflections caused by both bottom-flange buckling and beam-web shear buckling.
Elastic deflection can be neglected due to the relatively short length of the buckling
element.
(4-12)
Deflection compatibility
The deflection compatibility is based on the assumption that the out-of-plane
deflection of Point 11 (Figure 4-12) caused by bottom-flange buckling is identical to
that caused by shear buckling. For the out-plane deflection caused by bottom-flange
2 2 2 2
,( ) 2c t t c yw
Pc
Pc
Mp
Mp
Mp
Mp
βc
1
θ2
d
1 2 1 2(4 ) (2 ) ((4 ) (2 ) ) / (4 )ext i iW P F c F c M c c c
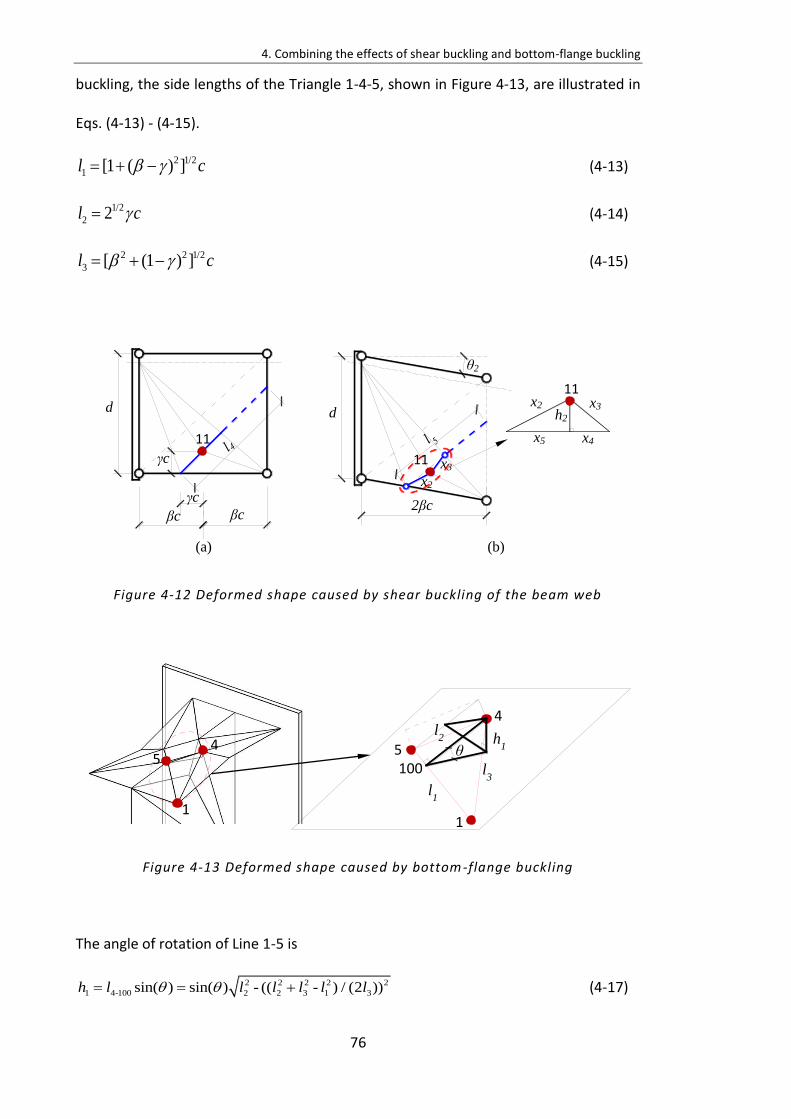
4. Combining the effects of shear buckling and bottom-flange buckling
76
buckling, the side lengths of the Triangle 1-4-5, shown in Figure 4-13, are illustrated in
Eqs. (4-13) - (4-15).
(4-13)
(4-14)
(4-15)
Figure 4-12 Deformed shape caused by shear buckling of the beam web
Figure 4-13 Deformed shape caused by bottom -flange buckling
The angle of rotation of Line 1-5 is
2 2 2 2 2
1 4-100 2 2 3 1 3sin( ) sin( ) - (( - ) / (2 ))h l l l l l l (4-17)
2 1/2
1 [1 ( ) ]l c
1/2
2 2l c
2 2 1/2
3 [ (1 ) ]l c
(a) (b)
d
2βc
θ2
d
βc βc
γc
γc
x2
x3
x2 x3
x4 x5
h2
11
11
11
h1
l2
l1
l3
5
1
4
5
1
4 θ 100
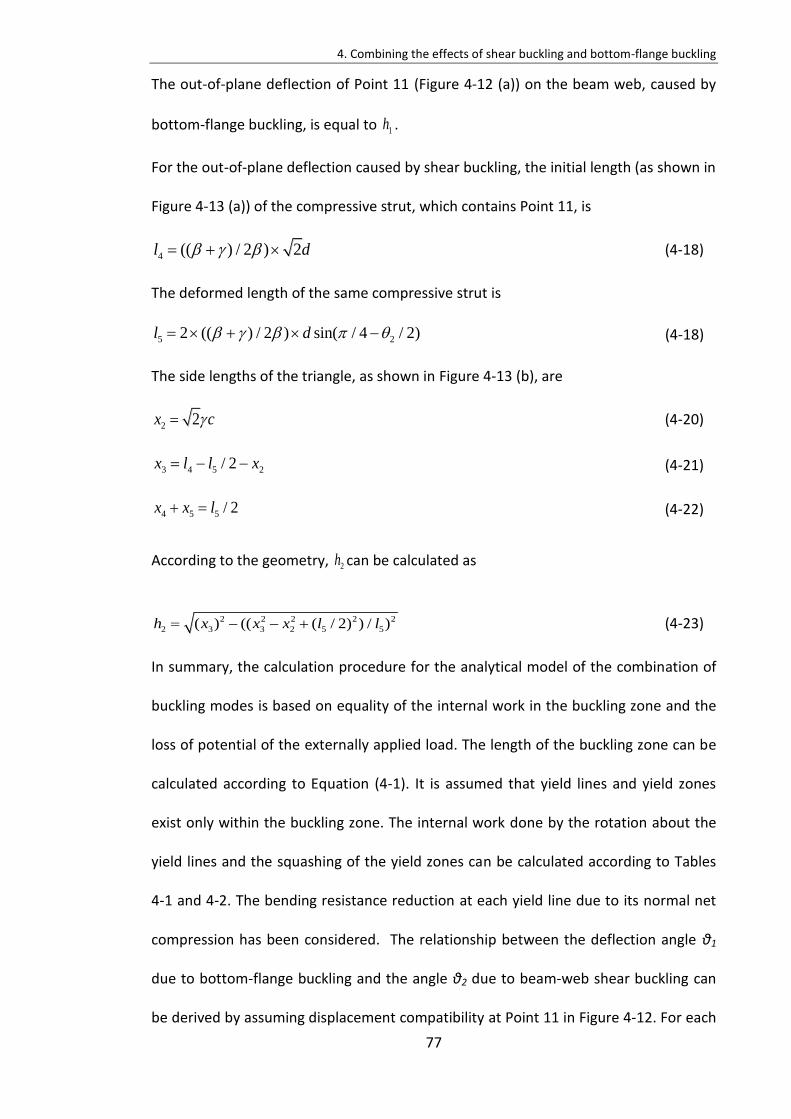
4. Combining the effects of shear buckling and bottom-flange buckling
77
The out-of-plane deflection of Point 11 (Figure 4-12 (a)) on the beam web, caused by
bottom-flange buckling, is equal to 1h .
For the out-of-plane deflection caused by shear buckling, the initial length (as shown in
Figure 4-13 (a)) of the compressive strut, which contains Point 11, is
4 (( ) / 2 ) 2l d (4-18)
The deformed length of the same compressive strut is
5 22 (( ) / 2 ) sin( / 4 / 2)l d (4-18)
The side lengths of the triangle, as shown in Figure 4-13 (b), are
(4-20)
3 4 5 2/ 2x l l x (4-21)
4 5 5 / 2x x l (4-22)
According to the geometry, 2h can be calculated as
2 2 2 2 2
2 3 3 2 5 5( ) (( ( / 2) ) / )h x x x l l (4-23)
In summary, the calculation procedure for the analytical model of the combination of
buckling modes is based on equality of the internal work in the buckling zone and the
loss of potential of the externally applied load. The length of the buckling zone can be
calculated according to Equation (4-1). It is assumed that yield lines and yield zones
exist only within the buckling zone. The internal work done by the rotation about the
yield lines and the squashing of the yield zones can be calculated according to Tables
4-1 and 4-2. The bending resistance reduction at each yield line due to its normal net
compression has been considered. The relationship between the deflection angle θ1
due to bottom-flange buckling and the angle θ2 due to beam-web shear buckling can
be derived by assuming displacement compatibility at Point 11 in Figure 4-12. For each
2 2x c
4. Combining the effects of shear buckling and bottom-flange buckling
78
given θ1, the corresponding θ2 can be calculated. Therefore, the overall deflection can
be calculated. The applied external load can be calculated according to the given θ1.
Therefore, a force-deflection relationship in the post-buckling stage can be determined.
4.3 VALIDATION AGAINST FINITE ELEMENT MODELLING
4.3.1 Validation of FE model against experimental results
The finite element software ABAQUS has been used to develop the finite element
modelling. In this section, the FE models are validated against the experimental results
published by Dharma (2007a).
Experimental programme
Dharma tested nine steel I-beams up to failure. In this research, four out of the nine I-
beams have been chosen to validate the numerical models. All the nine I-beams in the
tests failed in the combination buckling mode. Four specimens which demonstrated
clear descending force-displacement relationships after the occurrence of local
buckling have been selected to validate the FE model at the post-buckling stage. The
test numbers for the four beam sections are S3-2, S3-3, S4-1 and S4-2. The test setup is
shown in Figure 4-14. There is one stiffener at each end of the beam, as well as one at
mid-span. No axial restraint was applied during the testing, so that no axial force was
caused by thermal expansion. The specimens were heated to constant temperature
before the hydraulic jack applied a static point load at the mid-span.
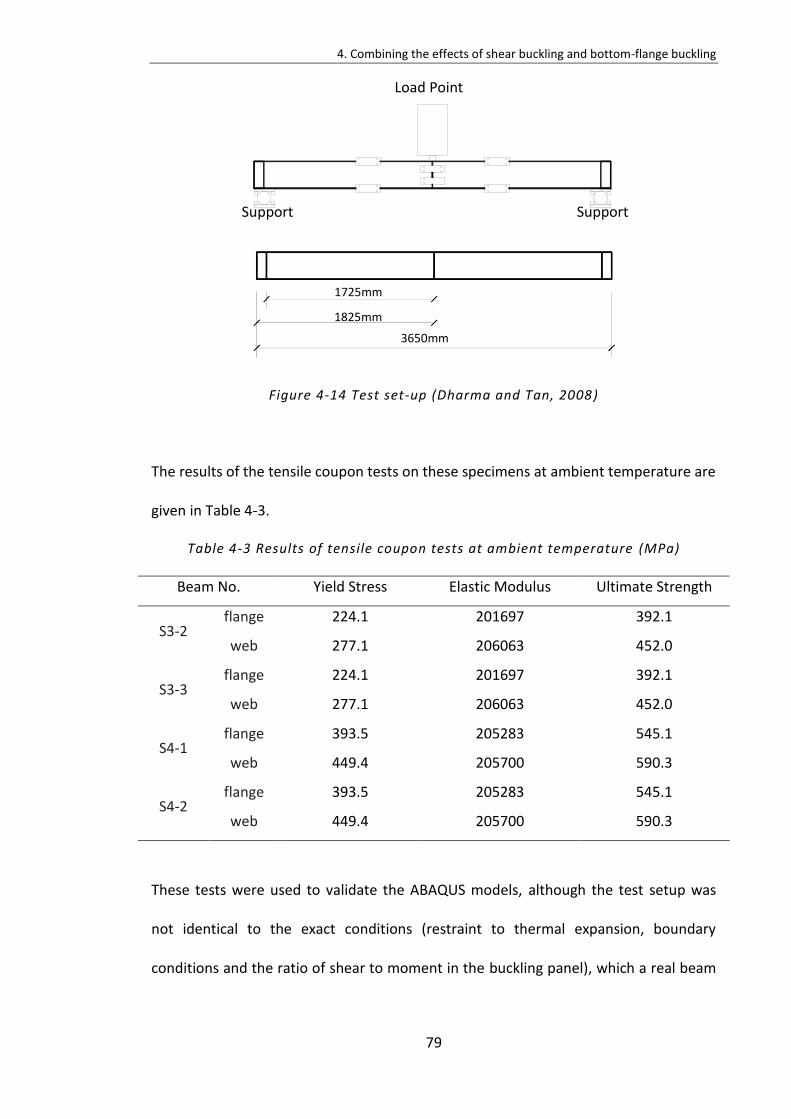
4. Combining the effects of shear buckling and bottom-flange buckling
79
Figure 4-14 Test set-up (Dharma and Tan, 2008)
The results of the tensile coupon tests on these specimens at ambient temperature are
given in Table 4-3.
Table 4-3 Results of tensile coupon tests at ambient temperature (MPa)
Beam No. Yield Stress Elastic Modulus Ultimate Strength
S3-2 flange 224.1 201697 392.1
web 277.1 206063 452.0
S3-3 flange 224.1 201697 392.1
web 277.1 206063 452.0
S4-1 flange 393.5 205283 545.1
web 449.4 205700 590.3
S4-2 flange 393.5 205283 545.1
web 449.4 205700 590.3
These tests were used to validate the ABAQUS models, although the test setup was
not identical to the exact conditions (restraint to thermal expansion, boundary
conditions and the ratio of shear to moment in the buckling panel), which a real beam
3650mm
1725mm
1825mm
Support Support
Load Point
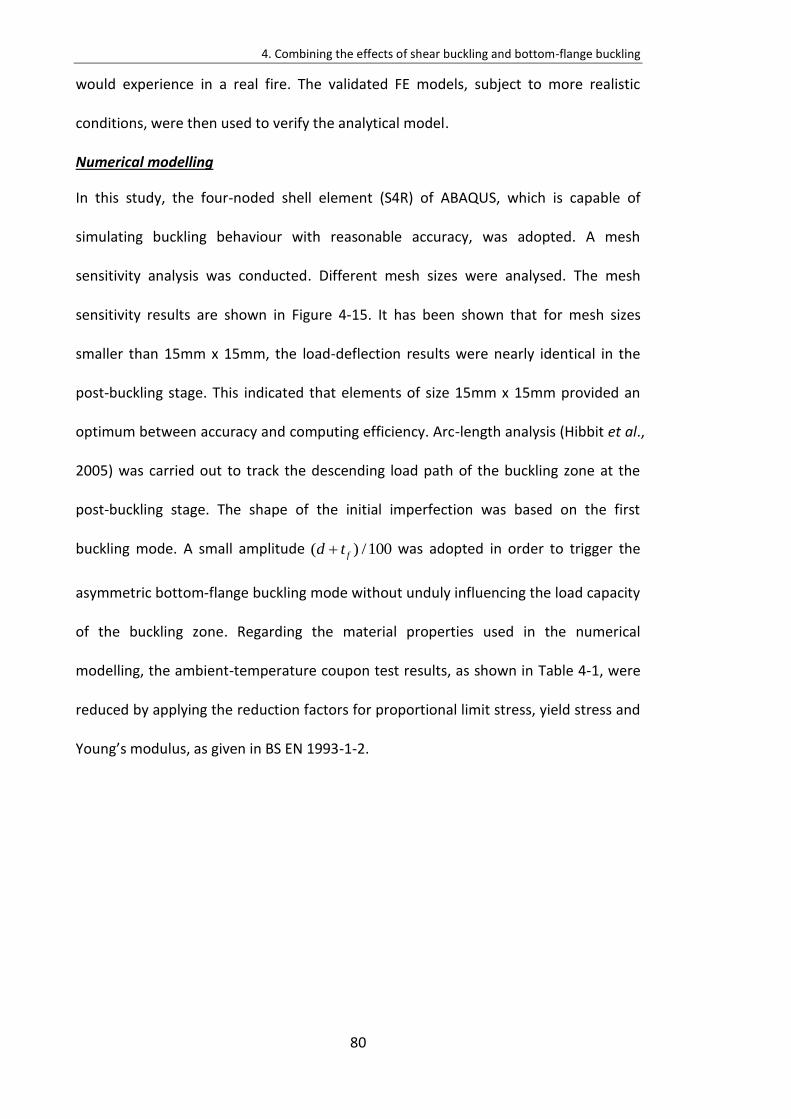
4. Combining the effects of shear buckling and bottom-flange buckling
80
would experience in a real fire. The validated FE models, subject to more realistic
conditions, were then used to verify the analytical model.
Numerical modelling
In this study, the four-noded shell element (S4R) of ABAQUS, which is capable of
simulating buckling behaviour with reasonable accuracy, was adopted. A mesh
sensitivity analysis was conducted. Different mesh sizes were analysed. The mesh
sensitivity results are shown in Figure 4-15. It has been shown that for mesh sizes
smaller than 15mm x 15mm, the load-deflection results were nearly identical in the
post-buckling stage. This indicated that elements of size 15mm x 15mm provided an
optimum between accuracy and computing efficiency. Arc-length analysis (Hibbit et al.,
2005) was carried out to track the descending load path of the buckling zone at the
post-buckling stage. The shape of the initial imperfection was based on the first
buckling mode. A small amplitude ( ) /100fd t was adopted in order to trigger the
asymmetric bottom-flange buckling mode without unduly influencing the load capacity
of the buckling zone. Regarding the material properties used in the numerical
modelling, the ambient-temperature coupon test results, as shown in Table 4-1, were
reduced by applying the reduction factors for proportional limit stress, yield stress and
Young’s modulus, as given in BS EN 1 3-1-2.
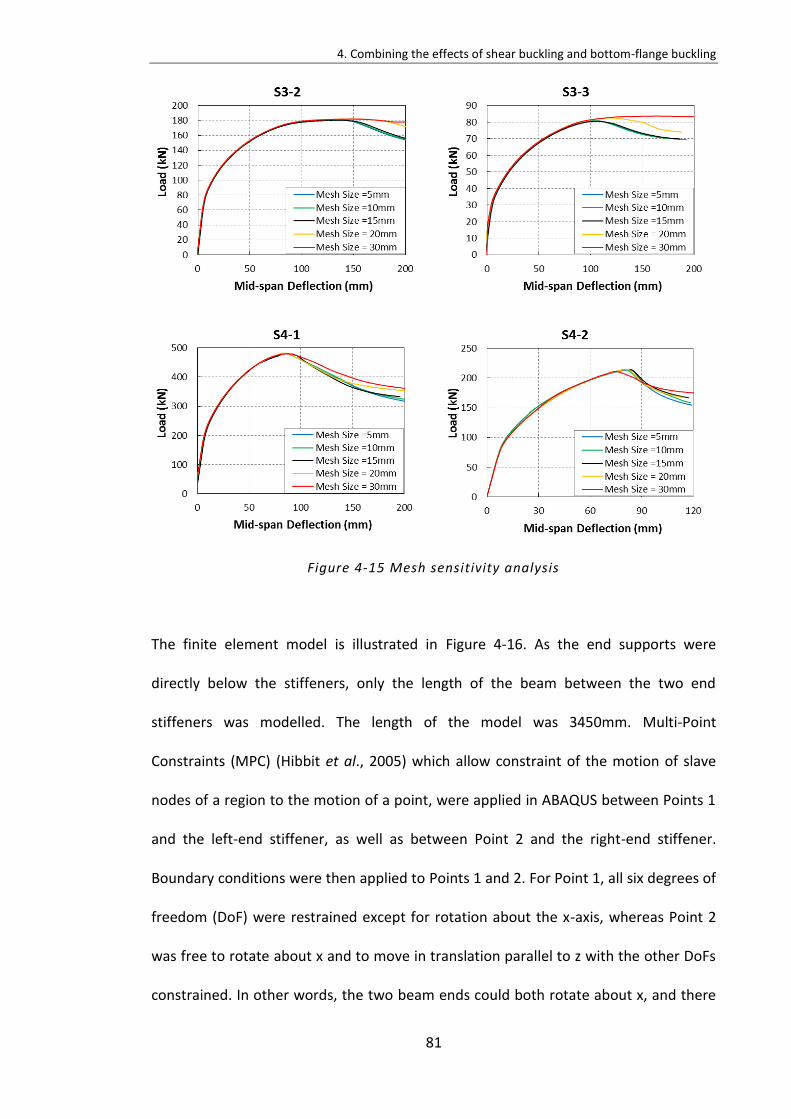
4. Combining the effects of shear buckling and bottom-flange buckling
81
Figure 4-15 Mesh sensitivity analysis
The finite element model is illustrated in Figure 4-16. As the end supports were
directly below the stiffeners, only the length of the beam between the two end
stiffeners was modelled. The length of the model was 3450mm. Multi-Point
Constraints (MPC) (Hibbit et al., 2005) which allow constraint of the motion of slave
nodes of a region to the motion of a point, were applied in ABAQUS between Points 1
and the left-end stiffener, as well as between Point 2 and the right-end stiffener.
Boundary conditions were then applied to Points 1 and 2. For Point 1, all six degrees of
freedom (DoF) were restrained except for rotation about the x-axis, whereas Point 2
was free to rotate about x and to move in translation parallel to z with the other DoFs
constrained. In other words, the two beam ends could both rotate about x, and there
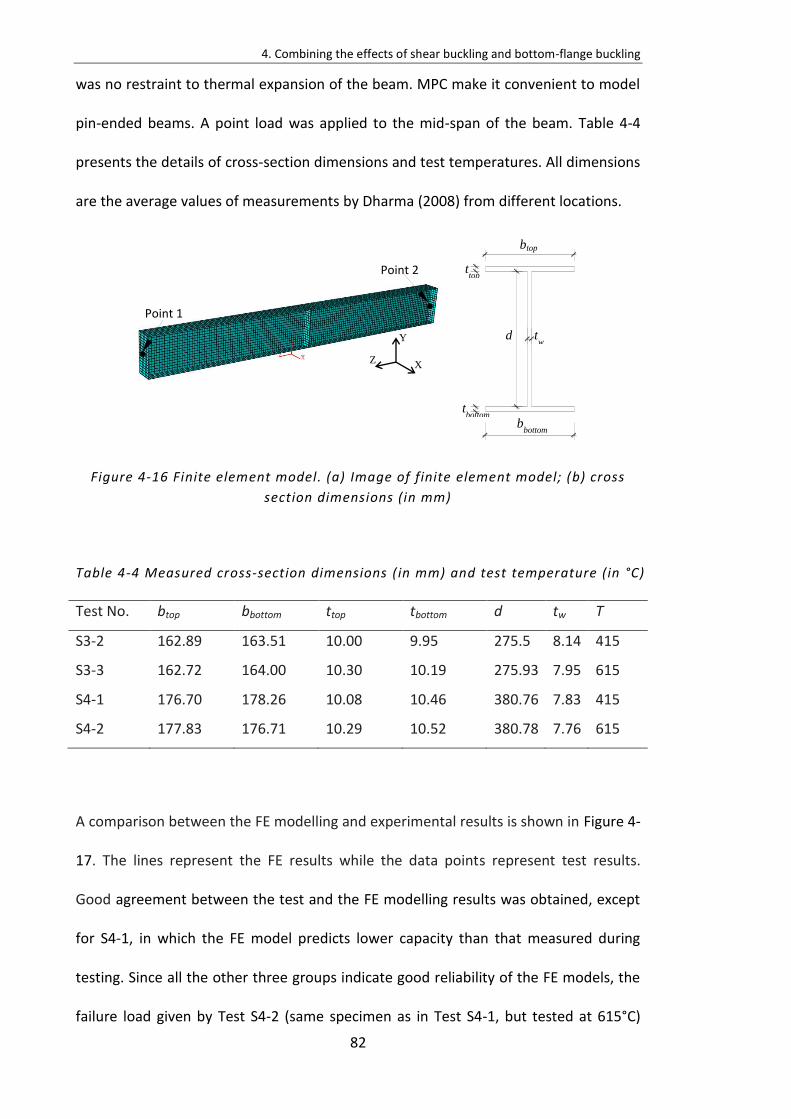
4. Combining the effects of shear buckling and bottom-flange buckling
82
was no restraint to thermal expansion of the beam. MPC make it convenient to model
pin-ended beams. A point load was applied to the mid-span of the beam. Table 4-4
presents the details of cross-section dimensions and test temperatures. All dimensions
are the average values of measurements by Dharma (2008) from different locations.
Figure 4-16 Finite element model. (a) Image of finite element model; (b) cross
section dimensions (in mm)
Table 4-4 Measured cross-section dimensions (in mm) and test temperature (in °C)
Test No. btop bbottom ttop tbottom d tw T
S3-2 162.89 163.51 10.00 9.95 275.5 8.14 415
S3-3 162.72 164.00 10.30 10.19 275.93 7.95 615
S4-1 176.70 178.26 10.08 10.46 380.76 7.83 415
S4-2 177.83 176.71 10.29 10.52 380.78 7.76 615
A comparison between the FE modelling and experimental results is shown in Figure 4-
17. The lines represent the FE results while the data points represent test results.
Good agreement between the test and the FE modelling results was obtained, except
for S4-1, in which the FE model predicts lower capacity than that measured during
testing. Since all the other three groups indicate good reliability of the FE models, the
failure load given by Test S4-2 (same specimen as in Test S4-1, but tested at 615°C)
bbottom
btop
ttop
tbottom
tw d
Point 1
Point 2
Y
X Z
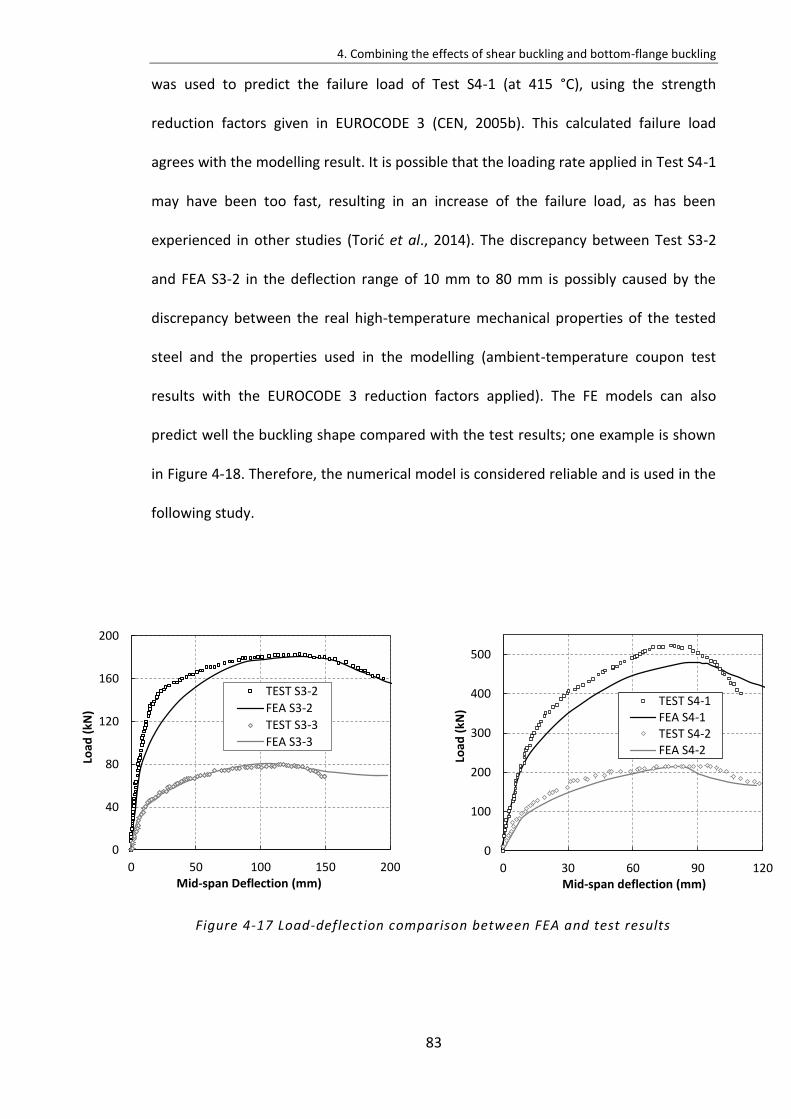
4. Combining the effects of shear buckling and bottom-flange buckling
83
was used to predict the failure load of Test S4-1 (at 415 °C), using the strength
reduction factors given in EUROCODE 3 (CEN, 2005b). This calculated failure load
agrees with the modelling result. It is possible that the loading rate applied in Test S4-1
may have been too fast, resulting in an increase of the failure load, as has been
experienced in other studies (Torić et al., 2014). The discrepancy between Test S3-2
and FEA S3-2 in the deflection range of 10 mm to 80 mm is possibly caused by the
discrepancy between the real high-temperature mechanical properties of the tested
steel and the properties used in the modelling (ambient-temperature coupon test
results with the EUROCODE 3 reduction factors applied). The FE models can also
predict well the buckling shape compared with the test results; one example is shown
in Figure 4-18. Therefore, the numerical model is considered reliable and is used in the
following study.
Figure 4-17 Load-deflection comparison between FEA and test results
0
40
80
120
160
200
0 50 100 150 200
Load
(kN
)
Mid-span Deflection (mm)
TEST S3-2
FEA S3-2
TEST S3-3
FEA S3-3
0
100
200
300
400
500
0 30 60 90 120
Load
(kN
)
Mid-span deflection (mm)
TEST S4-1FEA S4-1TEST S4-2FEA S4-2
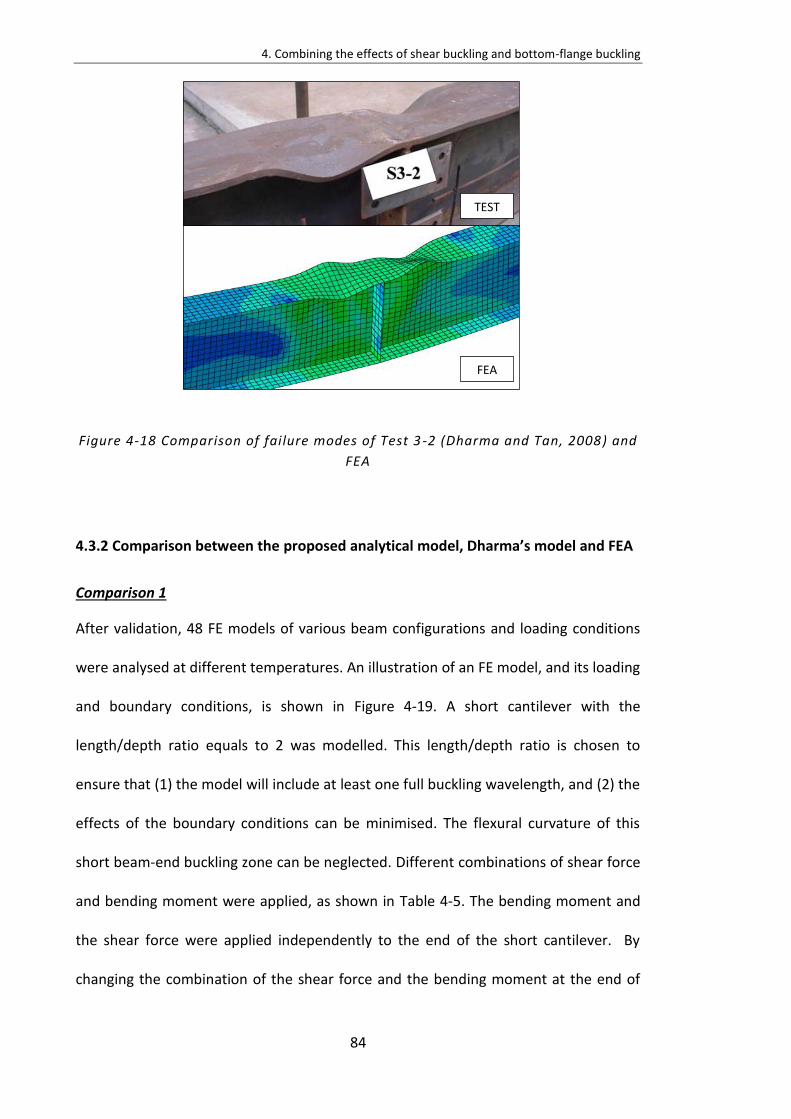
4. Combining the effects of shear buckling and bottom-flange buckling
84
Figure 4-18 Comparison of failure modes of Test 3 -2 (Dharma and Tan, 2008) and
FEA
4.3.2 Comparison between the proposed analytical model, Dharma’s model and FEA
Comparison 1
After validation, 48 FE models of various beam configurations and loading conditions
were analysed at different temperatures. An illustration of an FE model, and its loading
and boundary conditions, is shown in Figure 4-19. A short cantilever with the
length/depth ratio equals to 2 was modelled. This length/depth ratio is chosen to
ensure that (1) the model will include at least one full buckling wavelength, and (2) the
effects of the boundary conditions can be minimised. The flexural curvature of this
short beam-end buckling zone can be neglected. Different combinations of shear force
and bending moment were applied, as shown in Table 4-5. The bending moment and
the shear force were applied independently to the end of the short cantilever. By
changing the combination of the shear force and the bending moment at the end of
TEST
FEA
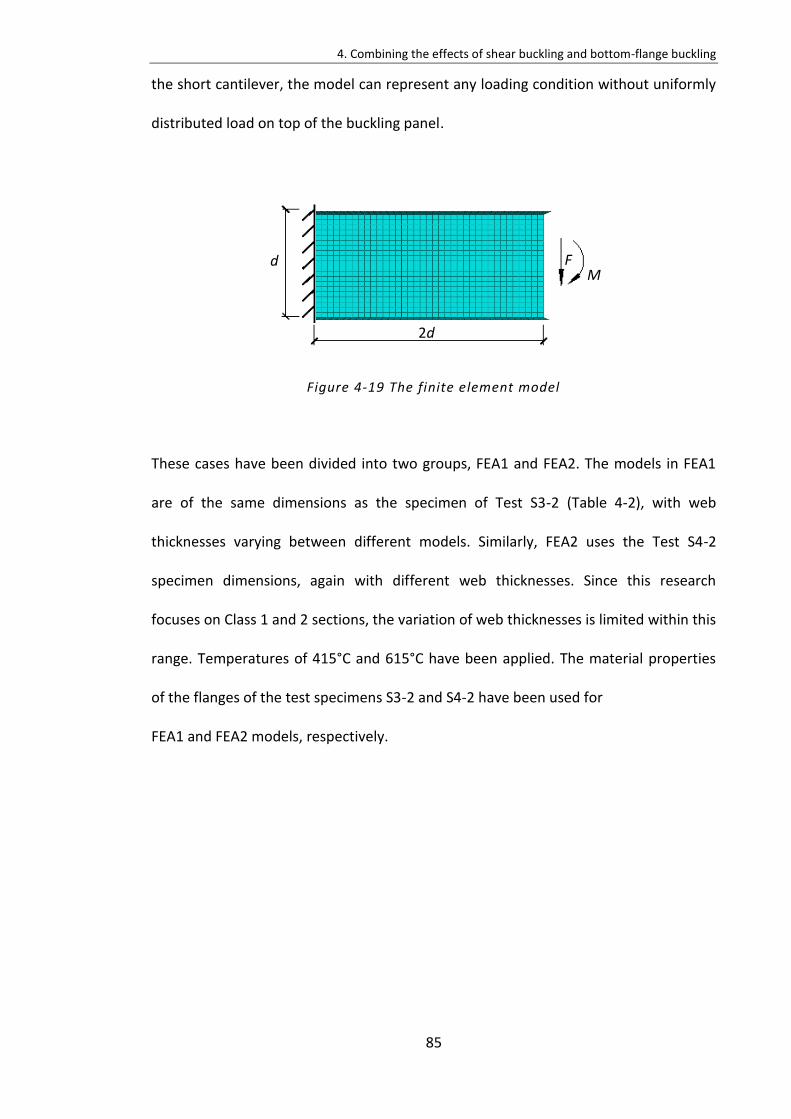
4. Combining the effects of shear buckling and bottom-flange buckling
85
the short cantilever, the model can represent any loading condition without uniformly
distributed load on top of the buckling panel.
Figure 4-19 The finite element model
These cases have been divided into two groups, FEA1 and FEA2. The models in FEA1
are of the same dimensions as the specimen of Test S3-2 (Table 4-2), with web
thicknesses varying between different models. Similarly, FEA2 uses the Test S4-2
specimen dimensions, again with different web thicknesses. Since this research
focuses on Class 1 and 2 sections, the variation of web thicknesses is limited within this
range. Temperatures of 415°C and 615°C have been applied. The material properties
of the flanges of the test specimens S3-2 and S4-2 have been used for
FEA1 and FEA2 models, respectively.
2d
d F M
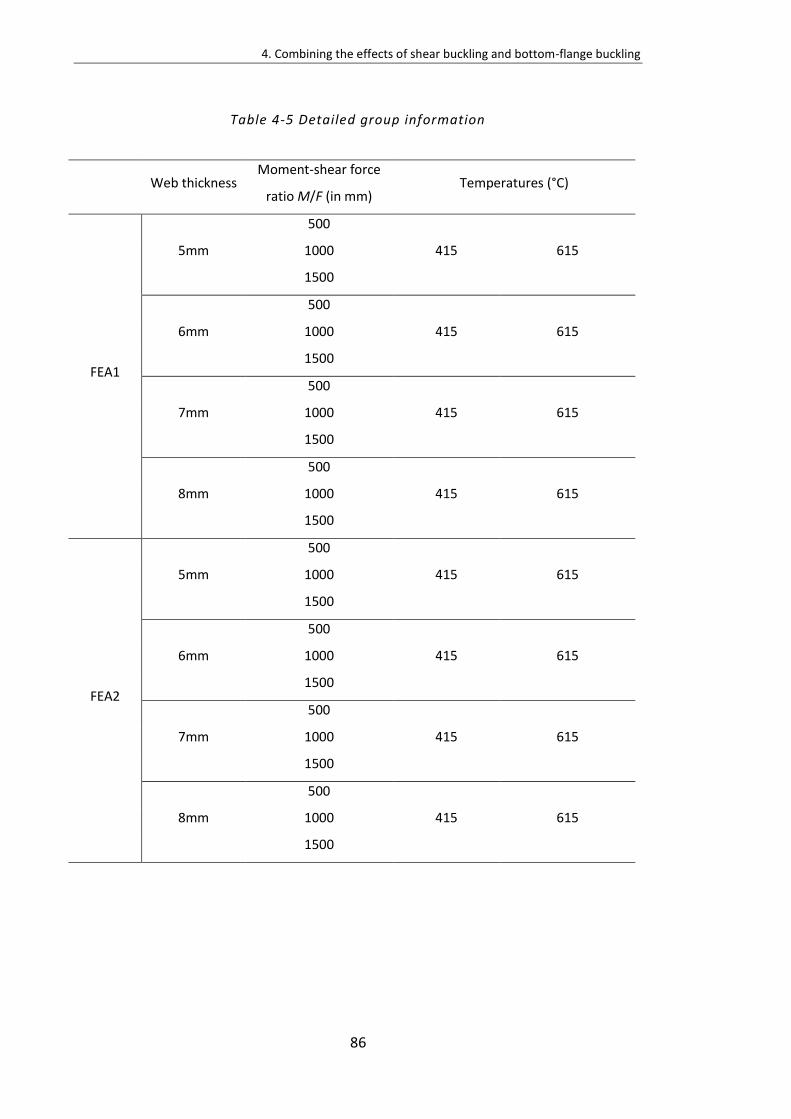
4. Combining the effects of shear buckling and bottom-flange buckling
86
Table 4-5 Detailed group information
Web thickness Moment-shear force
ratio M/F (in mm) Temperatures (°C)
FEA1
5mm
500
415 615 1000
1500
6mm
500
415 615 1000
1500
7mm
500
415 615 1000
1500
8mm
500
415 615 1000
1500
FEA2
5mm
500
415 615 1000
1500
6mm
500
415 615 1000
1500
7mm
500
415 615 1000
1500
8mm
500
415 615 1000
1500
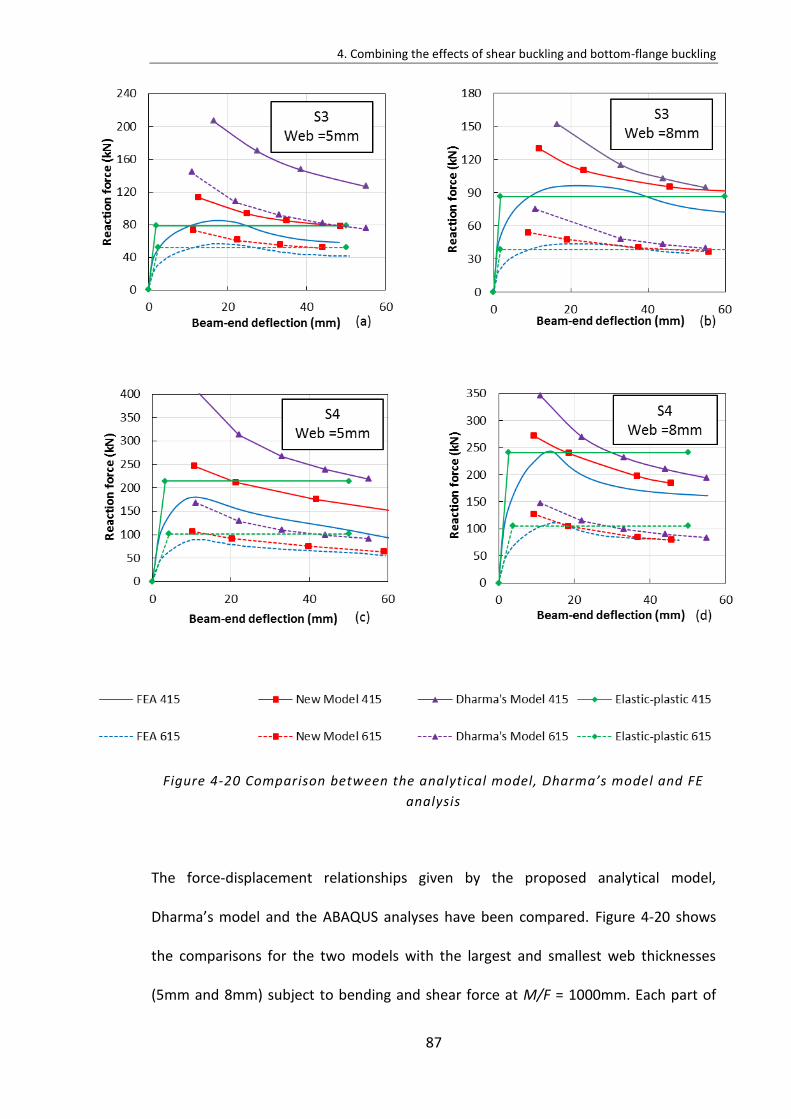
4. Combining the effects of shear buckling and bottom-flange buckling
87
Figure 4-20 Comparison between the analytical model, Dharma’s model and FE
analysis
The force-displacement relationships given by the proposed analytical model,
Dharma’s model and the ABAQUS analyses have been compared. Figure 4-20 shows
the comparisons for the two models with the largest and smallest web thicknesses
(5mm and 8mm) subject to bending and shear force at M/F = 1000mm. Each part of
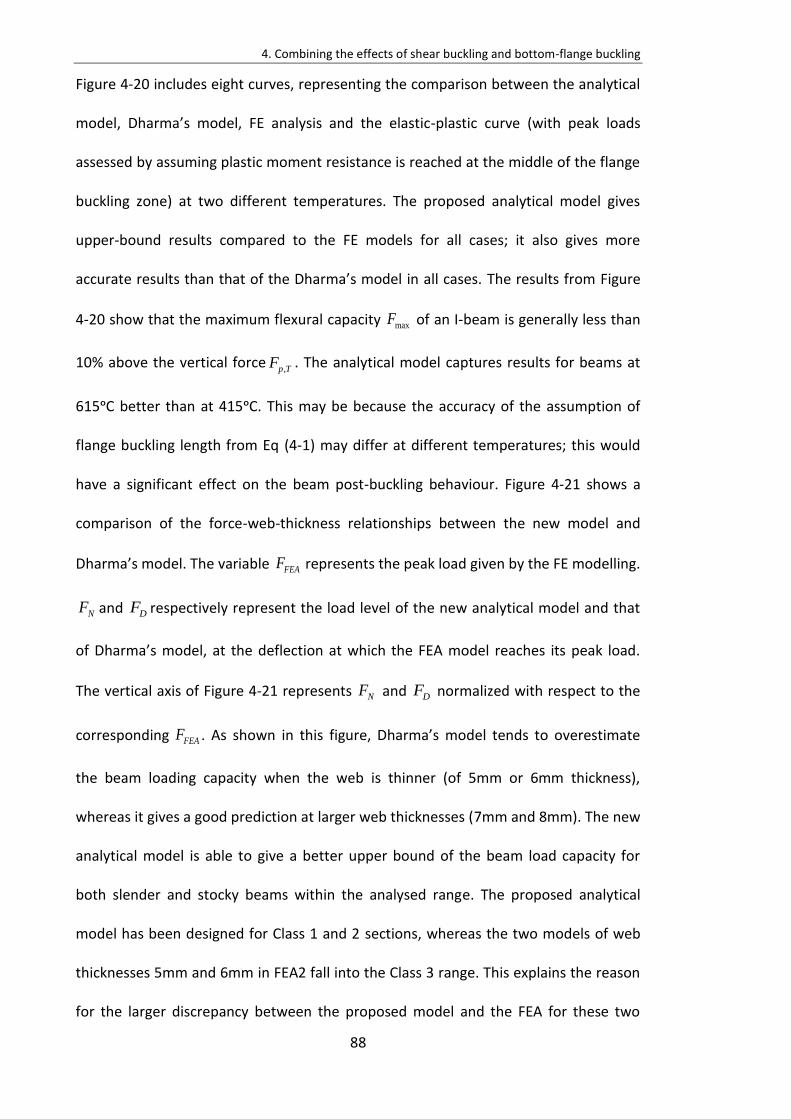
4. Combining the effects of shear buckling and bottom-flange buckling
88
Figure 4-20 includes eight curves, representing the comparison between the analytical
model, Dharma’s model, FE analysis and the elastic-plastic curve (with peak loads
assessed by assuming plastic moment resistance is reached at the middle of the flange
buckling zone) at two different temperatures. The proposed analytical model gives
upper-bound results compared to the FE models for all cases; it also gives more
accurate results than that of the Dharma’s model in all cases. The results from Figure
4-20 show that the maximum flexural capacity maxF of an I-beam is generally less than
10% above the vertical force,p TF . The analytical model captures results for beams at
615ᵒC better than at 415ᵒC. This may be because the accuracy of the assumption of
flange buckling length from Eq (4-1) may differ at different temperatures; this would
have a significant effect on the beam post-buckling behaviour. Figure 4-21 shows a
comparison of the force-web-thickness relationships between the new model and
Dharma’s model. The variable FEAF represents the peak load given by the FE modelling.
NF and DF respectively represent the load level of the new analytical model and that
of Dharma’s model, at the deflection at which the FEA model reaches its peak load.
The vertical axis of Figure 4-21 represents NF and DF normalized with respect to the
corresponding FEAF . As shown in this figure, Dharma’s model tends to overestimate
the beam loading capacity when the web is thinner (of 5mm or 6mm thickness),
whereas it gives a good prediction at larger web thicknesses (7mm and 8mm). The new
analytical model is able to give a better upper bound of the beam load capacity for
both slender and stocky beams within the analysed range. The proposed analytical
model has been designed for Class 1 and 2 sections, whereas the two models of web
thicknesses 5mm and 6mm in FEA2 fall into the Class 3 range. This explains the reason
for the larger discrepancy between the proposed model and the FEA for these two
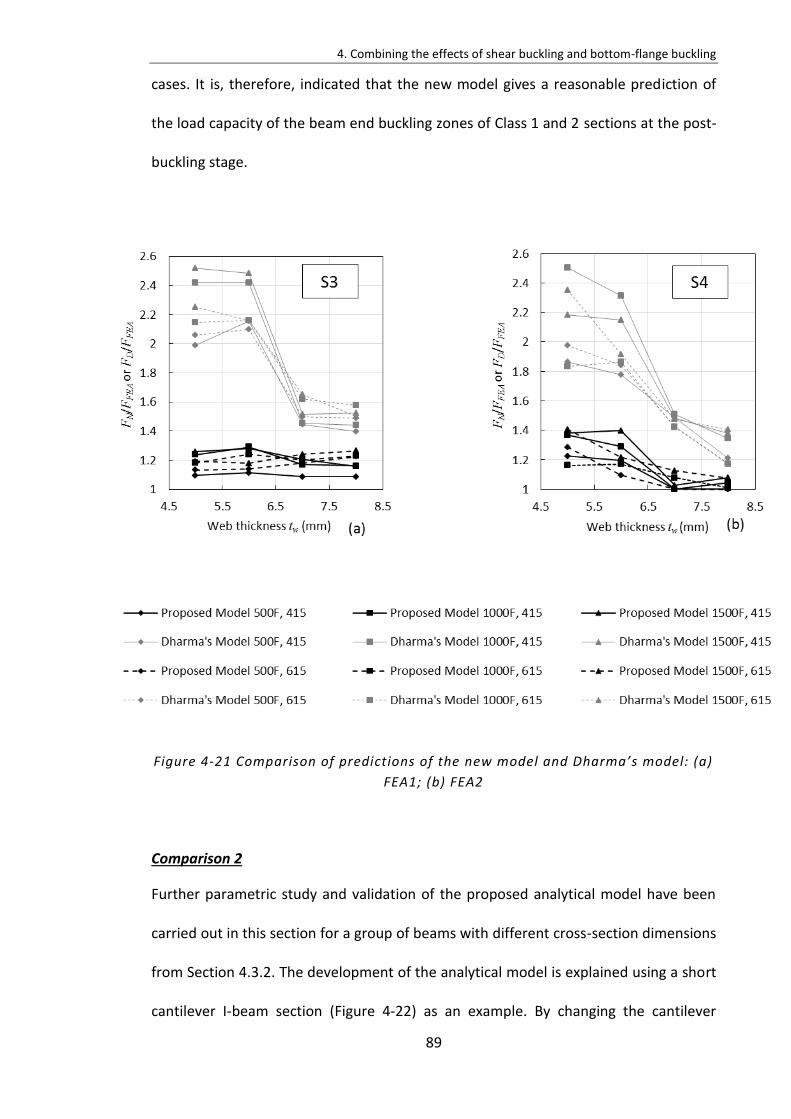
4. Combining the effects of shear buckling and bottom-flange buckling
89
cases. It is, therefore, indicated that the new model gives a reasonable prediction of
the load capacity of the beam end buckling zones of Class 1 and 2 sections at the post-
buckling stage.
Figure 4-21 Comparison of predictions of the new model and Dharma’s model: (a)
FEA1; (b) FEA2
Comparison 2
Further parametric study and validation of the proposed analytical model have been
carried out in this section for a group of beams with different cross-section dimensions
from Section 4.3.2. The development of the analytical model is explained using a short
cantilever I-beam section (Figure 4-22) as an example. By changing the cantilever
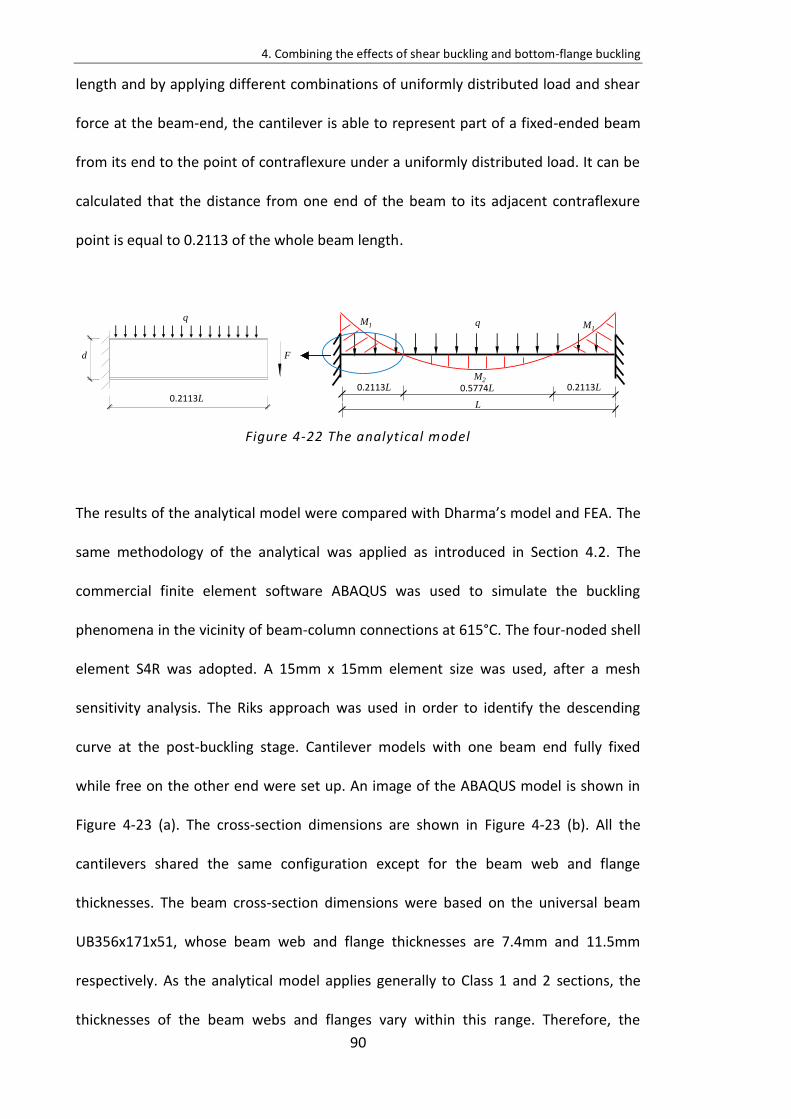
4. Combining the effects of shear buckling and bottom-flange buckling
90
length and by applying different combinations of uniformly distributed load and shear
force at the beam-end, the cantilever is able to represent part of a fixed-ended beam
from its end to the point of contraflexure under a uniformly distributed load. It can be
calculated that the distance from one end of the beam to its adjacent contraflexure
point is equal to 0.2113 of the whole beam length.
Figure 4-22 The analytical model
The results of the analytical model were compared with Dharma’s model and FEA. The
same methodology of the analytical was applied as introduced in Section 4.2. The
commercial finite element software ABAQUS was used to simulate the buckling
phenomena in the vicinity of beam-column connections at 615°C. The four-noded shell
element S4R was adopted. A 15mm x 15mm element size was used, after a mesh
sensitivity analysis. The Riks approach was used in order to identify the descending
curve at the post-buckling stage. Cantilever models with one beam end fully fixed
while free on the other end were set up. An image of the ABAQUS model is shown in
Figure 4-23 (a). The cross-section dimensions are shown in Figure 4-23 (b). All the
cantilevers shared the same configuration except for the beam web and flange
thicknesses. The beam cross-section dimensions were based on the universal beam
UB356x171x51, whose beam web and flange thicknesses are 7.4mm and 11.5mm
respectively. As the analytical model applies generally to Class 1 and 2 sections, the
thicknesses of the beam webs and flanges vary within this range. Therefore, the
F
q
d
0.2113L
qM1 M1
M2
0.2113L 0.2113L0.5774L
L
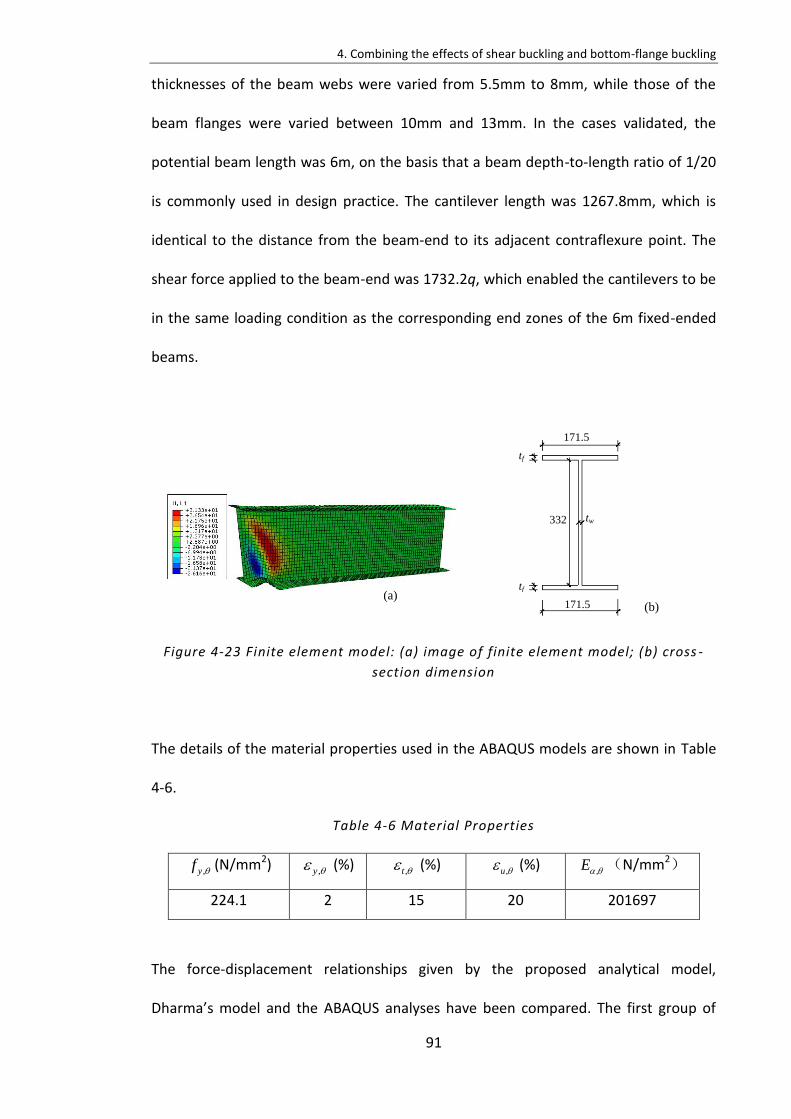
4. Combining the effects of shear buckling and bottom-flange buckling
91
thicknesses of the beam webs were varied from 5.5mm to 8mm, while those of the
beam flanges were varied between 10mm and 13mm. In the cases validated, the
potential beam length was 6m, on the basis that a beam depth-to-length ratio of 1/20
is commonly used in design practice. The cantilever length was 1267.8mm, which is
identical to the distance from the beam-end to its adjacent contraflexure point. The
shear force applied to the beam-end was 1732.2q, which enabled the cantilevers to be
in the same loading condition as the corresponding end zones of the 6m fixed-ended
beams.
Figure 4-23 Finite element model: (a) image of finite element model; (b) cross -
section dimension
The details of the material properties used in the ABAQUS models are shown in Table
4-6.
Table 4-6 Material Properties
,yf (N/mm2) ,y (%)
,t (%) ,u (%)
,E (N/mm2)
224.1 2 15 20 201697
The force-displacement relationships given by the proposed analytical model,
Dharma’s model and the ABAQUS analyses have been compared. The first group of
171.5
332
(b)
tf
tf
171.5
tw
(a)
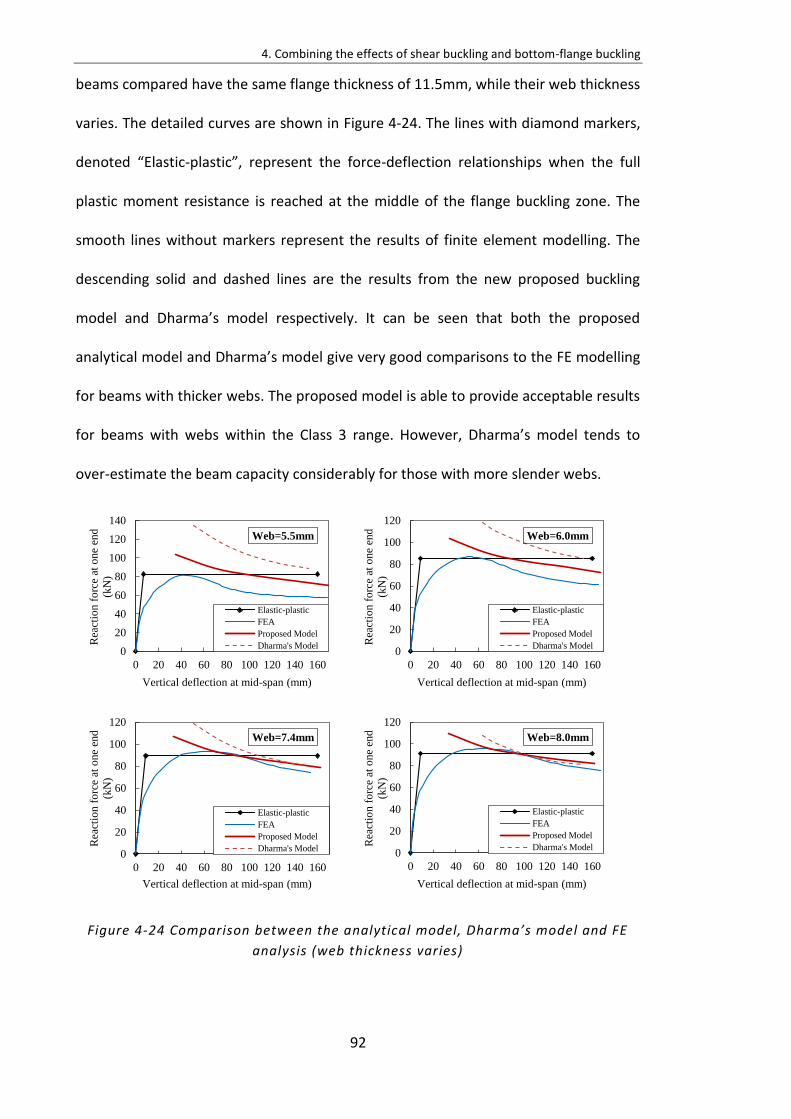
4. Combining the effects of shear buckling and bottom-flange buckling
92
beams compared have the same flange thickness of 11.5mm, while their web thickness
varies. The detailed curves are shown in Figure 4-24. The lines with diamond markers,
denoted “Elastic-plastic”, represent the force-deflection relationships when the full
plastic moment resistance is reached at the middle of the flange buckling zone. The
smooth lines without markers represent the results of finite element modelling. The
descending solid and dashed lines are the results from the new proposed buckling
model and Dharma’s model respectively. It can be seen that both the proposed
analytical model and Dharma’s model give very good comparisons to the FE modelling
for beams with thicker webs. The proposed model is able to provide acceptable results
for beams with webs within the Class 3 range. However, Dharma’s model tends to
over-estimate the beam capacity considerably for those with more slender webs.
Figure 4-24 Comparison between the analytical model, Dharma’s model and FE
analysis (web thickness varies)
0
20
40
60
80
100
120
140
0 20 40 60 80 100 120 140 160
Rea
ctio
n f
orc
e at
one
end
(kN
)
Vertical deflection at mid-span (mm)
Web=5.5mm
Elastic-plastic
FEA
Proposed Model
Dharma's Model
0
20
40
60
80
100
120
0 20 40 60 80 100 120 140 160
Rea
ctio
n f
orc
e at
one
end
(kN
)
Vertical deflection at mid-span (mm)
Web=6.0mm
Elastic-plastic
FEA
Proposed Model
Dharma's Model
0
20
40
60
80
100
120
0 20 40 60 80 100 120 140 160
Rea
ctio
n f
orc
e at
one
end
(kN
)
Vertical deflection at mid-span (mm)
Web=7.4mm
Elastic-plastic
FEA
Proposed Model
Dharma's Model
0
20
40
60
80
100
120
0 20 40 60 80 100 120 140 160
Rea
ctio
n f
orc
e at
one
end
(kN
)
Vertical deflection at mid-span (mm)
Web=8.0mm
Elastic-plastic
FEA
Proposed Model
Dharma's Model
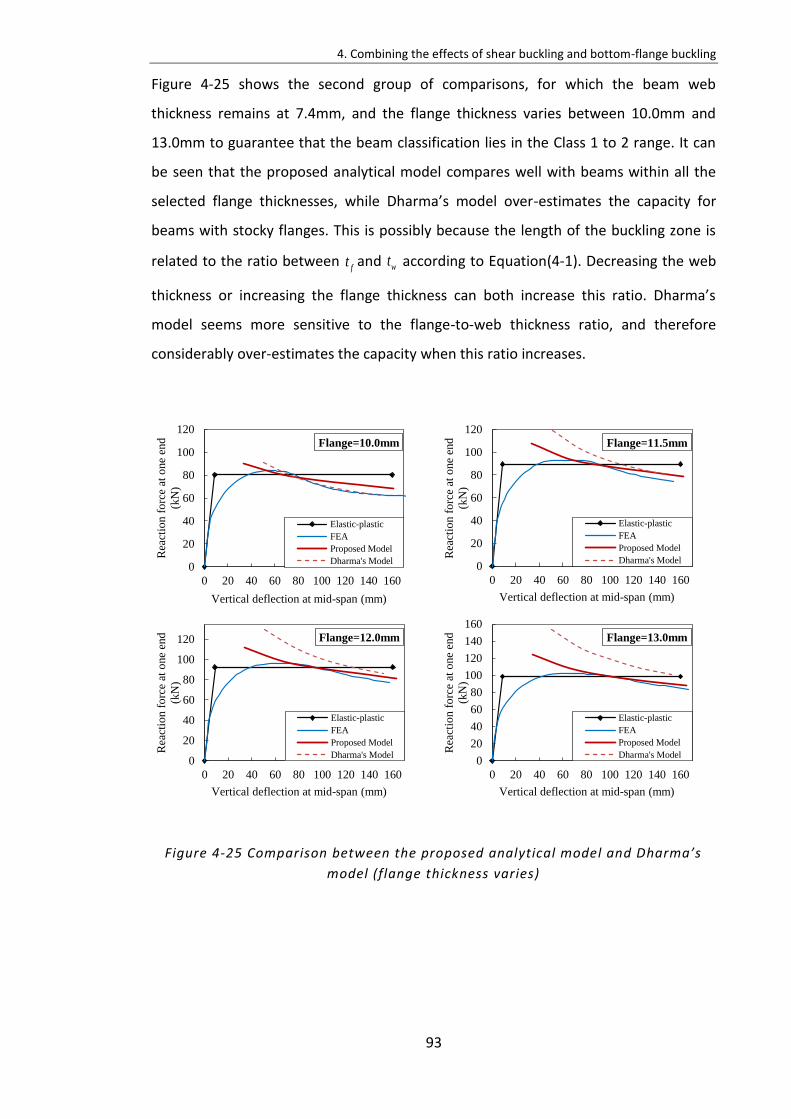
4. Combining the effects of shear buckling and bottom-flange buckling
93
Figure 4-25 shows the second group of comparisons, for which the beam web
thickness remains at 7.4mm, and the flange thickness varies between 10.0mm and
13.0mm to guarantee that the beam classification lies in the Class 1 to 2 range. It can
be seen that the proposed analytical model compares well with beams within all the
selected flange thicknesses, while Dharma’s model over-estimates the capacity for
beams with stocky flanges. This is possibly because the length of the buckling zone is
related to the ratio between ft and wt according to Equation(4-1). Decreasing the web
thickness or increasing the flange thickness can both increase this ratio. Dharma’s
model seems more sensitive to the flange-to-web thickness ratio, and therefore
considerably over-estimates the capacity when this ratio increases.
Figure 4-25 Comparison between the proposed analytical model and Dharma’s
model (flange thickness varies)
0
20
40
60
80
100
120
0 20 40 60 80 100 120 140 160
Rea
ctio
n f
orc
e at
one
end
(kN
)
Vertical deflection at mid-span (mm)
Flange=10.0mm
Elastic-plastic
FEA
Proposed Model
Dharma's Model
0
20
40
60
80
100
120
0 20 40 60 80 100 120 140 160
Rea
ctio
n f
orc
e at
one
end
(kN
)
Vertical deflection at mid-span (mm)
Flange=11.5mm
Elastic-plastic
FEA
Proposed Model
Dharma's Model
0
20
40
60
80
100
120
0 20 40 60 80 100 120 140 160
Rea
ctio
n f
orc
e at
one
end
(kN
)
Vertical deflection at mid-span (mm)
Flange=12.0mm
Elastic-plastic
FEA
Proposed Model
Dharma's Model
0
20
40
60
80
100
120
140
160
0 20 40 60 80 100 120 140 160
Rea
ctio
n f
orc
e at
one
end
(kN
)
Vertical deflection at mid-span (mm)
Flange=13.0mm
Elastic-plastic
FEA
Proposed Model
Dharma's Model
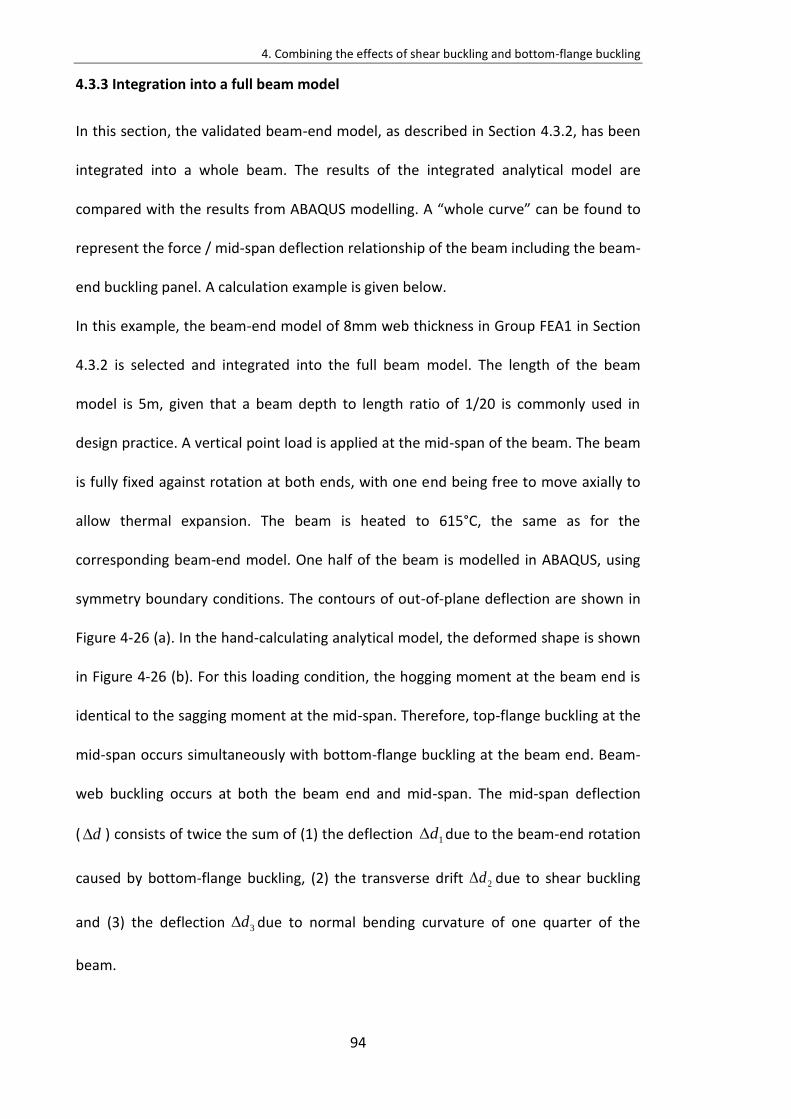
4. Combining the effects of shear buckling and bottom-flange buckling
94
4.3.3 Integration into a full beam model
In this section, the validated beam-end model, as described in Section 4.3.2, has been
integrated into a whole beam. The results of the integrated analytical model are
compared with the results from ABAQUS modelling. A “whole curve” can be found to
represent the force / mid-span deflection relationship of the beam including the beam-
end buckling panel. A calculation example is given below.
In this example, the beam-end model of 8mm web thickness in Group FEA1 in Section
4.3.2 is selected and integrated into the full beam model. The length of the beam
model is 5m, given that a beam depth to length ratio of 1/20 is commonly used in
design practice. A vertical point load is applied at the mid-span of the beam. The beam
is fully fixed against rotation at both ends, with one end being free to move axially to
allow thermal expansion. The beam is heated to 615°C, the same as for the
corresponding beam-end model. One half of the beam is modelled in ABAQUS, using
symmetry boundary conditions. The contours of out-of-plane deflection are shown in
Figure 4-26 (a). In the hand-calculating analytical model, the deformed shape is shown
in Figure 4-26 (b). For this loading condition, the hogging moment at the beam end is
identical to the sagging moment at the mid-span. Therefore, top-flange buckling at the
mid-span occurs simultaneously with bottom-flange buckling at the beam end. Beam-
web buckling occurs at both the beam end and mid-span. The mid-span deflection
( d ) consists of twice the sum of (1) the deflection 1d due to the beam-end rotation
caused by bottom-flange buckling, (2) the transverse drift 2d due to shear buckling
and (3) the deflection 3d due to normal bending curvature of one quarter of the
beam.
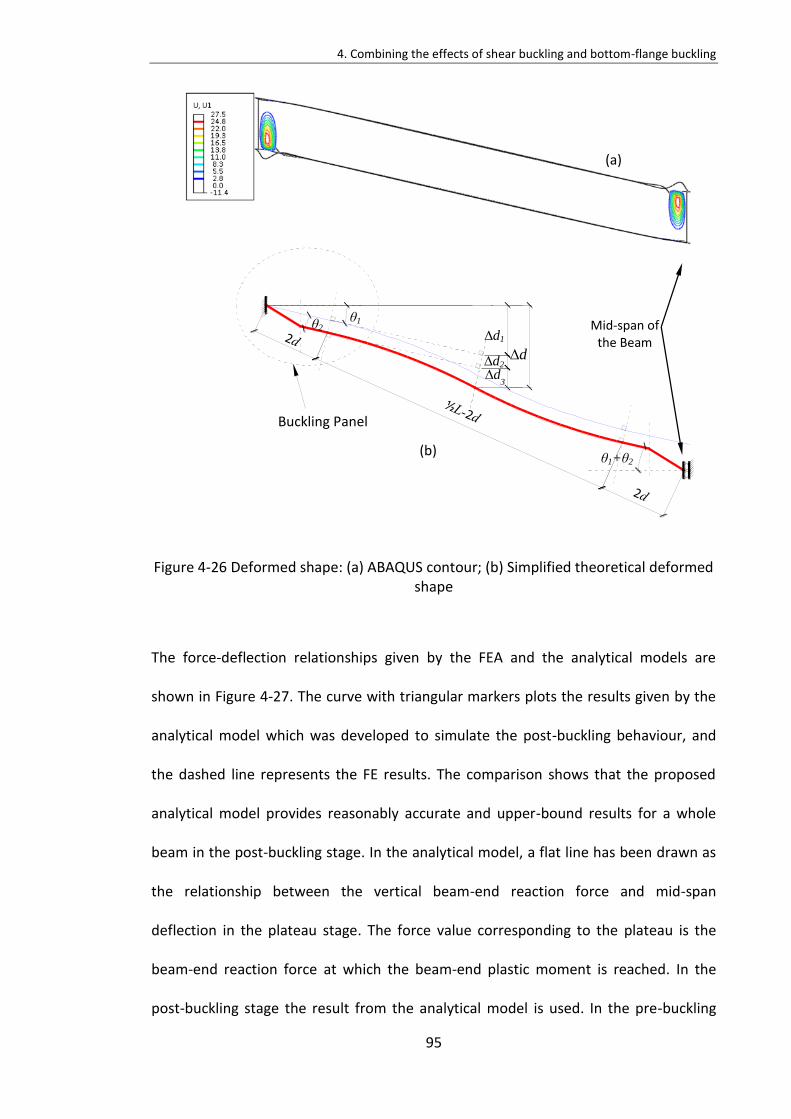
4. Combining the effects of shear buckling and bottom-flange buckling
95
Figure 4-26 Deformed shape: (a) ABAQUS contour; (b) Simplified theoretical deformed shape
The force-deflection relationships given by the FEA and the analytical models are
shown in Figure 4-27. The curve with triangular markers plots the results given by the
analytical model which was developed to simulate the post-buckling behaviour, and
the dashed line represents the FE results. The comparison shows that the proposed
analytical model provides reasonably accurate and upper-bound results for a whole
beam in the post-buckling stage. In the analytical model, a flat line has been drawn as
the relationship between the vertical beam-end reaction force and mid-span
deflection in the plateau stage. The force value corresponding to the plateau is the
beam-end reaction force at which the beam-end plastic moment is reached. In the
post-buckling stage the result from the analytical model is used. In the pre-buckling
(a)
d3
(b)
Buckling Panel
θ1 θ2
θ1+θ2
Mid-span of the Beam
d
d1
d2
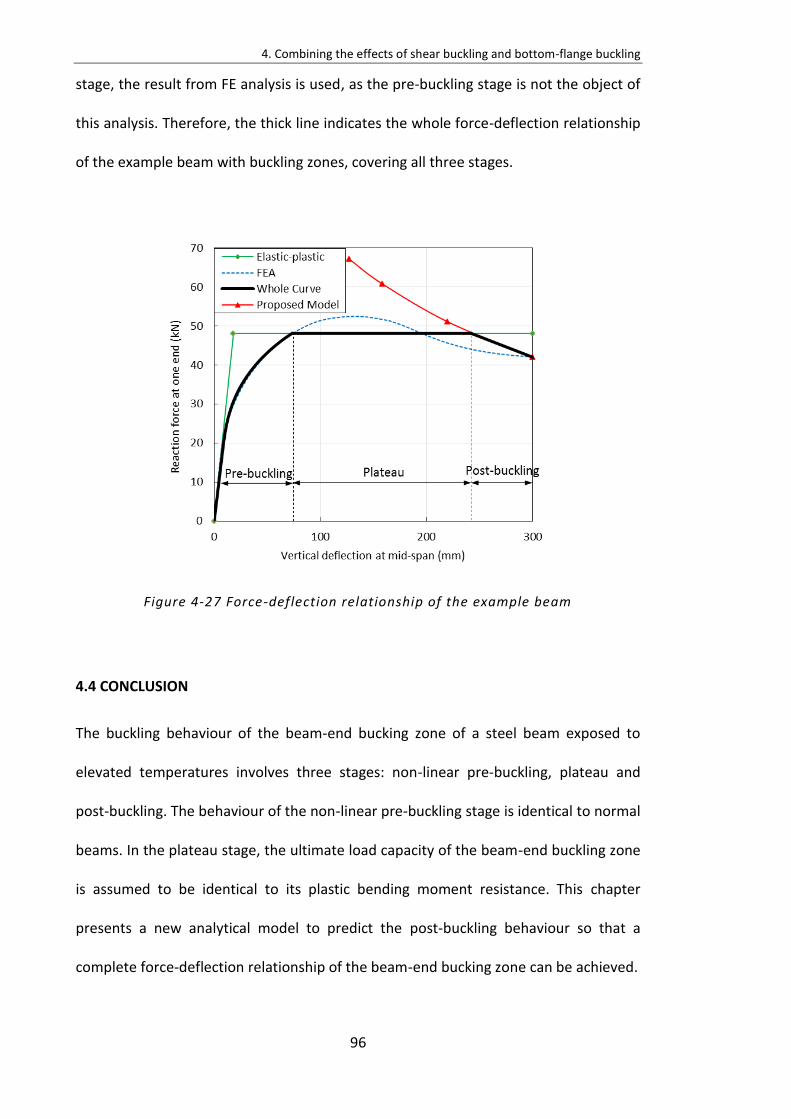
4. Combining the effects of shear buckling and bottom-flange buckling
96
stage, the result from FE analysis is used, as the pre-buckling stage is not the object of
this analysis. Therefore, the thick line indicates the whole force-deflection relationship
of the example beam with buckling zones, covering all three stages.
Figure 4-27 Force-deflection relationship of the example beam
4.4 CONCLUSION
The buckling behaviour of the beam-end bucking zone of a steel beam exposed to
elevated temperatures involves three stages: non-linear pre-buckling, plateau and
post-buckling. The behaviour of the non-linear pre-buckling stage is identical to normal
beams. In the plateau stage, the ultimate load capacity of the beam-end buckling zone
is assumed to be identical to its plastic bending moment resistance. This chapter
presents a new analytical model to predict the post-buckling behaviour so that a
complete force-deflection relationship of the beam-end bucking zone can be achieved.
4. Combining the effects of shear buckling and bottom-flange buckling
97
The proposed analytical model considers both the beam-web shear buckling and
bottom-flange buckling. The interaction between these two buckling modes is
accounted for by ensuring compatibility between the out-of-plane deflections of the
beam web caused by these two modes. A range of finite element models has been
created using ABAQUS. These models were firstly validated against test data, and
subsequently used to validate the analytical model. The analytical model has also been
compared with Dharma’s analytical model and FEA. Two comparison cases,
considering both with and without uniformly distributed load on top of the buckling
panel were discussed. The comparisons have shown that the proposed model provides
a reasonably accurate and conservative prediction of the force-deflection relationship
for Class 1 and 2 sections, whereas Dharma’s model tends to overestimate the post-
buckling capacity for beams with slender webs.
A calculation example of the validated beam-end buckling panel integrated into a
whole beam was given. This example indicated that the analytical model is of sufficient
accurate to be implemented into whole-beam analysation.
98
5.
A PARAMETRIC INVESTIGATION OF THE
TRANSITION LENGTH BETWEEN BEAM-WEB
SHEAR BUCKLING AND BOTTOM - FLANGE
BUCKLING AT ELEVATED TEMPERATUR
5. A parametric investigation of the transition between beam-web shear buckling and bottom - flange buckling at elevated temperatures
99
5.1 INTRODUCTION
Analytical models have been proposed to track the force-deflection behaviour when
pure shear buckling behaviour of the beam web occurs (Chapter 3), or beam-web
shear buckling and flange buckling occur simultaneously (Chapter 4) at elevated
temperatures. It has been pointed out in Chapter 3 that as beam length increases, the
‘failure’ mode switches from beam-web shear buckling to bottom-flange buckling.
Therefore, a transition criterion is needed in order to justify whether beam-web shear
buckling or a combination of beam-web shear buckling and bottom-flange buckling will
actually occur according to the structural information of a particular case. The purpose
of this criterion is to find the transition beam length, below which shear buckling will
occur; a combined buckling mode will occur if the actual beam length is longer than
the transition length defined by the transition criterion. The transition criterion is that,
as beam length increases, the lesser resistance of the two buckling modes will be
reached first. For the beam-web buckling mode the resistance is the plastic shear
resistance, while for the combined buckling mode the resistance is the plastic bending
resistance. The buckling mode corresponding to the lower of these is the real buckling
mode.
In this section, the transition criterion of the occurrence between shear buckling and
the combination of beam-web shear buckling and bottom-flange buckling has been
proposed for beams without axial restraint. The cross-section dimension from Section
4 Group FEA1 will be verified against the criterion.
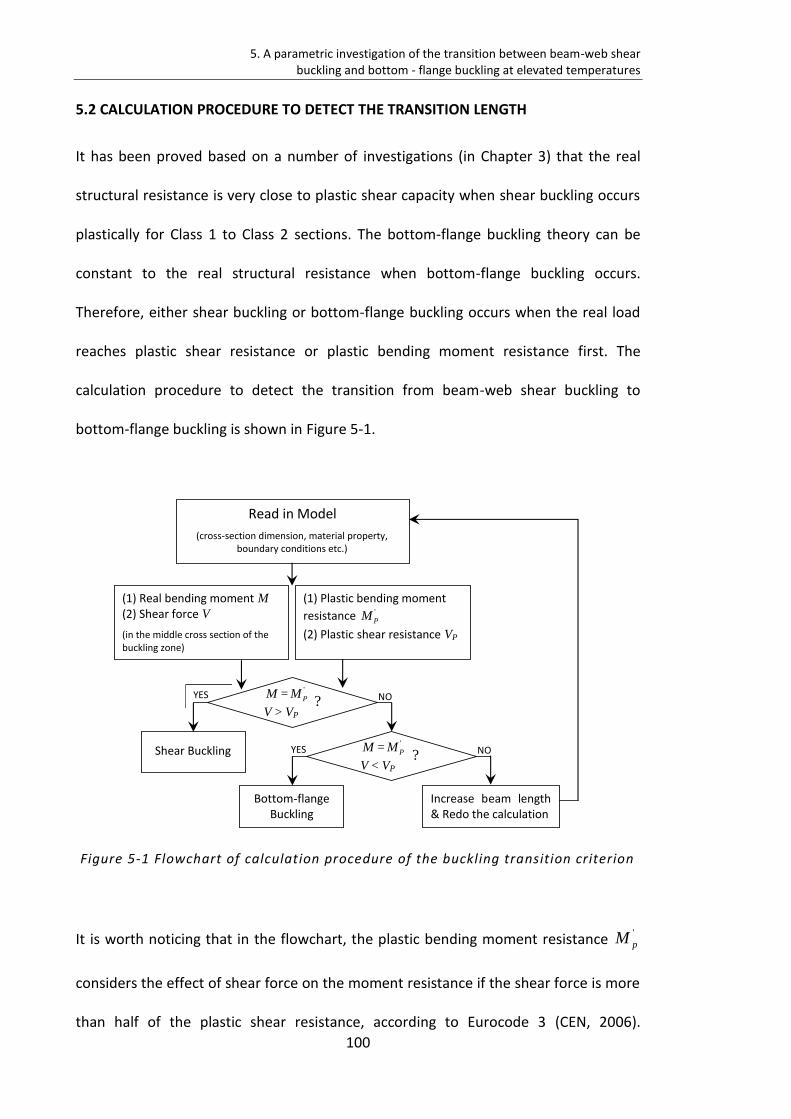
5. A parametric investigation of the transition between beam-web shear buckling and bottom - flange buckling at elevated temperatures
100
5.2 CALCULATION PROCEDURE TO DETECT THE TRANSITION LENGTH
It has been proved based on a number of investigations (in Chapter 3) that the real
structural resistance is very close to plastic shear capacity when shear buckling occurs
plastically for Class 1 to Class 2 sections. The bottom-flange buckling theory can be
constant to the real structural resistance when bottom-flange buckling occurs.
Therefore, either shear buckling or bottom-flange buckling occurs when the real load
reaches plastic shear resistance or plastic bending moment resistance first. The
calculation procedure to detect the transition from beam-web shear buckling to
bottom-flange buckling is shown in Figure 5-1.
Figure 5-1 Flowchart of calculation procedure of the buckling transition criterion
It is worth noticing that in the flowchart, the plastic bending moment resistance '
pM
considers the effect of shear force on the moment resistance if the shear force is more
than half of the plastic shear resistance, according to Eurocode 3 (CEN, 2006).
Read in Model
(cross-section dimension, material property, boundary conditions etc.)
(1) Real bending moment M (2) Shear force V
(in the middle cross section of the buckling zone)
(1) Plastic bending moment
resistance '
PM
(2) Plastic shear resistance VP
Bottom-flange Buckling
Shear Buckling
M = '
PM
V > VP
YES NO
M = '
PM
V < VP ?
?
YES NO
Increase beam length & Redo the calculation
5. A parametric investigation of the transition between beam-web shear buckling and bottom - flange buckling at elevated temperatures
101
According to the calculation procedure, the plastic shear resistance is given as
Equation (5-1),
, 0( / 3) /p v y MV A (5-1)
Where vA is the shear area.
The plastic bending moment resistance considering the effect of then shear force is,
' (1 )p pM M (5-2)
Where pM is the normal plastic bending moment capacity of the cross section. can
be expressed as Equation (5-3) according to Eurocode 3 (CEN, 2005a).
2
2 / 1Ed pV V (5-3)
Where EdV is the elastic shear resistance of the cross section.
5.3 VALIDATION AGAINST ABAQUS MODELS
Two groups of ABAQUS models were developed in order to verify the beam-web shear
buckling model, bottom flange buckling model as well as the transition length between
these two buckling phenomena at 415ᵒC. A summary of cross-section dimensions and
material properties of both groups are shown in Table 5-1.
Table 5-1 Cross-section dimensions of the beams analysed
Group No. d b tw tf
A&B 275.5 163 7 10
Group No. (N/mm2)
(%) (%) (%)
A&B 267.96 2 15 20
,y ,y ,t ,u
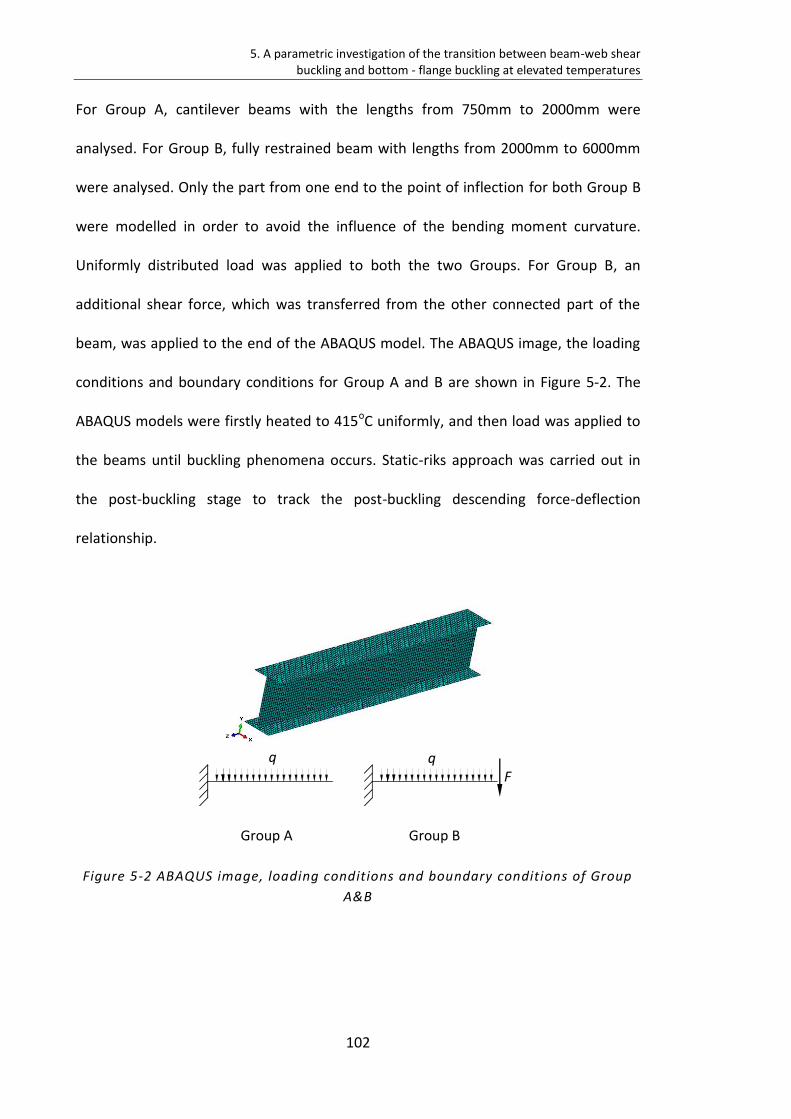
5. A parametric investigation of the transition between beam-web shear buckling and bottom - flange buckling at elevated temperatures
102
For Group A, cantilever beams with the lengths from 750mm to 2000mm were
analysed. For Group B, fully restrained beam with lengths from 2000mm to 6000mm
were analysed. Only the part from one end to the point of inflection for both Group B
were modelled in order to avoid the influence of the bending moment curvature.
Uniformly distributed load was applied to both the two Groups. For Group B, an
additional shear force, which was transferred from the other connected part of the
beam, was applied to the end of the ABAQUS model. The ABAQUS image, the loading
conditions and boundary conditions for Group A and B are shown in Figure 5-2. The
ABAQUS models were firstly heated to 415oC uniformly, and then load was applied to
the beams until buckling phenomena occurs. Static-riks approach was carried out in
the post-buckling stage to track the post-buckling descending force-deflection
relationship.
Figure 5-2 ABAQUS image, loading conditions and boundary conditions of Group
A&B
Group A
Group B
q q F
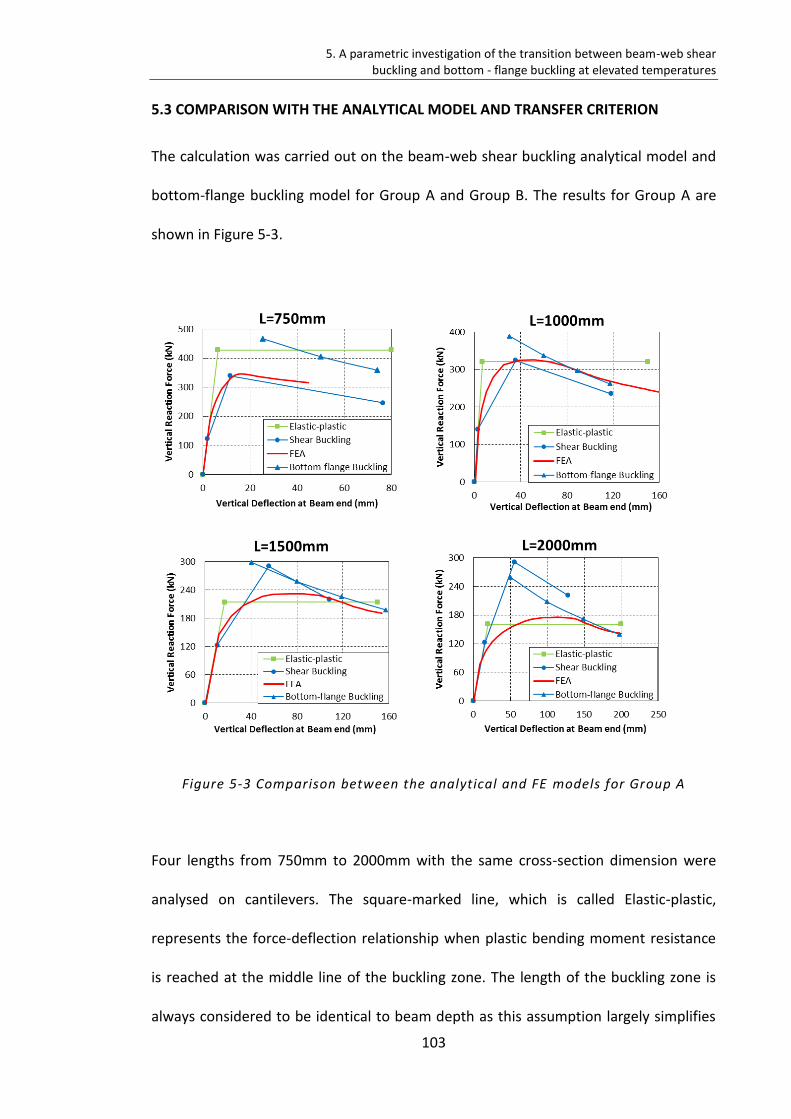
5. A parametric investigation of the transition between beam-web shear buckling and bottom - flange buckling at elevated temperatures
103
5.3 COMPARISON WITH THE ANALYTICAL MODEL AND TRANSFER CRITERION
The calculation was carried out on the beam-web shear buckling analytical model and
bottom-flange buckling model for Group A and Group B. The results for Group A are
shown in Figure 5-3.
Figure 5-3 Comparison between the analytical and FE models for Group A
Four lengths from 750mm to 2000mm with the same cross-section dimension were
analysed on cantilevers. The square-marked line, which is called Elastic-plastic,
represents the force-deflection relationship when plastic bending moment resistance
is reached at the middle line of the buckling zone. The length of the buckling zone is
always considered to be identical to beam depth as this assumption largely simplifies
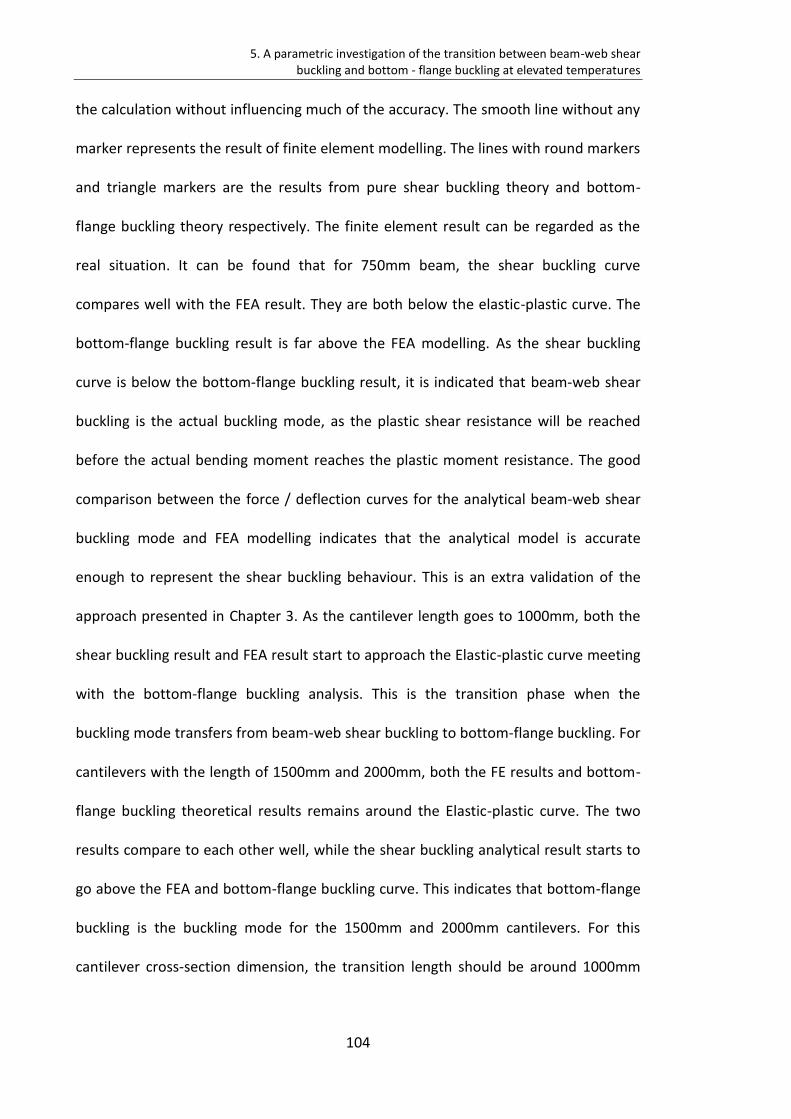
5. A parametric investigation of the transition between beam-web shear buckling and bottom - flange buckling at elevated temperatures
104
the calculation without influencing much of the accuracy. The smooth line without any
marker represents the result of finite element modelling. The lines with round markers
and triangle markers are the results from pure shear buckling theory and bottom-
flange buckling theory respectively. The finite element result can be regarded as the
real situation. It can be found that for 750mm beam, the shear buckling curve
compares well with the FEA result. They are both below the elastic-plastic curve. The
bottom-flange buckling result is far above the FEA modelling. As the shear buckling
curve is below the bottom-flange buckling result, it is indicated that beam-web shear
buckling is the actual buckling mode, as the plastic shear resistance will be reached
before the actual bending moment reaches the plastic moment resistance. The good
comparison between the force / deflection curves for the analytical beam-web shear
buckling mode and FEA modelling indicates that the analytical model is accurate
enough to represent the shear buckling behaviour. This is an extra validation of the
approach presented in Chapter 3. As the cantilever length goes to 1000mm, both the
shear buckling result and FEA result start to approach the Elastic-plastic curve meeting
with the bottom-flange buckling analysis. This is the transition phase when the
buckling mode transfers from beam-web shear buckling to bottom-flange buckling. For
cantilevers with the length of 1500mm and 2000mm, both the FE results and bottom-
flange buckling theoretical results remains around the Elastic-plastic curve. The two
results compare to each other well, while the shear buckling analytical result starts to
go above the FEA and bottom-flange buckling curve. This indicates that bottom-flange
buckling is the buckling mode for the 1500mm and 2000mm cantilevers. For this
cantilever cross-section dimension, the transition length should be around 1000mm
5. A parametric investigation of the transition between beam-web shear buckling and bottom - flange buckling at elevated temperatures
105
according to the results comparison. This conclusion can also be proved by the
ABAQUS result visualizations shown in Figure 5-4.
(a) L=750mm (b) L=2000mm
Figure 5-4 ABAQUS result visualization of Group B (a). L =750mm; (b). L=2000mm
According to the transition criterion, the calculating transition length from this
procedure is 1036mm. This is consistent to that achieved from the FE analysis
visualization and the comparison between the analytical models and the FE analysis.
The other group (Group B) of full-restrained beam examples were analysed. The
results are shown in Figure 5-5. Similar observation to Group A was carried out on
Group B results. It can be seen that the transition length of this group is around
3000mm. The ABAQUS result visualizations shown in Figure 5-6. The ABAQUS
visualization of shear buckling mode of 2000mm beam in Group B is shown in Figure 5-
6 (a); the visualization of combination buckling mode of 6000mm beams if shown in
Figure 5-6 (b).
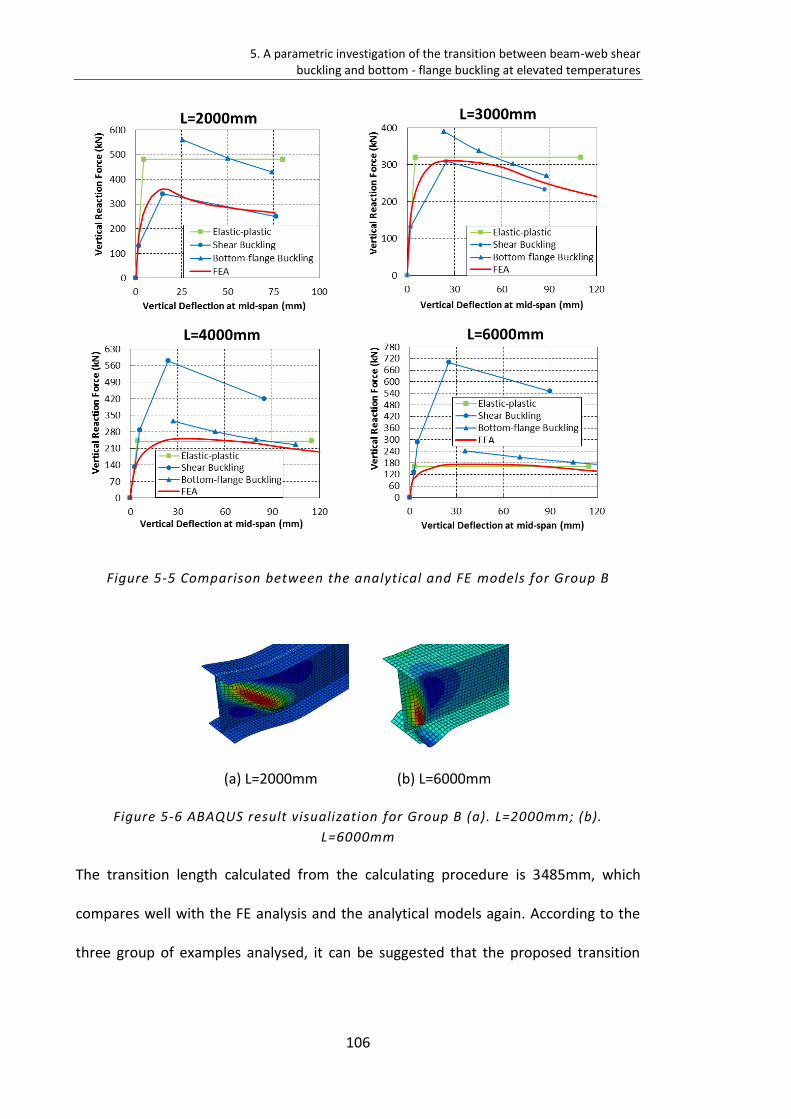
5. A parametric investigation of the transition between beam-web shear buckling and bottom - flange buckling at elevated temperatures
106
Figure 5-5 Comparison between the analytical and FE models for Group B
(a) L=2000mm (b) L=6000mm
Figure 5-6 ABAQUS result visualization for Group B (a). L=2000mm; (b).
L=6000mm
The transition length calculated from the calculating procedure is 3485mm, which
compares well with the FE analysis and the analytical models again. According to the
three group of examples analysed, it can be suggested that the proposed transition
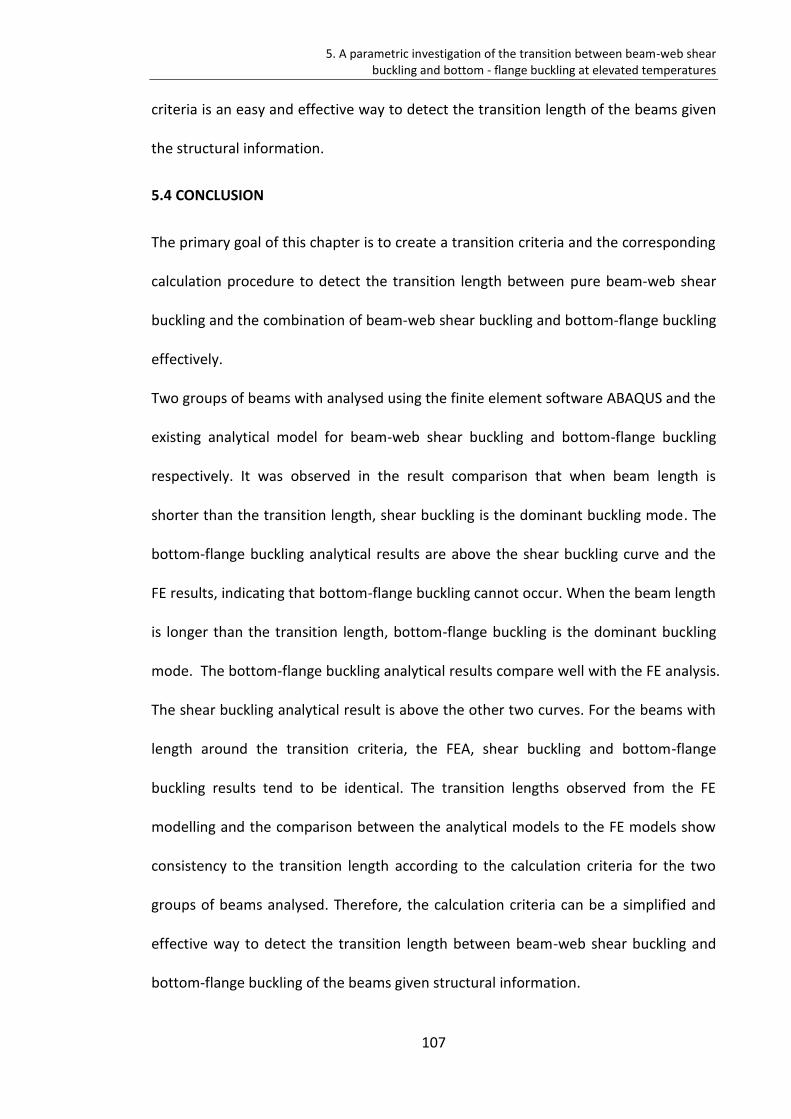
5. A parametric investigation of the transition between beam-web shear buckling and bottom - flange buckling at elevated temperatures
107
criteria is an easy and effective way to detect the transition length of the beams given
the structural information.
5.4 CONCLUSION
The primary goal of this chapter is to create a transition criteria and the corresponding
calculation procedure to detect the transition length between pure beam-web shear
buckling and the combination of beam-web shear buckling and bottom-flange buckling
effectively.
Two groups of beams with analysed using the finite element software ABAQUS and the
existing analytical model for beam-web shear buckling and bottom-flange buckling
respectively. It was observed in the result comparison that when beam length is
shorter than the transition length, shear buckling is the dominant buckling mode. The
bottom-flange buckling analytical results are above the shear buckling curve and the
FE results, indicating that bottom-flange buckling cannot occur. When the beam length
is longer than the transition length, bottom-flange buckling is the dominant buckling
mode. The bottom-flange buckling analytical results compare well with the FE analysis.
The shear buckling analytical result is above the other two curves. For the beams with
length around the transition criteria, the FEA, shear buckling and bottom-flange
buckling results tend to be identical. The transition lengths observed from the FE
modelling and the comparison between the analytical models to the FE models show
consistency to the transition length according to the calculation criteria for the two
groups of beams analysed. Therefore, the calculation criteria can be a simplified and
effective way to detect the transition length between beam-web shear buckling and
bottom-flange buckling of the beams given structural information.
5. A parametric investigation of the transition between beam-web shear buckling and bottom - flange buckling at elevated temperatures
108
After the buckling mode and the transition length have been determined, it is possible
to decide analytically the overall behaviour of the buckling panel. If the buckling mode
is shear buckling, the force-deflection path follows the trilinear curve representing the
beam-web shear buckling behaviour from the pre-buckling stage to the post-buckling
stage. If the buckling mode is the combined mode, the force-deflection path is linearly
elastic until the vertical reaction force at which the plastic bending moment resistance
occurs is reached. The elastic range is followed by a plateau stage, and finally by the
post-buckling stage, for which the force-deflection path is determined by the analytical
model introduced in Chapter 4.
109
6.
THE BEHAVIOUR AND EFFECTS OF BEAM-END
BUCKLING IN FIRE USING A COMPONENT-
BASED METHOD
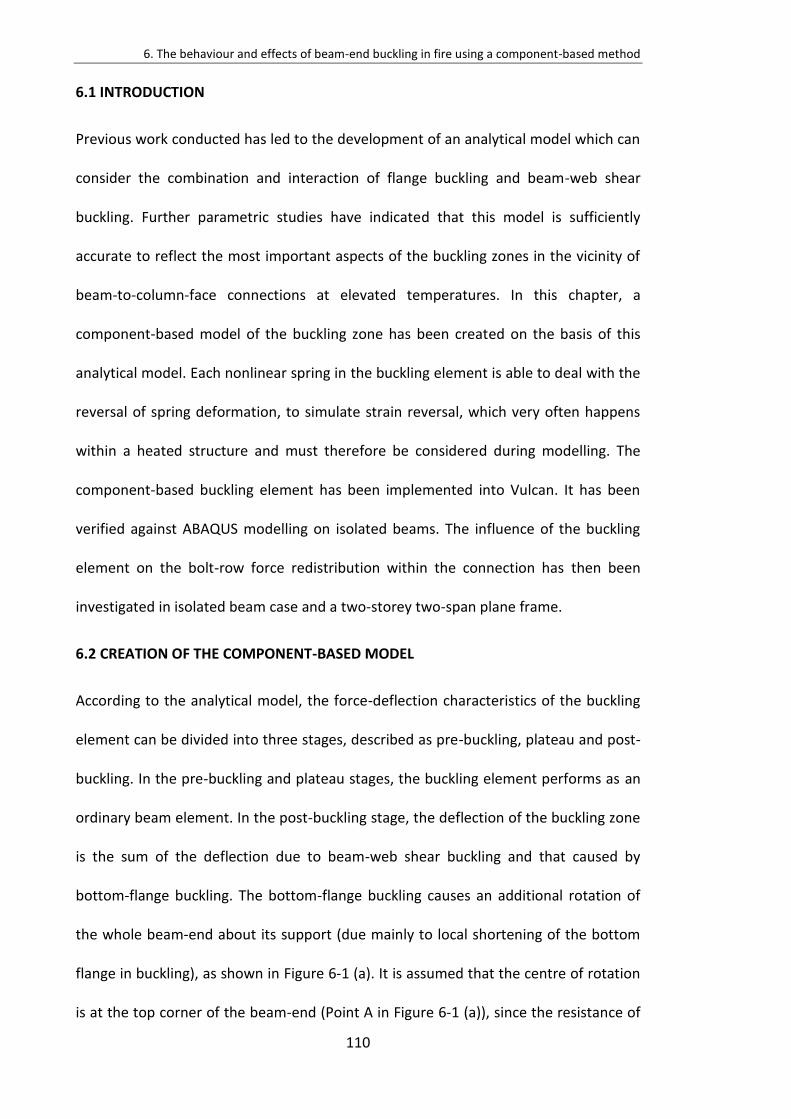
6. The behaviour and effects of beam-end buckling in fire using a component-based method
110
6.1 INTRODUCTION
Previous work conducted has led to the development of an analytical model which can
consider the combination and interaction of flange buckling and beam-web shear
buckling. Further parametric studies have indicated that this model is sufficiently
accurate to reflect the most important aspects of the buckling zones in the vicinity of
beam-to-column-face connections at elevated temperatures. In this chapter, a
component-based model of the buckling zone has been created on the basis of this
analytical model. Each nonlinear spring in the buckling element is able to deal with the
reversal of spring deformation, to simulate strain reversal, which very often happens
within a heated structure and must therefore be considered during modelling. The
component-based buckling element has been implemented into Vulcan. It has been
verified against ABAQUS modelling on isolated beams. The influence of the buckling
element on the bolt-row force redistribution within the connection has then been
investigated in isolated beam case and a two-storey two-span plane frame.
6.2 CREATION OF THE COMPONENT-BASED MODEL
According to the analytical model, the force-deflection characteristics of the buckling
element can be divided into three stages, described as pre-buckling, plateau and post-
buckling. In the pre-buckling and plateau stages, the buckling element performs as an
ordinary beam element. In the post-buckling stage, the deflection of the buckling zone
is the sum of the deflection due to beam-web shear buckling and that caused by
bottom-flange buckling. The bottom-flange buckling causes an additional rotation of
the whole beam-end about its support (due mainly to local shortening of the bottom
flange in buckling), as shown in Figure 6-1 (a). It is assumed that the centre of rotation
is at the top corner of the beam-end (Point A in Figure 6-1 (a)), since the resistance of
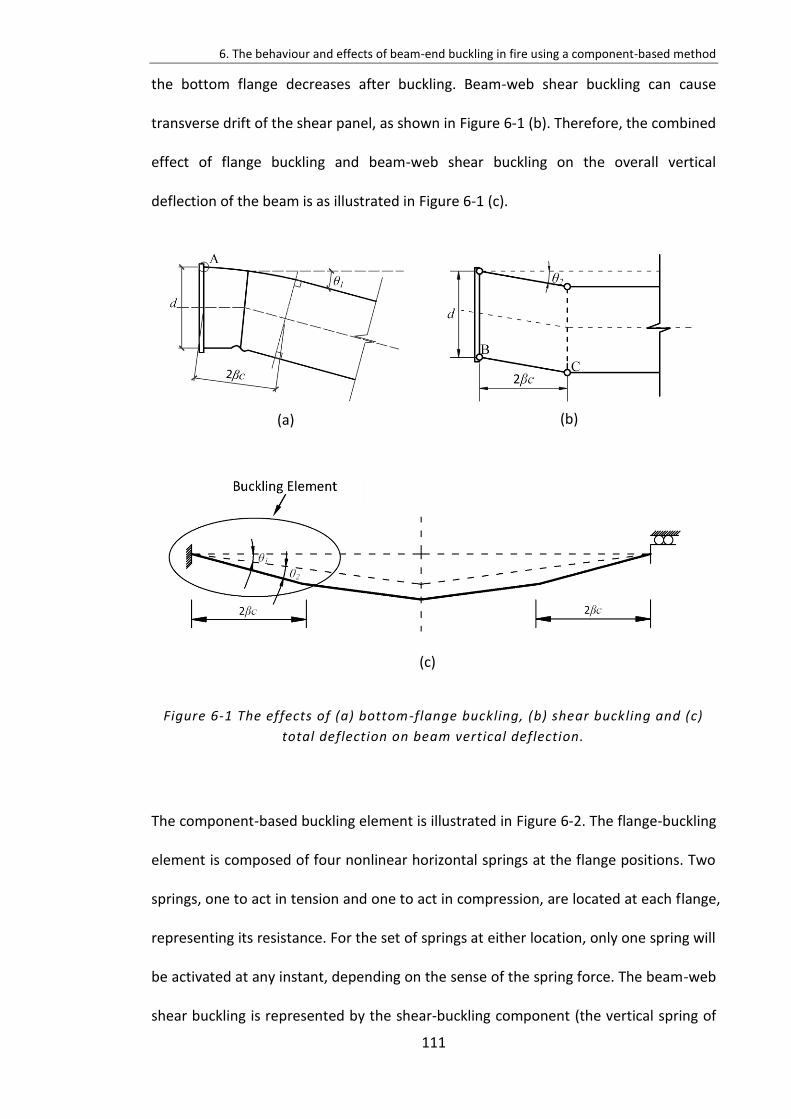
6. The behaviour and effects of beam-end buckling in fire using a component-based method
111
the bottom flange decreases after buckling. Beam-web shear buckling can cause
transverse drift of the shear panel, as shown in Figure 6-1 (b). Therefore, the combined
effect of flange buckling and beam-web shear buckling on the overall vertical
deflection of the beam is as illustrated in Figure 6-1 (c).
(a) (b)
(c)
Figure 6-1 The effects of (a) bottom-flange buckling, (b) shear buckling and (c)
total deflection on beam vertical deflection.
The component-based buckling element is illustrated in Figure 6-2. The flange-buckling
element is composed of four nonlinear horizontal springs at the flange positions. Two
springs, one to act in tension and one to act in compression, are located at each flange,
representing its resistance. For the set of springs at either location, only one spring will
be activated at any instant, depending on the sense of the spring force. The beam-web
shear buckling is represented by the shear-buckling component (the vertical spring of
(c)
6. The behaviour and effects of beam-end buckling in fire using a component-based method
112
the buckling element in Figure 6-2). The length of the component-based buckling
element is calculated according to Equation (6-1) on the basis of elastic buckling theory
(Timoshenko and Gere, 2009), which has been modified to consider the effects of
temperature and steel grade. In most fire tests only one shear-buckling wave has been
observed, and this is usually aligned at around 45ᵒ to the horizontal. Therefore, the
shear-buckling panel is not usually longer than the beam depth d, and the flange
buckling wave lies between the two plastic hinges (Points B and C in Figure 6-1 (b)) on
the bottom flange. Hence, it has been assumed that the flange-buckling wavelength
, calculated by Equation (6-1), is limited not to be longer than the beam depth d.
The connection element shown in Figure 6-2 is a typical component-based flush end-
plate connection. The compression springs in the connection element represent
column flange and end-plate in compression due to bending. The tension springs in the
connection element represent bolt rows in tension.
(6-1)
pL
3/41/4
,
2752 2 0.713 / / / (0.7 ) / 2p f w E y
y
L c d b t t k k d
L1=0 Lp
Connection Element
Fs
M
Ft
Buckling Element
Tension Springs
Compression Springs
A
Shear Springs
6. The behaviour and effects of beam-end buckling in fire using a component-based method
113
Figure 6-2 Component-based column-face connection and beam-end buckling
elements
6.3 LOADING AND UNLOADING PATHS OF THE BUCKLING ELEMENT
During the course of a fire, the beam-end buckling zones can experience complex
combinations of internal forces caused by high material nonlinearity and expansions
due to temperature variation, interacting with end-restraint conditions. In the model,
these forces will be resisted by the horizontal springs at the flanges. These springs can
be subject to either compression or tension at different stages of loading/heating. For
example, the bottom spring may be in compression during the initial heating phase,
and in tension in the high-temperature catenary stage. Therefore, it is essential to
establish a robust loading-unloading-reloading approach to deal with deformation
reversal at both constant and transient temperatures. The vertical shear spring does
not need a reversal path, as reversal of shear does not usually occur.
The Masing Rule (Chiang, 1999) was initially created to model the dynamic force-
deflection relationships of structural members under intensive cyclic seismic loading,
when the members were loaded into the nonlinear range. It has been widely applied
to deal with other engineering problems when the material is highly nonlinear and
when residual strains are highly affected by the load-deformation history. Researchers
(Block et al., 2007, Gerstle, 1988) have suggested that the Masing Rule could be used
to model semi-rigid connections in heating and cooling. In this research, the Masing
Rule is incorporated into the characteristic curve of each flange spring of the buckling
element, to enable modelling of the buckling panel under any possible loading-
unloading-reloading sequence during either constant or transient heating. The Masing
Rule has been modified for the post-buckling stage (after bottom-flange buckling
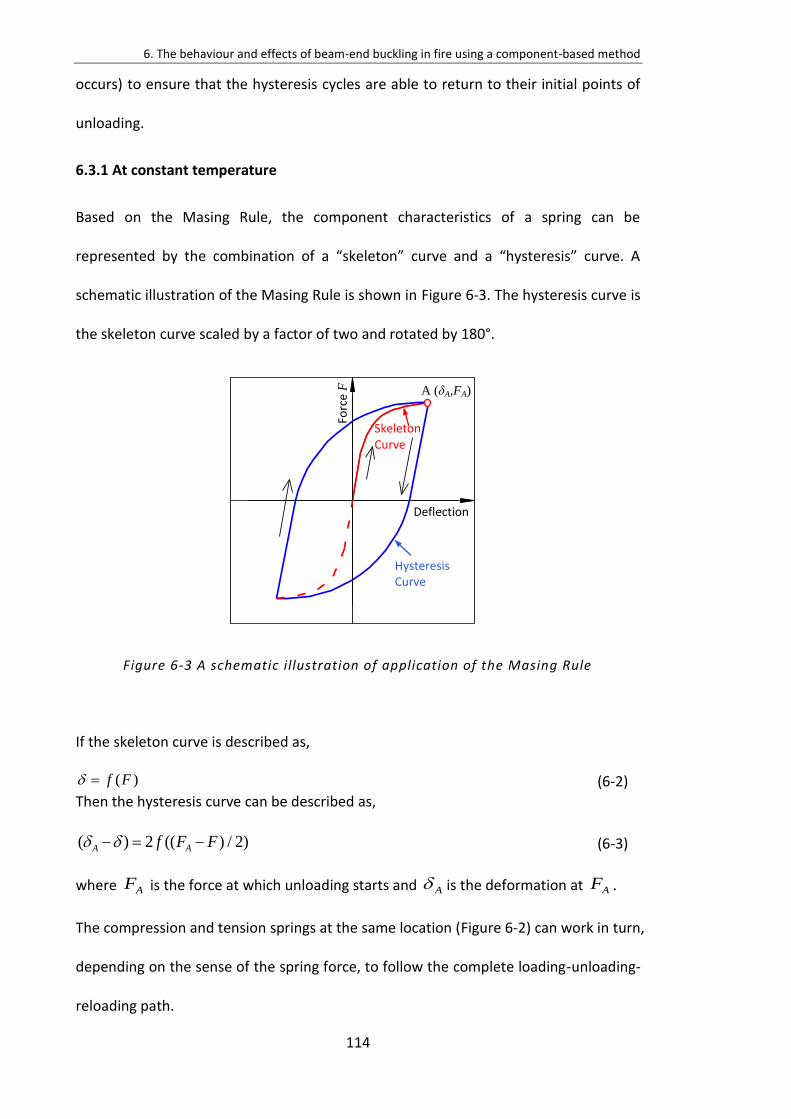
6. The behaviour and effects of beam-end buckling in fire using a component-based method
114
occurs) to ensure that the hysteresis cycles are able to return to their initial points of
unloading.
6.3.1 At constant temperature
Based on the Masing Rule, the component characteristics of a spring can be
represented by the combination of a “skeleton” curve and a “hysteresis” curve. A
schematic illustration of the Masing Rule is shown in Figure 6-3. The hysteresis curve is
the skeleton curve scaled by a factor of two and rotated by 180°.
Figure 6-3 A schematic illustration of application of the Masing Rule
If the skeleton curve is described as,
(6-2)
Then the hysteresis curve can be described as,
(6-3)
where is the force at which unloading starts and is the deformation at .
The compression and tension springs at the same location (Figure 6-2) can work in turn,
depending on the sense of the spring force, to follow the complete loading-unloading-
reloading path.
Forc
e F
Deflection
A (δA,FA)
Skeleton Curve
Hysteresis Curve
( )f F
( ) 2 (( ) / 2)A Af F F
AF A AF
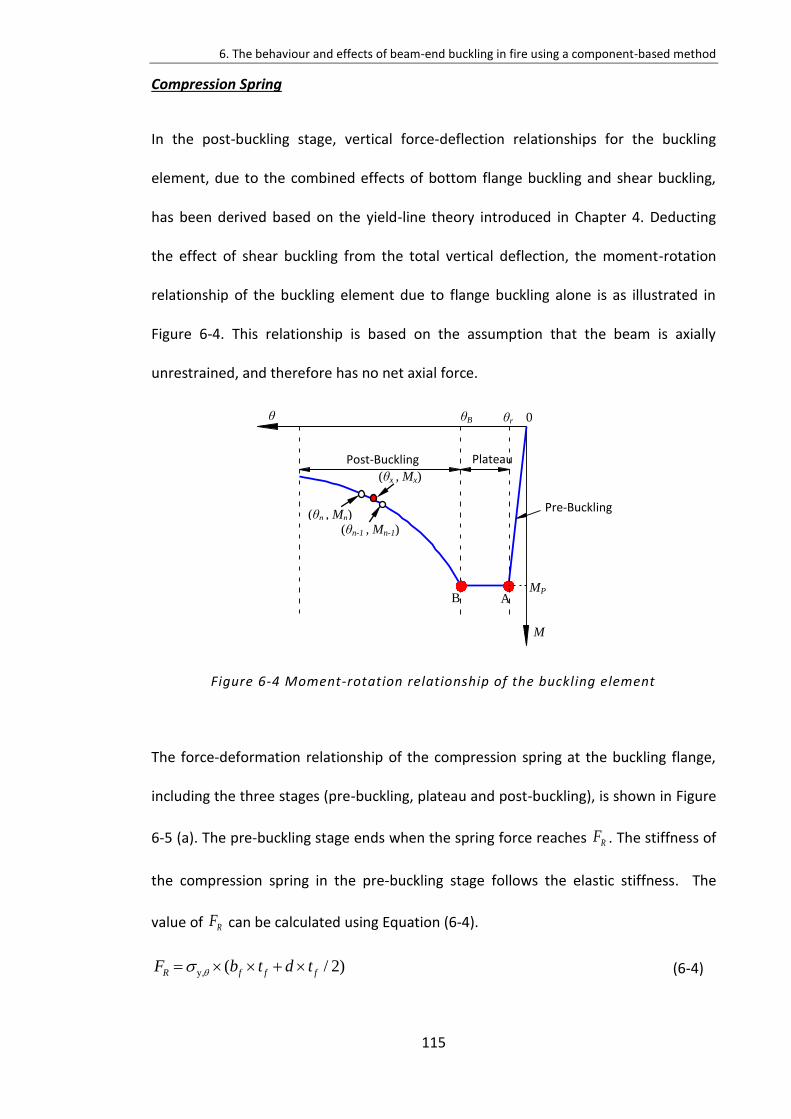
6. The behaviour and effects of beam-end buckling in fire using a component-based method
115
Compression Spring
In the post-buckling stage, vertical force-deflection relationships for the buckling
element, due to the combined effects of bottom flange buckling and shear buckling,
has been derived based on the yield-line theory introduced in Chapter 4. Deducting
the effect of shear buckling from the total vertical deflection, the moment-rotation
relationship of the buckling element due to flange buckling alone is as illustrated in
Figure 6-4. This relationship is based on the assumption that the beam is axially
unrestrained, and therefore has no net axial force.
Figure 6-4 Moment-rotation relationship of the buckling element
The force-deformation relationship of the compression spring at the buckling flange,
including the three stages (pre-buckling, plateau and post-buckling), is shown in Figure
6-5 (a). The pre-buckling stage ends when the spring force reaches . The stiffness of
the compression spring in the pre-buckling stage follows the elastic stiffness. The
value of can be calculated using Equation (6-4).
(6-4)
Plateau Post-Buckling
MP B A
M
θ θB 0
(θn , Mn) (θn-1 , Mn-1)
(θx , Mx)
Pre-Buckling
θr
RF
RF
y, ( / 2)R f f fF b t d t
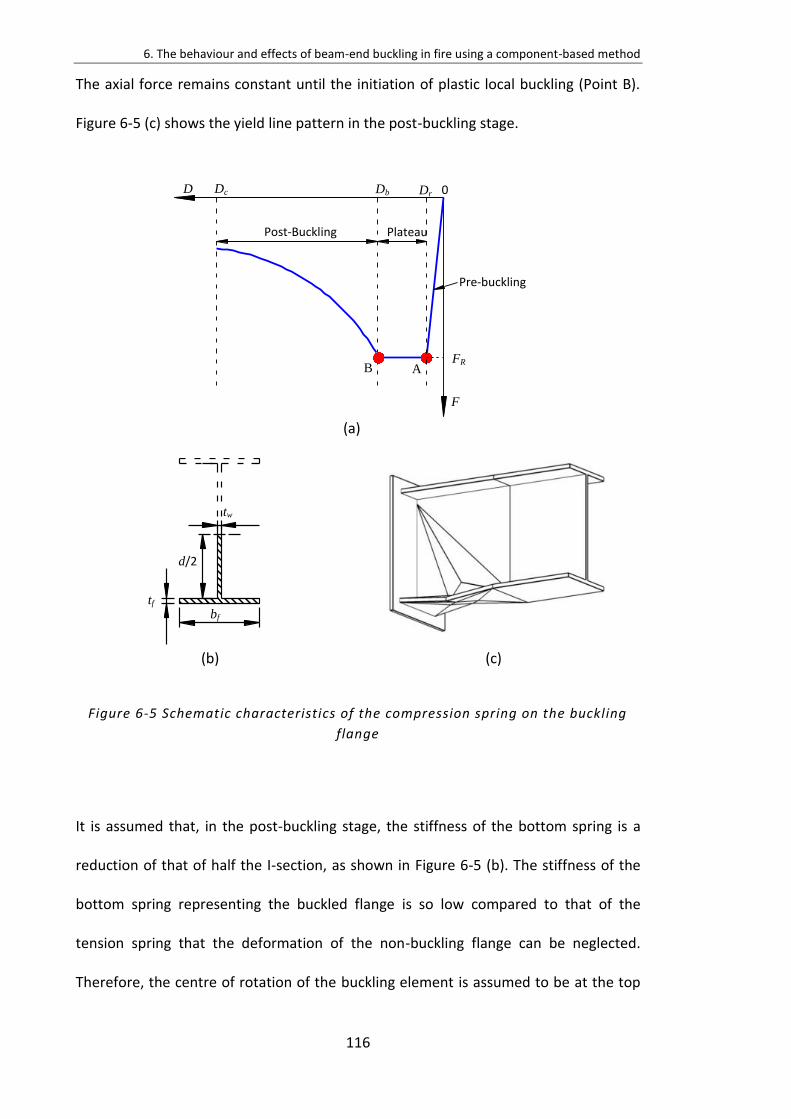
6. The behaviour and effects of beam-end buckling in fire using a component-based method
116
The axial force remains constant until the initiation of plastic local buckling (Point B).
Figure 6-5 (c) shows the yield line pattern in the post-buckling stage.
(a)
(b) (c)
Figure 6-5 Schematic characteristics of the compression spring on the buckling
flange
It is assumed that, in the post-buckling stage, the stiffness of the bottom spring is a
reduction of that of half the I-section, as shown in Figure 6-5 (b). The stiffness of the
bottom spring representing the buckled flange is so low compared to that of the
tension spring that the deformation of the non-buckling flange can be neglected.
Therefore, the centre of rotation of the buckling element is assumed to be at the top
Dc
Plateau Post-Buckling
FR
Db 0
B A
Pre-buckling
Dr
F
D
d/2
tf
bf
tw
6. The behaviour and effects of beam-end buckling in fire using a component-based method
117
flange, where the buckling element is connected to the connection element (Point A in
Figure 6-2). The compression spring deformation can be represented as:
(6-5)
For this axially unrestrained case, only the shear force and bending moment from the
connected beam are transferred to the buckling element. Therefore, the force
equilibrium within the buckling element gives:
(6-6)
(6-7)
where is the axial deformation of the buckled flange, is the moment about the
centre-line of the I-section, and and are the forces in the unbuckled (top for
this case) and buckled (bottom for this case) springs, respectively.
The analytical model in Chapter 4 can be used to determine the moment-rotation
relationship (Equation (6-8)) of the buckling element:
(6-8)
Substituting Eqs. (6-5) - (6-7) into Equation (6-8), the axial force-deformation
relationship of the buckled spring is:
2( ) /B BF f d (6-9)
The curved descending part of the moment-rotation relationship of the buckling
element has been simplified to a multi-linear relationship. The aim of the iteration
procedure is to work out the force-displacement curve for each iteration in the post-
buckling stage. The rotation at any given bending moment can be found through
linear interpolation within each linear increment (Figure 6-4). For any given , the
corresponding vertical movement Dx can be calculated. The compressive spring force
can be derived based on Equation (6-9) as:
B d
+ =0UB BF F
( ) 0.5UB BF F d M
B M
UBF BF
( )M f
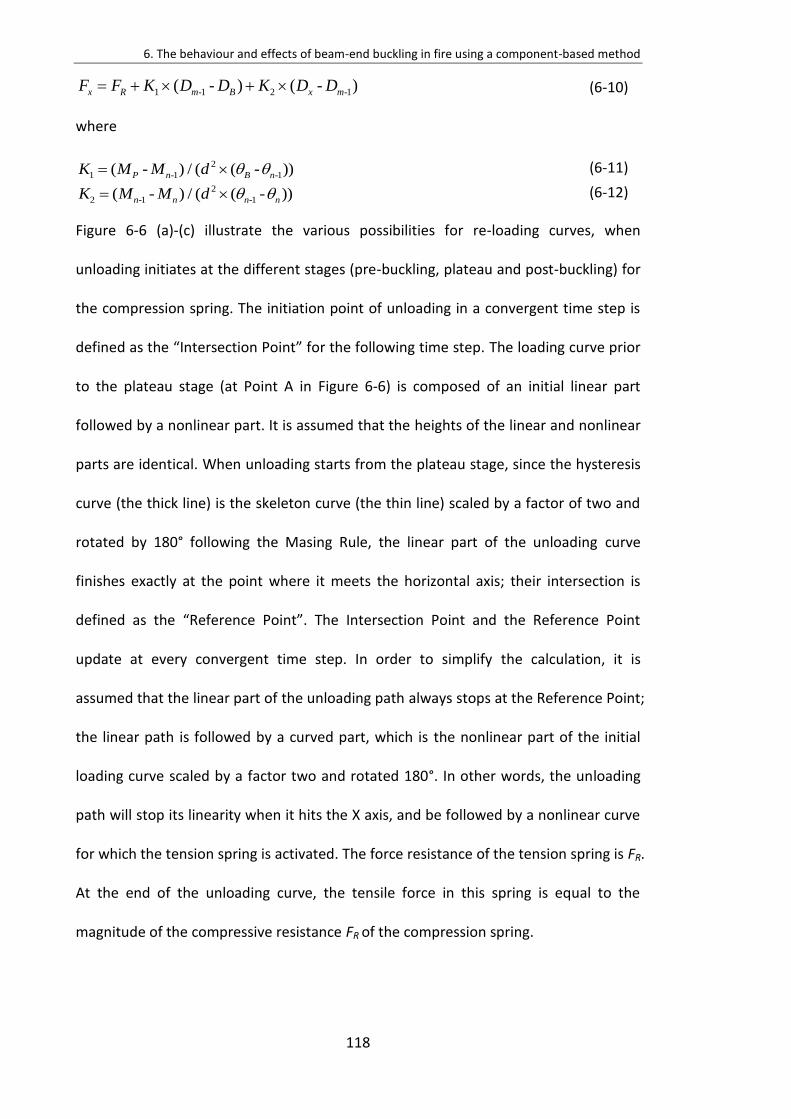
6. The behaviour and effects of beam-end buckling in fire using a component-based method
118
(6-10)
where
2
1 -1 -1( - ) / ( ( - ))P n B nK M M d (6-11)
2
2 -1 -1( - ) / ( ( - ))n n n nK M M d (6-12)
Figure 6-6 (a)-(c) illustrate the various possibilities for re-loading curves, when
unloading initiates at the different stages (pre-buckling, plateau and post-buckling) for
the compression spring. The initiation point of unloading in a convergent time step is
defined as the “Intersection oint” for the following time step. The loading curve prior
to the plateau stage (at Point A in Figure 6-6) is composed of an initial linear part
followed by a nonlinear part. It is assumed that the heights of the linear and nonlinear
parts are identical. When unloading starts from the plateau stage, since the hysteresis
curve (the thick line) is the skeleton curve (the thin line) scaled by a factor of two and
rotated by 180° following the Masing Rule, the linear part of the unloading curve
finishes exactly at the point where it meets the horizontal axis; their intersection is
defined as the “Reference oint”. The Intersection oint and the Reference oint
update at every convergent time step. In order to simplify the calculation, it is
assumed that the linear part of the unloading path always stops at the Reference Point;
the linear path is followed by a curved part, which is the nonlinear part of the initial
loading curve scaled by a factor two and rotated 180°. In other words, the unloading
path will stop its linearity when it hits the X axis, and be followed by a nonlinear curve
for which the tension spring is activated. The force resistance of the tension spring is FR.
At the end of the unloading curve, the tensile force in this spring is equal to the
magnitude of the compressive resistance FR of the compression spring.
1 -1 2 -1( - ) ( - )x R m B x mF F K D D K D D
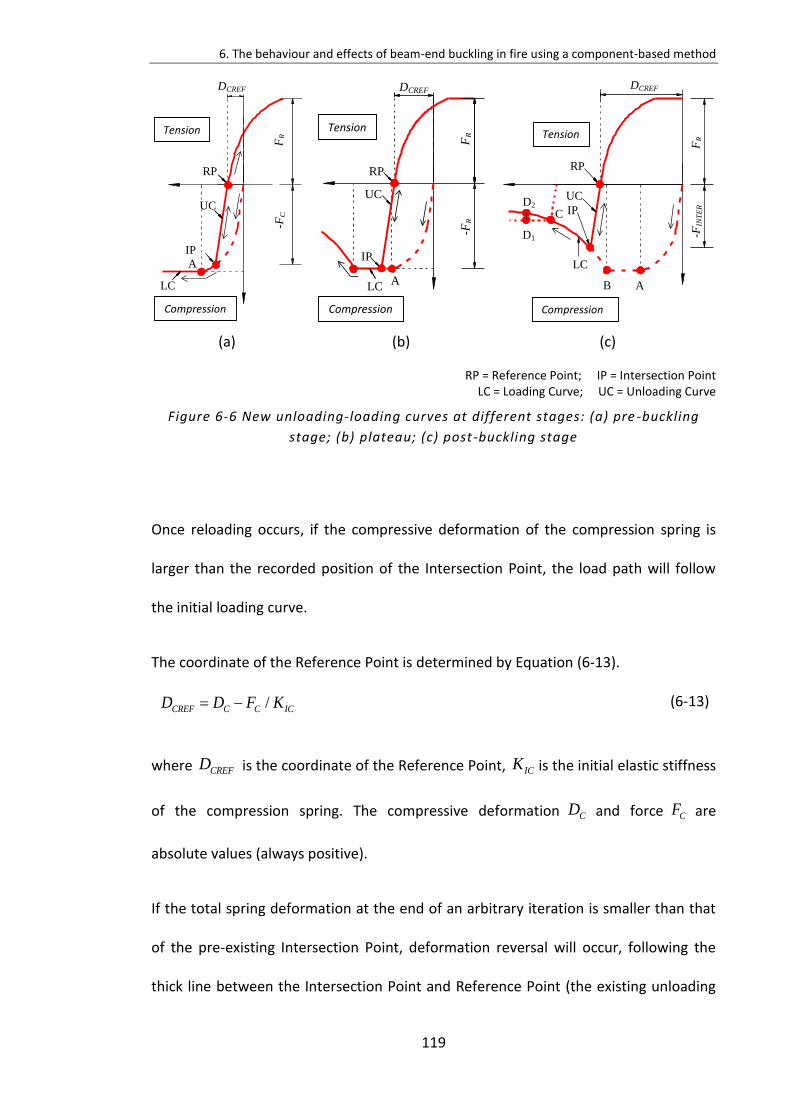
6. The behaviour and effects of beam-end buckling in fire using a component-based method
119
(a) (b) (c)
RP = Reference Point; IP = Intersection Point LC = Loading Curve; UC = Unloading Curve
Figure 6-6 New unloading-loading curves at different stages: (a) pre -buckling
stage; (b) plateau; (c) post-buckling stage
Once reloading occurs, if the compressive deformation of the compression spring is
larger than the recorded position of the Intersection Point, the load path will follow
the initial loading curve.
The coordinate of the Reference Point is determined by Equation (6-13).
(6-13)
where is the coordinate of the Reference Point, is the initial elastic stiffness
of the compression spring. The compressive deformation and force are
absolute values (always positive).
If the total spring deformation at the end of an arbitrary iteration is smaller than that
of the pre-existing Intersection Point, deformation reversal will occur, following the
thick line between the Intersection Point and Reference Point (the existing unloading
RP
IP
A
LC
UC
Compression
Tension
-FC
FR
DCREF
RP
IP
A LC
UC
Tension
Compression
-FR
FR
DCREF
RP
IP
A B
UC
LC
Tension
Compression
FR
-FIN
TE
R
DCREF
C
D1
D2
/CREF C C ICD D F K
CREFD ICK
CD CF
6. The behaviour and effects of beam-end buckling in fire using a component-based method
120
path). The slope of the unloading path is equal to the initial elastic stiffness at the
relevant temperature. The compression force on the unloading curve is:
(6-14)
For an arbitrary iteration, the spring force can be calculated based on the spring
deformation of the previous iteration. In the post-buckling stage, the spring stiffness
on the loading path is negative. This negative stiffness leads to the situation that one
force corresponds to two possible deformations (one on the loading path, one on the
unloading path). In order to avoid this numerical singularity, the following approach
has been proposed. Point C is assumed to be the start of an arbitrary iteration (Figure
6-6 (c)). For the loading path, a ‘zero’ stiffness (instead of a negative stiffness) is
assumed to define the start of the next iteration. The unloading path remains
unchanged. The loading and unloading paths become the dashed lines starting from
Point C. When the internal force is larger than the external, the iteration will follow the
unloading path. Otherwise, the loading path is adopted, in which case Point D1 is
assumed to be the end of this iteration. The position of D1 depends on the size of the
iteration step. In the next iteration Point D2, which has the same deformation as that
of Point D1, will be used as the starting point, but the spring force is calculated based
on the descending post-buckling curve. At the end of each iteration, the difference
between the internal and external forces is checked; this iterative process stops when
a balance between the external and internal forces is found.
The deformation of the compression spring can be calculated according to the
differential displacement of the two nodes of the buckling element. When the spring
deformation is on the unloading path above the Reference Point (Point RP in Figure
ICK
( - )C INTER INTER C ICF F D D K
CD
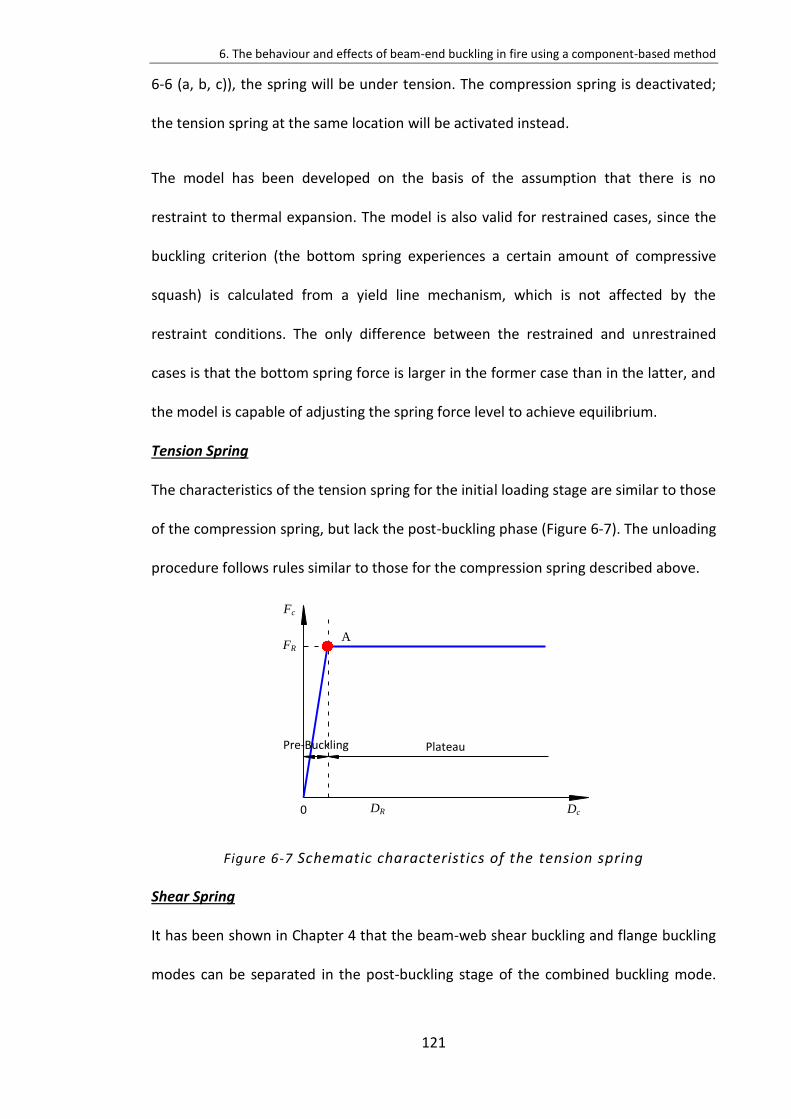
6. The behaviour and effects of beam-end buckling in fire using a component-based method
121
6-6 (a, b, c)), the spring will be under tension. The compression spring is deactivated;
the tension spring at the same location will be activated instead.
The model has been developed on the basis of the assumption that there is no
restraint to thermal expansion. The model is also valid for restrained cases, since the
buckling criterion (the bottom spring experiences a certain amount of compressive
squash) is calculated from a yield line mechanism, which is not affected by the
restraint conditions. The only difference between the restrained and unrestrained
cases is that the bottom spring force is larger in the former case than in the latter, and
the model is capable of adjusting the spring force level to achieve equilibrium.
Tension Spring
The characteristics of the tension spring for the initial loading stage are similar to those
of the compression spring, but lack the post-buckling phase (Figure 6-7). The unloading
procedure follows rules similar to those for the compression spring described above.
Figure 6-7 Schematic characteristics of the tension spring
Shear Spring
It has been shown in Chapter 4 that the beam-web shear buckling and flange buckling
modes can be separated in the post-buckling stage of the combined buckling mode.
A
Plateau Pre-Buckling
FR
Dc DR 0
Fc
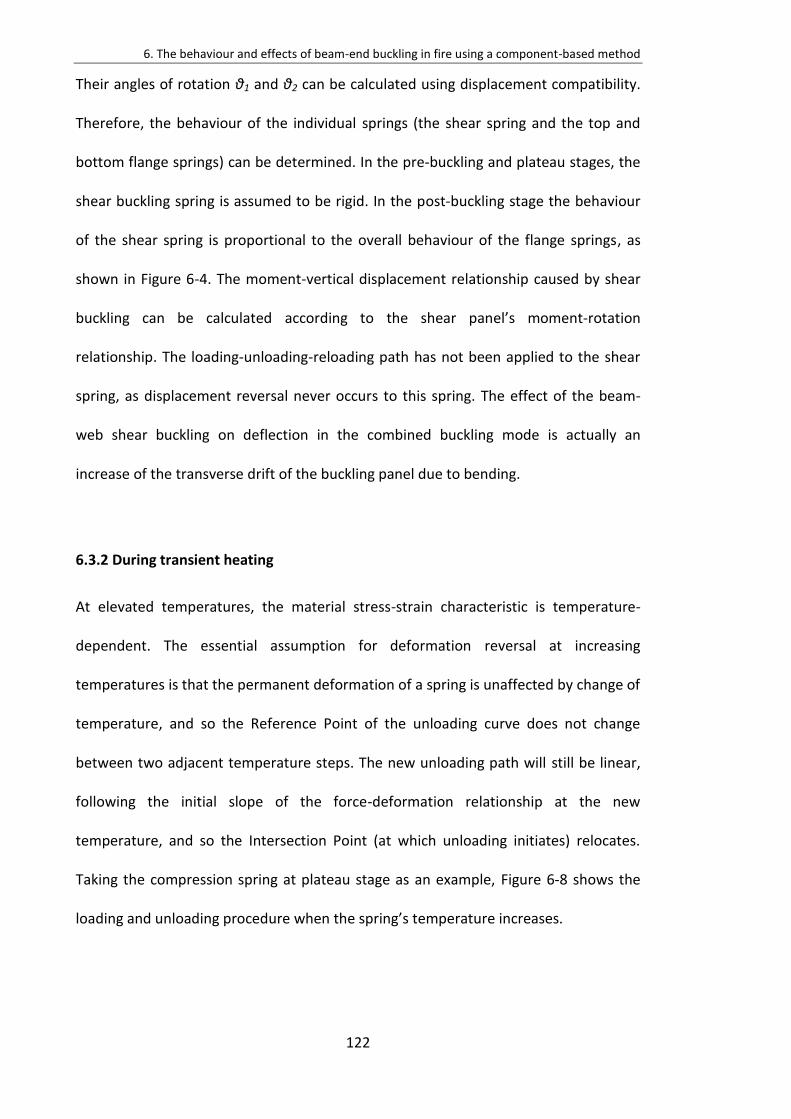
6. The behaviour and effects of beam-end buckling in fire using a component-based method
122
Their angles of rotation θ1 and θ2 can be calculated using displacement compatibility.
Therefore, the behaviour of the individual springs (the shear spring and the top and
bottom flange springs) can be determined. In the pre-buckling and plateau stages, the
shear buckling spring is assumed to be rigid. In the post-buckling stage the behaviour
of the shear spring is proportional to the overall behaviour of the flange springs, as
shown in Figure 6-4. The moment-vertical displacement relationship caused by shear
buckling can be calculated according to the shear panel’s moment-rotation
relationship. The loading-unloading-reloading path has not been applied to the shear
spring, as displacement reversal never occurs to this spring. The effect of the beam-
web shear buckling on deflection in the combined buckling mode is actually an
increase of the transverse drift of the buckling panel due to bending.
6.3.2 During transient heating
At elevated temperatures, the material stress-strain characteristic is temperature-
dependent. The essential assumption for deformation reversal at increasing
temperatures is that the permanent deformation of a spring is unaffected by change of
temperature, and so the Reference Point of the unloading curve does not change
between two adjacent temperature steps. The new unloading path will still be linear,
following the initial slope of the force-deformation relationship at the new
temperature, and so the Intersection Point (at which unloading initiates) relocates.
Taking the compression spring at plateau stage as an example, Figure 6-8 shows the
loading and unloading procedure when the spring’s temperature increases.
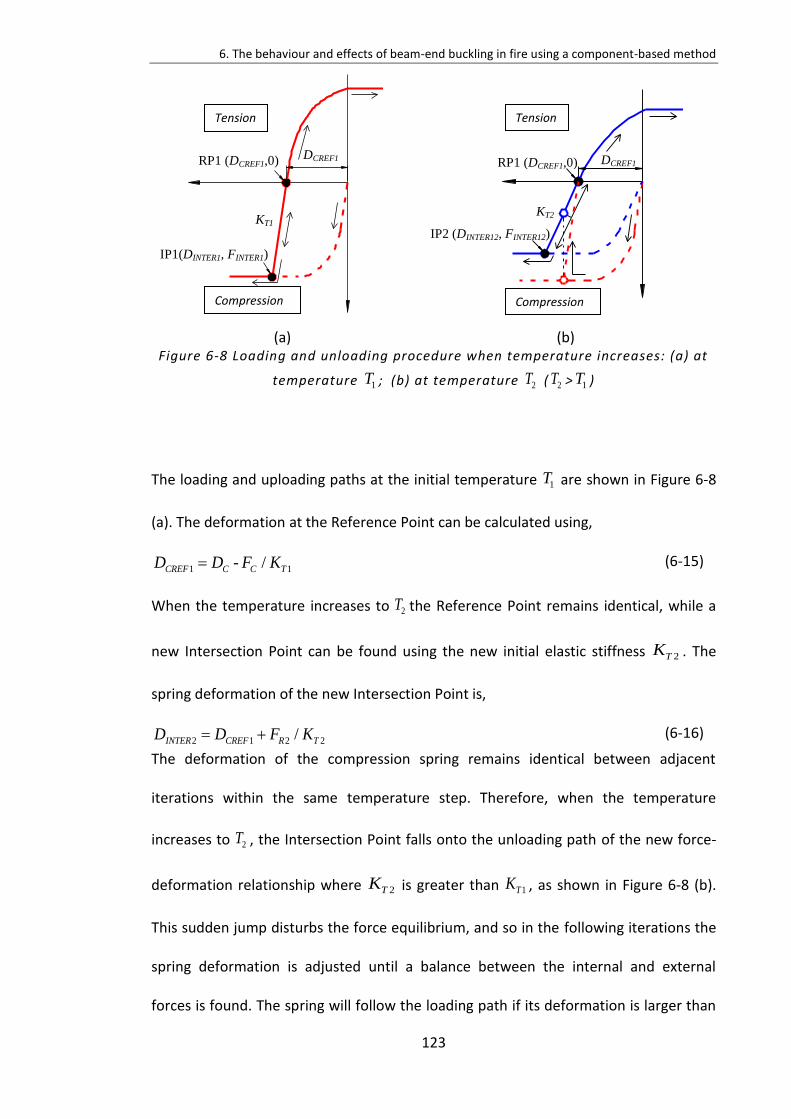
6. The behaviour and effects of beam-end buckling in fire using a component-based method
123
(a)
(b) Figure 6-8 Loading and unloading procedure when temperature increases: (a) at
temperature ; (b) at temperature ( > )
The loading and uploading paths at the initial temperature are shown in Figure 6-8
(a). The deformation at the Reference Point can be calculated using,
(6-15)
When the temperature increases to the Reference Point remains identical, while a
new Intersection Point can be found using the new initial elastic stiffness . The
spring deformation of the new Intersection Point is,
(6-16)
The deformation of the compression spring remains identical between adjacent
iterations within the same temperature step. Therefore, when the temperature
increases to , the Intersection Point falls onto the unloading path of the new force-
deformation relationship where is greater than , as shown in Figure 6-8 (b).
This sudden jump disturbs the force equilibrium, and so in the following iterations the
spring deformation is adjusted until a balance between the internal and external
forces is found. The spring will follow the loading path if its deformation is larger than
RP1 (DCREF1,0)
IP1(DINTER1, FINTER1)
KT1
DCREF1
Tension
Compression
KT2
DCREF1 RP1 (DCREF1,0)
IP2 (DINTER12, FINTER12)
Tension
Compression
1T 2T 2T 1T
1T
1 1- /CREF C C TD D F K
2T
2TK
2 1 2 2/INTER CREF R TD D F K
2T
2TK 1TK
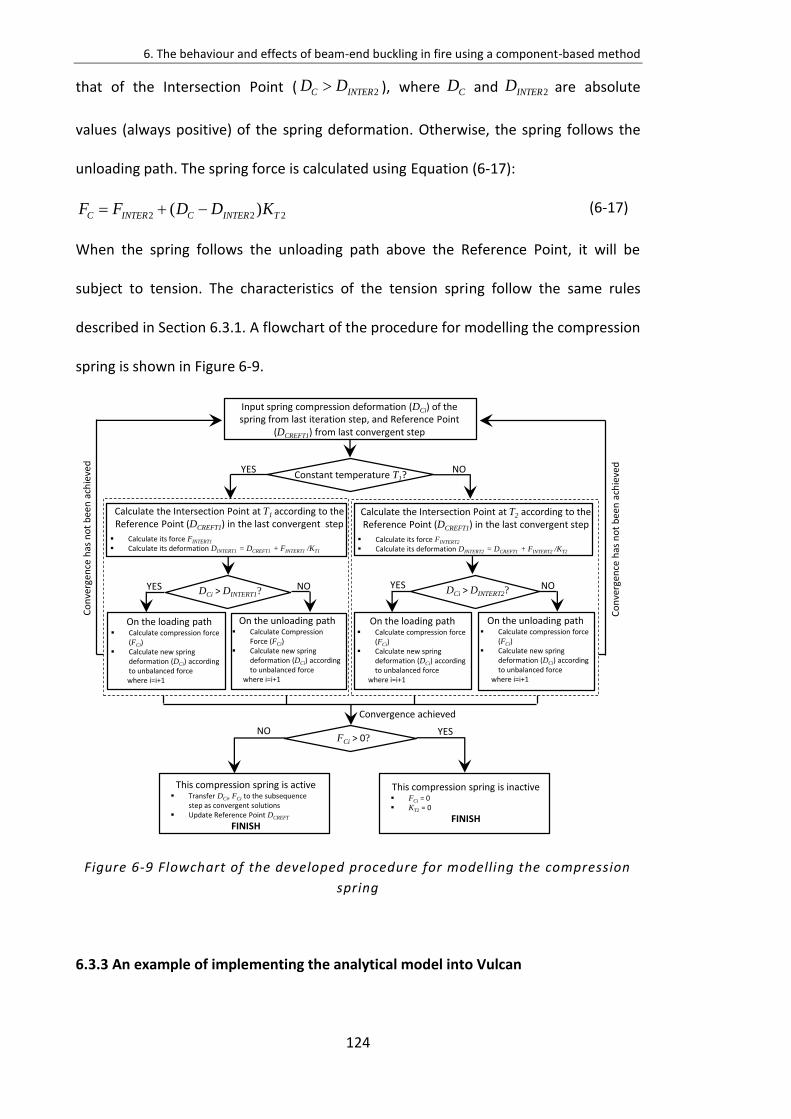
6. The behaviour and effects of beam-end buckling in fire using a component-based method
124
that of the Intersection Point ( ), where and are absolute
values (always positive) of the spring deformation. Otherwise, the spring follows the
unloading path. The spring force is calculated using Equation (6-17):
(6-17)
When the spring follows the unloading path above the Reference Point, it will be
subject to tension. The characteristics of the tension spring follow the same rules
described in Section 6.3.1. A flowchart of the procedure for modelling the compression
spring is shown in Figure 6-9.
Figure 6-9 Flowchart of the developed procedure for modelling the compression
spring
6.3.3 An example of implementing the analytical model into Vulcan
2C INTERD D CD 2INTERD
2 2 2( )C INTER C INTER TF F D D K
Input spring compression deformation (DCi) of the spring from last iteration step, and Reference Point
(DCREFT1) from last convergent step
YES NO
Calculate the Intersection Point at T1 according to the Reference Point (DCREFT1) in the last convergent step
Calculate its force FINTERT1
Calculate its deformation DINTERT1 = DCREFT1 + FINTERT1 /KT1
FCi > 0?
This compression spring is inactive FCi = 0 KT2 = 0
FINISH
NO
Constant temperature T1?
DCi > DINTERT1?
On the loading path Calculate compression force
(FCi) Calculate new spring
deformation (DCi) according to unbalanced forcewhere i=i+1
On the unloading path Calculate Compression
Force (FCi) Calculate new spring
deformation (DCi) according to unbalanced force
where i=i+1
NOYES
Calculate the Intersection Point at T2 according to the Reference Point (DCREFT1) in the last convergent step
Calculate its force FINTERT2
Calculate its deformation DINTERT2 = DCREFT1 + FINTERT2 /KT2
DCi > DINTERT2?
On the loading path Calculate compression force
(FCi) Calculate new spring
deformation (DCi) according to unbalanced force
where i=i+1
On the unloading path Calculate compression force
(FCi) Calculate new spring
deformation (DCi) according to unbalanced force
where i=i+1
NOYES
YES
This compression spring is active Transfer DCi, FCi to the subsequence
step as convergent solutions Update Reference Point DCREFT
FINISH
Co
nve
rgen
ce h
as n
ot
bee
n a
chie
ved
Convergence achieved
Co
nve
rgen
ce h
as n
ot
bee
n a
chie
ved
6. The behaviour and effects of beam-end buckling in fire using a component-based method
125
In this section, a step-by-step calculation example of implementing the analytical
model demonstrated in Chapter 4 will be presented. The example is an isolated beam,
6m fixed-ended beam with one buckling element on each side. The beam section is
UB356x171x51. The beam was firstly uniformly loaded at ambient temperature up to
the load ratio reaches 0.4 (26.8kN/m), and was subsequently be heated to 750ᵒC
following standard fire curve.
Step 1:
At ambient temperature, the stiffness of both the top and bottom springs is
, ( 0.5 )
210000 (171.5 11.5 0.5 343.5 7.4) 681072000 /
f wKINI E b t d t
N mm
(6-18)
The shear spring is assumed to be rigid. The stiffness of the shear spring is defined to
be 1.0x10²⁰.
An iteration procedure is applied to the program to calculate the force-deflection
curve of the buckling element of each step, given that the stiffness of each flange
spring is given in Equation (6-18). The ambient-temperature calculation is always
within the pre-buckling stage.
Step 2:
At elevated temperatures, both the material Young’s Modulus and the Yield Stress
have been reduced. Axial force is created due to the restraint of thermal expansion.
The axial force, as well as the bending moment at the end of the buckling element,
creates large compression force on the bottom compressive spring. When the
compression force reaches the value shown in Equation (6-19), the compression spring
enters the plateau stage.
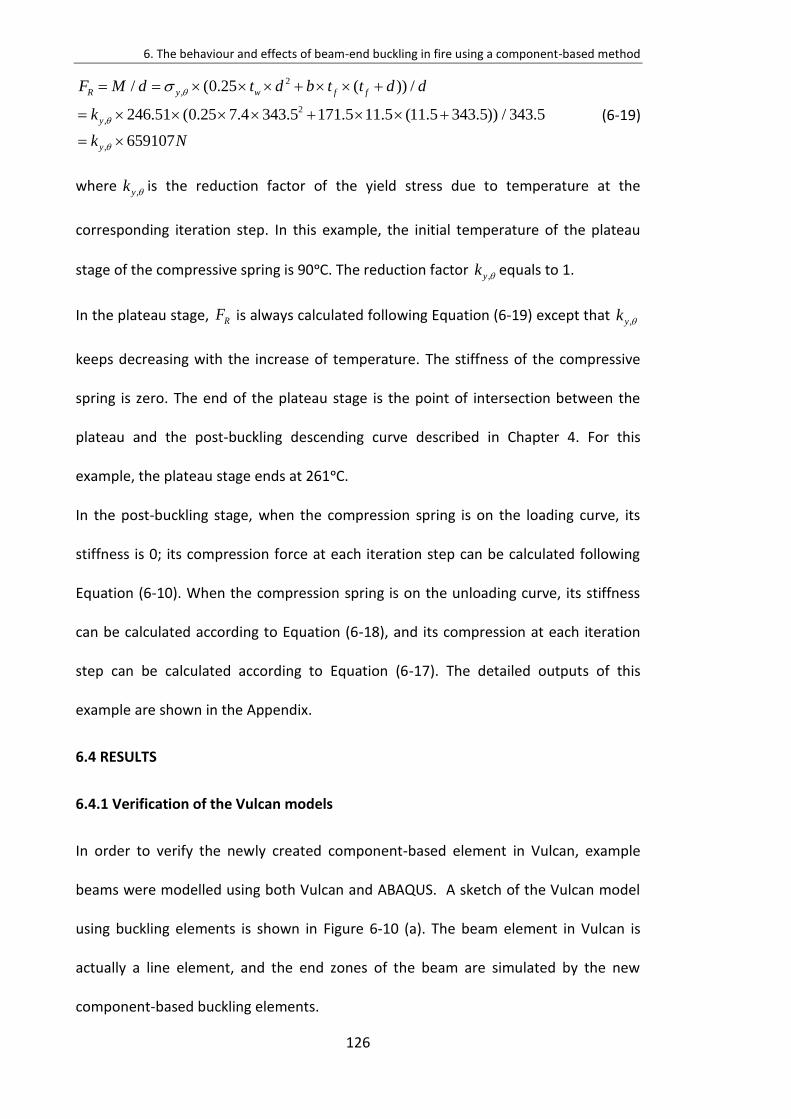
6. The behaviour and effects of beam-end buckling in fire using a component-based method
126
2
,
2
,
,
/ (0.25 ( )) /
246.51 (0.25 7.4 343.5 171.5 11.5 (11.5 343.5)) / 343.5
659107
R y w f f
y
y
F M d t d b t t d d
k
k N
(6-19)
where ,yk is the reduction factor of the yield stress due to temperature at the
corresponding iteration step. In this example, the initial temperature of the plateau
stage of the compressive spring is 90ᵒC. The reduction factor ,yk equals to 1.
In the plateau stage, RF is always calculated following Equation (6-19) except that ,yk
keeps decreasing with the increase of temperature. The stiffness of the compressive
spring is zero. The end of the plateau stage is the point of intersection between the
plateau and the post-buckling descending curve described in Chapter 4. For this
example, the plateau stage ends at 261ᵒC.
In the post-buckling stage, when the compression spring is on the loading curve, its
stiffness is 0; its compression force at each iteration step can be calculated following
Equation (6-10). When the compression spring is on the unloading curve, its stiffness
can be calculated according to Equation (6-18), and its compression at each iteration
step can be calculated according to Equation (6-17). The detailed outputs of this
example are shown in the Appendix.
6.4 RESULTS
6.4.1 Verification of the Vulcan models
In order to verify the newly created component-based element in Vulcan, example
beams were modelled using both Vulcan and ABAQUS. A sketch of the Vulcan model
using buckling elements is shown in Figure 6-10 (a). The beam element in Vulcan is
actually a line element, and the end zones of the beam are simulated by the new
component-based buckling elements.
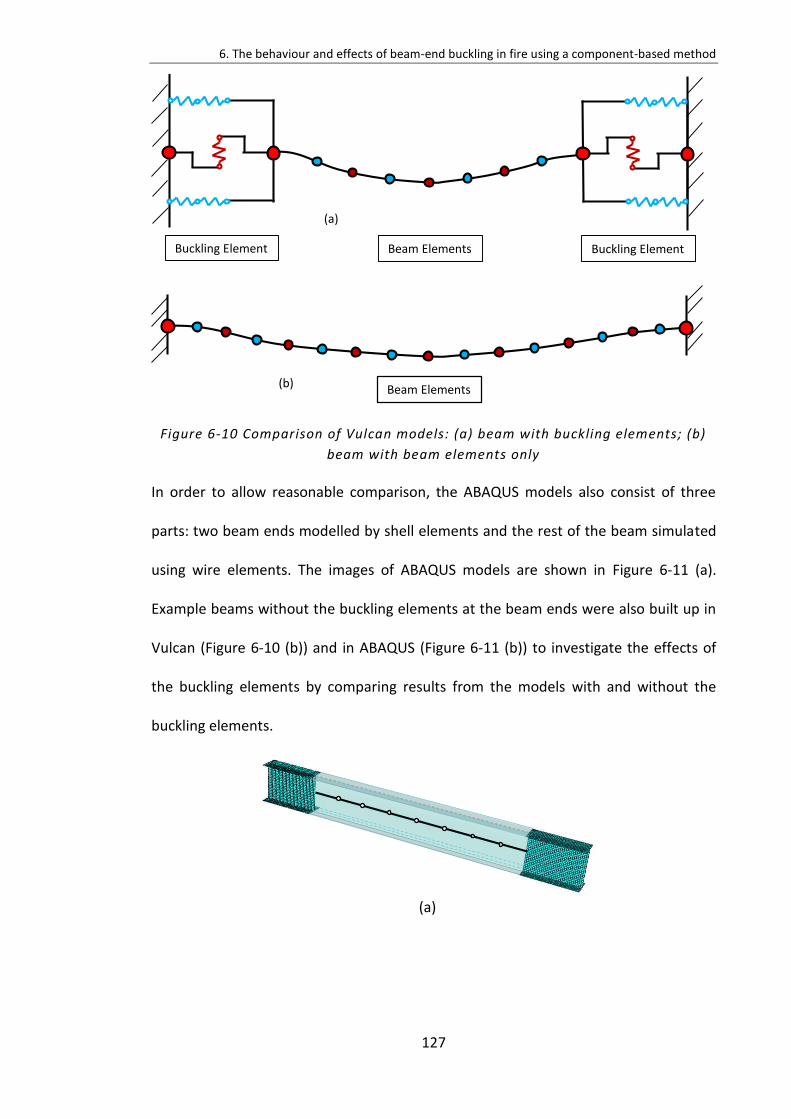
6. The behaviour and effects of beam-end buckling in fire using a component-based method
127
Figure 6-10 Comparison of Vulcan models: (a) beam with buckling elements; (b)
beam with beam elements only
In order to allow reasonable comparison, the ABAQUS models also consist of three
parts: two beam ends modelled by shell elements and the rest of the beam simulated
using wire elements. The images of ABAQUS models are shown in Figure 6-11 (a).
Example beams without the buckling elements at the beam ends were also built up in
Vulcan (Figure 6-10 (b)) and in ABAQUS (Figure 6-11 (b)) to investigate the effects of
the buckling elements by comparing results from the models with and without the
buckling elements.
(a)
Buckling Element Buckling ElementBeam Elements
(a)
Beam Elements(b)
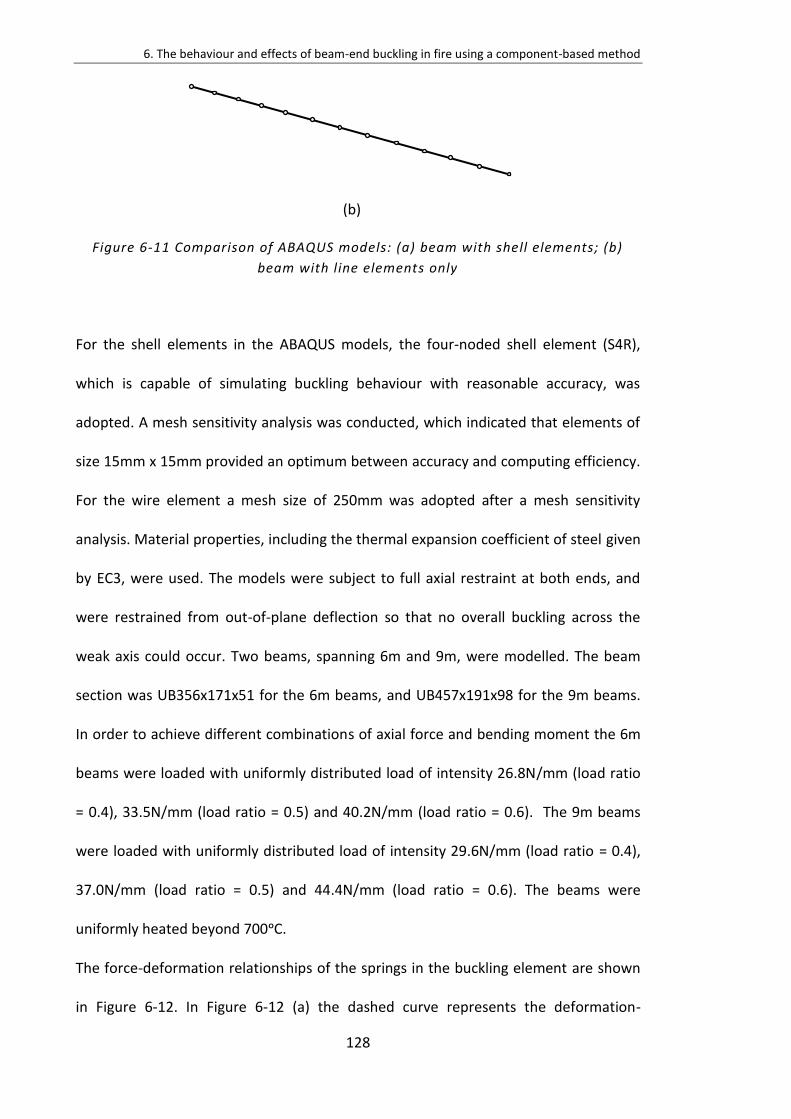
6. The behaviour and effects of beam-end buckling in fire using a component-based method
128
(b)
Figure 6-11 Comparison of ABAQUS models: (a) beam with shell elements; (b)
beam with line elements only
For the shell elements in the ABAQUS models, the four-noded shell element (S4R),
which is capable of simulating buckling behaviour with reasonable accuracy, was
adopted. A mesh sensitivity analysis was conducted, which indicated that elements of
size 15mm x 15mm provided an optimum between accuracy and computing efficiency.
For the wire element a mesh size of 250mm was adopted after a mesh sensitivity
analysis. Material properties, including the thermal expansion coefficient of steel given
by EC3, were used. The models were subject to full axial restraint at both ends, and
were restrained from out-of-plane deflection so that no overall buckling across the
weak axis could occur. Two beams, spanning 6m and 9m, were modelled. The beam
section was UB356x171x51 for the 6m beams, and UB457x191x98 for the 9m beams.
In order to achieve different combinations of axial force and bending moment the 6m
beams were loaded with uniformly distributed load of intensity 26.8N/mm (load ratio
= 0.4), 33.5N/mm (load ratio = 0.5) and 40.2N/mm (load ratio = 0.6). The 9m beams
were loaded with uniformly distributed load of intensity 29.6N/mm (load ratio = 0.4),
37.0N/mm (load ratio = 0.5) and 44.4N/mm (load ratio = 0.6). The beams were
uniformly heated beyond 700ᵒC.
The force-deformation relationships of the springs in the buckling element are shown
in Figure 6-12. In Figure 6-12 (a) the dashed curve represents the deformation-
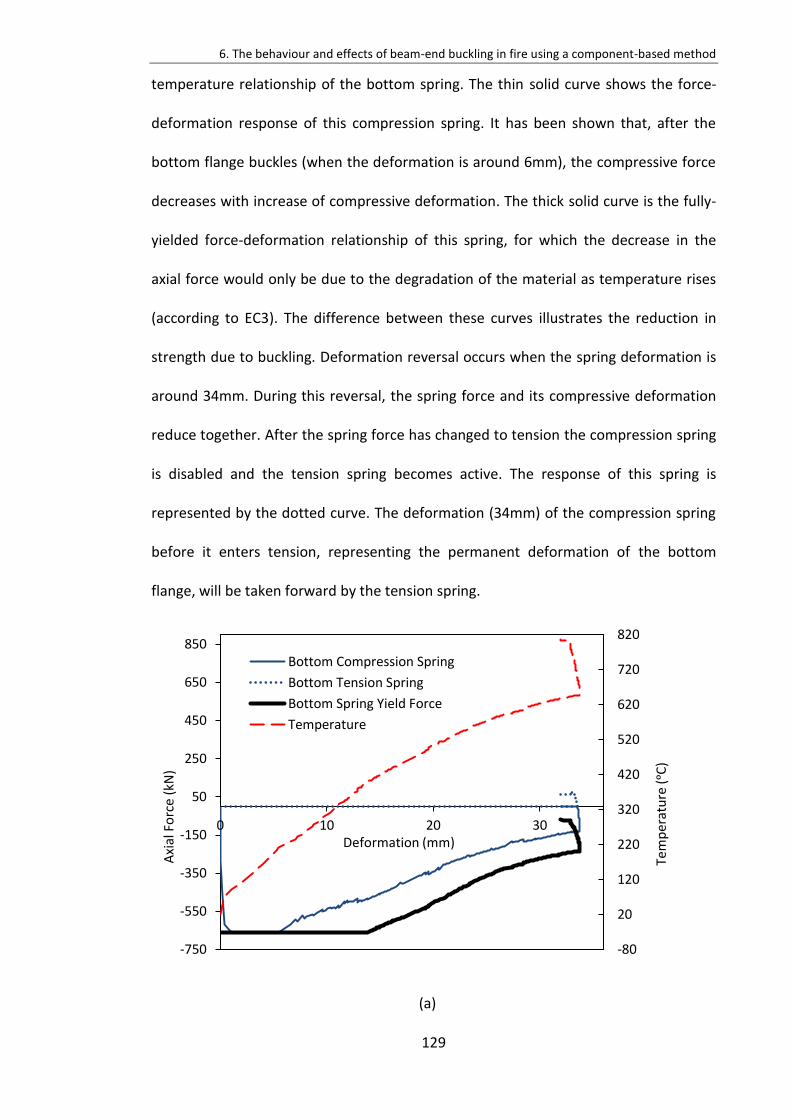
6. The behaviour and effects of beam-end buckling in fire using a component-based method
129
temperature relationship of the bottom spring. The thin solid curve shows the force-
deformation response of this compression spring. It has been shown that, after the
bottom flange buckles (when the deformation is around 6mm), the compressive force
decreases with increase of compressive deformation. The thick solid curve is the fully-
yielded force-deformation relationship of this spring, for which the decrease in the
axial force would only be due to the degradation of the material as temperature rises
(according to EC3). The difference between these curves illustrates the reduction in
strength due to buckling. Deformation reversal occurs when the spring deformation is
around 34mm. During this reversal, the spring force and its compressive deformation
reduce together. After the spring force has changed to tension the compression spring
is disabled and the tension spring becomes active. The response of this spring is
represented by the dotted curve. The deformation (34mm) of the compression spring
before it enters tension, representing the permanent deformation of the bottom
flange, will be taken forward by the tension spring.
(a)
-80
20
120
220
320
420
520
620
720
820
-750
-550
-350
-150
50
250
450
650
850
0 10 20 30
Temperature (ᵒC)
Axi
al F
orc
e (k
N)
Deformation (mm)
Bottom Compression Spring
Bottom Tension Spring
Bottom Spring Yield Force
Temperature
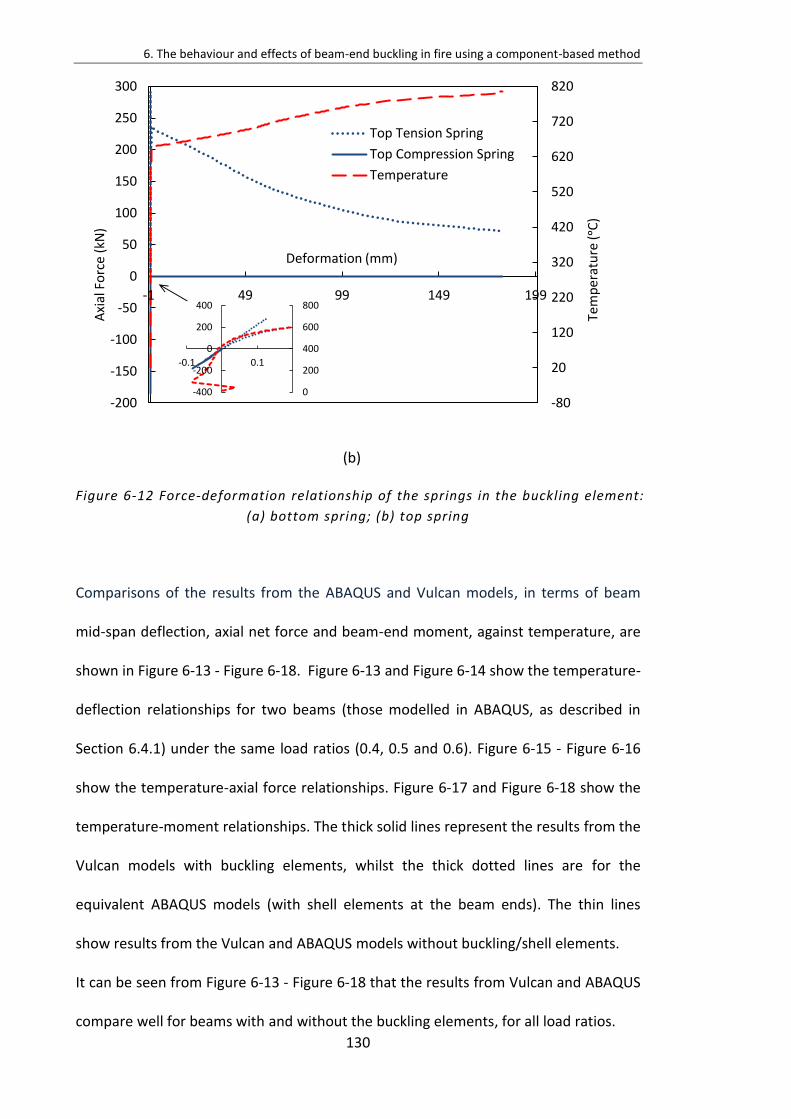
6. The behaviour and effects of beam-end buckling in fire using a component-based method
130
(b)
Figure 6-12 Force-deformation relationship of the springs in the buckling element:
(a) bottom spring; (b) top spring
Comparisons of the results from the ABAQUS and Vulcan models, in terms of beam
mid-span deflection, axial net force and beam-end moment, against temperature, are
shown in Figure 6-13 - Figure 6-18. Figure 6-13 and Figure 6-14 show the temperature-
deflection relationships for two beams (those modelled in ABAQUS, as described in
Section 6.4.1) under the same load ratios (0.4, 0.5 and 0.6). Figure 6-15 - Figure 6-16
show the temperature-axial force relationships. Figure 6-17 and Figure 6-18 show the
temperature-moment relationships. The thick solid lines represent the results from the
Vulcan models with buckling elements, whilst the thick dotted lines are for the
equivalent ABAQUS models (with shell elements at the beam ends). The thin lines
show results from the Vulcan and ABAQUS models without buckling/shell elements.
It can be seen from Figure 6-13 - Figure 6-18 that the results from Vulcan and ABAQUS
compare well for beams with and without the buckling elements, for all load ratios.
-80
20
120
220
320
420
520
620
720
820
-200
-150
-100
-50
0
50
100
150
200
250
300
-1 49 99 149 199
Temperature (ᵒC)
Axi
al F
orc
e (k
N)
Deformation (mm)
Top Tension Spring
Top Compression Spring
Temperature
0
200
400
600
800
-400
-200
0
200
400
-0.1 0.1
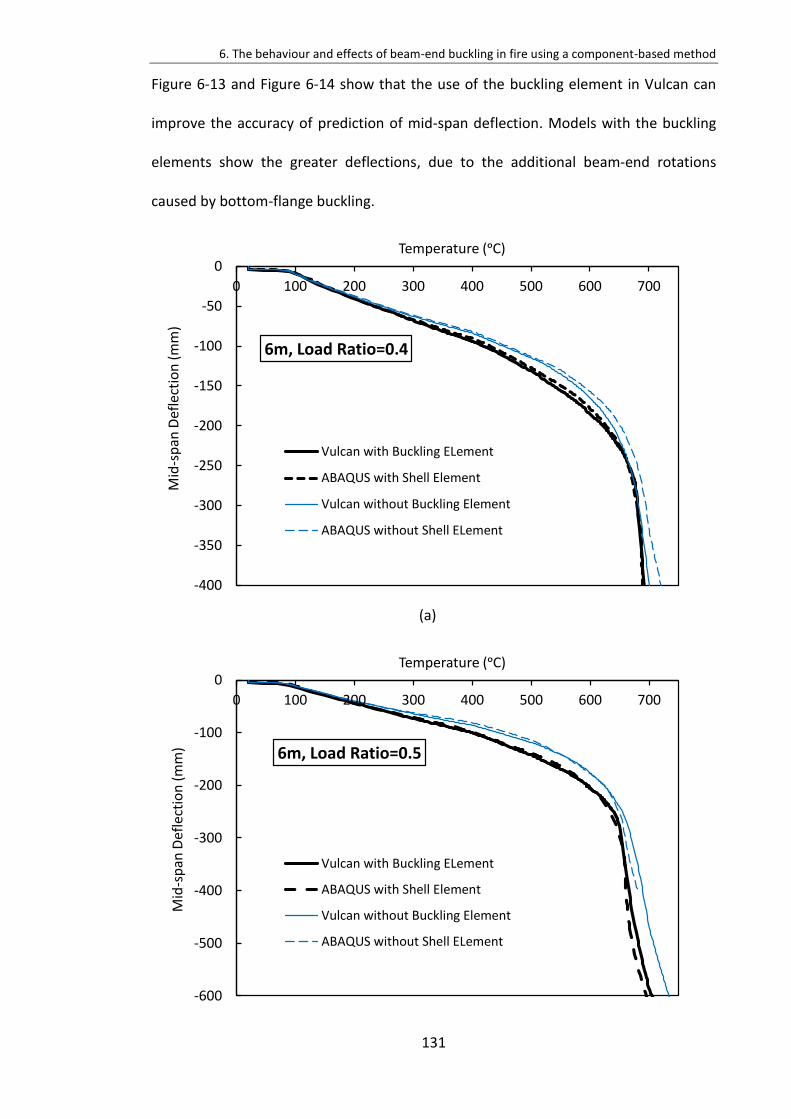
6. The behaviour and effects of beam-end buckling in fire using a component-based method
131
Figure 6-13 and Figure 6-14 show that the use of the buckling element in Vulcan can
improve the accuracy of prediction of mid-span deflection. Models with the buckling
elements show the greater deflections, due to the additional beam-end rotations
caused by bottom-flange buckling.
(a)
-400
-350
-300
-250
-200
-150
-100
-50
0
0 100 200 300 400 500 600 700
Mid
-sp
an D
efle
ctio
n (
mm
)
Temperature (ᵒC)
6m, Load Ratio=0.4
Vulcan with Buckling ELement
ABAQUS with Shell Element
Vulcan without Buckling Element
ABAQUS without Shell ELement
-600
-500
-400
-300
-200
-100
0
0 100 200 300 400 500 600 700
Mid
-sp
an D
efle
ctio
n (
mm
)
Temperature (ᵒC)
6m, Load Ratio=0.5
Vulcan with Buckling ELement
ABAQUS with Shell Element
Vulcan without Buckling Element
ABAQUS without Shell ELement
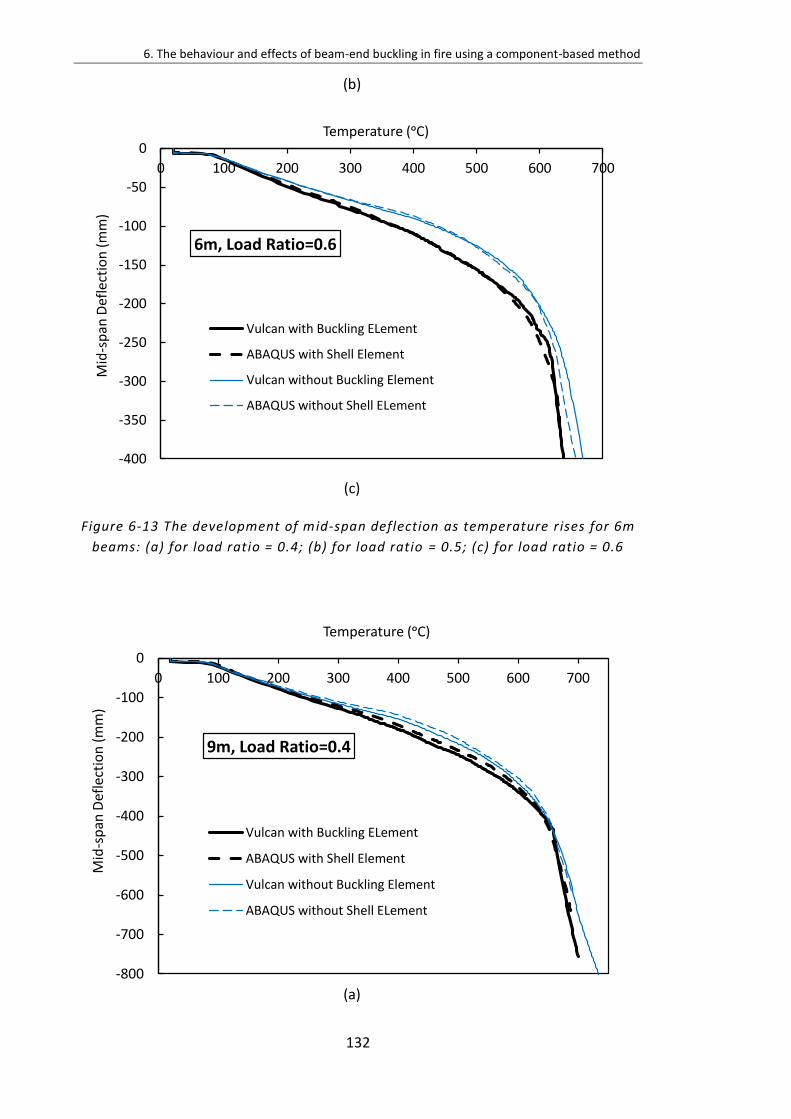
6. The behaviour and effects of beam-end buckling in fire using a component-based method
132
(b)
(c)
Figure 6-13 The development of mid-span deflection as temperature rises for 6m
beams: (a) for load ratio = 0.4; (b) for load ratio = 0.5; (c) for load ratio = 0.6
(a)
-400
-350
-300
-250
-200
-150
-100
-50
0
0 100 200 300 400 500 600 700
Mid
-sp
an D
efle
ctio
n (
mm
)
Temperature (ᵒC)
6m, Load Ratio=0.6
Vulcan with Buckling ELement
ABAQUS with Shell Element
Vulcan without Buckling Element
ABAQUS without Shell ELement
-800
-700
-600
-500
-400
-300
-200
-100
0
0 100 200 300 400 500 600 700
Mid
-sp
an D
efle
ctio
n (
mm
)
Temperature (ᵒC)
9m, Load Ratio=0.4
Vulcan with Buckling ELement
ABAQUS with Shell Element
Vulcan without Buckling Element
ABAQUS without Shell ELement
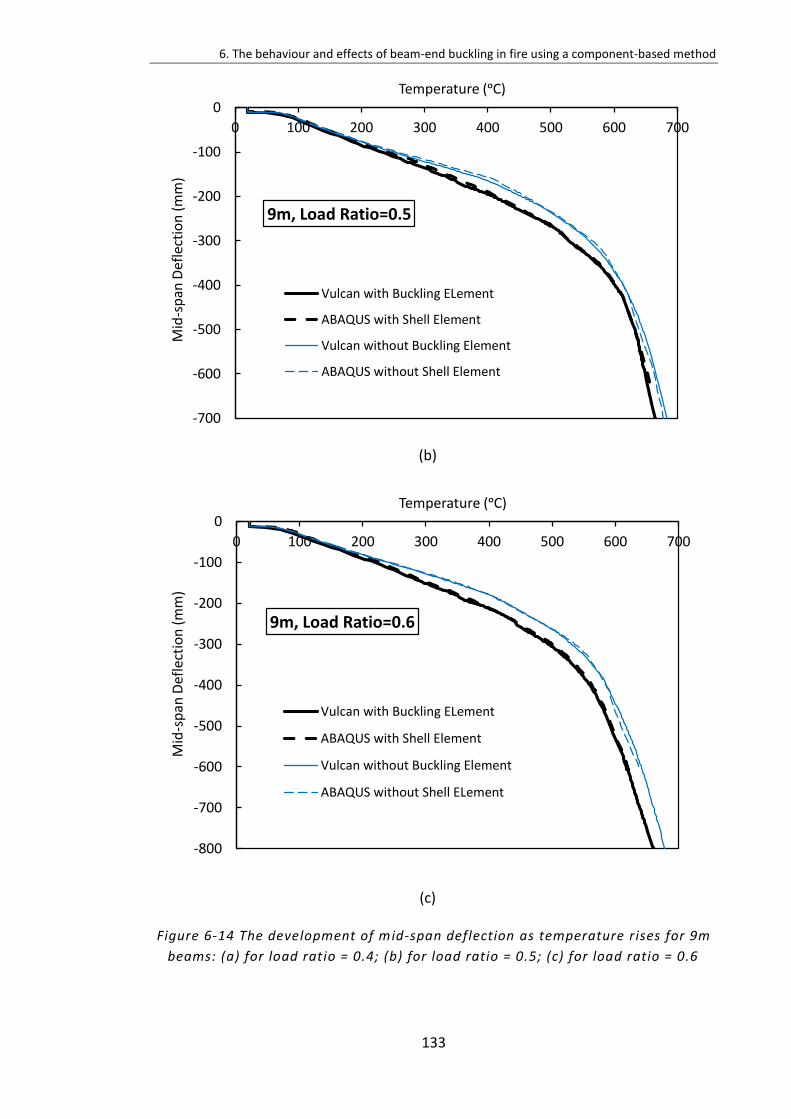
6. The behaviour and effects of beam-end buckling in fire using a component-based method
133
(b)
(c)
Figure 6-14 The development of mid-span deflection as temperature rises for 9m
beams: (a) for load ratio = 0.4; (b) for load ratio = 0.5; (c) for load ratio = 0.6
-700
-600
-500
-400
-300
-200
-100
0
0 100 200 300 400 500 600 700
Mid
-sp
an D
efle
ctio
n (
mm
)
Temperature (ᵒC)
9m, Load Ratio=0.5
Vulcan with Buckling ELement
ABAQUS with Shell Element
Vulcan without Buckling Element
ABAQUS without Shell Element
-800
-700
-600
-500
-400
-300
-200
-100
0
0 100 200 300 400 500 600 700
Mid
-sp
an D
efle
ctio
n (
mm
)
Temperature (ᵒC)
9m, Load Ratio=0.6
Vulcan with Buckling ELement
ABAQUS with Shell Element
Vulcan without Buckling Element
ABAQUS without Shell ELement
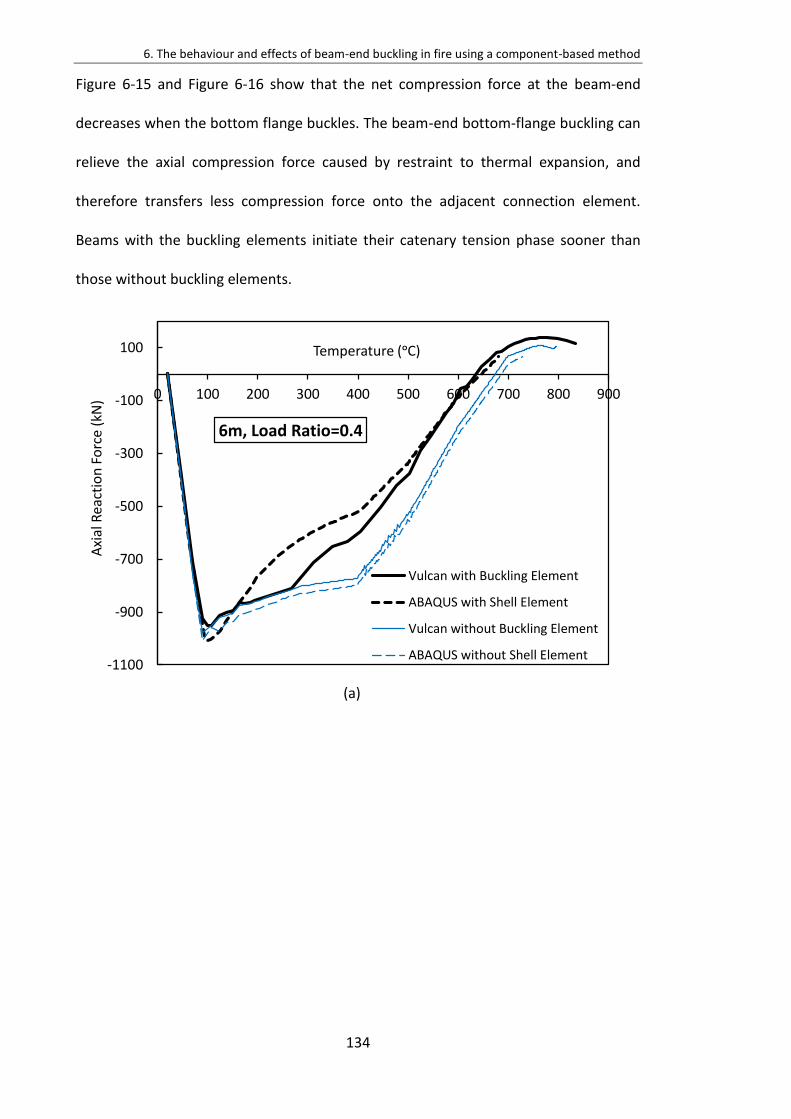
6. The behaviour and effects of beam-end buckling in fire using a component-based method
134
Figure 6-15 and Figure 6-16 show that the net compression force at the beam-end
decreases when the bottom flange buckles. The beam-end bottom-flange buckling can
relieve the axial compression force caused by restraint to thermal expansion, and
therefore transfers less compression force onto the adjacent connection element.
Beams with the buckling elements initiate their catenary tension phase sooner than
those without buckling elements.
(a)
-1100
-900
-700
-500
-300
-100
100
0 100 200 300 400 500 600 700 800 900
Axi
al R
eact
ion
Fo
rce
(kN
)
Temperature (ᵒC)
6m, Load Ratio=0.4
Vulcan with Buckling Element
ABAQUS with Shell Element
Vulcan without Buckling Element
ABAQUS without Shell Element
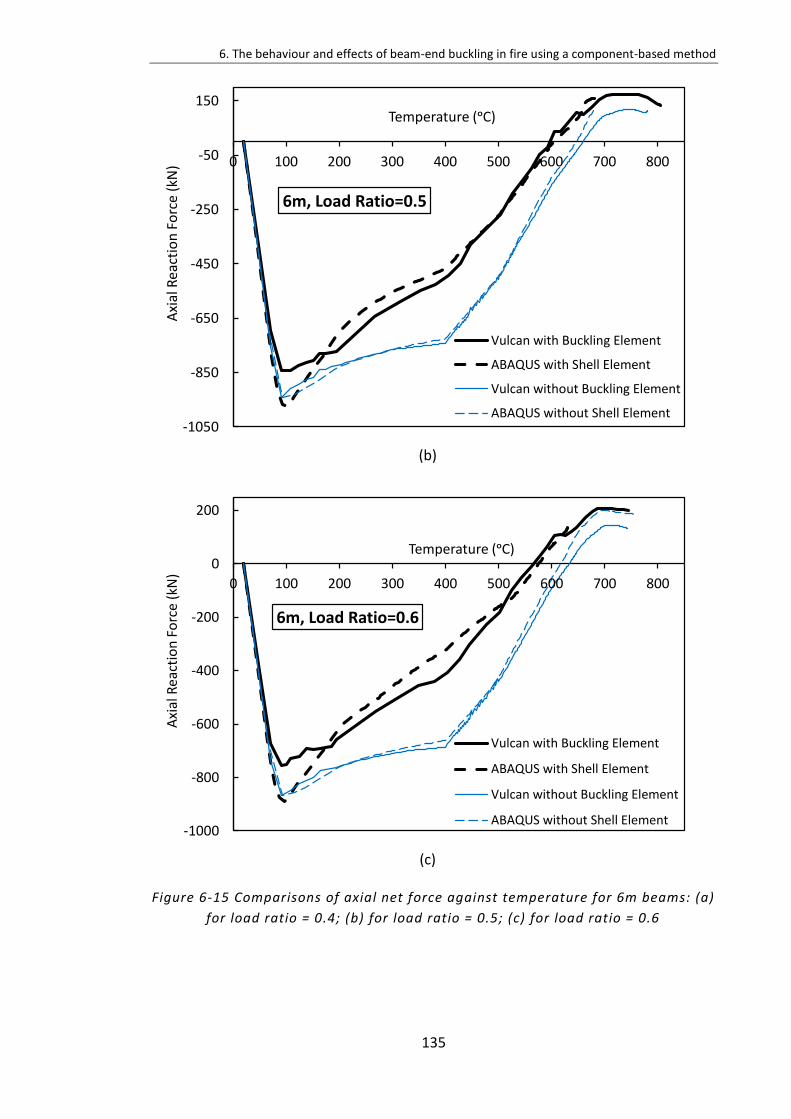
6. The behaviour and effects of beam-end buckling in fire using a component-based method
135
(b)
(c)
Figure 6-15 Comparisons of axial net force against temperature for 6m beams: (a)
for load ratio = 0.4; (b) for load ratio = 0.5; (c) for load ratio = 0.6
-1050
-850
-650
-450
-250
-50
150
0 100 200 300 400 500 600 700 800A
xial
Rea
ctio
n F
orc
e (k
N)
Temperature (ᵒC)
6m, Load Ratio=0.5
Vulcan with Buckling Element
ABAQUS with Shell Element
Vulcan without Buckling Element
ABAQUS without Shell Element
-1000
-800
-600
-400
-200
0
200
0 100 200 300 400 500 600 700 800
Axi
al R
eact
ion
Fo
rce
(kN
)
Temperature (ᵒC)
6m, Load Ratio=0.6
Vulcan with Buckling Element
ABAQUS with Shell Element
Vulcan without Buckling Element
ABAQUS without Shell Element
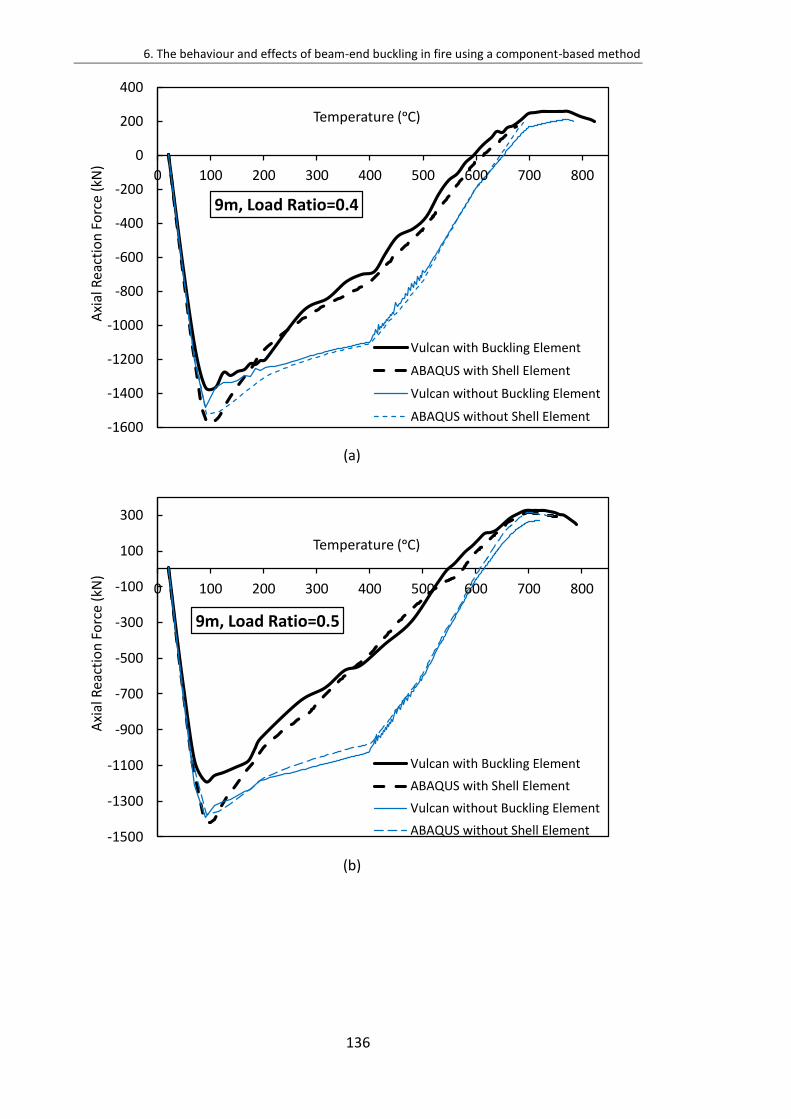
6. The behaviour and effects of beam-end buckling in fire using a component-based method
136
(a)
(b)
-1600
-1400
-1200
-1000
-800
-600
-400
-200
0
200
400
0 100 200 300 400 500 600 700 800
Axi
al R
eact
ion
Fo
rce
(kN
)
Temperature (ᵒC)
9m, Load Ratio=0.4
Vulcan with Buckling Element
ABAQUS with Shell Element
Vulcan without Buckling Element
ABAQUS without Shell Element
-1500
-1300
-1100
-900
-700
-500
-300
-100
100
300
0 100 200 300 400 500 600 700 800
Axi
al R
eact
ion
Fo
rce
(kN
)
Temperature (ᵒC)
9m, Load Ratio=0.5
Vulcan with Buckling Element
ABAQUS with Shell Element
Vulcan without Buckling Element
ABAQUS without Shell Element
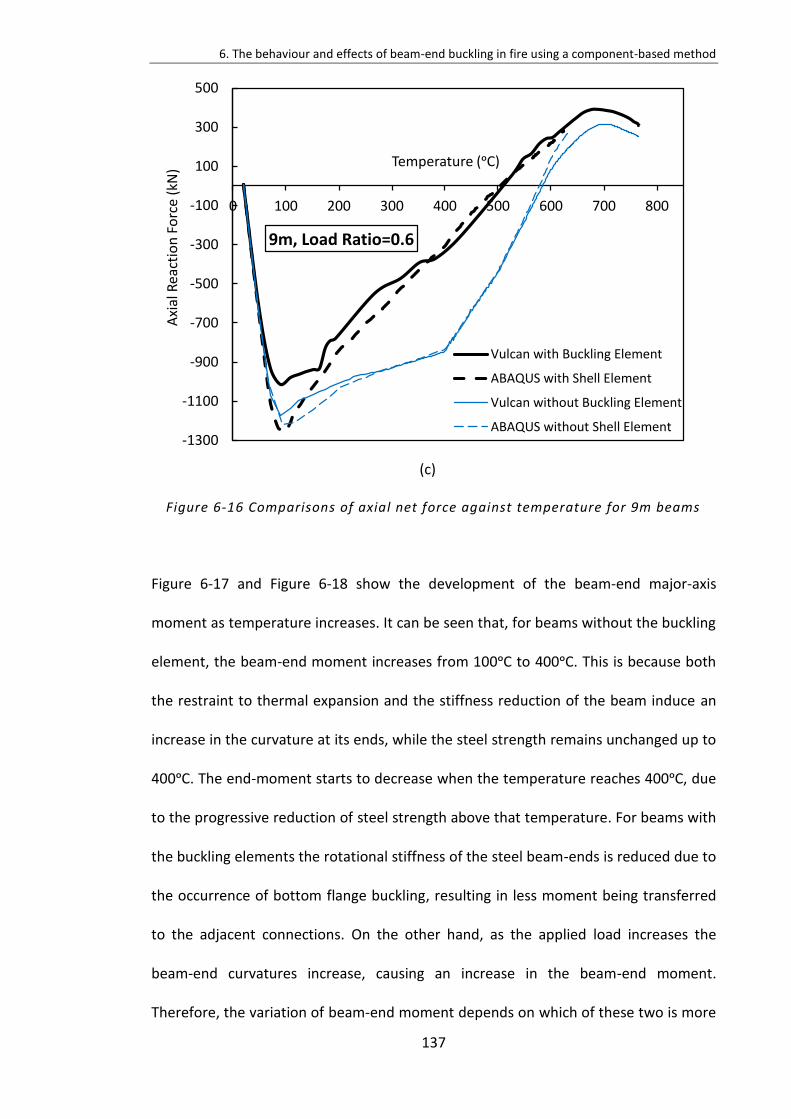
6. The behaviour and effects of beam-end buckling in fire using a component-based method
137
(c)
Figure 6-16 Comparisons of axial net force against temperature for 9m beams
Figure 6-17 and Figure 6-18 show the development of the beam-end major-axis
moment as temperature increases. It can be seen that, for beams without the buckling
element, the beam-end moment increases from 100ᵒC to 400ᵒC. This is because both
the restraint to thermal expansion and the stiffness reduction of the beam induce an
increase in the curvature at its ends, while the steel strength remains unchanged up to
400ᵒC. The end-moment starts to decrease when the temperature reaches 400ᵒC, due
to the progressive reduction of steel strength above that temperature. For beams with
the buckling elements the rotational stiffness of the steel beam-ends is reduced due to
the occurrence of bottom flange buckling, resulting in less moment being transferred
to the adjacent connections. On the other hand, as the applied load increases the
beam-end curvatures increase, causing an increase in the beam-end moment.
Therefore, the variation of beam-end moment depends on which of these two is more
-1300
-1100
-900
-700
-500
-300
-100
100
300
500
0 100 200 300 400 500 600 700 800
Axi
al R
eact
ion
Fo
rce
(kN
) Temperature (ᵒC)
9m, Load Ratio=0.6
Vulcan with Buckling Element
ABAQUS with Shell Element
Vulcan without Buckling Element
ABAQUS without Shell Element
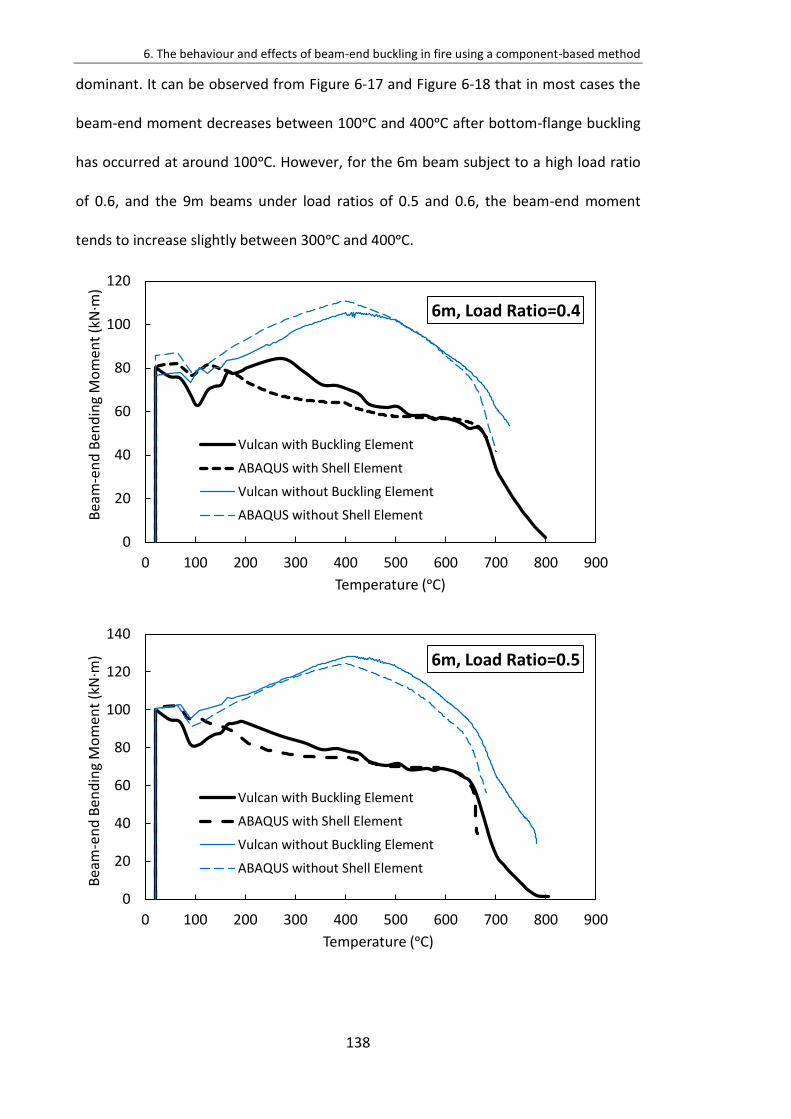
6. The behaviour and effects of beam-end buckling in fire using a component-based method
138
dominant. It can be observed from Figure 6-17 and Figure 6-18 that in most cases the
beam-end moment decreases between 100ᵒC and 400ᵒC after bottom-flange buckling
has occurred at around 100ᵒC. However, for the 6m beam subject to a high load ratio
of 0.6, and the 9m beams under load ratios of 0.5 and 0.6, the beam-end moment
tends to increase slightly between 300ᵒC and 400ᵒC.
0
20
40
60
80
100
120
0 100 200 300 400 500 600 700 800 900
Bea
m-e
nd
Ben
din
g M
om
en
t (k
N·m
)
Temperature (ᵒC)
6m, Load Ratio=0.4
Vulcan with Buckling Element
ABAQUS with Shell Element
Vulcan without Buckling Element
ABAQUS without Shell Element
0
20
40
60
80
100
120
140
0 100 200 300 400 500 600 700 800 900
Bea
m-e
nd
Ben
din
g M
om
ent
(kN
·m)
Temperature (ᵒC)
6m, Load Ratio=0.5
Vulcan with Buckling Element
ABAQUS with Shell Element
Vulcan without Buckling Element
ABAQUS without Shell Element
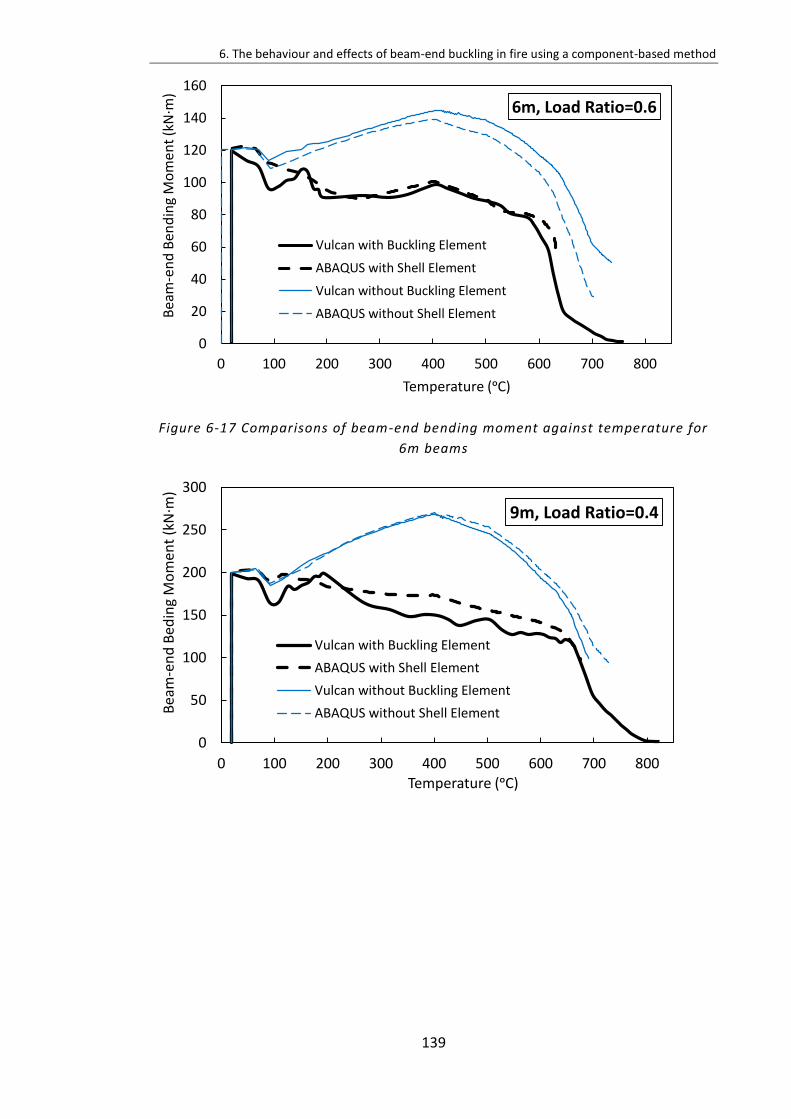
6. The behaviour and effects of beam-end buckling in fire using a component-based method
139
Figure 6-17 Comparisons of beam-end bending moment against temperature for
6m beams
0
20
40
60
80
100
120
140
160
0 100 200 300 400 500 600 700 800
Be
am-e
nd
Ben
din
g M
om
en
t (k
N·m
)
Temperature (ᵒC)
6m, Load Ratio=0.6
Vulcan with Buckling Element
ABAQUS with Shell Element
Vulcan without Buckling Element
ABAQUS without Shell Element
0
50
100
150
200
250
300
0 100 200 300 400 500 600 700 800
Bea
m-e
nd
Bed
ing
Mo
men
t (k
N·m
)
Temperature (ᵒC)
9m, Load Ratio=0.4
Vulcan with Buckling Element
ABAQUS with Shell Element
Vulcan without Buckling Element
ABAQUS without Shell Element
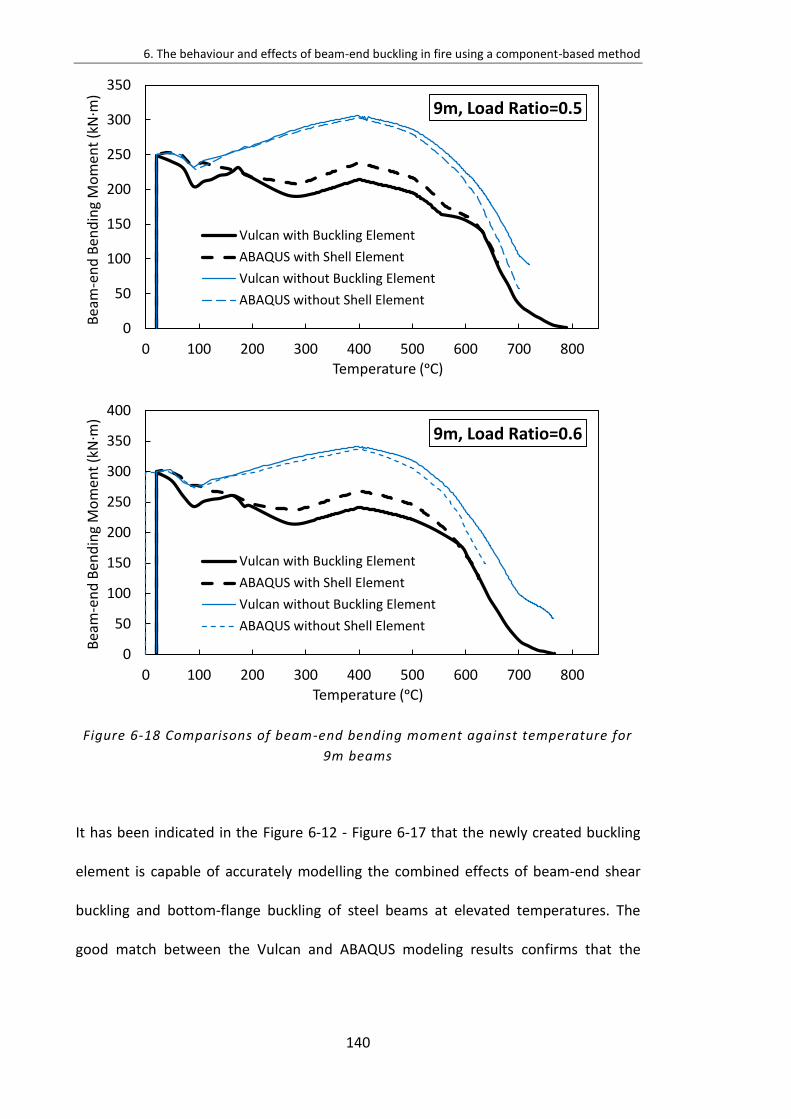
6. The behaviour and effects of beam-end buckling in fire using a component-based method
140
Figure 6-18 Comparisons of beam-end bending moment against temperature for
9m beams
It has been indicated in the Figure 6-12 - Figure 6-17 that the newly created buckling
element is capable of accurately modelling the combined effects of beam-end shear
buckling and bottom-flange buckling of steel beams at elevated temperatures. The
good match between the Vulcan and ABAQUS modeling results confirms that the
0
50
100
150
200
250
300
350
0 100 200 300 400 500 600 700 800
Bea
m-e
nd
Ben
din
g M
om
ent
(kN
·m)
Temperature (ᵒC)
9m, Load Ratio=0.5
Vulcan with Buckling Element
ABAQUS with Shell Element
Vulcan without Buckling Element
ABAQUS without Shell Element
0
50
100
150
200
250
300
350
400
0 100 200 300 400 500 600 700 800
Bea
m-e
nd
Ben
din
g M
om
ent
(kN
·m)
Temperature (ᵒC)
9m, Load Ratio=0.6
Vulcan with Buckling Element
ABAQUS with Shell Element
Vulcan without Buckling Element
ABAQUS without Shell Element
6. The behaviour and effects of beam-end buckling in fire using a component-based method
141
buckling element is able to account for the major structural effects of the net axial
compression due to restraint to thermal expansion.
The differences between the Vulcan models with and without the buckling elements
and between the ABAQUS models with and without shell elements, as shown in
Section 6.4.1, have indicated the importance of considering the beam-end buckling
phenomena. This is true only if such differences are not caused by the adoption of
different element types, especially for the ABAQUS models. This section examines the
sensitivity of the ABAQUS modelling results to the element types adopted. Two
ABAQUS models, one using wire elements to model the entire beam and one using
shell elements which are restrained against buckling, were used to model the beam
ends, retaining the wire elements for the rest of the beam, and results were compared
as shown in Figure 6-11.
The same mesh size, element type and temperature curve used for the ABAQUS
models described in Section 6.4.1 were used. The beam was of section UB356x171x51
and 3m length; this is short enough to avoid bottom-flange buckling. The beam web
was fully restrained against out-of-plane deformation, and therefore no beam-web
shear buckling was allowed. The two ABAQUS models resulted in indistinguishable
deflection and axial force, as shown in Figure 6-19. This confirms that the differences
in behaviour between models with and without shell elements at beam-ends are
entirely due to beam-end buckling, and are not caused by the use of different element
types.
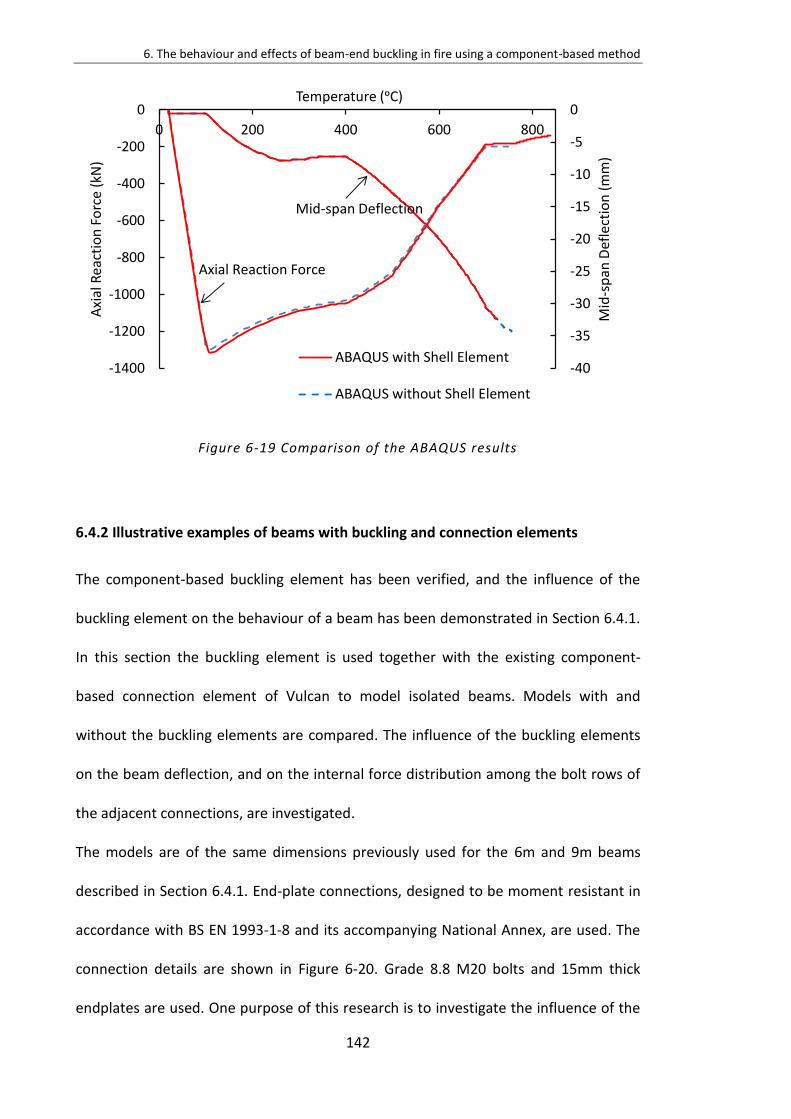
6. The behaviour and effects of beam-end buckling in fire using a component-based method
142
Figure 6-19 Comparison of the ABAQUS results
6.4.2 Illustrative examples of beams with buckling and connection elements
The component-based buckling element has been verified, and the influence of the
buckling element on the behaviour of a beam has been demonstrated in Section 6.4.1.
In this section the buckling element is used together with the existing component-
based connection element of Vulcan to model isolated beams. Models with and
without the buckling elements are compared. The influence of the buckling elements
on the beam deflection, and on the internal force distribution among the bolt rows of
the adjacent connections, are investigated.
The models are of the same dimensions previously used for the 6m and 9m beams
described in Section 6.4.1. End-plate connections, designed to be moment resistant in
accordance with BS EN 1993-1-8 and its accompanying National Annex, are used. The
connection details are shown in Figure 6-20. Grade 8.8 M20 bolts and 15mm thick
endplates are used. One purpose of this research is to investigate the influence of the
-40
-35
-30
-25
-20
-15
-10
-5
0
-1400
-1200
-1000
-800
-600
-400
-200
0
0 200 400 600 800
Temperature (ᵒC)
Mid
-sp
an D
efle
ctio
n (
mm
)
Axi
al R
eact
ion
Fo
rce
(kN
)
ABAQUS with Shell Element
ABAQUS without Shell Element
Axial Reaction Force
Mid-span Deflection
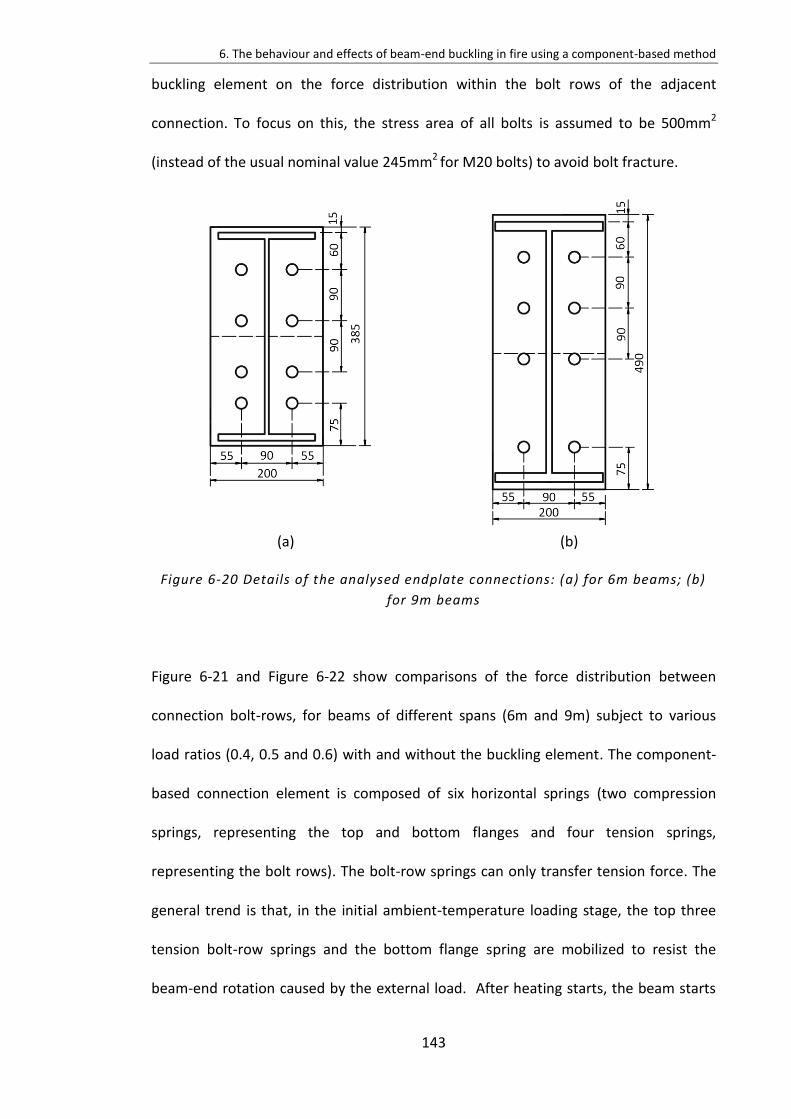
6. The behaviour and effects of beam-end buckling in fire using a component-based method
143
buckling element on the force distribution within the bolt rows of the adjacent
connection. To focus on this, the stress area of all bolts is assumed to be 500mm2
(instead of the usual nominal value 245mm2 for M20 bolts) to avoid bolt fracture.
(a) (b)
Figure 6-20 Details of the analysed endplate connections: (a) for 6m beams; (b)
for 9m beams
Figure 6-21 and Figure 6-22 show comparisons of the force distribution between
connection bolt-rows, for beams of different spans (6m and 9m) subject to various
load ratios (0.4, 0.5 and 0.6) with and without the buckling element. The component-
based connection element is composed of six horizontal springs (two compression
springs, representing the top and bottom flanges and four tension springs,
representing the bolt rows). The bolt-row springs can only transfer tension force. The
general trend is that, in the initial ambient-temperature loading stage, the top three
tension bolt-row springs and the bottom flange spring are mobilized to resist the
beam-end rotation caused by the external load. After heating starts, the beam starts
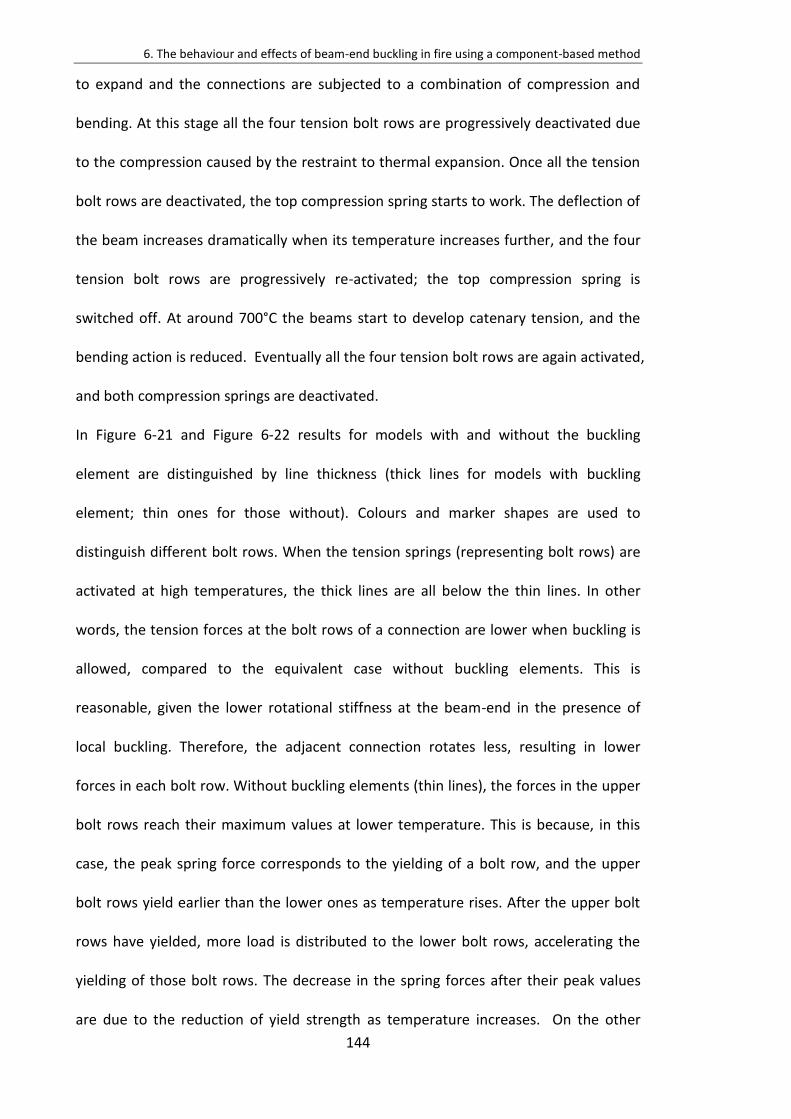
6. The behaviour and effects of beam-end buckling in fire using a component-based method
144
to expand and the connections are subjected to a combination of compression and
bending. At this stage all the four tension bolt rows are progressively deactivated due
to the compression caused by the restraint to thermal expansion. Once all the tension
bolt rows are deactivated, the top compression spring starts to work. The deflection of
the beam increases dramatically when its temperature increases further, and the four
tension bolt rows are progressively re-activated; the top compression spring is
switched off. At around 700°C the beams start to develop catenary tension, and the
bending action is reduced. Eventually all the four tension bolt rows are again activated,
and both compression springs are deactivated.
In Figure 6-21 and Figure 6-22 results for models with and without the buckling
element are distinguished by line thickness (thick lines for models with buckling
element; thin ones for those without). Colours and marker shapes are used to
distinguish different bolt rows. When the tension springs (representing bolt rows) are
activated at high temperatures, the thick lines are all below the thin lines. In other
words, the tension forces at the bolt rows of a connection are lower when buckling is
allowed, compared to the equivalent case without buckling elements. This is
reasonable, given the lower rotational stiffness at the beam-end in the presence of
local buckling. Therefore, the adjacent connection rotates less, resulting in lower
forces in each bolt row. Without buckling elements (thin lines), the forces in the upper
bolt rows reach their maximum values at lower temperature. This is because, in this
case, the peak spring force corresponds to the yielding of a bolt row, and the upper
bolt rows yield earlier than the lower ones as temperature rises. After the upper bolt
rows have yielded, more load is distributed to the lower bolt rows, accelerating the
yielding of those bolt rows. The decrease in the spring forces after their peak values
are due to the reduction of yield strength as temperature increases. On the other
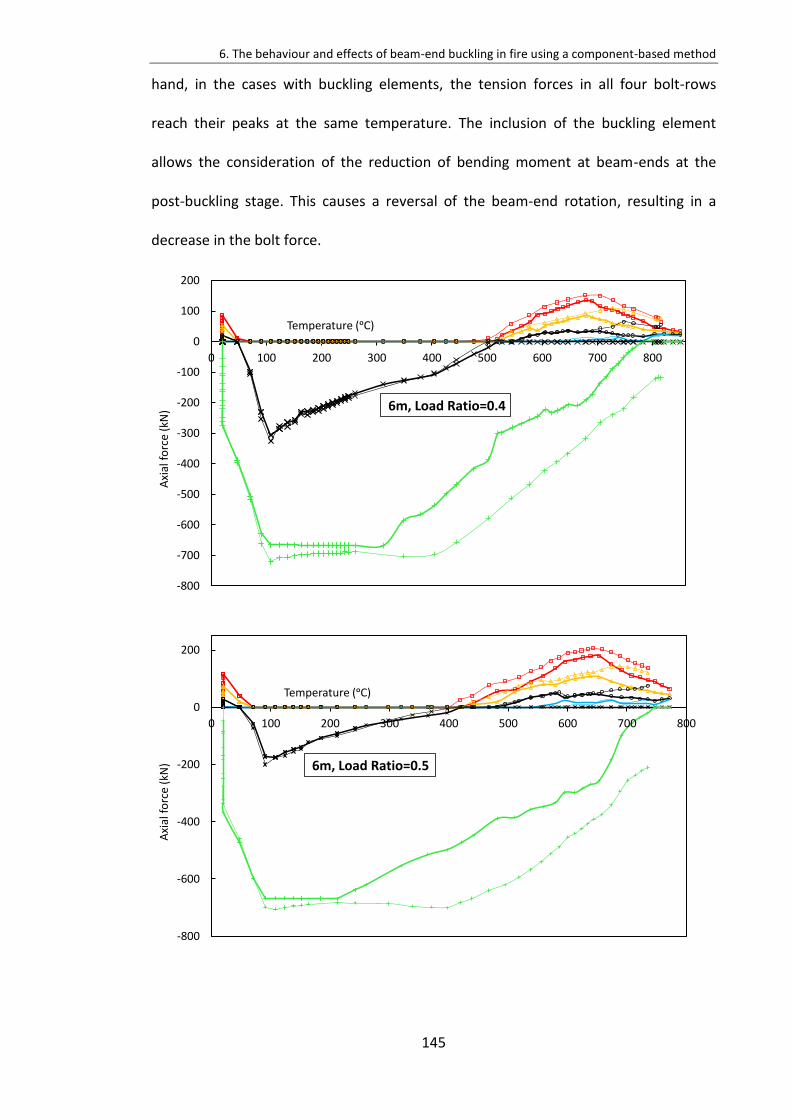
6. The behaviour and effects of beam-end buckling in fire using a component-based method
145
hand, in the cases with buckling elements, the tension forces in all four bolt-rows
reach their peaks at the same temperature. The inclusion of the buckling element
allows the consideration of the reduction of bending moment at beam-ends at the
post-buckling stage. This causes a reversal of the beam-end rotation, resulting in a
decrease in the bolt force.
-800
-700
-600
-500
-400
-300
-200
-100
0
100
200
0 100 200 300 400 500 600 700 800
Axi
al f
orc
e (k
N)
Temperature (ᵒC)
6m, Load Ratio=0.4
-800
-600
-400
-200
0
200
0 100 200 300 400 500 600 700 800
Axi
al f
orc
e (k
N)
Temperature (ᵒC)
6m, Load Ratio=0.5
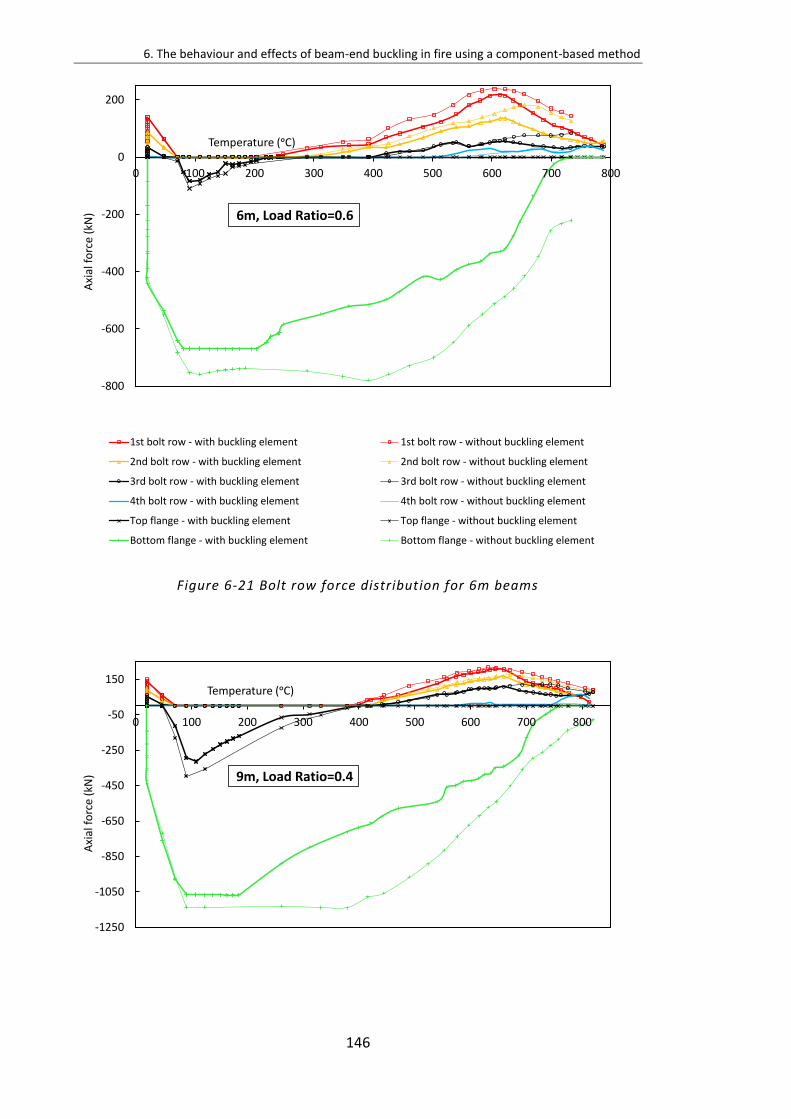
6. The behaviour and effects of beam-end buckling in fire using a component-based method
146
Figure 6-21 Bolt row force distribution for 6m beams
-800
-600
-400
-200
0
200
0 100 200 300 400 500 600 700 800
Axi
al f
orc
e (
kN)
Temperature (ᵒC)
6m, Load Ratio=0.6
-800-600-400-200
0200
-200
Axi
al f
orc
e (k
N)
Temperature (ᵒC)
1st bolt row - with buckling element 1st bolt row - without buckling element
2nd bolt row - with buckling element 2nd bolt row - without buckling element
3rd bolt row - with buckling element 3rd bolt row - without buckling element
4th bolt row - with buckling element 4th bolt row - without buckling element
Top flange - with buckling element Top flange - without buckling element
Bottom flange - with buckling element Bottom flange - without buckling element
6m, Load Ratio=0.5
-1250
-1050
-850
-650
-450
-250
-50
150
0 100 200 300 400 500 600 700 800
Axi
al f
orc
e (k
N)
Temperature (ᵒC)
9m, Load Ratio=0.4
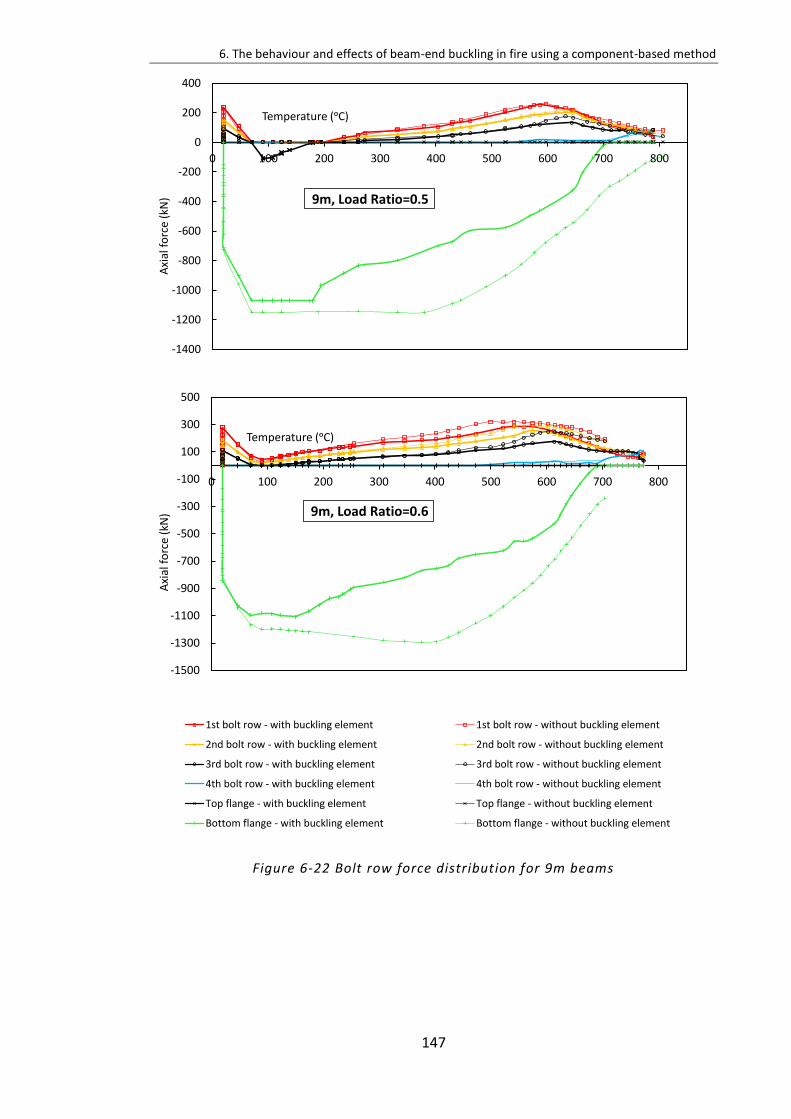
6. The behaviour and effects of beam-end buckling in fire using a component-based method
147
Figure 6-22 Bolt row force distribution for 9m beams
-1400
-1200
-1000
-800
-600
-400
-200
0
200
400
0 100 200 300 400 500 600 700 800A
xial
fo
rce
(kN
)
Temperature (ᵒC)
9m, Load Ratio=0.5
-1500
-1300
-1100
-900
-700
-500
-300
-100
100
300
500
0 100 200 300 400 500 600 700 800
Axi
al f
orc
e (k
N)
Temperature (ᵒC)
9m, Load Ratio=0.6
-800-600-400-200
0200
-200
Axi
al f
orc
e (k
N)
Temperature (ᵒC)
1st bolt row - with buckling element 1st bolt row - without buckling element
2nd bolt row - with buckling element 2nd bolt row - without buckling element
3rd bolt row - with buckling element 3rd bolt row - without buckling element
4th bolt row - with buckling element 4th bolt row - without buckling element
Top flange - with buckling element Top flange - without buckling element
Bottom flange - with buckling element Bottom flange - without buckling element
6m, Load Ratio=0.5
6. The behaviour and effects of beam-end buckling in fire using a component-based method
148
6.4.3 Frame analysis
In order to demonstrate the potential to carry out performance-based analysis
considering the buckling element in Vulcan, and to preliminary study the influence of
the buckling element on its adjacent connection, a two-storey two-span plane frame
model has been created. The dimension of the frame is shown in Figure 6-23. The
cross-sections of columns and beams in the frame are UC254×254×73 and UB
UB356x171x51 respectively. It is assumed that the fire occurs in the right-hand side
bay of the lower storey, and that the beam and columns around this bay are uniformly
heated by fire. The temperature of the left and right columns of this bay is 0.8 times
the temperature of the beam. The uniformly distributed load applied to the beams is
26.8kN/m, giving them a load ratio of 0.4 for fixed-ended beam. The columns at
ground floor level are loaded with a load ratio of 0.15. Flush end-plate connections
with the same dimensions as shown in Figure 6-20 (a) are located at the ends of each
beam. The stress area of the bolts is set to be 245mm2. Cases with and without the
buckling element have been analysed. For cases with the buckling element, the
buckling elements were located in between each connection element and its
connected beam. In order to initiate beam-end flange buckling, fully axial restraint has
been applied to the frame ends.
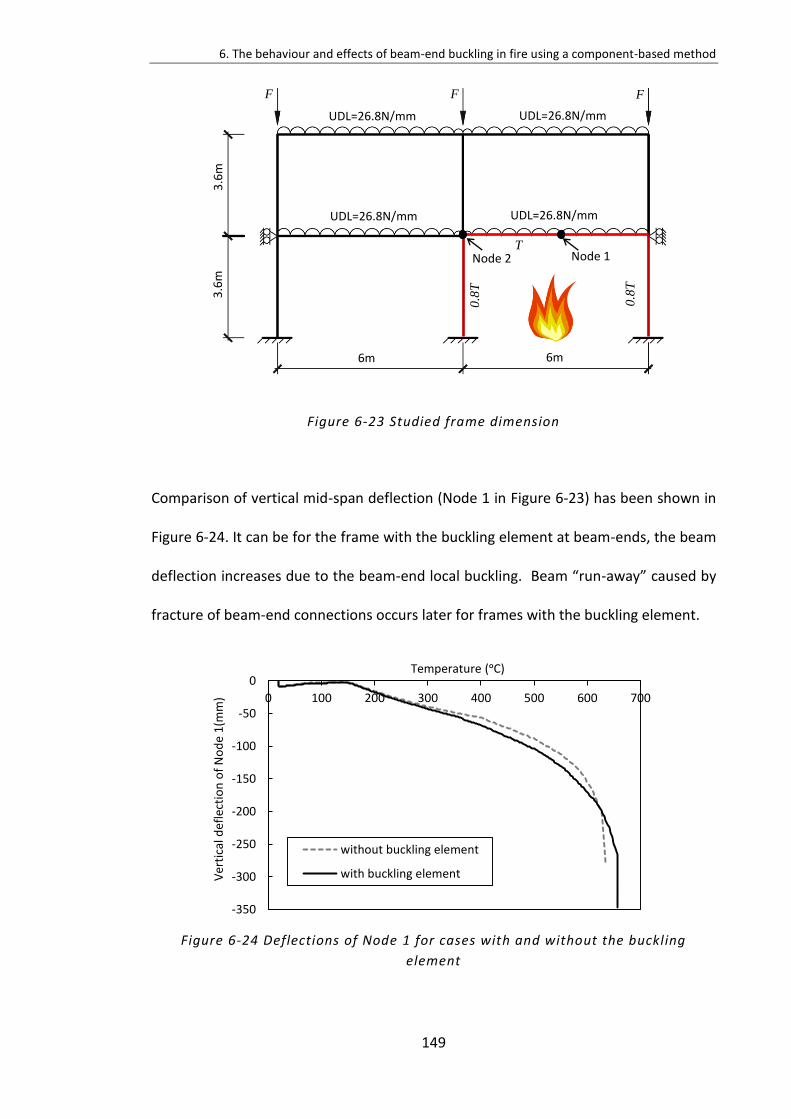
6. The behaviour and effects of beam-end buckling in fire using a component-based method
149
Figure 6-23 Studied frame dimension
Comparison of vertical mid-span deflection (Node 1 in Figure 6-23) has been shown in
Figure 6-24. It can be for the frame with the buckling element at beam-ends, the beam
deflection increases due to the beam-end local buckling. Beam “run-away” caused by
fracture of beam-end connections occurs later for frames with the buckling element.
Figure 6-24 Deflections of Node 1 for cases with and without the buckling
element
6m 6m
3.6
m
3.6
m
T
0.8
T
F F F
UDL=26.8N/mm UDL=26.8N/mm
UDL=26.8N/mm UDL=26.8N/mm
Node 1 Node 2
0.8
T
-350
-300
-250
-200
-150
-100
-50
0
0 100 200 300 400 500 600 700
Ver
tica
l def
lect
ion
of
No
de
1(m
m)
Temperature (ᵒC)
without buckling element
with buckling element
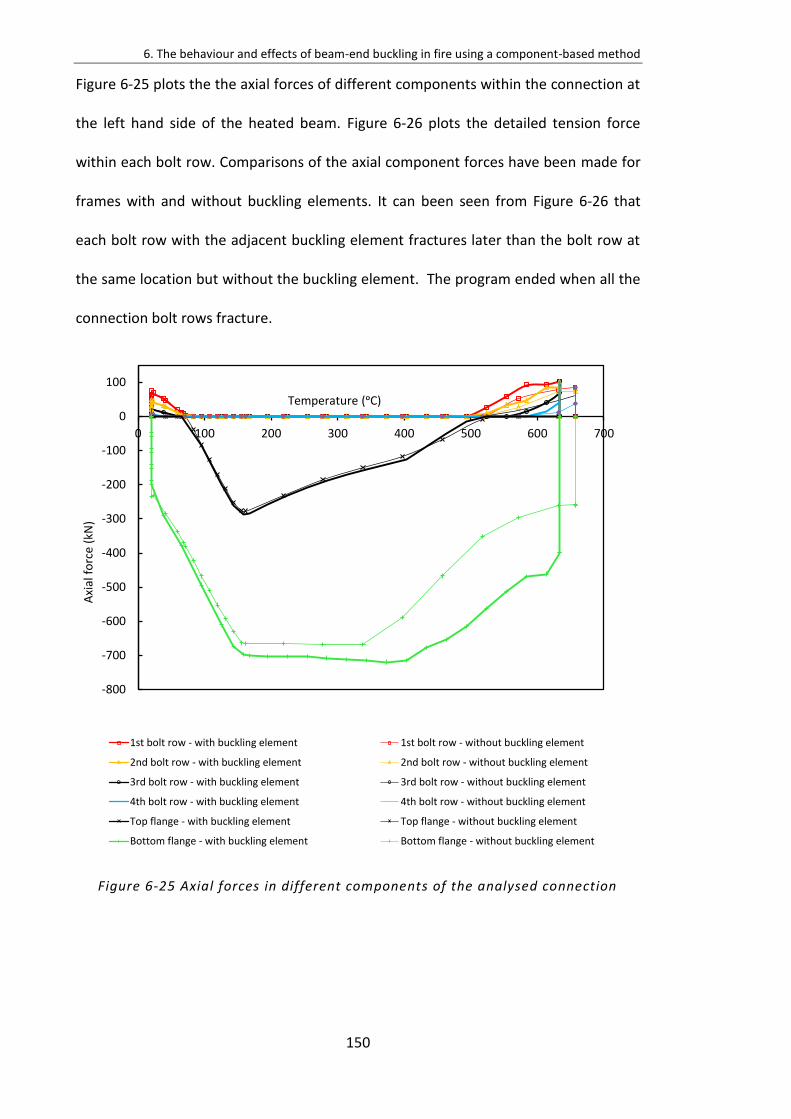
6. The behaviour and effects of beam-end buckling in fire using a component-based method
150
Figure 6-25 plots the the axial forces of different components within the connection at
the left hand side of the heated beam. Figure 6-26 plots the detailed tension force
within each bolt row. Comparisons of the axial component forces have been made for
frames with and without buckling elements. It can been seen from Figure 6-26 that
each bolt row with the adjacent buckling element fractures later than the bolt row at
the same location but without the buckling element. The program ended when all the
connection bolt rows fracture.
Figure 6-25 Axial forces in different components of the analysed connection
-800
-700
-600
-500
-400
-300
-200
-100
0
100
0 100 200 300 400 500 600 700
Axi
al f
orc
e (k
N)
Temperature (ᵒC)
1st bolt row - with buckling element 1st bolt row - without buckling element
3rd bolt row - with buckling element Top flange - without buckling element
2nd bolt row - with buckling element 2nd bolt row - without buckling element
3rd bolt row - without buckling element 4th bolt row - with buckling element
4th bolt row - without buckling element Top flange - with buckling element
Bottom flange - with buckling element Bottom flange - without buckling element
-800-600-400-200
0200
-200
Axi
al f
orc
e (k
N)
Temperature (ᵒC)
1st bolt row - with buckling element 1st bolt row - without buckling element
2nd bolt row - with buckling element 2nd bolt row - without buckling element
3rd bolt row - with buckling element 3rd bolt row - without buckling element
4th bolt row - with buckling element 4th bolt row - without buckling element
Top flange - with buckling element Top flange - without buckling element
Bottom flange - with buckling element Bottom flange - without buckling element
6m, Load Ratio=0.5
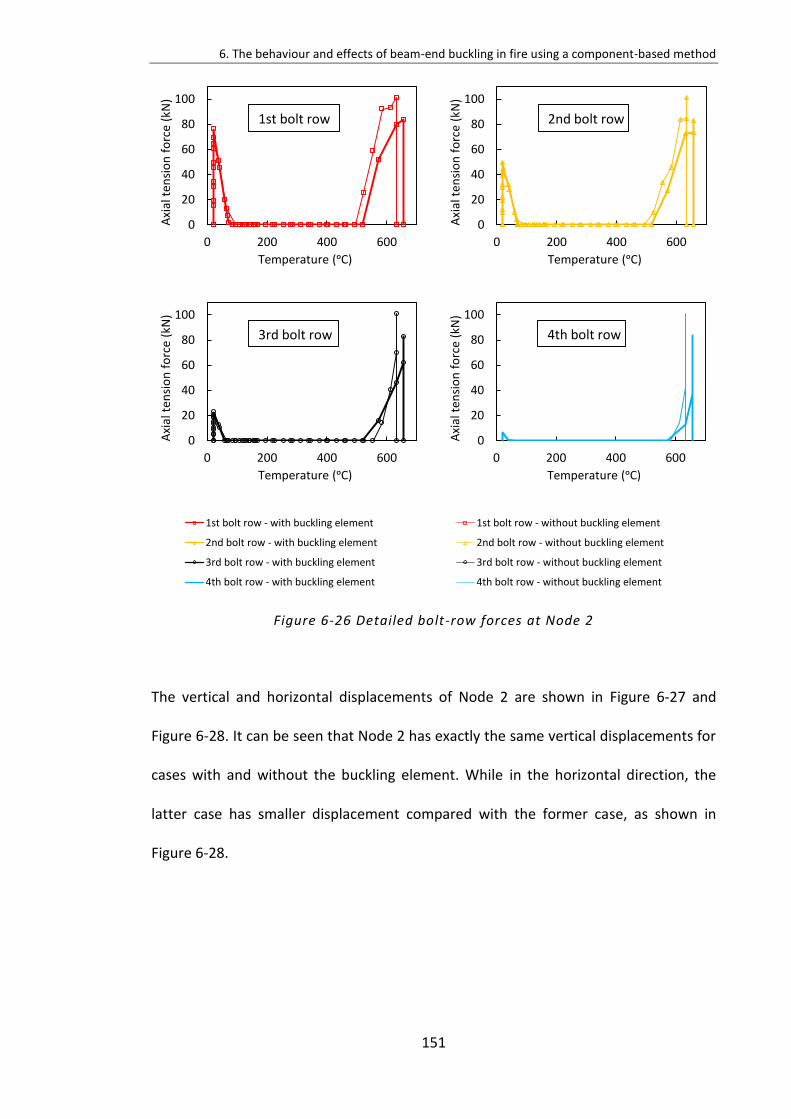
6. The behaviour and effects of beam-end buckling in fire using a component-based method
151
Figure 6-26 Detailed bolt-row forces at Node 2
The vertical and horizontal displacements of Node 2 are shown in Figure 6-27 and
Figure 6-28. It can be seen that Node 2 has exactly the same vertical displacements for
cases with and without the buckling element. While in the horizontal direction, the
latter case has smaller displacement compared with the former case, as shown in
Figure 6-28.
0
20
40
60
80
100
0 200 400 600
Axi
al t
ensi
on
fo
rce
(kN
)
Temperature (ᵒC)
1st bolt row
0
20
40
60
80
100
0 200 400 600
Axi
al t
ensi
on
fo
rce
(kN
)
Temperature (ᵒC)
2nd bolt row
0
20
40
60
80
100
0 200 400 600
Axi
al t
ensi
on
fo
rce
(kN
)
Temperature (ᵒC)
3rd bolt row
0
20
40
60
80
100
0 200 400 600A
xial
ten
sio
n f
orc
e (k
N)
Temperature (ᵒC)
4th bolt row
-800-600-400-200
0200
-200
Axi
al f
orc
e (k
N)
Temperature (ᵒC)
1st bolt row - with buckling element 1st bolt row - without buckling element
2nd bolt row - with buckling element 2nd bolt row - without buckling element
3rd bolt row - with buckling element 3rd bolt row - without buckling element
4th bolt row - with buckling element 4th bolt row - without buckling element
Top flange - with buckling element Top flange - without buckling element
Bottom flange - with buckling element Bottom flange - without buckling element
6m, Load Ratio=0.5
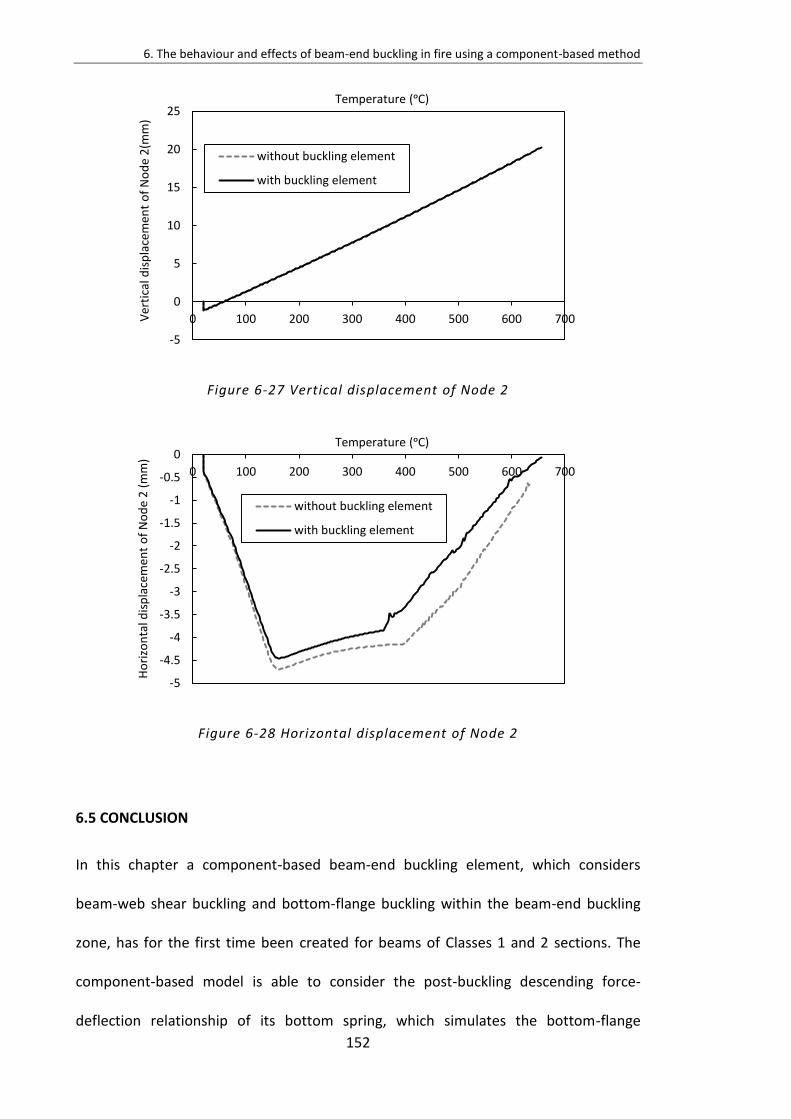
6. The behaviour and effects of beam-end buckling in fire using a component-based method
152
Figure 6-27 Vertical displacement of Node 2
Figure 6-28 Horizontal displacement of Node 2
6.5 CONCLUSION
In this chapter a component-based beam-end buckling element, which considers
beam-web shear buckling and bottom-flange buckling within the beam-end buckling
zone, has for the first time been created for beams of Classes 1 and 2 sections. The
component-based model is able to consider the post-buckling descending force-
deflection relationship of its bottom spring, which simulates the bottom-flange
-5
0
5
10
15
20
25
0 100 200 300 400 500 600 700Ver
tica
l dis
pla
cem
ent
of
No
de
2(m
m)
Temperature (ᵒC)
without buckling element
with buckling element
-5
-4.5
-4
-3.5
-3
-2.5
-2
-1.5
-1
-0.5
0
0 100 200 300 400 500 600 700
Ho
rizo
nta
ldis
pla
cem
ent
of
No
de
2 (
mm
)
Temperature (ᵒC)
without buckling element
with buckling element
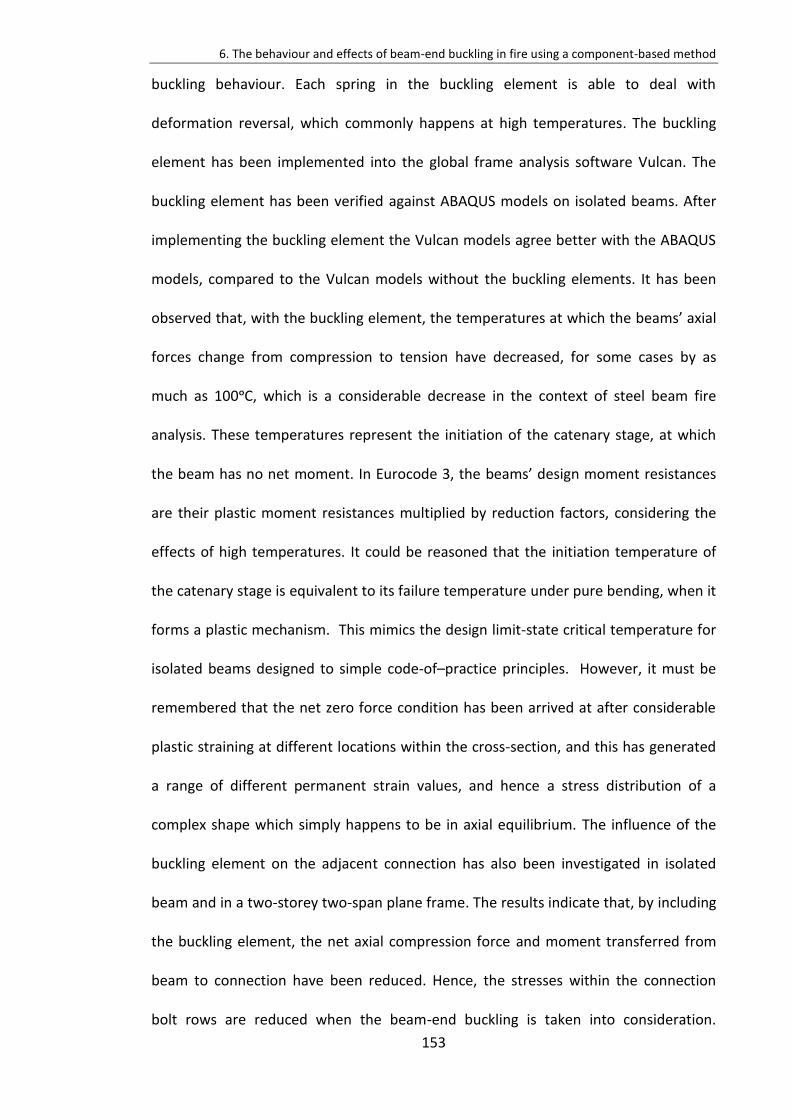
6. The behaviour and effects of beam-end buckling in fire using a component-based method
153
buckling behaviour. Each spring in the buckling element is able to deal with
deformation reversal, which commonly happens at high temperatures. The buckling
element has been implemented into the global frame analysis software Vulcan. The
buckling element has been verified against ABAQUS models on isolated beams. After
implementing the buckling element the Vulcan models agree better with the ABAQUS
models, compared to the Vulcan models without the buckling elements. It has been
observed that, with the buckling element, the temperatures at which the beams’ axial
forces change from compression to tension have decreased, for some cases by as
much as 100ᵒC, which is a considerable decrease in the context of steel beam fire
analysis. These temperatures represent the initiation of the catenary stage, at which
the beam has no net moment. In Eurocode 3, the beams’ design moment resistances
are their plastic moment resistances multiplied by reduction factors, considering the
effects of high temperatures. It could be reasoned that the initiation temperature of
the catenary stage is equivalent to its failure temperature under pure bending, when it
forms a plastic mechanism. This mimics the design limit-state critical temperature for
isolated beams designed to simple code-of–practice principles. However, it must be
remembered that the net zero force condition has been arrived at after considerable
plastic straining at different locations within the cross-section, and this has generated
a range of different permanent strain values, and hence a stress distribution of a
complex shape which simply happens to be in axial equilibrium. The influence of the
buckling element on the adjacent connection has also been investigated in isolated
beam and in a two-storey two-span plane frame. The results indicate that, by including
the buckling element, the net axial compression force and moment transferred from
beam to connection have been reduced. Hence, the stresses within the connection
bolt rows are reduced when the beam-end buckling is taken into consideration.
6. The behaviour and effects of beam-end buckling in fire using a component-based method
154
Although the bolt forces adjacent to the buckling element are not reduced by a large
amount, the trend is consistent for all the cases analysed. Therefore, the existence of
the buckling elements tends to protect the adjacent connections, as they decrease the
connection bolt-row forces.
155
7.
SUMMARY, DISCUSSION, CONCLUSIONS AND
RECOMMENDATIONS FOR FURTHER WORK
7. Summary, discussion, conclusions and recommendations for further work
156
7.1 SUMMARY
Structural analysis under fire conditions has become an essential part of the
performance-based design approach. The progressive collapse of the WTC 7 building
has emphasized that joints are among the most vulnerable components of structures
under fire conditions. Fracture of joints may initiate either locally-contained failures or
even progressive collapse of the whole building. Therefore it is necessary to be able to
model the behaviour of connections, including their robustness, fracture sequences
and survival times. In order to do this one of the most practical approaches is to use a
component-based method. Beam-end buckling (including both beam-web shear
buckling and bottom-flange buckling) has been widely observed in full-scale fire tests.
It may influence the beam survival temperature, the forces transferred to the adjacent
connection, as well as the deflection of the beam.
An analytical model was initially created to predict the shear capacity and vertical
deflection of shear panels at both ambient and elevated temperatures. The analytical
model is capable of predicting the formation of plastic hinges on flanges, the initiation
of beam-web shear buckling and the limiting conditions for Class 1 and 2 sections. A
tri-linear curve can be created for a particular beam section by linking these three
points, in order to track the load-deflection route of the shear panel. For beams for
which beam-web shear bucking is the main ‘failure’ mode, the proposed method
provides satisfactory accuracy in terms of both shear capacity and mid-span vertical
deflection. However, as beam lengths are increased, the ‘failure’ mode switches to
bottom-flange buckling. However, bottom-flange buckling has not been involved in the
beam-web shear buckling analytical model.
7. Summary, discussion, conclusions and recommendations for further work
157
An analytical model was also proposed considering simultaneous beam-web shear
buckling and bottom-flange buckling. The interaction between these two buckling
modes is accounted for by ensuring compatibility between the out-of-plane
deflections of the beam web caused by these two modes. Two comparison cases, both
with and without uniformly distributed load on top of the buckling panel, were
discussed. An example hand-calculation using the validated beam-end buckling panel
model, integrated into a whole beam, has been given. The theoretical results have
been validated against finite element modelling using ABAQUS over a range of
geometries. The second analytical model was also compared with Dharma’s analytical
model. These comparisons have shown that the proposed model provides sufficiently
accurate and conservative results for both Class 1 and 2 sections.
A transition length to distinguish between cases in which pure beam-web shear
buckling occurs and those in which the instability is a combination of shear buckling
and bottom-flange buckling has been proposed, including a calculation procedure to
detect the transition length between these two buckling modes. This criterion was
validated using two sets of beams analysed using ABAQUS. It has been observed from
the results that, when the beam length is less than the transition length, shear
buckling is the dominant buckling mode. The shear-buckling model then provides the
best representation, and the analytical shear buckling curve provides the best fit to the
FE results. In this range the analytical results for the model which includes bottom-
flange buckling lie above both the shear buckling curve and the FE results, indicating
that bottom-flange buckling is unlikely to occur. When the beam length is longer than
the transition length, a combination including bottom-flange buckling dominates. The
analytical results for the model which includes bottom-flange buckling then compare
7. Summary, discussion, conclusions and recommendations for further work
158
well with the FE analysis, and the analytical results for the pure shear buckling model
lie above the other two curves. For the beams with lengths in the vicinity of the
transition length the FEA, shear buckling and bottom-flange buckling results tend
towards being identical. The transition lengths observed from the FE modelling, and
the comparison between the analytical and FE models, show consistency in transition
length according to the calculation criteria for the two groups of beams analysed.
Therefore, it is suggested that this calculation procedure (Figure 5-1) is a simplified and
effective way to detect the transition length between pure beam-web shear buckling
and a combination with bottom-flange buckling of a beam. This transition criterion is
only available when the analysed beam is axially released. When the beam is axially
restrained, it is assumed that a combination buckling mode will always occur.
For the first time a component-based beam-end buckling element, which considers
beam-web shear buckling and bottom-flange buckling within the beam-end buckling
zone, has been created for Class 1 and 2 sections. The component-based model is
composed of two nonlinear springs. Each spring is able to deal with the reversal of
spring deformation, to simulate the strain reversal which very often happens within a
heated structure, and which is therefore essential to consider during modelling. The
component-based buckling element has been implemented within Vulcan. It has been
verified against ABAQUS models in isolated beam cases. A parametric study including
both isolated-beam cases and sub-frame analyses with connections was then carried
out. Results were compared for the same cases, but with and without the inclusion of
buckling elements. The influence of the buckling element on the structural response,
including the beam deflection and connection force transmission, have been analysed.
7. Summary, discussion, conclusions and recommendations for further work
159
7.2 DISCUSSION AND CONCLUSIONS
This research was inspired by the fact that both beam-web shear buckling and bottom-
flange buckling phenomena have been widely observed in full-scale fire tests, such as
the Cardington Fire Tests, as well as in accidental fires. Before this research had been
carried out, views on the effects of beam-end buckling on the connections adjacent to
the buckling zone varied. One speculation was that, after the beam-end buckling
occurred, the top bolt row would be seriously stretched due to the possibly large
rotation of the beam-end, and therefore top bolt row fracture could be a key factor
which might initiate member failure or even progressive collapse of a whole building.
The influence of these occurrences of beam-end buckling in the vicinity of the beam-
to-column connections of Class 1 and 2 steel sections under fire conditions include
beam survival temperature, effects on the adjacent connection bolt-row force
distribution, connection survival times and beam deflections.
It has been observed in experiments at a practical scale that bottom-flange buckling is
invariably accompanied by beam-web shear buckling. The rotation of the bottom
beam flange induces inevitable out-of-plane deflection of the beam web due to
deformation compatibility between the beam web and flange. However, it is often
assumed, particularly for plate-girders with thin webs, that beam-web shear buckling
can occur without accompanying flange buckling, although there is some minor
rotation of the bottom-flange. For steel beams at elevated temperatures, it is
therefore possible that either beam-web shear buckling or a combination of beam-
web shear buckling and bottom-flange buckling can occur. The occurrence of shear
buckling is influenced by the beam-end shear force, while the combination of both can
be triggered by compression force in the bottom flange, in combination with shear.
7. Summary, discussion, conclusions and recommendations for further work
160
This compression force can be generated either by beam-end hogging moment or a
combination of hogging moment and axial compression force due to restraint of
thermal expansion. This indicates that the combination of both buckling phenomena
tends to occur for steel beams with high axial restraint at high temperatures, because
such cases tend to produce a large net compression force, of which the beam bottom
flange force is usually a major component. The buckling type at the beam-end depends
on factors including beam-web aspect ratio, flange aspect ratio, beam length, external
load level, temperature and boundary conditions. This research has been limited to
beams in steel-framed construction, which would normally imply structures with wind
bracing around their perimeters. This bracing resists horizontal movements of the
structure, and therefore constrains the beams, producing large axial compressive
forces in the beams when they attempt to expand. For steel-framed beams without
bracing (typically in buildings with bracing concentrated into a central core), the edge
columns can be pushed out without applying much restraint to beam thermal
expansion. In such cases, bottom-flange buckling may not be initiated.
When a combination of beam-web shear buckling and bottom-flange buckling occurs,
the axial resistance of the bottom flange decreases as it deforms. This decrease leads
to reductions in the net beam-end axial and rotational stiffness. The column-face
connection is now located in series with a new rotational element, due to the
compressive displacement of the lower beam flange, which tends to rotate about a
centre near to the top bolt row. This leads to an increase of net beam-end rotation,
and therefore increased mid-span deflection. The net axial compression force may be
relieved due to the large compressive deformation of the buckling zone. The bending
moment in the buckling zone decreases because of the reduction of rotational stiffness
7. Summary, discussion, conclusions and recommendations for further work
161
at the beam-end. This implies lower forces to be resisted by the connection itself.
Hence, the stresses within the connection bolt rows tend to decrease when the
buckling element is taken into consideration. In general, by ignoring the buckling
element near to the beam-to-column connections in structural fire analysis, the results
tend to be on the safe side in terms of connection forces. In practical design based on
the Eurocode 3, the beam survival temperature is the temperature at which the beams’
axial forces change from compression to tension, when beams’ plastic moment
resistance decrease to zero. It could be reasoned that the initiation temperature of the
catenary stage is equivalent to its failure temperature under pure bending, when it
forms a plastic mechanism. This mimics the design limit-state critical temperature for
isolated beams designed to simple code-of–practice principles.
7.3 RECOMMENDATIONS FOR FURTHER WORK
Within the duration of a PhD project it is inevitable that some desirable further
developments of the research become apparent. A component-based beam-end
buckling model has been created in the form of a buckling element, as reported above.
This model has been applied to steel-framed structures. The following issues relate to
the PhD research done, and should be considered in future research work.
7.3.1 Behaviour of connections in fire
Several types of connections, such as fin plates, web cleats, flush, extended and
flexible end-plates, are commonly used in steel construction. The deformation types,
bolt-row force distributions and failure mechanisms vary between these types,
because of differences in their internal force distribution mechanisms. The current
study has only been considered extended end-plate connections with a limited range
of layouts and dimensions. The purpose of this has been to present examples which
7. Summary, discussion, conclusions and recommendations for further work
162
combine the component-based buckling element and a practical component-based
connection element in Vulcan, and to demonstrate the effects of the buckling element
on their local loading in fire conditions. Analyses need to be carried out on other
connection types, which have previously been shown to have very different
characteristics under combined loading. Parametric studies need particularly to
investigate different combinations of connection and beam-end flexibility. A general-
purpose component-based connection model actually exists (Dong et al., 2015) within
Vulcan, and this can be used with the component characterizations produced by
various researchers (Sarraj, 2007, Yu et al., 2009c, Taib and Burgess, 2011) to
represent connections of many different types. These can be combined with buckling
elements derived from different beam section dimensions so that the relationship
between connection ductility and beam buckling properties can be controlled
quantitatively. It should be possible to investigate the robustness of such
combinations and to attempt to develop principles to optimize this robustness.
7.3.2 Progressive collapse of buildings
It has been illustrated in the previous chapters that, by including component-based
beam-end buckling elements, the survival times of adjacent connections will be
influenced. In the time available for the work only two-span two-storey case studies
have been carried out, attempting to analyse quantitatively the influence of the
buckling elements on their adjacent connections. The analysis terminates when the
connection bolt rows completely fracture. Surrounding structure has been modelled to
simulate the constraint conditions of individual beams. It is clear that more complex
models need to be analysed, with boundary conditions closer to real cases. Moreover,
the progressive collapse of buildings can be historically-related. For instance, the
7. Summary, discussion, conclusions and recommendations for further work
163
horizontal force transferred from the beam to its attached column can differ, with and
without the bucking element, before the beam-to-column connections fracture.
Therefore, the initial deflections of the columns can vary after an attached beam has
fallen and frame stability has been regained. In the context of Vulcan analysis the
component-based buckling element is expected to be used in combination with the
static-dynamic procedure created by Sun (2012b). By involving the buckling element, it
will be possible to carry out more accurate performance-based fire analysis using
Vulcan.
7.3.3 Three-dimensional composite beam analysis at non-uniformly distributed
temperatures
It has been stated in Chapter 6 that the component-based buckling element is able to
deal with buckling problems considering different axial forces. In Chapter 6, the
buckling element was applied to steel beams with axial restraint, and the results
compared well with finite element analysis. This further showed that the buckling
element is able to deal with axial force automatically, as axial restraint is actually
providing a larger compressive force to the buckling element. Based on this premise, it
is reasonable that the component-based buckling element should be expected to be
applied to the analysis of composite floor systems at non-uniformly distributed
temperatures.
For beams at non-uniformly distributed temperatures, one key effect is that non-
uniformly distributed axial force across the beam depth will be produced. As the
buckling springs are able to deal with different axial forces automatically, it is possible
that the buckling element could consider non-uniformly distributed temperatures of
the beam. However, as the horizontal springs are only located at the top and bottom
7. Summary, discussion, conclusions and recommendations for further work
164
of the beam, it is only able to consider different temperatures at these two locations
on the cross section of the buckling element.
In three-dimensional composite floors, the concrete slabs will restrain the steel beams
from expansion. This is because on the one hand, most of the depth of the concrete
slab will have much lower temperatures than the unprotected steel beam underneath;
on the other hand, the thermal expansion of the concrete slab itself can be restrained
by any surrounding cooler slabs. The restraint from the composite slab restrains the
top flange of the steel beam from thermal expansion, and thus the net steel cross-
section acquires an induced compressive force which is balanced by tension in the
attached concrete slab; the lever arm between these two force resultants causes a
bending moment which forces the beam into thermal bowing towards the fire. In a 3-
dimensional slab, as against a simple composite beam, the thermal bowing is
restrained by the continuity away from any one heated beam, as well as by restraint to
thermal expansion, and therefore the compressive force in the bottom flange is
increased. This large compressive force, together with weakening of the steel as its
temperature rises, trigger bottom-flange buckling even though no strong bracing has
been applied to the frame. Such beam-end bottom-flange buckling can be widely
observed in photos (Newman et al., 2000) from the Cardington composite-framed Fire
Tests.
The analytical models (including both pure beam-web shear buckling and the
combination of beam-web shear buckling and bottom-flange buckling) are based on
the principle of plastic work-balance, which is a variant of the principle of stationary
potential energy for rigid-plastic systems. Therefore, selection of the appropriate yield
line mechanism is a key factor. Any change of yield-line mechanism will induce a
7. Summary, discussion, conclusions and recommendations for further work
165
change of the internal work, influencing the force-deflection relationship of the
buckling element. In extending the analytical buckling models from steel to composite
beams, it is necessary to check whether the yield-line mechanism is still applicable. For
instance, for a composite beam-end subjected to hogging moment, the reinforcement
within the concrete slab carries tension force instead of the top flange of the steel
beam. Therefore, a new yield zone in the reinforcing mesh may replace the initial
plastic zone in the beam top flange when creating the analytical model. It may be
possible to establish an equivalent-section criterion so that the analytical model can be
consistently applied to both steel and composite beams. The analytical results can be
compared with the existing full-scale fire tests (eg. the Cardington Fire Tests) for
further validation.
7.3.4 Buckling of cellular beams
A cellular beam is I-section beam with an array of holes along its web. It is currently
widely used, due to its ability to achieve large-spans while accommodating building
services within the structural depth of beam. The buckling behaviour of cellular beams
under fire conditions has not been sufficiently investigated. Due to the natural
relationship between cellular beams and I-section beams, it is reasonable to expect
that any analytical buckling model should be applicable, with appropriate
modifications, to cellular beams in the post-buckling stage.
The weakening of the webs of cellular beam makes it easier for beam-web shear
buckling to occur compared with I-section beams. If a combined buckling mode occurs,
the yield line mechanism may not change at the bottom flange, but significant
differences can be expected on the web, since it is very possible that only a part of the
beam web within the flange buckling zone. Therefore, the yield line mechanism for the
7. Summary, discussion, conclusions and recommendations for further work
166
beam web has to be reconsidered for cellular beams. Both the criterion for its
occurrence and the buckling region affected may be influenced by the distance
between two adjacent holes (the width of a “web-post”), the positions of the holes
and the height of the cellular beam.
A component-based buckling element has been created to simulate the plastic post-
buckling behaviour of steel beams in fire. By implementing this element into the three-
dimensional structural fire analysis software Vulcan, it enables to consider the effects
of the buckling elements on the robustness design of their adjacent connections.
Examples of isolated beams with the buckling element and the connection element
have been illustrated in this research. It can be expected that the buckling element be
involved in more complex performance-based frame analysis and be combined with
explicit dynamic procedure to simulate local and progressive collapse of a whole
building.
167
REFERENCES
AL-JABRI, K., BURGESS, I., LENNON, T. & PLANK, R. 2005. Moment–rotation–temperature
curves for semi-rigid joints. Journal of Constructional Steel Research, 61, 281-303.
AL-JABRI, K. S. 2011. Modelling and simulation of beam-to-column joints at elevated
temperature: a review. Journal of the Franklin Institute, 348, 1695-1716.
AL-JABRI, K. S., DAVISON, J. B. & BURGESS, I. W. 2008. Performance of beam-to-column joints
in fire—a review. Fire Safety Journal, 43, 50-62.
ANDERSON, D. & NAJAFI, A. 1994. Performance of composite connections: major axis end
plate joints. Journal of Constructional Steel Research, 31, 31-57.
ASFP 2010. Fire Protection for Structural Steel in Buildings (The Yellow Book), UK, The Steel
Construction Institute.
ASIC 1963. Specification for the design, fabrication and erection of structural steel for building,
American Institute of Steel Construction.
BAILEY, C. & MOORE, D. 2000a. The structural behaviour of steel frames with composite
floorslabs subject to fire. Part. 1: theory. Structural Engineer, 78(11), 19-27.
BAILEY, C. & MOORE, D. 2000b. The structural behaviour of steel frames with composite
floorslabs subject to fire. Part. 2: design. Structural Engineer, 78(11), 28-33.
BAILEY, C. G. 2004. Membrane action of slab/beam composite floor systems in fire.
Engineering structures, 26, 1691-1703.
BASLER, K. 1961a. Strength of plate girder in shear. Journal of the Structural Division ASCE,
87(ST7), 151-80.
BASLER, K. 1961b. Strength of plate girder under conbined bending and shear. Journal of the
Structural Division ASCE, 87(ST7), 181-97.
BASLER, K., YEN, B., MUELLER, J. & THURLIMANN, B. 1960. Web buckling tests on welded plate
girders, Fritz Engineering Laboratory, Lehigh University.
BLOCK, F. M. 2006. Development of a component-based finite element for steel beam-to-
column connections at elevated temperatures. PhD thesis, University of Sheffield.
BLOCK, F. M., BURGESS, I. W., DAVISON, J. B. & PLANK, R. J. 2007. The development of a
component-based connection element for endplate connections in fire. Fire Safety
Journal, 42, 498-506.
BRITISH STEEL TECHNICAL, 1987. BS 476 Fire Tests on Building Materials and Structures,
London, UK.
BRITISH STANDARDS INSTITUTE, 1990. BS 5950: Structural use of steel work in building: Part 8:
Code of practice for fire resistant design. London, UK
BURGESS, I. Connection modelling in fire. Proceedings of COST C26 workshop urban habitat
constructions under catastrophic events, Prague, 2007. 25-34.
BURGESS, I. the Influence of Connections on the Robustness of Composite Structures in Fire.
HKIE Fire Division one-day Symposium 2010: Fire Engineering for a Sustainable Future,
2010.
BURGESS, I., DAVISON, J. B., DONG, G. & HUANG, S.-S. 2012. The role of connections in the
response of steel frames to fire. Structural Engineering International, 22, 449-461.
BURGESS, I., HUANG, S. & STAIKOVA, S. A re-examination of the mechanics of tensile
membrane action in composite floor slabs in fire. 8th International Conference on
Structures in Fire, 2014.
168
CEN 2005a. BS EN 1993-1-1: Design of steel structures. Part 1.1: General structural rules. British
Standards Institution.
CEN 2005b. BS EN 1993-1-2. Design of steel structures. Part 1.2: General rules — Structural Fire
Design. British Standards Institution.
CEN 2005c. BS EN 1993-1-8. Design of steel structures, Part 1.8: Design of joints. European
Committee for Standardization.
CEN 2005d. BS EN 1994-1-2. Design of steel structures. Part 1.2: General rules — Structural Fire
Design. British Standards Institution.
CEN 2005e. BS EN 1994-1-8. Design of steel structures, Part 1.8: Design of joints. European
Committee for Standardization.
CEN 2006. BS EN 1993-1-5. Eurocode 3. Design of steel structures. Part 1.5: Plated structural
elements. British Standards Institution.
CLIMENHAGA, J. J. & JOHNSON, R. P. 1972. Moment-rotation curves for locally buckling beams.
Journal of the Structural Division, 98, 1239-1254.
COOKE, G. & LATHAM, D. 1987. The inherent fire resistance of a loaded steel framework. Steel
Construction Today, 1, 49-58.
DA SILVA, L. S., SANTIAGO, A. & REAL, P. V. 2001. A component model for the behaviour of
steel joints at elevated temperatures. Journal of Constructional Steel Research, 57,
1169-1195.
DHARMA, R. & TAN, K. 2008. Experimental and numerical investigation on ductility of
composite beams in the Hogging moment regions under fire conditions. Journal of
structural engineering, 134, 1873-1886.
DHARMA, R. B. 2007. Buckling behaviour of steel and composite beams at elevated
temperatures. PhD thesis, Nanyang Technological University.
DHARMA, R. B. & TAN, K.-H. 2007a. Rotational capacity of steel I-beams under fire conditions
Part I: Experimental study. Engineering structures, 29, 2391-2402.
DHARMA, R. B. & TAN, K.-H. 2007b. Rotational capacity of steel I-beams under fire conditions
Part II: Numerical simulations. Engineering structures, 29, 2403-2418.
DONG, G., BURGESS, I., DAVISON, B. & SUN, R. 2015. Development of a general component-
based connection element for structural fire engineering analysis. Journal of Structural
Fire Engineering, 6, 247-254.
ELGHAZOULI, A. & IZZUDDIN, B. Significance of local buckling for steel frames under fire
conditions. 4th International Conference on Steel and Aluminium Structures, 1999.
727-734.
FABIEN, Q., BURGESS, I. & HUANG, S.-S. Development and modification of yield line patterns in
thin slabs subjected to tensile membrane action. 9th International Conference on
Structures in Fire, 2016.
FOSTER, S., BAILEY, C., BURGESS, I. & PLANK, R. 2004. Experimental behaviour of concrete floor
slabs at large displacements. Engineering structures, 26, 1231-1247.
FRANSSEN, J. 2011. User’s manual for SAFIR 2011 a computer program for analysis of
structures subjected to fire. University of Liege, Belgium.
FUJII, T. On an improved theory for Dr. Basler’s theory. Proceeding of 8th Congress, IABSE, New
York, 1968. 477-487.
GALAMBOS, T. V. 1998. Guide to stability design criteria for metal structures, Structure
Stability Research Council.
169
GANN, R. 2005. NIST NCSTAR 1: Final report of the national construction safety team on the
collapse of the world trade center twin towers. Federal Building and Fire Safety
Investigation of the World Trade Center Disaster. Gaithersburg,(MD): National Institute
of Standards and Technology (NIST).
GANN, R. G. 2008. Final Report on the Collapse of World Trade Center Building 7,Federal
Building and Fire Safety Investigation of the World Trade Center Disaster. The National
Institute of Standards and Technology (NIST), 130.
GERSTLE, K. H. 1988. Effect of connections on frames. Journal of Constructional Steel Research,
10, 241-267.
GIONCU, V. & MAZZOLANI, F. 2003. Ductility of seismic-resistant steel structures, CRC Press.
GIONCU, V. & PETCU, D. 1995. Numerical investigations on the rotation capacity of beams and
beam-columns. Proceedings of International Colloquim Stability of Steel Structures.
Further Direction in Stability Research and Design, European Session, 1, 163-174.
GIONCU, V. & PETCU, D. 1997. Available rotation capacity of wide-flange beams and beam-
columns Part 1. Theoretical approaches. Journal of Constructional Steel Research, 43,
161-217.
GUO, S. 2012. Experimental and numerical study on restrained composite slab during heating
and cooling. Journal of Constructional Steel Research, 69, 95-105.
HANTOUCHE, E. G., ABBOUD, N. H., MOROVAT, M. A. & ENGELHARDT, M. D. 2016. Analysis of
steel bolted double angle connections at elevated temperatures. Fire Safety Journal,
83, 79-89.
von Mises, R. 1913. Mechanik der festen Körper im plastisch deformablen Zustand. Göttin.
Nachr. Math. Phys., vol. 1, pp. 582–592.
HIBBIT, D., KARLSSON, B. & SORENSON, P. 2005. ABAQUS reference manual 6.7. Pawtucket:
ABAQUS Inc.
HUANG, S.-S., DAVISON, B. & BURGESS, I. W. 2013. Experiments on reverse-channel
connections at elevated temperatures. Engineering structures, 49, 973-982.
HUANG, Z., BURGESS, I. & PLANK, R. 1999a. Three-dimensional modelling of two full-scale fire
tests on a composite building. Proceedings of the Institution of Civil Engineers.
Structures and buildings, 134, 243-255.
HUANG, Z., BURGESS, I. W. & PLANK, R. J. 1999b. The influence of shear connectors on the
behaviour of composite steel-framed buildings in fire. Journal of Constructional Steel
Research, 51, 219-237.
HUANG, Z., BURGESS, I. W. & PLANK, R. J. 2000. Three-dimensional analysis of composite steel-
framed buildings in fire. Journal of structural engineering, 126, 389-397.
HUANG, Z., BURGESS, I. W. & PLANK, R. J. 2003a. Modeling membrane action of concrete slabs
in composite buildings in fire. I: Theoretical development. Journal of structural
engineering, 129, 1093-1102.
HUANG, Z., BURGESS, I. W. & PLANK, R. J. 2003b. Modeling membrane action of concrete slabs
in composite buildings in fire. II: Validations. Journal of structural engineering, 129,
1103-1112.
ISO834 1975. International Standard 834: Fire Resistance Test - Elements of building
construction, International Organization for Standardization, Geneva, Switzerland.
CHIANG, D.-Y. 1999. The generalized Masing models for deteriorating hysteresis and cyclic
plasticity. Applied Mathematical Modelling, 23, 847-863.
170
JUNIOR, V. S. & CREUS, G. 2007. Simplified elastoplastic analysis of general frames on fire.
Engineering structures, 29, 511-518.
KATO, B. 1965. Buckling strength of plates in the plastic range. Publications of IABSE, 25.
KOUVELIS, P. & YU, G. 2013. Robust discrete optimization and its applications, Springer Science
& Business Media.
KUHLMANN, U. 1986. Rotationskapazität biegebeanspruchter I-Profile unter Berücksichtigung
des plastischen Beulens, Inst. für Konstruktiven Ingenieurbau, Ruhr-Univ.
LEE, S. C., LEE, D. S. & YOO, C. H. 2008. Ultimate shear strength of long web panels. Journal of
Constructional Steel Research, 64, 1357-1365.
LEE, S. C. & YOO, C. H. 1998. Strength of plate girder web panels under pure shear. Journal of
Structural Engineering, 124, 184-204.
LENNON, T. & MOORE, D. 2004. Results and observations from full-scale fire test at BRE
Cardington, 16 January 2003. BRE, Watford, UK.
LI, G.-Q. & GUO, S.-X. 2008. Experiment on restrained steel beams subjected to heating and
cooling. Journal of Constructional Steel Research, 64, 268-274.
LIEN, K., CHIOU, Y., WANG, R. & HSIAO, P. 2010. Vector form intrinsic finite element analysis of
nonlinear behavior of steel structures exposed to fire. Engineering structures, 32, 80-
92.
LIEW, J. R. & CHEN, H. 2004. Explosion and fire analysis of steel frames using fiber element
approach. Journal of structural engineering, 130, 991-1000.
LIU, T., FAHAD, M. & DAVIES, J. 2002. Experimental investigation of behaviour of axially
restrained steel beams in fire. Journal of Constructional Steel Research, 58, 1211-1230.
LTD, V. E. 2015. Sheffield. Available: http://www.vulcan-eng.com/ 2015].
MALHOTRA, H. L. 1980. Fire resistance versus fire behaviour. Fire Prevention, 134, 4.
MCALLISTER, T. & CORLEY, G. 2002. World Trade Center Building performance study: Data
collection, preliminary observations, and recommendations, Federal Emergency
Management Agency.
NAJJAR, S. & BURGESS, I. 1996. A nonlinear analysis for three-dimensional steel frames in fire
conditions. Engineering structures, 18, 77-89.
NEWMAN, G. 2000. A NEW APPROACH TO MULTI-STOREY STEEL FRAMED BUILDINGS Large-
Scale fire tests have shown that the fire performance of real buidings is much better
than expected. FIRE SAFETY ENGINEERING, 7, 14-19.
NEWMAN, G. M., ROBINSON, J. T. & BAILEY, C. G. 2000. Fire safe design: A new approach to
multi-storey steel-framed buildings, Steel Construction Institute Ascot.
NIST 2008. Federal Building and Fire Safety Investigation of the World Trade Centre Disaster:
Structural Response and Probable Collapse Sequence of World Trade Centre Building 7.
Gaithersburg: NIST Report NCSTAR 1-9(2).
O'CONNOR, M. & MARTIN, D. 1998. Behaviour of a multi-storey steel framed building
subjected to fire attack. Journal of Constructional Steel Research, 1, 295.
PEARSON, C. & DELATTE, N. 2005. Ronan point apartment tower collapse and its effect on
building codes. Journal of Performance of Constructed Facilities, 19, 172-177.
PORTER, D., ROCKEY, K. & EVANS, H. 1987. The collapse behaviour of plate girders loaded in
shear, University College Department of Civil and Structural Engineering.
ROCKEY, K., EVANS, H. & PORTER, D. A design method for predicting the collapse behaviour of
plate girders. ICE proceedings, 1978. Ice Virtual Library, 85-112.
171
ROCKEY, K. & SKALOUD, M. Influence of flange stiffness upon the load carrying capacity of
webs in shear. 8th Congress of IABSE, Final Report, New York, 1968.
ROCKEY, K. & SKALOUD, M. 1972. The ultimate load behaviour of plate girders loaded in shear.
Struct. Eng, 50, 29-47.
ROTTER, J., SANAD, A., USMANI, A. & GILLIE, M. Structural performance of redundant
structures under local fires. Proceedings of Interflam, 1999.
SAAB, H. & NETHERCOT, D. 1991. Modelling steel frame behaviour under fire conditions.
Engineering structures, 13, 371-382.
SARRAJ, M. 2007. The behaviour of steel fin plate connections in fire. University of Sheffield.
SLOTINE, J.-J. E. & LI, W. 1991. Applied nonlinear control, prentice-Hall Englewood Cliffs, NJ.
SPYROU, S., DAVISON, J., BURGESS, I. & PLANK, R. 2004a. Experimental and analytical
investigation of the ‘compression zone’component within a steel joint at elevated
temperatures. Journal of Constructional Steel Research, 60, 841-865.
SPYROU, S., DAVISON, J., BURGESS, I. & PLANK, R. 2004b. Experimental and analytical
investigation of the ‘tension zone’components within a steel joint at elevated
temperatures. Journal of Constructional Steel Research, 60, 867-896.
STANDARD, B. B. 1990. Structural use of steelwork in building, Part 8: Code of practice for fire
resistant design. British Standard Institution.
STAROSSEK, U. & HABERLAND, M. 2010. Disproportionate collapse: terminology and
procedures. Journal of Performance of Constructed Facilities, 24, 519-528.
SÜ LI, E. & MAYERS, D. F. 2003. An introduction to numerical analysis, Cambridge university
press.
SUN, R., BURGESS, I. W., HUANG, Z. & DONG, G. 2015. Progressive failure modelling and
ductility demand of steel beam-to-column connections in fire. Engineering structures,
89, 66-78.
SUN, R., HUANG, Z. & BURGESS, I. W. 2012a. The collapse behaviour of braced steel frames
exposed to fire. Journal of Constructional Steel Research, 72, 130-142.
SUN, R., HUANG, Z. & BURGESS, I. W. 2012b. Progressive collapse analysis of steel structures
under fire conditions. Engineering structures, 34, 400-413.
TAIB, M. & BURGESS, I. W. 2011. A Component-Based Model for Fin Plate Connections in Fire.
Proc., Applications of Structural Fire Engineering, Czech Technical Univ., Prague, Czech
Republic, 225-230.
TAN, K.-H. & HUANG, Z.-F. 2005. Structural responses of axially restrained steel beams with
semirigid moment connection in fire. Journal of structural engineering, 131, 541-551.
TIMOSHENKO, S. P. & GERE, J. M. 1961. Theory of elastic stability. 1961. McGraw-Hill, New
York.
TIMOSHENKO, S. P. & GERE, J. M. 2009. Theory of elastic stability, Courier Corporation.
TORIĆ, N., SUN, R. R. & BURGESS, I. W. Testing the acceptability of different creep strain
calculation models in structural fire analysis. 8th International Conference on
Structures in Fire, 2014. 11-13.
TSCHEMMERNEGG, F., TAUTSCHNIG, A., KLEIN, H., BRAUN, CH.HUMER, CH. 1987. Zur
Nachgiebigkeit von Rahmenknoten (Semi-rigid joints of frame structures Vol. 1– in
German). Stahlbau 56 Heft 10, 299-306.
USMANI, A., DRYSDALE, D., ROTTER, J., SANAD, A., GILLIE, M. & LAMONT, S. 2000. Behaviour of
steel framed structures under fire conditions. University of Edinburgh, Edinburgh.
172
USMANI, A., ROTTER, J., LAMONT, S., SANAD, A. & GILLIE, M. 2001. Fundamental principles of
structural behaviour under thermal effects. Fire Safety Journal, 36, 721-744.
VIMONSATIT, V., TAN, K.-H. & TING, S.-K. 2007a. Shear strength of plate girder web panel at
elevated temperature. Journal of Constructional Steel Research, 63, 1442-1451.
VIMONSATIT, V., TAN, K. & QIAN, Z. 2007b. Testing of plate girder web panel loaded in shear at
elevated temperature. Journal of Structural Engineering, 133, 815-824.
WAGNER, H. 1931. Flat sheet metal girder with very thin metal web, National Advisory
Committee for Aeronautics.
WALD, F., DA SILVA, L. S., MOORE, D., LENNON, T., CHLADNA, M., SANTIAGO, A., BENEŠ, M. &
BORGES, L. 2006. Experimental behaviour of a steel structure under natural fire. Fire
Safety Journal, 41, 509-522.
WANG, Y., DAI, X. & BAILEY, C. 2011. An experimental study of relative structural fire
behaviour and robustness of different types of steel joint in restrained steel frames.
Journal of Constructional Steel Research, 67, 1149-1163.
WILSON, J. M. 1886. On specifications for strength of iron bridges. Transactions of the
American Society of Civil Engineers, 15, 389-414.
YIN, Y. & WANG, Y. 2004. A numerical study of large deflection behaviour of restrained steel
beams at elevated temperatures. Journal of Constructional Steel Research, 60, 1029-
1047.
YIN, Y. & WANG, Y. 2005. Analysis of catenary action in steel beams using a simplified hand
calculation method, Part 1: theory and validation for uniform temperature distribution.
Journal of Constructional Steel Research, 61, 183-211.
YOO, C. H. & LEE, S. C. 2006. Mechanics of web panel postbuckling behavior in shear. Journal
of Structural Engineering, 132, 1580-1589.
YU, H., BURGESS, I., DAVISON, J. & PLANK, R. 2009a. Development of a yield-line model for
endplate connections in fire. Journal of Constructional Steel Research, 65, 1279-1289.
YU, H., BURGESS, I., DAVISON, J. & PLANK, R. 2009b. Tying capacity of web cleat connections in
fire, Part 1: Test and finite element simulation. Engineering structures, 31, 651-663.
YU, H., BURGESS, I., DAVISON, J. & PLANK, R. 2009c. Tying capacity of web cleat connections in
fire, Part 2: Development of component-based model. Engineering structures, 31, 697-
708.
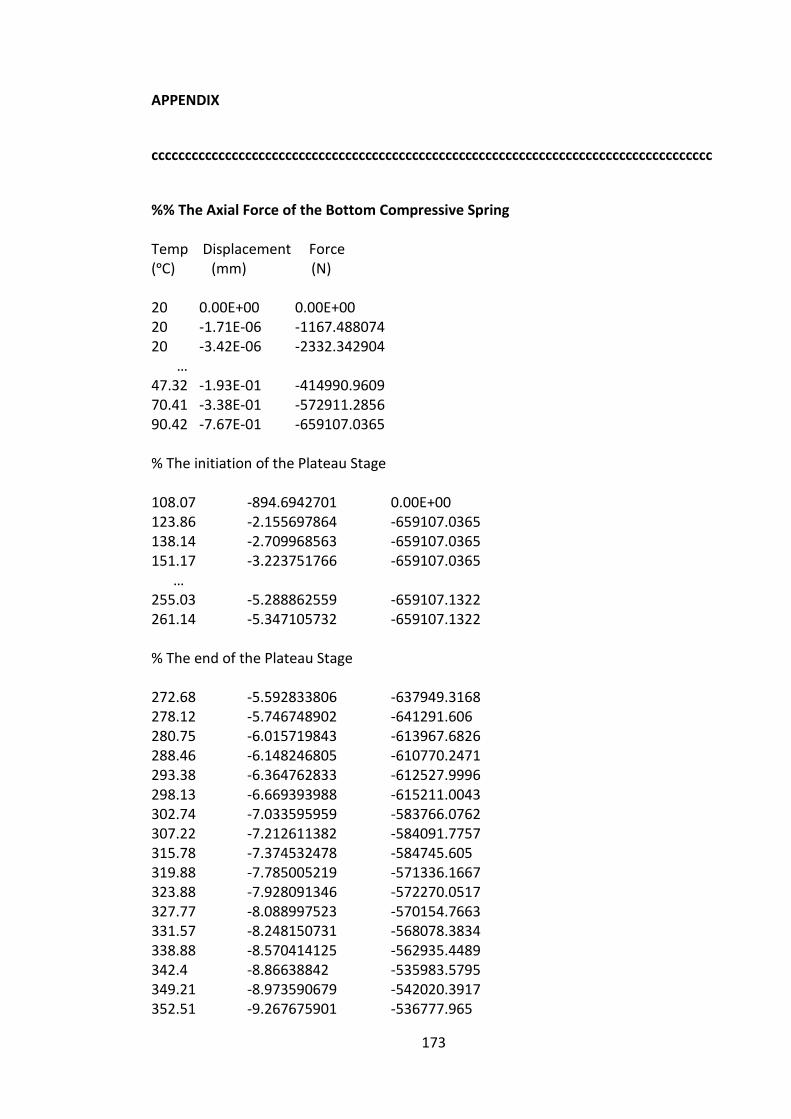
173
APPENDIX
cccccccccccccccccccccccccccccccccccccccccccccccccccccccccccccccccccccccccccccccccccc
%% The Axial Force of the Bottom Compressive Spring
Temp Displacement Force (ᵒC) (mm) (N) 20 0.00E+00 0.00E+00 20 -1.71E-06 -1167.488074 20 -3.42E-06 -2332.342904 … 47.32 -1.93E-01 -414990.9609 70.41 -3.38E-01 -572911.2856 90.42 -7.67E-01 -659107.0365 % The initiation of the Plateau Stage 108.07 -894.6942701 0.00E+00 123.86 -2.155697864 -659107.0365 138.14 -2.709968563 -659107.0365 151.17 -3.223751766 -659107.0365 … 255.03 -5.288862559 -659107.1322 261.14 -5.347105732 -659107.1322 % The end of the Plateau Stage 272.68 -5.592833806 -637949.3168 278.12 -5.746748902 -641291.606 280.75 -6.015719843 -613967.6826 288.46 -6.148246805 -610770.2471 293.38 -6.364762833 -612527.9996 298.13 -6.669393988 -615211.0043 302.74 -7.033595959 -583766.0762 307.22 -7.212611382 -584091.7757 315.78 -7.374532478 -584745.605 319.88 -7.785005219 -571336.1667 323.88 -7.928091346 -572270.0517 327.77 -8.088997523 -570154.7663 331.57 -8.248150731 -568078.3834 338.88 -8.570414125 -562935.4489 342.4 -8.86638842 -535983.5795 349.21 -8.973590679 -542020.3917 352.51 -9.267675901 -536777.965
174
355.73 -9.412503184 -533249.5237 361.97 -9.555128787 -530222.5922 365 -9.766866767 -534676.0695 367.97 -9.957780972 -522186.9863 373.73 -10.13856431 -530546.8868 379.28 -10.24177926 -529659.1959 381.98 -10.49865706 -522305.5201 384.63 -10.61857801 -519903.9014 389.8 -10.86044593 -513932.9986 394.79 -10.92410958 -519483.692 397.23 -11.1372007 -515277.8874 401.99 -11.28751609 -504075.3282 404.31 -11.50548656 -499418.2427 408.85 -11.57176787 -499471.7186 411.07 -11.77334763 -494013.1814 415.41 -11.88534219 -488032.3572 417.54 -12.07496457 -484059.3472 421.7 -12.1793867 -478393.6699 423.74 -12.36612613 -474577.1902 427.74 -12.45682816 -469985.8132 429.69 -12.65010763 -465669.8302 431.63 -12.71976402 -465857.7994 435.42 -12.80860389 -462292.1138 437.28 -12.97916779 -458139.7809 439.12 -13.0813893 -453726.1753 442.73 -13.25886092 -447965.0027 444.5 -13.35369756 -445104.1194 451.39 -13.73909954 -429991.9827 454.72 -13.87234082 -425648.6333 461.17 -14.03178071 -416404.9989 464.29 -14.37873332 -410298.4918 467.35 -14.55102928 -404752.0297 473.28 -14.73044155 -397161.0525 476.17 -15.00772656 -393027.0856 478.99 -15.18268817 -386711.3485 484.49 -15.54683945 -374651.9636 487.17 -15.69141698 -369176.9453 492.38 -15.91648312 -368508.6796 497.42 -15.92220819 -375766.7651 499.87 -16.09716945 -375584.1462 502.29 -16.22989879 -371276.5867 507.01 -16.54686738 -358875.0982 509.31 -16.84535563 -340571.678 513.82 -16.9258777 -351677.3689 516.02 -17.29290201 -324960.2157 520.34 -17.55344285 -319358.2388 522.45 -17.66330013 -318113.6636 526.58 -17.9103224 -311316.2574 528.6 -18.06299069 -306958.4386
175
532.57 -18.16354016 -302774.3382 534.52 -18.40259315 -299188.2762 538.34 -18.52638009 -294891.9613 540.21 -18.73343037 -292084.6157 543.89 -18.93364439 -288109.58 545.69 -19.07720086 -283276.8683 549.24 -19.34305128 -271632.6476 550.98 -19.46860121 -271538.078 554.41 -19.58825232 -273165.9103 556.09 -19.68832168 -271274.695 559.4 -19.90530862 -266517.5339 562.64 -20.02264766 -261253.7001 564.23 -20.21663443 -259183.0986 567.37 -20.43277855 -253895.394 570.45 -20.53648102 -249005.3726 571.96 -20.75629492 -245986.2755 574.94 -20.86236895 -242206.9969 576.41 -21.05508051 -239638.2775 579.31 -21.26502883 -235898.774 582.15 -21.33699038 -232949.9049 583.55 -21.53513575 -230905.4335 586.31 -21.63856777 -227624.2479 587.67 -21.82726248 -225632.1321 590.36 -22.03847815 -221172.0978 591.68 -22.14780582 -218710.1398 594.3 -22.72136021 -194322.7782 596.87 -22.81657866 -192322.2645 599.4 -23.06609863 -193867.5549 601.89 -23.29684195 -189394.0493 603.12 -23.40005368 -189377.387 605.54 -23.73896732 -179955.5126 607.93 -23.75141178 -187643.6763 610.28 -23.76209497 -194044.9555 612.6 -23.86418785 -190823.0797 613.74 -24.04970285 -188087.3408 616 -24.20963426 -186193.7451 618.23 -24.37726993 -184149.2161 619.33 -24.64776207 -175287.4761 621.51 -24.74468698 -177612.1342 623.66 -24.9362864 -174788.8133 624.72 -25.03476689 -173818.2974 626.82 -25.23683515 -171236.8867 628.9 -25.36291765 -167531.4722 629.92 -25.58856943 -166325.222 631.96 -25.79970907 -163023.4535 632.96 -25.92953917 -161665.7542 634.95 -26.28241096 -153264.3438 636.92 -26.37904141 -155030.7178 638.86 -26.51350759 -151830.9795
176
639.82 -26.74374681 -150204.0343 641.72 -26.98168855 -146691.7921 643.6 -27.08729774 -143091.866 644.53 -27.30986037 -142772.2535 646.37 -27.57228092 -138704.9997 647.29 -27.72180899 -136229.1565 650.89 -27.90399566 -140531.3428 652.66 -28.03049132 -140307.8153 656.13 -28.26350492 -138973.6337 657.84 -28.73215212 -132431.8939 659.53 -28.99669744 -129492.8234 662.85 -29.44646912 -125105.2374 664.48 -29.62524617 -125502.7462 667.69 -30.24154061 -117623.8762 669.27 -30.43719874 -117219.9282 672.39 -30.77601879 -110456.0437 673.92 -31.38666974 -106841.785 675.44 -31.58470872 -106587.3303 676.19 -31.77096186 -103391.0775 676.565 -31.84030033 -104299.39 676.7525 -32.00262448 -100907.4557 676.94 -32.22103807 -101305.6083 677.685 -32.29314508 -99678.70964 678.43 -32.62857849 -99699.29757 679.9 -33.41501939 -97524.24201 681.36 -33.96552705 -93667.51271 682.8 -34.29907822 -92576.41035 684.23 -34.29706636 -89964.08906 687.05 -34.29421898 -84874.00528 688.44 -34.29158189 -81958.33691 689.82 -34.28602104 -78037.64228 692.54 -34.29101631 -76246.07471 693.88 -34.26839924 -66697.95979 695.21 -34.26013936 -62362.49003 697.83 -34.24250551 -53805.53343 699.13 -34.23241306 -49359.74288 701.68 -34.23033272 -47455.86703 702.94 -34.21286067 -41833.01184 704.2 -34.20539044 -39288.5012 705.44 -34.20189375 -37965.29355 707.89 -34.20065228 -37060.99004 709.1 -34.18509492 -32261.47747 710.3 -34.17717648 -29740.54391 711.49 -34.17140109 -27870.39873 712.67 -34.16568507 -26042.72978 715.01 -34.16562102 -25660.08078 716.16 -34.15021325 -21174.97272 717.31 -34.14176343 -18681.63742 718.45 -34.13578176 -16902.82106
177
720.7 -34.12538614 -13843.77346 721.81 -34.11744738 -11605.43764 722.91 -34.11174444 -9996.938221 725.1 -34.10247051 -7407.719466 726.18 -34.09651884 -5794.138327 727.25 -34.08842427 -3643.497197 728.31 -34.08273413 -2144.776373 730.42 -34.0839769 -2433.304885 % The bottom spring goes into tension 731.46 -34.06431774 0 732.5 -34.05777491 0 734.55 -34.0552123 0 735.56 -34.04236292 0 736.57 -34.03116571 0 738.56 -34.02637352 0 739.55 -34.01711621 0 740.53 -34.011734 0 742.47 -34.00881056 0 743.43 -34.00183908 0 744.39 -33.99567735 0 746.28 -33.99081302 0 747.22 -33.98221695 0 748.15 -33.97681155 0 749.08 -33.97179623 0 750 -33.96659584 0 ccccccccccccccccccccccccccccccccccccccccccccccccccccccccccccccccccccccccccccccccccc
%% The Axial Force of the Bottom Tension Spring
Temp Displacement Force (ᵒC) (mm) (N) 20 0.00E+00 0.0000 47.32 -3.42E-03 0.0000 … % The bottom tension force starts to be activated
730.42
-34.07079902
929.6488432 731.46
-34.0646232
2471.137639
732.5
-34.05775442
4145.439403 733.52
-34.05517914
4751.935725
734.55
-34.05055009
5837.205119 735.56
-34.04201453
7808.653645
736.57
-34.03954034
8348.027493 736.57
-34.03119859
10236.65254
738.56
-34.02940311
10561.36037
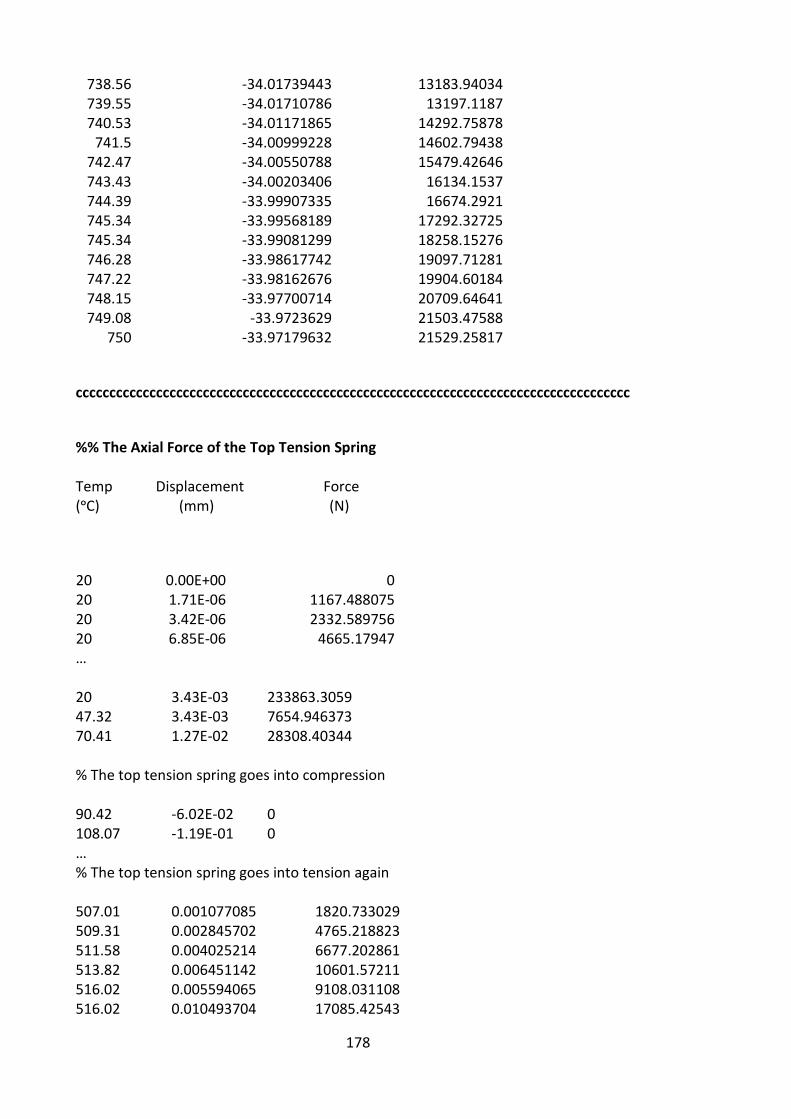
178
738.56
-34.01739443
13183.94034 739.55
-34.01710786
13197.1187
740.53
-34.01171865
14292.75878 741.5
-34.00999228
14602.79438
742.47
-34.00550788
15479.42646 743.43
-34.00203406
16134.1537
744.39
-33.99907335
16674.2921 745.34
-33.99568189
17292.32725
745.34
-33.99081299
18258.15276 746.28
-33.98617742
19097.71281
747.22
-33.98162676
19904.60184 748.15
-33.97700714
20709.64641
749.08
-33.9723629
21503.47588 750
-33.97179632
21529.25817
ccccccccccccccccccccccccccccccccccccccccccccccccccccccccccccccccccccccccccccccccccc
%% The Axial Force of the Top Tension Spring
Temp Displacement Force (ᵒC) (mm) (N)
20
0.00E+00 0 20
1.71E-06 1167.488075
20
3.42E-06 2332.589756 20
6.85E-06 4665.17947
… 20 3.43E-03 233863.3059 47.32 3.43E-03 7654.946373 70.41 1.27E-02 28308.40344 % The top tension spring goes into compression 90.42 -6.02E-02 0 108.07 -1.19E-01 0 … % The top tension spring goes into tension again 507.01 0.001077085 1820.733029 509.31 0.002845702 4765.218823 511.58 0.004025214 6677.202861 513.82 0.006451142 10601.57211 516.02 0.005594065 9108.031108 516.02 0.010493704 17085.42543
179
518.2 0.011500229 18550.94832 520.34 0.013069555 20889.12789 522.45 0.013587999 21519.61965 522.45 0.015002171 23759.27635 524.53 0.016903518 26527.49863 526.58 0.017140564 26656.66929 526.58 0.018863326 29335.87447 528.6 0.020839281 32117.92466 530.6 0.021071895 32185.18356 532.57 0.023893237 36169.20331 532.57 0.024426987 36977.18443 534.52 0.026280135 39428.29282 536.44 0.028171322 41891.85387 538.34 0.02961273 43646.44646 538.34 0.030085656 44343.49664 540.21 0.032158048 46982.41806 542.06 0.033995723 49232.59326 543.89 0.034380768 49355.40559 543.89 0.035426486 50856.58979 545.69 0.038299483 54504.49624 547.48 0.040187021 56693.53892 549.24 0.039995459 55936.82405 550.98 0.04195013 58166.14146 550.98 0.043763665 60680.7065 552.7 0.045554761 62622.65538 554.41 0.04849548 66092.06536 556.09 0.04986914 67385.16443 556.09 0.050441514 68158.57835 557.75 0.052400869 70204.9877 559.4 0.054008726 71743.28046 561.03 0.055325841 72869.65079 562.64 0.058113963 75895.28075 564.23 0.058724566 76047.42537 564.23 0.060745331 78664.28449 565.81 0.062969229 80856.63037 567.37 0.064930351 82674.82599 568.92 0.065799066 83076.11638 570.45 0.068588288 85872.47715 570.45 0.069292582 86754.25228 571.96 0.071297998 88521.00984 573.46 0.073313685 90263.61617 574.94 0.074878605 91424.47412 574.94 0.075358632 92010.5727 576.41 0.077832836 94240.78599 577.87 0.079992869 96049.06766 579.31 0.081208609 96700.6535 580.73 0.083879961 99058.46935 582.15 0.085754996 100431.2453 582.15 0.08648944 101291.3837
180
583.55 0.088687743 103007.8309 584.93 0.090921651 104735.3211 586.31 0.092507296 105679.6182 586.31 0.093226049 106500.7158 587.67 0.095542403 108248.9217 589.02 0.097354388 109393.5845 590.36 0.100202979 111666.5129 591.68 0.101774721 112489.6397 591.68 0.102621951 113426.0673 593 0.104780847 114856.4032 594.3 0.110370727 119992.1986 595.59 0.111675462 120415.0855 596.87 0.112215276 120004.4887 596.87 0.113481802 121358.9287 599.4 0.11856353 124720.356 600.65 0.120595386 125671.6905 601.89 0.12150805 125307.6982 603.12 0.122807282 125333.6662 603.12 0.124597515 127160.7272 604.34 0.127927706 129206.5756 605.54 0.129944842 129896.827 606.74 0.13141079 130004.6702 607.93 0.133875334 131076.0257 609.11 0.136430608 132201.3957 610.28 0.13904535 133348.8875 611.44 0.142119982 134897.6043 612.6 0.143845532 135123.3503 613.74 0.144752157 134583.2727 613.74 0.147162091 136823.9077 614.88 0.149525754 137588.7763 616 0.152858756 139221.6146 617.12 0.155495673 140169.4165 618.23 0.156789948 139888.1777 619.33 0.157969934 139499.1369 619.33 0.162007307 143009.5684 620.43 0.163520979 142834.1361 621.51 0.166585837 143932.873 622.59 0.169706276 144992.8172 623.66 0.171320958 144817.5971 624.72 0.172550969 144285.4829 624.72 0.17581425 146812.0633 625.78 0.179059016 147757.9099 626.82 0.182827199 149025.2814 627.87 0.184477315 148722.261 628.9 0.186367232 148499.7835 628.9 0.18985098 150939.4765 629.92 0.193259892 151741.4409 630.94 0.196818957 152568.6605 631.96 0.198900765 152412.1433
181
632.96 0.202685866 153287.7303 632.96 0.204663542 154472.4679 633.96 0.208561134 155306.1137 634.95 0.21437658 157154.2215 635.94 0.216960433 157114.8846 636.92 0.219627426 157101.1611 637.89 0.223140878 157510.5252 638.86 0.225617669 157162.6015 638.86 0.230219542 159665.046 639.82 0.234841595 160482.1737 640.77 0.239642988 161323.0864 641.72 0.244613364 162163.5899 642.66 0.247667718 162087.937 643.6 0.251545357 162338.9214 644.53 0.255114045 162200.1859 644.53 0.259794656 164400.163 645.46 0.265456893 165252.5187 646.37 0.271418921 166170.9696 647.29 0.273994304 165695.4125 647.29 0.277792644 167142.409 649.1 0.289232059 168396.0604 650.89 0.299152505 168890.7613 652.66 0.299720627 165594.7512 652.66 0.314310012 170868.3953 654.4 0.330914926 172925.5867 656.13 0.33710379 171742.0835 656.13 0.343992077 173636.4128 657.84 0.363620757 175781.6322 659.53 0.379929608 176737.5675 659.53 0.382932322 177426.36 661.2 0.402201004 178692.5859 662.85 0.421820114 179697.4318 664.48 0.422901642 176134.7056 664.48 0.443385249 180739.9403 666.09 0.47058715 182344.1701 667.69 0.497282367 183386.0491 669.27 0.498024624 179598.7198 670.84 0.558732153 185160.6014 672.39 0.560029609 181330.5871 672.39 0.599023198 186236.3599 673.92 0.646381665 187138.3502 675.44 0.704275328 187705.858 676.94 0.706112456 183717.3231 676.19 0.736840536 187696.8018 676.94 0.755966356 186223.1479 676.565 0.785853219 188296.7341 676.7525 0.785204514 187486.0498 676.94 0.849214408 187362.8257 678.43 0.849614731 183450.4382
182
677.685 1.203905596 165290.1646 678.43 1.703570672 185715.2676 679.9 2.525439037 183389.9387 681.36 3.417854191 181080.442 682.8 4.980968688 178802.5507 684.23 6.530419813 176540.5113 685.65 8.44919199 174294.2648 687.05 9.17552572 172079.663 687.05 10.16824034 172079.663 688.44 12.17881107 169880.8934 689.82 12.80953672 167697.9167 689.82 13.7854901 167697.9167 691.19 15.64411213 165530.7723 692.54 15.65851821 163395.2725 692.54 17.42162394 163395.2725 693.88 19.12780115 161275.5853 695.21 19.36993655 159171.7107 695.21 20.89403673 159171.7107 696.53 22.55407265 157083.6683 697.83 24.17612411 155027.2509 699.13 24.23441709 151304.5505 699.13 25.83984427 152970.8336 700.41 27.08522832 151270.3362 701.68 27.18166589 150265.866 701.68 27.8569617 150265.866 702.94 28.62186878 149269.2922 704.2 28.62713221 148188.1344 704.2 29.47961556 148272.7185 705.44 29.9039228 147291.9671 705.44 30.14182143 147291.9671 706.67 30.97252127 146319.1318 707.89 30.97748781 145354.193 707.89 31.63094469 145354.193 709.1 32.33889097 144397.1703 709.1 32.43331054 144397.1703 710.3 33.14180912 143448.0538 711.49 33.14681462 142506.8535 711.49 33.8484659 142506.8535 712.67 34.46223519 141573.5594 712.67 34.54151656 141573.5594 713.85 35.24029312 140640.2653 715.01 35.24529328 139722.7838 715.01 35.92298174 139722.7838 716.16 36.51860354 138813.2184 716.16 36.6015795 138813.2184 717.31 37.27677308 137903.6529 718.45 37.76115456 137001.9938 718.45 37.94739872 137001.9938 719.58 38.61109948 136108.2409
183
720.7 39.0987274 135222.4041 720.7 39.26959471 135222.4041 721.81 39.94567082 134344.4736 722.91 40.43540298 133474.4494 722.91 40.60191148 133474.4494 724.01 41.25852908 132604.4252 725.1 41.77015811 131742.317 725.1 41.91974432 131742.317 726.18 42.47105851 130888.1152 727.25 42.57014248 129997.1292 727.25 43.22680121 130041.8196 728.31 43.72685355 129203.4401 728.31 43.89046659 129203.4401 729.37 44.4799335 128365.0508 730.42 44.5090803 127534.5776 730.42 45.27982363 127534.5776 731.46 45.9333676 126712.0107 732.5 46.04895952 125889.4437 732.5 46.66861274 125889.4437 733.52 47.07603338 125082.6992 734.55 47.14717912 124268.0385 734.55 48.04645551 124268.0385 735.56 48.42042463 123469.2002 736.57 48.47301344 122670.3619 736.57 49.3831413 122670.3619 737.57 49.74177595 121879.4397 738.56 49.89516871 121096.4238 738.56 50.7509032 121096.4238 739.55 51.14361357 120313.3981 740.53 51.33830552 119538.2885 740.53 52.22632133 119538.2885 741.5 52.71508224 118771.0851 742.47 52.90584813 118003.8916 742.47 53.66279892 118003.8916 743.43 54.31020877 117244.5945 744.39 54.42435374 116485.3072 744.39 55.22004426 116485.3072 745.34 55.92647489 115733.9262 746.28 56.02395664 114990.4515 746.28 56.80769469 114990.4515 747.22 57.53582525 114246.9768 747.22 57.57618736 114246.9768 748.15 58.35567559 113511.4182 749.08 58.5535167 112775.8497 749.08 59.16735787 112775.8497 750 59.9594339 112048.1974 ccccccccccccccccccccccccccccccccccccccccccccccccccccccccccccccccccccccccccccccccccc
184
%% The Axial Force of the Top Compressive Spring
Temp Displacement Force (ᵒC) (mm) (N)
20
0.00E+00 0 20
1.71E-06 0
20
3.42E-06 0 20
6.85E-06 0
…
% The top compressive spring is activited
70.41 -0.060164448 -134126.0182 90.42 -0.118819559 -264887.2356 99.245 -0.118819559 -264887.236 99.245 -0.130815683 -291630.4766 108.07 -0.130718145 -291413.0329 123.86 -0.114739141 -255790.6629 138.14 -0.11603108 -258670.8125 151.17 -0.111104683 -247688.2805 163.17 -0.105928747 -236149.4454 163.17 -0.092095255 -205310.1152 174.27 -0.093941571 -209426.1527 184.61 -0.095278979 -212407.6663 194.28 -0.091665778 -204352.6735 194.28 -0.089189411 -198832.0505 203.36 -0.086237461 -192251.1982 211.92 -0.083818634 -186858.8514 220.03 -0.081968921 -182735.2427 227.71 -0.079287845 -176758.2572 235.02 -0.077152413 -171997.6874 241.99 -0.075166487 -167570.4167 248.65 -0.073203057 -163193.2955 255.03 -0.071550254 -159508.6619 261.14 -0.070971972 -158219.486 261.14 -0.069124089 -154099.9552 267.02 -0.067425364 -150312.9495 272.68 -0.065201872 -145356.0651 272.68 -0.065357889 -145703.8784 278.12 -0.064029536 -142742.5498 278.12 -0.061723744 -137602.1927 283.38 0.233220655 0 280.75 -0.060937513 -135849.429 283.38 -0.064474276 -143734.0186
185
283.38 -0.063250268 -141005.3083 288.46 -0.059436006 -132502.0853 288.46 -0.059443407 -132518.5851 293.38 -0.058747426 -130967.0175 298.13 -0.058750058 -130972.8844 298.13 -0.058569558 -130570.4915 302.74 -0.059901208 -133539.1698 302.74 -0.057169129 -127448.4818 307.22 -0.057727658 -128693.6251 311.56 -0.059100953 -131755.1437 311.56 -0.056606565 -126194.3452 315.78 -0.055594981 -123939.1972 319.88 -0.055579619 -123904.9518 319.88 -0.055415745 -123539.623 323.88 -0.055742375 -124267.7864 323.88 -0.054777578 -122116.9424 327.77 -0.053907503 -120177.2633 331.57 -0.054591298 -121701.6625 331.57 -0.053276067 -118769.5884 335.27 -0.053348008 -118929.9668 338.88 -0.052891595 -117912.4748 338.88 -0.052954369 -118052.4189 342.4 -0.051882515 -115662.9093 345.85 -0.051598491 -115029.7282 345.85 -0.052197127 -116364.281 349.21 -0.051425978 -114645.1405 352.51 -0.051747123 -115361.0776 352.51 -0.051091227 -113898.873 355.73 -0.050517411 -112619.6523 358.88 -0.050794326 -113236.9843 358.88 -0.050186732 -111882.461 361.97 -0.049887952 -111216.383 365 -0.049804442 -111030.213 365 -0.049485761 -110319.7695 367.97 -0.048822669 -108841.5229 370.88 -0.048690079 -108545.9375 373.73 -0.049016953 -109274.6463 376.53 -0.047862863 -106701.8053 376.53 -0.047395841 -105660.662 379.28 -0.047035866 -104858.1625 381.98 -0.047226758 -105283.7211 384.63 -0.046674615 -104052.8151 384.63 -0.046459839 -103574.0099 387.24 -0.046308773 -103237.2355 389.8 -0.046300531 -103218.8608 392.32 -0.046001624 -102552.5022 392.32 -0.04574957 -101990.5904 394.79 -0.045021861 -100368.2933 397.23 -0.045424419 -101265.7249
186
399.63 -0.044859695 -100006.7713 399.63 -0.044450437 -99094.40362 401.99 -0.044021932 -97709.4729 404.31 -0.044644015 -98582.24499 406.6 -0.043280823 -95085.96704 406.6 -0.042584352 -93555.85253 408.85 -0.0414401 -90584.68222 411.07 -0.042247625 -91889.87269 413.26 -0.04096151 -88652.5656 413.26 -0.040140043 -86874.673 415.41 -0.039327585 -84701.58935 417.54 -0.038654299 -82847.692 419.64 -0.039163719 -83536.16312 419.64 -0.037946953 -80940.8037 421.7 -0.037275082 -79131.10483 423.74 -0.036670749 -77481.26783 425.75 -0.037326267 -78498.34236 425.75 -0.035984013 -75675.53937 427.74 -0.035253262 -73794.67556 429.69 -0.036083092 -75186.64632 429.69 -0.034668446 -72238.93499 431.63 -0.03408755 -70704.17876 433.54 -0.035412313 -73120.26889 433.54 -0.033887665 -69972.13597 435.42 -0.032234024 -66260.44013 437.28 -0.033934002 -69445.36573 437.28 -0.031855758 -65192.27422 439.12 -0.031252685 -63676.05969 440.94 -0.031146333 -63181.35631 442.73 -0.031336067 -63291.13428 442.73 -0.029783644 -60155.62282 444.5 -0.029861575 -60053.79638 447.99 -0.028720818 -57268.04317 451.39 -0.028624583 -56598.82923 451.39 -0.027119888 -53623.62514 454.72 -0.023938692 -46942.54197 457.98 -0.02660185 -51739.52801 457.98 -0.022137345 -43056.24457 461.17 -0.021381957 -41252.51983 464.29 -0.02368058 -45324.92384 464.29 -0.02075384 -39723.10564 467.35 -0.019539019 -37104.68795 470.35 -0.02133696 -40205.041 470.35 -0.01825672 -34400.9736 473.28 -0.017105174 -31985.3191 476.17 -0.018713411 -34727.35143 476.17 -0.015459027 -28688.03837 478.99 -0.014651832 -26987.4456 481.77 -0.016433562 -30045.17675
187
484.49 -0.013396345 -24313.57815 484.49 -0.012887332 -23389.74906 487.17 -0.011142816 -20077.09301 489.8 -0.01181797 -21141.14634 492.38 -0.012159943 -21599.03293 492.38 -0.009346023 -16600.82346 494.92 -0.007648054 -13489.53892 497.42 -0.00307985 -5394.436384 499.87 -0.005999254 -10435.76043 502.29 -0.004110312 -7082.258334 502.29 -0.002160876 -3723.289634 504.67 -0.000855568 -1460.111282 507.01 0.001077083 0 … 509.31 0.00284568 0 … 550.98 0.043763328 0


