
Purdue UniversityPurdue e-Pubs
Open Access Theses Theses and Dissertations
Summer 2014
A cross-site study of user behavior and privacyperception in social networksYue ZhangPurdue University
Follow this and additional works at: https://docs.lib.purdue.edu/open_access_theses
Part of the Library and Information Science Commons, and the Social Work Commons
This document has been made available through Purdue e-Pubs, a service of the Purdue University Libraries. Please contact [email protected] foradditional information.
Recommended CitationZhang, Yue, "A cross-site study of user behavior and privacy perception in social networks" (2014). Open Access Theses. 716.https://docs.lib.purdue.edu/open_access_theses/716
111 14
eeeeee eeeeeeeeeee eeeeeeeee
..............................
)))).)........).))...).)....).).........))......))..))....))...).)....)))
1 1 1 1 1
1
¹¹¹ ¹¹¹¹¹
Ô ÔÔÔÔÔÔÔÔÔÔ ÔÔÔÔ¹ ÔÔ ÔÔÔÔ ÔÔÔÔÔÔÔÔ ÔÔÔ ÔÔÔÔÔÔ¹ ÔÔÔÔÔÔÔÔÔÔ ÔÔ ÔÔÔÔÔÔÔÔÔÍÔÔÍÔ
»¹»»¹» »» Ô»»¹¹»¹
»¹µ»»»¹ Ô¹»µ
Ô»¹¹´¹»» Ô´ »¹»»¹¹µµ
Ô¹»¹»¹¹ ¹¹¹¹
»¹µ»»»¹ Ô¹»µ
¼¹¹¹ Ô¼¹»»»»´ ìììììììììì


A CROSS-SITE STUDY OF USER BEHAVIOR AND PRIVACY PERCEPTION IN
SOCIAL NETWORKS
A Thesis
Submitted to the Faculty
of
Purdue University
by
Yue Zhang
In Partial Fulfillment of the
Requirements for the Degree
of
Master of Science
August 2014
Purdue University
West Lafayette, Indiana

ii
ii
To my Mom, Dad and Qi, for all the support and love they give me.

iii
iii
ACKNOWLEDGEMENTS
First and foremost, I would like to express my deepest gratitude to my committee.
I am so fortunate to have the best committee to help me going through the process of
inquiry. My Chair, Prof. Dark has been patiently giving me advice and leading me to the
right direction. I would never forget her support, advice and encouragement. I want to
thank Prof. Yang and Prof. Marshall for their unwavering help and invaluable input. I
also want to thank Prof. Whitten for helping me going through the formatting process.
There are many who have supported the creation of this work, making it difficult
to choose the words that truly express the heartfelt gratitude and appreciation. I feel I am
fortunate to be surrounded by an amazing group of graduate students and faculties. Thank
every one of them and thank Purdue for giving me such a wonderful experience.
iv
iv
TABLE OF CONTENTS
Page
LIST OF TABLES ............................................................................................................ vii
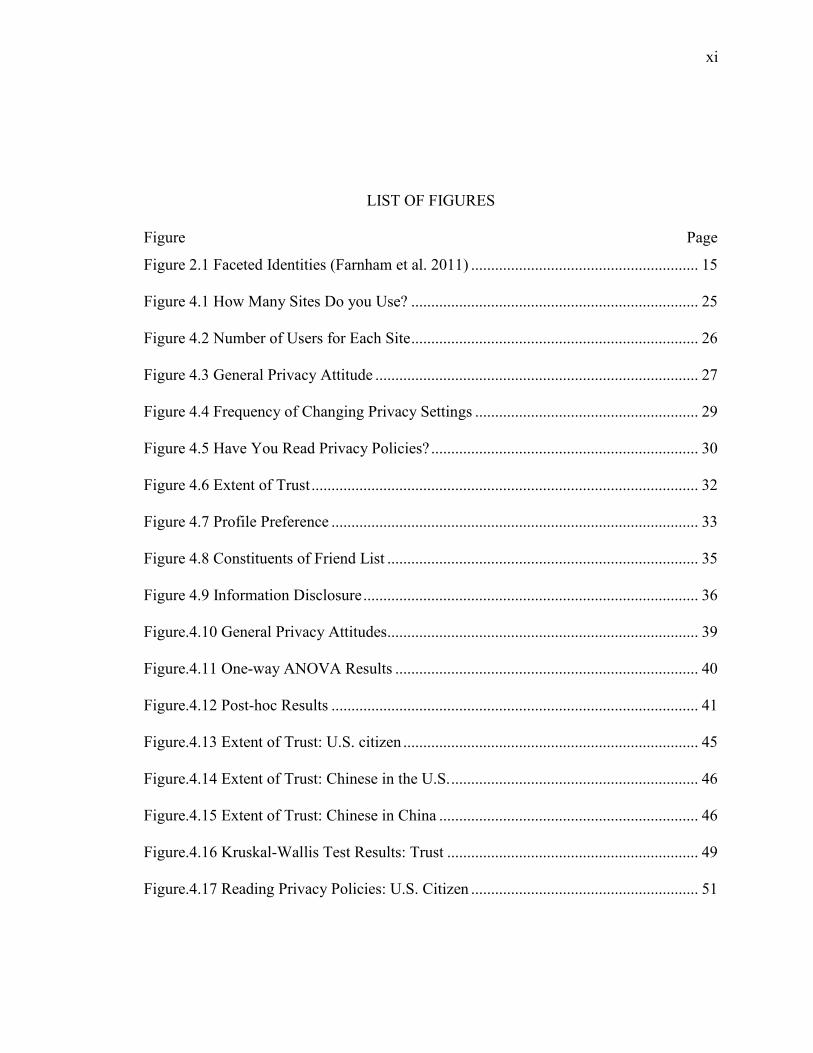
LIST OF FIGURES ........................................................................................................... xi
LIST OF ABBREVIATIONS .......................................................................................... xiv
GLOSSARY ............................................................................................................. xv
ABSTRACT ............................................................................................................ xvi
CHAPTER 1. INTRODUCTION ................................................................................. 1
1.1 Motivation and Objectives .........................................................................2
1.2 Significance ................................................................................................3
1.3 Research Questions ....................................................................................4
1.4 Assumption ................................................................................................5
1.5 Limitations .................................................................................................5
1.6 Delimitations ..............................................................................................6
1.7 Summary ....................................................................................................7
CHAPTER 2. REVIEW OF LITERATURE ................................................................ 8
2.1 Types of Social Networks ..........................................................................8
2.2 Information Disclosure Behavior across Multiple Social Networks .........9
2.3 Personal Traits and Privacy Perceptions ..................................................17

v
v
Page
2.4 Summary ..................................................................................................18
CHAPTER 3. METHODOLOGY .............................................................................. 20
3.1 Research Population and Sample Size .....................................................20
3.2 Data Collection ........................................................................................22
3.3 Data Analysis Methods ............................................................................23
3.4 IRB Protocol ............................................................................................23
3.5 Summary ..................................................................................................23
CHAPTER 4. PRESENTATION AND ANALYSIS OF DATA ............................... 24
4.1 Data Summary ..........................................................................................24
4.1.1 General Privacy Attitude ...................................................................27
4.1.2 Privacy Setting ..................................................................................29
4.1.3 Privacy Policy ...................................................................................30
4.1.4 Extent of Trust...................................................................................31
4.1.5 Profile Preference ..............................................................................33
4.1.6 Constituents of Friend List ................................................................34
4.1.7 Information Disclosure......................................................................36
4.2 Exploring Cultural Differences ................................................................37
4.2.1 Cultural Differences in General Privacy Attitude .............................38
4.2.2 Cultural Differences in Trust ............................................................44
4.2.3 Cultural Differences in Reading Privacy Policies .............................51
4.2.4 Cultural Differences in Privacy Settings ...........................................56
4.2.5 Cultural Differences in Friend Lists ..................................................62
vi
vi
Page
4.2.6 Cultural Differences in Profile Preferences ......................................67
4.2.7 Cultural Differences in Information Disclosure ................................72
4.3 Privacy Attitude and Information Disclosure Behavior ...........................78
4.4 Relationships among Privacy Perceptions and Behaviors .......................93
4.5 Summary ................................................................................................104
CHAPTER 5. DISCUSSION OF RESULTS ........................................................... 105
5.1 Modeling Privacy Attitude, Perception and Behavior ...........................106
5.2 Cultural Differences in Privacy Attitude ...............................................109
5.3 Cultural Differences in Privacy Perceptions and Behaviors ..................115
5.4 Privacy Attitude, Perception and Behavior in Different Sites ...............122
5.5 Conclusion and Future Work .................................................................130
LIST OF REFERENCES ................................................................................................ 133
APPENDICES
Appendix A Survey Questions ............................................................................... 135
Appendix B IRB Protocal ...................................................................................... 144

vii
vii
LIST OF TABLES
Table .............................................................................................................................. Page
Table 2.1 Information Disclosure in Different OSNs (Schrammel et al. 2009) ............ 11
Table 2.2. Personal Information Disclosed in Social Networks (Irani et al. 2009) .......... 13
Table 3.1. Estimated Population and Targeted Sample Size ............................................ 21
Table 4.1. Dataset Summary ............................................................................................. 24
Table 4.2. Number of Users for Each Site ........................................................................ 26
Table 4.3. General Privacy Attitude ................................................................................. 28
Table 4.4. Frequency of Changing Privacy Settings......................................................... 29
Table 4.5. Have You Read Privacy Policies? ................................................................... 31
Table 4.6. Extent of Trust ................................................................................................. 32
Table 4.7. Profile Preference ............................................................................................ 33
Table 4.8. Constituents of Friend List .............................................................................. 35
Table 4.9. Information Disclosure .................................................................................... 37
Table 4.10. Results for Testing Differences in General Privacy Attitudes ....................... 42
Table 4.11. Constituents of Respondents for Each Social Network ................................. 45
Table 4.12. Extent of Trust: U.S. Citizen ......................................................................... 47
Table 4.13. Extent of Trust: Chinese in the U.S. .............................................................. 47
Table 4.14. Extent of trust: Chinese in China ................................................................... 48
Table 4.15. Summary of Results for Extent of Trust ........................................................ 49
viii
viii
Table .............................................................................................................................. Page
Table 4.16. Reading Privacy Policies: U.S. Citizen ......................................................... 53
Table 4.17. Reading Privacy Policies: Chinese in the U.S. .............................................. 53
Table 4.18. Reading Privacy Policies: Chinese in China.................................................. 54
Table 4.19. Summary of Results for Reading Privacy Policies ........................................ 55
Table 4.20. Changing Privacy Settings: U.S..................................................................... 58
Table 4.21. Changing Privacy Settings: Chinese in the U.S. ............................................ 59
Table 4.22. Changing Privacy Settings: Chinese in China ............................................... 59
Table 4.23. Summary of Results for Changing Privacy Settings ..................................... 60
Table 4.24. Percentage of Real World Friends in Friend List: U.S. Citizen .................... 63
Table 4.25. Percentage of Real World Friends in Friend List: Chinese in the U.S .......... 64
Table 4.26. Percentage of Real World Friends in Friend List: Chinese in China ............. 64
Table 4.27. Summary of Results for Friend List .............................................................. 65
Table 4.28. Profile Preference: U.S. Citizen ..................................................................... 68
Table 4.29. Profile Preference: Chinese in the U.S. ......................................................... 68
Table 4.30. Profile Preference: Chinese in China ............................................................. 69
Table 4.31. Summary of Results for Profile Preference ................................................... 70
Table 4.32. Information Disclosure: U.S. Citizen ............................................................ 73
Table 4.33. Information Disclosure: Chinese in the U.S. ................................................. 74
Table 4.34 Information Disclosure: Chinese in China ..................................................... 75
Table 4.35. Cultural Differences in Information Disclosure ............................................ 76
Table 4.36. Privacy Attitude vs Information Disclosure: Facebook ................................. 79
Table 4.37. Privacy Attitude vs Information Disclosure: Twitter .................................... 82

ix
ix
Table .............................................................................................................................. Page
Table 4.38. Privacy Attitude vs Information Disclosure: WhatsApp ............................... 84
Table 4.39. Privacy Attitude vs. Information Disclosure: RenRen .................................. 86
Table 4.40. Privacy Attitude vs. Information Disclosure: Weibo..................................... 89
Table 4.41. Privacy Attitude vs. Information Disclosure: WeChat .................................. 91
Table 4.42. Correlation Matrix for All Facebook Users ................................................... 93
Table 4.43. Correlation Matrix U.S. Facebook Users....................................................... 94
Table 4.44. Correlation Matrix All Twitter Users ............................................................ 95
Table 4.45. Correlation Matrix U.S. Twitter Users .......................................................... 95
Table 4.46. Correlation Matrix Chinese Twitter Users in the U.S. .................................. 96
Table 4.47. Correlation Matrix All WhatsApp Users ....................................................... 97
Table 4.48. Correlation Matrix U.S. WhatsApp Users ..................................................... 97
Table 4.49. Correlation Matrix Chinese WhatsApp Users in the U.S. ............................. 98
Table 4.50. Correlation Matrix All RenRen Users ........................................................... 99
Table 4.51. Correlation Matrix Chinese RenRen Users in the U.S. ................................. 99
Table 4.52. Correlation Matrix Chinese RenRen Users in China ................................... 100
Table 4.53. Correlation Matrix All Weibo Users ........................................................... 100
Table 4.54. Correlation Matrix Chinese Weibo Users in the U.S. .................................. 101
Table 4.55. Correlation Matrix Chinese Weibo Users in China ..................................... 101
Table 4.56. Correlation Matrix All WeChat Users ......................................................... 102
Table 4.57. Correlation Matrix Chinese WeChat Users in the U.S. ............................... 103
Table 4.58. Correlation Matrix Chinese WeChat Users in China ................................... 103
Table 5.1. Rankings of Privacy for Different Types of Information .............................. 111

x
x
Table .............................................................................................................................. Page
Table 5.2. Privacy Indices for Different Cultural Contexts ........................................... 111
Table 5.3. Privacy Scores for Different Cultural Contexts ............................................. 118
Table 5.4. Privacy Indices for Different Cultural Sites .................................................. 111
Table 5.5. Privacy Scores for Different Sites ................................................................. 118
xi
xi
LIST OF FIGURES
Figure ............................................................................................................................. Page
Figure 2.1 Faceted Identities (Farnham et al. 2011) ......................................................... 15
Figure 4.1 How Many Sites Do you Use? ........................................................................ 25
Figure 4.2 Number of Users for Each Site ........................................................................ 26
Figure 4.3 General Privacy Attitude ................................................................................. 27
Figure 4.4 Frequency of Changing Privacy Settings ........................................................ 29
Figure 4.5 Have You Read Privacy Policies? ................................................................... 30
Figure 4.6 Extent of Trust ................................................................................................. 32
Figure 4.7 Profile Preference ............................................................................................ 33
Figure 4.8 Constituents of Friend List .............................................................................. 35
Figure 4.9 Information Disclosure .................................................................................... 36
Figure.4.10 General Privacy Attitudes .............................................................................. 39
Figure.4.11 One-way ANOVA Results ............................................................................ 40
Figure.4.12 Post-hoc Results ............................................................................................ 41
Figure.4.13 Extent of Trust: U.S. citizen .......................................................................... 45
Figure.4.14 Extent of Trust: Chinese in the U.S. .............................................................. 46
Figure.4.15 Extent of Trust: Chinese in China ................................................................. 46
Figure.4.16 Kruskal-Wallis Test Results: Trust ............................................................... 49
Figure.4.17 Reading Privacy Policies: U.S. Citizen ......................................................... 51

xii
xii
Figure ............................................................................................................................. Page
Figure.4.18 Reading Privacy Policies: Chinese in the U.S. .............................................. 52
Figure.4.19 Reading Privacy Policies: Chinese in China ................................................. 52
Figure.4.20 Kruskal-Wallis Test Results: Privacy Policy ................................................ 54
Figure.4.21 Changing Privacy Settings: U.S. Citizen ....................................................... 57
Figure.4.22 Changing Privacy Settings: Chinese in the U.S. ........................................... 57
Figure.4.23 Changing Privacy Settings: Chinese in China ............................................... 58
Figure.4.24 Kruskal-Wallis Test Results: Privacy Setting ............................................... 60
Figure.4.25 Percentage of Real World Friends in Friend List: U.S. Citizen .................... 62
Figure.4.26 Percentage of Real World Friends in Friend List: Chinese in the U.S .......... 62
Figure.4.27 Percentage of Real World Friends in Friend List: Chinese in China ............ 63
Figure.4.28 Kruskal-Wallis Test Results: Friend List ...................................................... 65
Figure.4.29 Profile Preference: U.S. Citizen .................................................................... 67
Figure.4.30 Profile Preference: Chinese in the U.S. ......................................................... 67
Figure.4.31 Profile Preference: Chinese in China ............................................................ 68
Figure.4.32 Kruskal-Wallis Test Results: Profile Preference ........................................... 70
Figure.4.33 Information Disclosure: U.S. Citizen ............................................................ 72
Figure.4.34 Information Disclosure: Chinese in the U.S. ................................................. 72
Figure.4.35 Information Disclosure: Chinese in China .................................................... 73
Figure 4.36 Privacy Attitude vs Information Disclosure: Facebook ................................ 79
Figure.4.37 Privacy Attitude vs Information Disclosure: Twitter .................................... 81
Figure.4.38 Privacy Attitude vs Information Disclosure: WhatsApp ............................... 84
Figure.4.39 Privacy Attitude vs Information Disclosure: RenRen ................................... 86

xiii
xiii
Figure ............................................................................................................................. Page
Figure 4.40 Privacy Attitude vs. Information Disclosure: Weibo .................................... 88
Figure.4.41 Privacy Attitude vs. Information Disclosure: WeChat .................................. 91
Figure 5.1 The Cube Model ............................................................................................ 107
Figure 5.2 The Cube Model-Construction Phase ............................................................ 108
Figure 5.3 The Cube Model-Usage Phase ...................................................................... 109
Figure 5.4 Privacy Attitudes vs. Actual Information Disclosure – Facebook ................ 114
Figure 5.5 Radar Chart: Privacy Scores for Different Cultural Contexts ....................... 118
Figure 5.6 Radar Chart: Privacy Indexes for Different Cultural Contexts ..................... 119
Figure 5.7 Radar Chart: Privacy Scores for Different Sites............................................ 123
Figure 5.8 Radar Chart: Privacy Indexes for Different Sites 1 ....................................... 124
Figure 5.9 Radar Chart: Privacy Indexes for Different Sites 2 ....................................... 126
Figure 5.10 Radar Chart: Privacy Indexes for Different Sites 3 ..................................... 127
Appendix Figure
Figure B.1 Original IRB Protocal ................................................................................... 144
Figure B.2 IRB Approval of Amendment....................................................................... 145

xiv
14
LIST OF ABBREVIATIONS
OSN - Online Social Networks
SSN - Social Security Number
ANOVA - Analysis of variance
URL - Uniform Resource Locator
IRB - Institutional Review Board
xv
15
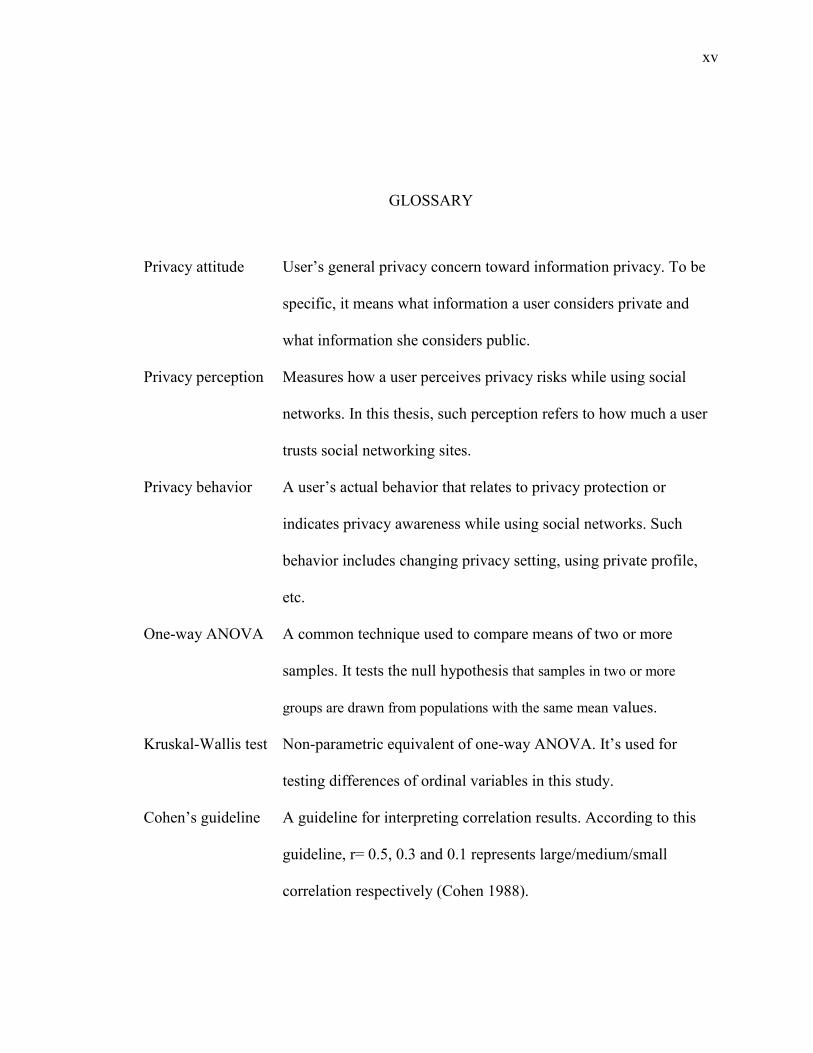
GLOSSARY
Privacy attitude User’s general privacy concern toward information privacy. To be
specific, it means what information a user considers private and
what information she considers public.
Privacy perception Measures how a user perceives privacy risks while using social
networks. In this thesis, such perception refers to how much a user
trusts social networking sites.
Privacy behavior A user’s actual behavior that relates to privacy protection or
indicates privacy awareness while using social networks. Such
behavior includes changing privacy setting, using private profile,
etc.
One-way ANOVA A common technique used to compare means of two or more
samples. It tests the null hypothesis that samples in two or more
groups are drawn from populations with the same mean values.
Kruskal-Wallis test Non-parametric equivalent of one-way ANOVA. It’s used for
testing differences of ordinal variables in this study.
Cohen’s guideline A guideline for interpreting correlation results. According to this
guideline, r= 0.5, 0.3 and 0.1 represents large/medium/small
correlation respectively (Cohen 1988).
xvi
16
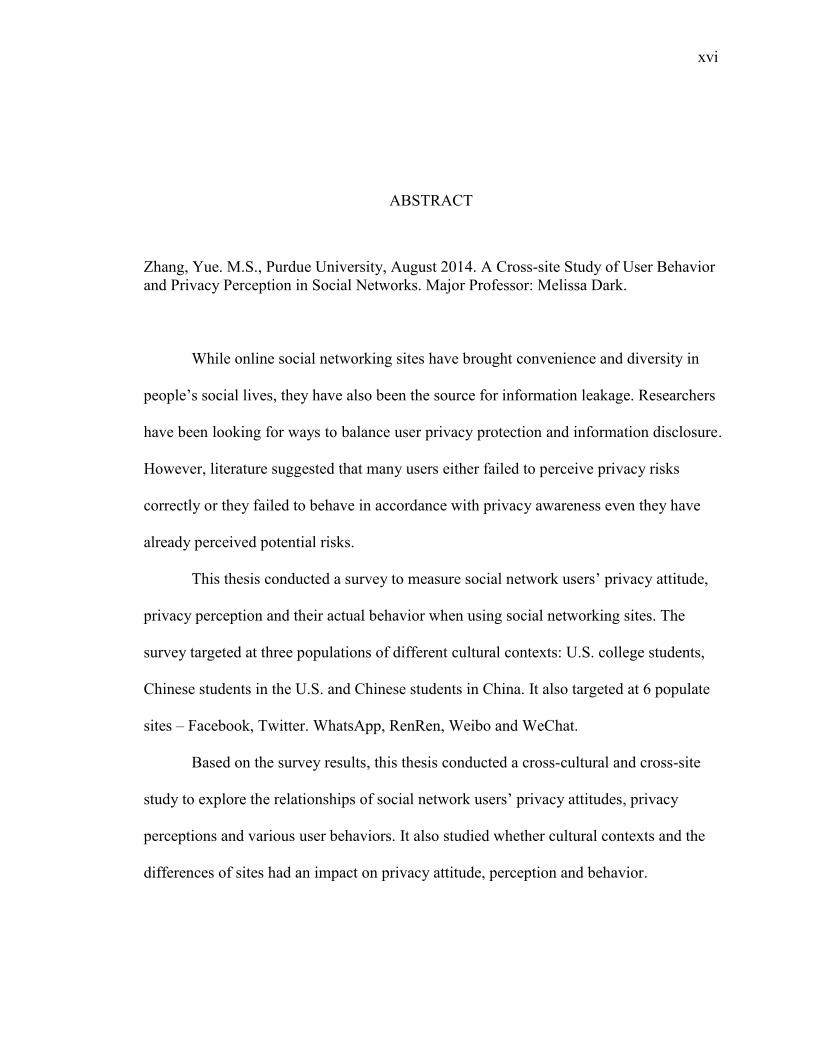
ABSTRACT
Zhang, Yue. M.S., Purdue University, August 2014. A Cross-site Study of User Behavior
and Privacy Perception in Social Networks. Major Professor: Melissa Dark.
While online social networking sites have brought convenience and diversity in
people’s social lives, they have also been the source for information leakage. Researchers
have been looking for ways to balance user privacy protection and information disclosure.
However, literature suggested that many users either failed to perceive privacy risks
correctly or they failed to behave in accordance with privacy awareness even they have
already perceived potential risks.
This thesis conducted a survey to measure social network users’ privacy attitude,
privacy perception and their actual behavior when using social networking sites. The
survey targeted at three populations of different cultural contexts: U.S. college students,
Chinese students in the U.S. and Chinese students in China. It also targeted at 6 populate
sites – Facebook, Twitter. WhatsApp, RenRen, Weibo and WeChat.
Based on the survey results, this thesis conducted a cross-cultural and cross-site
study to explore the relationships of social network users’ privacy attitudes, privacy
perceptions and various user behaviors. It also studied whether cultural contexts and the
differences of sites had an impact on privacy attitude, perception and behavior.

1
1
CHAPTER 1. INTRODUCTION
The Internet’s wide adoption has contributed to online social networking sites’
thriving popularity. Facebook, for example had 1.3 billion monthly active users
worldwide in 2014 (StatisticBrain, 2014) compared with a total of 835 million in 2012
(Internet World Status, 2012). The nature of social networks is to imitate real world
social relationships by providing mechanisms for sharing information, creating personal
profiles, establishing relations and communicating with each other. Not surprisingly, at
the same time of using such services, people are giving out massive amount of
information which may pose real threat to privacy. Documented threats include identity
theft, digital stalking, and personalized spam. The problem becomes worse when most
people are completely unaware of short-term and long term risks of sharing personal
information without restricted access (Schrammel et al., 2009; Krishnamurthy et al., 2008;
Acquisti et al.,2006) .
Privacy preserving methods which aim at anonymizing the social graph
(Machanavajjhala et al., 2007; Li et al., 2007; Sweeney, 2002), privacy setting
management (Squicciarini et al, 2012) or raising privacy awareness by evaluating user’s
privacy score (Liu et al, 2010), etc. have not been proven successful in protecting user’s
sensitive information or changing user’s information disclosure behavior.
2
2
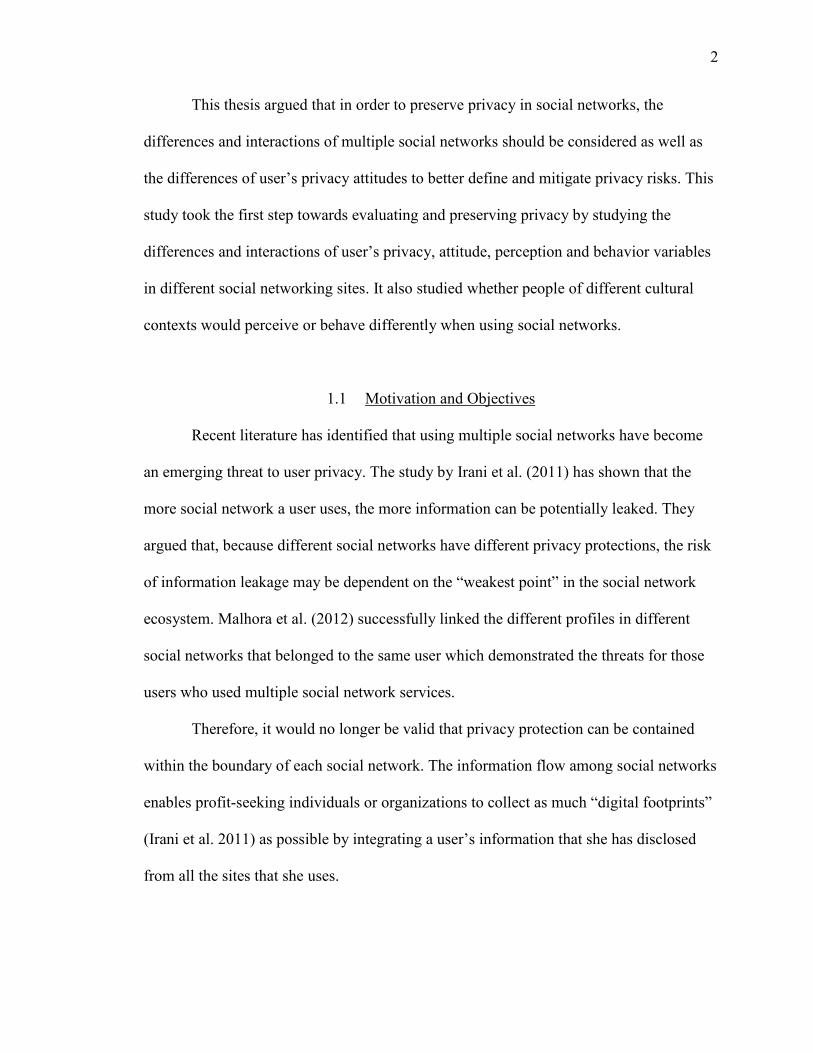
This thesis argued that in order to preserve privacy in social networks, the
differences and interactions of multiple social networks should be considered as well as
the differences of user’s privacy attitudes to better define and mitigate privacy risks. This
study took the first step towards evaluating and preserving privacy by studying the
differences and interactions of user’s privacy, attitude, perception and behavior variables
in different social networking sites. It also studied whether people of different cultural
contexts would perceive or behave differently when using social networks.
1.1 Motivation and Objectives
Recent literature has identified that using multiple social networks have become
an emerging threat to user privacy. The study by Irani et al. (2011) has shown that the
more social network a user uses, the more information can be potentially leaked. They
argued that, because different social networks have different privacy protections, the risk
of information leakage may be dependent on the “weakest point” in the social network
ecosystem. Malhora et al. (2012) successfully linked the different profiles in different
social networks that belonged to the same user which demonstrated the threats for those
users who used multiple social network services.
Therefore, it would no longer be valid that privacy protection can be contained
within the boundary of each social network. The information flow among social networks
enables profit-seeking individuals or organizations to collect as much “digital footprints”
(Irani et al. 2011) as possible by integrating a user’s information that she has disclosed
from all the sites that she uses.

3
3
Though such an emerging risk has been raised for several years, few literatures
have focused on such topic and no solutions that attempt to preserve privacy across
multiple social networks that have been proven effective.
The above literature assumed that the privacy risks came from the fact that users
disclosed different information in different social networks. However, arguments such as
“users do not behave inconsistently nor they have inconsistent profiles in different social
networks” or “users may not care about the information they have provided at all” may
easily debunk the above assumption. To find out a solution that adapts to real life
scenario, the fundamental understanding of why and how the usage of different social
networks poses threat to privacy is necessary.
Therefore, the main objective of this study is to understand how and why user’s
privacy perceptions and behaviors differ in different social networks and among different
cultural contexts and how the privacy perception influences the information disclosure
behavior.
1.2 Significance
As discussed above, previous studies have assumed that users behave differently
in social networking sites, however, none of them sufficiently justified their argument
either because of lacking empirical data to support their argument or they fail to explore
the reasons behind the differences of information disclosure.
Schrammel et al. (2012) took a site-centered approach to explore the difference of
information disclosure on different types of social networks. This aggregated approach
failed to distinguish the difference within the same type of social networks. Wang’s work
4
4
on the other hand, did discover the difference of user’s tagging behavior between two
popular bookmarking websites. However, this research only focuses on only two tagging
sites and such an ad-hoc result can’t be justifiably generalized to other sites.
To the best of our knowledge, a cross-site study of privacy attitude, perception
and behavior on different social networks has not yet been conducted studied the impact
of cultural contexts on social network users which have been rarely documented.
Another significance of the study was that it provided an up-to-date survey that
investigates diverse aspects of social network privacy. Hopefully it could help researchers
in this field better understand the usages, perceptions, attitudes and behaviors of social
network users.
1.3 Research Questions
The questions central to this research are as follows:
1. What are users’ privacy attitudes when they use the social networks? (e.g.
what information do they consider private and what is not?) Are they different?
2. Does culture background have a significant impact on social network users’
privacy perceptions and behaviors?
3. What’s the relationship among a user’s privacy attitudes, perceptions, and
behavior in a specific site?
5
5
1.4 Assumption
The following assumptions are inherent to this study:
1. The participants are assumed to be honest and to have a basic understanding
of the definition of privacy and social networks without major confusion.
2. The participants are assumed to be able to use the Qualtrics online survey
system and to navigate and answer the questions correctly.
3. The participants will not retake the survey as not to disproportionally affect
the outcomes.
4. The participants are representative of the study population.
5. The survey provides adequate information for the research questions.
1.5 Limitations
The study has the following limitations:
1. The self-reported survey may be biased as the actual behavior of the
respondents on social networks may be different from what they reported. The
self-reported survey may be biased also because the non-respondents may be
more concerned about privacy.
2. Social networking is fast-evolving. The popularity of each site rises and falls.
The results of this study including the survey itself are prone to be dated.
3. The design of the survey questions tried to capture the general characteristics
of each sites. In many cases, they were of coarse-grained. The profile
preference question for example, only had two options – public or private

6
6
while in fact the profile settings could be much more complicated in some
specific sites such as Facebook.
4. Twitter had an imbalanced sample with an overwhelming majority of
American users. WhatsApp had a small sample of 106 respondents. The
results may thus be biased.
1.6 Delimitations
The following delimitations are inherent to the study:
1. The study only focused on three different cultural groups – U.S. citizen,
Chinese in China and Chinese in the U.S. and the results could not be
generalized to other cultures.
2. The study only used a one-time survey that does not include a follow up study
to analyze users’ change in privacy perceptions or behaviors.
3. The study only focused on six selected sites – Facebook, RenRen, Twitter,
Weibo, WhatsApp and WeChat and three cultural groups.
4. The study only studied one-on-one correlation/association between privacy
attitude/perception/behavior variables and some of the results. The
interactions of multiple variables were not analyzed. Future work will include
more complex mediation and multiple-regression analysis.
5. The study only focused on general privacy attitude, trust, profile preference,
privacy policies, privacy setting, friend list and information disclosure
behavior. Other variables related to privacy such as gender, computer
expertise, perception of risks, age, etc. were not covered in this study.

7
7
1.7 Summary
This chapter has provided an overview to this study including motivations,
purposes, significance, research questions and scope definitions. The next chapter will
outline the previously explored information disclosure behavior analysis.

8
8
CHAPTER 2. REVIEW OF LITERATURE
2.1 Types of Social Networks
Online social networks (OSNs) have become an important part of people’s daily
lives. People use traditional social networks for information access, communication and
establishing friendships. In recent years, as different forms of social networks popping up,
the functionalities of social networks have become more extensive. Schrammel et al.
(2009) classified these online communities into 4 types:
Business Networking Sites - These sites are mainly used to maintain and
managing professional profiles (resume, contact information, etc) and professional
relationships. Typical sites are Xing and LinkedIn.
(Traditional) Social Networks - These sites are mainly used for maintaining
private relationships and contacts. The most prominent example for such sites are
Facebook, RenRen, and Google+.
Content and Media Sharing Networks - On these sites, the major focus is on
sharing content with others rather than maintaining/establishing relationships. People
watch, share or comment on videos, pictures or music on these sites. Typical examples
are Youtube and Flickr.
Social News and Bookmarking Sites - These sites are used to share and discover
interesting links to news and contents in the web. Typical examples are Reddit and Digg.
9
9
However, as the functionalities of social networks evolve and new social
community sites emerge, many social networks have more than just one characteristic
that can’t be easily fitted into one of the above categories. For example, Twitter was
generally regarded as a bookmarking site where users can share links and bookmarks of
interesting contents; however, users also use it as a social networking tool to
maintain/establishing friendship. Twitter also allows uploading videos, music and
pictures so that it also serves as a Content and Media Sharing Networks.
Research has shown interests in studying the possible privacy risks of the usage of
social networks. Works have shown that identity resolution (Jain et al.2012), profile
matching (Raad et al. 2010) and online social footprint aggregation (Irani et al. 2009)
have become emerging threats to the usage of multiple social networks. However, most
of these works fail to consider the innate difference of these social networks (usage
context) and the difference of users’ information disclosure behavior while using them.
Furthermore, most existing works about social network privacy have been focusing on a
single site (or at best with one type of social network) without considering the interaction
of different types of social networks.
2.2 Information Disclosure Behavior across Multiple Social Networks
The work by Schrammel et al. (2009) may be the first one that conducted a
systematic comparison of differences in information disclosure behavior on different
types of online communities. This work also explores the information disclosure behavior
related to demographic variables, usage contexts and usage patterns. The main research
questions for this work are “whether there are systematic differences in the amount of
10
10
information disclosure in different online communities and whether there is an important
influence of the demographic background on the information disclosure behavior?”
The research was based on an online survey with 856 participants. The survey
evaluated the following aspects that may have influence on the information disclosure
behavior on different communities: types of OSNs, demographic information,
employment status, computer knowledge, online time, trust in the social network, # of
friends, change default setting or not. The survey was then analyzed using linear
regression model to evaluate the influence of these factors on information disclosure
behavior.
The result suggested a significant difference in information disclosure behavior in
different social networks (see Table 2.1). The main findings were: 1) people disclose
much more information on in networking sites with a social or a professional context than
in other types of communities; 2) students and pupils are more freehanded in disclosing
their information than employed and self-employed persons except in content and media
sharing sites; 3) trust in the network is related to the information disclosure behavior in
all networks. The more the user trusts the provider of the site that he is handling the data
with care the more information he provides; 4) women are more cautious in providing
information to friends than men; 5) computer expertise has a significant relation to the
information disclosure on social networks - the more experienced and skilled a user is the
more information he does provide to unknown persons.

11
11
Table 2.1
Information Disclosure in Different OSNs (Schrammel et al. 2009)
Business Networks Social Networks
Content & Media
Sharing
Social News &
Bookmarking
Stranger Friend Stranger Friend Stranger Friend Stranger Friend
Real Name 68.5 96.6 55.0 88.2 10.9 31.8 30.1 47.7
Nickname 53.7 59.3 65.1 73.8 75.3 84.7 67.6 78.5
Picture of
User
62.9 85.4 65.7 91.1 20.3 35.6 33.8 42.6
Date of
birth
25.3 79.0 42.6 82.2 12.5 28.4 16.2 30.2
Network of
friends
28.1 86.2 39.8 88.2 20.6 39.7 16.2 35.3
Email-
address
8.7 62.6 12.5 64.7 8.1 35.9 16.9 38.2
Physical
address
2.2 42.1 2.8 29.6 1.3 11.9 2.2 10.3
Phone
number
3.1 46.1 2.1 29.1 1.3 12.6 1.5 8.1
Instant
messaging
cont.
15.7 63.2 17.6 60.0 9.1 26.9 11.0 21.3
Website 42.7 69.1 27.2 50.4 24.1 34.1 30.1 41.9
The author concluded that “There are significant differences in behavior and
needs of users depending of the type of community they are in. This suggests the

12
12
interpretation that users of networks typically only provide the information that is
required to achieve the maximum gains of the membership.”
Wang et al. (2011) performed a cross-site study on the user’s tagging behavior
between two popular bookmarking websites, StumbleUpon and Delicious. They analyzed
the tagging behavior of 3,616 users who uses both sites actively. The first experiment
tested the User Vocabulary Size which refers to the set of unique tags one use. The result
showed that 70% of users have an unbalanced vocabulary ratio across social media. The
second experiment evaluated Tag Sharing in User Vocabulary. They computed Jaccard
Index to identify the fraction of vocabulary shared by a user on Delicious and
StumbleUpon. The results showed that the majority of the users shared a small set of tags.
Specically, 29.2% users shared no tags and around 90% of users shared less than 10% of
tags. The third experiment was to study Tag Sharing in User Neighborhood Vocabulary.
The neibourhood was defined as the user himself and his one-hop network within the
dataset. They found out that more than 13% of the user's neighborhood did not share any
tags and more than 43% shared fewer than 10 tags across the sites. The fourth experiment
was conducted to study the Tag Sharing in URLs, which was to investigate how
differently a URL was tagged in each sites. For each URL, the tags were compared and
the overlaps in tags were calculated. The result turned out that almost 96% of the URLs
shared 2 or fewer tags. The final experiment was to study Time Spent on Delicious and
StumbleUpon. They found that 35% of users never tagged in both websites
simultaneously. The result suggested that users seldomly visited the two sites on the same
day. These results demonstrated a significant difference in users’ tagging behavior across
13
13
these sites, giving evidence that even using the same type of OSNs; the users’ behavior
may still vary greatly.
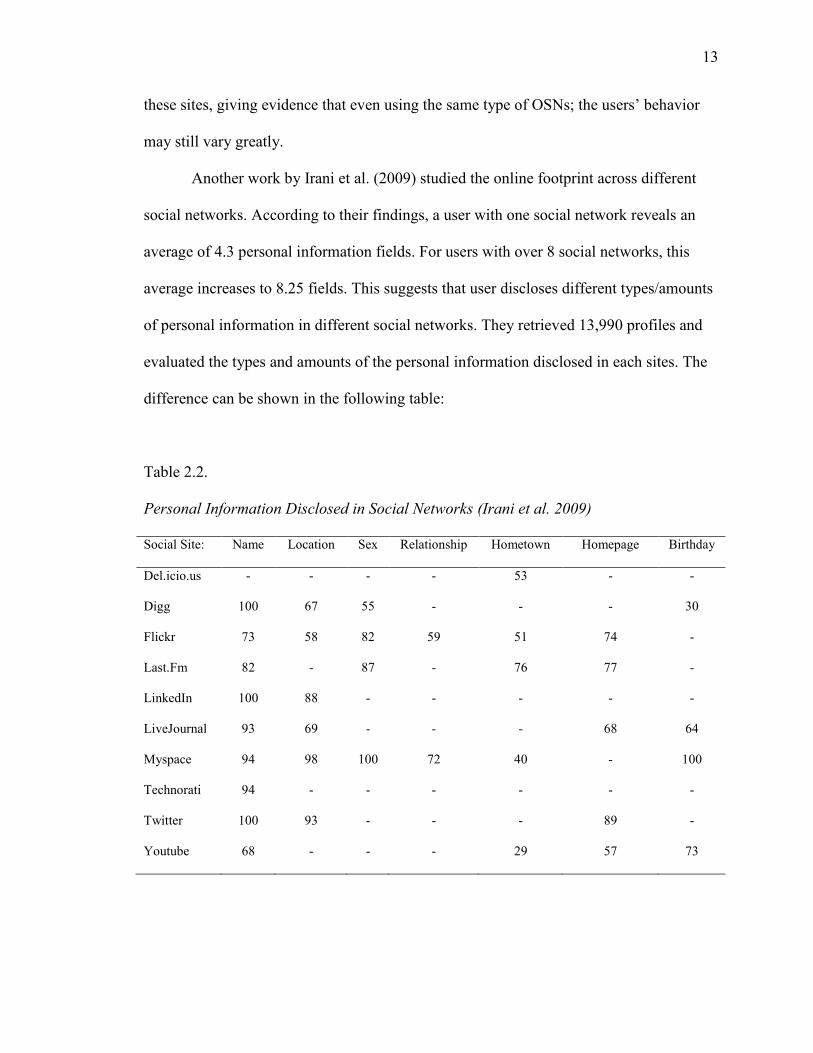
Another work by Irani et al. (2009) studied the online footprint across different
social networks. According to their findings, a user with one social network reveals an
average of 4.3 personal information fields. For users with over 8 social networks, this
average increases to 8.25 fields. This suggests that user discloses different types/amounts
of personal information in different social networks. They retrieved 13,990 profiles and
evaluated the types and amounts of the personal information disclosed in each sites. The
difference can be shown in the following table:
Table 2.2.
Personal Information Disclosed in Social Networks (Irani et al. 2009)
Social Site: Name Location Sex Relationship Hometown Homepage Birthday
Del.icio.us - - - - 53 - -
Digg 100 67 55 - - - 30
Flickr 73 58 82 59 51 74 -
Last.Fm 82 - 87 - 76 77 -
LinkedIn 100 88 - - - - -
LiveJournal 93 69 - - - 68 64
Myspace 94 98 100 72 40 - 100
Technorati 94 - - - - - -
Twitter 100 93 - - - 89 -
Youtube 68 - - - 29 57 73

14
14
Dijck (2013) studied the different user behaviors on Facebook and LinkedIn and
compared the users’ private self and professional self in online communities. He argues
that social networks are the tools for shaping identities and “users have a need for
multiple ‘stories’ about themselves, each story concerning different parts of their
identities and addressing a limited audience “. Therefore, users express different personas
in different social media by exhibiting different information about themselves. For
example, while a user may use Facebook to create a leisure persona (laying on the beach,
playing tennis, etc), one may also keep up a completely separate professional profile on
LinkedIn (e.g. a high-school teacher in English). A user who posts little (personal)
information on Facebook but who keeps up an active profile on LinkedIn makes a
statement that he or she cares about keeping his or her personal life private.
Farnham et al.(2011) also argued that assuming singularity of identity of a user’s
identity may be wrong. Instead, people’s lives are “faceted”- that is, people maintain
social boundaries and show different facets or sides of their character according to the
demands of the current social situation. People segment their lives into bounded areas
because various facets of their identities are incompatible. The faceted identity model
provided by the authors is shown in the following figure:

15
15
Figure 2.1 Faceted Identities (Farnham et al. 2011)
Through a questionnaire study with 631 respondents from the US, the authors
examined how people faceted their identities and their lives, and how these facets were
expressed through use of email and Facebook. The questionnaire first asked the basic
demographic information of the participants and then asked a series of questions
assessing social personality, including faceted identity, facet incompatibility, extraversion,
and self – monitoring. The result showed that users selected the most appropriate
technology for information sharing depending on the privacy and boundary requirements
of their communication- they used email for more private communications and Facebook
for keeping in touch with their extended networks. The authors believed that “people are
fairly adept at using the appropriate tool for the appropriate communication”. This may
imply that Internet users may choose to use different online tools (communities)
differently in order to maintain the boundaries of their facets of identities.
Users are not the only ones who decide how much information to be disclosed.
Stutzman (2006) studied the information disclosure on three different social networks (i.e.

16
16
Facebook, MySpace and Friendster) and found out that the amount of information
disclosure required by different social networks was different. For example, Facebook
offers the possibility of disclosing the most information but only requests the posting of
name, e-mail address, academic classification and school information; Friendster and
MySpace on the other hand, offer fewer options for information disclosure, but require
more by default for registering.
This work showed that the information disclosure behavior may be dependent on
the options and mandatory requirements provided by each social network. The innate
structure and functionality of each social network may offer different options for user’s
postings and require different amount/types of information for registering.
In conclusion, Schrammel et al. (2009) conducted the first systematic comparison
of user’s information disclosure behavior patterns across multiple social networks. He
also analyzed the demographic factors that may affect these different patterns. Wang et al.
(2011)’s work shows a significant difference in user’s behavior in different tagging sites.
Stutzman (2006) ‘s work suggested that user’s different information disclosure behavior
may be constrained by the options provided by and registration requirements requested
by each specific social network. The work by Irani et al. (2009) studied the online social
footprints of users and concluded that users disclose different amount and types of
information, which can be potential threat to user’s privacy. Dijck (2013) and Farnham et
al.(2011) claim that Internet users have different facets of identities and they use different
social networks as different tools to express the different facets of themselves.
These literature all gave evidence that people have different information
disclosure patterns across social networks because of 1) the innate difference of social

17
17
networks been used. 2) the need to exhibit different facets of their identities. 3) the extent
of trust that the user places to each site. There are other potential factors that may affect
one’s information disclosure behavior. These factors are discussed in the next section.
2.3 Personal Traits and Privacy Perceptions
The user’s personal traits can affect his/her information disclosure online. Datu et
al (2013) conducted such research on Facebook users to study whether personal traits can
affect users’ privacy settings in social networks. They used a “Big Five” model to
classified the user’s personal traits into 5 dimentisons: Extraversion, Openness,
Conscientiousness, Agreeableness and Neuroticism and then studied whether each trait
affect user’s privacy setting. There result suggested that Openness can be a predictor in
differentiating users with public profiles and users with private profiles.
Conscientiousness, which refers to individuals’ predisposition to self-control, regulation,
and order influenced individuals’ preference Facebook profile setting (e.g. public and
private). Basically, this means that people with more self-control tend to be more
cautious about their information disclosure while users with public profiles are generally
more open-minded than those with private profiles.
However, a similar work conducted by Schrammel et al. (2009) suggested that
personal traits do not have a significant influence on information disclosure behavior in
social networks. They authors thus made a hypothesis that the actual usage purpose and
goal of a user when inter acting with a community is the main driving factor behind the
information disclosure behavior. “For example a community member whose main goal is
to initiate a romantic relationship might provide very different types and amounts of

18
18
information compared to a user interested in exploring new trends or in keeping in touch
with old friends.”
The relationship between privacy concern, control and information disclosure
have been studied by many literatures. Zimmer et al. (2010) argued that the degree of
control over information makes people sure about their ability to manage it and so
increases their trust in the whole online social network system. The perception of trust
seems to have a negative effect on privacy concerns: an increase in trust causes a
reduction in the perception of the risk connected with privacy. Taddei et al. (2013)
claimed that privacy concerns cannot directly influence the degree of self-disclosure
online because that Internet users, and particularly young people, do not have a
detrimental fear for their privacy that determines their online behavior, but that control
and trust are crucial and more able to influence their effective disclosure behavior.
2.4 Summary
The above literature been discussed is not exhaustive. Though little attention has
been casted on the comparison of information disclosure behavior patterns across
multiple social networks, these works already leave us “bread crumbs” of how and why
people’s information disclosure behavior pattern varies across OSNs. One obvious reason
is the usage and goal when users use different types of OSNs. Also, several works have
shown that people used different social networks to exhibit different representations of
themselves (facets of identities) to different groups of people. Furthermore, information
disclosure behavior also depends on a user’s trust on each social network - the more you
trust, the more you disclose. Other factors that might influence information disclosure

19
19
behavior in social networks such as personal traits, privacy concern and control are also
discussed.
Assuming the different information disclosure pattern among different social
networks is true, the aggregation of online social footprints of user’s profile on each
social network site will be a great threat to user’s privacy. How to preserve user’s privacy
in a multiple social networks context thus becomes an interesting and urgent task.
The next chapter will introduce the methodology used in this study.

20
20
CHAPTER 3. METHODOLOGY
3.1 Research Population and Sample Size
This research is a descriptive study based on self-reported survey. The study
aimed at the culture factor that may influence behavior and perception in social networks.
Therefore, 3 populations were included for this study- Chinese college students currently
living in China, Chinese college students currently studying in the U.S. and U.S. college
students. The purpose was to find out whether there are significant differences in
behavior and perception between Chinese users and American users when using online
social networks and to study that when a shift in a culture environment happens, will it
affect such differences.
First, the population sizes were estimated using existing statistics. The total
number of U.S. college enrollment 17,487,475 (National Center for Education Statistics,
2013); the population of Chinese college students 25.365647 million (Chinese Statistics
Digest, 2012), and the Chinese students who studied abroad in the US 0.23
million.(Institutes of International Education, U.S. Bureau of Culture and Education
Affairs, 2013 ). There was no consensus on what’s the actual percentage of colleges
students were actually social network users. According to Lenhart et al. (2010), 72% of
all college students had a social media profile. However, a recent study by Martin (2013)
showed that 96% of college students had a Facebook account. In this study, 96% was

21
21
used as an estimation of percentage of social network users for all three groups.
Therefore, the population of social network users were calculated as total number of
enrollment * 96%.
The sample size needed to achieve 5% marginal error and 95% confidence level
was then calculated. The population and corresponding sample size was listed in the
following table.
Table 3.1.
Estimated Population and Targeted Sample Size
Population Confidence
Level
Marginal
Error
Sample Size
Needed
U.S. college students who are social network users 95% 5% 384
Chinese college students in China who are social
network users
95% 5% 384
Chinese students studying in the U.S. who are social
network users
95% 5% 384
To reach the threshold of 384 respondents, a sample of 1,234 valid responses
were collected including: 404 U.S students, 417 Chinese students living in the U.S. and
413 Chinese students currently living in China.

22
22
3.2 Data Collection
The date for data collection began on Jan 26, 2014 and finished on May 15, 2014.
Survey was used to gather the necessary data. The survey included demographic, general
privacy attitude, and questions about user behavior and perceptions in specific sites (see
Appendix A).
A survey using the Qualtrics software was created and launched online. An
anonymous link was then generated so that we caould distribute the survey by sending
the link through email. Various methods were used to collect responses: more than 3,000
email invitations were sent and social media platforms such as Facebook, Twitter, QQ
and WeChat were leveraged to get as many responses as possible.
In order to protect the respondent’s anonymity and confidentiality, each
respondent was provided with a randomly assigned ID number by the database. Thus, the
responses to the questionnaires could not be linked or matched to any particular
participant because no identifying information will be requested. Also, the participants
were taken to the informed consent web page and instructed to read the contents (see
Appendix A). If the participants agreed, they could check the “I have read, understood
the above consent form and desire of my own free will to participate in this study. ”
button to take part in the survey. They were then asked to fill out the survey, which
required approximately 2-5 minutes to complete. The data was stored electronically in an
encrypted format to ensure confidentiality, as well.

23
23
3.3 Data Analysis Methods
Descriptive statistics was applied to analyze the data. The basic statistics such as
frequency distribution, median, mean, variance etc. will be analyzed using the survey
report tools provided by Qualtrics. One-way ANOVA, Kruskal Wallis tests, and
correlation analysis were applied to study the relationships among variables using
Minitab.
3.4 IRB Protocol
The survey participants were the general public with Internet access and 18 years
of age or older; an exempt research (Category 2) was applied and granted (see Appendix
B).
3.5 Summary
This chapter introduces the methodology for preparing the research, collecting
data and for analyzing data. In the next chapter, the detailed process of data analysis is
introduced and the results are demonstrated.

24
24
CHAPTER 4. PRESENTATION AND ANALYSIS OF DATA
4.1 Data Summary
A total of 1,410 responses were collected in the raw dataset including 130
respondents that did not fall into any of the three populations. The dataset also had 47
respondents who claimed that they did not use any social network service at all. So these
responses were exclude from the dataset and we ended up with a sample of 1,234 valid
respondents including: 404 U.S students, 417 Chinese students living in the U.S. and 413
Chinese students currently living in China (Table 4.1).
Table 4.1.
Dataset Summary
Groups Total Response
None Social
Network Users
Valid Responses
U.S. citizen 426 22 404
Chinese citizen living in the U.S. 437 20 417
Chinese citizen living in China 417 4 413
None of the above 130 1 0
Total 1,410 47 1,234
25
25
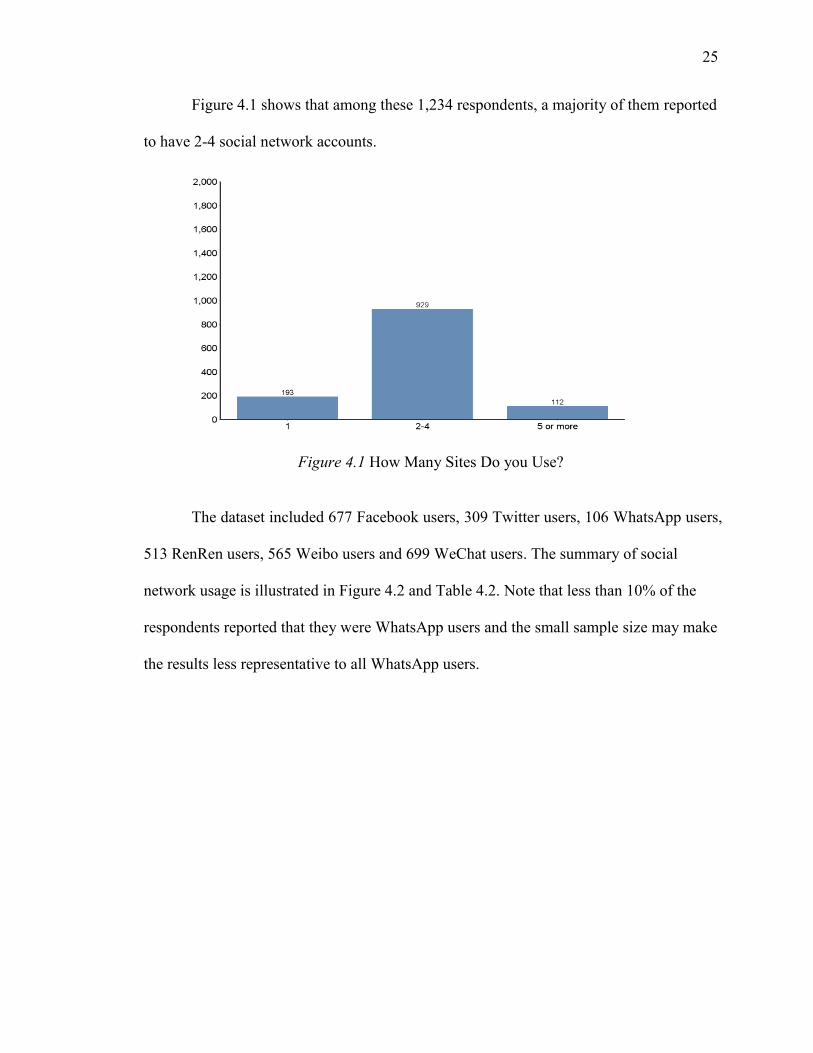
Figure 4.1 shows that among these 1,234 respondents, a majority of them reported
to have 2-4 social network accounts.
Figure 4.1 How Many Sites Do you Use?
The dataset included 677 Facebook users, 309 Twitter users, 106 WhatsApp users,
513 RenRen users, 565 Weibo users and 699 WeChat users. The summary of social
network usage is illustrated in Figure 4.2 and Table 4.2. Note that less than 10% of the
respondents reported that they were WhatsApp users and the small sample size may make
the results less representative to all WhatsApp users.

26
26
Figure 4.2 Number of Users for Each Site
Table 4.2.
Number of Users for Each Site
Sites Response Total Respondents %
Facebook 677 1234 54.86%
Twitter 309 1234 25.04%
WeChat 699 1234 56.65%
RenRen 513 1234 41.57%
Weibo 565 1234 45.79%
WhatsApp 106 1234 8.59%
None of the above 47 1234 3.81%

27
27
4.1.1 General Privacy Attitude
In the survey, the respondents were asked to rate their general privacy concerns of
16 different types of information as “public”, “moderate privacy concern” or “very
private” when they were using the social network. Fig. 4.3 illustrates how these social
network users perceive the extent of privacy for each information category. Based on the
responses, “SSN or other identification number” raised most privacy concerns as around
86% of the respondents rated it as “very private” and only 2.5% of the respondents
considered it as “public”. Gender was the type of information that raised the least privacy
concern – 75.5% of the respondents rated it as “public”.
Figure 4.3 General Privacy Attitude N=1,234

28
28
Table 4.3.
General Privacy Attitude
Types of information Public
Moderate
privacy concern
Very Private
Total
Responses
School information 467 589 178 1234
Real name 349 564 321 1234
Email address 312 649 273 1234
Phone number 72 376 786 1234
Physical address 55 324 855 1234
Age/ Birth year 395 589 250 1234
Relationship Status 517 527 190 1234
Gender 932 242 60 1234
Personal photo 383 576 275 1234
Login name/Nick name 694 375 165 1234
SSN or other identification
number
31 143 1060 1234
Hometown/Birthplace 413 579 242 1234
Network of friends (eg. friend
list or contact list)
303 663 268 1234
Exact birthdate 319 540 375 1234
Employer information 350 600 284 1234
Current geolocation 304 554 376 1234

29
29
4.1.2 Privacy Setting
The respondents were asked how often they changed their privacy settings for
each selected social network. The options were “Never”, “Seldom”, “Sometimes” and
“Often”. To avoid ambiguity of the choices, the survey defined, for example, “Seldom”
as “Once a year or less”; “Sometimes” as “Several times a year” and “Often” as
“Monthly or weekly”. For all across the social networks, most of the respondents
reported that they either “Seldom” or “Never” changed their privacy settings.
Figure 4.4 Frequency of Changing Privacy Settings N=1,234
Table 4.4.
Frequency of Changing Privacy Settings
Sites Never Seldom Sometimes Often
Total
Responses
Facebook 107 318 180 72 677
Twitter 88 125 69 27 309

30
30
Table 4.4 (continued)
Frequency of Changing Privacy Settings
WhatsApp 36 34 22 14 106
RenRen 101 225 114 73 513
Weibo 140 213 110 102 565
WeChat 153 261 140 145 699
4.1.3 Privacy Policy
The respondents were asked “have you ever read the privacy policies for each
site?”. The options were “No”, “Yes, but not carefully” and “Yes, I’ve read them
carefully”. Not surprisingly, very few of the respondents said that they had read the
privacy policies carefully in any of the selected social networks.
Figure 4.5 Have You Read Privacy Policies? N=1,234

31
31
Table 4.5.
Have You Read Privacy Policies?
Sites No
Yes, but not
carefully
Yes, I've read them
carefully
Total Responses
Facebook 353 253 71 677
Twitter 163 108 38 309
WhatsApp 56 29 21 106
RenRen 334 151 28 513
Weibo 349 170 46 565
WeChat 452 193 54 699
4.1.4 Extent of Trust
The study would like to find out whether the extent of trust would reflect users’
privacy perceptions or influence user behaviors. Therefore, the respondents were asked to
rate their extent of trust when they were using each selected social network. They could
select either “T don't trust it at all”, “I’m suspicious that it may misuse my information”,
or “I trust it won't misuse my information”. Although the majority of respondents
reported that they did not completely trust the social network platform by choosing either
“I don't trust” or “I’m suspicious”, there were still large proportion of people who would
like to trust these social networks, especially Weibo and WeChat users (46% and 50%
respectively).

32
32
Figure 4.6 Extent of Trust N=1,234
Table 4.6.
Extent of Trust
Sites I trust it I'm suspicious I don't trust it at all Total Responses
Facebook 188 357 132 677
Twitter 99 155 55 309
WhatsApp 43 44 19 106
RenRen 196 237 80 513
Weibo 260 229 76 565
WeChat 348 267 84 699

33
33
4.1.5 Profile Preference
The profile preference were considered in this study as a potential indicator of
users’ privacy perception with the assumption that people who use private profiles may
be more aware of privacy. So the respondents were asked whether they were using a
“public” profile or a “private” profile in each selected social networks. The results were
shown in Fig. 4.7 and Table 4.7. Most users in Twitter and its Chinese “replica” Weibo
were using public profiles as most users in the other four sites were using private profiles.
Figure 4.7 Profile Preference N=1,234
Table 4.7.
Profile Preference
Sites Public Private Total Responses
Facebook 283 394 677
Twitter 194 115 309

34
34
Table 4.7 (continued).
Profile Preference
WhatsApp 45 61 106
RenRen 213 300 513
Weibo 330 235 565
WeChat 200 499 699
4.1.6 Constituents of Friend List
The respondents were asked to choose how many people in their friend list or
contact lists were the people they actually knew in real world. The assumption was that
the percentage of real life friends may have an influence on user behavior in social
networks. Five choices.“<10%”, “10-40%”, “40-60%”,”60-90%” and “>90%” were
offered.
We can clearly see some similar trends in similar sites. For example, both
WeChat and WhatsApp had a large proportion of respondents who had more than 90%
real life friends in their friend lists. The responses are illustrated as follows:

35
35
Figure 4.8 Constituents of Friend List N=1,234
Table 4.8.
Constituents of Friend List
Sites <10% 10-40% 40-60% 60-90% >90%
Total
Responses
Facebook 21 57 110 227 262 677
Twitter 104 63 58 49 35 309
WhatsApp 5 7 18 26 50 106
RenRen 20 40 80 187 186 513
Weibo 125 177 104 95 64 565
WeChat 18 32 64 187 398 699

36
36
4.1.7 Information Disclosure
Finally, the survey asked the respondents what kind of information they actually
disclosed on each site. 13 types of personal information were picked out of the previous
16 categories in the general privacy attitude question. It seems that Facebook users and
three Chinese sites users were more willing to disclose information in each category
while WhatsApp users and Twitter users were most reluctantly in disclosing most types
of information.
The results are illustrated blow:
Figure 4.9 Information Disclosure N=1,234

37
37
Table 4.9.
Information Disclosure
Types of
information
Facebook Twitter WhatsApp RenRen Weibo WeChat
Real name 579 140 58 419 112 330
Email address 357 99 34 239 235 269
Phone number 109 21 45 91 66 199
Personal photo 533 153 64 364 257 408
Physical address 57 11 12 78 59 144
Age/ Birth year 469 121 40 360 262 354
Exact Birthdate 300 62 22 294 182 281
Relationship Status 400 97 28 227 237 289
Gender 610 227 71 447 432 532
Network of friends 402 123 35 259 181 283
Current geolocation 265 71 23 210 216 313
School information 472 75 29 369 218 269
Employer
information
295 51 19 175 134 184
4.2 Exploring Cultural Differences
In the previous section, we provide an overview of the dataset and demonstrated
the results and statistics for each survey question. In the following sections, we perform
detailed data analysis in order to answer the following research questions: 1) Is culture
background a significant factor in influencing social network users’ privacy perceptions

38
38
and behaviors? 2) What’s the relationship between privacy attitude and actual
information disclosure behavior? 3) What’s the relationship among the various privacy
perception and behavior variables?
4.2.1 Cultural Differences in General Privacy Attitude
This subsection discusses whether social network users with different cultural
background would have significantly different privacy attitudes. In this study we
specifically focus on three population- U.S. citizen, Chinese citizen studying in the
U.S. and Chinese citizen living in China. The following figure breaks down the
responses into the three groups and gives a contour of how different groups differ in their
privacy attitudes. For example, we can see from the figure that Chinese in China were
more concerned about their “Real name” than the other two groups, while the U.S. users
were more concerned about their “Nickname” and “Current geolocation”.

39
39
Figure.4.10 General Privacy Attitudes N=1,234, =404, =417, =413
In order to take a closer look, we perform detailed One-way ANOVA tests to find
out whether there are significant differences among the three groups. We use a Kruskal-
Wallis test (non-parametric) to verify the result and finally we perform a Turkey Post hoc
test to find out the exact differences. We first performed the tests on “Real name” to see
whether there were significant differences in privacy attitudes in this type of information
among the three groups. The hypotheses were:
There’s no difference in the mean of privacy attitudes among the three
groups.
40
40
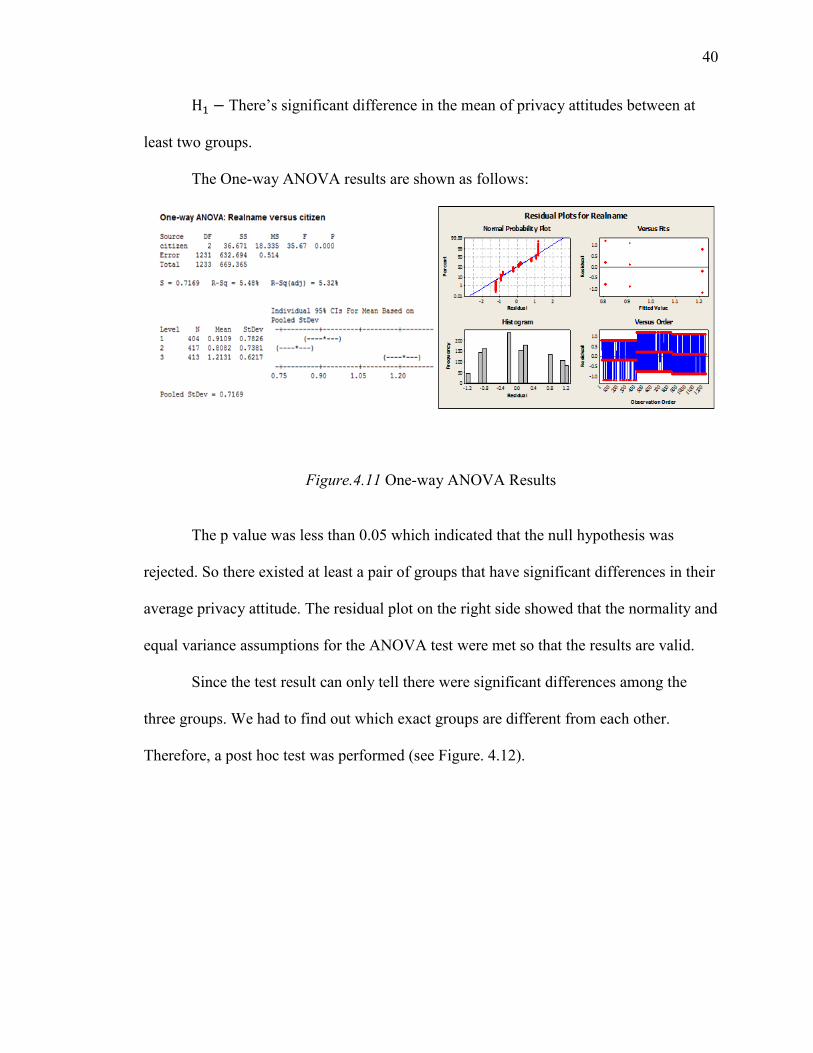
There’s significant difference in the mean of privacy attitudes between at
least two groups.
The One-way ANOVA results are shown as follows:
Figure.4.11 One-way ANOVA Results
The p value was less than 0.05 which indicated that the null hypothesis was
rejected. So there existed at least a pair of groups that have significant differences in their
average privacy attitude. The residual plot on the right side showed that the normality and
equal variance assumptions for the ANOVA test were met so that the results are valid.
Since the test result can only tell there were significant differences among the
three groups. We had to find out which exact groups are different from each other.
Therefore, a post hoc test was performed (see Figure. 4.12).

41
41
Figure.4.12 Post-hoc Results
The result suggested that (Chinese living in China) was significantly different
from both (U.S. Citizen) and (Chinese respondents in the U.S.). However, and
.did not have significant differences. To be more precise, the results gave evidence that
the Chinese users in China were more concerned about their real names than Chinese
users in the U.S. and U.S. users while the latter two groups did not have significant
differences.
We performed the same tests for all the 16 types of information. The results are
listed in the following table.
42
42
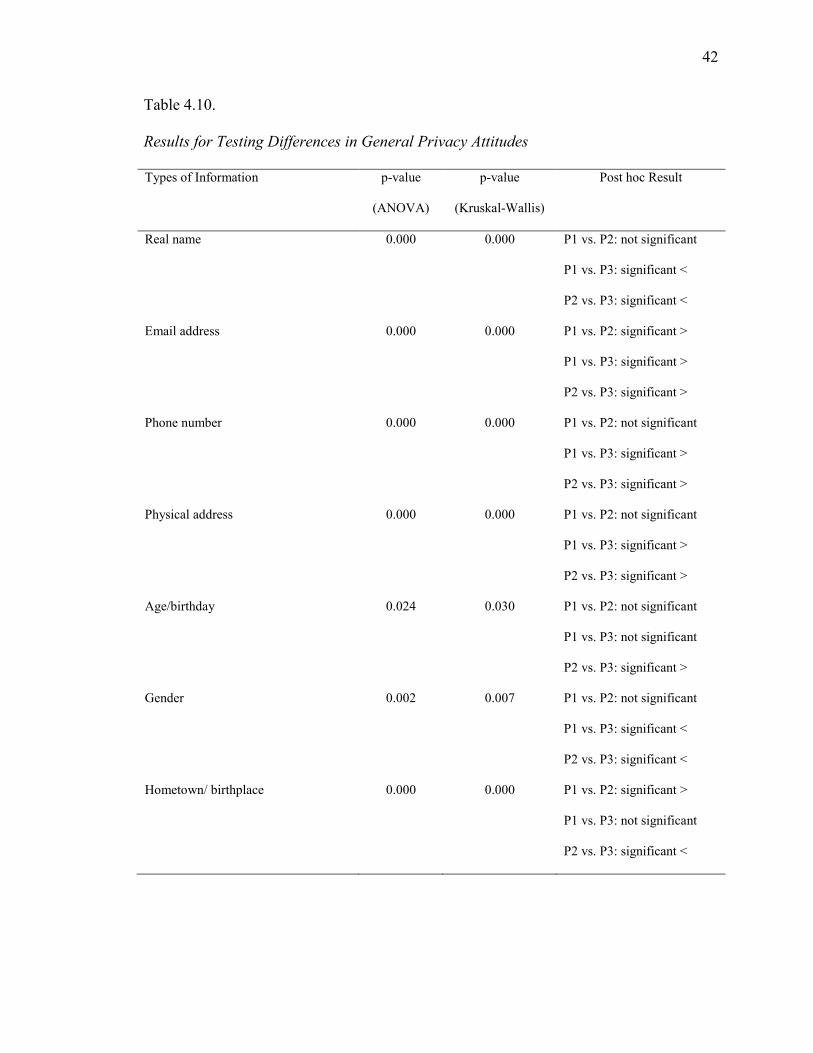
Table 4.10.
Results for Testing Differences in General Privacy Attitudes
Types of Information p-value
(ANOVA)
p-value
(Kruskal-Wallis)
Post hoc Result
Real name 0.000 0.000 P1 vs. P2: not significant
P1 vs. P3: significant <
P2 vs. P3: significant <
Email address 0.000 0.000 P1 vs. P2: significant >
P1 vs. P3: significant >
P2 vs. P3: significant >
Phone number 0.000 0.000 P1 vs. P2: not significant
P1 vs. P3: significant >
P2 vs. P3: significant >
Physical address 0.000 0.000 P1 vs. P2: not significant
P1 vs. P3: significant >
P2 vs. P3: significant >
Age/birthday 0.024 0.030 P1 vs. P2: not significant
P1 vs. P3: not significant
P2 vs. P3: significant >
Gender 0.002 0.007 P1 vs. P2: not significant
P1 vs. P3: significant <
P2 vs. P3: significant <
Hometown/ birthplace 0.000 0.000 P1 vs. P2: significant >
P1 vs. P3: not significant
P2 vs. P3: significant <
43
43
Table 4.10 (continued).
Results for Testing Differences in General Privacy Attitudes
Network of friends 0.000 0.000 P1 vs. P2: significant >
P1 vs. P3: significant <
P2 vs. P3: significant <
Birthday 0.000 0.000 P1 vs. P2: significant >
P1 vs. P3: significant >
P2 vs. P3: significant >
Employer information 0.000 0.000 P1 vs. P2: significant >
P1 vs. P3: not significant
P2 vs. P3: significant <
School information 0.000 0.000 P1 vs. P2: significant >
P1 vs. P3: not significant
P2 vs. P3: significant <
Current geolocation 0.000 0.000 P1 vs. P2: significant >
P1 vs. P3: significant >
P2 vs. P3: not significant
Note. Confidence level: 95%, α=0.05, n=1234, N=1,234, =404, =417, =413 “</>“denotes
“significantly smaller/larger than”
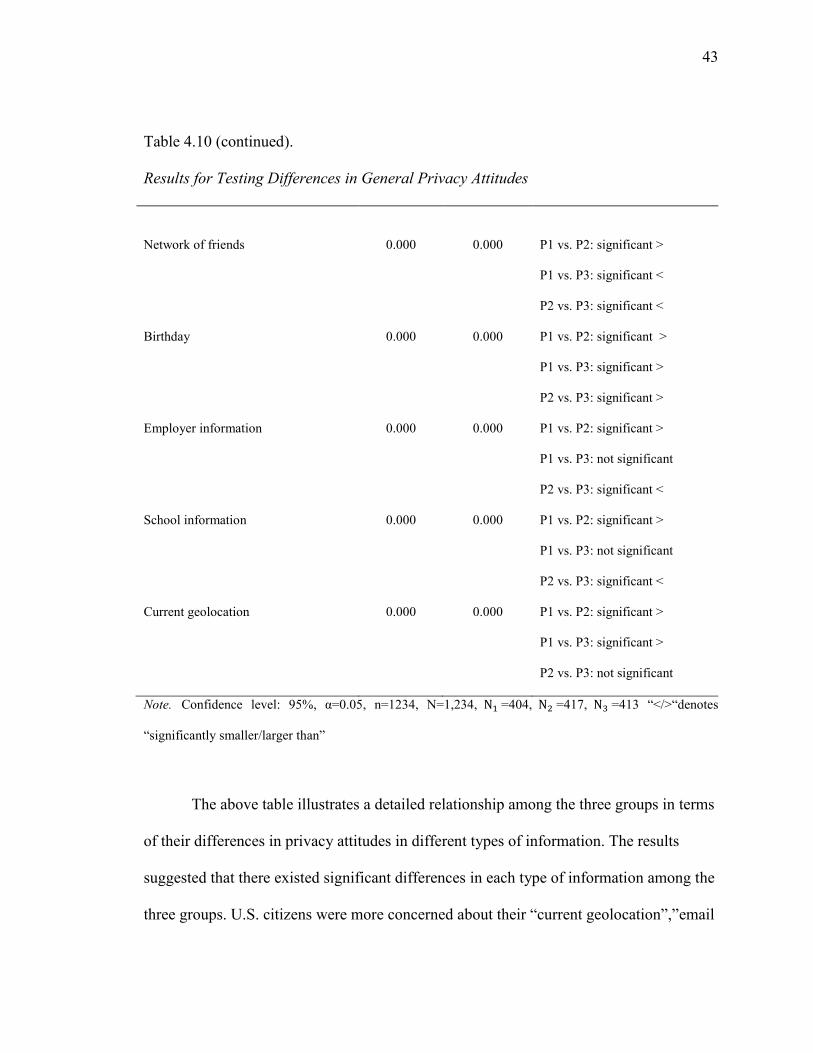
The above table illustrates a detailed relationship among the three groups in terms
of their differences in privacy attitudes in different types of information. The results
suggested that there existed significant differences in each type of information among the
three groups. U.S. citizens were more concerned about their “current geolocation”,”email

44
44
address”, “login name/nick name” and “birthday”. Chinese users in the U.S. were more
concerned about “Relationship status” while they are less concerned about “school
information”, “employer information” ,”hometown” and “network of friends” than the
other two groups. The Chinese users in China, however, were significantly more
concerned about “real name”, “gender”, “network of friends” and “personal photo” but
significantly less concerned about “email address”, “phone number”, “physical address”,
“SSN or other identification number” and “birthday”. The conclusion is that cultural
differences did play an important role in differentiating users’ general privacy attitudes
when they were using the social networks. People with different cultural background may
have very different privacy attitudes. However, we also found out that in some cases,
people with different cultural background may not have significant differences in privacy
attitudes in specific types of information (for example P1 and P3 did not have significant
differences in “employer information”, “school information”, “hometown” and
“relationship status”). The comparison between two Chinese groups suggests that a shift
in the cultural environment may have potential impact on privacy attitudes.
4.2.2 Cultural Differences in Trust
In this subsection, we compare Chinese and American respondents by studying
how much they trust each social network. Since Facebook and the other U.S. sites are
blocked in China and U.S. students rarely use the three Chinese social networks, we are
only able to conduct a pair wise comparison in each social network. The constituent of
respondents for each social network is listed in the following table:
45
45
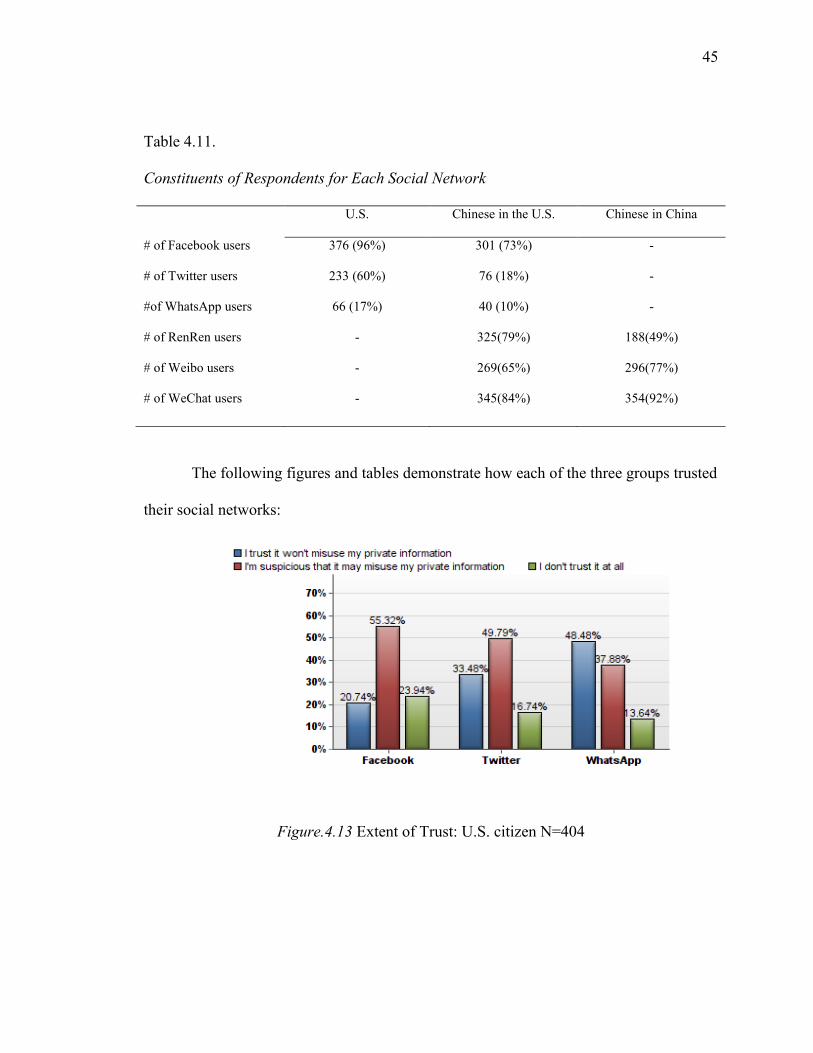
Table 4.11.
Constituents of Respondents for Each Social Network
U.S. Chinese in the U.S. Chinese in China
# of Facebook users 376 (96%) 301 (73%) -
# of Twitter users 233 (60%) 76 (18%) -
#of WhatsApp users 66 (17%) 40 (10%) -
# of RenRen users - 325(79%) 188(49%)
# of Weibo users - 269(65%) 296(77%)
# of WeChat users - 345(84%) 354(92%)
The following figures and tables demonstrate how each of the three groups trusted
their social networks:
Figure.4.13 Extent of Trust: U.S. citizen N=404

46
46
Figure.4.14 Extent of Trust: Chinese in the U.S. N=417
Figure.4.15 Extent of Trust: Chinese in China N=413

47
47
Table 4.12.
Extent of Trust: U.S. Citizen
Sites
I trust it won't misuse
my private
information
I'm suspicious that it
may misuse my private
information
I don't trust it at
all
Total Responses
Facebook 78 208 90 376
Twitter 78 116 39 233
WhatsApp 32 25 9 66
RenRen 0 0 0 0
Weibo 0 0 0 0
WeChat 0 0 0 0
Table 4.13.
Extent of Trust: Chinese in the U.S.
Sites
I trust it won't misuse
my private
information
I'm suspicious that it
may misuse my private
information
I don't trust it at
all
Total Responses
Facebook 110 149 42 301
Twitter 21 39 16 76
WhatsApp 11 19 10 40
RenRen 97 165 63 325
Weibo 75 141 53 269
WeChat 119 163 63 345

48
48
Table 4.14.
Extent of trust: Chinese in China
Sites
I trust it won't
misuse my private
information
I'm suspicious that it
may misuse my private
information
I don't trust it at
all
Total Responses
Facebook 0 0 0 0
Twitter 0 0 0 0
WhatsApp 0 0 0 0
RenRen 99 72 17 188
Weibo 185 88 23 296
WeChat 229 104 21 354
To look at the differences, we performed a Kruskal-Wallis test for each social
network. The results are shown in Figure 4.16 and Table 4.15:

49
49
Figure.4.16 Kruskal-Wallis Test Results: Trust
Table 4.15.
Summary of Results for Extent of Trust
Sites Population Been
Compared
Sample Sizes Hypothesis P-value
Facebook vs. = 376
= 301
N = 677
: There’s no significant differences
in the extent of trust between U.S.
Facebook users and Chinese Facebook
users in the U.S.
0.000

50
50
Table 4.15 (continued).
Summary of Results for Extent of Trust
Twitter vs. = 233
= 76
N = 309
: There’s no significant differences
in the extent of trust between U.S.
Twitter users and Chinese Twitter
users in the U.S.
0.311
WhatsApp vs. = 66
= 40
N = 106
: There’s no significant differences
in the extent of trust between U.S.
WhatsApp users and Chinese
WhatsApp users in the U.S.
0.039
RenRen vs. = 325
= 188
N = 513
: There’s no significant differences
in the extent of trust between Chinese
RenRen users in China and Chinese
RenRen users in the U.S.
0.000
Weibo vs. = 269
= 296
N = 565
: There’s no significant differences
in the extent of trust between Chinese
Weibo users in China and Chinese
Weibo users in the U.S.
0.000
WeChat vs. = 345
= 354
N = 699
: There’s no significant differences
in the extent of trust between Chinese
WeChat users in China and Chinese
WeChat users in the U.S.
0.311

51
51
The null hypothesis was rejected in all cases except for Twitter. There’s no
evidence that Chinese Twitter users and U.S. Twitter users were significantly different
from each other in terms of trust. However, evidence showed that Chinese Facebook
users trusted the social network more as compared with their American counterparts. Yet,
Chinese WhatsApp users trusted less than the U.S. WhatsApp users. For the three
Chinese sites – RenRen, Weibo and WeChat, Chinese users in China significantly trusted
these sites more than those studying in the U.S.
4.2.3 Cultural Differences in Reading Privacy Policies
In this section, we try to answer the question: Are there significant differences in
reading privacy policies between American users and Chinese users? An overview of the
responses is illustrated below:
Figure.4.17 Reading Privacy Policies: U.S. Citizen N=404

52
52
Figure.4.18 Reading Privacy Policies: Chinese in the U.S. N=417
Figure.4.19 Reading Privacy Policies: Chinese in China N=417
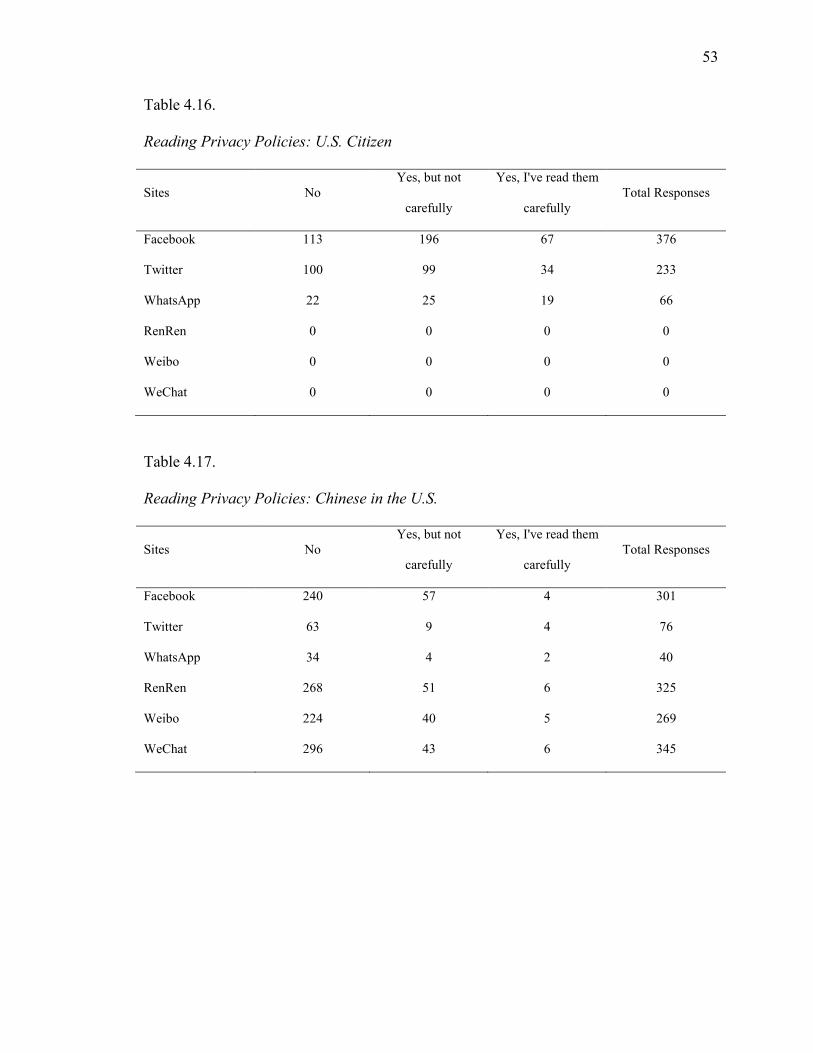
53
53
Table 4.16.
Reading Privacy Policies: U.S. Citizen
Sites No
Yes, but not
carefully
Yes, I've read them
carefully
Total Responses
Facebook 113 196 67 376
Twitter 100 99 34 233
WhatsApp 22 25 19 66
RenRen 0 0 0 0
Weibo 0 0 0 0
WeChat 0 0 0 0
Table 4.17.
Reading Privacy Policies: Chinese in the U.S.
Sites No
Yes, but not
carefully
Yes, I've read them
carefully
Total Responses
Facebook 240 57 4 301
Twitter 63 9 4 76
WhatsApp 34 4 2 40
RenRen 268 51 6 325
Weibo 224 40 5 269
WeChat 296 43 6 345

54
54
Table 4.18.
Reading Privacy Policies: Chinese in China
Sites No
Yes, but not
carefully
Yes, I've read them
carefully
Total Responses
Facebook 0 0 0 0
Twitter 0 0 0 0
WhatsApp 0 0 0 0
RenRen 66 100 22 188
Weibo 125 130 41 296
WeChat 156 150 48 354
Figure 4.20.and Table 4.19 summarizes the results of Kruskal-Wallis tests.
Figure.4.20 Kruskal-Wallis Test Results: Privacy Policy
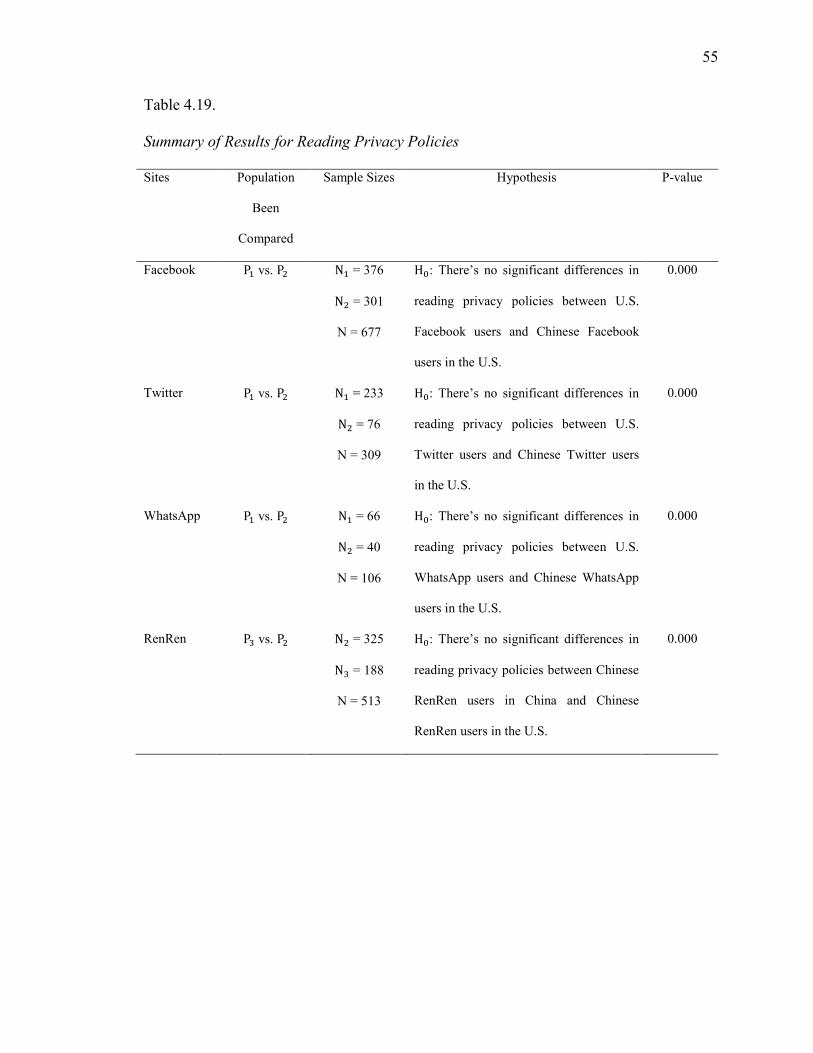
55
55
Table 4.19.
Summary of Results for Reading Privacy Policies
Sites Population
Been
Compared
Sample Sizes Hypothesis P-value
Facebook vs. = 376
= 301
N = 677
: There’s no significant differences in
reading privacy policies between U.S.
Facebook users and Chinese Facebook
users in the U.S.
0.000
Twitter vs. = 233
= 76
N = 309
: There’s no significant differences in
reading privacy policies between U.S.
Twitter users and Chinese Twitter users
in the U.S.
0.000
WhatsApp vs. = 66
= 40
N = 106
: There’s no significant differences in
reading privacy policies between U.S.
WhatsApp users and Chinese WhatsApp
users in the U.S.
0.000
RenRen vs. = 325
= 188
N = 513
: There’s no significant differences in
reading privacy policies between Chinese
RenRen users in China and Chinese
RenRen users in the U.S.
0.000
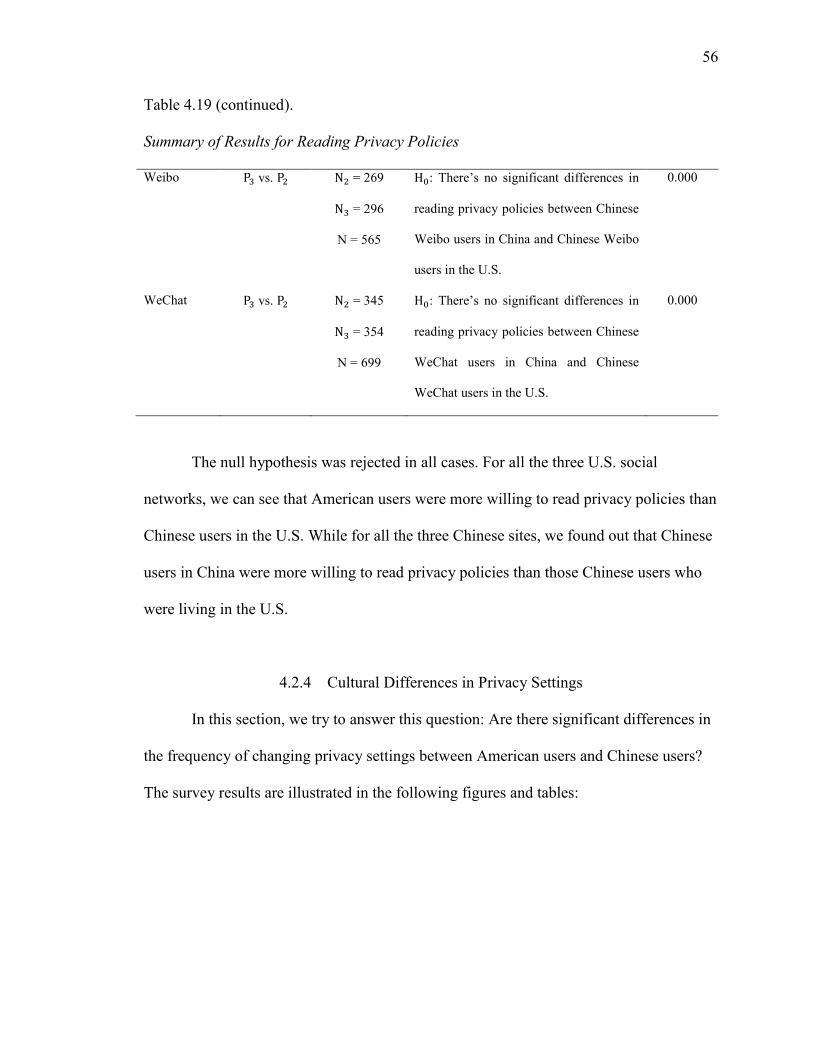
56
56
Table 4.19 (continued).
Summary of Results for Reading Privacy Policies
Weibo vs. = 269
= 296
N = 565
: There’s no significant differences in
reading privacy policies between Chinese
Weibo users in China and Chinese Weibo
users in the U.S.
0.000
WeChat vs. = 345
= 354
N = 699
: There’s no significant differences in
reading privacy policies between Chinese
WeChat users in China and Chinese
WeChat users in the U.S.
0.000
The null hypothesis was rejected in all cases. For all the three U.S. social
networks, we can see that American users were more willing to read privacy policies than
Chinese users in the U.S. While for all the three Chinese sites, we found out that Chinese
users in China were more willing to read privacy policies than those Chinese users who
were living in the U.S.
4.2.4 Cultural Differences in Privacy Settings
In this section, we try to answer this question: Are there significant differences in
the frequency of changing privacy settings between American users and Chinese users?
The survey results are illustrated in the following figures and tables:

57
57
Figure.4.21 Changing Privacy Settings: U.S. Citizen N=404
Figure.4.22 Changing Privacy Settings: Chinese in the U.S. N=417

58
58
Figure.4.23 Changing Privacy Settings: Chinese in China N=413
Table 4.20.
Changing Privacy Settings: U.S
Sites Never Seldom Sometimes Often
Total
Responses
Facebook 38 171 118 49 376
Twitter 56 99 56 22 233
WhatsApp 15 24 16 11 66
RenRen 0 0 0 0 0
Weibo 0 0 0 0 0
WeChat 0 0 0 0 0

59
59
Table 4.21.
Changing Privacy Settings: Chinese in the U.S.
Sites Never Seldom Sometimes Often
Total
Responses
Facebook 38 171 118 49 376
Twitter 56 99 56 22 233
WhatsApp 15 24 16 11 66
RenRen 0 0 0 0 0
Weibo 0 0 0 0 0
WeChat 0 0 0 0 0
Table 4.22.
Changing Privacy Settings: Chinese in China
Sites Never Seldom Sometimes Often -
Total
Responses
Facebook 0 0 0 0 0
Twitter 0 0 0 0 0
WhatsApp 0 0 0 0 0
RenRen 26 68 59 35 188
Weibo 59 103 66 68 296
WeChat 71 106 83 94 354
We coded the responses as: 3- “often”, 2 – “sometimes”, 1 – “seldom” and 0-
“never”. We performed the same analysis as privacy policies. The results are listed below:

60
60
Figure.4.24 Kruskal-Wallis Test Results: Privacy Setting
Table 4.23.
Summary of Results for Changing Privacy Settings
Sites Population
Been
Compared
Sample Sizes Hypothesis P-value
Facebook vs. = 376
= 301
N = 677
: There’s no significant differences in
changing privacy settings between U.S.
Facebook users and Chinese Facebook users
in the U.S.
0.000

61
61
Table 4.23 (continued).
Summary of Results for Changing Privacy Settings
Twitter vs. = 233
= 76
N = 309
: There’s no significant differences in
changing privacy settings between U.S.
Twitter users and Chinese Twitter users in
the U.S.
0.011
WhatsApp vs. = 66
= 40
N = 106
: There’s no significant differences in
changing privacy settings between U.S.
WhatsApp users and Chinese WhatsApp
users in the U.S.
0.005
RenRen vs. = 325
= 188
N = 513
: There’s no significant differences in
changing privacy settings between Chinese
RenRen users in China and Chinese
RenRen users in the U.S.
0.000
Weibo vs. = 269
= 296
N = 565
: There’s no significant differences in
changing privacy settings between Chinese
Weibo users in China and Chinese Weibo
users in the U.S.
0.000
WeChat vs. = 345
= 354
N = 699
: There’s no significant differences in
changing privacy settings between Chinese
WeChat users in China and Chinese
WeChat users in the U.S.
0.000
The results suggested that there were significant differences in the frequency of
changing privacy settings in every social network. In the three U.S. social networks,
American users changed their privacy settings more frequently than Chinese social

62
62
network users in the U.S. In the three Chinese sites, Chinese users in China also changed
their privacy settings more frequently than Chinese users living in the U.S.
4.2.5 Cultural Differences in Friend Lists
In this section, we studied whether culture differences affect users’ constituents of
their friend list. The survey results are illustrated in the following figures and tables:
Figure.4.25 Percentage of Real World Friends in Friend List: U.S. Citizen
Figure.4.26 Percentage of Real World Friends in Friend List: Chinese in the U.S N=417
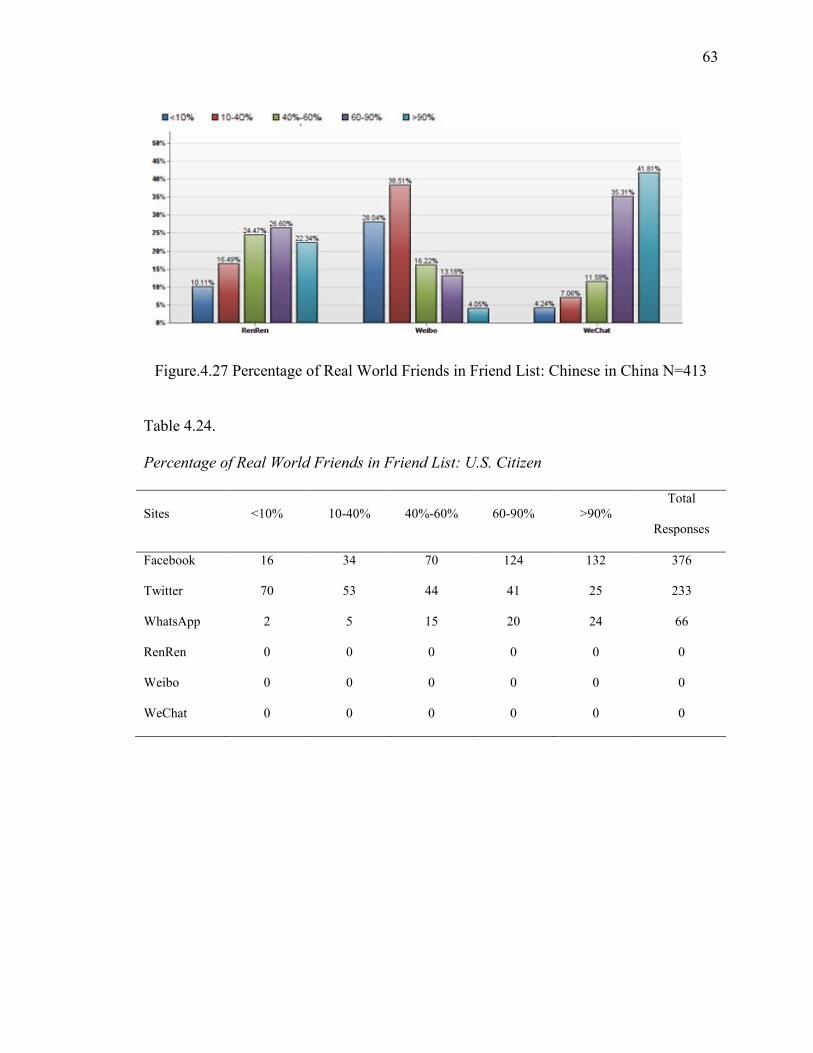
63
63
Figure.4.27 Percentage of Real World Friends in Friend List: Chinese in China N=413
Table 4.24.
Percentage of Real World Friends in Friend List: U.S. Citizen
Sites <10% 10-40% 40%-60% 60-90% >90%
Total
Responses
Facebook 16 34 70 124 132 376
Twitter 70 53 44 41 25 233
WhatsApp 2 5 15 20 24 66
RenRen 0 0 0 0 0 0
Weibo 0 0 0 0 0 0
WeChat 0 0 0 0 0 0

64
64
Table 4.25.
Percentage of Real World Friends in Friend List: Chinese in the U.S.
Sites <10% 10-40% 40%-60% 60-90% >90%
Total
Responses
Facebook 5 23 40 103 130 301
Twitter 34 10 14 8 10 76
WhatsApp 3 2 3 6 26 40
RenRen 1 9 34 137 144 325
Weibo 42 63 56 56 52 269
WeChat 3 7 23 62 250 345
Table 4.26.
Percentage of Real World Friends in Friend List: Chinese in China
Sites <10% 10-40% 40%-60% 60-90% >90%
Total
Responses
Facebook 0 0 0 0 0 0
Twitter 0 0 0 0 0 0
WhatsApp 0 0 0 0 0 0
RenRen 19 31 46 50 42 188
Weibo 83 114 48 39 12 296
WeChat 15 25 41 125 148 354
We performed Kruskal-Wallis tests to test the influence of cultural background on
friend list. The tests results are shown as follows:

65
65
Figure.4.28 Kruskal-Wallis Test Results: Friend List
Table 4.27.
Summary of Results for Friend List
Sites Population Been
Compared
Sample Sizes Hypothesis P-value
Facebook vs. = 376
= 301
N = 677
: There’s no significant
differences in constituent of friend
lists between U.S. Facebook users
and Chinese Facebook users in the
U.S.
0.816
Twitter vs. = 233
= 76
N = 309
: There’s no significant
differences in constituent of friend
lists between U.S. Twitter users and
Chinese Twitter users in the U.S.
0.219
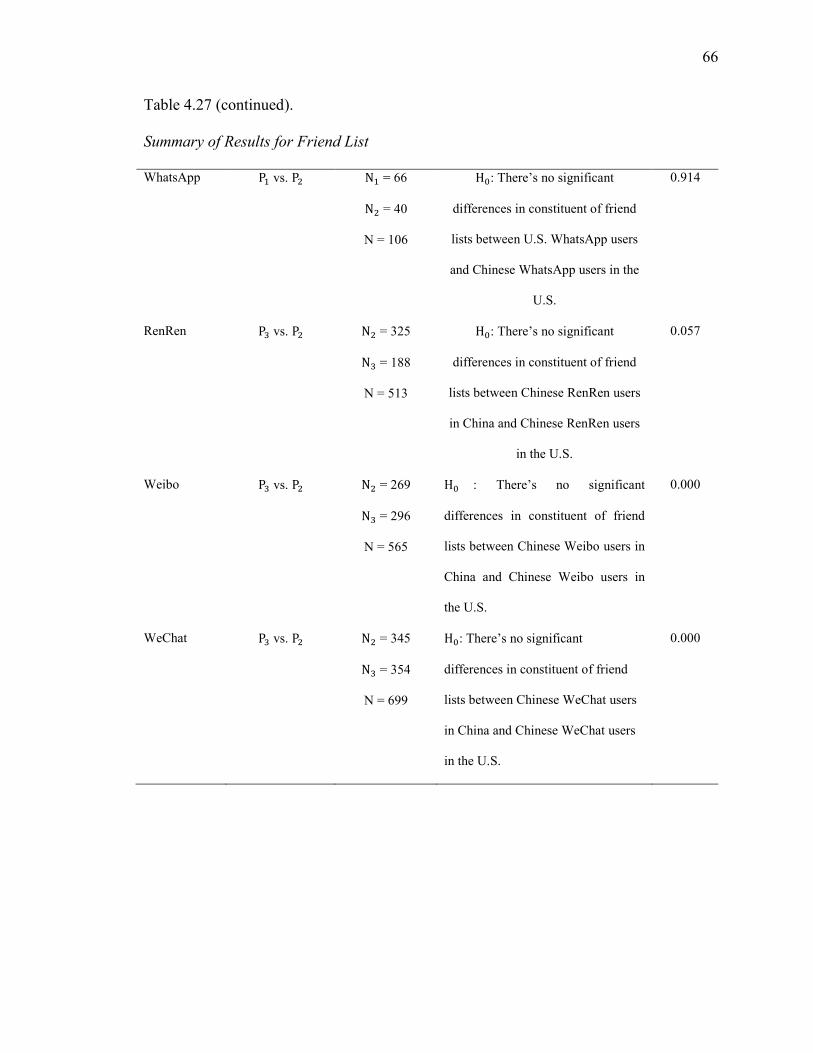
66
66
Table 4.27 (continued).
Summary of Results for Friend List
WhatsApp vs. = 66
= 40
N = 106
: There’s no significant
differences in constituent of friend
lists between U.S. WhatsApp users
and Chinese WhatsApp users in the
U.S.
0.914
RenRen vs. = 325
= 188
N = 513
: There’s no significant
differences in constituent of friend
lists between Chinese RenRen users
in China and Chinese RenRen users
in the U.S.
0.057
Weibo vs. = 269
= 296
N = 565
: There’s no significant
differences in constituent of friend
lists between Chinese Weibo users in
China and Chinese Weibo users in
the U.S.
0.000
WeChat vs. = 345
= 354
N = 699
: There’s no significant
differences in constituent of friend
lists between Chinese WeChat users
in China and Chinese WeChat users
in the U.S.
0.000

67
67
Only in Weibo and WeChat could we identify evidence that indicated significant
differences in the percentage of real life friends in the friend lists between Chinese users
in China and Chinese users in the U.S.
Chinese users in the U.S. had more real life friends than those in china. In the
other four social networks, no evidence was found that support significant differences.
4.2.6 Cultural Differences in Profile Preferences
In this section, we want to know whether culture differences affect users’ profile
management. The survey results are illustrated in the following figures and tables:
Figure.4.29 Profile Preference: U.S. Citizen N=404
Figure.4.30 Profile Preference: Chinese in the U.S. N=417
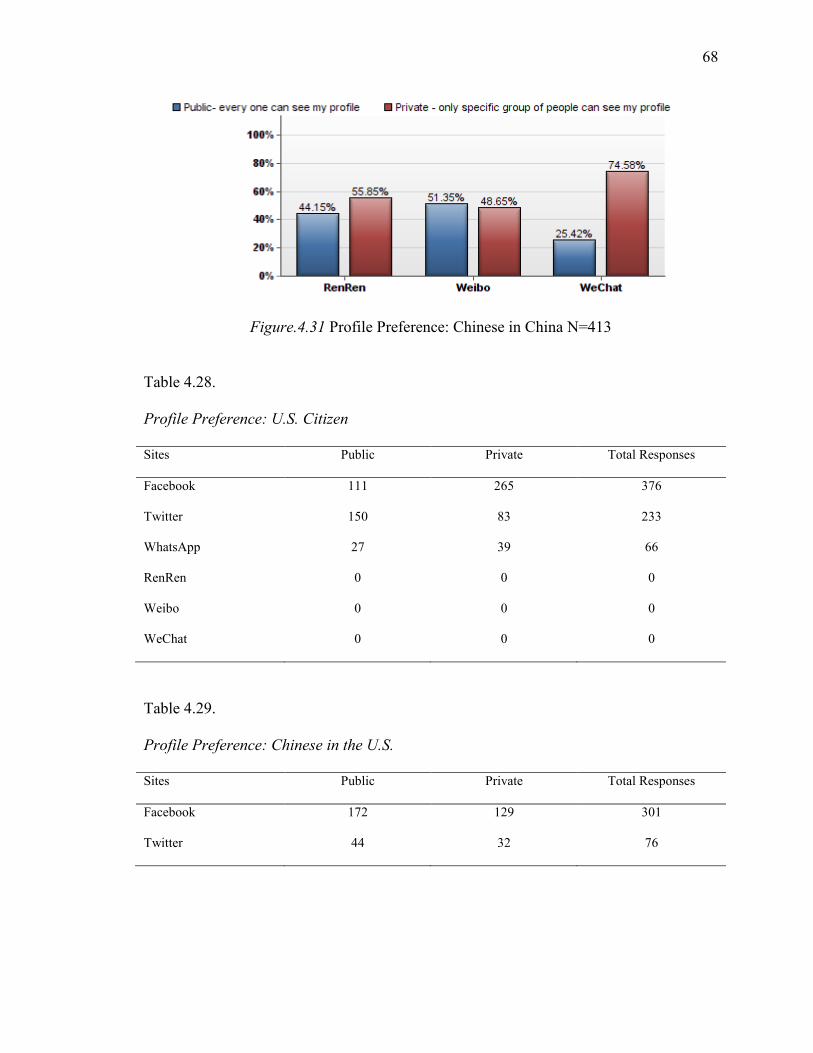
68
68
Figure.4.31 Profile Preference: Chinese in China N=413
Table 4.28.
Profile Preference: U.S. Citizen
Sites Public Private Total Responses
Facebook 111 265 376
Twitter 150 83 233
WhatsApp 27 39 66
RenRen 0 0 0
Weibo 0 0 0
WeChat 0 0 0
Table 4.29.
Profile Preference: Chinese in the U.S.
Sites Public Private Total Responses
Facebook 172 129 301
Twitter 44 32 76

69
69
Table 4.29 (continued).
Profile Preference: Chinese in the U.S.
WhatsApp 18 22 40
RenRen 130 195 325
Weibo 178 91 269
WeChat 110 235 345
Table 4.30.
Profile Preference: Chinese in China
Sites Public Private Total Responses
Facebook 0 0 0
Twitter 0 0 0
WhatsApp 0 0 0
RenRen 83 105 188
Weibo 152 144 296
WeChat 90 264 354
We performed Kruskal-Wallis tests to test the influence of cultural background on
profile preference. The tests results are shown as follows:

70
70
Figure.4.32 Kruskal-Wallis Test Results: Profile Preference
Table 4.31.
Summary of Results for Profile Preference
Sites Population
Been
Compared
Sample Sizes Hypothesis P-value
Facebook vs. = 376
= 301
N = 677
: There’s no significant differences in
profile preferences between U.S. Facebook
users and Chinese Facebook users in the
U.S.
0.000
Twitter vs. = 233
= 76
N = 309
: There’s no significant differences in
profile preferences between U.S. Twitter
users and Chinese Twitter users in the U.S.
0.396

71
71
Table 4.31 (continued).
Summary of Results for Profile Preference
WhatsApp vs. = 66
= 40
N = 106
: There’s no significant differences in
profile preferences between U.S.
WhatsApp users and Chinese WhatsApp
users in the U.S.
0.725
RenRen vs. = 325
= 188
N = 513
: There’s no significant differences in
profile preferences between Chinese
RenRen users in China and Chinese
RenRen users in the U.S.
0.433
Weibo vs. = 269
= 296
N = 565
: There’s no significant differences in
profile preferences between Chinese
Weibo users in China and Chinese Weibo
users in the U.S.
0.002
WeChat vs. = 345
= 354
N = 699
: There’s no significant differences in
profile preferences between Chinese
WeChat users in China and Chinese
WeChat users in the U.S.
0.139
The results suggested that American Facebook users were more likely to use a
private profile than their Chinese counterparts. Chinese Weibo users in China were also
more likely to use a private profile than those Chinese users in the U.S. For the other four
sites, we did not have evidence that there existed significant differences in profile
preference between different groups.

72
72
4.2.7 Cultural Differences in Information Disclosure
In this section, we want to know whether culture differences affect users’
information disclosure behavior. We first give an overview of the responses.
Figure.4.33 Information Disclosure: U.S. Citizen N=404
Figure.4.34 Information Disclosure: Chinese in the U.S. N=417

73
73
Figure.4.35 Information Disclosure: Chinese in China N=413
Table 4.32.
Information Disclosure: U.S. Citizen
Types of information Facebook Twitter WhatsApp RenRen Weibo WeChat
Real name 315 121 42 0 0 0
Email address 193 84 23 0 0 0
Phone number 63 18 35 0 0 0
Personal photo 294 128 45 0 0 0
Physical address 31 11 9 0 0 0
Age/ Birth year 271 101 30 0 0 0
Exact Birthdate 157 57 17 0 0 0
Relationship status 260 88 22 0 0 0
Gender 344 179 49 0 0 0
Network of friends 242 102 26 0 0 0
Current geolocation 115 51 17 0 0 0

74
74
Table 4.32 (continued).
Information Disclosure: U.S. Citizen
School information 226 57 22 0 0 0
Employer information 150 39 13 0 0 0
Table 4.33.
Information Disclosure: Chinese in the U.S.
Types of information Facebook Twitter WhatsApp RenRen Weibo WeChat
Real name 264 19 16 292 33 133
Email address 163 15 11 132 57 76
Phone number 46 3 10 43 7 45
Personal photo 239 25 19 256 119 194
Physical address 26 0 3 21 6 18
Age/ Birth year 197 20 10 222 78 117
Exact Birthdate 143 5 5 178 48 69
Relationship status 139 9 6 112 56 62
Gender 265 48 22 286 200 241
Network of friends 160 21 9 173 91 104
Current geolocation 150 20 6 134 91 121
School information 246 18 7 241 91 109
Employer information 145 12 6 111 49 63

75
75
Table 4.34.
Information Disclosure: Chinese in China
The same Kruskal-Wallis tests were performed for each type of information and
for each social network. The results are summarized in the following table.
Types of information Facebook Twitter WhatsApp RenRen Weibo WeChat
Real name 0 0 0 127 79 197
Email address 0 0 0 107 178 193
Phone number 0 0 0 48 59 154
Personal photo 0 0 0 108 138 214
Physical address 0 0 0 57 53 126
Age/ Birth year 0 0 0 138 184 237
Exact Birthdate 0 0 0 116 134 212
Relationship status 0 0 0 115 181 227
Gender 0 0 0 161 232 291
Network of friends 0 0 0 86 90 179
Current geolocation 0 0 0 76 125 192
School information 0 0 0 128 127 160
Employer
information
0 0 0 64 85 121

76
76
Table 4.35.
Cultural Differences in Information Disclosure
N1=376
N2=301
N1=233
N2=76
N1=66
N2=40
RenRen
N2=325
N3=188
N2=269
N3=296
N2=345
N3=354
Real name p=0.379 p=0.000
P1>P2
p=0.042
P1>P2
p=0.000
P2>P3
p=0.017
P2<P3
p=0.000
P2<P3
Email address p=0.528 p=0.033
P1>P2
p=0.527 p=0.002
P2<P3
p=0.000
P2<P3
p=0.000
P2<P3
Phone number p=0.742 p=0.621
p=0.016
P1>P2
p=0.020
P2<P3
p=0.000
P2<P3
p=0.000
P2<P3
Personal photo p=0.786 p=0.004
P1>P2
p=0.036
P1>P2
p=0.000
P2>P3
p=0.655 p=0.258
Physical address p=0.930 p=0.573 p=0.598 p=0.000
P2<P3
p=0.012
P2<P3
p=0.000
P2<P3
Age p=0.138 p=0.026
P1>P2
p=0.036
P1>P2
p=0.336
p=0.000
P2<P3
p=0.000
P2<P3
Birthday p=0.198 p=0.019
P1>P2
p=0.254 p=0.190
p=0.000
P2<P3
p=0.000
P2<P3
Relationship status p=0.000
P1>P2
p=0.001
P1>P2
p=0.039
P1>P2
p=0.000
P2<P3
p=0.000
P2<P3
p=0.000
P2<P3
Gender p=0.440 p=0.074
p=0.042
P1>P2
p=0.656
p=0.128 p=0.000
P2<P3
Network of friends p=0.012
P1>P2
p=0.035
P1>P2
p=0.074 p=0.157
p=0.158 p=0.000
P2<P3

77
77
Table 4.35 (continued).
Cultural Differences in Information Disclosure
Current geolocation p=0.000
P1<P2
p=0.562
p=0.195 p=0.879
p=0.312 p=0.000
P2<P3
On Facebook, we found out that Chinese users in the U.S. were less willing to
disclose their relationship status and network of friends but more willing to share their
school information and current geolocation. This matched the results of the privacy
attitudes where Chinese in the U.S. were more concerned about their relationship status
and network of friends but less concerned about school information and current
geolocation. Mismatches happened where American users were more concerned about
the email address and birthday, however no significant difference in disclosure of these
two types of information was found.
Twitter had a very imbalanced sample - 233 U.S. citizens vs. 76 Chinese users.
WhatsApp had a small sample size for each population - 66 U.S. citizens and 40 Chinese
users. The results may be biased.
On WeChat, Chinese users in China were significantly more willing to disclose
each type of information except for personal photo which no significant difference was
identified. On Weibo, Chinese users in China were also more willing to disclose all types
of information except for personal photo, gender, network of friends, current geolocation
and school information.

78
78
On RenRen, Chinese users in the U.S. were more willing to disclose their real
names and personal photos but less willing to disclose email, phone number, physical
address and relationship status.
4.3 Privacy Attitude and Information Disclosure Behavior
In this section, we want to study: What’s the relationship between privacy attitude
and actual information disclosure behavior? If a person consider “real name” as “very
private”, does that imply he would not disclose such information in social network? Does
privacy attitude guide/imply information disclosure behavior?
With these questions, we performed chi-square analysis to find out the association
between the two variables - Privacy Attitude and Information Disclosure Behavior.
As introduced above, the privacy attitudes were coded as “0” - “public”, “1-
moderate privacy concern” and “2” - “very private”. The information disclosure was
coded as “0” - the specific information was not disclosed and “1”- the information was
disclosed.
We performed the chi-square analysis in all 6 social networks and the results for
each social network are shown as follows:

79
79
Figure 4.36 Privacy Attitude vs Information Disclosure: Facebook N=677
Table 4.36.
Privacy Attitude vs Information Disclosure: Facebook
Types of information Privacy attitudes vs. Actual disclosure behavior Chi-square
(DF=2)
Sig.
Real Name “public” – 258/266 (96.99%)
“moderately private” – 233/265 (84.15%)
“Very private”- 98/146 (67.12%)
68.593 0.000
Email Address “public” –114/142 (80.28%)
“moderately private” – 189/356 (53.09%)
“Very private”- 53/179(29.61%)
81.624 0.000
Phone Number “public” – 13/28 (46.43%)
“moderately private” – 45/154(29.22%)
“Very private”- 51/495 (10.30%)
51.007 0.000

80
80
Table 4.36 (continued).
Privacy Attitude vs Information Disclosure: Facebook
Personal Photo “public” – 237/262(90.46%)
“moderately private” – 229/297(77.10%)
“Very private”- 67/118(56.78%)
55.939 0.000
Physical address “public” – 6/22 (27.27%)
“moderately private” – 29/135(21.48%)
“Very private”- 22/520 (4.23%)
51.846 0.000
Age “public” – 179/204(87.75%)
“moderately private” – 228/324(70.37%)
“Very private”-61/149(40.94%)
88.843 0.000
Birthday “public” – 106/136(77.94%)
“moderately private” – 139/287(48.43%)
“Very private”- 55/254(21.65%)
117.148 0.000
Relationship Status “public” – 218/272(80.15%)
“moderately private” – 162/190(55.86%)
“Very private”- 19/115(16.52%)
137.181 0.000
Gender “public” – 502/538 (93.31%)
“moderately private” – 97/119(81.51%)
“Very private”- 10/20 (50%)
51.420 0.000
Network of Friends “public” – 159/198 (80.30%)
“moderately private” – 209/374(55.88%)
“Very private”- 34/105(32.38%)
69.566 0.000

81
81
Table 4.36 (continued).
Privacy Attitude vs Information Disclosure: Facebook
Figure.4.37 Privacy Attitude vs Information Disclosure: Twitter N=309
Current Geolocation “public” – 119/169 (70.41%)
“moderately private” – 126/289 (43.60%)
“Very private”- 20/219(9.13%)
154.584 0.000
School Information “public” – 254/298(85.23%)
“moderately private” – 192/304(63.16%)
“Very private”- 26/75(34.67%)
83.830 0.000

82
82
Table 4.37.
Privacy Attitude vs Information Disclosure: Twitter
Types of information Privacy attitudes vs. Actual disclosure behavior Chi-square
(DF=2)
Sig.
Real Name “public” – 82/119 (68.91%)
“moderately private” – 38/120 (31.67%)
“very private”- 20/70 (28.57%)
43.670 0.000
Email Address “public” –28/61 (45.90%)
“moderately private” – 52/151 (34.44%)
“very private”- 99/309(32.04%)
12.689 0.002
Phone Number “public” – 0/10 (0.00%)
“moderately private” – 10/65(15.38%)
“very private”- 11/234 (4.70%)
9.920 0.007
Personal Photo “public” – 79/110(71.82%)
“moderately private” – 57/135(42.22%)
“very private”- 17/64(26.56%)
38.249 0.000
Physical address “public” – 3/12 (25.00%)
“moderately private” – 3/53(5.66%)
“very private”- 11/309(3.56%)
18.370 0.000
Age “public” – 54/100(54.00%)
“moderately private” – 52/140(37.14%)
“very private”-15/69(21.74%)
18.272 0.000
Birthday “public” – 29/60(48.33%)
“moderately private” – 17/122(13.93%)
“very private”- 16/127(12.60%)
37.167 0.000

83
83
Table 4.37 (continued).
Privacy Attitude vs Information Disclosure: Twitter
Relationship Status “public” – 62/140(44.29%)
“moderately private” – 31/114(27.19%)
“very private”- 4/55(7.27%)
26.596 0.000
Gender “public” – 190/241 (78.84%)
“moderately private” – 29/54(53.70%)
“very private”- 8/14 (57.14%)
16.299 0.000
Network of Friends “public” – 45/79 (56.96%)
“moderately private” – 66/175 (37.71%)
“very private”- 12/55(21.82%)
17.451 0.000
Current Geolocation “public” – 27/67 (40.30%)
“moderately private” – 37/124 (29.84%)
“very private”- 7/118(5.93%)
34.028 0.000
School Information “public” – 44/125(35.20%)
“moderately private” –24/134(17.91%)
“very private”- 7/50(14.00%)
13.942 0.000

84
84
Figure.4.38 Privacy Attitude vs Information Disclosure: WhatsApp N=106
Table 4.38.
Privacy Attitude vs Information Disclosure: WhatsApp
Types of information Privacy attitudes vs. Actual disclosure behavior Chi-square
(DF=2)
Sig.
Real Name “public” – 31/44 (70.45%)
“moderately private” – 15/41 (36.59%)
“very private”- 12/21 (57.14%)
9.888 0.007
Email Address “public” –9/28 (32.14%)
“moderately private” – 15/49 (30.61%)
“very private”- 10/29(34.48%)
0.125 0.939
Phone Number “public” – 6/7 (85.71%)
“moderately private” – 13/32(40.63%)
“very private”- 26/67 (38.81%)
5.771 0.056

85
85
Table 4.38 (continued).
Privacy Attitude vs Information Disclosure: WhatsApp
Personal Photo “public” – 29/41(70.73%)
“moderately private” – 24/41(58.54%)
“very private”- 11/24(45.83%)
4.018 0.134
Physical address “public” – 1/7 (14.29%)
“moderately private” – 4/26(15.38%)
“very private”- 7/73 (9.59%)
0.707 0.712
Age “public” – 17/29(58.62%)
“moderately private” – 15/49(30.61%)
“very private”-8/28(28.57%)
7.443 0.024
Birthday “public” – 10/22(45.45%)
“moderately private” –9/41(21.95%)
“very private”- 3/43(6.98%)
13.159 0.001
Current Geolocation “public” – 16/34 (47.06%)
“moderately private” –6/43 (13.95%)
“very private”- 1/29(3.45%)
20.074 0.000
School Information “public” – 15/47(31.91%)
“moderately private” – 10/48(20.83%)
“very private”- 4/11(36.36%)
1.968 0.374
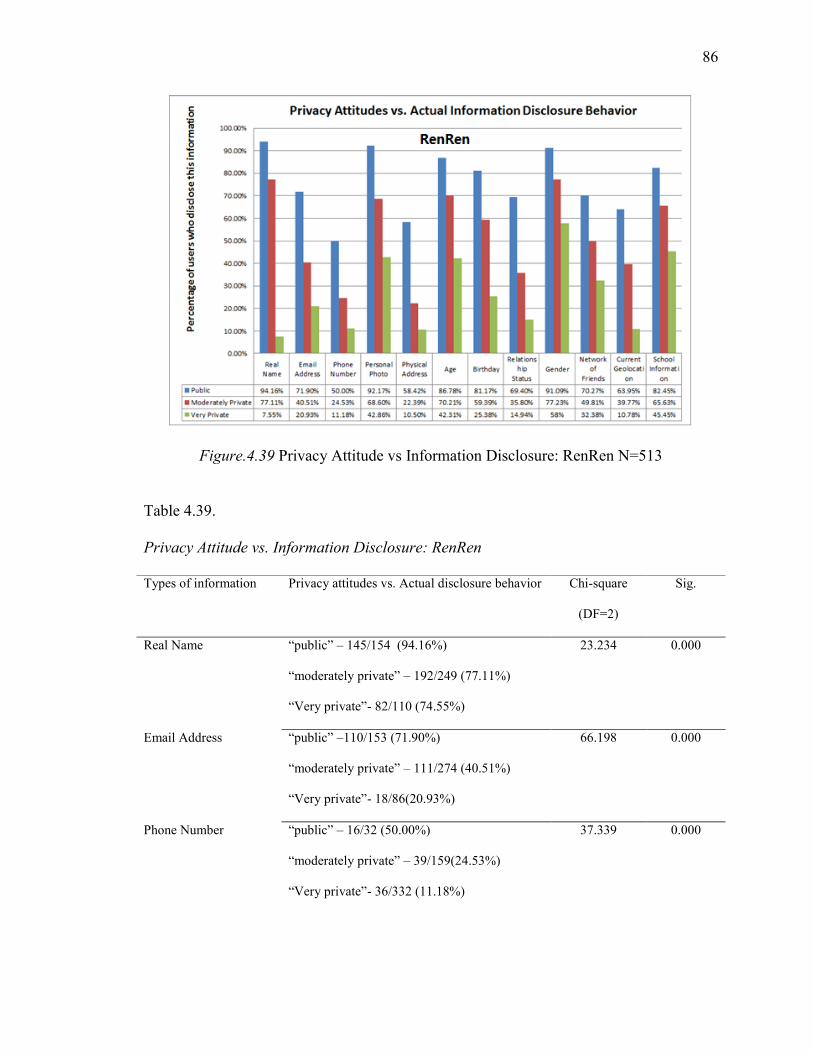
86
86
Figure.4.39 Privacy Attitude vs Information Disclosure: RenRen N=513
Table 4.39.
Privacy Attitude vs. Information Disclosure: RenRen
Types of information Privacy attitudes vs. Actual disclosure behavior Chi-square
(DF=2)
Sig.
Real Name “public” – 145/154 (94.16%)
“moderately private” – 192/249 (77.11%)
“Very private”- 82/110 (74.55%)
23.234 0.000
Email Address “public” –110/153 (71.90%)
“moderately private” – 111/274 (40.51%)
“Very private”- 18/86(20.93%)
66.198 0.000
Phone Number “public” – 16/32 (50.00%)
“moderately private” – 39/159(24.53%)
“Very private”- 36/332 (11.18%)
37.339 0.000

87
87
Table 4.39 (continued).
Privacy Attitude vs. Information Disclosure: RenRen
Personal Photo “public” – 153/166(92.17%)
“moderately private” – 166/242(68.60%)
“Very private”- 45/105(42.86%)
77.126 0.000
Physical address “public” – 10/17 (58.82%)
“moderately private” – 30/134(22.39%)
“Very private”- 38/362 (10.50%)
36.672 0.000
Age “public” – 151/174(86.78%)
“moderately private” – 165/235(70.21%)
“Very private”-44/104(42.31%)
61.516 0.000
Birthday “public” – 125/154(81.17%)
“moderately private” – 136/229(59.39%)
“Very private”- 33/130(25.38%)
90.393 0.000
Relationship Status “public” – 127/183(69.40%)
“moderately private” – 87/243(35.80%)
“Very private”- 13/87(14.94%)
84.238 0.000
Gender “public” – 358/393 (91.09%)
“moderately private” – 78/101(77.23%)
“Very private”- 11/19 (57.89%)
28.829 0.000
Network of Friends “public” – 104/148 (70.27%)
“moderately private” – 130/261(49.81%)
“Very private”- 25/104(32.38%)
52.323 0.000
Current Geolocation “public” – 94/147 (63.95%)
“moderately private” – 105/264 (39.77%)
“Very private”- 11/102(10.78%)
70.689 0.000

88
88
Table 4.39 (continued).
Privacy Attitude vs. Information Disclosure: RenRen
Figure 4.40 Privacy Attitude vs. Information Disclosure: Weibo N=565
School Information “public” – 202/245(82.45%)
“moderately private” – 147/224(65.63%)
“Very private”- 20/44(45.45%)
33.112 0.000

89
89
Table 4.40.
Privacy Attitude vs. Information Disclosure: Weibo
Types of information Privacy attitudes vs. Actual disclosure behavior Chi-square
(DF=2)
Sig.
Real Name “public” – 34/123 (27.64%)
“moderately private” – 47/283 (16.61%)
“Very private”- 31/159 (19.50%)
6.583 0.038
Email Address “public” –97/166 (58.43%)
“moderately private” – 116/297 (39.06%)
“Very private”- 22/102(21.57%)
37.002 0.000
Phone Number “public” – 16/36 (44.44%)
“moderately private” – 31/196(15.82%)
“Very private”- 19/333 (5.71%)
52.230 0.000
Personal Photo “public” –102/157(64.97%)
“moderately private” – 122/289(42.21%)
“Very private”- 33/119(27.73%)
40.408 0.000
Physical address “public” – 6/18 (33.33%)
“moderately private” – 23/170(13.53%)
“Very private”- 30/377 (7.96%)
51.846 0.001
Age “public” – 123/179(68.72%)
“moderately private” – 118/283(41.70%)
“Very private”-21/103(20.39%)
66.384 0.000
Birthday “public” – 104/168(61.90%)
“moderately private” – 61/266(22.93%)
“Very private”- 17/131(12.98%)
100.519 0.000

90
90
Table 4.40 (continued).
Privacy Attitude vs. Information Disclosure: Weibo
Relationship Status “public” – 130/219(59.36%)
“moderately private” – 93/258(36.05%)
“Very private”- 14/88(15.91%)
55.460 0.000
Gender “public” – 341/414 (82.37%)
“moderately private” – 76/122(62.30%)
“Very private”- 15/29 (51.72%)
31.485 0.000
Network of Friends “public” – 69/134 (51.49%)
“moderately private” – 85/296(28.72%)
“Very private”- 27/135(20.00%)
33.779 0.000
Current Geolocation “public” – 89/143 (62.24%)
“moderately private” – 100/297 (33.67%)
“Very private”- 27/125(21.60%)
52.157 0.000
School Information “public” – 117/223(52.47%)
“moderately private” – 93/279(33.33%)
“Very private”- 8/63(12.70%)
39.196 0.000

91
91
Figure.4.41 Privacy Attitude vs. Information Disclosure: WeChat N=699
Table 4.41.
Privacy Attitude vs. Information Disclosure: WeChat
Types of information Privacy attitudes vs. Actual disclosure behavior Chi-square
(DF=2)
Sig.
Real Name “public” – 84/166 (50.60%)
“moderately private” – 166/350(47.43%)
“very private”- 80/183 (43.72%)
1.670 0.434
Email Address “public” –101/197 (51.27%)
“moderately private” – 140/380 (36.84%)
“very private”- 28/122(22.96%)
26.469 0.000
Phone Number “public” – 18/44 (40.91%)
“moderately private” – 92/241(38.17%)
“very private”- 89/414 (21.50%)
24.371 0.000
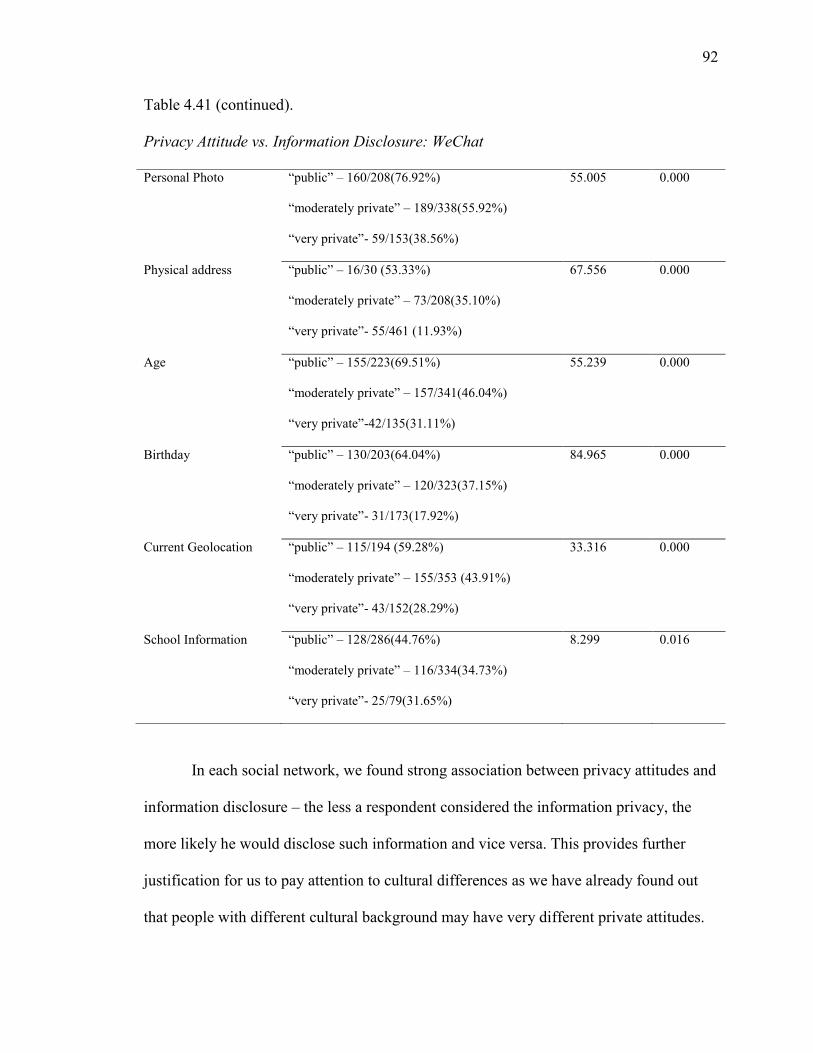
92
92
Table 4.41 (continued).
Privacy Attitude vs. Information Disclosure: WeChat
In each social network, we found strong association between privacy attitudes and
information disclosure – the less a respondent considered the information privacy, the
more likely he would disclose such information and vice versa. This provides further
justification for us to pay attention to cultural differences as we have already found out
that people with different cultural background may have very different private attitudes.
Personal Photo “public” – 160/208(76.92%)
“moderately private” – 189/338(55.92%)
“very private”- 59/153(38.56%)
55.005 0.000
Physical address “public” – 16/30 (53.33%)
“moderately private” – 73/208(35.10%)
“very private”- 55/461 (11.93%)
67.556 0.000
Age “public” – 155/223(69.51%)
“moderately private” – 157/341(46.04%)
“very private”-42/135(31.11%)
55.239 0.000
Birthday “public” – 130/203(64.04%)
“moderately private” – 120/323(37.15%)
“very private”- 31/173(17.92%)
84.965 0.000
Current Geolocation “public” – 115/194 (59.28%)
“moderately private” – 155/353 (43.91%)
“very private”- 43/152(28.29%)
33.316 0.000
School Information “public” – 128/286(44.76%)
“moderately private” – 116/334(34.73%)
“very private”- 25/79(31.65%)
8.299 0.016

93
93
However, we did not see such strong association in several types of information
on WhatsApp. One major reason may be we only had a small sample of 106 WhatsApp
users.
4.4 Relationships among Privacy Perceptions and Behaviors
In this chapter, correlation analyses are used to find out whether there were strong
relations among: 1) privacy policy, 2) trust in the social network, 3) privacy setting 4)
profile preference and 5) constituent of friend lists. We performed the same correlation
analyses for each social network and we also break down the users into different groups
( , , ). The results are shown in the following matrix. In each cell, the correlation
coefficients - Pearson’s r and Spearman’s rho were recorded.
Table 4.42.
Correlation Matrix for All Facebook Users
Privacy setting Privacy policy Profile
preference
Friend list Trust
Privacy policy r= 0.298
rho= 0.290
- - - -
Profile preference r= 0.210
rho= 0.218
r= 0.174
rho= 0.186
- - -
Friend list r= 0.004
rho= -0.002
r= -0.026
rho= 0.032
r= 0.022
rho= 0.017
- -
Trust r= -0.080
rho= -0.084
r= -0.150
rho= -0.148
r= -0.244
rho= -0.245
r= 0.032
rho= 0.016
-
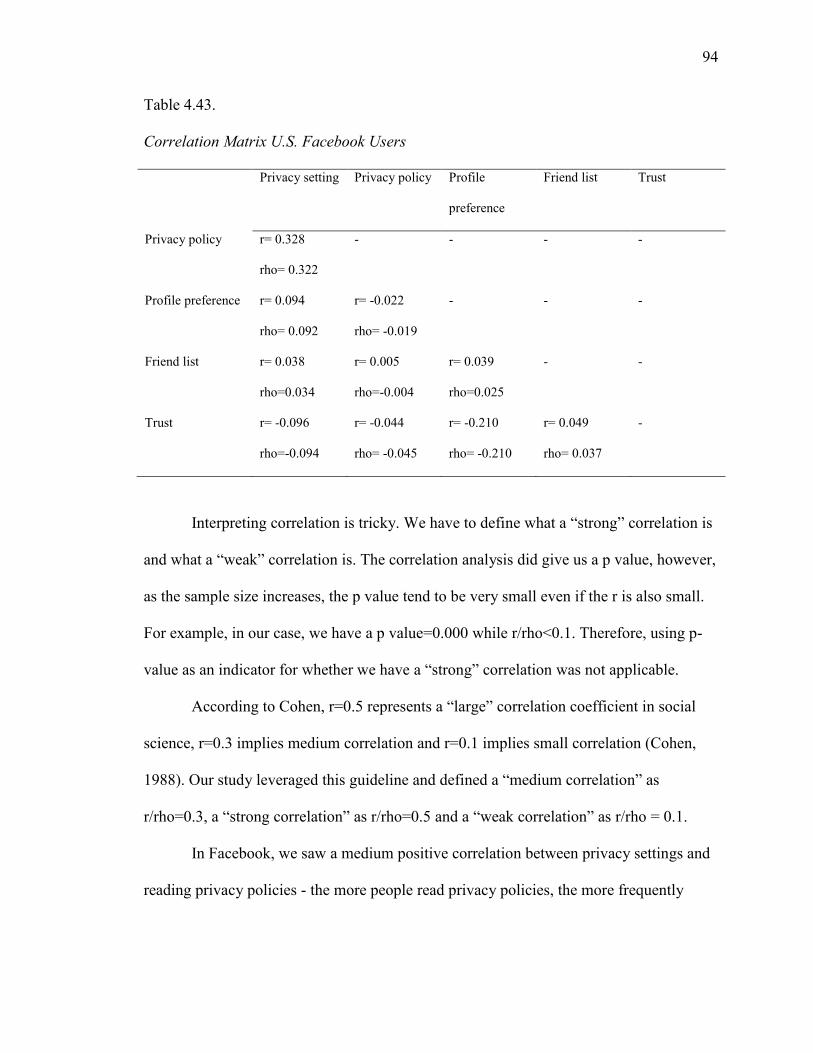
94
94
Table 4.43.
Correlation Matrix U.S. Facebook Users
Privacy setting Privacy policy Profile
preference
Friend list Trust
Privacy policy r= 0.328
rho= 0.322
- - - -
Profile preference r= 0.094
rho= 0.092
r= -0.022
rho= -0.019
- - -
Friend list r= 0.038
rho=0.034
r= 0.005
rho=-0.004
r= 0.039
rho=0.025
- -
Trust r= -0.096
rho=-0.094
r= -0.044
rho= -0.045
r= -0.210
rho= -0.210
r= 0.049
rho= 0.037
-
Interpreting correlation is tricky. We have to define what a “strong” correlation is
and what a “weak” correlation is. The correlation analysis did give us a p value, however,
as the sample size increases, the p value tend to be very small even if the r is also small.
For example, in our case, we have a p value=0.000 while r/rho<0.1. Therefore, using p-
value as an indicator for whether we have a “strong” correlation was not applicable.
According to Cohen, r=0.5 represents a “large” correlation coefficient in social
science, r=0.3 implies medium correlation and r=0.1 implies small correlation (Cohen,
1988). Our study leveraged this guideline and defined a “medium correlation” as
r/rho=0.3, a “strong correlation” as r/rho=0.5 and a “weak correlation” as r/rho = 0.1.
In Facebook, we saw a medium positive correlation between privacy settings and
reading privacy policies - the more people read privacy policies, the more frequently

95
95
he/she would change their privacy settings. However, such correlation was not consistent
across different groups. The correlation was identified “weak” among U.S. Facebook
users and not as significant among Chinese users.
Table 4.44.
Correlation Matrix All Twitter Users
Privacy
setting
Privacy policy Profile
preference
Friend list Trust
Privacy policy r= 0.430
rho= 0.423
- - - -
Profile preference r= 0.131
rho= 0.149
r= 0.139
rho= 0.139
- - -
Friend list r= 0.189
rho= 0.185
r= 0.199
rho= 0.194
r= 0.119
rho= 0.112
- -
Trust r= -0.081
rho= -0.072
r= -0.115
rho= -0.106
r= -0.245
rho= -0.242
r= 0.006
rho= 0.024
-
Table 4.45.
Correlation Matrix U.S. Twitter Users
Privacy setting Privacy policy Profile
preference
Friend list Trust
Privacy policy r= 0.454
rho= 0.453
- - - -
Profile preference r= 0.112
rho= 0.134
r= 0.159
rho= 0.167
- - -

96
96
Table 4.45 (continued).
Correlation Matrix U.S. Twitter Users
Friend list r= 0.209
rho= 0.201
r= 0.183
rho= 0.185
r= 0.131
rho= 0.130
- -
Trust r= -0.112
rho= -0.108
r= -0.132
rho= -0.126
r= -0.193
rho= -0.191
r= 0.023
rho= 0.032
-
Table 4.46.
Correlation Matrix Chinese Twitter Users in the U.S.
Privacy setting Privacy policy Profile
preference
Friend list Trust
Privacy policy r= 0.245
rho= 0.205
- - - -
Profile preference r= 0.226
rho= 0.215
r= 0.194
rho= 0.130
- - -
Friend list r= 0.111
rho= 0.131
r= 0.235
rho= 0.156
r= 0.098
rho= 0.081
- -
Trust r= -0.029
rho= 0.004
r= -0.184
rho= -0.155
r= -0.388
rho= -0.386
r= -0.052
rho= -0.011
-
In Twitter, again we saw a medium positive correlation between privacy settings
and reading privacy policies - the more people read privacy policies, the more frequently
he/she would change their privacy settings. We also identified a medium negative
correlation between Trust and Profile preference – the less users trust, the more they’d
like to use private profiles, which is intuitively true.
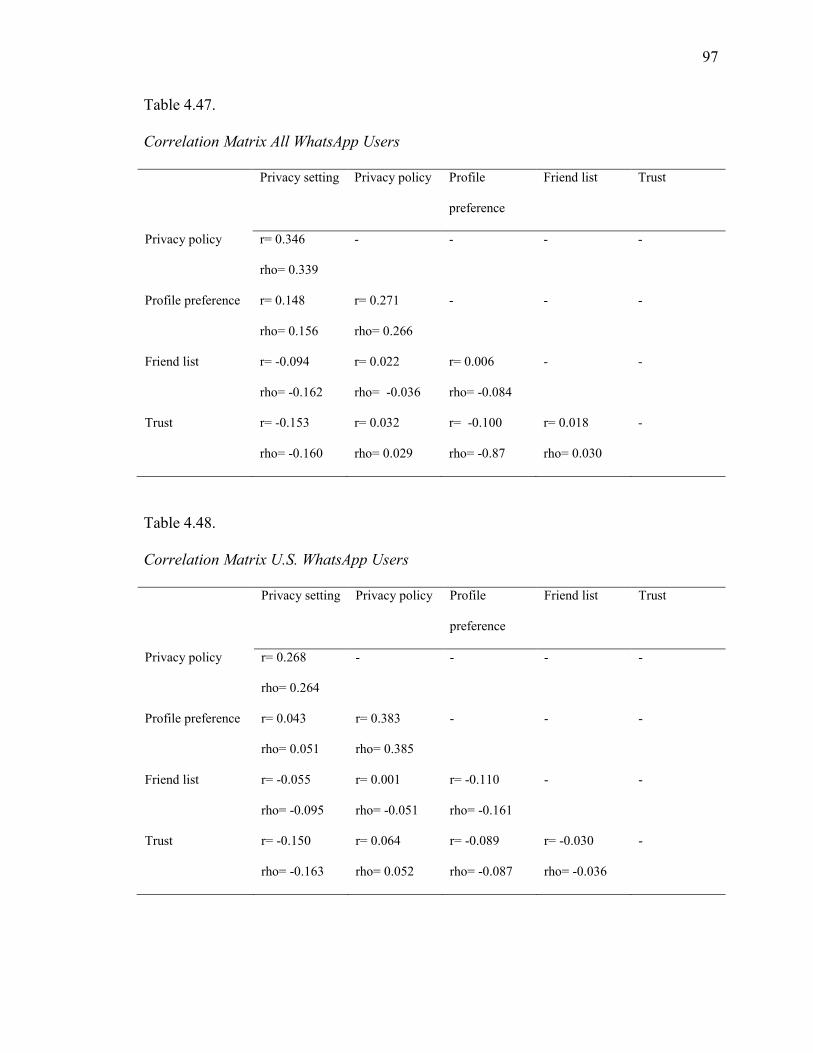
97
97
Table 4.47.
Correlation Matrix All WhatsApp Users
Privacy setting Privacy policy Profile
preference
Friend list Trust
Privacy policy r= 0.346
rho= 0.339
- - - -
Profile preference r= 0.148
rho= 0.156
r= 0.271
rho= 0.266
- - -
Friend list r= -0.094
rho= -0.162
r= 0.022
rho= -0.036
r= 0.006
rho= -0.084
- -
Trust r= -0.153
rho= -0.160
r= 0.032
rho= 0.029
r= -0.100
rho= -0.87
r= 0.018
rho= 0.030
-
Table 4.48.
Correlation Matrix U.S. WhatsApp Users
Privacy setting Privacy policy Profile
preference
Friend list Trust
Privacy policy r= 0.268
rho= 0.264
- - - -
Profile preference r= 0.043
rho= 0.051
r= 0.383
rho= 0.385
- - -
Friend list r= -0.055
rho= -0.095
r= 0.001
rho= -0.051
r= -0.110
rho= -0.161
- -
Trust r= -0.150
rho= -0.163
r= 0.064
rho= 0.052
r= -0.089
rho= -0.087
r= -0.030
rho= -0.036
-

98
98
Table 4.49.
Correlation Matrix Chinese WhatsApp Users in the U.S.
Privacy setting Privacy policy Profile
preference
Friend list Trust
Privacy policy r= 0.245
rho= 0.095
- - - -
Profile preference r= 0.311
rho= 0.260
r= 0.059
rho= -0.021
- - -
Friend list r= -0.204
rho= -0.354
r= 0.010
rho= -0.063
r= 0.197
rho= 0.041
- -
Trust r= -0.157
rho= -0.134
r= 0.000
rho= 0.066
r= -0.121
rho= -0.088
r= 0.124
rho= 0.207
-
In WhatsApp, we gain saw a medium positive correlation between privacy
settings and reading privacy policies. For American users, we also identified a medium
negative correlation between privacy policy and profile preference – the more they read
privacy policy, the more likely they would use a private profile. For Chinese users, a
positive correlation between privacy setting and profile preference was identified – the
more frequently they change your privacy setting, the more possible that they would use
a private profile.

99
99
Table 4.50.
Correlation Matrix All RenRen Users
Privacy setting Privacy policy Profile
preference
Friend list Trust
Privacy policy r= 0.240
rho= 0.213
- - - -
Profile preference r= 0.184
rho= 0.189
r= 0.087
rho= 0.092
- - -
Friend list r= -0.090
rho= -0.098
r= -0.102
rho= -0.103
r= -0.006
rho= -0.001
- -
Trust r= -0.015
rho= -0.003
r= -0.089
rho= 0.092
r= 0.007
rho= 0.013
r= 0.011
rho= 0.002
-
Table 4.51.
Correlation Matrix Chinese RenRen Users in the U.S.
Privacy setting Privacy policy Profile
preference
Friend list Trust
Privacy policy r= 0.070
rho= 0.054
- - - -
Profile preference r= 0.181
rho= 0.192
r= 0.131
rho= 0.144
- - -
Friend list r= -0.129
rho= -0.125
r= -0.116
rho= -0.080
r= -0.040
rho= -0.023
- -
Trust r= 0.025
rho= 0.035
r= -0.064
rho= -0.070
r= -0.022
rho= -0.013
r= -0.040
rho= -0.030
-
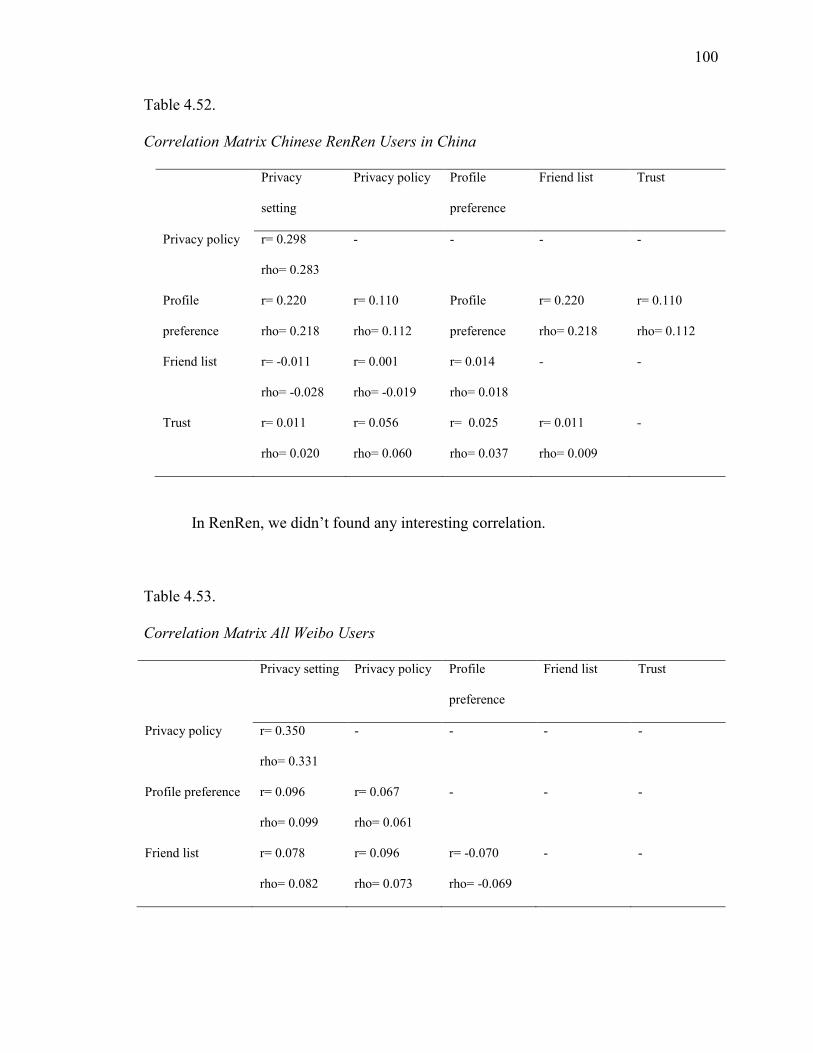
100
100
Table 4.52.
Correlation Matrix Chinese RenRen Users in China
Privacy
setting
Privacy policy Profile
preference
Friend list Trust
Privacy policy r= 0.298
rho= 0.283
- - - -
Profile
preference
r= 0.220
rho= 0.218
r= 0.110
rho= 0.112
Profile
preference
r= 0.220
rho= 0.218
r= 0.110
rho= 0.112
Friend list r= -0.011
rho= -0.028
r= 0.001
rho= -0.019
r= 0.014
rho= 0.018
- -
Trust r= 0.011
rho= 0.020
r= 0.056
rho= 0.060
r= 0.025
rho= 0.037
r= 0.011
rho= 0.009
-
In RenRen, we didn’t found any interesting correlation.
Table 4.53.
Correlation Matrix All Weibo Users
Privacy setting Privacy policy Profile
preference
Friend list Trust
Privacy policy r= 0.350
rho= 0.331
- - - -
Profile preference r= 0.096
rho= 0.099
r= 0.067
rho= 0.061
- - -
Friend list r= 0.078
rho= 0.082
r= 0.096
rho= 0.073
r= -0.070
rho= -0.069
- -

101
101
Table 4.53 (continued).
Correlation Matrix All Weibo Users
Trust r= -0.014
rho= -0.020
r= -0.111
rho= -0.117
r= -0.023
rho= -0.037
r= -0.055
rho= -0.050
-
Table 4.54.
Correlation Matrix Chinese Weibo Users in the U.S.
Privacy setting Privacy policy Profile
preference
Friend list Trust
Privacy policy r= 0.142
rho= 0.136
- - - -
Profile preference r= 0.117
rho= 0.132
r= 0.020
rho= 0.017
- - -
Friend list r= 0.069
rho= 0.079
r= 0.193
rho= 0.210
r= 0.024
rho= 0.026
- -
Trust r= -0.019
rho= -0.044
r= -0.016
rho= -0.031
r= -0.074
rho= -0.088
r= -0.157
rho= -0.163
-
Table 4.55.
Correlation Matrix Chinese Weibo Users in China
Privacy setting Privacy policy Profile
preference
Friend list Trust
Privacy policy r= 0.405
rho= 0.397
- - - -

102
102
Table 4.55 (continued).
Correlation Matrix Chinese Weibo Users in China
Profile preference r= 0.035
rho= 0.036
r= -0.001
rho= -0.009
- - -
Friend list r= 0.170
rho= 0.179
r= 0.237
rho= 0.209
r= -0.106
rho= -0.077
- -
Trust r= 0.053
rho= 0.056
r= -0.051
rho= -0.045
r= 0.070
rho= 0.063
r= -0.056
rho= -0.066
-
In Weibo, we found out a medium positive correlation between privacy settings
and reading privacy policies considering all the users. Such correlation was much more
significant among Chinese users in China (rho=0.397) than those in the U.S. (rho=0.136)
Table 4.56.
Correlation Matrix All WeChat Users
Privacy setting Privacy policy Profile
preference
Friend list Trust
Privacy policy r= 0.296
rho= 0.287
- - - -
Profile preference r= 0.113
rho= 0.112
r= 0.0206
rho= 0.019
- - -
Friend list r= -0.002
rho= 0.009
r= -0.029
rho= -0.039
r= 0.020
rho= -0.008
- -
Trust r= -0.047
rho= -0.042
r= -0.045
rho= -0.056
r= 0.076
rho= 0.081
r= 0.067
rho= 0.042
-

103
103
Table 4.57.
Correlation Matrix Chinese WeChat Users in the U.S.
Privacy setting Privacy policy Profile
preference
Friend list Trust
Privacy policy r= 0.092
rho= 0.089
- - - -
Profile preference r= 0.247
rho= 0.258
r= 0.099
rho= 0.116
- - -
Friend list r= -0.040
rho= -0.039
r=0.045
rho= 0.054
r= 0.053
rho= 0.036
- -
Trust r= -0.027
rho= -0.022
r= 0.067
rho= 0.058
r= 0.020
rho= 0.036
r= 0.018
rho= 0.006
-
Table 4.58.
Correlation Matrix Chinese WeChat Users in China
Privacy setting Privacy policy Profile
preference
Friend list Trust
Privacy policy r= 0.345
rho= 0.342
- - - -
Profile preference r= -0.031
rho= -0.032
r= -0.079
rho= -0.091
- - -
Friend list r= 0.073
rho= 0.093
r= 0.071
rho= 0.061
r= 0.024
rho= -0.001
- -
Trust r= -0.035
rho= -0.026
r= 0.042
rho= 0.077
r= 0.034
rho= 0.033
r= 0.076
rho= 0.059
-

104
104
In WeChat, we identified a medium positive correlation between privacy settings
and reading privacy policies among Chinese users in China, while Chinese users in the
U.S. did not have as strong a correlation.
4.5 Summary
This chapter introduces detailed data analysis procedures and results. The findings
and future work are discussed in the next chapter.

105
105
CHAPTER 5. DISCUSSION OF RESULTS
This study tries to answer the following research questions
1. What are users’ privacy attitudes when they use the social networks? (e.g.
what information do they consider private and what is not?) Are they different?
2. Does cultural background have a significant impact on social network users’
privacy perceptions and behaviors?
3. What’s the relationship among a user’s privacy attitude, perception, and a
user’s behavior in a specific site?
With these questions in mind, the thesis targeted at three different populations –
U.S. citizens, Chinese students in the U.S. and Chinese students in China in order to find
out the impact of cultural background. Six different social networks were then selected in
order to get a broader view of how people perceive and behave in different social
networks.
A survey was carefully designed and a dataset of 1,234 responses with more than
400 for each population were collected. Statistical analyses such as ANOVA tests, chi-
square tests, correlation/association analysis, etc. were applied to explore the
relationships among variables and compared the differences between groups in Chapter 4.

106
106
5.1 Modeling Privacy Attitude, Perception and Behavior
To understand user behavior and perception in social networks, the study
introduced and focused on four categories of variables:
Privacy attitude variable – General privacy attitude
Perception variable – Trust
Behavior variables – Profile preference, privacy setting, constituent of friend list
and privacy policies, information disclosure behavior
Grouping variables- cultural context and site were used to divide users into
subgroups based on citizenship and sites.
To capture the relationships among these variables, a cube model was developed,
as shown in the following figure.
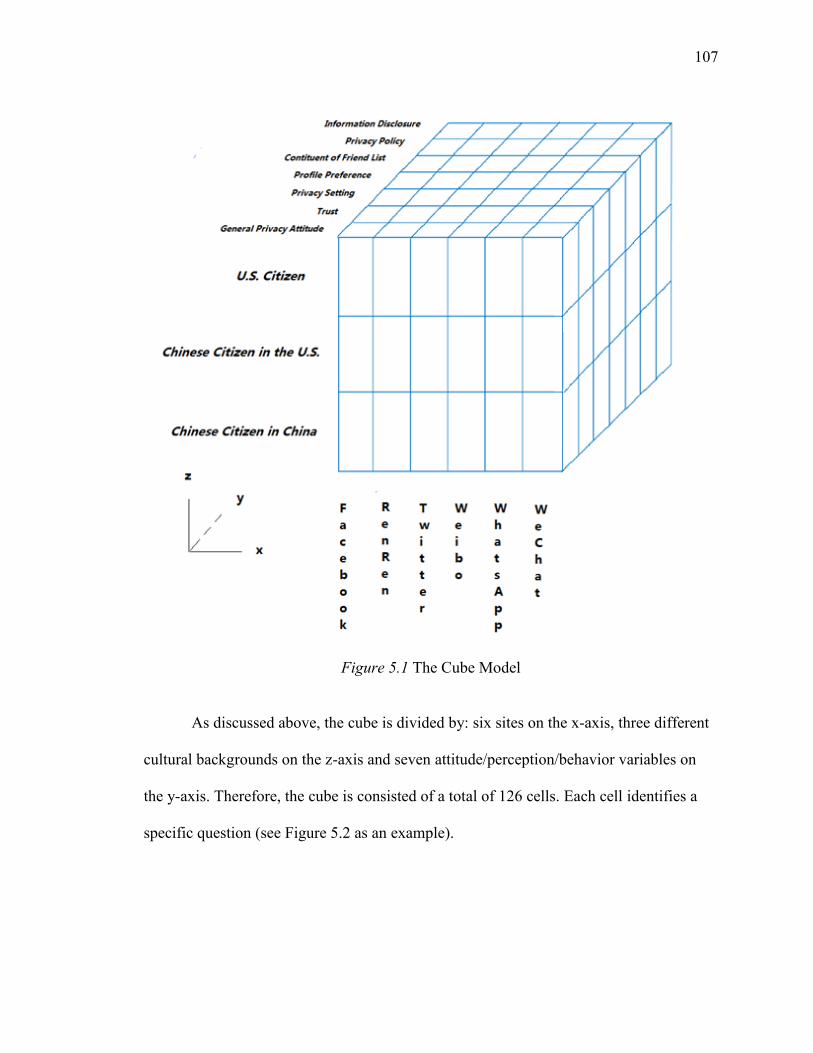
107
107
Figure 5.1 The Cube Model
As discussed above, the cube is divided by: six sites on the x-axis, three different
cultural backgrounds on the z-axis and seven attitude/perception/behavior variables on
the y-axis. Therefore, the cube is consisted of a total of 126 cells. Each cell identifies a
specific question (see Figure 5.2 as an example).
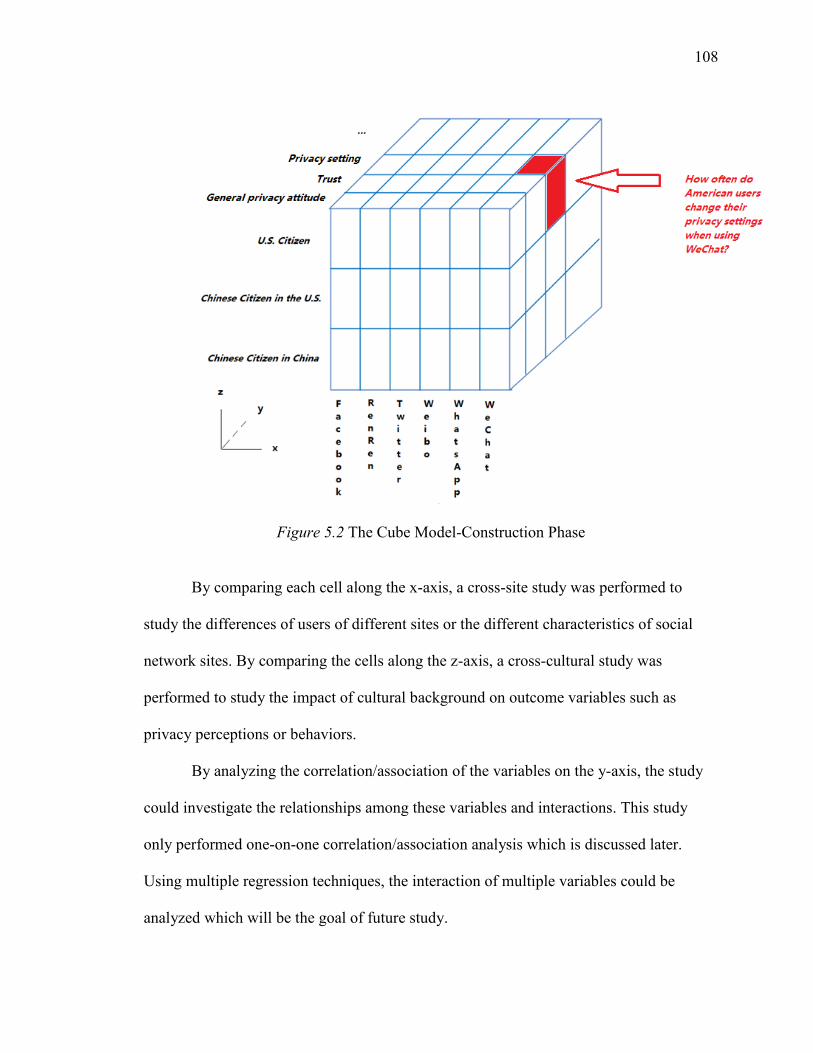
108
108
Figure 5.2 The Cube Model-Construction Phase
By comparing each cell along the x-axis, a cross-site study was performed to
study the differences of users of different sites or the different characteristics of social
network sites. By comparing the cells along the z-axis, a cross-cultural study was
performed to study the impact of cultural background on outcome variables such as
privacy perceptions or behaviors.
By analyzing the correlation/association of the variables on the y-axis, the study
could investigate the relationships among these variables and interactions. This study
only performed one-on-one correlation/association analysis which is discussed later.
Using multiple regression techniques, the interaction of multiple variables could be
analyzed which will be the goal of future study.
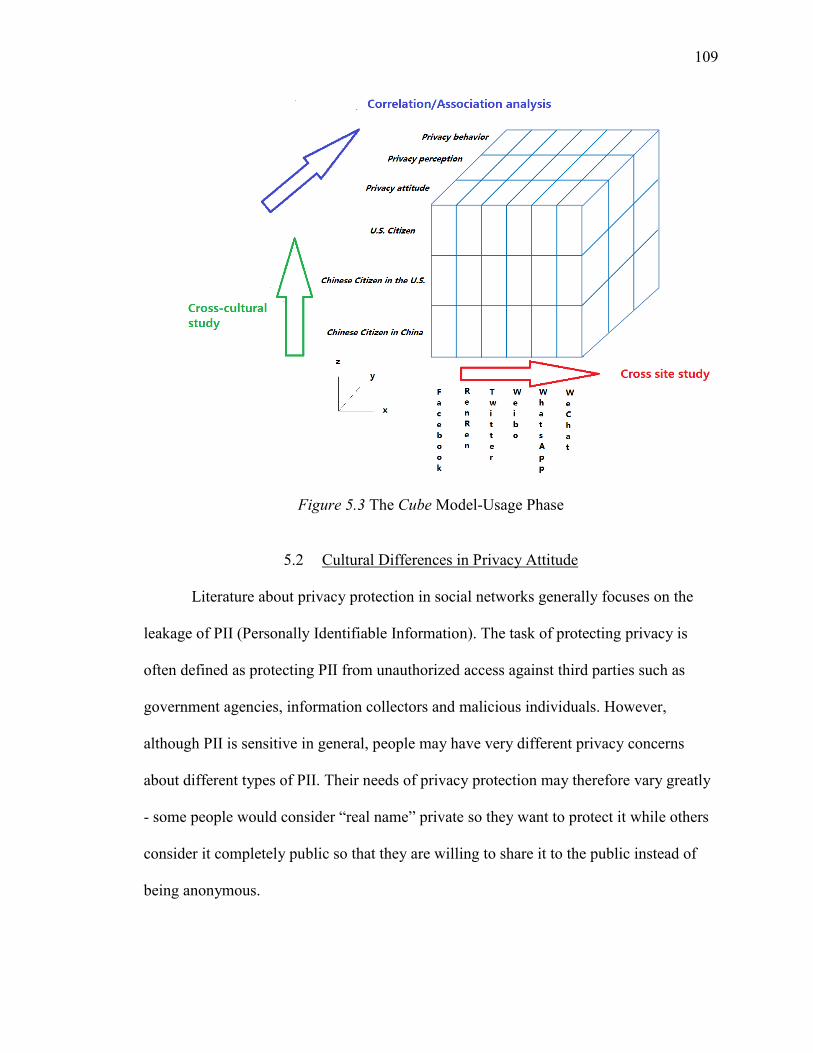
109
109
Figure 5.3 The Cube Model-Usage Phase
5.2 Cultural Differences in Privacy Attitude
Literature about privacy protection in social networks generally focuses on the
leakage of PII (Personally Identifiable Information). The task of protecting privacy is
often defined as protecting PII from unauthorized access against third parties such as
government agencies, information collectors and malicious individuals. However,
although PII is sensitive in general, people may have very different privacy concerns
about different types of PII. Their needs of privacy protection may therefore vary greatly
- some people would consider “real name” private so they want to protect it while others
consider it completely public so that they are willing to share it to the public instead of
being anonymous.
110
110
Considering people’s different privacy attitudes would help acquire a better
understanding of people’s privacy needs and help fine-tune social network users’ privacy
protection. The study considers different cultural groups to honor the fact that social
networks are often consisted of people in different cultures. Facebook as an example has
only 22.6% U.S. users (Facebook Demographics & Statistics, 2014) while a vast majority
of Facebook users come from various cultural settings. Understanding the cultural
differences in privacy attitudes also helps social network platforms assess and preserve
privacy in a fine-tuned manner.
The first research question therefore focuses on the users’ privacy attitudes when
using online social networks. The independent variable was cultural context. To be
specific, it tries to identify whether people of different cultural background have different
privacy attitudes toward different types of information, i.e. which information is
considered more private and which is considered less.
The result of the study suggested that people did have different privacy attitudes
toward different types of information. For example, in general people are mostly
concerned about their identification number, phone number and physical address while
gender and nickname/login name raise the least privacy concern. But if we take a closer
look, we could see that people with different cultural background have different priorities
toward the privacy concerns of information. The following table illustrates how people
rank their privacy concerns toward different types of information:

111
111
Table 5.1.
Rankings of Privacy for Different Types of Information
Privacy Rankings
U.S. Citizen Chinese in the U.S. Chinese in China
SSN/Other identification number 1 1 1
Address 2 2 2
Phone number 3 3 3
Current geolocation 4 8 7
Birthday 5 4 10
Email 6 5 12
Hometown 7 12 8
Network of friends 8 9 5
Real name 9 10 4
Age 10 6 11
School information 11 13 9
Personal photo 12 11 6
Nickname/Login name 13 14 14
Relationship status 14 7 13
Gender 15 15 15
It is clear that the top three items for each population are the same in terms of
privacy concern. However, other types (marked in red) apparently do not follow the same
pattern across cultural groups. “Real name” for example, ranks 4 for Chinese in China but
only ranks 9 and 10 for the other two populations. Also Chinese in China seem to be less
concerned about email and birthday address (ranks 12 and 10 respectively) as the other
two (ranks around 5). The Chinese users in the U.S. are much more concerned about

112
112
“relationship status” as compared with the other two, while the American users seem to
be more concerned about “current geolocation”.
Detailed ANOVA tests and post hoc tests were conducted and the results
suggested that there exist differences between at least two groups of users in their privacy
attitudes for all types of information. Yet such differences were not consistent for all
information. For some types of information, American users would consider them more
private than their Chinese counterparts, such as geolocation, email, birthday and login
name. While for other information such as gender, American users would consider it
more public.
Interestingly, the comparison between Chinese in the U.S. and Chinese in China
suggested that in 14 out of 16 types of information, there exist significant differences in
privacy attitudes between these two groups. For some types of information, such as real
name, phone number, personal photo, physical address and identification number, the
privacy attitudes of Chinese students in the U.S. are becoming similar to the U.S. citizens
while significantly different from those in China. However, for other types of information
such as login name and geolocation, Chinese users in both the U.S. and China do not
seem to differ significantly.
The results suggested that a shift in the cultural environment may significantly
change how people perceive privacy even they were born and raised in the same cultural
environment.
Privacy is a social construct. Therefore, privacy attitude with regard to different
types of information appears to vary more by social setting than cultural heritage.

113
113
The thesis then studied the correlation among general privacy attitude, behavior
and perception. The first effort was to study the relationship between information
disclosure and privacy attitude.
In fact, information disclosure behavior is where privacy breach potentially
happens therefore has been the center of discussion of social network privacy in
literatures (Tufekci 2008; Krishnamurthy 2009; Schrammel et al. 2009; Irani et al. 2011).
However, the relationship between perceptions and information disclosure has remained
an open problem (Zheleva et al. 2012) and the reason why social network users willingly
disclose their private information have not been sufficiently investigated (Faisal &
Alsumait 2011).
Surprisingly, one important factor has rarely been discussed is the general privacy
attitude. It seems intuitive that people would be more willing to disclosure their
information that she considers less private while more reluctant to share private
information. However, as the previous literatures suggested, the information disclosure
behavior was potentially affected by gender or the type of the social network (Schrammel
et al. 2009). Studies also suggested that although people claimed that they concerned
about privacy, their behaviors did not match. Whether there’s strong association between
privacy attitude and information disclosure behavior therefore, is one key issue for this
thesis to explore.
To test the hypothesis that users tend to disclosure the information which they
considers less private while refrain to disclose private information, respondents were
asked to rate their privacy attitude toward each type of information and whether they

114
114
disclosed such information or not. A series of chi-square tests were then performed for
each social network site.
The results suggested a strong positive association between privacy attitude and
information disclosure behavior in also every social networks, except for WhatsApp
which had a very small sample. The results show that the more private concern about a
specific type of information, the less likely to disclose it. For example, the following
figure illustrates the association on Facebook. It is very obvious that people who rated a
type of information as “public” would be much more likely to disclose such information
that those who considered it as “moderately private” or “very private”.
Figure 5.4 Privacy Attitudes vs. Actual Information Disclosure – Facebook
Such association between general privacy attitude and information disclosure
behavior was robust as it was identified across multiple social network platforms – even
when these sites were designed for different usages and they were targeted at different

115
115
user groups. With such an association between attitude and disclosure, it would be
justifiable to investigate if changing people’s privacy attitudes, through education,
cultural influence, etc. would affect people’s actual information disclosure behavior. If a
person becomes more aware about the privacy of SSN or geolocation for example, it may
be possible that she will less likely disclose such information in social networks thus
reducing the probability of unexpected leakage of such information.
5.3 Cultural Differences in Privacy Perceptions and Behaviors
The second research question explores the cultural differences in privacy
perceptions and behaviors. This thesis specifically studied whether there exist significant
differences in social network users’: 1) general privacy attitude; 2) frequency of changing
privacy settings; 3) extent of reading privacy policies; 4) extent to which they trust the
social network; 5) percentage of real-world friends in the friend list 6) profile preferences
and 7) information disclosure behavior.
For each of the seven variables, an index was created to rate how “well” a user
perceives privacy or behave in accordance with high privacy awareness. These indexes
were calculated by averaging the users’ survey responses across sites and mapped to a 0-
10 scale. Three scores were then created to integrate these indexes to rate user privacy
awareness in three dimensions: attitude, perception and behavior. These scores and
indexes are listed as follows:
General Attitude Index ( ) is a 0 to 10 score that rates the average concern
towards 16 selected personally identifiable information. A score of 10 indicates that the
user rated every type of information as “very private” while a score of 0 indicates that the
116
116
user rated each type of information as “public” Therefore, a high score means that a user
was more concerned about the privacy of personally identifiable information.
Trust Index ( ) is a 0 to 10 score that rates the extent to which that a user
suspected social networking sites. A score of 0 indicates that the user completely trusted
each of the social networks while a score of 10 means that the user did not trust social
network sites at all.
Privacy Setting Index ( ) is a 0 to 10 score that rates how often a user
changed their privacy settings. A score of 10 indicates that the user frequently changed
privacy settings in all sites while a score of 0 indicates that the user never changed
privacy settings in any of the sites.
Privacy Policy Index ( ) is a 0 to 10 score that rates how well a user read
privacy policies. A score of 10 indicates that the user has read privacy policies in all sites
while a score of 0 indicates that the user never read privacy policies in any of the sites.
Profile Preference Index ( ) is a 0 to 10 score that measures how many
profiles of a user are private profiles. A score of 10 indicates that the user used private
profiles in all sites while a score of 0 indicates that the user used public profiles in each of
the sites.
Friend List Index ( is a 0 to 10 score that measures how many people of a
user‘s friend list are actual friends that she knows in real life. The higher the score is, the
more proportion of the friend list was real world friends.
Information Disclosure Index ( ) is a 0 to 10 score that measures how
much information that a user discloses on an average social networking site. A score of 7

117
117
for example indicates that a user on average disclosed 70% of personal information on
each site.
Privacy Attitude Score ( ) is a 0 to 10 score that measures user’s attitude
toward the privacy of personally identifiable information. In this study, =
.
Privacy Perception Score ( ) is a 0 to 10 score that measure how much a user
perceive privacy risks in social networks. In this study, we only have “trust” as perception
variable. Therefore, .
Privacy Behavior Score ( ) is a 0 to 10 score that measures to what extent a
user’s behavior reflects high privacy awareness. A weighted summation was used to calculate the
score:
=
To study the impact of cultural background, the indices and scores of U.S. citizens,
Chinese citizens in China and Chinese citizens in the U.S. were calculated respectively.
The results are listed in the following tables.
Table 5.2.
Privacy Indexes for Different Cultures
Average 5.02 4.45 4.33 2.80 5.92 5.77 8.20
U.S. Citizen 5.42 5.26 4.47 3.99 6.16 5.75 8.67
Chinese in the U.S. 4.74 5.79 3.72 1.03 5.30 6.35 7.81
Chinese in China 4.90 2.18 4.83 3.47 6.33 5.17 8.14
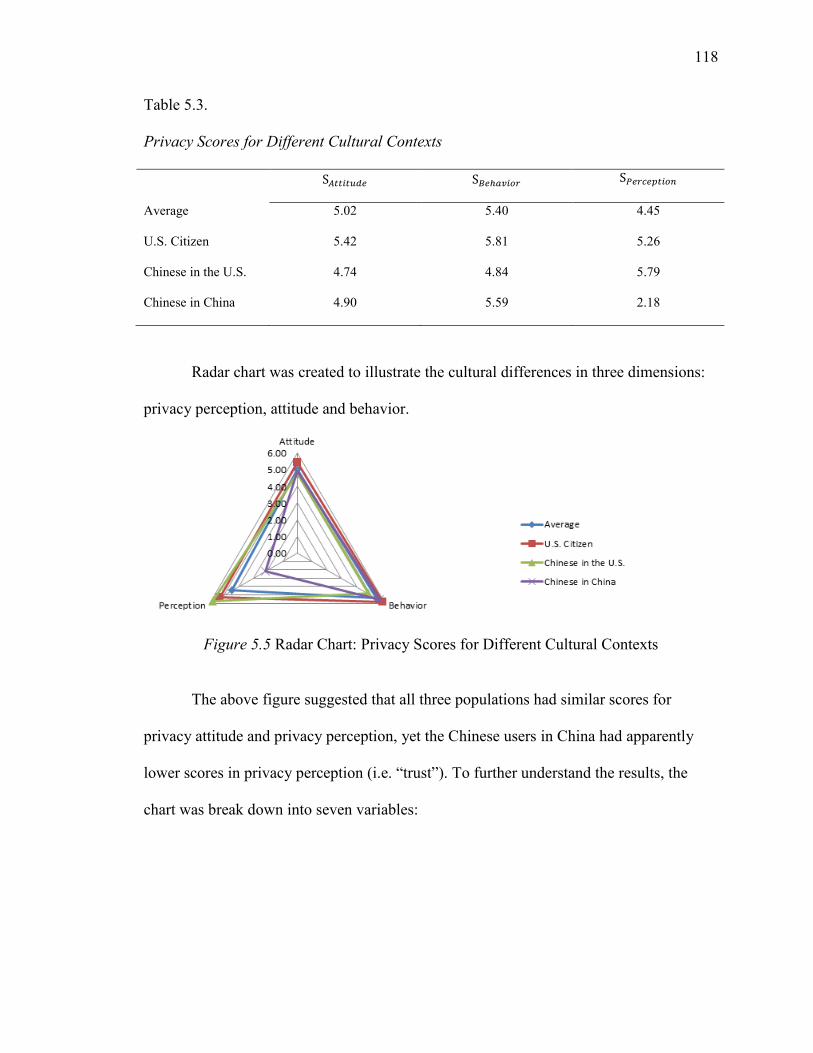
118
118
Table 5.3.
Privacy Scores for Different Cultural Contexts
Average 5.02 5.40 4.45
U.S. Citizen 5.42 5.81 5.26
Chinese in the U.S. 4.74 4.84 5.79
Chinese in China 4.90 5.59 2.18
Radar chart was created to illustrate the cultural differences in three dimensions:
privacy perception, attitude and behavior.
Figure 5.5 Radar Chart: Privacy Scores for Different Cultural Contexts
The above figure suggested that all three populations had similar scores for
privacy attitude and privacy perception, yet the Chinese users in China had apparently
lower scores in privacy perception (i.e. “trust”). To further understand the results, the
chart was break down into seven variables:

119
119
Figure 5.6 Radar Chart: Privacy Indexes for Different Cultural Contexts
The chart clearly shows that Chinese users in China were more willing to trust
social networking sites according to their responses. It also suggests that Chinese in the
U.S. were much more reluctant in reading privacy policies. The result also shows that
Chinese in the China were more likely to use a private profile while those in the U.S.
preferred a private one.
Although Chinese users in China have a high score in information disclosure of
7.81, which indicates that they disclosed about 21.9% personal information on an average
site; the U.S. citizens only disclosed about 13.3%. The Chinese users in the U.S.
disclosed 18.6% which was still much worse than their American counterparts. Also
interestingly, Chinese in the U.S. had more real life friends in their online friend lists than
Chinese in China according to their responses.
The above findings suggested that cultural differences capture the differences in
some of the privacy variables well while failing to capture the differences in others.

120
120
The study may be the first effort that tries to explore the impacts of cultural
background on these privacy perception and behavior variables. Previous works have
been focusing on other factors such as gender, computer expertise, personality traits, etc.
For example, Tufekci (2008) found out that gender, general privacy concern and future
audience play an important role in information disclosure behavior while Shrammel et al.
(2009) found out that profession –student/employed also affect information disclosure
behavior. Mohamed (2011) found out that how long a user uses a social network and
privacy protection behaviors have influences on users’ trust.
Therefore, it won’t be surprised that cultural background do not play significant
roles on some of these variables as there are so many other factors out there that may also
affect these perceptions/behaviors. One important factor that hasn’t been tested in this
study is the usage of the social networks. Each social network has different functionalities
and specific design in nature and people use social networks for different purposes.
Weibo and Twitter, for example are widely used as platforms for learning/broadcasting
news and events, so people usually keep a public profile and they usually “follow” a lot
of strangers or celebrities in order to get more interested news and events. WeChat for
example, is mainly used for private messaging so that people usually have more real-life
friends in their contacts and they would prefer a private profile to form a boundary so that
they can selectively disclose sensitive information to their friends and non-sensitive
information to the public. Facebook and RenRen were initially designed for students to
find and contact with their school mates and friends. Disclosing school information and
real name gives them better user experience by allowing them to be searched and
contacted. Actually, Facebook and RenRen have a majority of users (above 80%)

121
121
disclosed their real name in these sites while less than 20% users would disclose such
information on Weibo. Therefore, the usage of each social network may strongly affect
people’s profile preferences, information disclosure and constituents of friend lists.
Another important potential factor is “conformity effect “. Chinese users may
imitate what other cultural groups, especially American people when they started to use
Facebook, Twitter and WhatsApp. Such effect can also be identified when users choose
to disclose information which most people disclose. It’s interesting to think about that
each social network has its own culture or norm so that users conform to such culture and
norms even though they come from different cultures in real world.
The third potential factor is censorship in China. Weibo, served as an important
media for the public voices is under strict supervision of the government and the society.
Keeping a private profile reduces the chance of getting in trouble while those students in
the U.S. have less such concern. This may explain why Chinese in the U.S. prefer public
profile while Chinese in China prefer private profile.
The above factors are not exhaustive and they may affect the constituents of
friend list, what type of profile to use and what information to disclose greatly. They may
also have impacts on reading privacy policies and privacy settings. Subject to the usage
and “conformity effect”, social network users may behave and perceive similarly on the
same social network thus making the cultural differences obsolete.

122
122
5.4 Privacy Attitude, Perception and Behavior in Different Sites
The third research question focused on the relationships among privacy attitude,
perception and privacy behavior in different sites.
Similarly, the seven indexes and three privacy scores were calculated for each site
as listed in the following table:
Table 5.4.
Privacy Indexes for Different Sites
Facebook 5.02 4.59 4.40 2.92 5.82 6.41 4.50
RenRen 4.71 3.87 4.37 2.02 5.85 6.30 4.70
Twitter 5.25 4.29 3.71 2.98 3.72 4.03 6.89
Weibo 4.87 3.37 4.36 2.32 4.16 4.31 6.47
WhatsApp 4.96 3.87 3.77 3.35 5.75 6.63 6.52
WeChat 4.83 3.11 4.65 2.15 7.14 6.64 5.76
Table 5.5.
Privacy Scores for Different Sites
Facebook 5.02 4.81 4.59
RenRen 4.71 4.65 3.87
Twitter 5.25 4.26 4.29
Weibo 4.87 4.32 3.37

123
123
Table 5.5 (continued).
Privacy Scores for Different Sites
WhatsApp 4.96 5.20 3.87
WeChat 4.83 5.27 3.11
A series of 3-dimential radar charts were created to illustrate the differences of the
six sites in privacy attitude, perception behavior. The first chart includes all six sites and
similar sites were then put into single charts for comparison purpose. Again, the charts
suggested that in different sites, users have different privacy perceptions.
Figure 5.7 Radar Chart: Privacy Scores for Different Sites
To get a detailed look, the three dimensions are further divided into seven indexes.
The next chart includes all six sites and we can clearly see how these sites differ in these
variables.

124
124
Figure 5.8 Radar Chart: Privacy Indexes for Different Sites 1
For information disclosure, Facebook and RenRen users seem to have a much
worse score than the other four sites. It’s not surprising because both sites were used to
exhibit oneself and to make new friends, which encourage users to disclose much
personal information.
For friend list, two similar sites, Twitter and Weibo has a significantly lower
percentage of real life friends in users’ friend lists. It’s intuitively true because these two
sites enable users to follow and being followed by strangers without bilateral agreement.
On other sites, users generally have to agree/accept friend requests before they become
online friends.
For privacy policy, three Chinese sites, WeChat, RenRen and Weibo had much
fewer users that were willing to read privacy policies.
125
125
For profile preference, Twitter user and Weibo users tend to prefer public profiles
while more users on the other sites reported that they used private profiles. WeChat,
especially, has a very high score of profile preference. One explanation would be that
Twitter and Weibo’s default profile was public while WeChat’s was private and users
might simply won’t bother to change the default setting. Also, as discovered above,
Twitter and Weibo users did not disclose much information on these sites. Therefore,
they might be less concerned about profile management. WeChat on the other hand was
used for private messaging so that users were more reluctantly to make their profile
public in fear of sensitive messages may be leaked to strangers.
One interesting finding is that some of the differences capture in the seven
variables seemed to be attributed to the differences of the “type” or “usage” of the social
network such as profile preference, friend list and information disclosure as discussed
above. While other differences, such as differences in reading privacy policy seem more
likely to be linked to the fact that whether the sites are Chinese sites or American sites.
This study did a simple effort to study this issue by splitting the six sites into 1)
different types of same “nationality” 2) similar sites of different “nationality”

126
126
Figure 5.9 Radar Chart: Privacy Indexes for Different Sites 2
The first set of radar charts clearly suggests that the difference of usage/type of
social networks capture the differences of friend list, profile preference, and information
disclosure well. In the three American sites, Facebook and WhatsApp users had
significantly higher scores than Twitter users in profile preference and friend list while
Twitter and WhatsApp users performed better in information disclosure as compared to

127
127
Facebook users. The results hold for three Chinese sites and they follow the same pattern.
RenRen and WeChat users had significantly higher scores than Weibo users in profile
preference and friend list while Weibo and WeChat users performed better in information
disclosure as compared to RenRen users.
Such pattern can be better identified by comparing similar sites. The following
figures suggested that similar sites generally have similar scores in information disclosure,
attitude, privacy setting, friend list and profile preference (except for WeChat and
WhatsApp where we only have a small sample of 106 WhatsApp users).
However, there were mismatches. Three Chinese sites have consistent lower score
in trust and privacy policy. Such results actually match the fact the Chinese users were
less willing to read privacy policies and more willing to trust social networking sites as
compared to U.S. citizens.
Figure 5.10 Radar Chart: Privacy Indexes for Different Sites 3

128
128
The results suggest that the differences of social network sites do have significant
impacts on several behavior and perception variables and similar sites generally have
similar patterns in these variables. However, as sites were consisted of different groups of
people. In this case, the three Chinese sites were consisted of Chinese users while the
three American sites were consisted of a combination of U.S. citizens and Chinese users
in the U.S. So such differences of social networks may also be partially attributed to the
differences of users’ cultural background.
It might be an interesting topic to study whether it is the innate characteristic or
usage of the site or it is the mindsets of users themselves that contributed to the
differences in privacy attitudes, behavior or perception the most.
To further understand the relationships among privacy perceptions and behaviors.
The study tested the correlations among the other five variables using Person’s r and
Spearman’s rho:
Cohen’s guideline was leveraged to interpret the correlation results. According to
him, r=0.5 represents a “large” correlation coefficient in social science, r=0.3 implies
medium correlation and r=0.1 implies small correlation (Cohen, 1988).
On the three American sites, we found consistent medium positive correlation
between privacy setting and privacy policies – the more people are willing to read
privacy policies, the more frequently they tend to modify their privacy settings. On
Facebook and Twitter, we also found significant negative correlation between trust and
profile preference – the more trust, the more likely to use a public profile. On WeChat,
we found medium positive correlation between privacy policy and profile preference –

129
129
the more people are willing to read privacy policies, the more likely they would use a
private profile.
On the three Chinese sites, consistent medium positive correlation between
privacy setting and privacy policies were also identified. Yet other interesting
correlations were not found.
The correlations were then broken down into different cultural groups. Here the
study only focused on Facebook, RenRen, Weibo and WeChat which had a balanced
sample size for each population and a large total size. WhatsApp only has a total sample
size of 106 and Twitter has a very imbalanced sample as discussed before.
The results suggested that on all of these 4 sites, Chinese users in the U.S. did not
show significant correlation between privacy setting and privacy policy while the other
two groups – Chinese in China and U.S. citizens did. The previous tests already identified
that Chinese users in the U.S. are significantly “more reluctant” to change privacy
settings and to read privacy policies than the other two groups. It would be an interesting
topic that needs further investigation of why such “mismatch” happens.
In fact, according to the results, only privacy settings and reading privacy policies
had consistent medium correlation in social networks while others only had small or non-
significant correlations. No strong correlation (r>0.5) were identified between any of the
variables. The interpretation is that these variables could not accurately predict each other
– although they may be statistically correlated with significance. The study challenges the
assumption that people who distrust the social network would necessarily be more willing
to read privacy policies, or would she change privacy settings more frequently, add fewer
strangers into their friend lists or keep a private profile than those who trust. One

130
130
implication is that a simple correlation could not perfectly capture the relationships
among these variables. The intuition that these perception/behavior variables are
correlated with each other is that they all seemed to capture the privacy awareness of
users. However, as discussed above, these variables are also subject to the potential
influences of other factors that may not even related much to privacy, such as usage,
personality traits and conformity effects.
The consistent medium correlation among privacy settings and reading privacy
policies implies that they may be good indicators of users’ privacy awareness, and by
using concise/transparent privacy policies so that people are more willing to read, the
more possible that a user would change their privacy settings frequently. This finding is
important because privacy settings have been the major mechanism for end-users to
manage their privacy and previous research has shown that such mechanism failed to
protect privacy due to the fact that users simply do not bother to or are not adept at the
fine-grained privacy settings. This result justified the effort in making privacy settings
more useful by promoting reading privacy policies.
5.5 Conclusion and Future Work
This study found out that 1) People have different privacy concerns toward
different types of information 2) Cultural differences are indeed an important factor in
social network users’ privacy perceptions and behaviors. 3) Privacy attitudes generally
imply information disclosure behavior, users are generally more willing to disclose the
information that he/she considers public than those which he/she considers more private.
People perceive privacy differently, so that they disclose things differently. 4) The

131
131
differences of social networking sites also have impacts on the differences of user privacy
perception and behavior 5) No strong correlations were found among trust, profile
preference and other privacy perception/behavior variables. How people behave and
perceive may be a complicated problem that could not be modelled by simple correlation.
However, changing privacy settings and reading privacy policies were significantly
correlated in all social networks.
The relationship between users’ privacy perception and behavior remains an open
yet complicated problem. Previous work has put much effort into investigating factors
that may affect information disclosure such as gender, age, computer expertise, etc.
(Tufekci 2008; Krishnamurthy 2009; Schrammel et al. 2009; Irani et al. 2011). Following
their lines of inquiry, this thesis looked into another variable – privacy attitude that was
rarely discussed and found out that there was significant association between privacy
attitude and information disclosure behavior. The next step is to integrate other variables
such as gender, social network usage, etc. into the cube in order to achieve a more
sophisticated model.
Many previous literature treated different types of PII as equals without
distinguishing their different levels of sensitivity. It measured information disclosure by
simply counting how many different types of information were disclosed (Schrammel et
al. 2009; Irani et al. 2011). This thesis found out different types of information may have
different “weights” of privacy which varies person by person. A more precise
measurement of information disclosure index or privacy attitude index could then be
introduced based on the findings of the thesis, in order to better capture a user’s privacy
awareness as part of future work.

132
132
In the future, multiple regression analysis and mediation analysis will be applied
to study the relationship among multiple variables. The current results only covered
pairwise correlation and might not able to capture complex relationships among multiple
variables.
One innate limitation of the research is that the design of the survey questions
tried to capture common characteristics of different sites. Therefore, the data would
neglect many distinct features of each site. For example, Facebook and Weibo have very
different profile management mechanism. Facebook allows very fine-grained profile
setting that people could customize their own white lists or blacklists. Weibo, on the
other hand has only “public” or “private” options. Therefore, in this study we only let
users to choose whether they use a private profile or public profile. In the future, distinct
features of each site and their impact on users’ perceptions and behaviors will also be
investigated. For example, would a more fine-grained profile setting make people less
bother to use? Would a more fine-grained profile setting make people trust the site more?
Another area for future research is how to change people’s privacy attitudes or
what are the factors that affect people’s privacy attitudes. Since the study found out that
privacy attitudes guides information disclosure. Studying factors that influences privacy
attitudes may potentially make social network users more wisely disclosing their
information.

133
LIST OF REFERENCES

133
133
LIST OF REFERENCES
Cohen, J. (1988). Statistical power analysis for the behavioral sciences. Psychology Press.
Datu, N., Datu, J., & Rungduin, D.(2013). Personality differences of college students
with public and private Facebook profile: A big five model viewpoint.
International Journal of Research Studies in Psychology, volume 2 number 3, 59-
66.
Dijck, J. (2013). You have one identity':Performing the Self on Facebook and LinkedIn.
in Media, Culture & Society 35 (2): 199-215.
Faisal, M., & Alsumait, A. (2011, December). Social network privacy and trust concerns.
In Proceedings of the 13th International Conference on Information Integration
and Web-based Applications and Services (pp. 416-419). ACM.
Farnham,S.D., & Churchill, E. F.(2011). Faceted identity, faceted lives: social and
technical issues with being yourself online. in Proceedings of the ACM
Conference on Computer Supported Cooperative Work.
Irani, D., Webb, S., Li, K., Pu, C. (2009). Large online social footprints–an emerging
threat. IEEE International Conference on Computational Science and Engineering
3, 271–276.
Jain, P., Kumaraguru, P. (2012). Finding nemo: Searching and resolving identities of
users across online social networks. arXiv preprint arXiv:1212.6147.
Krasnova, H., Spiekermann, S., Koroleva, K., & Hildebrand, T. (2010). Online social
networks: Why we disclose.Journal of Information Technology, 25 , 109–125.
Krishnamurthy, B., & Wills, C. E. (2009, August). On the leakage of personally
identifiable information via online social networks. In Proceedings of the 2nd
ACM workshop on Online social networks (pp. 7-12). ACM.
Malhotra, A., Totti, L., Meira Jr, W., Kumaraguru, P., & Almeida, V. (2012, August).
Studying user footprints in different online social networks. In Proceedings of the
2012 International Conference on Advances in Social Networks Analysis and
Mining (ASONAM 2012) (pp. 1065-1070). IEEE Computer Society.

134
134
Mohamed, A. A. A. (2011). Online privacy concerns among social networks’ users.
Cross-Cultural Communication, 6(4), 74-89.
Raad,E., Chbeir,R., & Dipanda,A. (2010). User profile matching in social networks. In:
13th international conference on network-based information systems (NBiS), pp
297–304. IEEE.
Riesner,M., & Pernul,G.(2012). Provider-independent online social identity management-
enhancing privacy consistently across multiple social networking sites, in Proc. of
the 45th Hawaii International International Conference on Systems Science, pp.
800-809.
Schrammcl,J., Koffcl,C., & Tscheligi,M.(2009). Personality traits, usage patterns and
information disclosure in online communities. In Proceedings of the 23rd British
HCI Croup Annual Conference on People and Computers: Celebrating People and
Technology (BCS-HCI).
Schrammel, J., Koffel, C, Tscheligi, M. (2009). How much do you tell? Information
disclosure behavior in different types of online communities. In: Proc. 4th
International Conference on Communities and Technologies. 275–284.
Stutzman, F. (2006). An Evaluation of Identity-Sharing Behavior in Social Network
Communities. International Digital and Media Arts Journal, 3(1).
Taddei, S., & Contena, B. (2013). Privacy, trust and control: Which relationships with
online self-disclosure? Computers in Human Behavior, 29(3), 821–826.
Tufekci, Z. (2008). Can you see me now? Audience and disclosure regulation in online
social network sites. Bulletin of Science, Technology & Society, 28(1), 20-36.
Wang,X., Kumar,S., & Liu,H. (2011). A study of tagging behavior across social media.In
In SIGIR Workshop on Social Web Search and Mining (SWSM).

135
APPENDICES

135
135
Appendix A Survey Questions
Informed Consent Form
Introduction
This survey is part of our research study about privacy protection in Social Networks.
Your response would help us better understand students' behavior patterns and privacy
concerns when using different online social networking services.
Procedures
The questionnaire consists of 10 questions and will take approximately 3-5 minutes to
complete. This questionnaire will be conducted with an online Qualtrics-created survey.
Risks/Discomforts
Risks are minimal for involvement in this study. We consider the possibility that
participants may feel unconfortable or have privacy concerns about the questions. We
encourage them not to answer such questions or quit the survey upon such conditions.
Confidentiality

136
136
The response will be totally anonymous and confidential. No connection between you
and your answer could be linked. All questionnaires will be concealed, and no one other
than then primary investigator and assistant researchers will have access to them. The
data collected will be stored in the HIPPA-compliant, Qualtrics-secure database until it
has been deleted by the primary investigator.
Compensation
There is no direct compensation.However, hopefully, this survey would also
raise participants' privacy awareness on social networking sites.
Participation
Participation in this research study is completely voluntary. You have the right to
withdraw at any time or refuse to participate entirely.
I am above 18 and I have read, understood the above consent form and desire of my own
free will to participate in this study.
Yes
No
137
137
The survey has a total number of 10 questions which may take 3-5 mins to complete. We
really appreciate your participation!
Lao Tzu —“The journey of a thousand miles begins with a single step.”
Q1: Are you a _ ?
U.S. citizen
Chinese citizen living in the U.S.
Chinese citizen living in China
None of the above
Q2: How many social networking services (Facebook, Twitter, LinkedIn, Youtube,
Tumblr, tc.) are you actively using?
0
1
2-4
5 or more

138
138
Q3: In general, please rate the privacy level of the following personal information when
you use the Internet:
public( little privacy concern)
moderate privacy concern
very private
Real Name
Email address
Phone number
Physical address
Age/ Birth year
Exact birthdate
Relationship Status
Gender
Personal photo
Login name/Nick
name
SSN or other
identification
number
Hometown/
Birthplace
Network of friends

139
139
(eg. friend list or
contact list)
School information
Employer
information
Current geolocation
Q4: Are you a member of the following social networking services? (check all that apply)
RenRen(人人网)
Weibo(新浪微博)
WeChat(微信)
None of the above

140
140
Q5: How often do you change your privacy settings?
Never Seldom - Once a year or less
Sometimes - Several times a
year
Often - Monthly or weekly
RenRen
Q6: Have you ever read the Privacy Policies for each site?
No Yes, but not carefully Yes, I've read them carefully
RenRen

141
141
Q7: What type of profile are you currently using?
Public- every one can see my profile
Private - only specific group of people can see my profile
RenRen
Q8: How much do you trust each of your online social network?
I trust it won't misuse my private information
I'm suspicious that it may misuse my private
information
I don't trust it at all
RenRen
Only 2 questions left, we are almost there, be patient!

142
142
Q9: What information would you share on each of these online social networks? (check
all that apply)
Facebook Twitter WhatsApp RenRen Weibo WeChat
Real name
address
Phone
number
Physical
address
Age/ Birth
year
Exact
Birthdate
Relationship
Status
Gender
Personal
photo
Network of
friends (eg.

143
143
friend list or
contact list)
School
information
Employer
information
Current
geolocation
Q10 : Roughly estimate the percentage of your online friends who are people you
actually know in real world (friends/relatives/collegues/classmates etc.) in the following
social network.
10-40% 40%-60% 60-90% >90%
RenRen

144
144
Appendix B IRB Protocal
Figure B.1 Original IRB Protocal
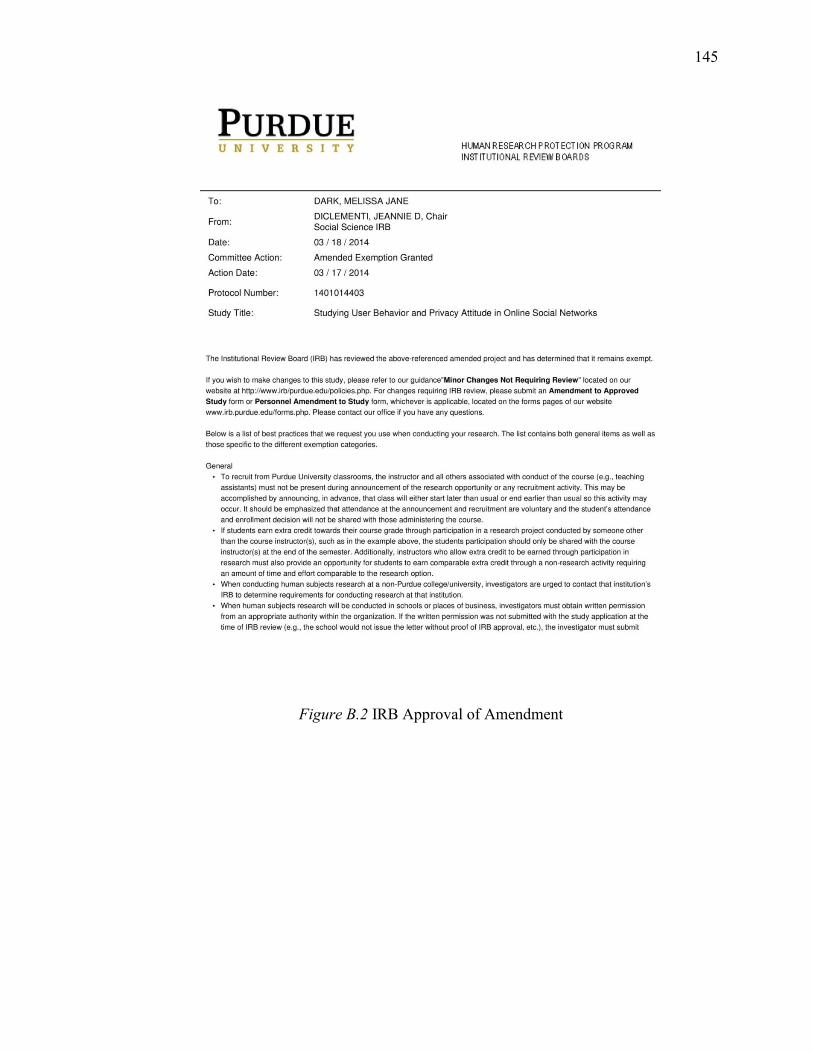
145
145
Figure B.2 IRB Approval of Amendment


