A Data mining approach for Monsoon prediction using
Satellite image data
Dinu John1, Dr. B. B. Meshram2
Department of Computer Technology
Veermata Jijabai Technological Institute Mumbai, India
[email protected], [email protected]
Abstract
The onset of monsoon is eagerly awaited in the Indian
sub-continent as it has deep impact in the economic
and social domain. It has been monitored and studied
in great depth. With the advent of satellite imagery,
it’s now possible to monitor the different parameters
which affect or gets affected by the monsoon in a
more global scale. In this paper, the onset of monsoon
is predicted based on the features extracted from
satellite images using data mining approach.
1. Introduction The prediction of rainfall is one of the major studies
in meteorological science. In India, where 75% of
agriculture is dependent on rainfall as its main source
of water, the amount and time of precipitation holds
high importance and can affect the entire economy of
nation. Other that in agriculture, the study of rainfall is
also required in the fields of aviation, shipping, fishing,
cyclone prediction, drought management, power
consumption etc. Hence the onset of monsoon is eagerly awaited by all.
Rainfall measurements have been taken in India for
more than 50 years. The ground based measurements
like radar, wind speed, pressure and humidity are
highly localised and do not help much in providing
long range prediction of rainfall. In the recent years,
with the development of weather satellites, the
monitoring of weather in a more global scale is feasible
and long range monsoon prediction has become
possible. In this paper we propose a method for
medium to long range prediction of monsoon onset
using a data mining technique based on satellite
images.
In section I a brief is given on the different satellite
images used for the paper and the source of those
images. Section II explains the technique used for
cloud detection. The detail on different features that are extracted and the dataset that is obtained is given in
section III. Section IV explains the monsoon onset
prediction algorithm and finally the features that can be
incorporated into the system to improve the efficiency
are discussed.
2. Cloud detection in satellite image A Satellite images is not a photograph of earth taken
from space. They are the pictorial representation of various electromagnetic radiations measured by sensors
on the satellite. A photograph is taken normally in the
visible spectrum. Satellites take images in visible as
well as outside this spectrum, like in the infra red, far
infra red and near infra red etc. The infra red (IR)
spectrum sensor measures the different thermal
radiation (10.5 - 12.5μm) coming from earth (day and
night). They are useful in differentiation land, sea, thick
and thin clouds. IR images also help in calculating the
cloud height, CTT (Cloud Top Temperature), an
important parameter in identifying rain bearing clouds
and SST (Sea Surface Temperature), another important
parameter in the study of monsoon. Water Vapour
Wind (WVW), which represents the humidity, is
studied in the near infra red spectrum (5.7 - 7.1μm).
The visible spectrum image (0.55 - 0.75μm) is useful in
determining overall cloud coverage, thin clouds, fog,
pollution, smoke etc [7]. Based on the type of spectrum and the type of satellite (Geostationary or polar
orbiting), the resolution of image varies from 2km to
8km.
Cloud detection in satellite images is the pre-
processing step of all satellite imagery. Their accurate
detection is difficult as clouds can easy be confused by
sand, snow or ice covered surfaces. Many studies and
developments have been made in this field with varying
techniques, technologies and success rates. Most of the
cloud detection techniques in satellite imagery make
use of the high reflectance of cloud in the visible (VIS)
spectrum and/or the low temperature in the infra red
(IR) spectrum. As mentioned in [8], cloud detection
methods can be categorized into two.
The first category utilizes the difference in the
reflectivity of thick clouds, thin clouds, land, and water
Dinu John et al , International Journal of Computer Science & Communication Networks,Vol 2(3), 421-424
421
ISSN:2249-5789

in the Visible spectrum during day time and the difference in the temperature radiance of cloud and
other entities in the Infra red spectrum during both day
and night. Based on this technique, seven different
types of clouds can be identified in satellite image [9].
The second category utilizes the texture of clouds to
identify and classify clouds. A variety of techniques
based on pattern recognition and/or maximum
likelihood estimation method and the use of Artificial
Neural Network (ANN) come under this category. But
the results based on the second category are
comparatively poor, as clouds (especially low clouds)
have very complex shapes and it’s not easy to typecast
them based solely on their texture.
For our system, we would use a technique similar to
what Xiaoning Song, Yingshi Zhao and Zhenhua Liu
used in their work [10]. Cloud is detected using the
spectral characteristics of cloud in the visible and infra-
red spectrum. Cloud has high reflectance in the visible spectrum and low radiation temperature in the infra red
(thermal) spectrum [11]. Cloud can be detected in the
thermal infra-red band based on the low temperature of
the cloud top, but this fails in case of thin clouds,
however thin clouds show high reflectivity in the
visible spectrum (but can be used only in daytime). The
trick here is in identifying the correct threshold. The
thick cloud and thin cloud edges are determined by
infrared band.
Figure 1: six regions used for extraction.
(Courtesy IMD)
3. Features extracted from Satellite Image For this study we would be using the Infra Red,
visible and water vapour images from INSAT-3A and
Kalpana-1 for the months of April, May and June.
Rather than measuring the entire Indian sub-continent disc region, for the prediction purpose we would extract
features from 6 satellite image regions; the region near
Andaman and Nicobar Islands, the Lakshadweep
Islands, the area nears Kerala, the Bay of Bengal, the
Indian Ocean, and the mid regions of India as shown in
Figure 1. The following features would be extracted
from the image data set:
Sea Surface Temperature (SST): This
would be extracted from the IR images of
INSAT-3A and Kalpana-1. Care is needed
to ascertain that the temperature readings
are taken from region void of clouds. SST
is a key parameter controlling climate in
the Indian subcontinent. In the case where
clouds are present in the image, the average
temperature for the season is set as default.
Cloud Top Temperature (CTT): This is extracted from IR images of clouds present
in the region. Colder clouds have higher
probability of causing precipitation. In the
case of absence of Clouds in the selected
region the CTT is taken as IR intensity at
the region.
Cloud density: Cloud density or thickness
can be estimated based on the intensity of
visible radiation reflected and the
temperature of the cloud. Thick clouds
have higher chance of being rain bearing.
When clouds are not present, the value is
considered as 0. A high intensity in the
visible spectrum and a low CTT (both
based on thresholds) will warrant a 1 else 0.
Water vapour or humidity: this is extracted
from the water vapour wind (WVW)
image. Higher the humidity, higher is the
probability of precipitation.
Since the Thermal and visible images are
represented as 8-bit greyscale image, each of the above
parameters can be represented by values between 0 and
255. The values would be extracted by taking the
histogram of each region and based on the parameter
the intensity value over the majority area is considered.
The extracted features for each hour of the day, for all
the six regions will be represented as a single record.
The data set consists of previous seven years of image
data for the months of April, May and June; out of this
four year data would be used as training dataset and the
remaining 3 year for testing.
Dinu John et al , International Journal of Computer Science & Communication Networks,Vol 2(3), 421-424
422
ISSN:2249-5789
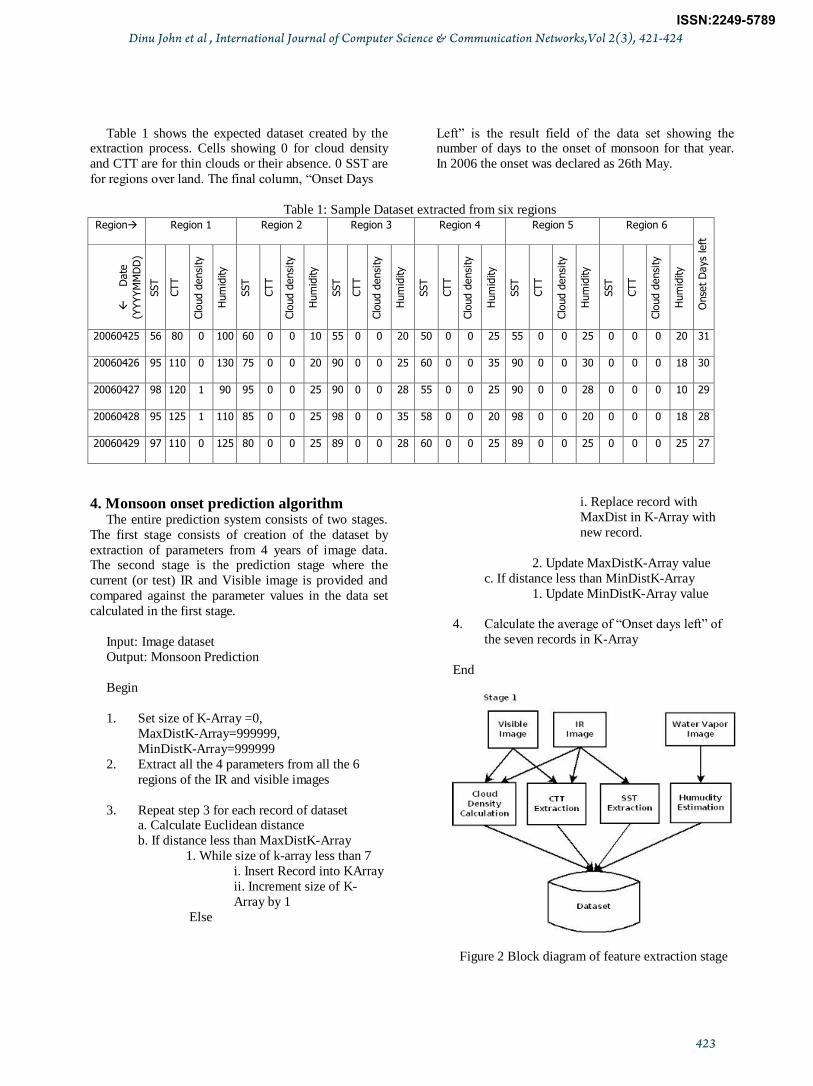
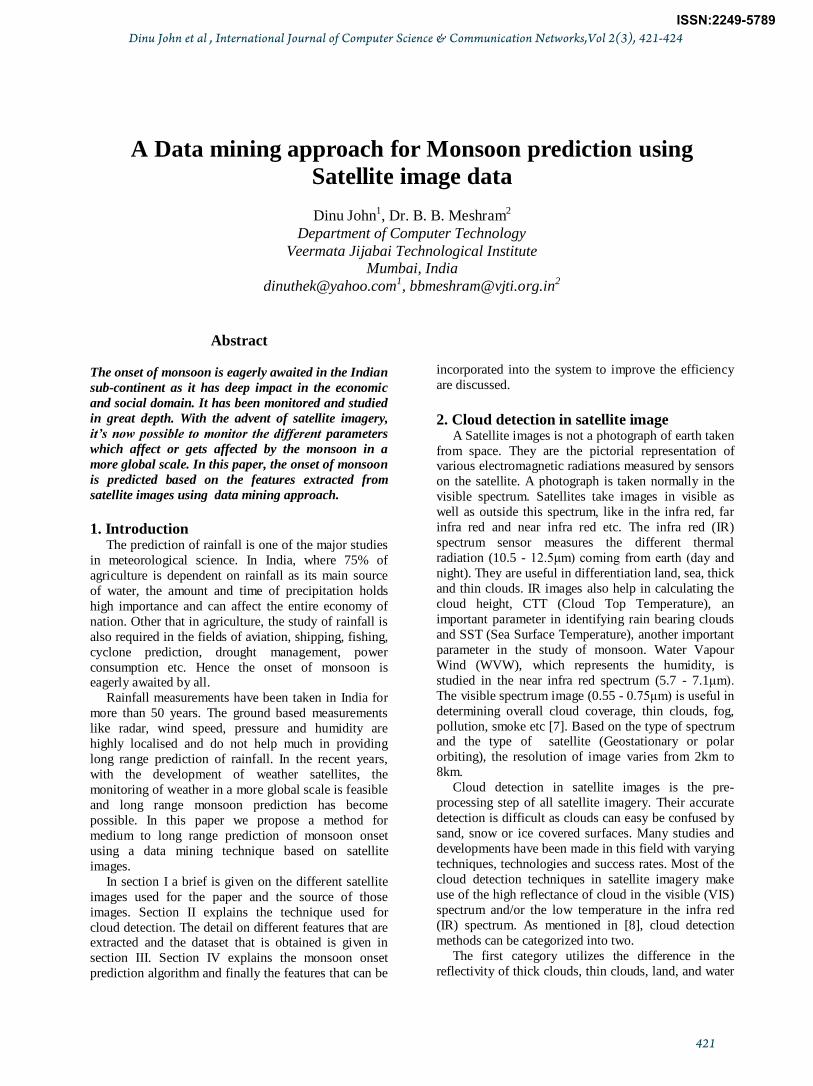
Table 1 shows the expected dataset created by the extraction process. Cells showing 0 for cloud density
and CTT are for thin clouds or their absence. 0 SST are
for regions over land. The final column, “Onset Days
Left” is the result field of the data set showing the number of days to the onset of monsoon for that year.
In 2006 the onset was declared as 26th May.
Table 1: Sample Dataset extracted from six regions Region Region 1 Region 2 Region 3 Region 4 Region 5 Region 6
Onse
t D
ays
left
Date
(YYYYM
MD
D)
SST
CTT
Clo
ud d
ensi
ty
Hum
idity
SST
CTT
Clo
ud d
ensi
ty
Hum
idity
SST
CTT
Clo
ud d
ensi
ty
Hum
idity
SST
CTT
Clo
ud d
ensi
ty
Hum
idity
SST
CTT
Clo
ud d
ensi
ty
Hum
idity
SST
CTT
Clo
ud d
ensi
ty
Hum
idity
20060425 56 80 0 100 60 0 0 10 55 0 0 20 50 0 0 25 55 0 0 25 0 0 0 20 31
20060426 95 110 0 130 75 0 0 20 90 0 0 25 60 0 0 35 90 0 0 30 0 0 0 18 30
20060427 98 120 1 90 95 0 0 25 90 0 0 28 55 0 0 25 90 0 0 28 0 0 0 10 29
20060428 95 125 1 110 85 0 0 25 98 0 0 35 58 0 0 20 98 0 0 20 0 0 0 18 28
20060429 97 110 0 125 80 0 0 25 89 0 0 28 60 0 0 25 89 0 0 25 0 0 0 25 27
4. Monsoon onset prediction algorithm The entire prediction system consists of two stages.
The first stage consists of creation of the dataset by
extraction of parameters from 4 years of image data. The second stage is the prediction stage where the
current (or test) IR and Visible image is provided and
compared against the parameter values in the data set
calculated in the first stage.
Input: Image dataset
Output: Monsoon Prediction
Begin
1. Set size of K-Array =0,
MaxDistK-Array=999999,
MinDistK-Array=999999
2. Extract all the 4 parameters from all the 6
regions of the IR and visible images
3. Repeat step 3 for each record of dataset a. Calculate Euclidean distance
b. If distance less than MaxDistK-Array
1. While size of k-array less than 7
i. Insert Record into KArray
ii. Increment size of K-
Array by 1
Else
i. Replace record with
MaxDist in K-Array with
new record.
2. Update MaxDistK-Array value
c. If distance less than MinDistK-Array
1. Update MinDistK-Array value
4. Calculate the average of “Onset days left” of
the seven records in K-Array
End
Figure 2 Block diagram of feature extraction stage
Dinu John et al , International Journal of Computer Science & Communication Networks,Vol 2(3), 421-424
423
ISSN:2249-5789
For the prediction of monsoon, we would be using Data mining technique, K- Nearest Neighbour
algorithm. It is used with along with Euclidean distance
estimation method for matching purpose. The K nearest
neighbour value is taken as k = 7.
Euclidean distance =
22
33
2
22
2
11 )(...)()()( nn pqpqpqpq
i.e. =
n
i
ii pq1
2)(
Figure 3: Block diagram of prediction stage
5. Discussion The objective of this paper was to explain a new
technique for the prediction of monsoon onset using
satellite image data of previous years. The proposed
system can predict onset 10-30 days in advance. There
are lot of other factors which gets affected or affects the monsoon onset. The efficiency of the technique can be
improved by adding those additional parameters like
Outgoing long wave radiation (OLR), Quantitative
Precipitation Estimate (QPE) and atmospheric pressure.
Also more regions for comparison can be added.
Reference
[1] G. D'souza, E.C. Barrett, C.H. Power (1990): Satellite rainfall
estimation techniques using visible and infrared imagery,
Remote Sensing Reviews, 4:2, 379-414
[2] J. K. Mishra, O. P. Sharma, "Cloud top temperature based
precipitation intensity estimation using INSAT-1D data",
International Journal of Remote Sensing 2001, 22:6, 969-985
[3] Tao Chen, Milcio Talagi, "Rainfall prediction of geostationary
meteorological satellite images using artificial neural network",
International Geoscience and Remote Sensing Symposium 1993
[4] E. C. Barrett, M. J. Beaumont, “Satellite rainfall monitoring: An
overview”, International Journal of Remote Sensing Reviews,
1994 11:1-4, 23-48
[5] S. K. Sasamal, "Pre‐ monsoon Indian Ocean SST in contrasting
years of Indian summer monsoon rainfall", International Journal
of Remote Sensing 2007, 28:19, 4403-4407
[6] Pavel Berkhin, "Survey of Clustering Data Mining
Techniques", Accrue Software, Inc., San Jose, CA
[7] Indian Meteorological Department, http://www.imd.gov.in
[8] Du Huadong, Wang Yongqi, Chen Yaming, “Studies on Cloud
Detection of Atmospheric Remote Sensing Image Using ICA
Algorithm”, 2009 IEEE.
[9] Yu Fan, Chen Weimin, “Research on the Cloud Classification
for the Bi-Spectrum Cloud Picture”, Journal of Nanjing Institute
of Meteorology, 1994, Vol. 17, 117-124.
[10] Xiaoning Song, Yingshi Zhao, Zhenhua Liu, “Cloud Detection
and Analysis of MODIS Image”, 2004 IEEE.
[11] R. W. Saunders and K. T. Kriebel, “An improved method for
detecting clear sky and cloudy radiances from AVHRR data”,
International Journal of Remote Sensing, vol. 9, no. 1, pp. 123-
150,1988.
Dinu John et al , International Journal of Computer Science & Communication Networks,Vol 2(3), 421-424
424
ISSN:2249-5789


![[PPT]PowerPoint Presentation - Climate Prediction · Web viewWorldwide Monsoons in 2008-09 1. Global monsoon features • Australian monsoon • South American monsoon • North American](https://cdn.vdocument.in/doc/165x107/5aba45597f8b9a441d8b6e25/pptpowerpoint-presentation-climate-prediction-viewworldwide-monsoons-in-2008-09.jpg)

