
A deeper understanding
of farm productivity
Ross Kingwell,
Vilaphonh Xayavong,
Nazrul Islam
How is farm productivity often
assessed?
• Data from annual farm surveys.
• Aggregated inputs, aggregated outputs.
• Environmental info rarely collected.
• Socio-managerial info rarely collected.
What is special about this study?
• 270 broadacre farm businesses were tracked from 2002 to 2011
• Their terms of trade, growth in productivity and profitability were measured
• Information was collected on the socio-managerial characteristics of these farm businesses, their training and use of innovations.

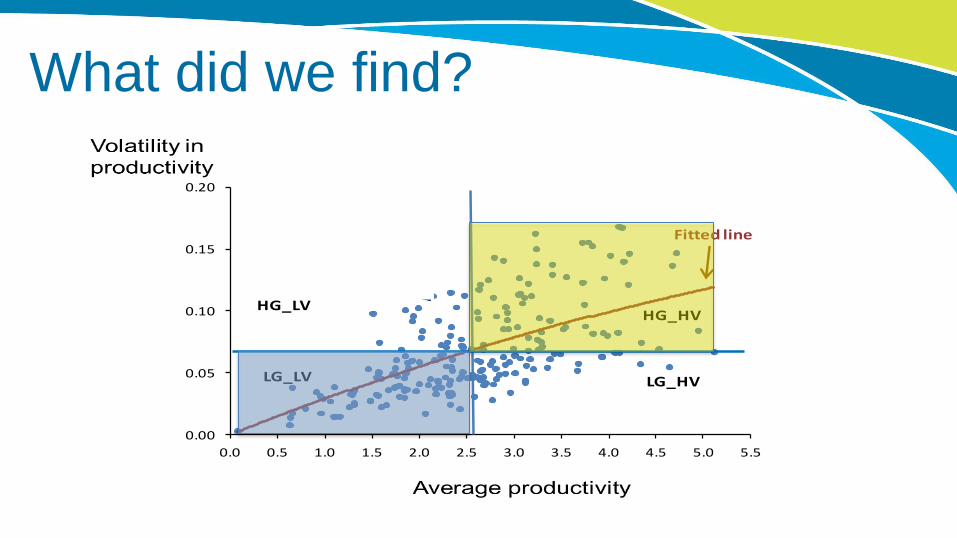
What did we find?
Crop dominant farms Sheep dominant farms
Productivity growth for crop farms was treble that for sheep farms

What did we find?
‘Growing’ farms ‘Less secure’ farms
Productivity growth for ‘growing’ farms was double that for ‘less secure’ farms

y = -0.0013x2 + 0.0302xR² = 0.3873
0.00
0.05
0.10
0.15
0.20
0.0 0.5 1.0 1.5 2.0 2.5 3.0 3.5 4.0 4.5 5.0 5.5
Std of dTFP
Geo-Mean of dTFP
HG_LV
LG_HVLG_LV
Fitted linedTFP
coordinates
HG_HV
dTFP coordinates
What did we find?
y = -0.0013x2 + 0.0302xR² = 0.3873
0.00
0.05
0.10
0.15
0.20
0.0 0.5 1.0 1.5 2.0 2.5 3.0 3.5 4.0 4.5 5.0 5.5
Std of dTFP
Geo-Mean of dTFP
HG_LV
LG_HVLG_LV
Fitted linedTFP
coordinates
HG_HV
dTFP coordinates
What did we find?

• more profitable ($288K of average annual farm profit vs $63K),
• more lucrative (5% ROE vs 2%),
• larger in size (4581ha vs 2199ha),
• receive less growing season rainfall (227mm vs 285mm),
• more crop dominant (87% of farm income coming from crop revenues vs 65%),
• able to generate more crop yield per 100mm of growing season rainfall, (0.77
tonnes per 100mm per hectare vs 0.70),
• able to generate more livestock income per mm of growing season rainfall ($1.78 vs
$1.56 per mm per hectare),
• mostly crop specialists and mixed enterprise farms versus livestock specialists and
mixed enterprise farms,
• less exposed to debt (debt to income ratio is 1.02 vs 1.39 and the debt burden is
$352 per hectare vs $535 per hectare),
• more likely to be a growing farm, less likely to be a less secure farm.
Farms in the HG_HV quadrant are very different
to farms in the LG_LV quadrant

A simple causal model of
productivity growth

But reality is a bit different……
When we look at all the farm data on (i) training, (ii) the farm family’s farming experience, (iii) available family labour, (iv) their use of innovations, (v) their managerial behaviour and (vi) business outcomes… the story becomes complicated

T
L
O M
C
H
A
B E
P

So what are the key findings from this
analysis?
Does training affect farm performance?
YES!!

What are the statistically significant
findings? • Where you farm (and especially the seasonal sequences you experience) greatly affects farm
performance (i.e. environment matters…no surprise there!!).
• In broadacre WA, farmers’ use of cropping innovations (min-till, airseeders) greatly affects farm productivity and profitability.
• Also farmers’ use of electronic innovations (GPS technologies, business management software) greatly affects farm productivity and profitability.
• Training greatly affects the farm business’s human capital.
• Human capital in turn greatly affects the family’s ability to adopt useful innovations regarding land, animal and electronic-based management.
• The greater a farm business’s human capital the greater is its organisation and time management skill and that in turn positively (but not quite significantly) affects farm performance.
• One implication is that provision of farm management and business training and education has significantly (albeit indirectly) improved farm productivity and profitability in broadacre WA.

Take Home Messages • Training and access to innovations matter greatly for improving
farm performance.
• Ongoing and further investment in training and education for the
farm family will help boost farm productivity and profitability.
• Ongoing investment in R&D will provide the range of innovations
that well-trained farmers can assess and adopt if they are found to
be useful and profitable.

Thank you


