S1
Supplementary Information
A Microfluidic Approach for Protein Structure Determination at Room
Temperature via on-chip Anomalous Diffraction
Sarah L. Perrya‡
, Sudipto Guhaa‡
, Ashtamurthy S. Pawatea, Amrit Bhaskarla
b, Vinayak Agarwal
c,
Satish K. Nairc and Paul J.A. Kenis*
a
a Department of Chemical & Biomolecular Engineering, University of Illinois at Urbana-Champaign, USA.
b School of Molecular &Cellular Biology, University of Illinois at Urbana-Champaign, USA.
c Department of Biochemistry, University of Illinois at Urbana-Champaign, USA ‡ These authors contributed equally to the work
* Correspondence email: [email protected]
Experimental Procedures
S.1 Protein Sample Preparation and Visualization of Crystallization Experiments
Selenomethionine labeled PhnA from Sinorhizobium meliloti was dissolved in 20 mM HEPES, pH 7.5, at
a range of concentrations: 15, 20, 25 and 40 mg/mL. For screening experiments, the 96-condition Hampton
Index Screen (Hampton Research) was used and the condition I-80 (0.2M ammonium acetate, 0.1M HEPES
pH 7.5 and 25% (w/v) PEG 3350) was identified for further optimization. The crystallization trials were set
up with the protein solution at 1:1 v/v ratio and were incubated at 9°C.
Traditional microbatch-under-oil crystallization trials were set up combining 2 µL each of protein and
precipitant solutions in a Greiner well plate (Hampton Research) at 9°C. These were harvested using
Mitegen crystal mounts.
Crystallization experiments were set up and visualized using a stereomicroscope (Leica, MZ12.5) with an
attached digital camera (Leica, DFC295) operated using Leica Application Suite software or a computer
controlled imaging system comprised of an optical microscope (Leica Z16 APO) equipped with an auto-
zoom lens (Leica 10447176), a digital camera (Leica DFC280), and a motorized x-y stage (Semprex KL66)
controlled by Image Pro Plus (Media Cybernetics). Images were taken with the help of a cross-polarizer.
S.2 Operation of Array Chips
The array chips are comprised of layers of different polymers. The fluid layer is fabricated out of
poly(dimethylsiloxane) (PDMS, General Electric RTV 650) using standard soft lithographic techniques.1
The control layer is fabricated from cyclic olefin copolymer (COC, TOPAS Advanced Polymers Inc., 4 mil)
via hot embossing. Thin sheets of COC (2 mil) or Duralar sheets (Graphix Plastics, 0.5 mil) are used as a
flat substrate on which the assembled chip is placed. A more detailed description of the fabrication
procedure can be found elsewhere.2
The microfluidic array chips consist of separate half-wells for protein and precipitant solutions. The two
half-wells are filled independently of each other using dedicated valve lines for each set of half-wells.
Actuate-to-open valving and fluid filling was achieved by the application of vacuum from a vacuum pump
connected to the device through a plastic gas manifold (Cole-Parmer Instrument Co.) and PTFE tubing
coupled with a thin metal tube to a small block of PDMS aligned over the inlets for the various control lines
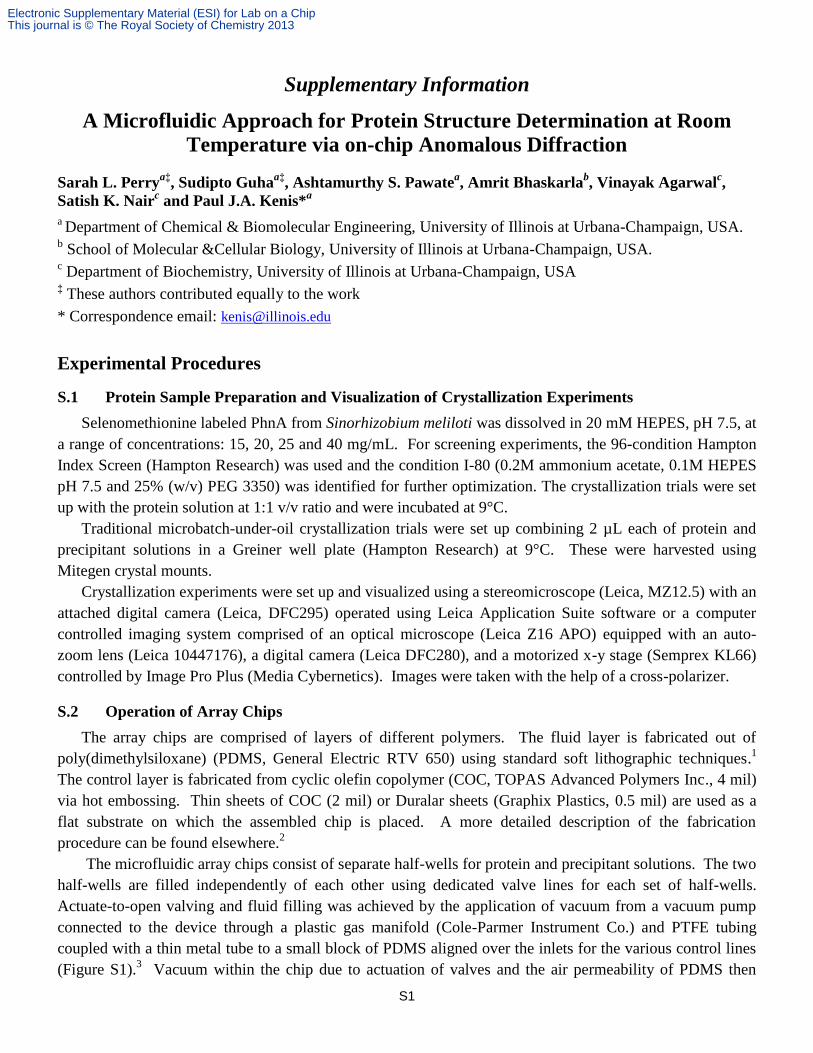
(Figure S1).3 Vacuum within the chip due to actuation of valves and the air permeability of PDMS then
Electronic Supplementary Material (ESI) for Lab on a ChipThis journal is © The Royal Society of Chemistry 2013
S2
served to pull the corresponding solutions into the chambers. First 1-2 µL of protein solution is pipetted onto
the protein line inlet and vacuum is pulled through the corresponding valve line, which allows dead filling of
the protein into the series of half-wells. Once the protein solution has been filled, the protein inlet and valve
line are sealed with Crystal Clear tape (Hampton Research). Next, the precipitant solution is loaded onto the
chip by pipetting 1 µL droplets of precipitant solution onto each of the six precipitant inlet holes. Vacuum is
then applied via the precipitant valve lines and the precipitant solutions fill into the appropriate half-wells.
The mixing valves located between the protein and precipitant half-wells are then actuated, allowing the two
solutions to mix by diffusion. Because mixing between the two half-wells occurs diffusively, it is necessary
to hold these valves open for a period of time. For PhnA, this mixing time was optimized at ~1 hour. After
allowing time for mixing, the mixing valves are allowed to relax and the remaining inlets are sealed with
Crystal Clear tape and the crystallization trials are allowed to incubate. A more detailed description of the
device geometry and filling procedure is described elsewhere.2 Samples were mounted on a modified
magnetic goniometer mount (Hampton Research) with an attached metal tube into which a slit was cut and
set-screw was used for securing samples.
Figure S1. Optical micrograph showing the setup of a 96-well microfluidic array chip, including the placement of
reagents droplets at inlets, and the way it is connected to a vacuum line to actuate sets of valves.
S.3 Screening for Protein Crystallization Conditions
The first step in structure determination of a new protein is screening against various potential
crystallization reagents. Screening was performed using the 96-condition Index Screen (Hampton Research)
on a 96-well chip where the ratio of protein-to-precipitant was varied (4:1 to 1:4). Each 96-well screening
chip allows 12 different precipitants to be screened against a single protein solution. A total of eight chips
were used for screening the entire Index Screen. Each chip requires just 6 µL of protein and 2 µL of each
precipitant solution to screen a total of 96 different conditions. Since the chamber volume ratio is varied
along the vertical, we are screening each of these 12 conditions over 8 different protein-to-precipitant ratios,
effectively increasing the experimental range of our experiment. This type of screen, varying the protein-to-
precipitant ratio, can be set up automatically on our microfluidic chips, while it would be much harder to
implement at the traditional well plate scale where each condition would need to be set up independently.
Each of our chips takes < 5 minutes to set up, thus enabling a large number of crystallization trials to be set
up in a high throughput fashion. The microfluidic chips are extremely simple to set up, requiring only a
pipette to meter the protein and precipitant solutions and a vacuum pump with a Teflon-tubing based
Electronic Supplementary Material (ESI) for Lab on a ChipThis journal is © The Royal Society of Chemistry 2013
S3
connector to fill in the solutions into the chip (Figure S1).2 Table S1 gives details of the screening of PhnA
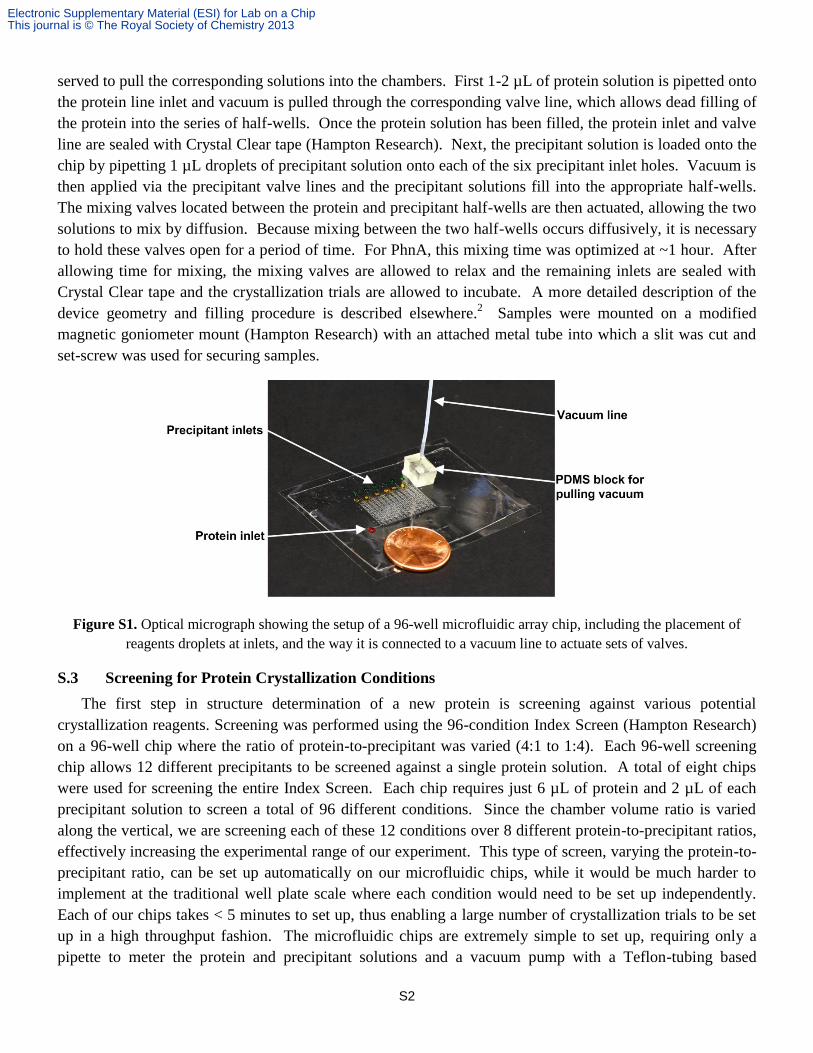
with the Index Screen and the conditions that gave hits (i.e., crystals). Figure S2 shows a 96-well array chip
with close ups of the crystals obtained in the screening phase.
Figure S2. Optical micrograph of a 96-well hybrid array based screening chip showing screening of PhnA using the
Index Screen. 12 different precipitants are screened in separate columns on a single chip. The enlarged views on top
and side show initial crystal hits from condition (a1) I-42, (a2) I-47, (a3) I-54, (a4) I-70, and (a5) I-71 from the Index
Screen. The scale bars in the insets correspond to 200 µm.
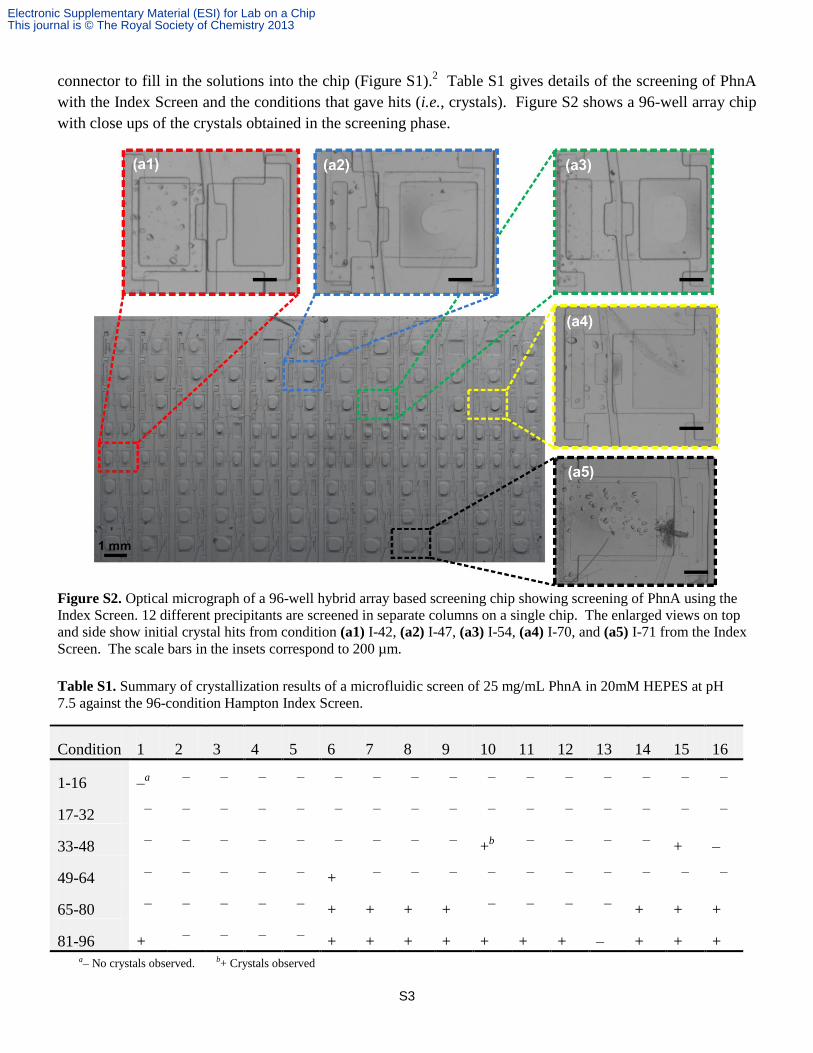
Table S1. Summary of crystallization results of a microfluidic screen of 25 mg/mL PhnA in 20mM HEPES at pH
7.5 against the 96-condition Hampton Index Screen.
Condition 1 2 3 4 5 6 7 8 9 10 11 12 13 14 15 16
1-16 –a – – – – – – – – – – – – – – –
17-32 – – – – – – – – – – – – – – – –
33-48 – – – – – – – – – +b – – – – + –
49-64 – – – – – + – – – – – – – – – –
65-80 – – – – – + + + + – – – – + + +
81-96 + – – – – + + + + + + + – + + + a– No crystals observed. b+ Crystals observed
Electronic Supplementary Material (ESI) for Lab on a ChipThis journal is © The Royal Society of Chemistry 2013
S4
S.4 X-ray Diffraction Data Analysis
Analysis of X-ray diffraction data collected at the synchrotron was performed using HKL2000 software
for indexing, refinement, integration, and scaling (HKL Research Inc.).4 Anomalous data was first scaled
using SCALEPACK in HKL2000 with the "Scale Anomalous" flag and truncated at Rmerge ≤ 0.25 (resolution
2.75 Å). Phase information was solved using the Phenix.Autosol wizard in Phenix5 to locate the selenium
atoms of the selenomethionine residues, followed by heavy atom refinement (FOM=0.394). The initial
phases were further improved by density modification in the Phenix.Autosol wizard and an initial model was
built with the Phenix.Autobuild wizard with 72% completeness. This was used as a starting model in the
Phenix.Autobuild wizard for the 2.11Å resolution experimental data where a model that was 79% complete
was obtained. The model was further extended to 97% completeness using ARP/wARP6 and refined using
Phenix.Refine wizard to Rwork of 0.176 and Rfree of 0.211. Images were generated using PyMOL7 and Coot.
8
This is the first report of PhnA structure determination using a SeMet derivative (Table S2). The data
obtained here is in good agreement both with the structure obtained from analysis of a single crystal grown
in a traditional well plate as evidenced by a RMSD < 0.4 Å when aligned in PyMOL,7 and with the structural
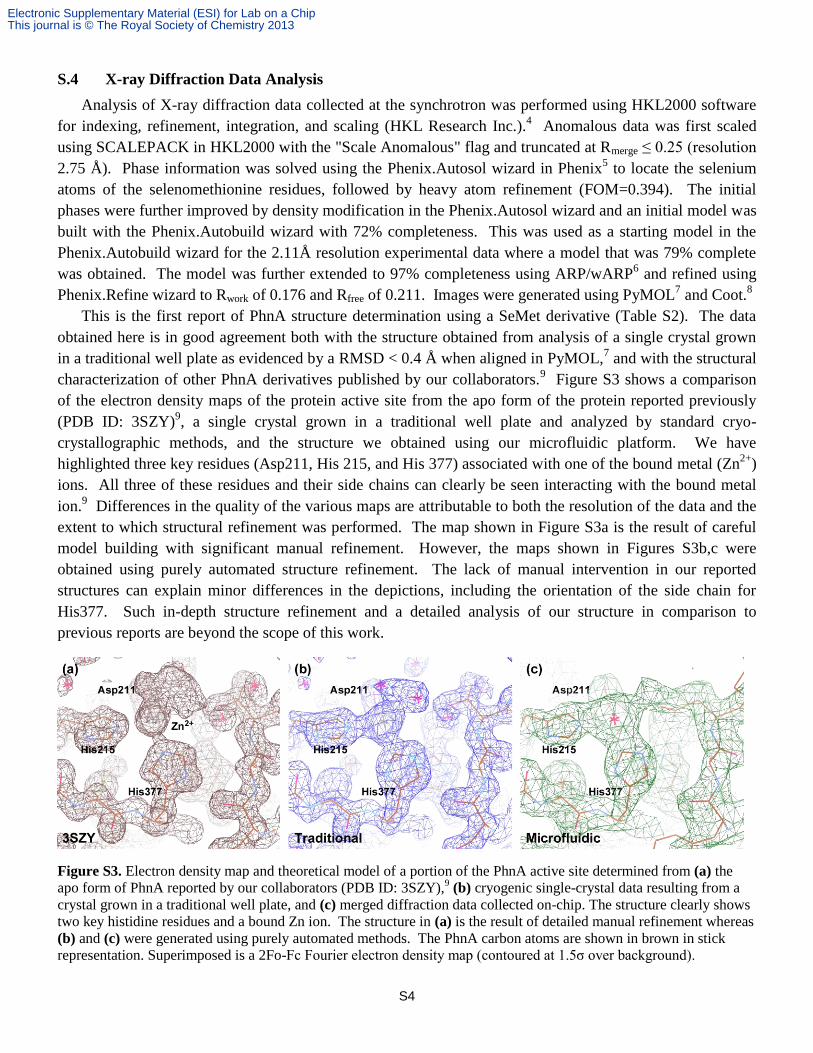
characterization of other PhnA derivatives published by our collaborators.9 Figure S3 shows a comparison
of the electron density maps of the protein active site from the apo form of the protein reported previously
(PDB ID: 3SZY)9, a single crystal grown in a traditional well plate and analyzed by standard cryo-
crystallographic methods, and the structure we obtained using our microfluidic platform. We have
highlighted three key residues (Asp211, His 215, and His 377) associated with one of the bound metal (Zn2+
)
ions. All three of these residues and their side chains can clearly be seen interacting with the bound metal
ion.9 Differences in the quality of the various maps are attributable to both the resolution of the data and the
extent to which structural refinement was performed. The map shown in Figure S3a is the result of careful
model building with significant manual refinement. However, the maps shown in Figures S3b,c were
obtained using purely automated structure refinement. The lack of manual intervention in our reported
structures can explain minor differences in the depictions, including the orientation of the side chain for
His377. Such in-depth structure refinement and a detailed analysis of our structure in comparison to
previous reports are beyond the scope of this work.
Figure S3. Electron density map and theoretical model of a portion of the PhnA active site determined from (a) the
apo form of PhnA reported by our collaborators (PDB ID: 3SZY),9 (b) cryogenic single-crystal data resulting from a
crystal grown in a traditional well plate, and (c) merged diffraction data collected on-chip. The structure clearly shows
two key histidine residues and a bound Zn ion. The structure in (a) is the result of detailed manual refinement whereas
(b) and (c) were generated using purely automated methods. The PhnA carbon atoms are shown in brown in stick
representation. Superimposed is a 2Fo-Fc Fourier electron density map (contoured at 1.5σ over background).
Electronic Supplementary Material (ESI) for Lab on a ChipThis journal is © The Royal Society of Chemistry 2013
S5
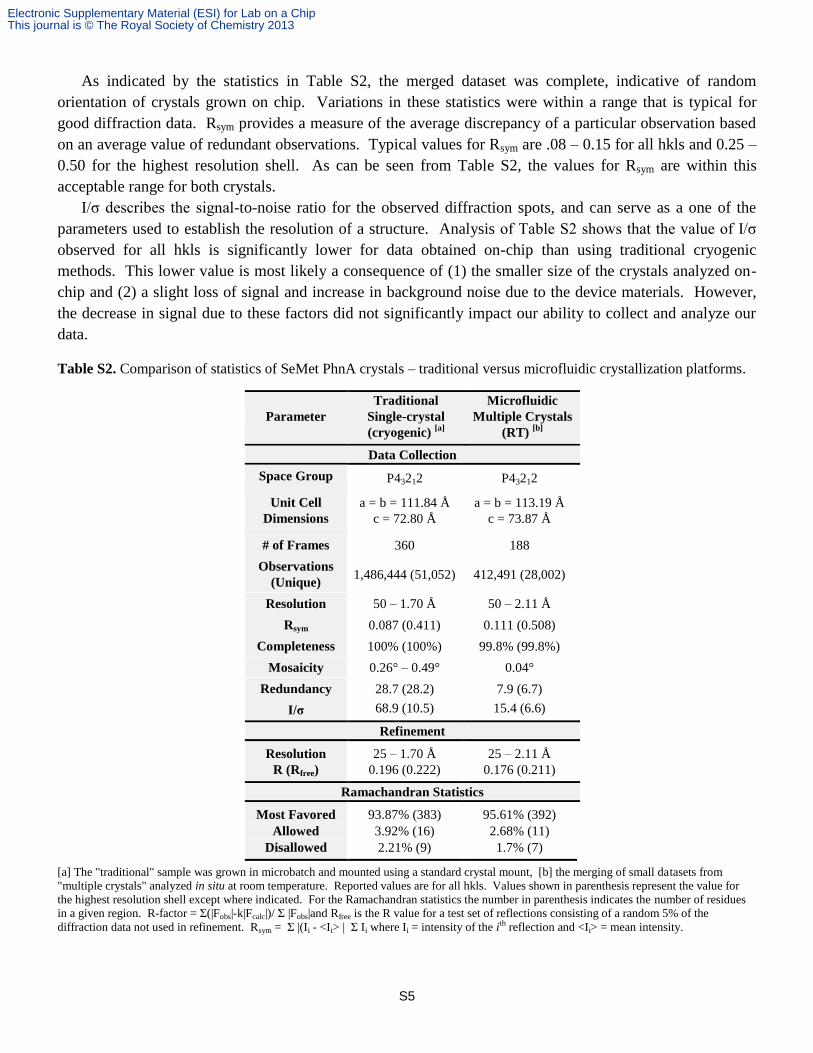
As indicated by the statistics in Table S2, the merged dataset was complete, indicative of random
orientation of crystals grown on chip. Variations in these statistics were within a range that is typical for
good diffraction data. Rsym provides a measure of the average discrepancy of a particular observation based
on an average value of redundant observations. Typical values for Rsym are .08 – 0.15 for all hkls and 0.25 –
0.50 for the highest resolution shell. As can be seen from Table S2, the values for Rsym are within this
acceptable range for both crystals.
I/σ describes the signal-to-noise ratio for the observed diffraction spots, and can serve as a one of the
parameters used to establish the resolution of a structure. Analysis of Table S2 shows that the value of I/σ
observed for all hkls is significantly lower for data obtained on-chip than using traditional cryogenic
methods. This lower value is most likely a consequence of (1) the smaller size of the crystals analyzed on-
chip and (2) a slight loss of signal and increase in background noise due to the device materials. However,
the decrease in signal due to these factors did not significantly impact our ability to collect and analyze our
data.
Table S2. Comparison of statistics of SeMet PhnA crystals – traditional versus microfluidic crystallization platforms.
Parameter
Traditional
Single-crystal
(cryogenic) [a]
Microfluidic
Multiple Crystals
(RT) [b]
Data Collection
Space Group P43212 P43212
Unit Cell
Dimensions
a = b = 111.84 Å
c = 72.80 Å
a = b = 113.19 Å
c = 73.87 Å
# of Frames 360 188
Observations
(Unique) 1,486,444 (51,052) 412,491 (28,002)
Resolution 50 – 1.70 Å 50 – 2.11 Å
Rsym 0.087 (0.411) 0.111 (0.508)
Completeness 100% (100%) 99.8% (99.8%)
Mosaicity 0.26° – 0.49° 0.04°
Redundancy 28.7 (28.2) 7.9 (6.7)
I/σ 68.9 (10.5) 15.4 (6.6)
Refinement
Resolution 25 – 1.70 Å 25 – 2.11 Å
R (Rfree) 0.196 (0.222) 0.176 (0.211)
Ramachandran Statistics
Most Favored 93.87% (383) 95.61% (392)
Allowed 3.92% (16) 2.68% (11)
Disallowed 2.21% (9) 1.7% (7)
[a] The "traditional" sample was grown in microbatch and mounted using a standard crystal mount, [b] the merging of small datasets from
"multiple crystals" analyzed in situ at room temperature. Reported values are for all hkls. Values shown in parenthesis represent the value for
the highest resolution shell except where indicated. For the Ramachandran statistics the number in parenthesis indicates the number of residues
in a given region. R-factor = Σ(|Fobs|-k|Fcalc|)/ Σ |Fobs|and Rfree is the R value for a test set of reflections consisting of a random 5% of the
diffraction data not used in refinement. Rsym = Σ |(Ii - <Ii> | Σ Ii where Ii = intensity of the ith reflection and <Ii> = mean intensity.
Electronic Supplementary Material (ESI) for Lab on a ChipThis journal is © The Royal Society of Chemistry 2013
S6
The structural refinement parameters R/Rfree are a measure of how well the refined structure agrees with
the observed electron density maps. Rfree provides a metric for cross-validating the quality of the structural
model by comparing it with a small test set of “free” reflections which were not used in the refinement of the
model.10,11
Generally speaking, for a structure determination made with data to 2.0Å resolution, the final R-
factor would be expected to be ~20%. Not only do our data fall within this range, it is interesting to note that
both R and Rfree are lower for the data collected on-chip compared to data obtained via traditional cryogenic
methods. Additionally, a larger fraction of the residues in the structures obtained from on-chip data
collection fall within the favored zones for structural conformations on a Ramachandran plot.
One of the most interesting statistics associated with our data collection strategy is the mosaicity, or
intrinsic disorder within a crystal.10
The mosaicity of data collected on-chip at room temperature is nearly
one order of magnitude lower compared to the cryogenic single-crystal results. While discussions of crystal
quality are typically done in terms of resolution, to a certain extent the degree of ordering within the crystal
directly affects the quality of diffraction. This lower mosaicity was observed despite the increased potential
for radiation damage due to data collection at room temperature and can be attributed to the lack of physical
handling as well as the absence of cryocooling, both of which is known to increase crystal mosaicity.12,13
References
1. D. C. Duffy, J. C. McDonald, O. J. A. Schueller and G. M. Whitesides, Analytical Chemistry, 1998, 70, 4974-4984.
2. S. Guha, S. L. Perry, A. S. Pawate and P. J. A. Kenis, Sensors and Actuators B: Chemical, 2012 174, 1-9. 3. B. R. Schudel, C. J. Choi, B. T. Cunningham and P. J. A. Kenis, Lab on a Chip, 2009, 9, 1676-1680. 4. Z. Otwinowski and W. Minor, Method Enzymol, 1997, 276, 307-326. 5. P. D. Adams, P. V. Afonine, G. Bunkoczi, V. B. Chen, I. W. Davis, N. Echols, J. J. Headd, L.-W. Hung, G. J.
Kapral, R. W. Grosse-Kunstleve, A. J. McCoy, N. W. Moriarty, R. Oeffner, R. J. Read, D. C. Richardson, J. S. Richardson, T. C. Terwilliger and P. H. Zwart, Acta Crystallographica Section D, 2010, 66, 213-221.
6. G. Langer, S. X. Cohen, V. S. Lamzin and A. Perrakis, Nat Protoc, 2008, 3, 1171-1179. 7. Schrödinger, LLC, 2010. 8. P. Emsley and K. Cowtan, Acta Crystallographica Section D, 2004, 60, 2126-2132. 9. V. Agarwal, S. A. Borisova, W. W. Metcalf, W. A. van der Donk and S. K. Nair, Chemistry & Biology, 2011, 18,
1230-1240. 10. G. Rhodes, Crystallography Made Crystal Clear - A Guide for Users of Macromolecular Models, Elsevier,
Amsterdam, 2006. 11. J. Drenth, Principles of Protein X-ray Crystallography, Springer, New York, 2007. 12. T. Alcorn and D. H. Juers, Acta Crystallographica Section D, 2010, 66, 366-373. 13. D. H. Juers and B. W. Matthews, Quarterly Reviews of Biophysics, 2004, 37, 105-119.
Electronic Supplementary Material (ESI) for Lab on a ChipThis journal is © The Royal Society of Chemistry 2013


